National Implementation Plan for the Stockholm … National Implementation Plan for the Stockholm...
134
0 National Implementation Plan for the Stockholm Convention on Persistent Organic Pollutants United Kingdom of Great Britain and Northern Ireland February 2017
Transcript of National Implementation Plan for the Stockholm … National Implementation Plan for the Stockholm...

0
National Implementation Plan for the
Stockholm Convention on Persistent
Organic Pollutants
United Kingdom of Great Britain and
Northern Ireland
February 2017

1
© Crown copyright 2017
You may re-use this information (excluding logos) free of charge in any format
or medium, under the terms of the Open Government Licence v.3. To view
this licence visit www.nationalarchives.gov.uk/doc/open-government-
licence/version/3/ or email [email protected]
This publication is available at https://consult.defra.gov.uk/eu-environment/uk-
nip-for-stockholm-convention-on-pops-2017
Any enquiries regarding this publication should be sent to us at
www.gov.uk/defra

2
Contents
Executive summary .......................................................................................... 6
Section 1 .......................................................................................................... 9
Introduction................................................................................................... 9
1.1 Purpose of the United Kingdom’s (UK) National Implementation
Plan…….. .................................................................................................... 9
1.2 Development of the UK’s 2016 National Implementation Plan ....... 9
1.3 What are Persistent Organic Pollutants? ....................................... 9
1.4 Overview of the listed Persistent Organic Pollutants .................... 10
1.5 Provisions of the Stockholm Convention ...................................... 11
Section 2 ........................................................................................................ 13
The UK’s legislative and policy framework on Persistent Organic Pollutants
(POPs) ....................................................................................................... 13
2.1 International level ......................................................................... 13
2.2 European Union ........................................................................... 15
2.3 National level ............................................................................... 18
Section 3 ........................................................................................................ 25
Implementation of action on Persistent Organic Pollutants in the UK ......... 25
3.1 Overview of regulatory control ..................................................... 25
3.2 Update for POPs regulated before 2013 (“existing POPs”) .......... 26
3.3 POPs regulated from 2013 (“new POPs”) .................................... 35
3.4 Controls on unintentionally produced POPs ................................. 43
3.5 Marketing and use controls .......................................................... 46
3.6 Controls on diffuse sources .......................................................... 46
3.7 Occupational exposure to dioxins, PCBs and HCB, PCBz ........... 47

3
3.8 Food legislation on dioxins and dioxin-like polychlorinated
biphenyls .................................................................................................. 48
3.9 Control of dioxins and polychlorinated biphenyls in animal feed .. 48
Section 4 ........................................................................................................ 49
Assessment of the data on current releases of the POPs .......................... 49
4.1 Monitoring of POPs ...................................................................... 49
4.2 UK source inventories of POPs .................................................... 54
4.3 Current releases of dioxins and furans, PCBs, HCB and PCBz in
UK…….. .................................................................................................... 58
4.4 Current emissions of selected POPs ............................................ 65
4.5 Overview of the emission data for the new POPs ........................ 67
4.6 Human exposure to POPs ........................................................... 74
4.7 Evaluation of POP concentrations in the marine environment ..... 74
4.8 Evaluation of concentrations in the freshwater environment ........ 75
4.9 Effectiveness evaluation of current legislation on emissions ........ 76
Section 5 ........................................................................................................ 77
Update on strategies and measures to further reduce the emissions of
POPs .......................................................................................................... 77
5.1 Overarching national environmental policies ................................ 77
5.2 Update of the 2013 National Implementation Plan’s measures to
manage UK emissions of POPs................................................................. 77
5.3 Further planned work for managing POPs emissions in the UK .. 79
Section 6 ........................................................................................................ 82
Reduction or elimination of POP releases from stockpiles and wastes ...... 82
6.1 Stockpiles relating firefighting foams containing perfluorooctane
sulphonic acid (PFOS) ............................................................................... 84
6.2 Stockpiles relating to HBCDD ...................................................... 84

4
Section 7 ........................................................................................................ 86
Other obligations of the Stockholm Convention .......................................... 86
7.1 Information exchange, awareness and education ........................ 86
7.2 Research, development and monitoring ....................................... 88
7.3 New and emerging POP issues ................................................... 89
7.4 Effectiveness evaluation .............................................................. 89
7.5 Provision of technical assistance ................................................. 90
7.6 Reporting obligations under the Stockholm Convention ............... 91
ANNEXES ...................................................................................................... 92
Annex 1: Glossary of Terms and Units used .............................................. 92
Annex 2: Descriptions of the persistent organic pollutants ......................... 99
Annex 3: The Current UK requirements for Stockholm Convention Annex C
Part II and Part III source categories ........................................................ 103
Annex 4: TEQ Schemes for Dioxins and Furans, and dioxin-like PCBs ... 105
Annex 4a: Toxic Equivalent Quotient (TEQ) schemes for dioxins and furans
................................................................................................................. 106
Annex 4b: Toxic Equivalent Quotient (TEQ) schemes for dioxin-like PCBs
................................................................................................................. 108
Annex 5 (A1): Emissions of dioxins and furans to air (g I-TEQ per year) 110
Annex 5 (A2): Emissions of dioxins and furans to land (g I-TEQ per year)
................................................................................................................. 111
Annex 5 (A3): Emissions of dioxins and furans to water (g I-TEQ per year)
................................................................................................................. 112
Annex 5 (A4): Emissions of dioxins and furans to residue (g I-TEQ per year)
................................................................................................................. 113
Annex 5 (A5): Emissions of dioxins and furans to product (g I-TEQ per year)
................................................................................................................. 114
Annex 5 (B1): Emissions of polychlorinated biphenyls to air (kg per year)
................................................................................................................. 115

5
Annex 5 (B2): Emissions of polychlorinated biphenyls to land (kg per year)
................................................................................................................. 116
Annex 5 (B3): Emissions of polychlorinated biphenyls to water (kg per year)
................................................................................................................. 117
Annex 5 (B4): Emissions of polychlorinated biphenyls to residue (kg per
year) ......................................................................................................... 118
Annex 5 (B5): Emissions of polychlorinated biphenyls to product (kg per
year) ......................................................................................................... 119
Annex 5 (C1): Emissions of hexachlorobenzene to air (kg per year) ........ 120
Annex 5 (C2): Emissions of hexachlorobenzene to land (kg per year) ..... 121
Annex 5 (C3): Emissions of hexachlorobenzene to water (kg per year) ... 122
Annex 5 (C4): Emissions of hexachlorobenzene to residue and product (kg
per year) ................................................................................................... 123
Annex 5 (D1): Emissions of pentachlorobenzene to air (kg per year) ...... 124
Annex 5 (D2): Emissions of pentachlorobenzene to land (kg per year) .... 125
Annex 5 (D3): Emissions of pentachlorobenzene to water (kg per year) .. 126
Annex 5 (D4): Emissions of pentachlorobenzene to residue (kg per year)
................................................................................................................. 127
Annex 5 (D5): Emissions of pentachlorobenzene to product (kg per year)
................................................................................................................. 128
Annex 5 (E1): Emissions of polychlorinated naphthalenes to air (kg per
year) ......................................................................................................... 129
Annex 5 (E2): Emissions of polychlorinated naphthalenes to land (kg per
year) ......................................................................................................... 130
Annex 5 (E3): Emissions of polychlorinated naphthalenes to water (kg per
year) ......................................................................................................... 131
Annex 5 (E4): Emissions of polychlorinated naphthalenes to residue (kg per
year) ......................................................................................................... 132
Annex 5 (E5): Emissions of polychlorinated naphthalenes to product (kg per
year) ......................................................................................................... 133

6
Executive summary
The Stockholm Convention is a global treaty to protect human health and the
environment from Persistent Organic Pollutants (POPs). These chemicals
persist in the environment, can bioaccumulate and biomagnify in food chain
organisms including humans and are toxic. They also have the potential to be
transported long distances and are deposited far from their place of
manufacture/release. The Convention requires that Parties adopt and
introduce measures to reduce releases of POPs into the environment with the
aim of minimising human and wildlife exposure.
There are currently 26 POPs listed in the Convention. These fall into three
broad categories: pesticides (such as aldrin, chlordecone and lindane),
industrial chemicals (e.g. polychlorinated biphenyls (PCBs), and certain
homologue groups of poly-brominated diphenyl ethers (PBDEs)) and
unintentional by-products (such as dioxins and furans) of combustion and
some industrial and non-industrial processes. Many of the pesticides and
industrial chemicals listed in the Convention have already been banned in the
United Kingdom (UK) for many years. However, continued use is permitted for
certain applications based on limited exemptions, which are detailed in
Annexes A and B of the Convention.
As a Party to the Stockholm Convention, the United Kingdom (UK) developed
a National Implementation Plan (NIP) in 2007 and an update was published in
20131. This has now been revised to describe how the Convention is being
implemented in the UK and to outline next steps for the management of
POPs, particularly those which have been more recently listed. Evidence for
the more recently included POPs has been obtained through a review of
existing emission inventories for releases to the following vectors: air, land,
water, residue and product; a periodical review of scientific journals for
emission factor data; and communication with industry and national and
international experts.
Since 2007, a UK POPs multi-vector inventory has been developed,
maintained and reviewed annually to evaluate those POPs which are released
unintentionally from anthropogenic sources (listed in Annex C of the
Convention). This has been built on the existing UK National Atmospheric
Emissions Inventory2 (NAEI) and now reflects better knowledge of emissions
from non-air vector emission sources. These include PCB concentrations in
sewage sludge, waste incineration residues, non-ferrous metal smelting
1 http://chm.pops.int/Implementation/NIPs/NIPTransmission/tabid/253/Default.aspx
2 http://naei.defra.gov.uk/data/data-selector?view=air-pollutants

7
residues, and hexachlorobenzene (HCB) emissions from the use of the
pesticide Chlorothalonil (which is emitted to air, land and water). Additional
research has also been conducted to look at household burning of garden
waste, to better typify activity within the UK population
The multi-vector inventory provides detailed information on sources of POPs
and is a key part of the UK’s assessment capability for further emissions and
emission minimisation. It shows that estimates of emissions to air, land and
water for all Stockholm Convention Annex C substances (including the
recently listed pentachlorobenzene) have declined significantly in the UK
between the period 1990 to 2014. This is largely due to policy actions
targeting major UK point sources. The magnitude of diffuse sources such as
accidental house fires, use of solid fuels in domestic properties and backyard
burning have also declined since 1990, but represent a more challenging set
of sources to control and further minimise.
In particular for dioxins and furans, there is evidence that annual release totals
are reaching a plateau with the remaining annual emission levels being
maintained by contributions from domestic combustion activities. In 2014,
most dioxins/furans emissions came from diffuse sources such as the small
scale combustion of waste or accidental fires. The heat and power generation
sector is the main source of industrial emissions. Emissions to land/landfill are
products of open burning processes and waste disposal. However for two of
the vectors (water and product), there is an increase to that of the 2010 figure.
For the water vector the increase (17%) is due to emissions from waste
entering landfill, and from the heat and power generation sector. For the
product vector the increase (7%) is due to the increase in recycled ashes and
residues for use largely in aggregates.
For polychlorinated biphenyls (PCBs), the major source of emissions to air
and land continue to be PCB-based di-electric heat transfer fluids from old
electrical equipment (e.g. capacitors, transformers, electrical switching gear).
The UK Government recognises that the main source of UK PCB emissions
arising from di-electric equipment is still cause for concern. However, total
emissions have declined over the last twenty years and in 2014 the UK PCB
emissions had reduced by 97% from that of the 1990 emissions. The
Government is seeking further ways in how it can address emissions from di-
electric equipment that contain PCBs.
The release estimates of HCB to air, land and water in 2014 indicate a
continuing decline in emissions since 1990, with the current key sources being
the combustion of fuels in the power industry and its presence as a trace
contaminant in the pesticide chlorothalonil.

8
The major route of potential human exposure to POPs is through the food
chain. The Food Standards Agency monitors the UK food supply and animal
feeds for a selection of the listed POPs. The levels found have raised no
concerns for human health.
As the contribution to emissions (and potential human exposure) from larger
industrial sources has reduced, a range of smaller, more diffuse sources have
come to dominate emissions of unintentionally produced POPs in the UK.
Although backyard burning and domestic space heating remains a key diffuse
source of some POPs, publicity has helped to raise public awareness about
good practice in the disposal practices of household waste. The Government
will continue to build on this work.
Emissions of both unintentionally produced and manufactured POPs including
PCDD/Fs, PCBs and polybrominated di-phenyl ethers (PBDE) flame
retardants will continue to be monitored through the Toxic Organic Micro-
Pollutants (TOMPS) air monitoring programme. The UK recognises that it is
important to continue to provide long–term data to ensure that existing
controls are sufficient to continue reductions in environmental exposure but
also believes that there is a need to develop strategies to address the “new”
chemicals that are being to the added to the Convention annexes. Hence the
UK will be developing work around selecting and monitoring some of the
recently listed POPs. Where available, current emission trends data will be
compared to data collected in 2020 to review the success of UK policies on
reducing emissions as well as input into the next review of the UK National
Implementation Plan.
Overall the UK has made good progress against the actions outlined in the
2007 and 2013 NIPs. In terms of future activity, the priority is to gain a better
understanding of the potential scale and magnitude of emissions from past
(legacy) uses and in items currently in-use and which still contain POPs,
particularly when these enter waste streams. The UK emissions inventory has
been expanded to provide detail to the five vectors required by the Stockholm
Convention. Where relevant, the emission inventory will be expanded to
include emission data on the four substances which were added to the
Convention in 2013 and 2015 (hexachlorobutadiene, polychlorinated
naphthalenes, pentachlorophenol its salts and esters, and
hexabromocyclododecane (HBCDD)). The UK Government will also continue
to support research on POPs, which will help inform future measures needed
to achieve further emission reductions.

9
Section 1
Introduction
1.1 Purpose of the United Kingdom’s (UK) National Implementation Plan
The Stockholm Convention on Persistent Organic Pollutants (POPs,
http://www.pops.int/) entered into force on 17 May 2004. It is a global treaty
signed by 151 States and regional economic integration organisations. The
Convention’s objective is to protect human health and the environment from
these chemicals.
Parties to the Convention are required to develop and endeavour to put into
practice a National Implementation Plan (NIP) setting out how they will
implement their obligations under the Convention. This plan was to be
submitted within two years of the date on which the Convention entered into
force for that Party. The UK ratified the Stockholm Convention on 17 April
2005 and consequently submitted its first NIP in 2007. This was followed up
with an update in 2013.
Under the Stockholm Convention there is a requirement that the UK NIP is
subject to periodic updating and revision in response to the dynamic nature of
the Convention, for example, in its identification and inclusion of additional
POPs.
1.2 Development of the UK’s 2017 National Implementation Plan
This updated UK NIP has been developed by the Department for
Environment, Food and Rural Affairs (Defra) in close collaboration with the
Scottish Government, the Welsh Government, the Department of Agriculture,
Environment and Rural Affairs (DAERA), Northern Ireland and other relevant
Government Departments and Agencies.
1.3 What are Persistent Organic Pollutants?
Persistent Organic Pollutants (POPs) are a group of chemicals that are toxic,
persist in the environment, bioaccumulate in fatty tissues and biomagnify
through the food chain. In addition, they have the potential to be transported
long distances and deposited far from their place of release, including in
pristine environments such as the Arctic and Antarctic. Persistent Organic
Pollutants have been identified as priority chemicals for many years and the

10
international community has called for actions to reduce and eliminate their
production, use and release.
1.4 Overview of the listed Persistent Organic Pollutants
The Stockholm Convention currently focuses on reducing and eliminating
releases of 26 POPs (Table 1). These include those added to annexes A and
C of the Convention in 2013 and 2015. Descriptions of each of the 26 POPs
are provided at Annex 2.
Table 1 The 26 POPS listed in the Stockholm Convention
Chemical
CA
S N
um
ber
Pesticid
e
Industr
ial
chem
ica
l
Unin
tentio
nal
by-
pro
duct
Aldrin 309-00-2 X
Chlordane 57-74-9 X
Dieldrin 60-57-1 X
Endrin 72-20-8 X
Heptachlor 76-44-8 X
Hexachlorobenzene (HCB) 118-74-1 X X X
Mirex 2385-85-5 X
Toxaphene (camphechlor) 8001-35-2 X
Polychlorinated biphenyls
(PCBs)
various X X
Dichlorodiphenyltrichloroethane
DDT
50-29-3 X
Polychlorinated dibenzo-p-
dioxins (PCDD) (dioxins)
various X
Polychlorinated dibenzofurans
(PCDF) (furans)
various X
Chlordecone 143-50-0 X
Hexabromobiphenyl 36355-01-8 X
Hexa- and hepta-
bromodiphenyl ether
various X
Alpha hexachlorocyclohexane 319-84-6 X
Beta hexachlorocyclohexane 319-85-7 X
Lindane (gamma
hexachlorocyclohexane)
58-89-9 X
Pentachlorobenzene (PCBz) 608-93-5 X X X
Perfluorooctanesulfonic acid
(PFOS), its salts and
perfluorooctane sulfonyl
fluoride (PFOS-F)
various
X
Tetra- and penta-
bromodiphenyl ether
various X
11
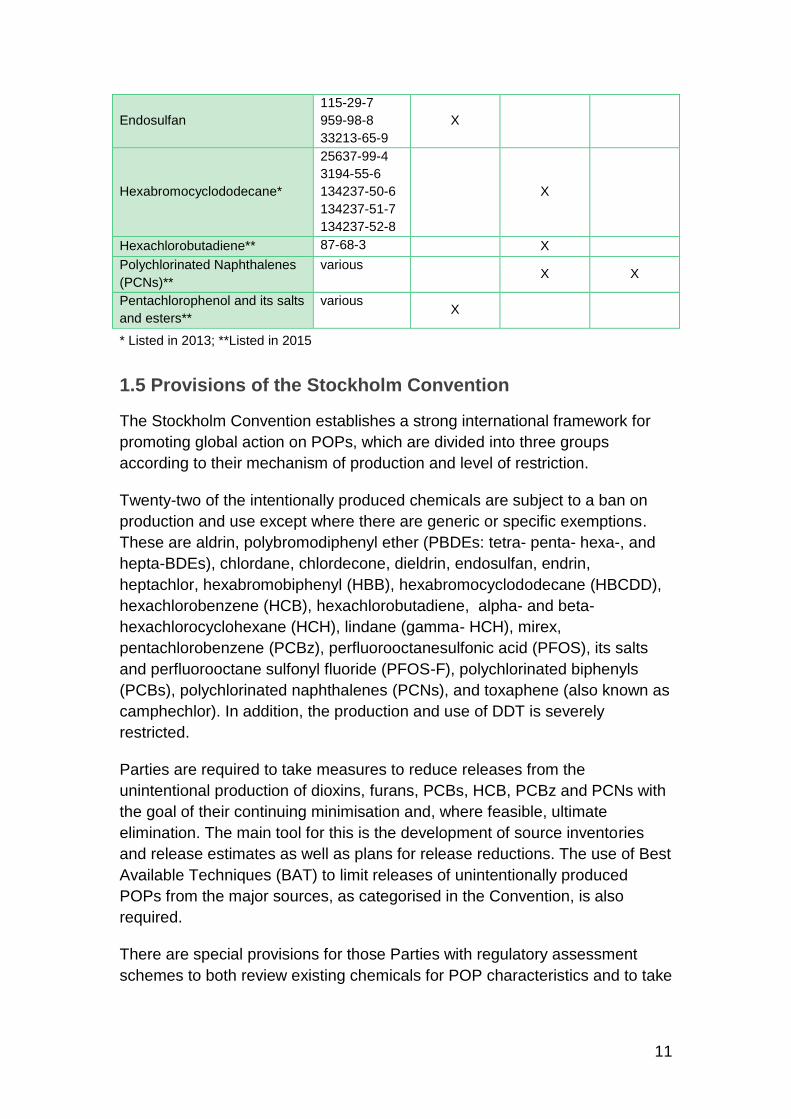
Endosulfan
115-29-7
959-98-8
33213-65-9
X
Hexabromocyclododecane*
25637-99-4
3194-55-6
134237-50-6
134237-51-7
134237-52-8
X
Hexachlorobutadiene** 87-68-3 X
Polychlorinated Naphthalenes
(PCNs)**
various X X
Pentachlorophenol and its salts
and esters**
various X
* Listed in 2013; **Listed in 2015
1.5 Provisions of the Stockholm Convention
The Stockholm Convention establishes a strong international framework for
promoting global action on POPs, which are divided into three groups
according to their mechanism of production and level of restriction.
Twenty-two of the intentionally produced chemicals are subject to a ban on
production and use except where there are generic or specific exemptions.
These are aldrin, polybromodiphenyl ether (PBDEs: tetra- penta- hexa-, and
hepta-BDEs), chlordane, chlordecone, dieldrin, endosulfan, endrin,
heptachlor, hexabromobiphenyl (HBB), hexabromocyclododecane (HBCDD),
hexachlorobenzene (HCB), hexachlorobutadiene, alpha- and beta-
hexachlorocyclohexane (HCH), lindane (gamma- HCH), mirex,
pentachlorobenzene (PCBz), perfluorooctanesulfonic acid (PFOS), its salts
and perfluorooctane sulfonyl fluoride (PFOS-F), polychlorinated biphenyls
(PCBs), polychlorinated naphthalenes (PCNs), and toxaphene (also known as
camphechlor). In addition, the production and use of DDT is severely
restricted.
Parties are required to take measures to reduce releases from the
unintentional production of dioxins, furans, PCBs, HCB, PCBz and PCNs with
the goal of their continuing minimisation and, where feasible, ultimate
elimination. The main tool for this is the development of source inventories
and release estimates as well as plans for release reductions. The use of Best
Available Techniques (BAT) to limit releases of unintentionally produced
POPs from the major sources, as categorised in the Convention, is also
required.
There are special provisions for those Parties with regulatory assessment
schemes to both review existing chemicals for POP characteristics and to take

12
regulatory measures to prevent the development, production and marketing of
new substances with POP characteristics.
The Convention also makes provision for the identification and safe
management of stockpiles containing or consisting of POPs. Waste
containing, consisting of or contaminated with POPs should be disposed of in
such a way that the POP content is destroyed or irreversibly transformed.
Where this does not represent the environmentally preferable option or where
the POP content is low, waste shall be otherwise disposed of in an
environmentally sound manner. Disposal operations that may lead to the
recovery or re-use of POPs are forbidden.
The Convention recognises the particular needs of developing countries such
as specific provisions on technical assistance and financial resources and
mechanisms are included in the general obligations.

13
Section 2
The UK’s legislative and policy framework on Persistent Organic Pollutants (POPs)
In addition to the Stockholm Convention, the UK has the following
commitments at the international, European Union (EU) and national level.
2.1 International level
Owing to the long range transportation of POPs, a global approach is
necessary to agree the control of these substances.
2.1.1 The 1998 Aarhus Protocol on Persistent Organic Pollutants to the
United Nations Economic Cooperation for Europe (UNECE) Protocol to
the 1979 Convention on Long-Range Transboundary Air Pollution
The UNECE Convention on Long Range Transboundary Air Pollution
(CLRTAP; http://www.unece.org/env/lrtap/pops_h1.html) Executive Body
adopted the Protocol on Persistent Organic Pollutants on 24 June 1998 in
Aarhus, Denmark. This aims to eliminate discharges, emissions and losses of
16 pesticides, industrial chemicals and by-products/contaminants. The POPs
Protocol bans or severely restricts the production and use of specified
products and includes provisions for dealing with their wastes. Seven new
substances were added to the Protocol in 2009, although these changes have
not yet entered into force.
In its Long Term Strategy adopted in December 2010, the UNECE Convention
stated that the main focus of global action on POPs should be through the
Stockholm Convention, with further changes to the POPs Protocol focusing on
unintentionally released POPs and where it is agreed that the implementation
of stricter measures in the UNECE region is needed.
2.1.2 The Rotterdam Convention on the Prior Informed Consent for
certain hazardous chemicals and pesticides in international trade
The Rotterdam Convention is a global agreement which seeks to promote shared responsibility and cooperative efforts among Parties in the international trade of certain hazardous chemicals, in order to protect human health and the environment. It establishes a Prior Informed Consent (PIC, http://www.pic.int/) procedure, which seeks agreement from importing countries to accept shipments of certain hazardous chemicals. Many of the POPs listed in the Stockholm Convention are also listed in the Rotterdam Convention. The UK ratified the Rotterdam Convention in 2004. It is implemented in the European Union (EU) through Regulation (EU) No

14
649/2012 (the PIC regulation) on the export and import of hazardous chemicals. In the UK, the PIC procedure is operated by the Government’s Health and Safety Executive which has been appointed jointly with the Health and Safety Executive for Northern Ireland as the UK PIC Designated National Authorities.
2.1.3 The Basel Convention on the Control of Transboundary
Movements of Hazardous Wastes and their Disposal
The Basel Convention (http://www.basel.int/) is a global agreement which
addresses the problems and challenges posed by the movement and
management of hazardous wastes, including those consisting of, containing or
contaminated with POPs. The Basel Convention uses a PIC procedure to
control transboundary movements of waste whereby hazardous waste cannot
be shipped from one country to another without the consent of those countries
involved, including countries of transit.
The Basel Convention was amended in 1995. The amendment prohibits the
export of all hazardous waste from Parties that are members of the EU,
OECD and Liechtenstein to all other Parties to the Convention. While the ban
is not yet in force, it is implemented in the EU through the Waste Shipment
Regulation. The UK ratified it in 1994.
In recent years the Basel Convention has been developing technical
guidelines on the environmentally sound management of wastes containing
POPs. Seven guidelines were adopted by the Conference of the Parties in
May 2015.
2.1.4 The Sustainable Development Goals
The United Nations Sustainable Development Summit of September 2015
adopted the 2030 Agenda for Sustainable Development. This agenda sets out
an international commitment to 17 Sustainable Development Goals and 169
targets, which aim to, inter alia, end poverty, combat inequality, protect human
rights, and ensure protection of natural resources. Goals 3 (Good Health and
Well-Being), 6 (Clean Water and Sanitation), and 12 (Responsible
Consumption and Production) all include targets relating to harmful chemicals.
The Department for International Development (DFID) leads on coordinating
the UK’s implementation of the Goals, with support from Cabinet Office.
Other Government Departments have overall responsibility for implementing
the Goals related to their area of work to ensure the UK fulfils its obligations.
The Well-being of Future Generations (Wales) Act 2015 gives public bodies in
Wales a statutory duty to carry out sustainable development, and puts
15
national goals, linked to the UN Sustainable Development Goals, on a
legislative footing for the first time.
2.1.5 The Strategic Approach to International Chemicals Management
The International Conference on Chemicals Management February 2006
finalised and adopted the Strategic Approach to International Chemicals
Management (SAICM, http://www.saicm.org/).
This is a global framework to improve chemicals management. It is a
voluntary agreement supported by a high-level declaration and contains a
toolkit of policies and activities aimed at raising the standards of chemicals
management, particularly in developing countries. SAICM coordinates
international bodies with responsibilities for chemicals management and
supports and enhances the global treaties that cover chemicals and
hazardous waste.
The 4th ICCM held in 2015 addressed issues on the continued
implementation of SAICM as a policy framework to foster the sound
management of chemicals globally. Resolutions were negotiated on:
• The endorsement of “overall orientation and guidance” (OOG) to assist
further implementation of SAICM towards its 2020 goal;
• Work on emerging policy issues within SAICM, including the adoption of a
new one on environmental persistent pharmaceutical pollutants;
•The establishment of a process for consideration of what international
arrangements should follow in respect of sound management of chemicals
and waste after 2020; and
•Budgetary and administrative arrangements for SAICM.
An “open group” of countries is addressing the future of SAICM through an
inter-sessional process. The overall result should enable ICCM5 – to take
place in March 2020 – to reach a decision on further work.
2.2 European Union
As a Member State of the European Union (EU), there is close co-operation
between the EU and the UK on policy and legislation on chemicals. Most UK
legislation concerning the control of chemicals arises from European
Community legislation.
2.2.2 European Union legislation on Persistent Organic Pollutants
The Union Implementation Plan includes a full list of relevant European
Legislation. Further details can be found at:
16
http://ec.europa.eu/environment/chemicals/international_conventions/index_e
n.htm
The key instruments are outlined below.
Regulation (EC) 850/2004 on POPs is directly applicable in UK law and
implements the most important obligations of both the Stockholm Convention
and the UNECE POPs Protocol. It prohibits the production, use and marketing
of the POPs listed in the Annexes of both instruments and contains provisions
on stockpiles and wastes.
In 2012 and 2016 a number of amendments of (EC) 850/2004 entered into
force to implement the international agreement reached at the 5th, 6th and 7th
Conference of the Parties (COP) to the Stockholm Convention in 2011, 2013
and 2015, respectively. The new chemicals added to the EU Regulation on
POPs have already been subject to prohibition or severe restrictions in the
EU. However, certain restrictions go further than previously was the case in
order to comply with the new international commitments.
The new chemicals were: Endosulfan, Hexachlorobutadiene (HCBD),
Polychlorinated Naphthalenes (PCNs), Short Chain Chlorinated Paraffins
(SCCPs) and Hexabromocyclododecane (HBCDD). Endosulfan is a new
pesticide and the other new substances have been widely used in consumer
and industrial products.
Council Directive 96/59/EC on the disposal of polychlorinated biphenyls and
polychlorinated terphenyls (PCTs) aims at disposing PCBs and equipment
containing PCBs3 as soon as possible. This Directive included a target to
remove and safely dispose of all larger equipment (heat transfer fluid
reservoirs of greater than 5 litres) containing PCBs before the end of 2010.
Furthermore this Directive also sets requirements for the environmentally
sound use and disposal of PCBs.
With regard to unintentionally produced POPs, there are several instruments
that have an impact, either directly or indirectly, on the reduction of releases of
these substances. The main release control measures are set out in the
Industrial Emissions Directive (IED) (2010/75/EU). Agreed in 2010, the IED
brought together and updated, seven existing European Directives covering
industrial emissions.
Regulation (EC) No 1907/2006 concerning the Registration, Evaluation,
Authorisation and Restriction of Chemicals (REACH) inter alia provides
3 Transformers can be used until the end of their useful life provided their PCB level is less than 500ppm.

17
provisions to ensure that industrial chemicals fulfilling POP criteria4 can be
identified and may be prevented from being produced or imported in the EU.
Criteria for the identification of these substances are set out in REACH Annex
XIII.
Under REACH, the standard information requirements for substance
registration depend upon the amount of the substance which is manufactured
in or imported into the EU. The most basic level of information (physico-
chemical data) applies to substances manufactured in quantities of one tonne
or more per year. The information requirements become progressively more
detailed including data on human toxicology and ecotoxicology, at
manufacture or import levels of 10, 100 and 1,000 tonnes or more per year.
The data requirements for higher tonnage brackets will have a potential
overlap with the POP criteria set out in the Stockholm Convention. However
the critical thresholds do not specifically match and some criteria, such as
long range transport, are not included within REACH data requirements. The
Regulation also has provisions to apply controls to substances of very high
concern (SVHC) which fulfil POP criteria. These provisions apply regardless
of tonnage. Furthermore, the European Chemicals Agency (ECHA) has a right
to request further information from companies if it suspects that a substance
might exhibit POP criteria.
Regulation (EU) No 649/2012 concerning the export and import of certain
hazardous chemicals (known as the PIC Regulation) prohibits, in accordance
with the provisions of the Stockholm Convention, the export from the
European Union of POPs listed in Annexes A and B of the Convention.
The Water Framework Directive’s daughter directive 2008/105/EC on
environmental quality standards in the field of water policy sets out
environmental quality standards (EQS) relating to the presence of two groups
of priority substances in surface waters. The substances are listed based on
the risk they pose to, or via, the aquatic environment. Annex I of this Directive
lists 33 substances broken into three groups:
• Priority substances (PS) - required for reduction of discharges and
losses;
• Priority hazardous substances (PHS) - required for the cessation or
phase out of discharges, emissions and losses; and
• Other pollutants (OP).
4 These are defined as chemicals which are persistent, bio-accumulative and toxic (PBT) or very persistent and very
bio-accumulative (vPvB)

18
Substances listed in Annex I include some POPs and these are classified as
PHS or OP. These are: brominated diphenylethers flame retardants,
cyclodiene pesticides (classified as OPs including aldrin, dieldrin and endrin),
DDT (OP), HCB, HCBD, HCHs and PCBz. Annex I substances were
subsequently reviewed, updated and a further 12 substances were added to
Annex II under the Water Framework daughter Directive – 2013/39/EU
together with EQS values. The POP chemicals included in the revised list are
perfluorooctane sulphonic acid and derivatives (PFOS), and dioxins and
furans and dioxin-like PCBs. Member states (MS) are required to report
surface water concentrations of these additional 12 substances to the
Commission in 2018.
In addition, the 2008/105/EC and 2013/39/EU daughter directives place a
requirement on MS to establish, for each River Basin District, an inventory of
emissions, discharges and losses for PS and PHS. The aim of these
inventories is to provide an evidence base to inform policy decisions, plans
and programmes of measures to reduce emissions, discharges and losses
and thus help maintain or achieve compliance with EQS.
2.3 National level
The UK has arrangements in place to ensure that independent expert
scientific advice is available to inform policy through the Hazardous
Substances Advisory Committee. There is also a dedicated body for
engagement with stakeholders on chemicals matters, through the UK
Chemicals Stakeholder Forum.
2.3.1 UK regulation on Persistent Organic Pollutants
In the UK, the Persistent Organic Pollutants Regulations 20075 (UK POP
Regulations 2007) supplements the Community Regulation EC 850/2004.
Following the addition of five new substances to the Stockholm Convention at
the 5th, 6th and 7th Conference of the Parties in 2011, 2013 and 2015
Regulation EC 850/2004 (amended to Regulation (EU) No 757/2010) was
amended in 2012 and 2016 to list the additional substances in its annexes.
The UK POP Regulations 2007 designates the Environment Agency as the
Competent Authority and enforcement agency for Regulation EC 850/2004 in
England, Natural Resources Body for Wales in Wales; the Department for
Agriculture, Environment and Rural Affairs (DAERA) in Northern Ireland; and
the Scottish Environment Protection Agency (SEPA) in Scotland.
5 http://www.legislation.gov.uk/uksi/2007/3106/made

19
2.3.2 UK roles and responsibilities
The range of UK Government Departments and agencies with an
implementation and/or enforcement role for the Stockholm Convention
include:
Department for Environment, Food and Rural Affairs (Defra) - Defra leads
for the UK in consultation with the Devolved Administrations, other
Government Departments and other stakeholders on the further development
and implementation of the Stockholm Convention. Defra aims to promote and
protect the quality of life and natural resources, both at home and
internationally. The department has published its strategy6 to 2020 “Creating a
great place for living” where it sets out its strategic objective for the
environment - a cleaner, healthier environment, benefiting people and the
economy. The aims are:
• Increased biodiversity, improved habitat and expanded woodlands;
• Cleaner air;
• Cleaner water and sustainable usage;
• Cleaner and healthier seas;
• Productive land and soils;
• Conserved and enhanced landscapes;
• Maintained protection of designated sites;
• Reduced waste and waste crime; and
• Greater enjoyment of the natural environment.
Defra will publish a 25‐year Environment Plan by the end of 2017 to meet these aims.
In the UK environmental responsibilities have been devolved to the following
bodies:
Scottish Government - the Environment and Forestry Directorate (ENFOR)
of the Scottish Government aims to improve the sustainable exploitation of
land, sea and freshwater resources and rural development, while
safeguarding the interests of consumers, and protecting and enhancing the
environment. The ENFOR encourages action to reduce pollution and other
measures to safeguard the environment. Specifically, it develops and
oversees the implementation of policy on, for example, integrated pollution
prevention and control, the water environment, waste, resource management
6 https://www.gov.uk/government/publications/defras-strategy-to-2020-creating-a-great-place-for-living

20
and air quality. The ENFOR also sponsors the Scottish Environment
Protection Agency (SEPA, the regulatory and enforcement authority for
environmental protection and pollution control in Scotland, covering
discharges to air, land and water);
Welsh Government– the Welsh Government is committed to sustainable
development as its central organising principle. Its responsibilities include:
environmental water quality, waste management, contaminated land and land
quality, air quality, and industrial pollution controls. The Welsh Government is
of the view that the regulation of industrial chemicals and nanotechnologies is
best carried out through strong legislation applied consistently across Europe
and, where possible, reinforced through global treaties. The Welsh
Government supports a consistent UK-wide approach to policy and regulation
in this area and sponsors the Natural Resources Body for Wales (NRW); and
Northern Ireland Department of Agriculture, Environment and Rural Affairs
(DAERA NI) –DAERA’s objectives include the conservation and enhancement
of the environment. The Department takes the lead in advising on and
implementing environmental policy and strategy in Northern Ireland. The
Northern Ireland Environment Agency (NIEA) as an executive agency of
DAERA has a wide range of responsibilities for the environment and supports
DAERA’s mission to make Northern Ireland a better place to live, work and
invest.
One Department with a particular interest in promoting the success of
multilateral environmental agreements such as the Stockholm Convention in
developing countries is:
Department for International Development (DFID) – This is responsible for
promoting sustainable development and reducing poverty. The UK Aid
Strategy7 sets out the UK’s aid priorities, which cover a range of the
challenges, set out in the Sustainable Development Goals, including the
environment. DFID’s assistance is concentrated in the poorest countries of
sub-Saharan Africa and Asia. It works in partnership with other Governments,
civil society, the private sector and the research community. It also works with
multilateral institutions including the World Bank, the Global Environment
Facility (GEF), and United Nations agencies.
In England, Wales and Scotland the responsibility for enforcing environmental
and chemicals legislation rests with the following bodies:
7
https://www.gov.uk/government/uploads/system/uploads/attachment_data/file/478834/ODA_strategy_final_web_0905.pdf

21
The Environment Agency (EA) – the EA is the designated enforcer of the
Stockholm Convention in England and is the main environmental regulator in
England. It was set up as a non-departmental public body (NDPB) sponsored
largely by Defra. The Agency issues various permits, licences, consents and
registrations, including permits under Integrated Pollution Prevention and
Control to reduce unintentional release of POPs. Before users (e.g. industrial
manufacturers) carry out an activity that may need a licence the agency offers
advice on ways of reducing that activity’s effect on the environment. Part of its
role is to regularly inspect and monitor licence-holders to ensure that the
standards that have been set are being met. The EA can take legal action
against those committing environmental crime;
The Scottish Environment Protection Agency (SEPA) – the SEPA is the
designated enforcer of the Stockholm Convention in Scotland and the main
environmental regulator for Scotland. It is sponsored by the Scottish
Government, as an NDPB, with the main purpose of protecting and improving
the environment, whilst also contributing to improving the health and well-
being of people in Scotland and achieving sustainable economic growth. In
broad terms it regulates activities that may pollute water, air and land, the
storage, transport, management, processing and disposal of waste, and the
keeping and disposal of radioactive materials;
Natural Resource Body for Wales (NRW) – the NRW is the enforcing
authority in Wales for the regimes that delivers the UK commitment to the
Stockholm Convention and is the main environmental regulator for Wales.
Their purpose is to ensure that the environment and natural resources of
Wales are sustainably maintained, used and enhanced, now and in the future.
It has a broad remit, including land management, conservation, advisor, and is
responsible for a wide range of environmental regulation including protecting
people and the environment from emissions to air, land and water; and
The Northern Ireland Environment Agency (NIEA) – the NIEA is the main
environmental regulator for Northern Ireland. NIEA aims to protect, conserve
and promote the natural environment of Northern Ireland for the benefit of
present and future generations. The agency provides education and advice
and undertakes the regulation of activities which have the potential to pose a
risk to human health or damage the natural environment. It is responsible for
implementing a wide range of legislation covering water quality, pollution
prevention and control, waste management, and nature conservation and the
countryside.
In summary, in relation to matters relevant to the Stockholm Convention, the
four environment agency organisations have similar roles and responsibilities.
The exception to this is that in England and Wales the industrial processes
with less potential to release dioxins and furans (i.e. Industrial Pollution

22
Prevention and Control (IPPC) Part B and Part A(2)) processes are regulated
by local authorities while in Scotland they are regulated by SEPA. In Northern
Ireland, those processes corresponding to Part A and Part A(2) of IPPC are
regulated by NIEA, while the regulation of those processes corresponding to
Part B are split between NIEA and local authorities.
There are also a number of other UK Departments with specific
responsibilities for the management of chemicals. These include:
Health and Safety Executive (HSE) – the HSE’s mission is to prevent death,
injury and ill health in Great Britain’s workplaces. HSE deals with a range of
health risks, including noise, vibration, pathogens, radiation and the risks
posed by chemicals specifically. HSE is the UK Competent Authority for the
regulation of biocides, pesticides, detergents and chemicals as they are
regulated by REACH, and duties under the Classification and Labelling
regime. Within its enforcement responsibilities HSE enforces a range of
chemical related legislation;
The Chemicals Regulation Division (CRD) – the CRD is a division of HSE.
The primary aim of CRD is to ensure the safe use of biocides, industrial
chemicals, pesticides and detergents to protect the health of people and the
environment;
Health and Safety Executive Northern Ireland (HSE NI) – the HSE NI is the
lead body responsible for the promotion and enforcement of health and safety
at work standards in Northern Ireland. Its mission is to ensure that risks to
people's health and safety arising from work activities are effectively
controlled;
UK Health Departments – The aim of these departments is to improve the
health and well-being of people. The Department of Health for England sets
the direction on promoting and protecting people’s health, taking the lead on
issues such as environmental hazards to health, infectious diseases, health
promotion and education and the safety of medicines. The Environmental
Hazards Branch, within the Department, plays a role providing policy advice
relating to possible impacts on human health of chemicals in the environment.
The Department works closely on environmental chemical issues with Other
Government Departments and international organisations such as the
European Union (EU), World Health Organisation (WHO) and Organisation for
Economic Cooperation & Development (OECD). It obtains expert scientific
and medical advice from the Public Health England (PHE). PHE is assisted in
formulating expert advice by a number of independent advisory committees.
PHE also provides a dedicated field service and an integrated approach to
protecting the public to chemical hazards, radiation and microbiological
hazards;

23
Food Standards Agency (FSA) – The FSA is an independent food safety
watchdog set up to protect the public’s health and consumer interests in
relation to food. It’s Science and Policy Directorate is responsible for the
development of policy and provision of advice on chemical contaminants in
food and feed, and represents the UK during negotiations with the European
Commission and other Member States regarding regulatory limits for
contaminants in food. FSA has devolved offices in Wales and Northern
Ireland. Food Standards Scotland (FSS) is a separate department but it works
closely with FSA on matters of food safety;
Local Authorities – in England and Wales local authorities enforce local air
pollution controls. Under this, conditions are included in authorisations for
prescribed processes to ensure that processes are operated using the best
available techniques not entailing excessive cost. They are also responsible
for the enforcement of food safety regulations, including contaminant limits;
Her Majesty’s Revenue and Customs (HMRC) - have enforcement
responsibility at borders against imports and exports of regulated chemicals
under the Stockholm Convention;
UK Border Force - have law enforcement command within the Home Office.
Their role is to secure the UK border by carrying out immigration and customs
controls for people and goods entering the UK. In dealing with hazardous
chemicals the Border Force will detain shipments that are believed not to
comply with the requirements of the legislation for up to two working days
pending further enquiries and / or examination by the HSE. The detention of
non-compliant shipments for up to two working days is allowed for under the
Health and Safety etc Act 1974. In the event that enquiries are likely to take
longer than two days then detention powers for up to three working days
under Product Safety Regulations8 can be used; and
Centre for Environment, Fisheries and Aquaculture Science (Cefas) – Cefas
is an Executive Agency of Defra. It is a world leader in marine science and
technology, providing innovative solutions for the aquatic environment,
biodiversity and food security. Cefas is the designated scientific and technical
advisor to the Marine Management Organisation (MMO). The MMO licenses
the dredging and disposal of dredged material in England under part 4 of the
Marine and Coastal Access Act 20099.
When determining an application for a marine licence for disposal to sea, the
MMO must have regard to protect the environment and human health and
also prevent interference with legitimate uses of the sea hence the suitability
8 http://www.legislation.gov.uk/uksi/2005/1803/contents/made
9 http://www.legislation.gov.uk/ukpga/2009/23/contents

24
of dredged material for disposal to sea must always be assessed.
Assessment is undertaken in line with Oslo and Paris Conventions (OSPAR,
http://www.ospar.org/convention) guidelines for the management of dredged
material (OSPAR 2009). Cefas identifies which contaminants including POPs
need to be tested for in sediments proposed for dredging and disposal. The
results of chemical analysis are considered against Cefas Action Levels (ALs).
The ALs are not statutory contaminant standards but are used as part of a
‘weight of evidence’ approach to assessing dredged material and its suitability
for disposal to sea. It should be noted these ALs are under review. Generally,
capital dredged sediments would be tested for POPs whereas maintenance
dredged sediments, which have been recently deposited, would only be tested
in specific areas where there has been previous a POP contamination issue.

25
Section 3
Implementation of action on Persistent Organic Pollutants in the UK
This section considers the current situation regarding POPs in the UK,
outlining their production, use, release pathways and relevant regulatory
controls. Where relevant, details of present stocks and marketing of the
substances, and measures undertaken to meet compliance requirements is
also provided. Details of POPs emissions are provided in Section 4.
Information regarding the existing POPs identified under the Stockholm
Convention was provided in the UK’s 2007 and 2013 National Implementation
Plans (NIPs). They cover the 12 substances added to the Annexes of the
Convention at its creation in 2004, plus the additional substances added to
the Convention in 2009, 2011 and 2013 (23 substances in total). A further
three substances were also added in 2015, for which the requirements
entered into force late in 2016.
The purpose of this 2017 NIP is to provide an update on that information and
should be read in conjunction with the 2007 and 2013 NIPs. Those POPs
listed in 2013 and 2015 are covered in detail in this NIP. However, more
background about the existing POPs and those listed in 2013 and 2015 is
provided in the Defra reports, “Cost Benefit analysis of the Addition of
Hexabromocyclododecane (HBCDD) to the Stockholm Convention and the
1998 POPs Protocols” and “A Further Update of the UK’s Persistent Organic
Pollutants Multi-media Emissions Inventory - CB0489 - Annual Report – 2016.
These reports are available at http://randd.defra.gov.uk/.
3.1 Overview of regulatory control
The requirements of the Stockholm Convention are implemented in UK
principally by the UK’s Persistent Organic Pollutants Regulations 200710 and
these are detailed section 2.3.1 above. Section 2 also details other chemical
and environmental legislation that complements the Regulation in
implementing the requirements of the Stockholm Convention. In addition there
are controls in place to reduce releases of unintentionally produced POPs and
human exposure to these. These are outlined at the end of this section.
10
http://www.legislation.gov.uk/uksi/2007/3106/made

26
The Environment Agency's (EA) Chemical Compliance Team undertakes
proactive, cost-effective monitoring and enforcement of compliance with
certain chemical marketing and use regulations, including the requirements
relating to POPs. Intelligence-led, risk-based targeting is used to deliver
sector-focussed compliance campaigns which employ a combination of advice
and guidance to raise awareness across the broader industry audience, and
proportionate direct enforcement action where necessary.
3.2 Update for POPs regulated before 2013 (“existing POPs”)
The term “existing POPs” covers those substances listed in the Stockholm
Convention before 2013, i.e. all 12 substances added at the Convention’s
creation in 2004, nine substances added in 2009 and endosulfan which was
added in 2011. The ‘new’ POPs are the substances added to the Convention
in 2013 (hexabromocylododecane) and in 2015 (hexachlorobutadiene,
polychlorinated naphthalenes, and pentachlorophenol). These substances are
chiefly dominated by pesticides and industrial chemicals.
The UNECE POPs Protocol (see section 2.1.1 above), which is independent
of the Convention, also includes many of the same substances within its
Annexes with some key differences – notably polycyclic aromatic
hydrocarbons (PAHs). The EU POPs Regulation (see section 2.2.2 above)
acts as the bridging instrument to both the Convention and the Protocol,
although the timing of when substances were added to the Regulation may
differ for the Convention and Protocol. For the sake of clarity, classification of
‘existing’ POPs is based on the Convention’s chronology, and also extends to
include the substances covered under the POPs Regulation. This section
provides an update to the more detailed information contained in the UK 2007
and 2013 NIPs.
3.2.1 Pesticides
At its creation the Stockholm Convention listed pesticides within its Annexes
(A, B, and/or C). These: were aldrin; chlordane;
dichlorodiphenyltrichloroethane (DDT); dieldrin; endrin; heptachlor;
hexachlorobenzene; mirex; and toxaphene (also known as camphechlor).
Subsequently, in 2009, the chlordecone, lindane, and the principal isomers
found in technical hexachlorocyclohexane (HCH) (alpha- and beta- HCH)
were added to the Convention, along with pentachlorobenzene (a
contaminant found in specific types of pesticide). Then in 2011, endosulfan
was included in the list of pesticides.
All the pesticides listed have been banned in the UK for many years, with only
lindane (banned in 2002) and endosulfan (banned in the EU as of 2006

27
EC/777/2006). However, even in these cases the use of lindane and
endosulfan has been banned in the UK for over 10 years now.
Only limited monitoring data exists for emissions of these pesticides into air,
land and water, but reportable concentrations from point sources covered by
the UK Pollutant Release and Transfer Register11 (PRTR) demonstrate that
no emissions above the reporting threshold have been notified from industry.
Diffuse emissions of these pesticides, particularly from timber stocks
historically treated with lindane, are possible, but are expected to be in trace
amounts.
Additional to the Stockholm Convention and EU POPs Regulation, a number
of the persistent pesticides (heptachlor, hexachlorobenzene,
pentachlorobenzene, lindane, endosulfan and pentachlorophenol are listed as
priority substances or priority hazardous substances under the Environmental
Quality Standards (EQS) Directive 2008/105/EC (amended by 2013/39/EC).
Additionally the industrial chemical HBCDD has also been listed in the EQS.
These daughter directives of the Water Framework Directive (2000/60/EC)
lists maximum allowable concentrations and annual average (EQSs) in
surface waters, and aquatic biota.
The EA carries out water monitoring for some of the pesticides listed in the
Stockholm Convention. In 2015, monitoring data collected for compliance with
the EQS Directive, for hexachlorocyclohexane (HCH, alpha-, beta- and
gamma- (lindane) isomers), the “drins” (cyclodiene pesticides) and para-para
DDT showed that the samples exceeded the EQS for these pesticides at a
limited number of specific sites. Further analysis of this data will be carried out
in order to assess the overall significance of these emissions and to determine
if further action is required to eliminate them.
3.2.2 Industrial chemicals
The original 12 substances added to the Stockholm Convention were
dominated by pesticide products with the remaining substances covering
industrial products, primarily polychlorinated biphenyls (PCBs), and
hexachlorobenzene (HCB) which had application both as a pesticide and as
an industrial chemical. Amongst the original listed substances were dioxins
and furans, which have no commercial use, but can be released
unintentionally through a number of pathways typically related to combustion.
In 2009, a further nine substances were added to the Annexes of the
Convention, with a number of new industrial use chemicals. In particular, this
11
https://data.gov.uk/dataset/uk-pollutant-release-and-transfer-register

28
gave focus to those brominated chemicals chiefly used as flame-retardants,
where health and environmental concern warranted action. These included
tetra- and penta- brominated diphenyl ether – the primary homologues within
the commercial pentabrominated diphenyl ether flame retardant, and hexa
and hepta brominated diphenyl ether – homologues found within the
commercial octabrominated diphenyl ether flame retardant. Another
brominated chemical, hexabromobiphenyl (HBB), used as an industrial
chemical, pesticide and flame-retardant was also added at this time.
Alongside the brominated chemicals a fluorinated surfactant
(perfluorooctanesulfonic acid (PFOS)) used primarily in stain repellents, as a
mist suppressant used in the metal plating industry and in firefighting foams
was added.
The UK has used all of the above chemicals, with stockpiles and legacy waste
aspects a key issue for the named industrial chemical substances. The
possible exception being HBB, which has had limited use in the UK and has
not been used for many years having been banned in the UK in 197712.
3.2.3 Review of specific named “existing POPs”
This section provides an overview of those ‘existing POPs’ (added to the
Convention before 2013) which are the most relevant to the UK for continued
emissions and need for emission control.
3.2.3.1 Hexachlorobenzene (HCB)
Hexachlorobenzene is an industrial chemical as well as a seed treatment
pesticide. Furthermore, it can be generated unintentionally from certain kinds
of combustion process. In 2004, HCB was added to both Annex A (banned)
and Annex C (unintentionally released) of the Stockholm Convention reflecting
both commercial uses but also its unintentional sources. The ban on
commercial use of HCB is upheld in the UK through the UK POPs
Regulations, 2007.
The former commercial use of HCB was primarily dominated by the use of
hexachloroethane (HCE) as a cover gas in aluminium manufacture. The
production process for HCE also generated significant amounts of HCB as
part of the same mixture. The cover gas used in this process was
subsequently released to air at the end of the production process representing
a major point source release for HCB. Environmental concerns over this
practice lead to a voluntary cease by industry in 20004.
12
Whiting et al, 2012, ‘Further update of the UK source industries for emissions to air, land and water of dioxins, dioxin-like PCBs, and HCB, incorporating multi-media emission inventories for nine new POPs under the Stockholm Convention’, Defra Report ref CB0429

29
The primary direct application of HCB within agriculture was as a seed
treatment to prevent fungal diseases in grains, however this application had
ceased by the 1970s13. Agricultural source emissions of HCB continued to be
present after this date with HCB as a contaminant by-product in other
pesticides.
This use of pesticides (primarily chlorothalonil) containing HCB as a
contaminant, represents the key current emission source for HCB. Emissions
to air of HCB from use of chlorothalonil represented 49% (10.5 kg) of total air
emissions in 2014, with a range of different combustion sources making up
the remaining 51%
Legislative restrictions on levels of contamination and improvements in
production processes have seen the level of HCB contamination decline in
chlorothalonil. Bailey, 200114 quotes working concentrations in the mid-1990s
of 26 mg/kg active ingredient. A sampling campaign in 2010 of pesticides on
the UK market found working concentrations of 8 mg/kg active4.
3.2.3.2 Pentachlorobenzene (PCBz)
Pentachlorobenzene) is not produced in the UK and has no current
commercial uses. It was, however, present as a contaminant in the pesticide
quintozene. The UK set maximum limits for PCBz contamination in quintozene
in the early 1990s (10 mg/g active substance). Subsequently, following a
review, quintozene was not included as an active substance under Council
Directive 91/414/EEC and quintozene-containing products already on the
market were withdrawn on 27 June 2001 with existing stocks to be exhausted
by 27 June 2002. From 28 June 2002 it has been illegal to market, use or
store plant protection products containing quintozene.
Emissions of PCBz from a wide range of sources have been estimated for the
period 1990 to 2014. Emissions in 1990 were dominated by industrial sources
and from the legacy of earlier industrial processes. The significance of these
industrial sources has declined since 1990, leading to more recent emission
estimates being dominated by diffuse sources.
In the past PCBz was present as:
an elastomer in PCB di-electric fluids;
a contaminant of HCE (hexachloroethane) cover gas agents used in aluminium manufacture;
a contaminant of the pesticide quintozene;
13
Barber et al. (2005). ‘Hexachlorobenzene, sources, environmental fate, and risk charactisation’ Eurochlor dossier.
14 Bailey et al. (2001). ‘Global HCB emissions.’ Chemosphere 43, 167-182

30
a contaminant of the pesticide pentachlorophenol (PCP);
a contaminant of tetrachloroethene (also known as perchloroethylene or PERC) used in dry cleaning; and
a by-product of the production of carbon tetrachloride.
Pentachlorobenzene is also produced as an unintentional by-product in
combustion processes, in the following diffuse activities:
uncontrolled combustion of waste;
accidental fires;
incineration of hazardous and clinical wastes;
combustion of solid fuels – principally coal in domestic grates; and
trace residues from emissions at waste water treatment works.
3.2.3.3 Polychlorinated biphenyls (PCBs)
Prior to the mid-1970s, PCBs were used in both ‘closed’ (electrical equipment
such as capacitors, transistors and electrical switching gear) and ‘open’
applications (such as paints and sealants). Although the open use of PCBs
ceased in the 1970s, it is possible that building sealants containing PCBs may
still be present in older properties. A significant amount of PCBs found in the
environment will have arisen from past use of such products.
The manufacture of new PCB containing equipment was banned in 1985.
However, given the life-span of electrical equipment, particularly larger
equipment used in electrical distribution networks, a significant bank of ‘in-use’
equipment containing PCBs is expected. The Stockholm Convention listing
does provide derogation for PCBs already in use at the time of listing in the
Convention.
Owing to their high environmental persistence the residual bank of equipment
containing these chemicals still being used, PCB emissions have been
evident in the environment long after the ban was introduced. As required
under Council Directive 96/59/EC on the disposal of polychlorinated biphenyls
and polychlorinated terphenyls (the PCB Directive), the Environment Agencies
hold registers of known PCB holdings (including any transformer, capacitor or
receptacle containing residual stocks) in the UK. These are available on
request from Agency offices.
Under the EU Directive 96/59/EC on disposal of PCBs and PCTs, it was a
requirement to identify and dispose of all di-electric equipment containing
more than 5 litres of PCB by the end of 1999. This was intended to target the
larger PCB based equipment still in use.

31
The method used to estimate the current number and size of PCB-containing
items of equipment is complex and due to the difficulty in identifying PCB-
containing equipment. The inventory contains many items that could contain
PCBs between 50 and 500 ppm but it is not possible to check for certain
because of the environmental and human health risks involved. This leads to
uncertainties in the estimates of the current number and size of PCB-
containing items of equipment. The UK Environment Agencies are working
with companies on their PCB registers to establish more accurate records.
In September 2016, there were a total of 83 registered holders in the UK of
which there were 75 holders in England and Wales and 8 holders in Scotland,.
There were a total of 346,583 items of registered PCB-containing equipment.
The number of registered items has increased significantly in England and
Wales since the last NIP (2013) as a result of work undertaken by the EA to
raise awareness of the Directive amongst companies belonging to the energy
sector and still using PCB-containing equipment.
All UK agencies are continuing to work with companies on their PCB registers
to establish more accurate records and to arrange for the disposal of items of
PCB-containing equipment that are not transformers. In January 2017, in
England and Wales, there were 287 items registered that were not
transformers registered by two different companies. These companies are
working to disposal plans agreed with the Environment Agency.
3.2.3.4 Dioxins and furans
Dioxins and furans are a family of chemicals which to date have no known
commercial use, but are produced unintentionally as a combustion by-product.
Their formation can occur under thermal conditions during a number industrial
production processes. Dioxins and furans can also cycle through the
environment, including the food chain.
Emissions of these chemicals have declined significantly following measures
taken to control industrial releases. However, unintentional releases from
diffuse sources, such as backyard burning, continue to present a challenge in
achieving further reductions.
The Irish dioxin incident of 2008, in which highly contaminated feed was given
to pig farms in the Republic of Ireland but a proportion of which reached beef
and dairy farms in Northern Ireland, leading to the disposal or destruction of
hundreds of tonnes of milk and beef and the culling of 5,000 cattle, remains
the only major dioxin incident affecting the UK since 2007.
3.2.3.5 Polybrominated diphenyl ethers (tetra-, penta-, hexa- and hepta- BDEs)

32
Polybrominated diphenyl ethers (PBDEs) are a family of chemicals which
have been used in different blends for application as flame-retardants. While
different trade name products have been sold across the UK and Europe,
three main blends have been used based on the primary homologue groups,
‘penta-’, ‘octa-’ and ‘deca-BDEs’. Table 2 provides details of these blends and
which homologue groups have been present in each blend.
Table 2 Commercial mixtures of polybrominated diphenyl
ethers15
Commercial Penta BDE mixture as % wt/wt
Commercial Octa BDE mixture as %wt/wt
Commercial Deca BDE mixture as % wt/wt*
Tetra 38-42% Hexa 0.2 – 10% Deca >97%
Penta 55 – 65% Hepta 13 – 44% Nona/Octa <3%
Hexa 5% Octa 19 – 41%
Hepta 2.7 – 4.5% Nona 1 – 12%
Deca 1.3 – 50%
*Concentrations of c.DecaBDE post 1995 expected to be aligned to OECD voluntary scheme.
Health and environmental concerns for PBDEs, particularly the lower order
homologues which are expected to be more toxic, meant that a European ban
on the commercial penta- and octa-BDE blends was enacted in 2004 through
Council Directive 2003/11/EC. This is implemented through the UK Controls
on commercial Pentabromodiphenyl Ether and commercial
Octabromodiphenyl Ether Regulations 2004 and bans the use and placing on
the market of Commercial penta and octa BDEs. The ban applies to goods
marketed and manufactured in the UK.
While the ban on manufacture and use of the commercial mixture was
imposed in 2004, existing stock and in-use goods were permitted to continue.
Where the commercial penta- and octa- BDEs were used in plastics for
electrical products and in vehicles, as well as soft furnishings, the life-span of
these goods could be expected to extend for some years after the ban,
15 Whiting et al, “A Further Update of the UK’s Persistent Organic Pollutants Multi-media Emissions Inventory Annual
report -2016. http://randd.defra.gov.uk/
33
creating a need for additional control during the waste management of these
products.
Since 2007, the EU Waste Electrical and Electronic Equipment (WEEE)
Regulation has regulated the disposal and recycling of electrical and
electronic equipment containing the tetra-, penta-, hexa- and hepta- BDEs.
This legislation is implemented in the UK through the Waste Electrical and
Electronic Equipment Regulations 201316 .
Additional controls on the use and placing on the market of these substances
are provided through the EU Chemicals Regulation (REACH, 1906/2007) and
the EU Restriction of certain Hazardous Substances (RoHS) Directive
(2011/65/EU).
3.2.3.6 Perfluorooctanesulfonic acid (PFOS), its salts and perfluorooctane
sulfonyl fluoride (PFOS-F)
Perfluorooctane sulfonic acid (PFOS) is produced as a commercial product,
where its high surfactant properties make it well suited as a stain repellent,
mist suppressant in metal manufacture and as a surfactant within fire-fighting
foams. Additionally, releases to environment can occur unintentionally through
the degradation of related anthropogenic chemicals once released into the
environment.
PFOS is not manufactured within the UK, and manufacture within Europe was
expected to decline after 2001 when the major manufacturer (3M) voluntarily
phased out PFOS. Continued manufacture of PFOS is now limited to one
member state within the EU.
Under the Stockholm Convention PFOS is listed within Annex B (restriction),
with a number of acceptable purposes and specific exemptions in place for
named applications.
Finding alternatives with comparable properties (particularly high surfactant
properties at low doses) has proved challenging, meaning that for a small
number of the applications stated under Annex B of the Convention, use in
the UK still continues. This primarily relates to the use of PFOS within metal
plating activities in the chrome industry, the use of small quantities in semi-
conductor manufacture and limited applications in the photographic industry.
In the UK, PFOS-containing stockpiles have been notified to the EA for use as
a wetting agent and mist suppressant in non-decorative hard chrome plating.
16
http://www.legislation.gov.uk/uksi/2013/3113/made

34
The UK has conducted awareness raising campaigns with the sector;
circulating information via the Surface Engineering Association (SEA) and UK
PPC (pollution prevent and control) site inspectors. Hence between 2012 and
2013 the number of companies notifying increased from 4 to 6. In 2014 a total
33,837 kg of PFOS-containing material equating to 135 kg of PFOS were
notified by six companies. Information from the manufacturer suggests that
these quantities will diminish as alternatives are now being used and products
reformulated.
Previous use of PFOS was dominated by the domestic market, particularly as
a stain repellent in furniture and other furnishing items. These items which are
still being used are likely to remain a source of PFOS emissions for an
extended period.
In the UK, the main environmental release pathways are believed to be to
water, where concerns have been raised about further de novo17 formation of
PFOS within waste water treatment works. However, very little substantiated
data exists to be able to verify current emission estimates.
3.2.3.7 Lindane and isomers of technical Hexachlorocyclohexane (alpha- and
beta-HCH)
The technical formulation of HCH was manufactured and used as an
insecticide within the UK since the 1940s as a main alternative to the pesticide
DDT. This product was primarily made up of a mixture of HCH isomers, where
the alpha and beta isomers were the dominant form within commercial
formulations. However, health and environmental concerns were raised with
respect to these isomers, and manufacturers began altering formulations to
reduce the content of these isomers in favour of the gamma isomer (lindane).
The use of technical HCH comprising chiefly alpha and beta isomers was
banned in the UK in 1982.
Lindane, a commercial formulation comprising 99% gamma HCH, ultimately
replaced the technical HCH product. However, the production process was
inefficient and for every 1 tonne of lindane produced, approximately 8 – 10
tonnes of hazardous waste containing chiefly alpha and beta HCH was
generated.
In the UK, technical HCH and lindane was primarily used as an insecticide to
protect timber stocks. Later applications for lindane also included use in
specialist shampoos for treatment of head lice. The use of lindane within the
UK was banned in 2002.
17 Synthesis of PFOS from simple molecules

35
Lindane and technical HCH are no longer manufactured or used in the UK.
Placing products on the market containing lindane or technical HCH is also
banned in the UK. The use of lindane on timber stocks and potential long
service life of such timber stocks means that it is possible some ‘in-use’ or
waste wood contaminated with lindane may still remain in circulation in the
UK. However, given that lindane has been banned for over ten years and use
of lindane had begun to decline before the ban, this should mean that such
stockpiles are in decline.
3.3 POPs regulated from 2013 (“new POPs”)
The ‘new’ POPs are the substances hexabromocyclododecane (HBCDD),
hexachlorobutadiene (HCBD), pentachlorophenol (PCP) and its salts and
esters and polychlorinated naphthalenes (PCNs). They were listed in the
Stockholm Convention at the 6th and 7th Conference of the Parties (COP) to
the Stockholm Convention held in May 2013 and in May 2015, respectively.
They were also listed in the POP Protocol at the 27th meeting of the
Executive Body of LRTAP Convention held in December 2009.
3.3.1 Hexabromocyclododecane (HBCDD)
3.3.1.1 Current production, marketing use, and control
Hexabromocyclododecane (HBCDD) is a flame retardant used mainly in
thermal insulation foams in the construction industry. It is used in the
manufacture of expanded polystyrene (EPS) and extruded polystyrene (XPS)
insulation foam boards. As these foam boards are required to meet stringent
fire safety regulations in the UK, HBCDD provides the required level of
performance, at a relatively low concentration. HBCDD has also been applied
in the back coating of textiles, mainly for upholstered furniture and in vehicle
upholstery. It has been used as an additive in the manufacturer of high-impact
polystyrene (HIPS) which is used in electrical and electronic equipment and
appliances. There are no significant unintentional production sources of
HBCDD.
HBCDD was produced in the UK by one manufacturer until 2003. After this
time HBCDD was imported into the UK from European suppliers (Albermarle,
Chemtura and ICL). However information collated by the European Chemicals
Agency indicates that an increasing proportion of HBCDD used in Europe was
imported from outside of Europe. The estimated proportion of HBCDD used in
Europe which was imported into the EU was 38% in 2003, rising to 48% in
2006. It is likely that a similar proportion of HBCDD was imported into the UK
over this period.

36
HBCDD has been subject to review both under the Stockholm Convention as
a POP but also under the EU Regulation on the Registration, Evaluation,
Authorisation and restriction of Chemicals (REACH). Under the latter it was
identified as a substance of very high concern (SVHC) and subject to the
authorisation process, which means permission would be needed for specific
use in named applications. Under the Stockholm Convention, HBCDD was
added to Annex A (banned) in 2013 with a specific exemption in place giving
derogation to the EU REACH Regulation process.
In January 2016 authorisation was given to thirteen companies for two specific
applications (use as a flame retardant in EPS boarding and in the
manufacture of expanded polystyrene beads)18. The review period for these
authorisations is two years and the authorisation will be assessed again in
August 2017. The sunset date (after which new applications for authorisation
cannot be made) for HBCDD was August 2015.
3.3.1.2 Historical use and release pathways
HBCDD is not produced in the UK and historical uses have not been found.
However it is widely used in the UK as a flame retardant. Hence emissions of
HBCDD into the environment would have occurred from the following:
Manufacturing goods containing HBCDD;
Use of goods containing HBCDD; and
End of life goods containing HBCDD.
3.3.1.3 Stockpiles and compliance activity
Although HBCDD is not manufactured in the UK, it is imported for
manufacturing of insulation foam boards. It is also possible that import of the
finished goods fire proofed with HBCDD into the UK can occur. Under the
REACH Regulation (see para 3.3.1.1.) the continued use of HBCDD has been
controlled through the authorisation process so that only specific applications
are permitted (i.e. insulation boarding) and produced/supplied by those
manufacturers/importers that have an authorisation in place for such goods.
Work to find viable alternatives is expected to be ongoing and the
authorisations in place are due to be reviewed at the end of 2017.
For those goods already ‘in-use’, particularly within the housing market, at
present there are some controls in place to manage the end-of-life and waste
aspects, namely:
18
ECHA news update: http://echa.europa.eu/view-article/-/journal_content/title/authorisations-granted-for-two-uses-of-hbcdd

37
The Environmental Permitting (England and Wales) Regulations 2016
(Amendment) (No 2) 2016 (Statutory Instrument 2016 No. 47519) as
amended. This lays down environmental controls on (inter alia) the
landfill of waste materials;
The Waste Electrical and Electronic Equipment (Amendment)
Regulations 2007 (Statutory Instrument 2007 No. 345420). Use of
HBCDD in HIPs was a minor use, but it can be expected that in-use
stockpiles exist, representing a waste legacy issue. This regulation lays
down targets for recovery and recycling of waste electrical and
electronic equipment. It includes record-keeping requirements;
HBCDD has now been added to the EU POPs Regulation and a target
threshold of 1000mg/kg for wastes has been set. Those substances
with higher concentrations than the threshold are considered as
hazardous waste; and
The European brominated flame retardant industry operates a
programme called the “Voluntary Emissions Control Action
Programme (VECAP).” This aims to reduce emissions of a range of
brominated chemicals, and covers producers and industrial users of
these chemicals. This is now linked with a programme focused on
management of HBCDD in the polystyrene foams supply chain, known
as “SECURE.” This programme has resulted in improvements in the
control of HBCDD emissions at source. It covers 60 of the 73
European user sites for HBCDD, accounting for approximately 93% of
HBCDD consumption in Europe.
3.3.2 Pentachlorophenol (PCP) its salts and esters
3.3.2.1 Current production, marketing, use and control
Pentachlorophenol (PCP) is a pesticide with particular use for treatment of
timber against a range of pests. However, concerns over its environmental
effects and human health have meant through regulation or restriction that its
use globally has been in decline for a number of years. Globally, manufacture
of PCP is now limited to the USA and Mexico where the latest available
production data reported that 13,867 tonnes of PCP was produced globally in
2009. PCP is currently only used in Canada and the USA, primarily for utility
poles and railway sleepers.
19
http://www.legislation.gov.uk/ukdsi/2016/9780111143261 20
http://www.legislation.gov.uk/uksi/2007/3454/pdfs/uksi_20073454_en.pdf
38
The salt of PCP (sodium-PCP) is also manufactured and used in India as an
anti-fungal wood preservative at approximately 1,500 tonnes per annum.
In the UK, the commercial production of PCP stopped in 1978, although its
use continued until 2008. During this period, PCP was imported from the USA
(~30 tonnes per annum) and predominantly used for production of PCPL
(~93% of imported PCP was synthesised to PCPL, of which ~70% was then
exported). Use of PCPL in the UK was mostly for fabrics used by the military.
3.3.2.2 Historical use and release pathways
Pentachlorophenol was most commonly used as a biocide, pesticide,
disinfectant, defoliant, anti-sapstain and anti-microbial agents, and wood
preservative in the agriculture and forestry sectors (namely for wooden utility
poles and wooden trays used in mushroom farming). Its salt, sodium
pentachlorophenate (NaPCP), was also used as a pesticide, namely a
molluscicide (a pesticide against molluscs). The NaPCP salt degrades to PCP
under certain conditions. Furthermore, PCP was also used for the production
of PCP’s ester pentachlorophenyl laurate (PCPL) which was used on textiles
and fabrics for heavy duty military transport, tent fabrics and leathers as well
as rope used in awnings and sails. The use of PCPL protected such textiles
from fungi and bacteria. At the height of production, approximately 90,000
tonnes were globally produced per annum.
Historical and current environmental release pathways include:
• Production of PCP and its ester (PCP is used for the production of
PCPL) and salt (NaPCP degrades to PCP) (historical source);
• Processing including the application of PCP/ PCPL as well as the
manufacturing process of products containing PCP and its derivatives
(historical source);
• Evaporation during in service life of treated products and stockpiles.
For example, PCP volatises from the surface of treated wood at ~5% of
the total amount of the preservative applied. However, during the first
12 months evaporation rates are much higher, with around 30% of
PCP evaporating within the first 12 months of treatment;
• Waste handling where PCP treated products are sent to landfill;
• Contaminated sites resulting from former PCP production and wood
preservation plants; and
• Domestic or forest fires (temperatures exceeding 800 degrees
centigrade are required for complete combustion – as achieved in
modern incineration plants).

39
Pentachlorophenol is also a source of dioxins and furans and was at the
centre of a dioxin food incident in 2007 when high levels of dioxins were
identified in fruit yoghurt in the Czech Republic. The source of the
contamination was traced to the fruit ingredient, which had been thickened
with contaminated guar gum from India. The guar gum had been treated with
PCP (a common practice for non-food grade guar gum) and had been
fraudulently or accidentally introduced into the food chain. As a result of this
incident special control measures at EU level were introduced and these still
remain in place.
3.3.2.3 Stockpiles and compliance activity
Restrictions on the use of PCP entered into force in the EU in 1991 under
Council Directive 91/173/EEC and a ban was placed with respect to the use of
PCP as a synthesising or processing agent in industrial processes (including
use as a wood preservative) under the Directive 1999/51/EC. Further
restrictions on the use of PCP in the UK entered into force in 2008 under the
REACH Annex XVII. legislation which stipulates that PCP levels should not
exceed 0.1% of the weight of any product placed on the market.
3.3.3 Hexachlorobutadiene (HCBD)
3.3.3.1 Current production, marketing, use and control
In the EU, commercial production of hexachlorobutadiene (HCBD) stopped in
1993 and production in the UK ceased at the same time. The latest global
estimate of HCBD emissions at the time of commercial production (1982) was
approximately 10,000 tonnes. Although HCBD is no longer used in
manufacturing processes and does not occur naturally, it is unintentionally
released from certain chemical processes, including the production of
chlorinated hydrocarbons, in particular carbon tetrachloride, trichloroethylene
and tetrachloroethylene. The UK manufacture of carbon tetrachloride ceased
in 1993, with the production rates of around 200,000 tonnes per annum before
this point. Manufacture of trichloroethylene and tetrachloroethylene both
ceased in the UK in 2008, with production rates in the early 1990s of 375,000
tonnes and 13,000 tonnes respectively per annum. At the point production
ceased, only 4.5 tonnes per annum of trichloroethylene and
tetrachloroethylene.
Other unintentional emission sources of HCBD include the electrolytic
manufacture of magnesium. While magnesium is manufactured in the UK it is
important to note that the electrolytic production pathway is not the preferred
production route, and that manufacture of magnesium in the UK via this route
is unlikely or at best minimal.
40
Unintentional releases from combustion outside of industry are less regulated
(domestic combustion and accidental fires are of most relevance to HCBD),
and there are comparatively fewer monitoring studies available identifying
hazardous by-products. No studies reporting the unintentional release of
HCBD in either domestic combustion or accidental fires have been identified
in this review. However, in both cases it is expected that any HCBD releases
will be minor given general improvements to the quality of materials burned in
domestic combustion and the low frequency at which accidental hazardous
fires occur.
3.3.3.2 Historical use and release pathways
Hexachlorobutadiene was used mostly as a chemical intermediate in the
production of rubber compounds, and to a lesser extent in the production of
chlorofluorocarbons (CFCs) and lubricants. It was also used in smaller
quantities as a solvent, lubricating fluid (e.g. for gyroscopes, and heat transfer
liquid hydraulic fluid). HCBD was also reportedly used as a fumigant for
pesticide against Phylloxera (a type of aphid pest) as well as in the production
of aluminium and graphite rods. However, such claims have since been
reviewed and are no longer believed to be accurate.
Current environmental release pathways for HCBD include unintentional
releases, given that there is no production or stockpiles of HCBD in the UK.
Sources of unintentional releases, as identified in the literature, include:
The production of chlorinated solvents, at a trace level – including the
manufacture and use of trichloroethylene (used an industrial solvent)
and the methanol-based production of chlorinated methanes;
The production of polyvinyl chloride, PVC;
Magnesium (by electrolysis);
Waste disposal from the production of chlorinated hydrocarbons
containing HCBD. Lenoir et al.21 observed the by-product formation of
organochlorine compounds including HCBD from incineration
processes of acetylene, which was indicated as being present in flames
of all incineration processes. HCBD entering such plants can be
released to water and soil via sewage sludge;
Previously, unintentional releases were also reported as a result of the
use of perchloroethylene (which is still widely used in the dry cleaning
sector, although strictly regulated under environmental permitting), and
21
Formation and inhibition of chloroaromatic micropollutants formed in incineration processes. Chemosphere 43, 107-114

41
from the manufacture of carbon tetrachloride (CTC). The production of
CTC ceased in 1993; and
Emissions from motor vehicles have also been indicated as a potential
source for HCBD. However, no evidence has been developed to
substantiate this and it is expected to be a minor emission source and
therefore has not been considered in more detail.
Under the POPs Regulation (EC) No 850/200422. the placing of HCBD on the
market was prohibited in 2012 According to the Regulation, manufactured
objects containing HCBD that were in use before 10 July 2012 are allowed to
be placed on the market and used, and manufactured objects containing
HCBD produced before that date were allowed to be placed on the market
until 10 January 2013. As such it is possible that products containing HCBD
are still continuing to be in use in the EU and the UK.
Unintentional releases of HCBD can also occur as a result of waste
management, either through incineration plant, or landfill. For example,
ethylene dichloride (EDC) used in the manufacture of polyvinyl chloride plastic
(PVC), has been found to contain around 65% chlorine, of which 1.2% can
form as HCBD during production processes23. These chlorines can be
released to the environment during incineration if the appropriate waste
management options are not in place. To address this issue in the EU,
maximum concentration limits for releases of HCBD to the environment were
established under Regulation (EU) 1342/201424:
• Reasonable effort shall be made to avoid contamination from waste
management. HCBD concentrations must not exceed 100 mg/kg
(Article 7 of Regulation 850/2004)25; and
• HCBD concentrations must not exceed 1,000 mg/kg from wastes
emitted from thermal processes and waste management facilities,
as well as from construction and demolition wastes and those
otherwise not specified (a comprehensive list is set out in Annex II
of Regulation 1342/2014).
22
Commission Regulation (EU) No 519/2012 of 19 June 2012 amending Regulation (EC) No 850/2004 of the European Parliament and of the Council on persistent organic pollutants as regards Annex I. OJ L159/1. http://eur-lex.europa.eu/LexUriServ/LexUriServ.do?uri=OJ:L:2012:159:0001:0004:en:PDF 23
Thorton 2002 – Environmental Imapcts of Polyvinyl Chloride (PVC) Building Materials. A Briefing paper for the Healthy building Network
24 Commission Regulation (EU) No 1342/2014 of 17 December 2014 amending Regulation (EC) No 850/2004 of the
European Parliament and of the Council on persistent organic pollutants as regards Annexes IV and V Text. OJ L 363/67. http://eur-lex.europa.eu/legal-content/EN/TXT/?uri=CELEX%3A32014R1342
25 Regulation (EC) No 850/2004 of the European Parliament and of the Council of 29 April 2004 on persistent organic
pollutants amending Directive 79/117/EEC. OJ L158/7. http://eur-lex.europa.eu/LexUriServ/LexUriServ.do?uri=OJ:L:2004:158:0007:0049:EN:PDF

42
Emissions from unintentional releases are low and are controlled by
incineration, among other techniques. Thus, there have been significant
reductions in emissions from waste management, although some releases are
still reported. In light of the thresholds established under Regulation (EU)
1243/2014, it is expected that these unintentional releases will continue to
decline in the UK.
3.3.4 Polychlorinated naphthalenes (PCNs)
3.3.4.1 Historic and current uses and production
Polychlorinated naphthalenes (PCNs) were produced at the beginning of last
century and were produced in high volumes (in the 1920s global production
was approximately 9,000 tonnes per year) for a diverse range of uses and
applications. PCNs are a good dielectic medium (heat transfer) with a high
degree of thermal and chemical stability, and are compatible with other
products such as petroleum waxes and chlorinated paraffins and are soluble
in chlorinated and aromatic solvents. As such PCNs have had various uses
including dielectric fluids, flame retardants, fungicides, wood preservation and
dye carriers. With characteristics similar to those of PCBs, PCNs have also
been produced for similar uses as PCBs such as cable insulation and di-
electric fluids for capacitors.
Global production started to decline from 1977 over health concerns, with a
complete phase-out now in place in many countries. Within the UK, PCN
production stopped in the mid 1960s although there were some reports in
1970 and again in 2000 that small amounts of PCN were still being produced
and imported to other countries. Across wider Europe, Bayer was one of the
main producers of PCNs, producing between 100 and 200 tonnes per year
between 1980 and 1983 after which it ceased production.
Production of PCNs was possible within the European Union until 2012 when
PCNs were incorporated into the EU POPs regulation. Internationally, the
main producers of PCNs were based in the USA, with all USA production
ceasing in 1980; and Canada, with production and use being prohibited in
2013. Between 1920 and 1980 the total global PCN production was
approximately 150,000 tonnes, roughly 10% of the quantity of PCBs produced
in the same timeframe.
While the main production processes of PCNs have ceased, they are still
created unintentionally. These substances can be produced during
uncontrolled waste combustion, waste incineration (e.g. municipal, clinical and
industrial waste) and other thermal (domestic and industrial) processes. This
includes production of PCNs as by-products of the non-ferrous metal industry,
coking, metal reclamation, industrial solvent production, and cement industry

43
processes which can be considered sources for ongoing small release
quantities.
3.3.4.2 Emission sources and release pathways
Since production of PCNs has ceased, the main releases of PCNs to the
environment are likely to be from unintentional production, historical stockpiles
and existing products that contain PCNs. The main likely sources for the UK
are:
Landfills holding old PCB and PCN containing products;
Disposal routes of capacitors and engine oils (commercially produced
up to 30 years ago);
Incineration of clinical, municipal and medical wastes;
Thermal processes such as copper ore roasting, aluminium
reclamation, magnesium production and Chlor-alkali that result in PCN
emissions; and
Sewage sludge application to land.
Landfills have been identified as being a potentially large source of PCNs due
to the historical use patterns; however actual data to support this are scarce.
Nonetheless, it is likely that, as the emissions from both PCN and PCB
manufactured products declines, the dominance of unintentional formation
and emission from these sources will also decrease.
3.3.4.3 Stockpiles, compliance activity and alternatives
As it is described above, PCNs had similar uses to that of PCBs i.e. used as
halowaxes and heat-transfer fluids and therefore is likely to have a similar
profile for use and stockpiles. Any stockpiles of PCN within di-electric
equipment will have been subject to the same regulations and controls as
PCBs. Notably Directive 96/59/EC on the disposal of di-electric equipment
that may contain PCBs, would have similar benefits for the safe disposal and
destruction of PCNs within these type of equipment.
3.4 Controls on unintentionally produced POPs
3.4.1 Current legislation on unintentionally produced POPs
The UK’s legislation on unintentionally produced POPs (dioxins and furans,
HCB, PCB, PCN and PCBz) is delivered through a combination of action at
the national, European Union and international level (see section 2) In the UK,
control measures via legislation and abatement technologies have led to a
significant reduction in dioxins and furans, PCBs and PCBz emissions. These
measures include a combination of pollution control equipment or substitute
44
process technologies. For major industrial sources these measures are listed
in this section of the NIP. Full details of existing Community legislation are
available in the Union Implementation Plan
http://ec.europa.eu/environment/chemicals/international_conventions/index_e
n.htm
A summary of the control measures applied in the UK including the application
of Best Available Techniques and Best Environmental Practices is provided at
Annex 3.
Details about the emission source categories (as required for reporting
purposes for the Stockholm Convention) to which these apply are given in
Annex 5.
3.4.2 Control on industrial processes
Unintentionally produced persistent organic pollutants, including dioxins,
furans and dioxin-like PCBs, are covered under several instruments in
Community legislation that have an impact, either directly or indirectly, on the
reduction of releases of these substances. The main release control
measures are set out in the Industrial Emissions Directive ((IED, 2010/75/EU).
The IED lays down the legal framework for the control of releases of dioxins
and furans and dioxin-like PCBs from industrial installations. Installations
covered by Annex I of the Directive must have an environmental permit in
order to operate. The requirements of IED, including specific standards on
emissions and stringent limits on certain pollutants to air, water and land;
waste minimisation and energy efficiency, are incorporated into an operator’s
permit. If an installation does not comply with these permit conditions, the
regulator will take enforcement action, requiring the operator of the installation
to make changes to meet the conditions as soon as possible. Should the
conditions continue not to be met, the permit could be withdrawn. Continuing
to operate without complying with the permit conditions, can lead to
prosecution.
The Directive also requires regular monitoring and periodic, risk-based
inspections. Operators either monitor their emissions all the time, i.e.
continuous monitoring, or periodically at times defined in their permit. In both
cases monitoring must meet the quality requirements set by the relevant
regulator.
In the UK, the enforcement authorities are the Environment Agencies and
local authorities. In England, the EA regulates industrial processes such as
municipal waste incinerators, cement works, chemical manufacturing plants,
oil refineries and steel works. Local authorities regulate some
combustion/incineration and metal processes and crematoria. The agencies

45
SEPA, NIEA and NRW (see section 2.3.2) of the devolved Administrations
regulate releases in their respective territories.
The implementation of Integrated pollution prevention and control (IPPC),
which required new and existing installations to meet the requirements of the
IPPC Directive by 30th October 1999, resulted in significant reductions in
dioxin and furan emissions, particularly from municipal solid waste (MSW)
incineration plants. Although reductions have been achieved for sinter plants,
there remain significant emissions from this sector owing more to large gas
volumes emitted than to high concentrations. Subsequently IPPC has been
superseded by the industrial emissions directive (IED), which sets further
restrictions and limits on emissions of dioxins and furans from regulated plant.
3.4.3 Other key legislation for dioxins, PCBs, HCB, and PCBz
The IED regulates most waste incineration facilities. Under this Directive,
sector-specific, technical documents (known as Best Available Technique
Reference documents - BREFs), apply mandatory emissions limits and
environmental standards which must be reflected in an operators permit within
4 years after they are adopted. For waste incineration facilities, these
requirements include a strict emission limit for dioxins and furans of 0.1
nanogramme I-TEQ per cubic metre of gaseous releases. A summary of how
TEQ measurements are derived and the equivalent measures for dioxins and
furans is attached in Annexes 4, 4A and 4B. The major reductions in dioxins
and furans emissions achieved by the previous waste incineration IPPC
Directive is expected to continue to be delivered by IED.
The European Pollutant Release and Transfer Register (E-PRTR), a
Community-wide inventory of the principal emissions and responsible
sources, was established by EU Regulation 166/2006. The register includes
unintentionally produced POPs.
3.4.4 Controls on open agricultural burning
Since May 2006 agricultural waste has been included in national waste
management controls. The unregulated open burning of agricultural waste has
been banned since May 2007, with the exception of the open burning of small
quantities of plant tissue which continues to be allowed under the
Environmental Permitting (England and Wales) Regulations 2010. These
regulations were updated in 2016 and cite the EA and NRW as the enforcing
authorities. Schedule 3 of these Regulations provides an exemption from the
need for an environmental permit, subject to certain conditions. However, it is
an offence for a farmer to dispose of agricultural waste in a manner likely to
cause pollution of the environment or harm to human health.

46
3.5 Marketing and use controls
Controls on the marketing and use of certain chemicals found to be
contaminated with dioxins and furans have been put in place. These include:
PCB-containing oils used as of heat transfer fluids in di-electric
equipment. This requires the registration of PCB containing equipment,
safe management of wastes and ultimately the phase-out of PCBs in
UK stocks. Where PCB fluids contain dioxins and furans as a
contaminant, there are would be synergistic benefits for the control of
dioxins and furans also;
Trichlorophenoxyacetic acid (2,4,5-T) was a herbicide for control of
weeds. In 1976, the Seveso accident in Italy witnessed a release of
2kg of dioxins and furans into the immediate surrounding environment
from a manufacturing plant producing 2,4,5-T. This culminated in the
‘Seveso Directive’ on mass hazards, which was transposed in the UK
into the Control of Major Accident Hazard Regulations 199926
(amended 2015, COMAH). The normal production and use of 2,4,5-T
can also contain low quantities of dioxins and furans as a contaminant.
As 2,4,5-T is no longer approved for use in the UK, tariff codes are
used to help identify imported goods that may contain 2,4,5-T; and
Pentachlorophenol (PCP) was manufactured as a wood preservative
for control of pests. The process meant that trace quantities of dioxins
and furans as a contaminant could be present. Additionally the
combustion of PCP treated wood particularly at low temperatures or in
poorly aerated conditions can generate dioxins and furans. The use of
PCP as a pesticide in the UK ceased in 1978, while the use of PCP as
an intermediate for the manufacture of PCP Laureate (used in
specialised textiles) continued until 2008. No further manufacture or
use of PCP in the UK occurred after this time. As PCP is now listed in
annex A of the Convention it is expected that this will have synergistic
benefits for the creation of dioxins and furans as a contaminant of
PCP.
3.6 Controls on diffuse sources
Industrial sources of POPs are now strictly regulated but some diffuse sources
of dioxin and furans, PCBs, HCB and PCBz releases continue to make a
significant contribution to emissions and will require further consideration.
There is legislation restricting the lighting of domestic garden waste bonfires
and open burning on domestic premises. Section 33 of the Environment
26
http://www.legislation.gov.uk/uksi/2015/483/pdfs/uksi_20150483_en.pdf

47
Protection Act 1990 states that a person who disposes of controlled waste in a
manner likely to cause environmental pollution or harm to human health
commits an offence.
3.7 Occupational exposure to dioxins, PCBs, HCB, and
PCBz
The Health and Safety Executive has responsibility for workplace health and
safety in the UK, and it is the legal duty of those who create risk through work
activities to understand those risks and ensure they are adequately controlled.
This includes ensuring that duty holders/employers identify and obtain
relevant information on the hazardous properties of the substance or materials
they use or manufacture.
Exposure to harmful substances including dioxins, PCBs, HCB and PCBz
arising from work activities is controlled under the Control of Substances
Hazardous to Health Regulations (COSHH) 2002
(http://www.hse.gov.uk/coshh/index.htm).
COSHH applies in the workplace when hazardous substances are used or
where processes are undertaken that generate hazardous substances.
COSHH requires the employer to carry out a risk assessment to establish
what, if any, hazards are associated with products/processes employees are
using/undertaking and then to put measures in place to control exposure to
that hazard.
Workplace Exposure Limits (WELs)
http://www.hse.gov.uk/pUbns/priced/eh40.pdf) set the concentration in air of a
substance that workers can be exposed to over a given time period. WELs
are set in order to help employers protect the health of their workers by
controlling the risk of exposure to harmful substances as part of a risk
management programme. The WEL can also be used as a tool to monitor the
efficacy of the control measures selected.
WELs are established under the legal framework COSHH, providing a point
of reference for employers to use as part of a risk management programme,
with the key purpose being to keep exposures at the WEL and ideally drive
them down below it.
Dioxins and Furans: There is no WEL for dioxins. Schedule 1 of COSHH lists
substances and processes defined as carcinogens and the 17 biologically
active dioxin congeners are listed. Therefore, under COSHH there is a
requirement for employers to reduce exposure to these compounds (dioxins)
to a level as low as is reasonably practicable.

48
The HSE has issued specific guidance on how to reduce exposure to dioxins in the aluminium recycling industry: (http://www.hse.gov.uk/pubns/indg377.pdf). Polychlorinated biphenyls (PCBs): There is a Workplace Exposure Limit
(WEL) of 0.1 mg/m3 for PCBs. In situations where exposure to PCBS may
arise, employers must ensure that any exposure of their employees is either
prevented or, where this is not reasonably practicable, adequately controlled.
Hexachlorobenzene (HCB): There is no occupational exposure limit for HCB.
HCB has a 'harmonised classification' in the EU as a Category 1B carcinogen.
This means that it is regarded as a potential human carcinogen and if it is
present in the workplace either intentionally or as a process by-product, the
employer has an obligation under the COSHH Regulations 2002 (as
amended) to assess the risk and reduce any exposure to as low as is
reasonably practicable.
Pentachlorobenzene (PCBz): There is no specific mention or reference to
PCBz in the COSHH Regulations or in EH40 which lists the UK’s WELs. If
PCBz was used in the workplace, a high level of control would be expected
under occupational health and safety legislation.”
3.8 Food legislation on dioxins and dioxin-like polychlorinated biphenyls
Regulation (EC) 1881/2006 on setting maximum levels for certain
contaminants in food as amended by Regulation (EC) 1259/2011 establishes
maximum acceptable levels for dioxins, furans, dioxin-like PCBs and non
dioxin-like PCBs in food. Limits are set in meat, liver (including fish liver), fish,
marine oils, milk and dairy products, hen eggs and egg products, animal fats,
vegetable oil and foods for infants and young children. The Commission’s
Recommendation 2013/711 establishes separate action levels for dioxins and
dioxin-like PCBs at which an investigation should be considered, if possible to
identify and eliminate any significant local sources.
3.9 Control of dioxins and polychlorinated biphenyls in animal feed
Measures to protect consumers from carry over from animal feed into meat,
milk and eggs and other foodstuff are in place through Directive 2002/32/EC.
Maximum permitted limits and action thresholds for dioxins, furans, dioxin-like
PCBs as well as non-dioxin-like PCBs have been set on for in animal feed.

49
Section 4
Assessment of the data on current releases of the POPs
The following considers current releases of the POPs to the environment, data
on emission trends in different environmental vectors (where available) and
uptake through the food chain. It also outlines measures that are in place to
control emissions of unintentionally produced POPs and to what extent these
have resulted in reducing emissions from regulated sources. More detailed
background about the existing POPs and those listed in 2013 and 2015 is
provided in the following Defra reports:
Review and update of the UK Source Inventories of Dioxins, Dioxin-
Like Polychlorinated Biphenyls and Hexachlorobenzene for Emissions
to Air, Water and Land (Report and Annex);
A further update of the UK source inventories for emissions to air, land
and water of dioxins, dioxin-like PCBs, PCBs and HCB, incorporating
multi-media emission inventories for nine new POPs under the
Stockholm Convention;
Cost Benefit analysis of the addition of Hexabromocyclododecane
(HBCDD) to the Stockholm Convention and the 1998 POPs Protocols;
and
A Further Update of the UK’s Persistent Organic Pollutants Multi-Media
Emissions Inventory – CB0489 – Annual Report 2016.
These reports are available at http://randd.defra.gov.uk/.
4.1 Monitoring of POPs
4.1.1 Toxic Organic Micro-Pollutants (TOMPS) monitoring network (air)
The Toxic Organic Micro-Pollutants (TOMPS) network measures ambient air
concentrations for a range of pollutants at rural and urban locations in the UK.
The network was set up in 1990 with current monitoring sites including two
urban and four rural locations; London, Manchester, High Muffles (North
Yorkshire), Hazelrigg (Lancashire), Weybourne (Norfolk) and Auchencorth
(Midlothian), respectively. The TOMPs network reports quarterly data for 37
PCB congeners, four co-planar PCB congeners, ten furans congeners
(PCDFs), seven dioxin congeners (PCDDs), and 22 PBDE congeners. The
network has provided over 25 years of data and as such comprises a

50
considerable and important dataset which can be used to provide estimates of
the change in atmospheric concentrations over time.
A summary of the data along with an interpretation of temporal and spatial
trends may be found in Graf et al (2016)27. The continuous monitoring of
these chemicals has demonstrated a constant decline in UK air
concentrations in most locations over the last two decades, with average
clearance rates28 for dioxins and furans in urban locations of 4.9 years and for
PCBs across all sites of 6 years. However, no significant decline in rural
locations for dioxins and furans has been observed. Data for Stockholm
Convention PBDE homolgues have shown a clear decline at the urban sites of
Manchester and London and at the semi-rural site of Hazelrigg with
atmospheric clearance rates of 3.4, 2.0 and 3.5 years, respectively. The paper
from Brown et al (2013)29 discusses twenty years of continuous monitoring of
PAHs in the UK from the TOMPs and PAH networks. The TOMPs data have
also shown a strong observable link between the declining ambient air
concentrations for dioxins and furans, PBDEs and PCBs with emission
reductions estimated in the annually produced National Atmospheric Emission
Inventory (NAEI) dataset.
4.1.2 Monitoring of POPs in food
The Food Standard Agency (FSA) does not have an ongoing programme for
monitoring POPs in food and animal feed. Resources are instead allocated on
a risk basis, in line with Regulation 882/2004 on official controls. The FSA
provides additional funding to local authorities for the testing of imported and
locally-produced food and feed, which may include testing for dioxins and
furans, PCBs and other Stockholm Convention POPs. The Agency also
carried out its own targeted surveys and investigations into the occurrence of
dioxins and furans, PCBs and other POPs in food and feed.
The Expert Committee on Pesticides Residues in Food (PRiF), as an expert
committee of Defra, has an ongoing programme of monitoring for pesticide
residues in food. This forms the UK’s contribution to the European
harmonised pesticide monitoring programme and undertakes testing of a
range of foods including milk, fruit, vegetables, animal and cereal products
27 Graf, C., Katsoyiannis, A., Jones, K.C. and Sweetman, A.J. (2016) The TOMPs Ambient Air monitoring Network -
continuous data on the UK air quality for 20 years. Environmental Pollution special issue - Ten Years of Global
Monitoring under the Stockholm Convention on Persistent Organic Pollutants (POPs): Trends, Sources and
Transport Modelling, 217, 42-51. 28
Clearance rates refers to the time taken for concentrations to reduce by 50%
29 Brown, A.S. Brown, R.J.C., Coleman, P.J. Conolly, C. Sweetman, A.J. Jones, K.C. Butterfield, D.M., Sarantaridis,
D., Donovan, B.J. and Roberts I. (2013) Twenty years of measurement of polycyclic aromatic hydrocarbons (PAHs)
in UK ambient air by nationwide air quality networks. Environ. Sci.: Processes Impacts, 15 (6), 1199 – 1215

51
and infant food. The programme publishes quarterly results which can be
found at:
http://www.pesticides.gov.uk/guidance/industries/pesticides/advisory-
groups/PRiF/PRiF_Results_and_Reports/index-to-results-by-food-pesticide-
residues.htm
4.1.2.1 Polybrominated diphenyl ethers (PBDEs)
The FSA has been investigating levels of PBDEs in food since 2003. Further
to the work reported in the 2007 National Implementation Plan (NIP), which
included trout and eels, farmed and wild fish and shellfish and a Total Diet
Study (TDS), FSA has continued to investigate levels in other foods, as well
as feed. Results have been supplied to the European Food Safety Authority
(EFSA) within the scope of their continuous call for data, which includes
Commission Recommendation 2014/11830 on the monitoring of BFRs in food.
4.1.2.2 Perfluorooctane sulfonate (PFOS)
The FSA has included perfluorinated compounds (PFCs) in several
investigations since 2007. Conclusions based on previous EFSA opinions
were that dietary exposure to PFCs was not a health concern but a further
EFSA opinion is expected in 2017, which may lead to a reassessment.
4.1.2.3 FSA work on POPs recently listed under the Stockholm Convention
Chemicals that meet the criteria for POPs and which are therefore considered
as candidate compounds for listing under the Stockholm Convention are also
likely to bioaccumulate in the food chain and were consequently identified as
emerging risks by FSA. An initial investigation has recently been completed
into levels of pentachlorobenzene (PCBz), hexachlorobutadiene (HCBD) and
pentachlorophenol (PCP) in food and Total Diet Study (TDS) samples,
following development and validation of the necessary analytical methods. As
hexachlorobenzene (HCB) is easily measured with PCBz, this was also
included. The data is still being reviewed but levels are generally low and no
immediate human health concerns are apparent.
The FSA has previously attempted to investigate levels of short-, medium-
and long-chain chlorinated paraffins (S/M/LCCPs) in food but the analytical
methodology is complex and a fresh study has been ruled out until the
European Reference Laboratory for Dioxins fulfils a request to develop a
suitable method.
30
http://eur-lex.europa.eu/legal-content/EN/TXT/PDF/?uri=CELEX:32014H0118&qid=1475762535515&from=EN

52
Dioxin-like compounds
The FSA has been investigating brominated dioxins, furans and biphenyls
(PBDD/F/PBBs) since 2004. The formation of PBDD/Fs is thought to be
associated with the widespread use of brominated flame retardants (BFRs).
The World Health Organisation (WHO) has concluded that the Toxic
Equivalency Factor (TEF) used for the chlorinated congeners can be applied
to their brominated analogues. More recently, the FSA has explored mixed
halogenated (chlorinated and brominated) dioxins, furans and biphenyls
(PXDD/Fs, PXBs). This work was prompted by an increasing number of
reports of dioxin-like activity in environmental samples, in particular those
collected near electronic waste handling sites, which could not be attributed to
either pure chlorinated or brominated congeners.
Mixed halogenated dioxins and furans (PXDD/Fs) are thought to be formed
during combustion when both chlorine and bromine are present, a
circumstance that has become increasingly common with the widespread use
of brominated flame retardents (BFRs). The mixed halogenated congeners
are of potential importance as there have been some reports that they exhibit
higher potency than the most toxic congener 2, 3, 7, 8-tetrachlorodibenzo-p-
dioxin (TCDD). Owing to the much larger number of possible congeners and
the limited availability of suitable reference standards, the work is very
challenging. However, it has been shown that PXDD/Fs and PXBs are
detectable in a wide range of foods. Most notably, a mono-brominated
congener of PCB 126 was almost ubiquitous and the di- and even tri-bromo
congeners were also regularly found. Following an initial investigation of a
range of food samples, mixed halogenated dioxins and biphenyls have been
measured in a recent TDS31 and in a range of fish samples analysed to
provide baseline data for Descriptor 9 within the scope of the Marine Strategy
Framework Directive.
4.1.3 Monitoring of POPs in the marine environment
The Centre for Environment, Fisheries and Aquaculture Science (Cefas)
undertake monitoring for some POPs in the marine environment. A range of
organic contaminants has been determined in marine mammal tissues
alongside the Cetacean Strandings Investigation Programme (CSIP)32, funded
by Defra. These have included PCBs, a range of organochlorine pesticides
(such as DDT and its breakdown products, hexachlorocyclohexanes,
hexachlorobenzene and dieldrin), polycyclic aromatic hydrocarbons, tributyltin
31
http://tna.europarchive.org/20141103165934/http://www.foodbase.org.uk//admintools/reportdocuments/656-1-1109_C01050.pdf 32
http://ukstrandings.org/

53
compounds, the flame retardants PBDEs (homologues identified under the
Stockholm Convention) and HBCDD, and the perfluorinated compounds
(PFCs) PFOS and PFOA. Within the UK’s Clean Seas Environment
Monitoring Programme (CSEMP)33, Cefas also undertakes contaminant
(PCBs, PBDEs, PAHs analyses) in surface sediments and biota from offshore
regions around England and Wales. Cefas have performed several one-off
studies on dioxins both under CSIP and CSEMP (completing 2017) and a
one-off survey for PFCs under CSEMP. The UK’s Marine Management
Organisation (MMO) in collaboration with Cefas are involved in dredging
operations in ports, harbours and estuaries and for licencing the disposal at
sea of dredge material as well as monitoring disposal sites which entails POP
substances.
4.1.4 Monitoring of POPs in the freshwater environment
As outlined in section 2.2.2 The Environmental Quality Standards (daughter)
Directive (EQSD; 2008/105/EC) established standards (concentrations in
surface waters) for priority, and priority hazardous substances, and other
pollutants to be met by Member States (MS). This was amended in 2013 and
an additional 12 substances were added to the list of substances (Priority
Substances Directive; 2013/39/EU). Under the later directive, MS are
required to report on levels substances including some POPs. These were
endrin, hexachlorobenzene (HCB), dioxins, furans and dioxin-like
polychlorinated biphenyls), DDT, the polybrominated diphenyl ethers (PBDEs)
homologues identified under the Stockholm Convention,
hexabromocyclododecanes (HBCDD), perfluorooctanesulfonic acid (PFOS),
hexachlorocyclohexanes (HCHs), and pentachlorobenzene (PCBz). To
achieve Water Framework Directive (WFD) objectives, MS are obliged to
reduce or eliminate discharges, and emissions and losses to surface waters of
those substances which behave like ubiquitous persistent, bioaccumulative
and toxic substances some of which include POPs.
To further our understanding of harmful chemicals in the UK’s surface waters
and how they enter such, and to compliment the UK’s WFD monitoring
commitments, the UK’s Water Industry Research (UKWIR) commissioned the
Chemicals Investigation Programme (CIP)34, to investigate the management
and control of some of the priority and priority hazardous substances listed in
the WFD daughter Directives along with other targeted chemicals. Phase 1 of
CIP (CIP1; 2010-2013) investigated the occurrence, sources and removal of
trace substances in over 180 wastewater treatment works (WWTW) effluents.
This established a definitive basis for the overall national assessment of the
33
https://www.bodc.ac.uk/projects/data_management/uk/merman/assessments_and_data_access/
34 https://www.ukwir.org/site/web/news/news-items/ukwir-chemicals-investigation-programme

54
risk posed by harmful substances found in WWTW discharges. The CIP1
made it possible to identify substances that require further attention or
investigation, to rule out others of little concern and to delineate the scale of
likely improvements in effluent quality required to meet the objectives of the
programmes of measures required under WFD. Associated research has
provided estimates of the likely overall cost of such measures and identified
several treatment options that might be employed, as well as defining the
uncertainties that still need to be addressed. In the second phase (CIP2;
2015-2020), 600 WWTWs have been identified to undergo a programme of
effluent screening and upstream and downstream river sampling for prioritised
substances. The POPs included in this work are PBDE homologues covered
by the Stockholm Convention, PFOS and HBCDD.
4.2 UK source inventories of POPs
Parties to the Stockholm Convention are required to evaluate current releases
and develop and maintain source inventories and release estimates for
substances listed under Annex C (unintentional releases arising from
anthropogenic sources) of the Convention. Evaluation of the inventories
enables the assessment of progress made towards the goal of continuing
minimisation and to identify where further control measures are required.
The UK has established a range of inventories to monitor emissions including:
(i) the National Atmospheric Emissions Inventory (NAEI) which provides a
standard reference inventory for data on a wide range of POPs and other
pollutants to air; (ii) pollution inventories of releases to air, water and land for
large industrial processes which are regulated under the EU Industrial
Emissions Directive (IED); (iii) the POPs multi-vector emission inventories
covering those substances listed in Annex C of the Stockholm Convention to
five vectors (air, land, water, residue, and product)35 and are compiled
annually. Additionally, under the requirements of the Environmental Quality
Standards Directive, the UK has developed inventories of releases and losses
to water, which are reported within river basin management plans and are
updated on a four yearly basis.
The data provided by the UK pollution inventories is consolidated with data
from other sources in the UK’s Pollutant Release and Transfer Register
(PRTR). The PRTR enables the UK to meet the obligations of the United
Nations Economic Commission for Europe (UNECE) Aarhus Convention on
35
Under the Stockholm Convention five emission vectors are defined, which include air, land, water, residue, and product. For clarity -The uncontrolled release of material to land (e.g. accidental building fires) is accredited as a ‘land’ vector release. The controlled placing of material to land (e.g. landfill) is accredited as a ‘residue’ vector release. The product vector denotes POPs placed to market within articles. For Annex A substances which are banned, the deliberate placing on the market without exemption would be illegal. However recycling of materials contaminated with POPs, particularly trace contamination would be a ‘product’ vector release.

55
public access to information and participation in decision-making and can be
found at http://www.unece.org/env/pp/introduction.html .
Action undertaken as part of the UK’s 2007 Dioxin Action Plan led to the
development of multi-vector inventories for emissions to air, water, land,
residue and product vectors for the unintentionally produced POPs dioxins
and furans, HCB, PCBz and PCBs. The emission estimates to water, land,
residue and product were not available for these substances in 2007.
Estimates provided in the multi-vector inventories have been revised to reflect
improved quality of POPs source data gained through further work undertaken
to establish a better understanding of emission factors for these POPs. The
time trend estimates of emissions to air provided in the 2007 NIP were based
on the best available data at the time and have been superseded by those
estimated for the air-vector in the more recent multi-vector inventories. This
reflects the change in methodology used to calculate the estimates based on
improved knowledge about emission sources and factors.
As a result of actions identified in the 2007 Dioxin Action Plan, an annual
estimate of the release of dioxins and furans to air, water, land, residue and
product has been undertaken. These estimates have been developed through
standard emission inventory processes following the guidance set out within
the European Monitoring and Evaluation Programme (EMEP) guidebook for
the UNECE Convention on long range transboundary air pollution (CLRTAP).
The UK also made use of the UNEP standardised toolkit for dioxins and
furans where UK-centric data have not been available. The emission
estimates have also drawn upon data reported by operators into the UK’s
Pollutant Release and Transfer Register (PRTR, http://prtr.defra.gov.uk/),
noting that the PRTR is designed to cover a named set of economic activities
which are largely dominated by industrial point sources.
In 2014 emissions to air within the UK’s PRTR were estimated to be 30 g I-
TEQ to air and 10 g I-TEQ to water. The 2014 PRTR notes that emission
estimates for releases to soil were not reported by operators. However, it is
important to note that the PRTR covers only industrial point sources and that
the deliberate release of such materials to soil in the UK is illegal. Releases to
air, water and soil will also include diffuse sources not covered by the UK
PRTR. Where environmental regulation of industry has reduced emissions
since 1990, the importance of diffuse emissions to total releases has
proportionately increased; this includes sources such as backyard burning of
waste, accidental building and vehicle fires, and the disposal of sewage
sludge which can be consigned to agricultural land. The Food Standards
Agency is investigating the risks to the food chain that might result from the
application of certain end of waste streams, such as paper sludge and poultry
litter ash, used wood, mechanically biologically treated (MBT) sludge and
compost-like output (CLO), for agricultural uses including soil improvers,

56
fertilisers and animal bedding. All of these materials may contain dioxins and
PCBs, among other environmental contaminants.
The time trend data for atmospheric emissions of dioxins and furans within the
POPs multi-vector emission inventory shows that since 2007, there has been
a ‘plateau effect’, with minor increases and decreases of dioxins and furans
emissions from year to year. This ranges from 217 g I-TEQ to 224 g I-TEQ for
the years 2007 – 2014. Further work has been undertaken since 2007 to
reduce the uncertainty within the estimates for the dioxin and furan emission
inventory. This has included work on hazardous and clinical waste
incineration, non-ferrous metal production, sewage sludge and backyard
burning (national waste burning habits survey).
As illustrated the increased control of emissions of combustion by-products
such as dioxins and furans from industry has seen marked improvements in
emission reduction of dioxins and furans from industry point sources. However
and proportionately, the importance of diffuse sources to total releases has
increased since 1990. It is thought to be difficult to quantify and apply further
controls to these sources without significant effort and cost, specifically
because of their diffuse nature, e.g. frequency and nature of bonfires in
domestic premises annually across the whole of the United Kingdom. Total
atmospheric emissions of dioxins and furans have fallen by 85% since 1990,
where the 1990 release estimate was 1,304 g I-TEQ and the 2014 estimate is
217 g I-TEQ.
The UK will continue to use a combination of the UK emission inventories and
the TOMPs monitoring network to provide evidence of the dioxin and furan
releases and ambient concentrations, with continued efforts to continue to
decrease emissions where applicable. However, it has also been shown that
dioxins and furans can enter the human food chain via the use of
contaminated feed or accidental contamination, and thus the monitoring of
animal feed will also continue to ensure protection of UK consumers.
The UK is developing a set of regularly updated emission inventories to satisfy
the requirements of Directive 2008/105/EC on environmental quality
standards in the field of water policy. The inventories will include priority and
priority hazardous substances, updated in accordance with -yearly reviews.
4.2.1 UK POPs emission inventory infrastructure
An overview of the scope of POPs information that is available from the UK
data reporting mechanisms, including data for the new POPs is presented in
Table 3.

57
Table 3 – Summary of UK POPs emission inventory infrastructure36
Table 3 Summary of UK POPs emission inventory infrastructure
Substance NAEI IED/EPR Pollution
Inventories UK PRTR
Chlordecone
Dioxins and furans
Hexabromobiphenyl (HBB)
Hexachlorobenzene (HCB)
α- and β- Hexachlorocyclohexane (HCH)
Lindane
Polycyclic Aromatic Hydrocarbons (PAHs)
Polybrominated diphenylethers (PBDEs)
Polychlorinated biphenyls (PCBs)
Pentachlorobenzene (PCBz)
Perfluoro octane sulfonates (PFOS)
Hexabromocyclododecane
Hexachlorobutadiene
Pentachlorophenol
Polychlorinated Naphthalenes
MEDIA
Air
Land
Water
Waste transfer
SOURCE TYPES
Point source
Diffuse Source
Key NAEI - National Atmospheric Emissions Inventory –from 1990 IED/EPR Pollution Inventories – EU Industrial Emissions Directive/Environmental Permitting Regulations Pollution Inventories –from 1995 UK PRTR – United Kingdom Pollutant Release and Transfer Register from 2007
No data in inventory
Limited data in inventory
Data in inventory
36
Not all Stockholm POPs are on this table. Reporting obligations are that only emissions above the threshold value are required to be reported.

58
4.3 Current releases of dioxins and furans, PCBs, HCB and PCBz in UK
The POPs multi-vector inventories provide estimates of emissions to air, land
and water spanning the years from 1990 – 2014. The inventories show that
emission rates of dioxins and furans, PCBs and HCB in the UK have declined
over this period. However for PCBz, the emissions have slightly increased and
these are due to a small increase in combustion from municipal waste and
industrial sources and diffuse sources emissions. Table 4 below gives The
percentage change in emissions from 1990 for the years 2010 and 2014 are
presented in Table 4.
Table 4 Emission reductions in dioxins and furans, PCBs, HCB,
and PCBz for the UK between 1990 and 2014
% Reduction from 1990 for 2010 and 2014
All vectors Air
2010 2014 2010 2014
Dioxins and
furans
68 70 82 83
PCBs 94 96 88 89
HCB 99 99 99 99
PCBz 89 88 91 89
4.3.1. Dioxins and Furans
Inventories of dioxins are reported as a total of dioxins and furans as a measure of toxic equivalency factors (TEQ). A summary of how TEQ measurements are derived and the equivalent measures for dioxins and furans are attached at Annexes 4, 4A and 4B. There are two systems in current use for presenting toxic equivalency factors for dioxins; the International TEQ (I-TEQ) and the more recent World Health Organisation the TEQ (WHO TEQ).
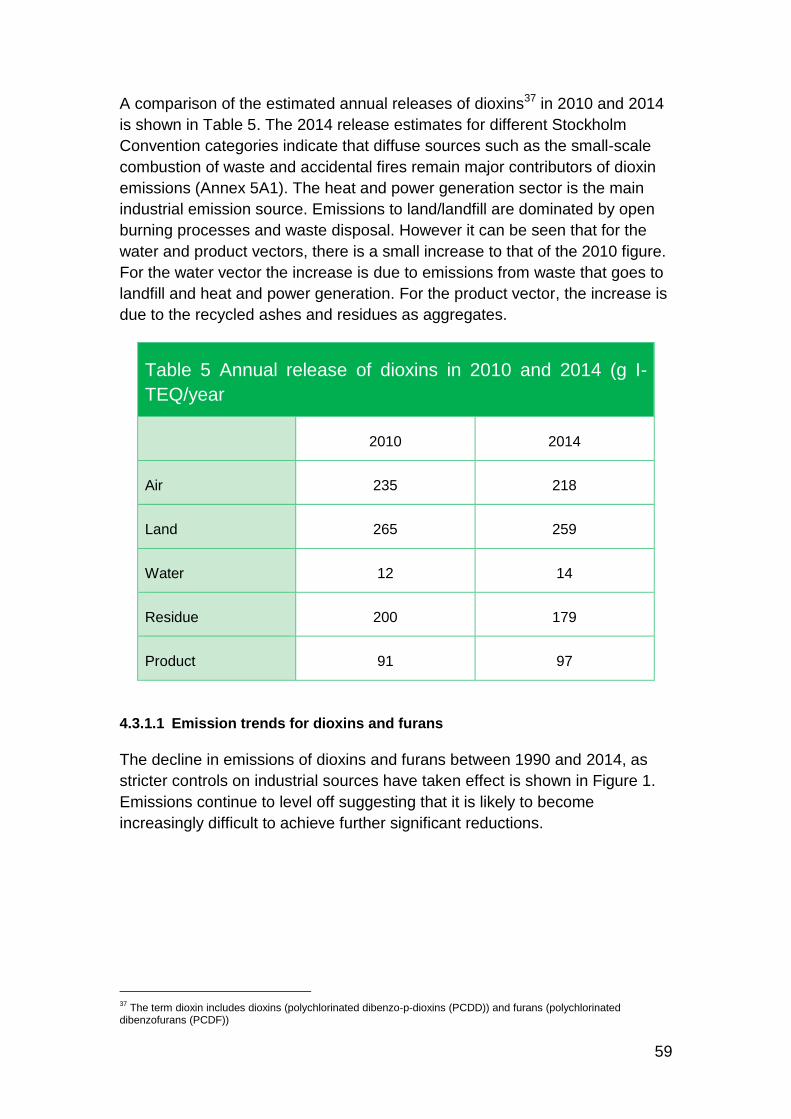
59
A comparison of the estimated annual releases of dioxins37 in 2010 and 2014
is shown in Table 5. The 2014 release estimates for different Stockholm
Convention categories indicate that diffuse sources such as the small-scale
combustion of waste and accidental fires remain major contributors of dioxin
emissions (Annex 5A1). The heat and power generation sector is the main
industrial emission source. Emissions to land/landfill are dominated by open
burning processes and waste disposal. However it can be seen that for the
water and product vectors, there is a small increase to that of the 2010 figure.
For the water vector the increase is due to emissions from waste that goes to
landfill and heat and power generation. For the product vector, the increase is
due to the recycled ashes and residues as aggregates.
Table 5 Annual release of dioxins in 2010 and 2014 (g I-
TEQ/year
2010 2014
Air 235 218
Land 265 259
Water 12 14
Residue 200 179
Product 91 97
4.3.1.1 Emission trends for dioxins and furans
The decline in emissions of dioxins and furans between 1990 and 2014, as
stricter controls on industrial sources have taken effect is shown in Figure 1.
Emissions continue to level off suggesting that it is likely to become
increasingly difficult to achieve further significant reductions.
37
The term dioxin includes dioxins (polychlorinated dibenzo-p-dioxins (PCDD)) and furans (polychlorinated dibenzofurans (PCDF))

60
Figure 1: Dioxin and furan emissions for the UK 1990 - 2014
0
200
400
600
800
1000
1200
1400
19
90
19
91
19
92
19
93
19
94
19
95
19
96
19
97
19
98
19
99
20
00
20
01
20
02
20
03
20
04
20
05
20
06
20
07
20
08
20
09
20
10
20
11
20
12
20
13
20
14
Emis
sio
n a
s g
I-TE
Q
Year
UK Dioxins and Furans emissions
Air
Land
Water
Residue
Product
4.3.2 Polychlorinated biphenyls (PCBs)
These are a family of chemicals made up of many individual congeners which
can exhibit different physical, chemical properties as well as toxicities.
Releases of PCBs into the environment will contain complex mixtures of these
congeners which would require full analyses to better understand the ratios of
the different congeners. This information is limiting and can be difficult to
derive at the individual congener level. Internationally, the practice is to quote
emissions as total PCBs based on a common number of congeners, with the
potential for including the ‘dioxin-like PCB’ fraction as a sub-total where
possible. The inventory reports estimates of the total weight of PCBs
released.
The 2007 NIP reported that releases of PCBs to air were estimated to be
1330 kg in 2004. Owing to recent improvements in the estimation methods,
this figure has now been revised to 1196 kg for 2004.
Annual air releases of PCBs in 2014 were estimated to be 733 kg/year, which
represents a 463 kg (39%) reduction on the revised 2004 estimates. Although
PCBs have not been manufactured and used in the UK for many decades, old
PCB-containing equipment continues to exist and may still account for the
majority of all air emissions in 2014 at 52% (see Table 6). However
comparison with the 2010 emission figure (56%) indicates that the emissions
are decreasing steadily.

61
Table 6 Key Sources of PCB emissions to air in 2010 and 2014
Source of PCB
emissions
2010 2014
Release of
PCB to air
(kg/year)
% of total
PCB
emissions
to air
Release
of PCB
to air
(kg/year)
% of total
PCB
emissions
to air
Di-electric equipment 473 56 380 52
Electric Arc Furnaces 113 13 93 13
Backyard burning 82 10 82 11
Accidental fires
vehicles and buildings
24 3 24 3
Power station
combustion of coal
34 4 32 4
Basic Oxygen
Furnaces (Iron
production)
13 2 18 3
Iron and steel sintering 17 2 23 3
Other sources 64 8 60 8
In 2014, PCB releases to land, including waste to landfill were estimated to be
1293 kg/year. Compared to data modelled over the last twenty years this
represents a highly significant reduction since 1990 (Figure 2). The figure also
demonstrates that levels of PCB releases to both air and land significantly
reduced following an awareness campaign in 2000 that resulted in the
identification, removal and destruction of large PCB containing equipment
from the environment.
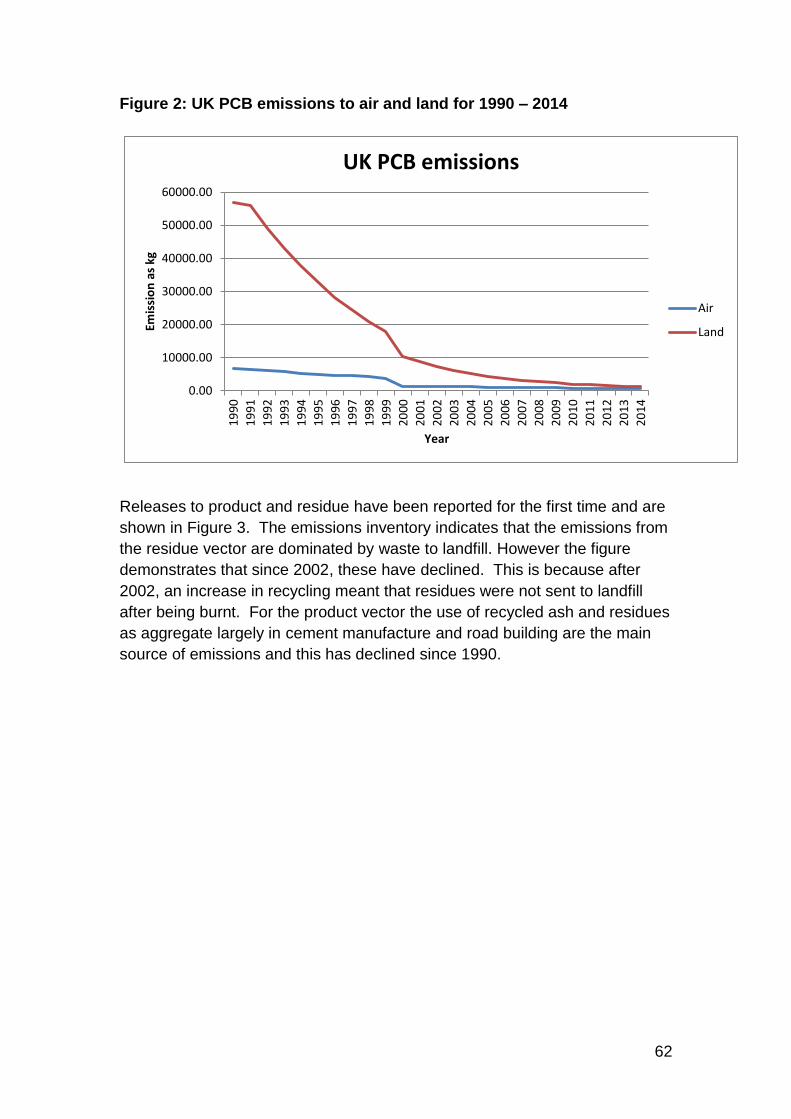
62
Figure 2: UK PCB emissions to air and land for 1990 – 2014
0.00
10000.00
20000.00
30000.00
40000.00
50000.00
60000.00
19
90
19
91
19
92
19
93
19
94
19
95
19
96
19
97
19
98
19
99
20
00
20
01
20
02
20
03
20
04
20
05
20
06
20
07
20
08
20
09
20
10
20
11
20
12
20
13
20
14
Emis
sio
n a
s kg
Year
UK PCB emissions
Air
Land
Releases to product and residue have been reported for the first time and are
shown in Figure 3. The emissions inventory indicates that the emissions from
the residue vector are dominated by waste to landfill. However the figure
demonstrates that since 2002, these have declined. This is because after
2002, an increase in recycling meant that residues were not sent to landfill
after being burnt. For the product vector the use of recycled ash and residues
as aggregate largely in cement manufacture and road building are the main
source of emissions and this has declined since 1990.

63
Figure 3: UK PCB emissions to water, residue and product for 1990 –
2014
0.00
200.00
400.00
600.00
800.00
1000.00
1200.00
1400.00
1600.001
99
0
19
91
19
92
19
93
19
94
19
95
19
96
19
97
19
98
19
99
20
00
20
01
20
02
20
03
20
04
20
05
20
06
20
07
20
08
20
09
20
10
20
11
20
12
20
13
20
14
Emis
sio
n a
s kg
Year
UK PCB emissions
Water
Residue
Product
4.3.3 Hexachlorobenzene (HCB)
The annual releases for HCB in 2014 indicate a continuing decline in
emissions to air and land since 1990 with negligible releases to water over the
last twenty years (Table 7).
Table 7 UK HCB emissions (kg) for 1990, 2010 and 2014
Emissions to: 1990 2010 2014
Air 3753 33 22
Land* 48 9 4
Water 3 2 2
*Land emissions are associated with agricultural pesticide use only.
Since the ban on the use of hexachloroethane (HCE) in secondary aluminium
manufacture (2003), the dominant source of emissions of HCB to the
environment in the UK has been through the use of pesticides.
The previous emission estimates quoted in the UK’s 2007 NIP were based on
UK agricultural statistics and literature emission factors assuming 100%
release to air at the maximum allowable concentrations under UK and

64
European law. As part of the POPs multi-media inventory development carried
out in 2009 the model for emissions was revised based on Fong (2008)38 to
account for spray drift. This apportioned the pesticide used based on air, land
and water compartments more accurately. The further update of the UK POPs
inventories carried out in 2010 included a sampling and analysis regime for
chlorothalonil, the main pesticide related to HCB emissions. This work was
used to review the emission factor used for HCB emission from chlorothalonil
to provide the best 'working concentration' estimates. The previous estimates
were based on work by Bailey (2001)39, which was based on the 40 ppm
regulatory threshold. The 2010 sampling and analysis programme took 30
samples (23 from chlorothalonil products and 7 from a related product as
exploratory work) at point of usage and analysed for both chlorothalonil and
HCB. Based on market share, this gives a new weighted average of 8 ppm.
The estimates assume that the 1998 (and before) factors are correct and
extrapolated between 1998 - 2009. Assuming that 1998 will be 40 ppm and
2009 will be 8 ppm.
4.3.4 Pentachlorobenzene
Pentachlorobenzene (PCBz) is a pollutant included within the substance data-
set for PRTR40 reporting, with all emissions above 1 kg per annum to air, land
and water required to be reported. To date there has only been one reported
occurrence of emissions above the reporting threshold. This was an emission
to air in 2009 of 1 kg from the oil refinery sector.
Based on the POPs multi-vector emission inventory, estimated PCBz
emissions to air have declined significantly, with emissions in 2014 only 11%
of the 1990 estimate total emission to air (301 kg). This has been due to
legislative control measures on industrial sources and the development of
effective abatement technologies. The comparatively low 2014 PCBz
emission estimates to air (33 kg) are now dominated by a handful of sources,
notably iron and steel manufacture (36%), industrial combustion of coal for
heat and power generation (15%) and energy from waste plants (13%). Within
the domestic sector, the combustion of wood and coal within residential
premises also accounts for 12% of total air emissions (Figure 4).
Estimated PCBz releases to air form the dominant vector for 2014 (33 kg) with
other vectors having smaller quantities of estimated releases. Land is the
sector most important vector (9 kg) with leaks from di-electric equipment being
38
Yongfu Xu (2008) ‘Review and update of the HCB inventory emissions to air, land and water, paper published by AEA.
39 Bailey RE (2001) Global HCB emission, published in Chemosphere 43, pp 167 – 182
40 The UK PRTR will include all emissions of POPs from industrial sources at IPPc part A2 and greater, provided
they exceed a pre-set annual emission threshold

65
the key source, the ‘residue’ vector had estimated releases to controlled
landfill of 5 kg in 2014, while estimated releases to water and recycled into
products were 3 kg and 1 kg respectively.
Figure 4: UK Pentachlorobenzene emissions to air 2014 (33 kg total
emission).
4.4 Current emissions of selected POPs
In addition to the POPs discussed above, there are two additional POPs
where emissions are being monitored in the UK because of significant legacy
uses.
4.4.1 Perfluorooctane sulfonic acid (PFOS) emissions
The UK environmental releases of PFOS in 2014 were estimated to be around
0 kg to air, 2 kg to land and 150 kg to water. The emission estimates of PFOS
to surface waters via discharge from waste water treatment works (WWTWs)
and to agricultural soils via the use of sewage sludge as a fertiliser were
refined from 2012 estimates using additional field measurement data. The
PFOS concentrations provided by sampling campaigns carried out in 2013/14
were combined with mass flow data from two WWTPs to provide chemical
mass flows for PFOS. The PFOS was detected in all wastewater samples
collected with influent concentrations ranging from 6.4 to 25 ng/L (mean 15.2
ng/L) and effluent concentrations ranging from 1.9 to 58 ng/L (mean 22.3

66
ng/L). Using a mass balance approach, the calculated per person emission
rates from WWTPs to surface waters ranged from 5 to 10 µg/person/day. For
the UK, assuming a population of 62 million with a 95% WWTP connection
rate, this provides an estimate of the PFOS emissions to water of 150 kg per
year.
The emission factors for PFOS to soil via the application of sewage sludge
using data collected for the 2012 emission estimates ranged from 32 to 64
µg/person/year. These data when scaled up to the UK provided an emission
of approximately 2 to 4 kg per year to sludge. As approximately 60% of
sewage sludge produced in the UK is used as an agricultural fertiliser,
between 1 to 2 kg was estimated to be emitted to soil per year. More recent
data from the sampling campaign in 2013/14 provided an upper estimate of 18
kg per year to soil receiving sewage sludge, although PFOS concentrations in
sludge collected from one WWTP were below reporting limits and so emission
to soil from this sludge would be considerably lower. As a result the emission
estimates for 2014 to soil remained at 2kg per annum.
4.4.2 Polybrominated diphenylethers (PBDEs)
The TOMPs network provides a sample archive that can be retrospectively
analysed to determine concentrations of additional POP chemicals of interest.
This archive was used to assess PBDEs in the UK atmosphere which showed
consistent decreases in concentrations over recent years with the observed
decline starting during the period 2001-2003 (Birgul et al. 2012)41. This is
illustrated in Figure 5 for the sum of 9 PBDE congeners using average data
for four sites, which included London, Manchester, Hazelrigg and High
Muffles. The figure also shows a comparison with an updated UK atmospheric
emission data based on the method developed by Prevedouros et al. (2004)42
and recent data from the TOMPs network.
The emission estimates are based on a dynamic model of historical estimates
of PBDE manufacture, incorporation into products (e.g. polyurethane foams)
and subsequent emission from each product type using specific emission
factors over their respective life cycles. The strong correlation between the
estimated emissions and the measured concentrations from the TOMPs
network and this suggests that on-going releases from articles containing the
penta-BDE commercial mixture continue to control the long-term trends in the
UK atmosphere.
41
Birgul, A., Katsoyiannis, A., Gioia, R., Crosse, J., Earnshaw, E., Ratola, N., Jones, K.C., and Sweetman, A.J. (2012) Polybrominated diphenyl ethers (PBDEs) in the United Kingdom atmosphere. Environmental Pollution, 169, 105-111
42 Prevedouros, K., Jones, K.C., and Sweetman, A.J. (2004) Production, Consumption and Emission Estimates for
Pentabrominated Diphenyl Ether (PeBDE) in Europe (1970 to 2000). Environmental Science and Technology, 38(12), 3224-3231.

67
Figure 5: Comparison of estimated annual emissions of PBDE in the UK
to the average annual concentrations of ΣPBDEs provided by the TOMPs
network using archived samples (red markers) and current network data
(blue markers).
4.5 Overview of the emission data for the new POPs
All of the four new POPs added to the Stockholm Convention in 2013 and
2015 have restrictions under relevant EU regulations and therefore either
banned in the UK and/or had their use restricted. In addition PCNs and
HCBD is also listed in the UNECE’s convention on long range
transboundary air pollution (CLR-TAP).
4.5.1 Annex A substances, pesticides (Pentachlorophenol (PCP))
The UK has reviewed its emissions inventory for PCP and expanded it to
include all five emission vectors. The PCP emissions to air are the dominant
vector with 99% of all releases to this vector (Table 8). This largely arises from
legacy treated timber stockpiles which can emit during the course of their
service life. For land there are only two sources of emissions. During the
active treatment of timber it is assumed 750 kg per annum was lost to soil per
year from spillages. Then after active treatment ceased in 1998, these
emissions will have fallen to zero. The other major source comes from
application of sewage sludge to land. The assumed emission factor in this
case is expected to decline significantly after 1998 when treating timber with
PCP ceased.
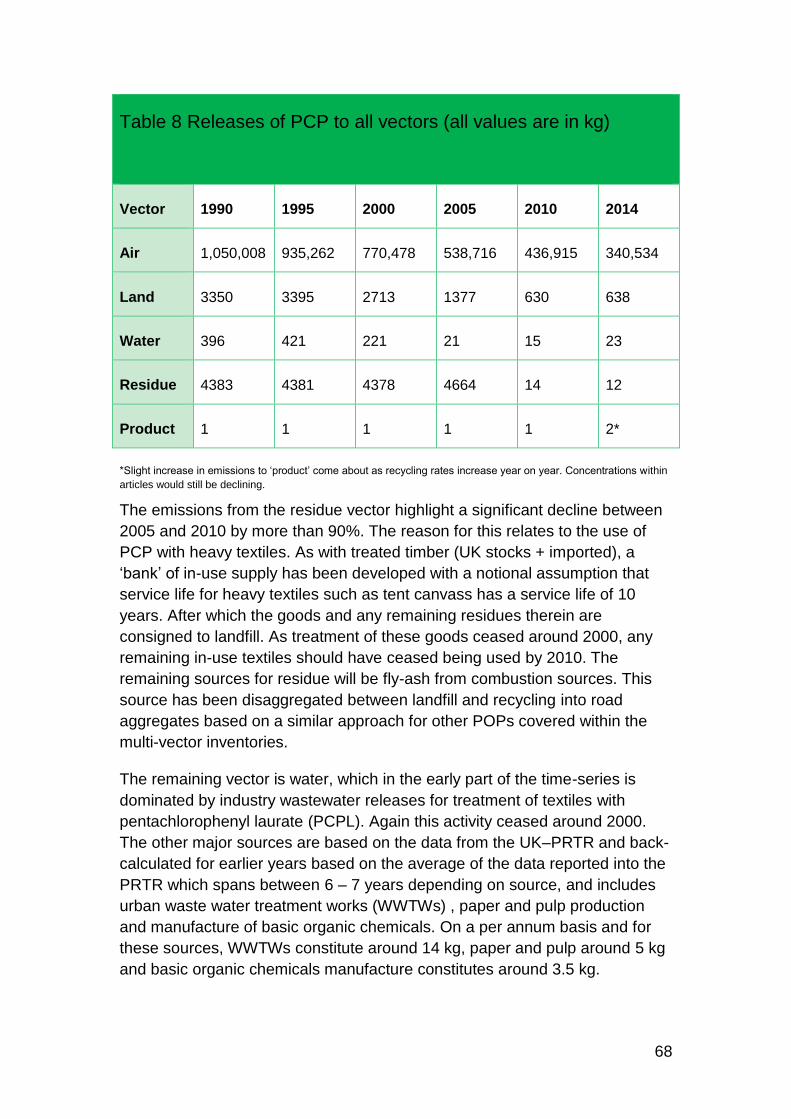
68
Table 8 Releases of PCP to all vectors (all values are in kg)
Vector 1990 1995 2000 2005 2010 2014
Air 1,050,008 935,262 770,478 538,716 436,915 340,534
Land 3350 3395 2713 1377 630 638
Water 396 421 221 21 15 23
Residue 4383 4381 4378 4664 14 12
Product 1 1 1 1 1 2*
*Slight increase in emissions to ‘product’ come about as recycling rates increase year on year. Concentrations within
articles would still be declining.
The emissions from the residue vector highlight a significant decline between
2005 and 2010 by more than 90%. The reason for this relates to the use of
PCP with heavy textiles. As with treated timber (UK stocks + imported), a
‘bank’ of in-use supply has been developed with a notional assumption that
service life for heavy textiles such as tent canvass has a service life of 10
years. After which the goods and any remaining residues therein are
consigned to landfill. As treatment of these goods ceased around 2000, any
remaining in-use textiles should have ceased being used by 2010. The
remaining sources for residue will be fly-ash from combustion sources. This
source has been disaggregated between landfill and recycling into road
aggregates based on a similar approach for other POPs covered within the
multi-vector inventories.
The remaining vector is water, which in the early part of the time-series is
dominated by industry wastewater releases for treatment of textiles with
pentachlorophenyl laurate (PCPL). Again this activity ceased around 2000.
The other major sources are based on the data from the UK–PRTR and back-
calculated for earlier years based on the average of the data reported into the
PRTR which spans between 6 – 7 years depending on source, and includes
urban waste water treatment works (WWTWs) , paper and pulp production
and manufacture of basic organic chemicals. On a per annum basis and for
these sources, WWTWs constitute around 14 kg, paper and pulp around 5 kg
and basic organic chemicals manufacture constitutes around 3.5 kg.

69
Since the use of PCP for timber and textile treatment ceased in the UK for
over a decade now, there is no ongoing active use of PCP, Sodium
pentachlorophenate (NaPCP) or PCPL in the UK for commercial purposes.
However the widespread use of PCP and long-lasting service life of treated
timber represents a significant legacy issue. This aspect has proved difficult to
quantify as no data are available on the quantities of timber that were treated
with PCP and which might still be in use. However, a number of references
and authors have attempted to gauge the likely size of this stockpile and
resulting emissions.
The UK PCP emissions to air fell between 1990 and 2002, from 538 to 437
tonnes (t), which compares to the NAEI range of 750 falling to 540 t, and the
current estimates of 1,000 declining to 690 t43. In Scotland, monitoring of PCP
in water stopped in 2006 since PCP concentrations were found to be below
the environmental quality standard (EQS) of 0.4 μg L-1 for surface waters, and
reporting was no longer deemed necessary.
The United Nations Environment Programme (UNEP)44 has stated that PCP
emissions in the UK would arise from wood that has been treated within the
last 16 years. Releases to air from in-use, treated wood were estimated to be
300 t in 2012 in the UK and show a declining trend since the 1990s, this
compares to 308 t in the NAEI and 380 t in the current estimates.
4.5.1.1 Monitoring information in water pentachlorophenol
The Environment Agency (EA) carries out water monitoring for PCP under the
EQS compliance requirements for the WFD. Monitoring data for 2013 to 2015
have shown that of the water bodies sampled, none of them failed the EQS.
4.5.2 Annex A substances, Industrial chemicals
(hexabromocyclododecane and hexachlorobutadiene)
4.4.5.1 Hexabromocyclododecane (HBCDD)
A 201045 study commissioned by the UK provided estimated UK annual
release inventories of HBCDD and this is set out in Table 9 below.
43 Webster et al. 2010 Exploration of management options for Pentachlorophenol (PCP). Paper for the 8
th meeting of
the UNECE CLRTAP task Force on Persistent Organic Pollutants, Montreal, May 2010
44 Report off the Persistent Organic Pollutants Review Committee on the work of its tenth meeting, Addendum: risk
management evaluation on pentachlorophenol and its salts and esters - 2014
45 Costs and Benefits of the Addition of HBCDD to the Stockholm Convention and the 1998 POPs Protocol. (AEA)
2010. http://randd.defra.gov.uk/

70
Table 9 UK estimated release inventory for HBCDD (2010 and
2030)
Source
Estimated annual release (kg)
Air
(vapour)
Air
(dust)
Water Uncontrolled
landfill
Recycling
Total
Manufacture of
goods containing
HBCDD
7
730
60
-
800
Manufacture of
EPS/XPS 4.2 4.9 42 - 51
Manufacture of
HIPS 0.3 0.4 3 - 3.7
Manufacture of
Textiles 2.6 720 15 - 740
Use of goods
containing HBCDD 130000 9600 13000 91000 - 240000
Use of EPS/XPS 7000 - 91000 - 98000
Use of HIPS 50 - - - 50
Use of Textiles 130000 2500 13000 - - 140000
Disposal/recycling
of goods
containing HBCDD
(2010)
3000
2800
0
240000
-
240000
Disposal/recycling
of goods
containing HBCDD
(2030)
270
7200
0
460000
20000
490000
Disposal/recycling
of EPS/XPS (2010) 2800 - 140000 - 140000
Disposal/recycling
of EPS/XPS (2030) 7200 - 350000 - 360000
Disposal/recycling
of HIPS 49 0 20000 20000 40000
Disposal/recycling
of Textiles 220 - 88000 - 89000
Total (2010) 130000 120000 13000 330000 0 490000
Total (2030) 130000 170000 13000 550000 20000 730000
The values presented in the table are order of magnitude estimates only,
and are to be used to focus attention on key sectors and sources.
71
The data in Table 9 indicates that the most significant environmental
releases of HBCDD are:
Disposal to land of Expanded Polystyrene(EPS)/Extruded
Polystyrene(XPS) boards is forecast to become increasingly significant
up to 2030. In 2030, disposal to land of EPS/XPS is estimated to
account for 49% of all HBCDD releases;
Emissions to air of HBCDD from textiles, estimated to
account for 18% of all HBCDD releases in 2030;
Disposal to landfill of waste EPS/XPS boards during
installation is estimated to account for 13% of all HBCDD
releases in 2030; and
Disposal of end-of-life textiles containing HBCDD to landfill is
estimated to account for 12% of all HBCDD releases in 2030.
4.4.5.1.1 Monitoring information in water for HBCDD
The EA commenced water monitoring for HBCDD in 2016 under the EQS
requirements for the WFD. Only limited data are available at the present time.
4.4.5.2 Hexachlorobutadiene (HCBD)
In the UK, no emissions or releases have been reported or measured in the
past decade. As reported by Weber et al.46 although there is a wealth of data
concerning historical emissions, there are no reliable emission data for HCBD
for unintentional releases at a global level. A summary of available information
is presented in the Table 10 below. It is important to note that no information
for the UK has been identified, and so development of full UK emission
estimates is not been possible.
46
Unintentionally produced hexachlorobenzene and pentachlorbenzene POPs waste from solvent productions – The need to establish emission factors and inventories

72
Table 10 Estimated unintentional releases of HCBD
Year Estimated unintentional releases
Geographic scope
Reference
1975 454 tonnes/ year (to air)
U.S. U.S. EPA (2003)
2000 2 tonnes/ year (to air)
U.S. UNEP-POPS-POPRC 9-13-Add
2000 2.59 tonnes/year-1 (to air from the manufacture of chlorinated chemicals)
UNECE Europe Van der Gon et al. 200747
2004 <100 g (to air) Canada UNEP-POPS-POPRC 9-13-Add
2010 88.9 kg (to water from waste and waste water management)
EU-27 E-PRTR (only includes releases over the emission limit of >1 kg per year, and no UK facilities were included)
2011 538 kg/year (comprising 360 kg fugitive air emissions and 122 kg point source emissions)
U.S. UNEP-POPS-POPRC 9-13-Add
2012 ~0.7 – 500 kg/ year (from the manufacture of chlorinated chemicals)
EU-27 European Commission, 2012
2012 6 kg/ year (to sewage sludge)
EU-27 European Commission, 2012
2015 10,080 kg/ year (to air)
China Zhang et al., 201548
4.4.5.2.1 Monitoring information in water for HCBD
Under the requirements of the WFD, the EA has demonstrated that monitoring
data for the 2013 – 2015 period has indicated that none of the surface water
bodies sampled failed the EQS value.
47 Emissions of persistent organic pollutants and eight candidate POPs from UNECE-Europe in 2000, 2010 and 2020
and the emission reduction resulting from the implementation of the UNECE POP protocol
48 Highly chlorinated unintentionally produced persistent organic pollutants generated during the methanol-based
production of chlorinated methanes: A case study in China

73
4.5.3 Annex A and C substances, Industrial chemical, unintentional by -
product (polychlorinated naphthalenes (PCNs))
The UK has developed an emissions inventory for PCNs for the period 1990 –
2014 using data from the literature and other supporting information.
Estimates of the total emissions of PCNs to the UK are given in Figure 6, with
the ‘land’ and ‘air’ vectors dominating all emissions across the time period.
These are dominated by the use of PCNs in di-electric fluids for energy
distribution networks. Since the cessation of PCN production (1960s), use of
PCNs within new di-electric equipment has also ceased. However a
substantial ‘bank’ of in-use, old equipment and long service life (up to 45
years), means the potential for emissions through di-electric leak are possible,
both directly to land and also through volatilisation to air.
The European Directive 96/59/EC on the use of di-electric equipment that may
contain PCBs, had a requirement for all ‘industrial’ grade equipment (i.e.,
equipment assumed to contain >5 kg fill size for heat transfer fluids) should
have been removed from service by 2000 and irreversible destroyed.
Furthermore under the EU POPs Regulation, it is a requirement for Member
States to develop and maintain registers of in-use di-electric equipment that
may contain PCBs. Based on these facts and review of available data, the
decline in existing stocks and emissions from PCB contaminated di-electric
equipment saw a significant step change around 2000 with around 75% of the
stockpiles removed from service. Where PCNs and PCBs were used in a
similar capacity, it can be expected that this campaign of removal would have
also seen similar levels of PCNs removed from the existing di-electric
stockpiles.
The remaining stockpiles of equipment post-2000 would continue to decline
with the resultant emissions also continuing to steadily decrease. In 2014,
based on the inventory estimates, the emission vectors have shifted slightly
so that ‘air’ and ‘land’ vectors become equally dominant. The air vector
emissions (2014) are dominated by a) releases into the atmosphere from
thermal processes, in the majority of cases through unintentional production of
PCNs as by-products; and b) residual PCNs found within dielectrics (e.g.
capacitors) and other products that have been stockpiled or have a
‘significant’ product lifespan.
The ‘land’ vector emissions are also dominated by the presence of capacitors
and other dielectric fluid producing products as sources within the
environment. A large number of dielectric containing products (e.g. capacitors
and transformers) end up in landfills when they get towards the end of their
‘working’ life, resulting in leakage of dielectric fluids to land over time. Based
on the inventory created there was estimated to be ~92 kg of PCNs released

74
to land from dielectrics, with another 5.7 kg attributed to more ‘managed’
forms of emissions to land (sewerage sludge spreading) during 2014.
Figure 6: Estimations of the UK’s total emissions of PCN for all vectors (1990 – 2014).
4.6 Human exposure to POPs
Human exposure to POPs can be through air, water, soil, food, dermal contact
and occupational exposure. Studies on the original POPs had indicated that in
contemporary industrialised settings, more than 90% exposure of the general
population to these compounds was through food. However in the UK, the
decline in industrial emissions of POPs has resulted in a reduction in food-
related exposure. With regard to the newer POPs, there is increasing
evidence that other exposure routes may also be significant, for example
inhalation and ingestion of dust containing the likes of brominated flame
retardants in the home environment and via drinking water in the case of
perfluorinated compounds.
4.7 Evaluation of POP concentrations in the marine environment
The Centre for Environment, Fisheries and Aquaculture Science (Cefas)
undertake monitoring for some POPs in the marine environment. Their

75
monitoring using stranded Harbour porpoises (Phocoena phocoena) have
shown concentrations of:
PBDEs (summed tetra to hexa-BDE congeners) in the range from not
detected to 15.7 mg/kg lipid weight (l.w.) between 1992 – 2008, with
the peak concentration observed in a porpoise stranded in 1993.
Monitoring has shown concentrations have declined significantly since
1998;
HBCDD concentrations rose until around 2003 but have been declining
since then;
HCHs (alpha and gamma isomers) have declined over time with
concentrations over the period 1992-2008 ranging from not detected to
2.0 mg/kg (l.w.) and the peak concentration occurring in a porpoise
stranded in 1992;
HCB concentrations have declined steadily from 1992 to 2008;
Total DDT concentrations (predominantly DDE in marine mammals)
have declined during the period 1992 to around 1998, then stabilised or
‘plateaued’, but since then have declined significantly;
Similarly, for the organochlorine pesticide, dieldrin, concentrations have
declined significantly from 1992 to ~1998;
However, the exception to these observable and steady declines has
been for PCBs. Following an initial decline after regulations were
introduced in 1981, concentrations have plateaued since around 1997
and have remained steady thereafter. However, PCB levels are still at
toxicologically significant concentrations and each year approximately
40% of porpoises have blubber concentrations above a threshold
value. Such concentrations increases the risk of infectious disease
immune suppression which may lead to reduced fecundity and possible
mortality.
In addition, recent work funded by Defra and other sources have shown
elevated PCB concentrations in other marine mammal species such as
the killer whale (Orcinus orca) across northern Europe and the
Mediterranean. In UK waters, concentrations are in killer whales are
above the higher threshold established for reproductive impairment
and/or failure.
4.8 Evaluation of concentrations in the freshwater environment
Under the second phase of the UK’ Water Industry Research Chemicals
Investigation programme (CIP2), early results seem to suggest that several

76
POPs (PFOS, PFOA and HBCDD) are exceeding the environmental quality
standards (EQS) detailed in the 2013 Priority Substances Directive (daughter
of the Water Framework Directive). Concentrations of PFOS in surface waters
downstream of treated sewage effluent discharges generally exceed the EQS
for this substance and this appears to be a widespread phenomenon. For
HBCDD this substance appears to be present in effluents at some locations
and less so at others.
4.9 Effectiveness evaluation of current legislation on emissions
Without exception, monitoring surveys in the UK have demonstrated a decline in emissions of dioxins and furans, PCBs, HCB and PCBz (see Annexes 5A to 5D for data on time series to air, land and water).

77
Section 5
Update on strategies and measures to further reduce the emissions of POPs
5.1 Overarching national environmental policies
The UK Government is committed to protecting and improving the natural environment. This is to safeguard the enormous range of valuable benefits the natural environment provides to UK citizens, from clean air and water through to diverse wildlife, beautiful landscapes and urban green spaces. In order to do this Defra will published a 25 year environment plan in 2017 which sets out the framework to achieve this in England. The aim is to make this the first generation to leave the natural environment in a better state than it is now.
The framework adopts an integrated mangement approach which recognises that natural assets and the benefits they provide do not exist in silos, but are part of a wider system. There are interactions and dependencies within environmental systems that need to be understood and managed so that the potential benefits which can be obtained from the environment are realised in practice. The natural assets that the UK considers are important are water, land, plants and wildlife, air, marine environment, resources, recycling and waste, and the low carbon economy. The mangement of hazardous chemicals has played and will continue to play a key role in helping to fulfil the objectives of Defra’s 25 year environment plan in all of these key natural assets.
Under the Environment (Wales) Act 2016, Welsh Ministers are required to publish a statutory Natural Resources Policy in 2017. The Natural Resources Policy will form a key part of the delivery of the sustainable management of natural resources by setting out what Welsh Ministers consider to be the key risks, priorities and opportunities for the sustainable management of natural resources in Wales. This will include what should be done in relation to biodiversity and climate change and policies for contributing to the sustainable management of natural resources.
5.2 Update of the 2013 National Implementation Plan’s measures to manage UK emissions of POPs
5.2.1 Assessment of the potential emissions from legacy pesticide
production and application
In the 2013 NIP, the UK undertook to identify and quantify potential stockpiles of legacy, unused treated wood as emission sources for the organochlorine pesticide, lindane (gamma-hexachlorocyclohexane). In 2015/2016 research was carried out by the Environment Agency (EA) to assess the potential emissions from legacy lindane production and application. This analysis did

78
not find any non-compliance for the presence of the substance in timber being supplied by the UK market leaders and no further work is planned in this area.
It is known, however, that wooden railway sleepers were treated with lindane in the past. An investigation of previously used lindane in these materials will be carried out by the EA via a review of the known largest UK holder of railway sleepers.
The UK is also planning further investigations into the potential for leaching from land-spreading of wood chip compost.
5.2.2 Emission from consumer products and domestic activity
Studies have been carried out to assess concentrations of the brominated flame retardants, PBDEs in waste domestic and office soft furnishings49, plastic products, namely rainwater pipes and shower curtains, UK waste electrical and electronic (WEEE) equipment50, and end-of-life vehicles (ELV)51. Most of these studies found very low concentrations levels of these POPs. However, due to legacy risks, the UK Government will continue to investigate the likely impact of PBDE-containing electrical and electronic equipment and end-of-life vehicles in waste streams, as well as the presence of PBDEs on the UK market from goods imported from outside of the EU.
5.2.3 Food chain pathway, mechanisms and livestock uptake of POPs
The Food Standards Agency (FSA) has carried out an investigation into the uptake of pharmaceuticals, veterinary medicines and personal care products from the environment into food. As none of the chemicals detected were identified as POPs, the UK has decided to make this a low priority for further study.
The FSA has also commissioned two investigations into the use of former
waste materials in agricultural applications. All of these materials may contain
quantities of dioxins and furans and other POPs and it is important to ensure
that the proposed uses do not lead to an unacceptable uptake into crops or
exposure of grazing animals. At the time of writing, this work is still
ongoing52,53 .
49
Harrad S et al. Appendix 5 -A Further Update of the UK’s Persistent Organic Pollutants Multimedia
Emissions Inventory Final Report 2016, “Analysis of polybrominated diphenyl ethers in waste domestic and
office soft furnishings”. http://randd.defra.gov.uk/
50 Peacock et al, Analysis of Poly-Brominated Biphenyl Ethers (PBDEs) in Selected UK waste Streams: PBDEs In
waste electrical and electronic equipment (WEEE), February 2012
51 Turrell J et al, Analysis of Poly-brominated Biphenyl Ethers (PBDEs) in selected UK Waste Streams: PBDEs in
end of life vehicles December 2012
52 https://www.food.gov.uk/science/research/chemical-safety-research/env-cont/fs102009a
53 https://www.food.gov.uk/science/research/chemical-safety-research/env-cont/fs102009b

79
5.2.4 Development and maintenance of multimedia emissions
inventory for new and existing POPs
Since 2013, the UK has expanded its multimedia source inventories to provide assessment of emissions of dioxins and furans, PCB, HCB, PCNs and PCBz emissions to product and residue vectors as well as air, water and land.
5.3 Further planned work for managing POPs emissions in the UK
5.3.1 Further developments to the TOMPS monitoring network and
multimedia emissions inventory
The TOMPs network will continue to monitor the original Annex C POPs at all sampling sites. However, there is good justification that monitoring intensity could be reduced as the time series emission data indicates that emissions of these POPs have now decreased to low levels. The Government will therefore review the frequency of the monitoring for these substances and consider whether to select new POPs to monitor to ensure that it continues to target its monitoring efforts on the POPs of greatest concern. Government will also continue to develop its multimedia source inventories to reflect changes in data that is available.
5.3.2 Addressing POPs legacy use
The UK recognises there is an ongoing issue about POPs legacy uses which is particularly problematic within the context of waste and recycling. In relation to brominated flame retardants (BFR) in waste electronic and electrical equipment (WEEE), the UK is developing new treatment guidance which will introduce new threshold limits from the European POPs Regulation into the national standards for the output streams. This will require operators to establish a system for screening the input waste stream to isolate plastics and other materials that contain BFRs above the threshold limit and which must be removed and sent for irreversible destruction. Further studies will also be carried to assess whether POPs are present in recycled plastics and articles. (See Table 11)
The UK recognises that waste in landfill is a potential source of POPs release into groundwater. Previous work by the EA has revealed the presence of chemicals in leachate and groundwater but at the time it was not possible to analyse for POPs. However the methodology has since been improved and in view of this, the EA are looking to repeat this study before 2020 to assess if POPs are finding their way into leachate and/or groundwater.
Finally, as mentioned in section 5.2.1, the UK will review historical lindane material found predominantly in railway sleepers and will investigate the potential for leaching from land-spreading of wood chip compost.

80
5.3.3 POPs in the aquatic environment
As part of its obligations under the Water Framework Directive (WFD), the EA has developed estimates of emissions of hazardous substances, some of which are classed as POPs. However, preliminary results indicate a discrepancy in the data obtained from the different methodologies for calculating emissions data under the WFD and the UK POPs multimedia source inventories for the water vector. The UK intends to resolve this discrepancy to ensure that an accurate picture of the levels of POPs concentrations which enter the surface water environment is available, and which aims to harmonise emission data generated by the two approaches.
There are plans to measure POPs in sludge material generated from waste water treatment operations. This work will provide information on the removal efficiencies of treatment process, on emissions to surface waters and the prevalence of these substances downstream of discharges. Risk assessments on such substances can then be undertaken which will feed into risk management proposals potentially identifying measures to control further emissions to the wider aqueous environment.
Concentration data show that POPs continue to enter the marine environment and that this is potentially having localised impacts marine animals. The presence of POPs in the marine environment is currently being addressed under the Marine Strategy Framework Directive (MSFD). The MSFD requires Member States to develop a programme of measures to achieve objectives of good environmental status54. Government will monitor progress achieved towards these targets and we will report this progress to the extent of how the measures have realised the targets set in the next update of this NIP.
5.3.6 POPs alternatives
Article 9 of the Stockholm Convention includes a requirement on information exchange relevant to the reduction or elimination of the production, use and release of POPs and alternatives to POPs. The UK plays an important role in the substitution of POPs and ensures that industry and other organisations are compliant with the obligations under the Convention, and also in demonstrating to other parties that substitution of POPs is feasible. A study is being carried out to investigate alternative chemicals, for the BFRs, Deca-BDE and HBCDD. The UK will look at ways in which new information on alternatives can be disseminated wider.
5.3.7 Summary of planned work for managing POPs emission of POPs
in the UK
A summary of the planned work to be taken together with time schedules is presented in Table 11.
54
These are set out in the UK Marine Strategy part 3
https://www.gov.uk/government/publications/marine-strategy-part-three-uk-programme-of-measures.

81
Table 11 Implementation schedule for planned work for managing POP emissions in the UK
Activity Actors Timing
POPs monitoring and inventory
Development and maintenance of multimedia emissions inventory for new and existing POPs
Defra On-going
Further development and maintenance of TOMPS Monitoring network (Air)
Defra On-going
Addressing POPs legacy issues
Review of historical lindane found in railway sleepers
EA 2017-2020
Assessment of PBDEs within end of life vehicles
Defra 2015 – 2016
Assessment of PBDEs in recycled plastics
Defra 2016- 2017
Assessment of PCP and PCBz in finished articles
Defra 2017- 2018
Analysis of landfill leachate EA/Defra 2017-2020
Food chain pathway, mechanisms and livestock uptake
Investigation of use of former waste materials in agricultural applications (section 5.2.3)
FSA Ongoing
POPs in water
Analysis of sludge for POPs Defra 2017- 2020
Measures under the MSFD Defra 2018
Measures under the WFD Defra Ongoing
Information exchange
POPs alternatives for DecaBDE and HBCDD
Defra Ongoing

82
Section 6
Reduction or elimination of POP releases from stockpiles and wastes
Article 6 of the Stockholm Convention requires that appropriate strategies
should be developed to identify stockpiles and wastes consisting of,
containing or contaminated with POP substances. Stockpiles identified by
these strategies should be managed in a safe, efficient and environmentally
sound manner.
The Stockholm Convention defines which stockpiles are deemed as waste
and requires that they are handled, collected and transported in an
environmentally sound manner. The Convention requires wastes to be
disposed of in such a way that the POPs content is destroyed or irreversibly
transformed. However, waste can be otherwise disposed of in an
environmentally sound manner when destruction or irreversible transformation
does not represent the environmentally preferable option, or where the POP
content is below a certain threshold concentration value. The Stockholm and
Basel Conventions are working together to agree low POP content levels for
the banned substances.
The Basel Convention adopted technical guidelines, including low POP
content values, for the environmentally sound management of wastes
consisting of seven groups of POPs in 2015. These values have been
adopted on a provisional basis and will be reviewed in 2017.
Regulation (EC) 850/2004 on POPs contains provisions that go beyond those
required by the Stockholm Convention and defines waste management
options. Under Article 7, the Regulation requires that waste consisting of,
containing or contaminated by POPs shall be disposed of or recovered in
such a way as to ensure that the POPs content is destroyed or irreversibly
transformed by physico-chemical treatment, incineration on land or use as
secondary fuel.
Regulation (EC) 850/2004 was amended in 2014 (Commission Regulation
(EU) No 1342/2014) to include additional chemicals to the list of POP
substances with concentration limit values for Annex IV of the POPs
Regulation. Values for low POP content limits in Annex IV of the Regulation
provide trigger levels above which all POPs in wastes are to be destroyed or
irreversibly transformed. Derogations from this requirement are allowed in
Article 7(4)(b), where destruction or irreversible transformation is not the
environmentally preferable option. The wastes to which this exemption may
apply, and the maximum concentration limits up to which the exemption is
applied, are listed in Annex V. However, the derogations are only to be used

83
by Member States in exceptional cases. It is UK Government policy that no
waste should be exported from the UK for disposal.
In addition, those dealing with waste consisting of, containing or contaminated
with POPs will be subject to other waste controls regulations, as appropriate.
These include duty of care and controls for hazardous waste.
The concentration limits in the POPs regulation are listed in Table 13 below.
Table 13 Persistent organic pollutants concentration limits in
waste - Annex IV - Low POPs concentration limits
Substance Concentration Limit
Endosulfan 50 mg/kg
Perfluorooctane sulphonic acid and its
derivatives C8F17SO2X (X=OH, Metal
salt {O-M+}, halide, amide, and other
derivatives including polymers)
50 mg/kg
Hexachlorobutadiene 100 mg/kg
Polychlorinated naphthalenes 10 mg/kg
C10-C13, short chain chloroalkanes
(SCCPs)
10 000 mg/kg
Tetrabromodiphenyl ether,
Pentabromodiphenyl ether,
Hexabromodiphenylether,
Heptabromodiphenyl ether
Sum of the concentrations of tetra, penta,
hexa and penta diphenyl ether:1000
mg/kg
Dioxins/Furans 15 μg/kg
Polychlorinated biphenyls 50 mg/kg
Hexabromocyclododecane 1000 mg/kg (subject to review by the
Commission by 20/4/2019
Other Persistent organic pollutants 50 mg/kg
84
6.1 Stockpiles relating firefighting foams containing perfluorooctane sulphonic acid (PFOS)
The production and supply of PFOS-containing firefighting foams were
phased out under the REACH Regulation and the use of such foams was then
banned in 2011 under the POPs Regulation 850/2004 (as amended). The
Environment Agency undertook a communications and compliance campaign
for PFOS in 2011. Primarily, this focussed on raising awareness of
requirement to cease use and dispose of PFOS-containing foams. The
targeted sectors included fire and rescue services (FRS) and large industry
with involvement in flammable liquids – particularly the petrochemicals
industry, downstream oil industries, and aviation authorities. It has been
confirmed by the FRS that PFOS-foams are no longer in use and several
industrial holders of foams notified disposal of the material following the
communications campaign.
The use and disposal of PFOS-foams are no longer considered to be a
current concern. However, the substance may be present in residual forms in
land resulting from PFOS-foam/water run-off occurring during past industrial
incidents.
6.2 Stockpiles relating to HBCDD
Under the Regulation 850/2004 (as amended), if a holder has 50 kg or more
of a material that consists or contains a POP substance and is held for an
exempt purpose, they must submit information about the size and nature of
stockpile to the enforcing authority 12 months after the substance is listed in
Annex I or II of the Regulation. The holder must update the notification every
12 months thereafter, and must ensure that the stockpile is managed in a
safe, efficient and environmentally sound manner.
As the brominated flame retardant, HBCDD is now regulated as a POP, the
requirement to notify exempt stockpiles of HBCDD-containing materials will
apply as from March 2017. Whilst there are active REACH authorisations for
the continued use of HBCDD in expanded polystyrene (EPS) manufacturing in
Europe, none of the manufacturing companies are located in the UK. It is
therefore expected that stockpile notifications will only be received from
importers and distributors of construction materials where the holder has 50
kg or more of HBCDD-containing EPS on site. Construction companies are
considered unlikely to notify their on-site stockpiles as it is understood that
they order materials from suppliers to arrive on-site as required, rather than
having their own stores of materials at a depot or site lock-up.
The EA will be working with construction industry associations to raise
awareness of the requirement to notify stockpiles of HBCDD-containing

85
materials, and also with waste industry associations to clarify requirements for
the proper handling and disposal of HBCDD-containing foams during building
demolition.

86
Section 7
Other obligations of the Stockholm Convention
The principal obligations of the Convention require Parties to adopt and
implement measures aimed at reducing or eliminating the release of POPs
into the environment. This section considers a range of other obligations listed
in the Convention and what the UK is doing to implement them.
7.1 Information exchange, awareness and education
Article 10 includes obligations for Parties to facilitate ‘Public information,
awareness and education’ on POPs. Specifically, it requires that “each Party
shall, within its capabilities promote and facilitate inter alia “training of workers,
scientists and educators, policy and decision makers”. In the UK it is standard
practice when developing decision making on environmental policy to consult
stakeholders and make information publicly available through a range of
media including publications of consultation documents, research reports and
the internet. In addition, Defra provides and exchanges information with
Parties to Convention via the Convention Secretariat.
Making information about the environment publicly available is essential in
achieving sustainable development. By providing access to environmental
information, the public is able to make informed decisions in the full
knowledge of the likely environmental implications and to participate more
effectively in decision-making processes that affect the environment.
Openness also promotes transparent decision making and greater public
accountability of how authorities undertake their duties and responsibilities in
the UK.
Since 1992, the public has had a statutory right of access to environmental
information held by public authorities. This stems from the European
Community Directive 90/313/EEC on the freedom of access to information on
the environment. In 2003, the 1990 Directive was replaced by EC Directive
2003/4/EC on public access to environmental information, which takes
account of advances in technology, reflects international developments in
access rights, learns from the experience of the earlier regime, and ensures
the consistent application of the UNECE Aarhus Convention in the European
Union.
The Defra website www.defra.gov.uk contains a wide range of information on
what the Government is doing to protect the environment in a range of areas
such as chemicals, air quality, soil and contamination and water quality. It

87
includes information on national, EU and international chemicals policy,
Government position statements, advisory committee papers and reports, and
developments in research.
The National Air Quality Information Archive is the UK’s national archive of air
quality information and reports, including detailed air quality monitoring data
and statistics, plus major sections on local air quality management and air
quality research. This may be found at:
www.airquality.co.uk/archive/index.php
Openly accessible information on chemical emissions is also included in the
UK’s National Atmospheric Emissions Inventory, which compiles estimates of
emissions from UK sources including road transport, power stations and
industrial plants. This may be found at: www.naei.org.uk
The EA’s Pollution Inventory is an annual record of pollution in England from
activities that it regulates. One of its main objectives is to provide the public
with easily accessible information about pollution from industrial and other
sources in their local area and nationally. It records pollution that is released
into air, discharged into rivers or the sewerage network, or is transferred off-
site as waste. This feeds into the National Atmospheric Emissions Inventory,
and both the UK and European Pollutant Release and Transfer Register
(PRTR). The pollution inventory home page can be found at:
http://www.environment-agency.gov.uk/
Similarly, the Scottish Environment Protection Agency (SEPA) provides a
wide variety of environmental information in reports and on its website, which
also contains an education homepage: http://www.sepa.org.uk/default.aspx
The Scottish Pollutant Release Inventory (SPRI)’ is an annual record of pollution prepared by SEPA and can be found at: http://www.sepa.org.uk/air/process_industry_regulation/pollutant_release_inventory.aspx
The Northern Ireland Environment Agency also compiles emission data for
Northern Ireland and submits this to the UK Pollutant Release and Transfer
Register (PRTR).
The data provided by the UK pollution inventories is consolidated with data from other sources and can be found at: http://prtr.defra.gov.uk/
For some POPs, such as dioxins and furans, the major route of human
exposure is through diet. It is therefore important that the public has access to
information on food. The Foods Standards Agency provides this information
which, along with every other public authority, has a legal duty under Section

88
19 of the Freedom of Information Act 200055 to: adopt and maintain a scheme
which relates to the publication of information; have the scheme approved by
the Information Commissioner; publish information in accordance with that
scheme; and to review the scheme periodically. The Agency’s publication
scheme brings together in one place the many differing types of information
that are issued by the Agency in the discharge of its public functions and it
categorises the information type and provides details on how to obtain it.
The FSA produces a wide range of publications for the public and the food
industry. Many of these are available free of charge and some of which can be
downloaded from its website: www.food.gov.uk .
7.2 Research, development and monitoring
Article 11 requires that Parties facilitate, support and encourage research,
development, and monitoring and data collection of POPs. Focus is on their
sources, releases, transport, levels and trends, and effects on humans and
the environment.
The UK Government continues to fund and support scientific research to
underpin policy development on POPs. Monitoring is commissioned and
carried out by a range of organisations for a variety of purposes. These
include compliance monitoring for international, European and national
legislation, trend monitoring and addressing knowledge gaps regarding
particular chemicals including POPs. Details about Defra’s past and on-going
research can be found at the following website:
http://randd.defra.gov.uk/
A number of other Government Departments and agencies have significant
research portfolios on POPs. Examples of these include: the Department of
Health’s research through the National Institute for Health Research (NIHR)
on Environmental Health, Air Pollution and Toxicology; the EA’s Air Quality,
Human Health Effects and Diffuse Pollution work; the FSA’s chemical
contaminants in food programme and the Scotland and Northern Ireland
Forum for Environmental Research, Information on these can be found at the
following:
http://www.ncl.ac.uk/hpru/
http://hieh.hpru.nihr.ac.uk/
55
http://www.legislation.gov.uk/ukpga/2000/36/contents

89
https://www.journalslibrary.nihr.ac.uk/programmes/
http://www.environment-agency.gov.uk/research/
http://food.gov.uk/science/
www.sniffer.org.uk
Details of mandatory monitoring of food and animal feed undertaken by the
FSA can be found at the following website: www.food.gov.uk
7.3 New and emerging POP issues
Article 8 of the Stockholm Convention sets out process and criteria by which
new POPs are processed, assessed and listed in the Annexes of the
Convention. The UK Government will continue to respond to new and
emerging issues addressing both requirements under the Stockholm
Convention and the UNECE POPs Protocol.
The UK continues to participate in international assessments of POPs and
plays an active role to input into the work of technical committees under both
the Stockholm Convention and the UNECE POPs Protocol to assess
substances that meet the criteria of a POP. The UK, in partnership with the
European Community and its Member States has nominated substances to be
added to the Stockholm Convention.
In addition, the UK continues to survey the environment and food for existing
and emerging POPs substances. Details of previous and ongoing studies may
be found at the Food Standards Agency (FSA) and Centre for Environment,
Fisheries and Aquaculture Science (Cefas) web pages below:
http://www.food.gov.uk/science/research/contaminantsresearch/env-
cont/organic-cont/
https://www.cefas.co.uk/cefas-data-hub/research-and-publications-
list/?page=490
7.4 Effectiveness evaluation
Article 16 requires that Parties in accordance to their technical and financial
capabilities and using existing monitoring programmes and mechanisms
(where possible) cooperate on a regional basis, when appropriate and
contribute to a global monitoring programme for the Convention.
The UK has, in the past, submitted information gained from its POP
monitoring programmes in food and air to the European Food Safety Authority

90
and the Convention’s Secretariat, respectively. The UK will continue to
maintain liaison and collaboration with the Secretariat in contributing towards
a global monitoring plan and consideration of inclusion of new POPs in future
research and monitoring programmes.
7.5 Provision of technical assistance
Article 12 requires Parties to recognise that rendering timely and appropriate
technical assistance in response to requests from developing country Parties
and Parties with economies in transition is essential to the successful world-
wide implementation of the Convention. Provision of technical assistance
includes taking into account the particular needs of developing countries and
countries with economies in transition to develop and strengthen their capacity
to implement their obligations under the Convention. Much of the UK’s
regional and bilateral development assistance is focused on helping
developing countries to mainstream sound management of chemicals
including POPs in poverty reduction strategies and development assistance.
The principle routes for providing assistance to developing countries and
countries with economies in transition are listed below:
(i) The Global Environment Facility (GEF)
The GEF was created in 1991 to channel multilateral funds into projects that
create global environmental benefits, initiated by people in developing
countries. It brings together 182 member Governments, leading development
institutions, the scientific community and a wide spectrum of private sector
and non-Governmental organisations. It has allocated US$14.5 billion in
grants and an additional US$75.4 billion in co-financing from other sources to
support more than 4000 projects in 167 countries. These projects are
implemented by the United Nations Development Programme (UNDP), the
United Nations Environment Programme (UNEP) and the World Bank. More
information on the GEF can be found at:www.gefweb.org
In 2002 persistent organic pollutants became a GEF focal area. In 2014 the
GEF-6 replenishment allocated US$554 million for chemicals, and $US375
million specifically for projects involving POPs, providing financial and
technical assistance to countries in meeting their Stockholm Convention’s
obligations. The UK is contributing £210 million to the GEF-6 replenishment
budget of US$4.433 billion.
(ii) UK contributions to the Stockholm Convention
The UK previously contributed to the ‘POPs Club’ which was established
under UNEP to support the development of what is now the Stockholm
Convention. Since the Convention entered into force in May 2004, the UK has

91
an obligation to make annual assessed contributions to support the activities
of the Secretariat and participation of developing countries. In 2015, the UK’s
assessed contribution was $US 349,209.
7.6 Reporting obligations under the Stockholm Convention
Under Article 15, Parties are required to report periodically on the measures
taken and on their effectiveness in meeting the objectives of the Convention.
Reporting will include:
(a) Data on the total quantities of production, import and export of the
chemicals listed in Annexes A and B;
(b) A list of countries from which it has imported and exported each of these.
The purpose of reporting is to assess progress towards meeting obligations
under the Convention. As required under Article 12 of the EU POPs
Regulation, the UK has submitted annual and triannual reports to the
European Commission since 2007 outlining the progress made towards
meeting the objectives of the Convention.
The UK’s international reporting requirements and a schedule for the next four
years to 2021 are outlined in Table 14 below:
Table 14: The UK’s reporting requirements 2016 - 2021
Report Reported to Date for submission to
Convention Secretariat
National Implementation Plan
(update)
Stockholm
Convention
Secretariat
November 2016
4th Stockholm Convention
Article 15 report
Stockholm
Convention
Secretariat
2018 and periodically as
required
EU POPs Regulation Article
12 Annual Report
EU Commission Annually
EU POPs Regulation Article
12 Triannual Report
EU Commission Triennially (next report due
in 2019

92
ANNEXES
Annex 1: Glossary of Terms and Units used
Anthropogenic Caused or influenced by human
activity
BAT Best Available Techniques
BFRs Brominated Flame Retardants
BREFs Best Available Technique Reference
Documents
Biologically active A material is considered bioactive if it
has interaction with or effect on any
cell tissue in the human body
Cefas Centre for Environment, Fisheries
and Aquaculture Science
CLRTAP Convention on Long-Range
Transboundary Air Pollution
COMAH Control of Major Accident Hazard
Regulations 1999
Congener A congener is any single, well-defined
chemical compound within a closely
related group. As an example, a
polychlorinated biphenyl (PCB)
congener is a well-defined chemical
compound in the PCB category. The
name of a PCB congener is
associated with the total number of
chlorine substituents and the position
of each chlorine
COP Conference of the Parties

93
COSHH Control of Substances Hazardous to
Health Regulations
COT Committee on Toxicity of Chemicals
in Food, Consumer Products and the
Environment
DAERA NI Department of Agriculture,
Environment &Rural Affairs Northern
Ireland
DEFRA Department for Environment, Food
and Rural Affairs
DDT The chemical name for DDT is 1,1,1-
trichloro-2,2-bis(4-
chlorophenyl)ethane or
dichlorodiphenyltricloroethane. The
term DDT generally refers to para,
para’DDT. However the compound’s
structure permits several different
isomeric forms including ortho, para
and meta, para’-DDT.
De Novo Synthesis of a compound from simple
molecules under certain favourable
conditions
DFID Department for International
Development
Dioxin-like PCBs PCB congener which has the same
toxic action as to the most toxic dioxin
congener (2,3,7,8-tetrachlorodibenzo-
p-dioxin) but at a different level of
potency on the basis of which it is
assigned a TEF value
EA Environment Agency
EC European Commission

94
ECHA European Chemicals Agency
ELVs Specified Emission Limit Values
EFSA European Food Standards Agency
EMEP European Monitoring & Evaluation
Programme
EPA Environmental Protection Act
E-PRTR European Pollutant Release and
Transfer Register, which is based on
Regulation (EC) No 166/2006 -
implementing the obligations of the
UN-ECE PRTR Protocol signed in
May 2003 by 36 countries and the
European Community.
EQS Environmental Quality Standard
EU European Union
FSA Food Standards Agency
GEF Global Environment Facility
HBCDD Hexabromocyclododecane
HCB Hexachlorobenzene
HCBD Hexachlorobutadiene
HCE Hexachloroethane
HCH Hexachlorocyclohexane
HSE Health and Safety Executive
HMRC Her Majesty’s Revenue and Customs
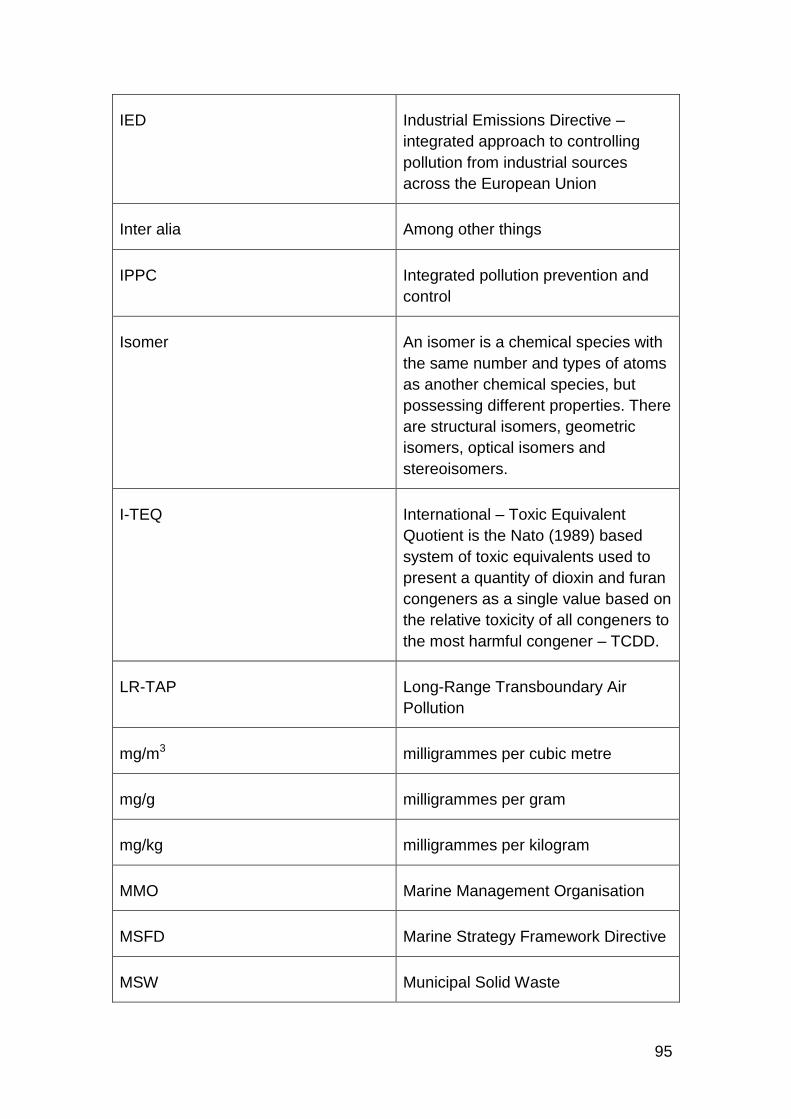
95
IED Industrial Emissions Directive –
integrated approach to controlling
pollution from industrial sources
across the European Union
Inter alia Among other things
IPPC Integrated pollution prevention and
control
Isomer An isomer is a chemical species with
the same number and types of atoms
as another chemical species, but
possessing different properties. There
are structural isomers, geometric
isomers, optical isomers and
stereoisomers.
I-TEQ International – Toxic Equivalent
Quotient is the Nato (1989) based
system of toxic equivalents used to
present a quantity of dioxin and furan
congeners as a single value based on
the relative toxicity of all congeners to
the most harmful congener – TCDD.
LR-TAP Long-Range Transboundary Air
Pollution
mg/m3 milligrammes per cubic metre
mg/g milligrammes per gram
mg/kg milligrammes per kilogram
MMO Marine Management Organisation
MSFD Marine Strategy Framework Directive
MSW Municipal Solid Waste
96
NAEI National Atmospheric Emissions
Inventory
NDPB Non-departmental public body
NIEA The Northern Ireland Environment
Agency
NRW Natural Resource Body for Wales
OECD Organisation for Economic
Cooperation & Development
OSPAR Oslo and Paris Conventions
PAH Polycyclic aromatic hydrocarbons
PBDEs Polybrominated diphenyl ethers
PCBs Polychlorinated biphenyls
PCBz Pentachlorobenzene
PCDD Polychlorinated dibenzo-p-dioxins
(also known as ‘dioxins’)
PCCD/F Mixture of congeners of PCDD and
PCDF (referred to collectively as
‘dioxins’)
PCDF Polychlorinated dibenzofurans (also
known as ‘furans’)
PCNs Polychlorinated naphthalenes
PCP Pentachlorophenol
PCTs Polychlorinated terphenyls
PERC Perchloroethylene

97
PFOA Perfluorooctanoic acid
PFOS Perfluorooctane sulfonate
PFOS-F Perfluorooctane sulfonyl fluoride
PHE Public Health England
PI Pollution Inventory
PIC Prior Informed Consent
POPs Persistent Organic Pollutants
PPC Pollution Prevention and Control
Regulations
PRTR Pollutant Release and Transfer
Registers
PVC Polyvinyl chloride
REACH Registration, Evaluation,
Authorisation of Chemicals
SAICM Strategic Approach to International
Chemical Management
SCCPs Short chain chlorinated paraffins
SEPA Scottish Environment Protection
Agency
SPRI Scottish Pollutant Release Inventory
TCDD 2, 3, 7, 8-tetrachlorodibenzo-p-dioxin
TDI tolerable daily intake
TDS Total Diet Study

98
TEF Toxic equivalency factor
TEQ Toxic equivalent quotient
TOMPs Toxic Organic Micro-Pollutants
UK United Kingdom
UNECE United Nations Economic
Commission for Europe
UNEP United Nations Environment
Programme
WEEE Waste Electrical & Electronic
Equipment
WFD Water Framework Directive
WHO World Health Organisation

99
Annex 2: Descriptions of the persistent organic pollutants
Aldrin
A pesticide applied to soils to control
termites, grasshoppers, corn rootworm, and
other insect pests.
Chlordane
Used extensively to control termites and as
a broad-spectrum insecticide on a range of
agricultural crops.
Chlordecone Is a synthetic chlorinated compound, which
was mainly used as an agricultural
pesticide. It was first produced in 1951 and
introduced commercially in 1958.
Dichlorodiphenyltrichloroethane
(p,p’-DDT)
DDT was widely used during World War II
to protect soldiers and civilians from
malaria, typhus, and other diseases spread
by insects. It continues to be applied
against mosquitoes in several countries to
control malaria.
Dieldrin
Used principally to control termites and
textile pests, dieldrin has also been used to
control insect-borne diseases and insects
living in agricultural soils.
Dioxins
Dioxins are families of structurally related
compounds and belong to a class of
environmental pollutants known as
organochlorines. Dioxins is an umbrella
description for polychlorinated dibenzo-p-
dioxins (PCDD) and polychlorinated
dibenzofurans (PCDF)
Endosulfan Is an insecticide that has been used since
the 1950s to control crop pests, tsetse flies
and ectoparasites of cattle and as a wood
preservative. As a broad-spectrum
insecticide, endosulfan is currently used to

100
control a wide range of pests on a variety of
crops including coffee, cotton, rice,
sorghum and soy.
Endrin
This insecticide is sprayed on the leaves of
crops such as cotton and grains. It is also
used to control mice, voles and other
rodents.
Furans
Unintentionally produced compounds from
many of the processes that produce
dioxins, and also during the production of
PCBs. Included in reference to dioxins
Hexabromobiphenyl (HBB) Is an industrial chemical that has been
used as a flame retardant, mainly in the
1970s. It is no longer produced or used in
most countries.
Hexabromodiphenyl ethers and
Heptabromodiphenyl ethers
Are the main components of commercial
octabromodiphenyl ether mixture which has
been used as a flame retardant.
Tetrabromodiphenyl ether and
pentabromodiphenyl ether
Are the main components of commercial
pentabromodiphenyl ether mixture which
has been used as a flame retardant.
Heptachlor
Primarily employed to control soil insects
and termites, heptachlor has also been
used more widely to control cotton insects,
grasshoppers, other crop pests, and
malaria-carrying mosquitoes.
Hexachlorobenzene (HCB)
First introduced in 1945 to treat seeds,
HCB was primarily used as a fungicide. It
was widely used to control wheat bunt. It is
also a by-product of certain industrial
chemicals and exists as an impurity in
several pesticide formulations. HCB
emissions may also arise from combustion
sources.

101
Hexachlorocyclohexane (alpha
and beta HCH)
Are still produced as a by-product of
lindane, although the intentional use of
alpha- and beta- HCH as an insecticide
was phased out years ago.
Lindane (gammaHCH) Is the common name for the gamma isomer
of hexachlorocyclohexane Lindane has
been used as a broad-spectrum insecticide
for seed and soil treatment, foliar
applications, tree and wood treatment and
against ectoparasites in both veterinary and
human applications.
Mirex
This insecticide is applied mainly to combat
fire ants and other types of ants and
termites. It has also been used as a fire
retardant in plastics, rubber, and electrical
goods.
Pentachlorobenzene (PCBz) PCBz was used in PCB products, in
dyestuff carriers, as a fungicide, a flame
retardant and as a chemical intermediate
e.g. previously for the production of
quintozene. PCBz might still be used as an
intermediate. PCBzis also produced
unintentionally during combustion, thermal
and industrial processes. It also present as
impurities in products such as solvents or
pesticides.
Perfluoroctane sulfonic acid
(PFOS), its salts and
perfluorooctane sulfonyl fluoride
(PFOS-F)
PFOS is both intentionally produced and an
unintended degradation product of related
anthropogenic chemicals. The current
intentional use of PFOS is widespread and
includes: electric and electronic parts, fire
fighting foam, photo imaging, hydraulic
fluids and textiles.
Polychlorinated biphenyls
(PCBs)
These compounds were used in industry as
heat exchange fluids, in electric
transformers and capacitors, and as
additives in paint, carbonless copy paper,

102
sealants and plastics. They can also be
formed unintentionally as by-products in
some chemical and combustion processes.
It is now known that some PCBs exhibit
similar biological activity to dioxins and
these compounds are therefore referred to
as dioxin-like PCBs.
Toxaphene
This insecticide, also called camphechlor,
is applied to cotton, cereal grains, fruits,
nuts, and vegetables. It has also been used
to control ticks and mites in livestock.
Hexabromocyclododecane
(HBCDD)
This is a brominated flame retardant. Its
primary application is in extruded (XPS)
and expanded (EPS) polystyrene foam that
is used as thermal insulation in the building
industry.
Hexachlorobutadiene (HCBD) Used mostly as a chemical intermediate in
the production of rubber compounds, and
to a lesser extent in the production of
chlorofluorocarbons (CFCs) and lubricants.
Pentachlorophenol (PCP) Most commonly used as a biocide,
pesticide, disinfectant, defoliant, anti-
sapstain agent, anti-microbial agent and
wood preservative in the agriculture and
forestry sectors (namely for wooden utility
poles and wooden trays used in mushroom
farming).
Polychlorinated Naphthalenes
(PCNs)
PCNs were produced for a diverse range of
uses and applications. These are use as
dielectric fluids, flame retardants,
fungicides, wood preservation and dye
carriers.

103
Annex 3: The Current UK requirements for Stockholm Convention Annex C Part II and Part III source categories
Annex C - Part II source categories
These source categories are regulated through one or a combination of the
following regulations, depending on their potential to pollute. The UK 2007
NIP (Annexes 5A) provided detail about how these applied for each sector.
The Industrial Emissions Directive (IED) is implemented in England and
Wales through the Environmental Permitting Regulations (EPR). The IED lays
down rules on integrated prevention and control of pollution arising from
industrial activities. It also lays down rules to prevent or, where that is not
practicable, to reduce emissions into air, water and land and to prevent the
generation of waste, in order to achieve a high level of protection of the
environment taken as a whole. It applies to those installations which are
known in EPR as A (1) or A(2) installations, small waste incineration plants
(SWIPs) or solvent emission activities (SEAs) in EPR.
A (1) installations are regulated by the Environment Agency in England,
Natural Resources Wales in Wales, Scottish Environment Protection Agency
in Scotland and by Northern Ireland Environment Agency in Northern Ireland.
A (2) installations, SWIPs and SEAs are regulated by local authorities in
England, Wales and Northern Ireland and SEPA in Scotland.
Local authorities also regulate installations known in the EPR as Part B
installations. Part B installations have a lower potential to pollute the
environment than A (1) and A(2) installations, and are regulated for emissions
to air only. Part B installations are not covered by IED.
All these systems require the operators of certain industrial and other
installations to obtain a permit to operate. Once an operator has submitted a
permit application, the regulator then decides whether to issue a permit. If one
is issued, it will include conditions aimed at reducing and preventing pollution
to acceptable levels.
BAT conclusions determined in accordance with Article 13 of the IED
published by the European Commission are the reference for setting permit
conditions.
Sector guidance (SG) notes are issued by the Secretary of State for
Environment, Food and Rural Affairs and by the Welsh Government under
regulation 64 of the EPR. They form statutory guidance on what constitute the

104
Best Available Techniques for A (2) installations for each of the main sectors
regulated.
Process Guidance (PG) notes are issued by the Secretary of State for
Environment, Food and Rural Affairs under regulation 64 of the EPR. They
form statutory guidance on what constitute the Best Available Techniques
(BAT) for Part B installations for each of the processes regulated.
Annex C - Part III source categories
The Convention also requires the promotion, in accordance with its action
plan, of the use of BAT and BEP for new and existing sources within source
categories such as those within Part III of Annex C. The UK 2007 NIP
(Annexes 5B) provided detail about how these are applied for each sector.
The narrative outlined for Part II sources is also relevant for many of the Part
III sources. However some of the Part III source categories are not covered in
this way, specifically residential combustion sources and motor vehicles.
Some processes are also covered or prohibited by other regulations – e.g.
open burning of waste, shredder plants for end of life vehicles.

105
Annex 4: TEQ Schemes for Dioxins and Furans, and dioxin-like PCBs
Measurement of toxicity for dioxins (Toxic Equivalency Factors)
Dioxins are found and released to the environment as complex mixtures of
chemical congeners. There are 210 congeners in total. Only 17 of these
congeners are considered biologically active and exhibit toxicity similar to that
of 2, 3, 7, 8-tetrachlorodibenzo-p-dioxin (TCDD), the most toxic congener. In
order to give a single measure of the toxicity of a sample and to simplify the
handling of data on these compounds various ‘toxic equivalent quotient’ (TEQ)
schemes have been proposed. These schemes provide a series of ‘toxic
equivalency factors’ (TEFs) that are applied to the measured concentrations
or amount of each congener to give a measure of the overall toxicity of a
mixture. The toxic equivalent concentration is the amount of 2, 3, 7, 8-TCDD
that is estimated to give the same overall effect as the mixture present.
There are two systems in current use for presenting toxic equivalency factors
for dioxins; the International TEQ (I-TEQ) and the more recent World Health
Organisation the (WHO TEQ). The latter also includes the dioxin-like PCBs.
These are given in Annex 4a and 3b.
In the UK, the Committee on the Toxicity of Chemicals in Food, Consumer
Products and the Environment (COT) adopted the use of WHO-TEQ, while
the I-TEQ scheme is widely used in UK and EU legislation. For purposes of
this document both terms I-TEQ and WHO-TEQ will be used where
appropriate. The 2005 WHO-TEFs have been incorporated into legislation
relating to contaminants in food through Commission Regulation 1259/2011
and in feeding stuffs through Commission Regulation 277/2012.

106
Annex 4a: Toxic Equivalent Quotient (TEQ) schemes for dioxins and furans
I-TEQ
(Nato
1989)
WHO TEQ
(1997/98)56
WHO TEQ (2005
update)57
Dioxins Humans/Mammals Humans/Mammals
2,3,7,8-TCDD 1 1 1
1,2,3,7,8-PeCDD 0.5 1 1
1,2,3,4,7,8-HxCDD 0.1 0.1 0.1
1,2,3,6,7,8-HxCDD 0.1 0.1 0.1
1,2,3,7,8,9-HxCDD 0.1 0.1 0.1
1,2,3,4,6,7,8-HpCDD 0.01 0.01 0.01
OCDD 0.001 0.0001 0.0003
Furans
2,3,7,8-TCDF 0.1 0.1 0.1
1,2,3,7,8-PeCDF 0.05 0.05 0.03
2,3,4,7,8-PeCDF 0.5 0.5 0.3
1,2,3,4,7,8-HxCDF 0.1 0.1 0.1
56
Van den Berg et al (1998) toxic equivalent factors for PCBs, PCDDs and PCDFs for humans and wildlife. Environmental Health Perspectives, 106, 12 57
Van den Berg et al: The 2005 World Health Organization Re-evaluation of Human and Mammalian Toxic
Equivalency Factors for Dioxins and Dioxin-like Compounds. WHO TEQ 2005 revised values, quoted from WHO
website: http://www.who.int/foodsafety/chem/tef_update/en/index.html
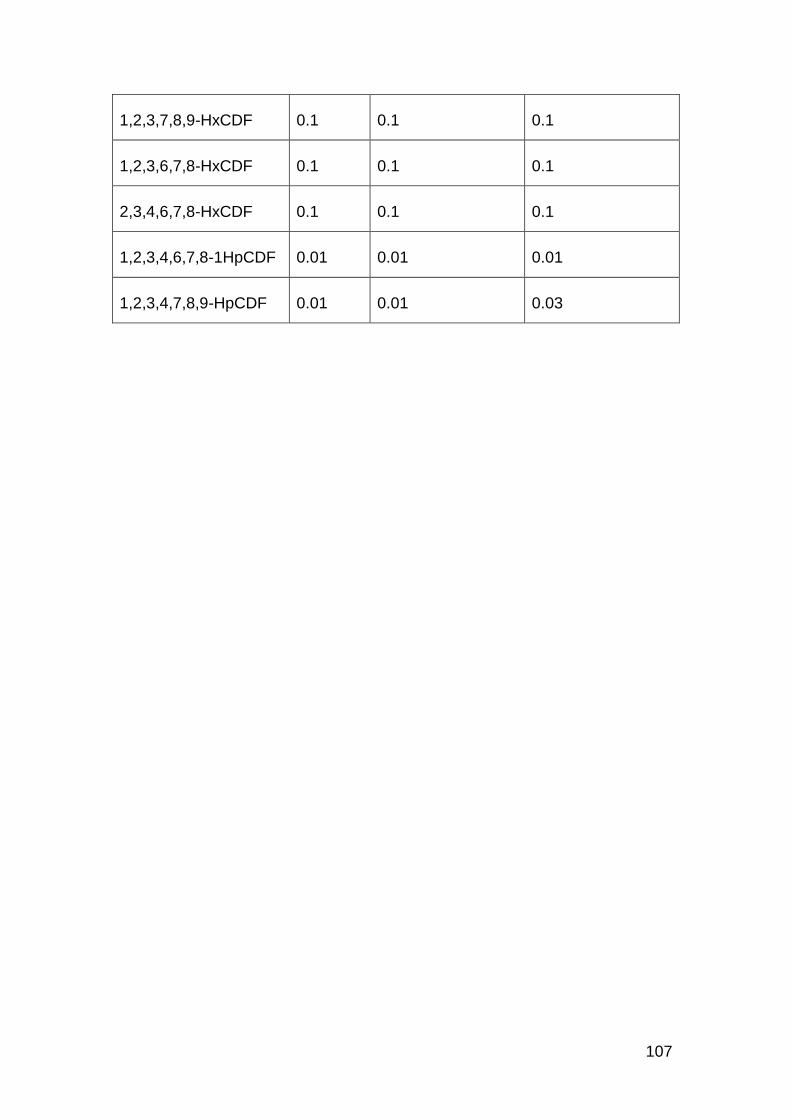
107
1,2,3,7,8,9-HxCDF 0.1 0.1 0.1
1,2,3,6,7,8-HxCDF 0.1 0.1 0.1
2,3,4,6,7,8-HxCDF 0.1 0.1 0.1
1,2,3,4,6,7,8-1HpCDF 0.01 0.01 0.01
1,2,3,4,7,8,9-HpCDF 0.01 0.01 0.03

108
Annex 4b: Toxic Equivalent Quotient (TEQ) schemes for dioxin-like PCBs
Ahlborg et
al (1993)58 WHO-TEQ(1997/8)
WHO TEQ (2005)
Non-Ortho PCBs Humans/Mammals Humans/Mammals
3,4,4’,5-TCB (81) 0.0001 0.0003
3,3’,4,4’-TCB (77) 0.0005 0.0001 0.0001
3,3’,4,4’,5PeCB (126) 0.1 0.1 0.1
3,3’,4,4’,5,5’-
HxCB(169) 0.01 0.01
0.03
Mono-Ortho PCBs
2,3,3’,4,4’-PeCB
(105) 0.0001 0.0001
0.00003
2,3,4,4’,5-PeCB
(114) 0.0005 0.0005
0.00003
2,3’,4,4’,5-PeCB
(118) 0.0001 0.0001
0.00003
2’,3,4,4’,5-PeCB
(123) 0.0001 0.0001
0.00003
2,3,3’,4,4’,5-HxCB
(156) 0.0005 0.0005
0.00003
2,3,3’,4,4’,5’-HxCB
(157) 0.0005 0.0005
0.00003
58 Chemosphere, Vol. 28, No. 6, pp. 1049-1067, 1994

109
2,3’,4,4’,5,5’-HxCB
(167) 0.00001 0.00001
0.00003
2,3,3’,4,4’,5,5’-HpCB
(189) 0.0001 0.0001
0.00003
Di-Ortho PCBs
2,2’,3,3’,4,4’,5-HpCB
(170) 0.0001 0 0
2,2’,3,4,4’,5,5’-HpCB
(180) 0.00001 0 0

110
Annex 5 (A1): Emissions of dioxins and furans to air (g I-TEQ per year)
Stockholm
Convention
Categories
Units 1990 1991 1992 1993 1994 1995 1996 1997 1998 1999 2000 2001 2002 2003 2004 2005 2006 2007 2008 2009 2010 2011 2012 2013 2014
Waste
Incineration
g I-
TEQ
484.37 479.12 460.23 312.59 146.38 160.93 53.73 31.43 16.47 15.34 15.07 14.72 14.45 14.83 13.96 14.20 12.92 13.62 13.09 12.52 12.61 12.62 12.95 13.56 14.38
Ferrous and Non
Ferrous Metals
g I-
TEQ
118.49 107.29 105.82 108.53 112.35 114.62 114.71 118.92 93.05 76.83 61.29 53.37 41.66 40.70 48.79 48.74 44.69 39.80 39.31 32.62 49.18 38.97 36.43 33.27 29.94
Heat and Power
generation
g I-
TEQ
331.08 352.64 353.13 358.83 313.50 328.46 181.49 166.11 133.70 131.28 110.92 107.59 91.84 83.50 77.78 67.47 64.83 65.18 78.62 75.31 90.09 82.63 89.11 100.81 101.47
Production of
Mineral Products
g I-
TEQ
9.28 7.73 7.06 7.17 8.12 7.99 7.90 8.93 4.82 5.63 5.02 5.28 2.33 2.53 25.02 2.03 1.84 2.03 1.61 1.70 3.18 1.30 1.17 2.45 1.60
Transportation g I-
TEQ
176.22 158.29 144.07 129.04 117.94 106.27 96.88 89.12 75.25 55.64 27.24 26.62 25.89 25.74 25.97 25.89 26.57 25.52 25.71 24.44 22.96 21.68 19.95 18.34 16.92
Open Burning
Processes
g I-
TEQ
114.99 106.83 93.55 58.74 58.00 58.01 58.02 58.03 58.04 58.05 58.06 58.07 58.08 58.09 58.10 58.11 42.91 33.49 32.61 32.62 32.64 32.65 32.66 32.68 32.68
Production of
chemicals and
consumer goods
g I-
TEQ
5.01 5.49 5.35 4.77 4.51 3.66 3.62 2.49 1.88 1.26 0.80 1.09 1.08 1.08 1.04 1.16 1.13 1.17 1.18 1.03 1.09 1.24 0.92 1.30 1.06
Waste Disposal g I-
TEQ
2.39 2.40 2.40 2.41 2.42 2.49 2.50 2.50 2.47 2.39 2.32 2.27 2.24 2.10 1.92 1.80 1.68 1.56 1.42 1.21 1.03 0.91 0.80 0.70 0.62
Miscellaneous g I-
TEQ
62.30 56.76 56.65 53.45 52.29 60.99 55.74 50.49 47.36 52.78 48.18 51.46 52.54 57.33 45.95 43.64 44.38 41.90 38.90 32.28 21.66 21.95 20.73 20.65 18.80
Total g I-
TEQ
1304.13 1276.56 1228.25 1035.53 815.50 843.41 574.58 528.01 433.03 399.19 328.89 320.46 290.10 285.90 298.53 263.03 240.95 224.26 232.45 213.73 234.45 213.94 214.72 223.77 217.48

111
Annex 5 (A2): Emissions of dioxins and furans to land (g I-TEQ per year)
Stockholm
Convention
Categories
Units 1990 1991 1992 1993 1994 1995 1996 1997 1998 1999 2000 2001 2002 2003 2004 2005 2006 2007 2008 2009 2010 2011 2012 2013 2014
Waste
Incineration
g I-
TEQ
1.10 1.11 1.10 1.14 1.09 1.11 1.11 1.12 1.10 1.11 1.09 1.07 1.09 1.11 1.06 1.06 1.04 1.04 1.06 1.03 1.03 1.03 1.06 1.09 1.09
Ferrous and Non
Ferrous Metals
g I-
TEQ
0.00 0.00 0.00 0.00 0.00 0.00 0.00 0.00 0.00 0.00 0.00 0.00 0.00 0.00 0.00 0.00 0.00 0.00 0.00 0.00 0.00 0.00 0.00 0.00 0.00
Heat and Power
generation
g I-
TEQ
0.79 0.81 0.90 0.92 0.90 0.87 0.87 0.86 0.86 0.86 0.85 0.84 0.83 0.83 0.93 1.05 1.17 1.30 3.48 3.78 4.87 4.25 5.39 6.30 6.02
Production of
Mineral Products
g I-
TEQ
0.00 0.00 0.00 0.00 0.00 0.00 0.00 0.00 0.00 0.00 0.00 0.00 0.00 0.00 0.00 0.00 0.00 0.00 0.00 0.00 0.00 0.00 0.00 0.00 0.00
Transportation g I-
TEQ
0.00 0.00 0.00 0.00 0.00 0.00 0.00 0.00 0.00 0.00 0.00 0.00 0.00 0.00 0.00 0.00 0.00 0.00 0.00 0.00 0.00 0.00 0.00 0.00 0.00
Open Burning
Processes
g I-
TEQ
180.22 174.81 165.87 142.09 141.80 142.03 142.26 142.49 142.72 142.95 143.18 143.41 143.67 143.94 144.19 144.46 110.62 89.98 88.35 88.60 88.89 89.16 89.54 89.90 89.90
Production of
chemicals and
consumer goods
g I-
TEQ
4.71 4.66 4.07 3.56 3.12 2.70 2.33 2.03 1.72 1.47 0.84 0.69 0.58 0.48 0.40 0.34 0.29 0.25 0.22 0.19 0.16 0.14 0.13 0.11 0.10
Waste Disposal g I-
TEQ
78.47 78.67 73.38 72.08 76.98 85.57 79.60 73.67 76.80 81.41 86.02 131.32 130.23 141.00 151.01 151.69 151.41 154.17 155.11 147.57 142.83 138.68 135.17 134.61 134.61
Miscellaneous g I-
TEQ
62.22 56.43 56.25 53.24 52.34 61.10 56.00 51.00 47.85 53.39 49.12 52.41 56.29 64.20 49.63 47.12 47.69 46.62 44.18 37.75 27.33 27.66 26.72 26.74 26.82
Total g I-
TEQ
327.51 316.48 301.57 273.03 276.23 293.38 282.18 271.16 271.05 281.19 281.10 329.74 332.70 351.55 347.23 345.72 312.21 293.36 292.38 278.92 265.11 260.93 258.02 258.75 258.54

112
Annex 5 (A3): Emissions of dioxins and furans to water (g I-TEQ per year)
Stockholm
Convention
Categories
Units 1990 1991 1992 1993 1994 1995 1996 1997 1998 1999 2000 2001 2002 2003 2004 2005 2006 2007 2008 2009 2010 2011 2012 2013 2014
Waste
Incineration
g I-
TEQ
0.03 0.03 0.03 0.03 0.03 0.03 0.02 0.02 0.02 0.02 0.02 0.01 0.01 0.01 0.01 0.00 0.00 0.00 0.00 0.00 0.00 0.00 0.00 0.00 0.00
Ferrous and Non
Ferrous Metals
g I-
TEQ
0.22 0.19 0.20 0.20 0.23 0.24 0.24 0.24 0.22 0.21 0.23 0.21 0.19 0.18 0.18 0.14 0.15 0.08 0.08 0.07 0.08 0.07 0.07 0.07 0.07
Heat and Power
generation
g I-
TEQ
1.99 1.99 2.02 2.04 2.22 2.17 2.20 2.21 2.10 2.00 2.01 2.03 2.04 2.05 2.08 2.05 2.08 2.07 2.07 2.05 2.05 2.05 2.05 2.08 2.08
Production of
Mineral Products
g I-
TEQ
0.00 0.00 0.00 0.00 0.00 0.00 0.00 0.00 0.00 0.00 0.00 0.00 0.00 0.00 0.00 0.00 0.00 0.00 0.00 0.00 0.00 0.00 0.00 0.00 0.00
Transportation g I-
TEQ
0.00 0.00 0.00 0.00 0.00 0.00 0.00 0.00 0.00 0.00 0.00 0.00 0.00 0.00 0.00 0.00 0.00 0.00 0.00 0.00 0.00 0.00 0.00 0.00 0.00
Open Burning
Processes
g I-
TEQ
0.08 0.08 0.08 0.08 0.08 0.08 0.08 0.08 0.08 0.08 0.08 0.08 0.08 0.08 0.08 0.08 0.08 0.08 0.08 0.08 0.08 0.08 0.08 0.08 0.08
Production of
chemicals and
consumer goods
g I-
TEQ
10.34 9.68 8.86 8.02 7.75 7.61 6.59 6.64 5.95 5.41 5.18 3.92 3.83 3.57 3.06 2.77 2.16 1.46 1.39 1.28 1.11 1.14 1.10 1.08 1.07
Waste Disposal g I-
TEQ
34.09 33.18 32.27 31.35 30.44 32.09 30.50 29.88 29.58 29.72 29.96 30.13 29.64 28.21 26.86 12.50 11.16 10.94 11.88 9.01 8.71 10.69 10.37 10.32 10.32
Miscellaneous g I-
TEQ
0.00 0.00 0.00 0.00 0.00 0.00 0.00 0.00 0.00 0.00 0.00 0.00 0.00 0.00 0.00 0.00 0.00 0.00 0.00 0.00 0.00 0.00 0.00 0.00 0.00
Total g I-
TEQ
46.76 45.15 43.45 41.71 40.74 42.21 39.63 39.06 37.94 37.44 37.48 36.38 35.80 34.10 32.27 17.55 15.63 14.64 15.51 12.49 12.03 14.03 13.67 13.64 13.63

113
Annex 5 (A4): Emissions of dioxins and furans to residue (g I-TEQ per year)
Stockholm
Convention
Categories
Units 1990 1991 1992 1993 1994 1995 1996 1997 1998 1999 2000 2001 2002 2003 2004 2005 2006 2007 2008 2009 2010 2011 2012 2013 2014
Waste
Incineration
g I-
TEQ
316.95 313.79 300.85 266.15 194.79 177.76 194.14 3.53 3.70 3.77 3.84 3.90 3.97 3.44 2.91 2.38 1.86 1.96 2.03 1.89 1.94 1.76 1.51 1.51 1.07
Ferrous and Non
Ferrous Metals
g I-
TEQ
126.30 107.97 105.54 105.05 111.12 106.40 99.73 94.37 81.99 72.98 69.26 59.10 48.75 42.07 36.29 27.48 23.80 14.86 12.24 8.01 6.36 6.43 5.96 6.08 6.00
Heat and Power
generation
g I-
TEQ
70.04 70.04 67.06 58.58 61.38 60.21 56.30 52.67 57.18 50.76 53.61 57.64 56.97 60.64 58.52 58.85 65.08 61.80 60.97 60.13 63.38 64.42 81.58 81.13 83.34
Production of
Mineral Products
g I-
TEQ
5.35 4.56 4.13 4.21 4.69 4.52 4.61 4.72 4.72 4.54 4.35 4.01 4.07 3.97 3.99 3.93 3.95 3.87 3.47 2.54 2.62 2.80 2.49 2.68 2.67
Transportation g I-
TEQ
0.00 0.00 0.00 0.00 0.00 0.00 0.00 0.00 0.00 0.00 0.00 0.00 0.00 0.00 0.00 0.00 0.00 0.00 0.00 0.00 0.00 0.00 0.00 0.00 0.00
Open Burning
Processes
g I-
TEQ
0.00 0.00 0.00 0.00 0.00 0.00 0.00 0.00 0.00 0.00 0.00 0.00 0.00 0.00 0.00 0.00 0.00 0.00 0.00 0.00 0.00 0.00 0.00 0.00 0.00
Production of
chemicals and
consumer goods
g I-
TEQ
11.86 12.11 11.27 10.45 10.76 11.02 11.30 11.59 11.62 11.56 11.44 12.05 12.97 14.20 14.49 15.63 16.39 15.76 14.02 14.32 15.01 15.19 15.42 16.53 16.26
Waste Disposal g I-
TEQ
135.13 136.68 136.94 138.49 141.43 145.20 145.79 150.23 156.67 163.59 168.00 179.19 190.71 185.63 179.82 159.65 150.50 131.28 114.43 110.95 110.34 99.52 96.14 91.50 69.57
Miscellaneous g I-
TEQ
0.00 0.00 0.00 0.00 0.00 0.00 0.00 0.00 0.00 0.00 0.00 0.00 0.00 0.00 0.00 0.00 0.00 0.00 0.00 0.00 0.00 0.00 0.00 0.00 0.00
Total g I-
TEQ
665.62 645.14 625.80 582.92 524.16 505.12 511.87 317.11 315.88 307.18 310.49 315.90 317.44 309.95 296.01 267.92 261.57 229.53 207.16 197.82 199.65 190.12 203.11 199.42 178.91
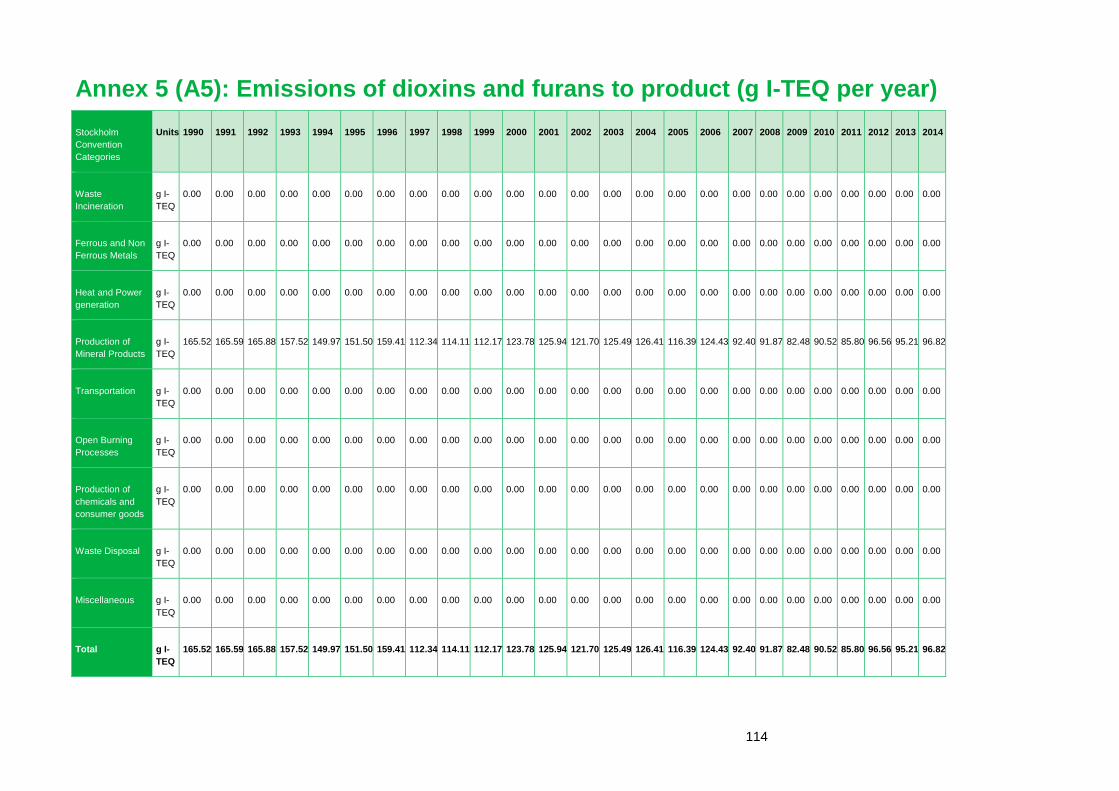
114
Annex 5 (A5): Emissions of dioxins and furans to product (g I-TEQ per year)
Stockholm
Convention
Categories
Units 1990 1991 1992 1993 1994 1995 1996 1997 1998 1999 2000 2001 2002 2003 2004 2005 2006 2007 2008 2009 2010 2011 2012 2013 2014
Waste
Incineration
g I-
TEQ
0.00 0.00 0.00 0.00 0.00 0.00 0.00 0.00 0.00 0.00 0.00 0.00 0.00 0.00 0.00 0.00 0.00 0.00 0.00 0.00 0.00 0.00 0.00 0.00 0.00
Ferrous and Non
Ferrous Metals
g I-
TEQ
0.00 0.00 0.00 0.00 0.00 0.00 0.00 0.00 0.00 0.00 0.00 0.00 0.00 0.00 0.00 0.00 0.00 0.00 0.00 0.00 0.00 0.00 0.00 0.00 0.00
Heat and Power
generation
g I-
TEQ
0.00 0.00 0.00 0.00 0.00 0.00 0.00 0.00 0.00 0.00 0.00 0.00 0.00 0.00 0.00 0.00 0.00 0.00 0.00 0.00 0.00 0.00 0.00 0.00 0.00
Production of
Mineral Products
g I-
TEQ
165.52 165.59 165.88 157.52 149.97 151.50 159.41 112.34 114.11 112.17 123.78 125.94 121.70 125.49 126.41 116.39 124.43 92.40 91.87 82.48 90.52 85.80 96.56 95.21 96.82
Transportation g I-
TEQ
0.00 0.00 0.00 0.00 0.00 0.00 0.00 0.00 0.00 0.00 0.00 0.00 0.00 0.00 0.00 0.00 0.00 0.00 0.00 0.00 0.00 0.00 0.00 0.00 0.00
Open Burning
Processes
g I-
TEQ
0.00 0.00 0.00 0.00 0.00 0.00 0.00 0.00 0.00 0.00 0.00 0.00 0.00 0.00 0.00 0.00 0.00 0.00 0.00 0.00 0.00 0.00 0.00 0.00 0.00
Production of
chemicals and
consumer goods
g I-
TEQ
0.00 0.00 0.00 0.00 0.00 0.00 0.00 0.00 0.00 0.00 0.00 0.00 0.00 0.00 0.00 0.00 0.00 0.00 0.00 0.00 0.00 0.00 0.00 0.00 0.00
Waste Disposal g I-
TEQ
0.00 0.00 0.00 0.00 0.00 0.00 0.00 0.00 0.00 0.00 0.00 0.00 0.00 0.00 0.00 0.00 0.00 0.00 0.00 0.00 0.00 0.00 0.00 0.00 0.00
Miscellaneous g I-
TEQ
0.00 0.00 0.00 0.00 0.00 0.00 0.00 0.00 0.00 0.00 0.00 0.00 0.00 0.00 0.00 0.00 0.00 0.00 0.00 0.00 0.00 0.00 0.00 0.00 0.00
Total g I-
TEQ
165.52 165.59 165.88 157.52 149.97 151.50 159.41 112.34 114.11 112.17 123.78 125.94 121.70 125.49 126.41 116.39 124.43 92.40 91.87 82.48 90.52 85.80 96.56 95.21 96.82

115
Annex 5 (B1): Emissions of polychlorinated biphenyls to air (kg per year)
Stockholm
Convention
Categories
Units 1990 1991 1992 1993 1994 1995 1996 1997 1998 1999 2000 2001 2002 2003 2004 2005 2006 2007 2008 2009 2010 2011 2012 2013 2014
Waste
Incineration
kg 11.68 11.45 10.93 9.84 7.29 6.04 5.39 1.53 1.71 1.63 1.54 1.46 1.37 1.18 1.01 0.86 0.73 0.64 0.51 0.45 0.45 0.43 0.41 0.42 0.42
Ferrous and Non
Ferrous Metals
kg 537.54 462.78 479.00 496.79 464.59 435.26 415.53 439.47 387.44 231.77 223.43 202.30 168.18 171.79 199.11 179.73 183.25 199.70 196.15 140.48 151.17 155.82 135.00 139.36 140.86
Heat and Power
generation
kg 120.79 120.24 111.37 99.67 83.73 75.20 70.12 60.24 61.05 54.82 56.32 59.59 54.54 57.01 54.09 52.98 56.53 52.25 48.73 41.41 43.25 42.86 54.13 51.32 41.19
Production of
Mineral Products
kg 1.54 1.50 1.32 1.33 1.19 0.98 0.95 0.86 0.64 0.65 0.54 0.50 0.44 0.40 0.33 0.27 0.28 0.26 0.35 0.24 0.23 0.26 0.18 0.26 0.25
Transportation kg 0.03 0.03 0.03 0.02 0.02 0.02 0.02 0.02 0.01 0.01 0.00 0.00 0.00 0.00 0.00 0.00 0.00 0.00 0.00 0.00 0.00 0.00 0.00 0.00 0.00
Open Burning
Processes
kg 126.20 126.06 125.82 125.14 125.14 125.17 125.19 125.21 125.23 125.26 125.28 125.31 125.34 125.36 125.38 125.41 99.68 83.73 82.25 82.27 82.30 82.33 82.36 82.39 82.43
Production of
chemicals and
consumer goods
kg 5670.95 5327.88 5010.44 4716.02 4421.78 4150.53 3899.98 3667.23 3451.01 3249.78 847.14 793.40 746.55 703.30 663.21 626.00 591.29 558.87 528.50 499.97 473.20 448.09 424.26 402.04 380.83
Waste Disposal kg 112.64 112.94 105.47 103.65 98.94 96.89 78.25 61.45 52.35 43.00 32.26 43.46 38.61 35.63 32.93 27.76 22.46 17.46 12.03 6.16 2.86 2.72 2.59 2.46 2.41
Miscellaneous kg 151.73 143.63 142.91 138.84 136.49 146.24 138.27 130.61 125.19 130.11 122.73 126.01 127.49 133.74 120.25 117.22 118.10 115.10 111.13 102.93 89.34 89.51 88.01 84.49 84.13
Total kg 6733.10 6306.52 5987.29 5691.29 5339.17 5036.33 4733.71 4486.62 4204.61 3837.02 1409.27 1352.03 1262.51 1228.40 1196.31 1130.23 1072.33 1028.02 979.64 873.91 842.80 822.03 786.95 762.75 732.50

116
Annex 5 (B2): Emissions of polychlorinated biphenyls to land (kg per year)
Stockholm
Convention
Categories
Units 1990 1991 1992 1993 1994 1995 1996 1997 1998 1999 2000 2001 2002 2003 2004 2005 2006 2007 2008 2009 2010 2011 2012 2013 2014
Waste Incineration kg 0.00 0.00 0.00 0.00 0.00 0.00 0.00 0.00 0.00 0.00 0.00 0.00 0.00 0.00 0.00 0.00 0.00 0.00 0.00 0.00 0.00 0.00 0.00 0.00 0.00
Ferrous and Non
Ferrous Metals
kg 0.00 0.00 0.00 0.00 0.00 0.00 0.00 0.00 0.00 0.00 0.00 0.00 0.00 0.00 0.00 0.00 0.00 0.00 0.00 0.00 0.00 0.00 0.00 0.00 0.00
Heat and Power
generation
kg 0.44 0.48 0.43 0.47 0.41 0.30 0.30 0.29 0.27 0.28 0.23 0.22 0.17 0.15 0.13 0.10 0.10 0.11 0.16 0.16 0.19 0.18 0.21 0.23 0.22
Production of Mineral
Products
kg 0.00 0.00 0.00 0.00 0.00 0.00 0.00 0.00 0.00 0.00 0.00 0.00 0.00 0.00 0.00 0.00 0.00 0.00 0.00 0.00 0.00 0.00 0.00 0.00 0.00
Transportation kg 0.00 0.00 0.00 0.00 0.00 0.00 0.00 0.00 0.00 0.00 0.00 0.00 0.00 0.00 0.00 0.00 0.00 0.00 0.00 0.00 0.00 0.00 0.00 0.00 0.00
Open Burning
Processes
kg 0.00 0.00 0.00 0.00 0.00 0.00 0.00 0.00 0.00 0.00 0.00 0.00 0.00 0.00 0.00 0.00 0.00 0.00 0.00 0.00 0.00 0.00 0.00 0.00 0.00
Production of
chemicals and
consumer goods
kg 56422.37 55790.95 48758.33 42691.71 37424.12 32279.82 27932.96 24253.91 20601.15 17613.23 10035.31 8295.80 6895.33 5761.63 4842.02 4094.35 3484.85 2986.46 2577.51 2240.66 1961.97 1730.29 1536.67 1373.92 1236.27
Waste Disposal kg 345.25 346.16 322.87 317.15 338.69 376.53 350.23 324.17 337.93 358.20 378.48 475.12 424.09 408.12 382.47 329.30 273.91 223.13 168.36 106.79 59.99 58.25 56.77 56.54 56.54
Miscellaneous kg 0.00 0.00 0.00 0.00 0.00 0.00 0.00 0.00 0.00 0.00 0.00 0.00 0.00 0.00 0.00 0.00 0.00 0.00 0.00 0.00 0.00 0.00 0.00 0.00 0.00
Total kg 56768.06 56137.60 49081.62 43009.32 37763.22 32656.65 28283.50 24578.36 20939.34 17971.72 10414.02 8771.14 7319.59 6169.89 5224.62 4423.75 3758.86 3209.70 2746.04 2347.61 2022.15 1788.72 1593.65 1430.69 1293.03

117
Annex 5 (B3): Emissions of polychlorinated biphenyls to water (kg per year)
Stockholm
Convention
Categories
Units 1990 1991 1992 1993 1994 1995 1996 1997 1998 1999 2000 2001 2002 2003 2004 2005 2006 2007 2008 2009 2010 2011 2012 2013 2014
Waste
Incineration
kg 0.00 0.00 0.00 0.00 0.00 0.00 0.00 0.00 0.00 0.00 0.00 0.00 0.00 0.00 0.00 0.00 0.00 0.00 0.00 0.00 0.00 0.00 0.00 0.00 0.00
Ferrous and Non
Ferrous Metals
kg 0.00 0.00 0.00 0.00 0.00 0.00 0.00 0.00 0.00 0.00 0.00 0.00 0.00 0.00 0.00 0.00 0.00 0.00 0.00 0.00 0.00 0.00 0.00 0.00 0.00
Heat and Power
generation
kg 0.00 0.00 0.00 0.00 0.00 0.00 0.00 0.00 0.00 0.00 0.00 0.00 0.00 0.00 0.00 0.00 0.00 0.00 0.00 0.00 0.00 0.00 0.00 0.00 0.00
Production of
Mineral Products
kg 0.00 0.00 0.00 0.00 0.00 0.00 0.00 0.00 0.00 0.00 0.00 0.00 0.00 0.00 0.00 0.00 0.00 0.00 0.00 0.00 0.00 0.00 0.00 0.00 0.00
Transportation kg 0.00 0.00 0.00 0.00 0.00 0.00 0.00 0.00 0.00 0.00 0.00 0.00 0.00 0.00 0.00 0.00 0.00 0.00 0.00 0.00 0.00 0.00 0.00 0.00 0.00
Open Burning
Processes
kg 0.00 0.00 0.00 0.00 0.00 0.00 0.00 0.00 0.00 0.00 0.00 0.00 0.00 0.00 0.00 0.00 0.00 0.00 0.00 0.00 0.00 0.00 0.00 0.00 0.00
Production of
chemicals and
consumer goods
kg 0.00 0.00 0.00 0.00 0.00 0.00 0.00 0.00 0.00 0.00 0.00 0.00 0.00 0.00 0.00 0.00 0.00 0.00 0.00 0.00 0.00 0.00 0.00 0.00 0.00
Waste Disposal kg 128.62 128.96 120.28 118.15 126.18 140.27 130.48 120.77 125.89 133.45 0.00 0.00 0.00 0.00 0.00 0.00 0.00 0.00 0.00 0.00 0.00 0.00 0.00 0.00 0.00
Miscellaneous kg 0.00 0.00 0.00 0.00 0.00 0.00 0.00 0.00 0.00 0.00 0.00 0.00 0.00 0.00 0.00 0.00 0.00 0.00 0.00 0.00 0.00 0.00 0.00 0.00 0.00
Total kg 128.62 128.96 120.28 118.15 126.18 140.27 130.48 120.77 125.89 133.45 0.00 0.00 0.00 0.00 0.00 0.00 0.00 0.00 0.00 0.00 0.00 0.00 0.00 0.00 0.00

118
Annex 5 (B4): Emissions of polychlorinated biphenyls to residue (kg per year)
Stockholm
Convention
Categories
Units 1990 1991 1992 1993 1994 1995 1996 1997 1998 1999 2000 2001 2002 2003 2004 2005 2006 2007 2008 2009 2010 2011 2012 2013 2014
Waste
Incineration
kg 8.27 8.17 7.71 7.25 6.79 6.32 5.86 5.40 5.43 5.47 5.50 5.53 5.57 4.75 3.95 3.16 2.39 2.50 2.57 2.34 2.39 2.15 1.84 1.82 1.23
Ferrous and Non
Ferrous Metals
kg 32.01 27.34 28.25 29.14 29.62 30.50 28.69 30.42 26.54 25.28 24.91 22.49 18.45 17.98 21.54 19.03 19.27 21.32 21.29 15.16 16.96 17.81 14.71 14.19 14.49
Heat and Power
generation
kg 16.54 16.69 15.81 13.62 12.58 11.67 10.58 9.37 9.34 8.16 8.76 9.47 8.78 9.45 9.03 9.23 10.09 9.24 8.64 7.33 7.71 7.73 9.91 9.10 9.64
Production of
Mineral Products
kg 0.41 0.43 0.38 0.40 0.37 0.30 0.31 0.27 0.22 0.23 0.19 0.18 0.16 0.14 0.11 0.09 0.09 0.08 0.11 0.11 0.11 0.10 0.08 0.10 0.10
Transportation kg 0.00 0.00 0.00 0.00 0.00 0.00 0.00 0.00 0.00 0.00 0.00 0.00 0.00 0.00 0.00 0.00 0.00 0.00 0.00 0.00 0.00 0.00 0.00 0.00 0.00
Open Burning
Processes
kg 0.00 0.00 0.00 0.00 0.00 0.00 0.00 0.00 0.00 0.00 0.00 0.00 0.00 0.00 0.00 0.00 0.00 0.00 0.00 0.00 0.00 0.00 0.00 0.00 0.00
Production of
chemicals and
consumer goods
kg 0.41 0.45 0.44 0.37 0.36 0.30 0.32 0.18 0.10 0.12 0.06 0.12 0.13 0.14 0.13 0.14 0.14 0.15 0.15 0.13 0.13 0.16 0.12 0.18 0.03
Waste Disposal kg 1050.10 1062.75 1069.29 1083.17 1103.34 1127.34 1137.16 1178.72 1229.31 1282.56 1324.89 1380.85 1484.00 1443.32 1399.05 1256.21 1178.84 1018.02 904.77 876.06 870.81 782.63 755.76 717.54 536.58
Miscellaneous kg 0.04 0.04 0.04 0.04 0.03 0.03 0.03 0.02 0.02 0.01 0.01 0.01 0.01 0.01 0.01 0.01 0.01 0.01 0.00 0.00 0.00 0.00 0.00 0.00 0.00
Total kg 1107.78 1115.87 1121.91 1133.98 1153.09 1176.46 1182.95 1224.37 1270.96 1321.82 1364.32 1418.65 1517.08 1475.80 1433.82 1287.88 1210.83 1051.32 937.53 901.14 898.11 810.60 782.42 742.94 562.07

119
Annex 5 (B5): Emissions of polychlorinated biphenyls to product (kg per year)
Stockholm
Convention
Categories
Units 1990 1991 1992 1993 1994 1995 1996 1997 1998 1999 2000 2001 2002 2003 2004 2005 2006 2007 2008 2009 2010 2011 2012 2013 2014
Waste
Incineration
kg 0.00 0.00 0.00 0.00 0.00 0.00 0.00 0.00 0.00 0.00 0.00 0.00 0.00 0.00 0.00 0.00 0.00 0.00 0.00 0.00 0.00 0.00 0.00 0.00 0.00
Ferrous and Non
Ferrous Metals
kg 0.00 0.00 0.00 0.00 0.00 0.00 0.00 0.00 0.00 0.00 0.00 0.00 0.00 0.00 0.00 0.00 0.00 0.00 0.00 0.00 0.00 0.00 0.00 0.00 0.00
Heat and Power
generation
kg 0.00 0.00 0.00 0.00 0.00 0.00 0.00 0.00 0.00 0.00 0.00 0.00 0.00 0.00 0.00 0.00 0.00 0.00 0.00 0.00 0.00 0.00 0.00 0.00 0.00
Production of
Mineral Products
kg 39.27 34.80 35.47 35.00 35.08 35.70 33.39 34.19 30.55 28.55 28.82 27.45 23.55 23.67 27.00 24.60 25.27 26.67 25.94 19.08 21.11 22.06 20.74 19.62 20.24
Transportation kg 0.00 0.00 0.00 0.00 0.00 0.00 0.00 0.00 0.00 0.00 0.00 0.00 0.00 0.00 0.00 0.00 0.00 0.00 0.00 0.00 0.00 0.00 0.00 0.00 0.00
Open Burning
Processes
kg 0.00 0.00 0.00 0.00 0.00 0.00 0.00 0.00 0.00 0.00 0.00 0.00 0.00 0.00 0.00 0.00 0.00 0.00 0.00 0.00 0.00 0.00 0.00 0.00 0.00
Production of
chemicals and
consumer goods
kg 0.00 0.00 0.00 0.00 0.00 0.00 0.00 0.00 0.00 0.00 0.00 0.00 0.00 0.00 0.00 0.00 0.00 0.00 0.00 0.00 0.00 0.00 0.00 0.00 0.00
Waste Disposal kg 0.00 0.00 0.00 0.00 0.00 0.00 0.00 0.00 0.00 0.00 0.00 0.00 0.00 0.00 0.00 0.00 0.00 0.00 0.00 0.00 0.00 0.00 0.00 0.00 0.00
Miscellaneous kg 0.00 0.00 0.00 0.00 0.00 0.00 0.00 0.00 0.00 0.00 0.00 0.00 0.00 0.00 0.00 0.00 0.00 0.00 0.00 0.00 0.00 0.00 0.00 0.00 0.00
Total kg 39.27 34.80 35.47 35.00 35.08 35.70 33.39 34.19 30.55 28.55 28.82 27.45 23.55 23.67 27.00 24.60 25.27 26.67 25.94 19.08 21.11 22.06 20.74 19.62 20.24

120
Annex 5 (C1): Emissions of hexachlorobenzene to air (kg per year)
Stockholm
Convention
Categories
Units 1990 1991 1992 1993 1994 1995 1996 1997 1998 1999 2000 2001 2002 2003 2004 2005 2006 2007 2008 2009 2010 2011 2012 2013 2014
Waste
Incineration
kg 4.71 4.66 4.48 3.98 2.97 2.72 2.95 0.26 0.26 0.26 0.27 0.27 0.27 0.24 0.21 0.18 0.14 0.14 0.13 0.13 0.13 0.13 0.12 0.14 0.14
Ferrous and Non
Ferrous Metals
kg 3047.00 3015.50 3479.36 4158.14 4833.64 5052.07 5056.00 5231.07 5541.86 0 0 0 0 0 0 0 0 0 0 0 0 0 0 0 0
Heat and Power
generation
kg 1.50 1.55 1.72 2.22 3.21 3.47 3.26 3.91 5.52 5.40 5.65 6.11 6.64 6.77 6.54 6.50 7.25 7.37 7.66 9.19 9.70 10.00 12.27 12.07 10.27
Production of
Mineral Products
kg 0.15 0.12 0.11 0.11 0.13 0.13 0.13 0.13 0.14 0.13 0.13 0.12 0.12 0.12 0.12 0.12 0.12 0.12 0.10 0.07 0.08 0.08 0.07 0.08 0.08
Transportation kg 0.81 0.79 0.79 0.76 0.71 0.72 0.76 0.80 0.81 0.62 0.54 0.55 0.45 0.51 0.57 0.60 0.74 0.70 0.80 0.76 0.66 0.72 0.62 0.60 0.55
Open Burning
Processes
kg 0.00 0.00 0.00 0.00 0.00 0.00 0.00 0.00 0.00 0.00 0.00 0.00 0.00 0.00 0.00 0.00 0.00 0.00 0.00 0.00 0.00 0.00 0.00 0.00 0.00
Production of
chemicals and
consumer goods
kg 699.16 639.54 622.03 403.21 220.84 232.38 230.63 135.65 127.46 85.13 70.80 61.17 56.12 51.28 64.98 61.70 56.69 47.42 43.21 24.13 22.74 13.54 11.05 8.05 10.44
Waste Disposal kg 0.00 0.00 0.00 0.00 0.00 0.00 0.00 0.00 0.00 0.00 0.00 0.00 0.00 0.00 0.00 0.00 0.00 0.00 0.00 0.00 0.00 0.00 0.00 0.00 0.00
Miscellaneous kg 0.00 0.00 0.00 0.00 0.00 0.00 0.00 0.00 0.00 0.00 0.00 0.00 0.00 0.00 0.00 0.00 0.00 0.00 0.00 0.00 0.00 0.00 0.00 0.00 0.00
Total kg 3753.33 3662.16 4108.48 4568.43 5061.49 5291.49 5293.72 5371.82 5676.04 91.54 77.38 68.21 63.60 58.92 72.41 69.10 64.95 55.75 51.90 34.29 33.31 24.46 24.14 20.94 21.48

121
Annex 5 (C2): Emissions of hexachlorobenzene to land (kg per year)
Stockholm
Convention
Categories
Units 1990 1991 1992 1993 1994 1995 1996 1997 1998 1999 2000 2001 2002 2003 2004 2005 2006 2007 2008 2009 2010 2011 2012 2013 2014
Waste
Incineration
kg 0.00 0.00 0.00 0.00 0.00 0.00 0.00 0.00 0.00 0.00 0.00 0.00 0.00 0.00 0.00 0.00 0.00 0.00 0.00 0.00 0.00 0.00 0.00 0.00 0.00
Ferrous and Non
Ferrous Metals
kg 0.00 0.00 0.00 0.00 0.00 0.00 0.00 0.00 0.00 0.00 0.00 0.00 0.00 0.00 0.00 0.00 0.00 0.00 0.00 0.00 0.00 0.00 0.00 0.00 0.00
Heat and Power
generation
kg 0.00 0.00 0.00 0.00 0.00 0.00 0.00 0.00 0.00 0.00 0.00 0.00 0.00 0.00 0.00 0.00 0.00 0.00 0.00 0.00 0.00 0.00 0.00 0.00 0.00
Production of
Mineral Products
kg 0.00 0.00 0.00 0.00 0.00 0.00 0.00 0.00 0.00 0.00 0.00 0.00 0.00 0.00 0.00 0.00 0.00 0.00 0.00 0.00 0.00 0.00 0.00 0.00 0.00
Transportation kg 0.00 0.00 0.00 0.00 0.00 0.00 0.00 0.00 0.00 0.00 0.00 0.00 0.00 0.00 0.00 0.00 0.00 0.00 0.00 0.00 0.00 0.00 0.00 0.00 0.00
Open Burning
Processes
kg 0.00 0.00 0.00 0.00 0.00 0.00 0.00 0.00 0.00 0.00 0.00 0.00 0.00 0.00 0.00 0.00 0.00 0.00 0.00 0.00 0.00 0.00 0.00 0.00 0.00
Production of
chemicals and
consumer goods
kg 47.72 29.46 34.08 35.46 34.67 37.47 37.92 36.39 33.89 7.84 7.80 6.20 6.16 6.77 6.77 7.18 7.18 5.42 5.42 9.86 9.30 5.52 4.50 3.27 4.25
Waste Disposal kg 0.00 0.00 0.00 0.00 0.00 0.00 0.00 0.00 0.00 0.00 0.00 0.00 0.00 0.00 0.00 0.00 0.00 0.00 0.00 0.00 0.00 0.00 0.00 0.00 0.00
Miscellaneous kg 0.00 0.00 0.00 0.00 0.00 0.00 0.00 0.00 0.00 0.00 0.00 0.00 0.00 0.00 0.00 0.00 0.00 0.00 0.00 0.00 0.00 0.00 0.00 0.00 0.00
Total kg 47.72 29.46 34.08 35.46 34.67 37.47 37.92 36.39 33.89 7.84 7.80 6.20 6.16 6.77 6.77 7.18 7.18 5.42 5.42 9.86 9.30 5.52 4.50 3.27 4.25
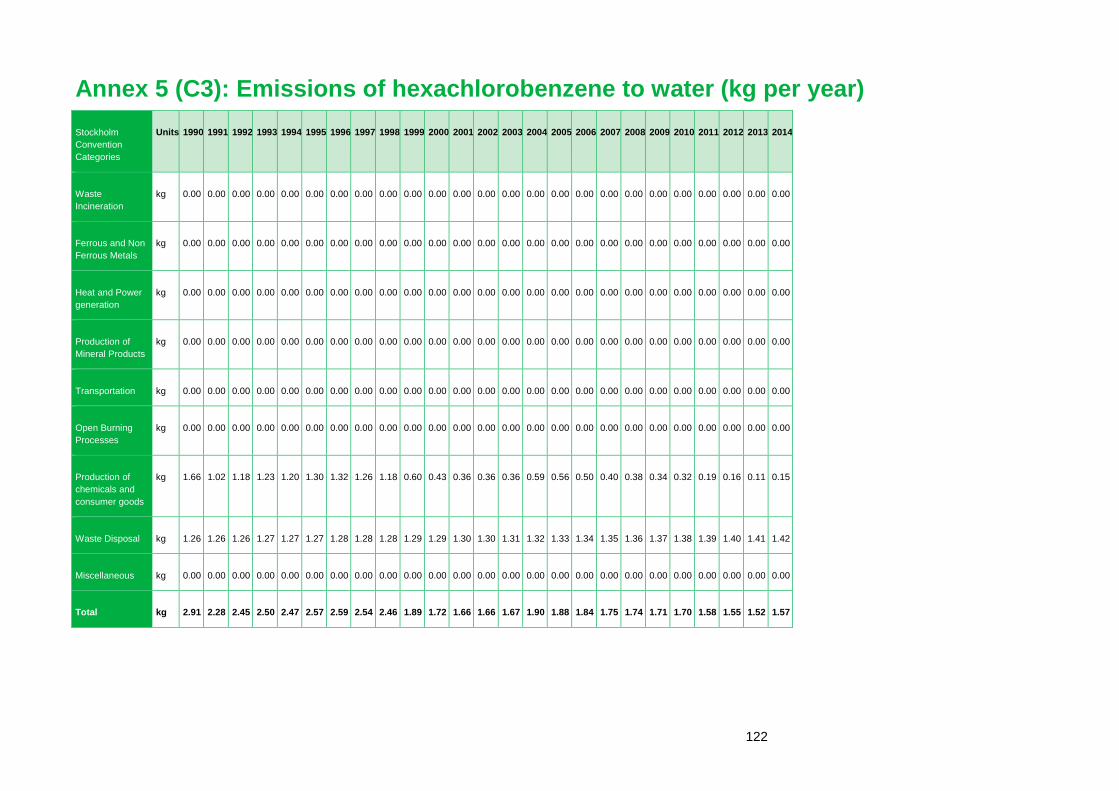
122
Annex 5 (C3): Emissions of hexachlorobenzene to water (kg per year)
Stockholm
Convention
Categories
Units 1990 1991 1992 1993 1994 1995 1996 1997 1998 1999 2000 2001 2002 2003 2004 2005 2006 2007 2008 2009 2010 2011 2012 2013 2014
Waste
Incineration
kg 0.00 0.00 0.00 0.00 0.00 0.00 0.00 0.00 0.00 0.00 0.00 0.00 0.00 0.00 0.00 0.00 0.00 0.00 0.00 0.00 0.00 0.00 0.00 0.00 0.00
Ferrous and Non
Ferrous Metals
kg 0.00 0.00 0.00 0.00 0.00 0.00 0.00 0.00 0.00 0.00 0.00 0.00 0.00 0.00 0.00 0.00 0.00 0.00 0.00 0.00 0.00 0.00 0.00 0.00 0.00
Heat and Power
generation
kg 0.00 0.00 0.00 0.00 0.00 0.00 0.00 0.00 0.00 0.00 0.00 0.00 0.00 0.00 0.00 0.00 0.00 0.00 0.00 0.00 0.00 0.00 0.00 0.00 0.00
Production of
Mineral Products
kg 0.00 0.00 0.00 0.00 0.00 0.00 0.00 0.00 0.00 0.00 0.00 0.00 0.00 0.00 0.00 0.00 0.00 0.00 0.00 0.00 0.00 0.00 0.00 0.00 0.00
Transportation kg 0.00 0.00 0.00 0.00 0.00 0.00 0.00 0.00 0.00 0.00 0.00 0.00 0.00 0.00 0.00 0.00 0.00 0.00 0.00 0.00 0.00 0.00 0.00 0.00 0.00
Open Burning
Processes
kg 0.00 0.00 0.00 0.00 0.00 0.00 0.00 0.00 0.00 0.00 0.00 0.00 0.00 0.00 0.00 0.00 0.00 0.00 0.00 0.00 0.00 0.00 0.00 0.00 0.00
Production of
chemicals and
consumer goods
kg 1.66 1.02 1.18 1.23 1.20 1.30 1.32 1.26 1.18 0.60 0.43 0.36 0.36 0.36 0.59 0.56 0.50 0.40 0.38 0.34 0.32 0.19 0.16 0.11 0.15
Waste Disposal kg 1.26 1.26 1.26 1.27 1.27 1.27 1.28 1.28 1.28 1.29 1.29 1.30 1.30 1.31 1.32 1.33 1.34 1.35 1.36 1.37 1.38 1.39 1.40 1.41 1.42
Miscellaneous kg 0.00 0.00 0.00 0.00 0.00 0.00 0.00 0.00 0.00 0.00 0.00 0.00 0.00 0.00 0.00 0.00 0.00 0.00 0.00 0.00 0.00 0.00 0.00 0.00 0.00
Total kg 2.91 2.28 2.45 2.50 2.47 2.57 2.59 2.54 2.46 1.89 1.72 1.66 1.66 1.67 1.90 1.88 1.84 1.75 1.74 1.71 1.70 1.58 1.55 1.52 1.57

123
Annex 5 (C4): Emissions of hexachlorobenzene to residue and product (kg per year)
No emissions to the residue or product vector have been reported for hexachlorobenzene.

124
Annex 5 (D1): Emissions of pentachlorobenzene to air (kg per year)
Stockholm
Convention
Categories
Units 1990 1991 1992 1993 1994 1995 1996 1997 1998 1999 2000 2001 2002 2003 2004 2005 2006 2007 2008 2009 2010 2011 2012 2013 2014
Waste
Incineration
kg 24.32 24.17 23.26 21.29 17.50 16.38 16.91 7.24 7.32 7.39 7.47 0.75 0.76 0.67 0.59 0.50 0.41 0.40 0.37 0.35 0.37 0.35 0.32 0.32 0.27
Ferrous and Non
Ferrous Metals
kg 190.04 187.14 210.20 248.47 281.61 293.55 297.42 305.14 323.68 14.31 12.70 11.51 9.98 11.93 11.87 11.88 12.47 12.78 11.82 8.94 8.43 7.72 8.38 11.04 11.78
Heat and Power
generation
kg 29.63 30.90 31.26 28.81 28.90 25.86 24.50 24.73 28.93 29.25 27.76 9.46 8.85 8.35 7.60 7.43 7.92 7.78 9.96 10.51 11.89 11.77 13.66 15.61 15.67
Production of
Mineral Products
kg 0.00 0.00 0.00 0.00 0.00 0.00 0.00 0.00 0.00 0.00 0.00 0.00 0.00 0.00 0.00 0.00 0.00 0.00 0.00 0.00 0.00 0.00 0.00 0.00 0.00
Transportation kg 0.00 0.00 0.00 0.00 0.00 0.00 0.00 0.00 0.00 0.00 0.00 0.00 0.00 0.00 0.00 0.00 0.00 0.00 0.00 0.00 0.00 0.00 0.00 0.00 0.00
Open Burning
Processes
kg 0.11 0.10 0.10 0.10 0.10 0.11 0.10 0.10 0.10 0.10 0.10 0.10 0.10 0.10 0.10 0.10 0.08 0.07 0.07 0.06 0.05 0.06 0.05 0.05 0.05
Production of
chemicals and
consumer goods
kg 57.40 54.36 51.83 49.32 46.79 44.35 42.16 40.06 38.07 65.30 42.85 42.25 41.70 9.62 9.09 8.60 8.14 7.71 7.31 6.92 6.55 6.19 5.86 5.54 5.23
Waste Disposal kg 0.01 0.01 0.01 0.01 0.01 0.01 0.01 0.01 0.01 0.01 0.01 0.01 0.01 0.01 0.01 0.01 0.01 0.01 0.01 0.01 0.00 0.00 0.00 0.00 0.00
Miscellaneous kg 0.00 0.00 0.00 0.00 0.00 0.00 0.00 0.00 0.00 0.00 0.00 0.00 0.00 0.00 0.00 0.00 0.00 0.00 0.00 0.00 0.00 0.00 0.00 0.00 0.00
Total kg 301.51 296.68 316.67 347.99 374.92 380.25 381.11 377.28 398.10 116.36 90.88 64.08 61.40 30.68 29.26 28.51 29.04 28.76 29.53 26.79 27.30 26.10 28.27 32.57 33.01

125
Annex 5 (D2): Emissions of pentachlorobenzene to land (kg per year)
Stockholm
Convention
Categories
Units 1990 1991 1992 1993 1994 1995 1996 1997 1998 1999 2000 2001 2002 2003 2004 2005 2006 2007 2008 2009 2010 2011 2012 2013 2014
Waste
Incineration
kg 0.00 0.00 0.00 0.00 0.00 0.00 0.00 0.00 0.00 0.00 0.00 0.00 0.00 0.00 0.00 0.00 0.00 0.00 0.00 0.00 0.00 0.00 0.00 0.00 0.00
Ferrous and Non
Ferrous Metals
kg 0.00 0.00 0.00 0.00 0.00 0.00 0.00 0.00 0.00 0.00 0.00 0.00 0.00 0.00 0.00 0.00 0.00 0.00 0.00 0.00 0.00 0.00 0.00 0.00 0.00
Heat and Power
generation
kg 0.00 0.00 0.00 0.00 0.00 0.00 0.00 0.00 0.00 0.00 0.00 0.00 0.00 0.00 0.00 0.00 0.00 0.00 0.00 0.00 0.00 0.00 0.00 0.00 0.00
Production of
Mineral Products
kg 0.00 0.00 0.00 0.00 0.00 0.00 0.00 0.00 0.00 0.00 0.00 0.00 0.00 0.00 0.00 0.00 0.00 0.00 0.00 0.00 0.00 0.00 0.00 0.00 0.00
Transportation kg 0.00 0.00 0.00 0.00 0.00 0.00 0.00 0.00 0.00 0.00 0.00 0.00 0.00 0.00 0.00 0.00 0.00 0.00 0.00 0.00 0.00 0.00 0.00 0.00 0.00
Open Burning
Processes
kg 1.18 1.14 1.13 1.11 1.10 1.17 1.14 1.10 1.07 1.12 1.08 1.11 1.12 1.15 1.07 1.05 0.89 0.77 0.73 0.69 0.61 0.61 0.60 0.61 0.61
Production of
chemicals and
consumer goods
kg 114.66 108.62 103.04 97.74 92.45 87.38 82.66 78.19 73.96 81.92 30.34 16.44 15.60 14.81 14.06 13.34 12.66 12.02 11.41 10.83 10.29 9.76 9.27 8.80 8.36
Waste Disposal kg 0.00 0.00 0.00 0.00 0.00 0.00 0.00 0.00 0.00 0.00 0.00 0.00 0.00 0.00 0.00 0.00 0.00 0.00 0.00 0.00 0.00 0.00 0.00 0.00 0.00
Miscellaneous kg 0.00 0.00 0.00 0.00 0.00 0.00 0.00 0.00 0.00 0.00 0.00 0.00 0.00 0.00 0.00 0.00 0.00 0.00 0.00 0.00 0.00 0.00 0.00 0.00 0.00
Total kg 115.83 109.76 104.17 98.86 93.55 88.56 83.79 79.28 75.03 83.04 31.42 17.55 16.72 15.96 15.13 14.40 13.55 12.79 12.15 11.52 10.89 10.38 9.88 9.41 8.97

126
Annex 5 (D3): Emissions of pentachlorobenzene to water (kg per year)
Stockholm
Convention
Categories
Units 1990 1991 1992 1993 1994 1995 1996 1997 1998 1999 2000 2001 2002 2003 2004 2005 2006 2007 2008 2009 2010 2011 2012 2013 2014
Waste
Incineration
kg 0.00 0.00 0.00 0.00 0.00 0.00 0.00 0.00 0.00 0.00 0.00 0.00 0.00 0.00 0.00 0.00 0.00 0.00 0.00 0.00 0.00 0.00 0.00 0.00 0.00
Ferrous and Non
Ferrous Metals
kg 0.00 0.00 0.00 0.00 0.00 0.00 0.00 0.00 0.00 0.00 0.00 0.00 0.00 0.00 0.00 0.00 0.00 0.00 0.00 0.00 0.00 0.00 0.00 0.00 0.00
Heat and Power
generation
kg 0.00 0.00 0.00 0.00 0.00 0.00 0.00 0.00 0.00 0.00 0.00 0.00 0.00 0.00 0.00 0.00 0.00 0.00 0.00 0.00 0.00 0.00 0.00 0.00 0.00
Production of
Mineral Products
kg 0.00 0.00 0.00 0.00 0.00 0.00 0.00 0.00 0.00 0.00 0.00 0.00 0.00 0.00 0.00 0.00 0.00 0.00 0.00 0.00 0.00 0.00 0.00 0.00 0.00
Transportation kg 0.00 0.00 0.00 0.00 0.00 0.00 0.00 0.00 0.00 0.00 0.00 0.00 0.00 0.00 0.00 0.00 0.00 0.00 0.00 0.00 0.00 0.00 0.00 0.00 0.00
Open Burning
Processes
kg 0.00 0.00 0.00 0.00 0.00 0.00 0.00 0.00 0.00 0.00 0.00 0.00 0.00 0.00 0.00 0.00 0.00 0.00 0.00 0.00 0.00 0.00 0.00 0.00 0.00
Production of
chemicals and
consumer goods
kg 0.04 0.04 0.04 0.04 0.04 0.03 0.03 0.03 0.03 0.45 0.45 0.00 0.00 0.00 0.00 0.00 0.00 0.00 0.00 0.00 0.00 0.00 0.00 0.00 0.00
Waste Disposal kg 2.90 2.90 2.91 2.91 2.92 2.92 2.93 2.94 2.94 2.95 2.96 2.98 3.00 3.01 3.02 3.04 2.96 2.94 2.88 2.89 2.92 2.96 2.98 3.00 3.02
Miscellaneous kg 0.00 0.00 0.00 0.00 0.00 0.00 0.00 0.00 0.00 0.00 0.00 0.00 0.00 0.00 0.00 0.00 0.00 0.00 0.00 0.00 0.00 0.00 0.00 0.00 0.00
Total kg 2.94 2.94 2.94 2.95 2.95 2.96 2.97 2.97 2.98 3.40 3.41 2.98 3.00 3.01 3.02 3.04 2.96 2.94 2.88 2.89 2.92 2.96 2.98 3.00 3.02

127
Annex 5 (D4): Emissions of pentachlorobenzene to residue (kg per year)
Stockholm
Convention
Categories
Units 1990 1991 1992 1993 1994 1995 1996 1997 1998 1999 2000 2001 2002 2003 2004 2005 2006 2007 2008 2009 2010 2011 2012 2013 2014
Waste
Incineration
kg 2.15 2.12 2.03 1.82 1.42 1.31 1.36 0.35 0.34 0.34 0.33 0.33 0.32 0.27 0.22 0.18 0.13 0.13 0.13 0.12 0.12 0.11 0.09 0.09 0.06
Ferrous and Non
Ferrous Metals
kg 0.00 0.00 0.00 0.00 0.00 0.00 0.00 0.00 0.00 0.00 0.00 0.00 0.00 0.00 0.00 0.00 0.00 0.00 0.00 0.00 0.00 0.00 0.00 0.00 0.00
Heat and Power
generation
kg 0.57 0.59 0.66 0.83 1.20 1.29 1.19 1.42 2.01 1.96 2.06 2.23 2.43 2.47 2.39 2.37 2.64 2.68 2.78 3.34 3.50 3.63 4.47 4.69 4.70
Production of
Mineral Products
kg 0.00 0.00 0.00 0.00 0.00 0.00 0.00 0.00 0.00 0.00 0.00 0.00 0.00 0.00 0.00 0.00 0.00 0.00 0.00 0.00 0.00 0.00 0.00 0.00 0.00
Transportation kg 0.00 0.00 0.00 0.00 0.00 0.00 0.00 0.00 0.00 0.00 0.00 0.00 0.00 0.00 0.00 0.00 0.00 0.00 0.00 0.00 0.00 0.00 0.00 0.00 0.00
Open Burning
Processes
kg 0.00 0.00 0.00 0.00 0.00 0.00 0.00 0.00 0.00 0.00 0.00 0.00 0.00 0.00 0.00 0.00 0.00 0.00 0.00 0.00 0.00 0.00 0.00 0.00 0.00
Production of
chemicals and
consumer goods
kg 0.00 0.00 0.00 0.00 0.00 0.00 0.00 0.00 0.00 0.00 0.00 0.00 0.00 0.00 0.00 0.00 0.00 0.00 0.00 0.00 0.00 0.00 0.00 0.00 0.00
Waste Disposal kg 0.00 0.00 0.00 0.00 0.00 0.00 0.00 0.00 0.00 0.00 0.00 0.00 0.00 0.00 0.00 0.00 0.00 0.00 0.00 0.00 0.00 0.00 0.00 0.00 0.00
Miscellaneous kg 0.00 0.00 0.00 0.00 0.00 0.00 0.00 0.00 0.00 0.00 0.00 0.00 0.00 0.00 0.00 0.00 0.00 0.00 0.00 0.00 0.00 0.00 0.00 0.00 0.00
Total kg 2.73 2.72 2.68 2.65 2.62 2.60 2.56 1.76 2.35 2.30 2.39 2.56 2.75 2.74 2.61 2.55 2.78 2.82 2.91 3.45 3.62 3.73 4.56 4.78 4.76

128
Annex 5 (D5): Emissions of pentachlorobenzene to product (kg per year)
Stockholm
Convention
Categories
Units 1990 1991 1992 1993 1994 1995 1996 1997 1998 1999 2000 2001 2002 2003 2004 2005 2006 2007 2008 2009 2010 2011 2012 2013 2014
Waste
Incineration
kg 0.00 0.00 0.00 0.00 0.00 0.00 0.00 0.00 0.00 0.00 0.00 0.00 0.00 0.00 0.00 0.00 0.00 0.00 0.00 0.00 0.00 0.00 0.00 0.00 0.00
Ferrous and Non
Ferrous Metals
kg 0.00 0.00 0.00 0.00 0.00 0.00 0.00 0.00 0.00 0.00 0.00 0.00 0.00 0.00 0.00 0.00 0.00 0.00 0.00 0.00 0.00 0.00 0.00 0.00 0.00
Heat and Power
generation
kg 0.00 0.00 0.00 0.00 0.00 0.00 0.00 0.00 0.00 0.00 0.00 0.00 0.00 0.00 0.00 0.00 0.00 0.00 0.00 0.00 0.00 0.00 0.00 0.00 0.00
Production of
Mineral Products
kg 0.58 0.59 0.60 0.62 0.63 0.64 0.66 0.50 0.66 0.65 0.68 0.73 0.79 0.79 0.76 0.75 0.80 0.81 0.82 0.96 1.03 1.05 1.27 1.31 1.33
Transportation kg 0.00 0.00 0.00 0.00 0.00 0.00 0.00 0.00 0.00 0.00 0.00 0.00 0.00 0.00 0.00 0.00 0.00 0.00 0.00 0.00 0.00 0.00 0.00 0.00 0.00
Open Burning
Processes
kg 0.00 0.00 0.00 0.00 0.00 0.00 0.00 0.00 0.00 0.00 0.00 0.00 0.00 0.00 0.00 0.00 0.00 0.00 0.00 0.00 0.00 0.00 0.00 0.00 0.00
Production of
chemicals and
consumer goods
kg 0.00 0.00 0.00 0.00 0.00 0.00 0.00 0.00 0.00 0.00 0.00 0.00 0.00 0.00 0.00 0.00 0.00 0.00 0.00 0.00 0.00 0.00 0.00 0.00 0.00
Waste Disposal kg 0.00 0.00 0.00 0.00 0.00 0.00 0.00 0.00 0.00 0.00 0.00 0.00 0.00 0.00 0.00 0.00 0.00 0.00 0.00 0.00 0.00 0.00 0.00 0.00 0.00
Miscellaneous kg 0.00 0.00 0.00 0.00 0.00 0.00 0.00 0.00 0.00 0.00 0.00 0.00 0.00 0.00 0.00 0.00 0.00 0.00 0.00 0.00 0.00 0.00 0.00 0.00 0.00
Total kg 0.58 0.59 0.60 0.62 0.63 0.64 0.66 0.50 0.66 0.65 0.68 0.73 0.79 0.79 0.76 0.75 0.80 0.81 0.82 0.96 1.03 1.05 1.27 1.31 1.33

129
Annex 5 (E1): Emissions of polychlorinated naphthalenes to air (kg per year)
Stockholm
Convention
Categories
Units 1990 1991 1992 1993 1994 1995 1996 1997 1998 1999 2000 2001 2002 2003 2004 2005 2006 2007 2008 2009 2010 2011 2012 2013 2014
Waste Incineration kg 30.41 30.13 28.94 25.75 19.21 16.15 20.79 1.24 1.10 1.10 1.10 1.11 1.11 1.00 0.88 0.76 0.65 0.61 0.54 0.50 0.54 0.53 0.50 0.44 0.45
Ferrous and Non
Ferrous Metals
kg 20.04 17.46 18.37 19.39 20.26 20.86 20.05 21.14 19.12 18.58 17.96 16.79 14.43 14.04 15.83 14.43 14.60 14.66 14.48 10.50 11.46 11.86 10.86 9.94 10.27
Heat and Power
generation
kg 6.35 6.42 7.81 11.21 17.60 17.62 20.76 21.44 22.44 21.71 22.61 24.48 26.47 26.97 25.98 25.79 28.96 29.42 30.62 37.09 39.13 42.57 56.85 51.77 52.92
Production of
Mineral Products
kg 3.14 2.58 2.35 2.38 2.74 2.70 2.76 2.89 2.99 2.86 2.77 2.56 2.44 2.48 2.52 2.44 2.47 2.11 1.98 1.84 1.91 2.06 1.92 1.99 1.99
Transportation kg 0.00 0.00 0.00 0.00 0.00 0.00 0.00 0.00 0.00 0.00 0.00 0.00 0.00 0.00 0.00 0.00 0.00 0.00 0.00 0.00 0.00 0.00 0.00 0.00 0.00
Open Burning
Processes
kg 0.00 0.00 0.00 0.00 0.00 0.00 0.00 0.00 0.00 0.00 0.00 0.00 0.00 0.00 0.00 0.00 0.00 0.00 0.00 0.00 0.00 0.00 0.00 0.00 0.00
Production of
chemicals and
consumer goods
kg 566.98 532.66 500.92 471.50 442.08 414.97 389.91 366.67 345.07 324.95 84.70 79.31 74.62 70.29 66.29 62.56 59.09 55.85 52.81 49.96 47.28 44.76 42.39 40.15 38.04
Waste Disposal kg 0.25 0.26 0.26 0.26 0.26 0.26 0.26 0.26 0.25 0.25 0.25 0.24 0.23 0.22 0.21 0.19 0.28 0.24 0.19 0.15 0.11 0.10 0.09 0.08 0.08
Miscellaneous kg 0.00 0.00 0.00 0.00 0.00 0.00 0.00 0.00 0.00 0.00 0.00 0.00 0.00 0.00 0.00 0.00 0.00 0.00 0.00 0.00 0.00 0.00 0.00 0.00 0.00
Total kg 627.18 589.50 558.65 530.49 502.15 472.56 454.53 413.64 390.98 369.45 129.39 124.48 119.29 114.99 111.70 106.18 106.04 102.88 100.62 100.05 100.43 101.89 112.63 104.37 103.74

130
Annex 5 (E2): Emissions of polychlorinated naphthalenes to land (kg per year)
Stockholm
Convention
Categories
Units 1990 1991 1992 1993 1994 1995 1996 1997 1998 1999 2000 2001 2002 2003 2004 2005 2006 2007 2008 2009 2010 2011 2012 2013 2014
Waste Incineration kg 0.00 0.00 0.00 0.00 0.00 0.00 0.00 0.00 0.00 0.00 0.00 0.00 0.00 0.00 0.00 0.00 0.00 0.00 0.00 0.00 0.00 0.00 0.00 0.00 0.00
Ferrous and Non
Ferrous Metals
kg 0.00 0.00 0.00 0.00 0.00 0.00 0.00 0.00 0.00 0.00 0.00 0.00 0.00 0.00 0.00 0.00 0.00 0.00 0.00 0.00 0.00 0.00 0.00 0.00 0.00
Heat and Power
generation
kg 0.00 0.00 0.00 0.00 0.00 0.00 0.00 0.00 0.00 0.00 0.00 0.00 0.00 0.00 0.00 0.00 0.00 0.00 0.00 0.00 0.00 0.00 0.00 0.00 0.00
Production of
Mineral Products
kg 0.00 0.00 0.00 0.00 0.00 0.00 0.00 0.00 0.00 0.00 0.00 0.00 0.00 0.00 0.00 0.00 0.00 0.00 0.00 0.00 0.00 0.00 0.00 0.00 0.00
Transportation kg 0.00 0.00 0.00 0.00 0.00 0.00 0.00 0.00 0.00 0.00 0.00 0.00 0.00 0.00 0.00 0.00 0.00 0.00 0.00 0.00 0.00 0.00 0.00 0.00 0.00
Open Burning
Processes
kg 0.00 0.00 0.00 0.00 0.00 0.00 0.00 0.00 0.00 0.00 0.00 0.00 0.00 0.00 0.00 0.00 0.00 0.00 0.00 0.00 0.00 0.00 0.00 0.00 0.00
Production of
chemicals and
consumer goods
kg 2043.54 1842.16 1667.10 1514.35 1361.61 1231.18 1119.06 1022.00 937.40 863.15 284.99 254.75 229.67 208.27 189.89 173.99 160.12 147.96 137.20 127.63 119.04 111.31 104.29 97.89 92.03
Waste Disposal kg 25.40 25.20 24.48 24.24 25.08 26.52 25.28 32.20 28.63 28.87 27.13 36.11 39.27 41.71 40.23 36.22 30.29 27.21 24.08 18.28 14.00 10.02 5.31 5.67 5.67
Miscellaneous kg 0.00 0.00 0.00 0.00 0.00 0.00 0.00 0.00 0.00 0.00 0.00 0.00 0.00 0.00 0.00 0.00 0.00 0.00 0.00 0.00 0.00 0.00 0.00 0.00 0.00
Total kg 2068.94 1867.36 1691.58 1538.59 1386.69 1257.70 1144.34 1054.20 966.03 892.03 312.12 290.86 268.94 249.99 230.12 210.20 190.42 175.17 161.28 145.91 133.04 121.33 109.60 103.56 97.69

131
Annex 5 (E3): Emissions of polychlorinated naphthalenes to water (kg per year)
No emissions have been reported to water for polychlorinated naphthalenes.
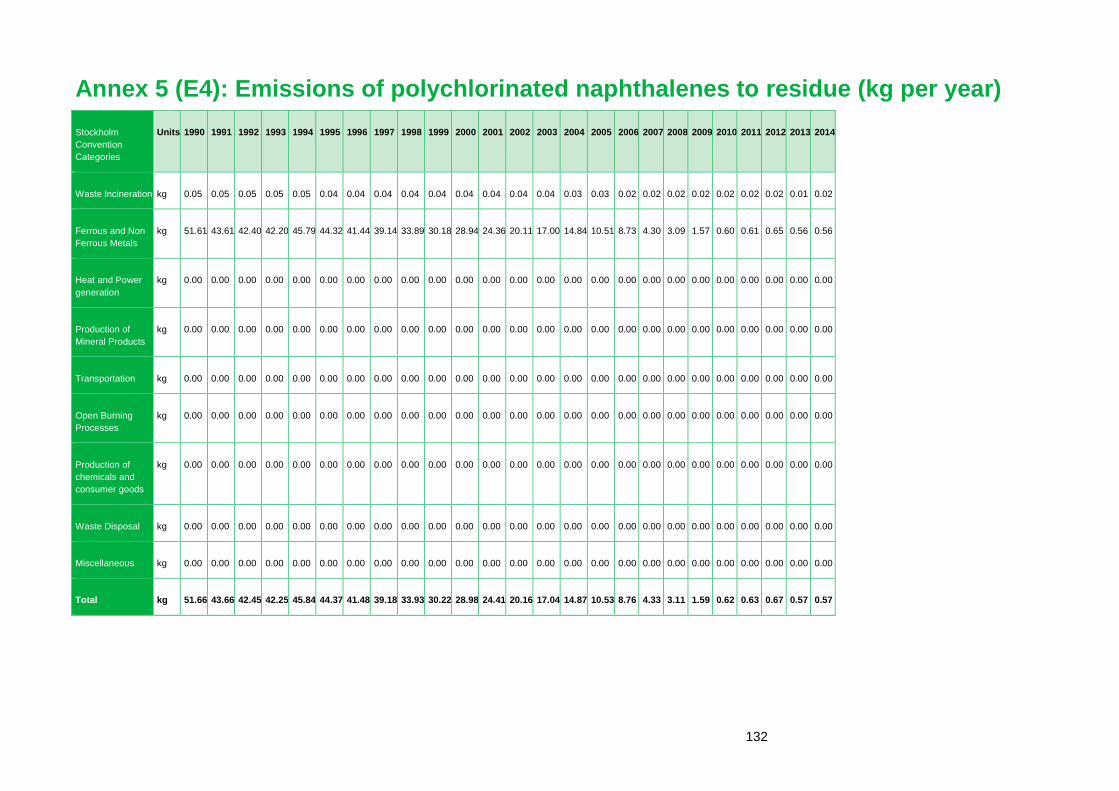
132
Annex 5 (E4): Emissions of polychlorinated naphthalenes to residue (kg per year)
Stockholm
Convention
Categories
Units 1990 1991 1992 1993 1994 1995 1996 1997 1998 1999 2000 2001 2002 2003 2004 2005 2006 2007 2008 2009 2010 2011 2012 2013 2014
Waste Incineration kg 0.05 0.05 0.05 0.05 0.05 0.04 0.04 0.04 0.04 0.04 0.04 0.04 0.04 0.04 0.03 0.03 0.02 0.02 0.02 0.02 0.02 0.02 0.02 0.01 0.02
Ferrous and Non
Ferrous Metals
kg 51.61 43.61 42.40 42.20 45.79 44.32 41.44 39.14 33.89 30.18 28.94 24.36 20.11 17.00 14.84 10.51 8.73 4.30 3.09 1.57 0.60 0.61 0.65 0.56 0.56
Heat and Power
generation
kg 0.00 0.00 0.00 0.00 0.00 0.00 0.00 0.00 0.00 0.00 0.00 0.00 0.00 0.00 0.00 0.00 0.00 0.00 0.00 0.00 0.00 0.00 0.00 0.00 0.00
Production of
Mineral Products
kg 0.00 0.00 0.00 0.00 0.00 0.00 0.00 0.00 0.00 0.00 0.00 0.00 0.00 0.00 0.00 0.00 0.00 0.00 0.00 0.00 0.00 0.00 0.00 0.00 0.00
Transportation kg 0.00 0.00 0.00 0.00 0.00 0.00 0.00 0.00 0.00 0.00 0.00 0.00 0.00 0.00 0.00 0.00 0.00 0.00 0.00 0.00 0.00 0.00 0.00 0.00 0.00
Open Burning
Processes
kg 0.00 0.00 0.00 0.00 0.00 0.00 0.00 0.00 0.00 0.00 0.00 0.00 0.00 0.00 0.00 0.00 0.00 0.00 0.00 0.00 0.00 0.00 0.00 0.00 0.00
Production of
chemicals and
consumer goods
kg 0.00 0.00 0.00 0.00 0.00 0.00 0.00 0.00 0.00 0.00 0.00 0.00 0.00 0.00 0.00 0.00 0.00 0.00 0.00 0.00 0.00 0.00 0.00 0.00 0.00
Waste Disposal kg 0.00 0.00 0.00 0.00 0.00 0.00 0.00 0.00 0.00 0.00 0.00 0.00 0.00 0.00 0.00 0.00 0.00 0.00 0.00 0.00 0.00 0.00 0.00 0.00 0.00
Miscellaneous kg 0.00 0.00 0.00 0.00 0.00 0.00 0.00 0.00 0.00 0.00 0.00 0.00 0.00 0.00 0.00 0.00 0.00 0.00 0.00 0.00 0.00 0.00 0.00 0.00 0.00
Total kg 51.66 43.66 42.45 42.25 45.84 44.37 41.48 39.18 33.93 30.22 28.98 24.41 20.16 17.04 14.87 10.53 8.76 4.33 3.11 1.59 0.62 0.63 0.67 0.57 0.57

133
Annex 5 (E5): Emissions of polychlorinated naphthalenes to product (kg per year)
Stockholm
Convention
Categories
Units 1990 1991 1992 1993 1994 1995 1996 1997 1998 1999 2000 2001 2002 2003 2004 2005 2006 2007 2008 2009 2010 2011 2012 2013 2014
Waste Incineration kg 0.00 0.00 0.00 0.00 0.00 0.00 0.00 0.00 0.00 0.00 0.00 0.00 0.00 0.00 0.00 0.00 0.00 0.00 0.00 0.00 0.00 0.00 0.00 0.00 0.00
Ferrous and Non
Ferrous Metals
kg 0.00 0.00 0.00 0.00 0.00 0.00 0.00 0.00 0.00 0.00 0.00 0.00 0.00 0.00 0.00 0.00 0.00 0.00 0.00 0.00 0.00 0.00 0.00 0.00 0.00
Heat and Power
generation
kg 0.00 0.00 0.00 0.00 0.00 0.00 0.00 0.00 0.00 0.00 0.00 0.00 0.00 0.00 0.00 0.00 0.00 0.00 0.00 0.00 0.00 0.00 0.00 0.00 0.00
Production of
Mineral Products
kg 13.74 14.45 17.12 20.43 26.30 29.97 32.83 36.22 36.55 37.98 42.76 42.31 41.42 41.94 44.52 38.88 41.43 26.78 27.84 24.45 28.10 26.21 26.92 25.40 25.40
Transportation kg 0.00 0.00 0.00 0.00 0.00 0.00 0.00 0.00 0.00 0.00 0.00 0.00 0.00 0.00 0.00 0.00 0.00 0.00 0.00 0.00 0.00 0.00 0.00 0.00 0.00
Open Burning
Processes
kg 0.00 0.00 0.00 0.00 0.00 0.00 0.00 0.00 0.00 0.00 0.00 0.00 0.00 0.00 0.00 0.00 0.00 0.00 0.00 0.00 0.00 0.00 0.00 0.00 0.00
Production of
chemicals and
consumer goods
kg 0.00 0.00 0.00 0.00 0.00 0.00 0.00 0.00 0.00 0.00 0.00 0.00 0.00 0.00 0.00 0.00 0.00 0.00 0.00 0.00 0.00 0.00 0.00 0.00 0.00
Waste Disposal kg 0.00 0.00 0.00 0.00 0.00 0.00 0.00 0.00 0.00 0.00 0.00 0.00 0.00 0.00 0.00 0.00 0.00 0.00 0.00 0.00 0.00 0.00 0.00 0.00 0.00
Miscellaneous kg 0.00 0.00 0.00 0.00 0.00 0.00 0.00 0.00 0.00 0.00 0.00 0.00 0.00 0.00 0.00 0.00 0.00 0.00 0.00 0.00 0.00 0.00 0.00 0.00 0.00
Total kg 13.74 14.45 17.12 20.43 26.30 29.97 32.83 36.22 36.55 37.98 42.76 42.31 41.42 41.94 44.52 38.88 41.43 26.78 27.84 24.45 28.10 26.21 26.92 25.40 25.40