NATIONAL HURRICANE CENTER CENTRAL PACIFIC HURRICANE CENTER ... - · PDF filenational hurricane...
17
NATIONAL HURRICANE CENTER CENTRAL PACIFIC HURRICANE CENTER TROPICAL CYCLONE REPORT TROPICAL STORM FLOSSIE (EP062013) 25 – 30 July 2013 John P. Cangialosi National Hurricane Center Derek Wroe Central Pacific Hurricane Center 4 November 2013 NOAA GOES-15 SATELLITE IMAGE OF TROPICAL STORM FLOSSIE AT 0130 UTC 27 JULY 2013. Flossie was a tropical storm that formed in the eastern North Pacific, and then moved into the central Pacific basin where it produced gusty winds and heavy rains over the Hawaiian Islands.
Transcript of NATIONAL HURRICANE CENTER CENTRAL PACIFIC HURRICANE CENTER ... - · PDF filenational hurricane...

NATIONAL HURRICANE CENTER CENTRAL PACIFIC HURRICANE CENTER
TROPICAL CYCLONE REPORT
TROPICAL STORM FLOSSIE
(EP062013) 25 – 30 July 2013
John P. Cangialosi National Hurricane Center
Derek Wroe Central Pacific Hurricane Center
4 November 2013
NOAA GOES-15 SATELLITE IMAGE OF TROPICAL STORM FLOSSIE AT 0130 UTC 27 JULY 2013.
Flossie was a tropical storm that formed in the eastern North Pacific, and then moved into the
central Pacific basin where it produced gusty winds and heavy rains over the Hawaiian Islands.

Tropical Storm Flossie 2
Tropical Storm Flossie
25 – 30 JULY 2013
SYNOPTIC HISTORY
The genesis of Flossie appears to be partly associated with a tropical wave that moved
off the west coast of Africa on 9 July. The wave traveled westward across the Atlantic basin at
15 to 20 kt, and moved over Central America on 18 July. Thunderstorm activity gradually
increased near the wave axis during the next several days while it moved south of Mexico. On
24 July, when the disturbance was located well to the south-southwest of the Baja California
peninsula, the thunderstorm activity consolidated and gained organization; however, data from
the European Space Agency’s Advanced Scatterometer (ASCAT) indicated that the system did
not have a well-defined center of circulation at that time. Visible satellite imagery and
microwave data indicated that the circulation became better defined late on 24 July, and it is
estimated that a tropical depression formed by 0000 UTC 25 July, when it was located about
850 n mi west-southwest of the southern tip of the Baja California peninsula. The depression
strengthened to a tropical storm 6 h later. The “best track” chart of Flossie’s path is given in Fig.
1, with the wind and pressure histories shown in Figs. 2 and 3, respectively. The best track
positions and intensities are listed in Table 11.
Flossie gradually strengthened over the next couple of days while it moved westward
over relatively warm water and within a low wind shear environment. The tropical storm
reached its peak intensity of 60 kt by 1200 UTC 27 July when it was located just east of 140°W
longitude. At that time, an eye became apparent in microwave images (Fig. 4), with a
corresponding warm spot in geostationary infrared imagery. The tropical storm moved into the
area of responsibility of the Central Pacific Hurricane Center (CPHC) a few hours later. Shortly
after crossing 140°W, Flossie briefly weakened to an intensity of 50 kt when a narrow upper-
level trough developed to its west and imparted southwesterly vertical wind shear over the
cyclone. As the trough weakened, deep convection increased around the center of Flossie,
leading to a short period of re-intensification between 0600 and 1200 UTC 28 July.
A gradual weakening trend resumed late on 28 July and accelerated on 29 July. As
Flossie moved westward, it encountered northwesterly vertical wind shear produced by an
anticyclone aloft over the Hawaiian Islands. The shear began to significantly disrupt the upper-
level outflow of Flossie and displaced the associated deep convection to the south of the center
(Fig. 5). Under persistent northwesterly vertical wind shear, Flossie weakened to a tropical
depression at 0000 UTC 30 July when the system was centered about 20 n mi northeast of the
Island of Maui, and it degenerated to a post-tropical remnant low at 1200 UTC 30 July near the
northern coast of the Island of Kauai.
1 A digital record of the complete best track, including wind radii, can be found on line at
ftp://ftp.nhc.noaa.gov/atcf. Data for the current year’s storms are located in the btk directory, while previous years’ data are located in the archive directory.

Tropical Storm Flossie 3
METEOROLOGICAL STATISTICS
Observations in Flossie (Figs. 2 and 3) include subjective satellite-based Dvorak
technique intensity estimates from the Tropical Analysis and Forecast Branch (TAFB), the
Satellite Analysis Branch (SAB), CPHC, Joint Typhoon Warning Center (JTWC) and objective
Advanced Dvorak Technique (ADT) estimates from the Cooperative Institute for Meteorological
Satellite Studies/University of Wisconsin-Madison. Data and imagery from NOAA polar-orbiting
satellites including the Advanced Microwave Sounding Unit (AMSU), the NASA Tropical Rainfall
Measuring Mission (TRMM), ASCAT, NASA/NOAA Joint Polar Satellite System Suomi National
Polar-orbiting Partnership, and Defense Meteorological Satellite Program (DMSP) satellites,
among others, were also useful in constructing the best track of Flossie. The estimated peak
intensity of 60 kt is based on Dvorak satellite estimates from TAFB and SAB.
No ship or land reports of winds of tropical storm force associated with Flossie were
received. The highest sustained wind measured on land at an official observing site was 31 kt
at Keahole Airport in Kailua-Kona, Hawaii, and the highest official wind gust was 43 kt at
Kahului Airport in Kahului, Hawaii. Selected surface observations are given in Table 2.
Flossie produced rainfall totals of generally 1.5 to 4 inches over the Hawaiian Islands.
The highest report was on Mount Waialeale on the Island of Kauai, where a storm total of 9.27
inches was recorded. Selected rainfall totals are given in Table 2.
High surf in excess of 15 feet affected east-facing shores of the Main Hawaiian Islands
with minor coastal inundation reported.
CASUALTY AND DAMAGE STATISTICS Flossie caused minor damage on the Hawaiian Islands, mainly across Maui and Hawaii
Counties on 29 and 30 July. On the Island of Maui, one man suffered injuries when lightning
struck and damaged his home. Power outages affected more than 10,000 homes on the
Islands of Maui and Hawaii due to lightning strikes and gusty winds downing trees.
FORECAST AND WARNING CRITIQUE
The development of Flossie was generally well predicted. The disturbance from which
Flossie formed was introduced in the National Hurricane Center’s Tropical Weather Outlook at
1200 UTC 21 July, about 84 h before genesis occurred. Initially, the disturbance was assessed
to have a low chance (<30%) of development during the next 48 h. The chance of development
was raised to the medium category (30 to 50%) at 0000 UTC 23 July, 48 h before genesis, and
to the high category (>50%) 6 h before formation occurred.

Tropical Storm Flossie 4
A verification of NHC official track forecasts for Flossie is given in Table 3a. Official
forecast track errors were greater than the mean official errors for the previous 5-yr period at all
forecast times. A homogeneous comparison of the NHC official track errors with selected
guidance models is given in Table 3b. The Global Forecast System (GFSI) and its ensemble
mean (AEMI) were among the best performing models for Flossie. The simpler Beta and
Advection Model shallow layer (BAMS) also performed well.
A homogeneous comparison of CPHC official track errors with selected guidance
models for Flossie is given in Table 3c. The United Kingdom Meteorological Office model
(EGRI) had smaller average errors than the CPHC official forecasts beyond 12 h, while the
TVCE consensus outperformed the official forecasts in the 12 to 48 h range. Otherwise, CPHC
official track errors were better than or comparable to nearly all of the guidance.
A verification of NHC official intensity forecasts for Flossie is given in Table 4a. NHC
forecast intensity errors were much lower than the mean official errors for the previous 5-yr
period. A homogeneous comparison of the NHC official intensity errors with selected guidance
models is given in Table 4b. The statistical-dynamical models and consensus aids
outperformed the dynamical models at most of the forecast times.
A homogeneous comparison of CPHC official intensity errors with selected guidance
models for Flossie is given in Table 4c. The HWRF model (HWFI) had smaller average errors
than the CPHC forecasts beyond 12 h. Otherwise, CPHC official intensity errors were better
than or comparable to nearly all of the guidance.
Coastal watches and warnings associated with Flossie are given in Table 5. This event
marked the first occasion for which tropical storm watches had been issued for the Main
Hawaiian Islands since Tropical Storm Felicia in 2009, and the first time tropical storm warnings
had been issued since Tropical Storm Flossie in 2007. The initial tropical storm watch was
issued at 0300 UTC 28 July for the Islands of Hawaii, Maui, Molokai, Lanai, and Kahoolawe,
with tropical storm watches expanding westward that day to Oahu at 0900 UTC and to the
Islands of Kauai and Niihau at 2100 UTC. Tropical storm warnings were first posted for the
Islands of Hawaii, Maui, Molokai, Lanai, and Kahoolawe at 0900 UTC 28 July, with tropical
storm warnings expanding westward to Oahu at 2100 UTC that day and to the Islands of Kauai
and Niihau at 1500 UTC 29 July. Since Flossie weakened when it approached the Hawaiian
Islands, tropical storm conditions did not occur in the warning area, and all tropical storm
warnings were discontinued by 0300 UTC 30 July.

Tropical Storm Flossie 5
Table 1. Best track for Tropical Storm Flossie, 25-30 July 2013.
Date/Time (UTC)
Latitude (°N)
Longitude (°W)
Pressure (mb)
Wind Speed (kt)
Stage
25 / 0000 14.9 121.8 1005 30 tropical depression
25 / 0600 14.9 123.5 1004 35 tropical storm
25 / 1200 14.9 125.2 1003 35 "
25 / 1800 15.0 126.8 1002 40 "
26 / 0000 15.2 128.4 1001 40 "
26 / 0600 15.5 130.0 1000 45 "
26 / 1200 15.9 131.6 999 45 "
26 / 1800 16.3 133.3 998 50 "
27 / 0000 16.7 135.0 997 50 "
27 / 0600 17.1 136.6 996 55 "
27 / 1200 17.7 138.4 994 60 "
27 / 1800 18.4 140.2 996 55 "
28 / 0000 18.9 142.3 999 50 "
28 / 0600 19.3 144.3 999 50 "
28 / 1200 19.7 146.0 998 55 "
28 / 1800 19.8 147.7 1000 50 "
29 / 0000 19.7 149.4 1001 50 "
29 / 0600 19.9 151.1 1002 45 "
29 / 1200 20.2 152.7 1004 40 "
29 / 1800 20.5 154.2 1006 35 "
30 / 0000 21.0 155.7 1007 30 tropical depression
30 / 0600 21.8 157.4 1009 30 "
30 / 1200 22.3 159.4 1011 25 low
30 / 1800 dissipated
27 / 1200 17.7 138.4 994 60 maximum winds and
minimum pressure

Tropical Storm Flossie 6
Table 2. Selected surface observations in the Hawaiian Islands associated with Tropical
Storm Flossie.
Location
(State of Hawaii)
Minimum Sea Level Pressure
Maximum Surface
Wind Speed Total
rain
(in)
Date/
time
(UTC)
Press.
(mb)
Date/
time
(UTC)a
Sustained
(kt)
Gust
(kt)
International Civil Aviation Organization
(ICAO) Sites
Hilo (PHTO) 29/1653 1009.8 29/2153 23 33
Kailua-Kona (PHKO) 29/2353 1010.5 30/0118 31 37
Lanai City (PHNY) 30/0156 1008.5 29/2106 28 35
Kahului (PHOG) 30/0154 1008.7 30/0454 28 43
Kalaeloa (PHJH) 30/0253 1010.8 30/0953 25 29
Honolulu (PHNL) 31/0053 1017.0 31/0053 22 28
Non-METAR Observations
Kula 1 (KLFH1) 30/0448 21 38
Kaneloa (KAOH1) 29/1953 27 41
Honokanaia (HKAH1) 30/0353 20 46
Hakioawa (HKIH1) 30/0452 29 46
PTA East (PTAH1) 28/1959 24 32
PTA Range 17 (PTRH1) 30/1749 20 35
Kaupo Gap (KPGH1) 30/0435 17 33 5.27
Kula 1 (KLFH1) 30/0448 21 38 2.26
Lanai 1 (LNIH1) 29/1637 29 43
Marine Observations
Hilo (ILOH1)
19.73°N 155.06°W 29/2130 1009.9 29/2154 25 36
Kahului Bay (KLIH1)
20.90°N 156.47°W 30/0224 1007.8 30/0448 26 37
Kawaihae (KWHH1)
20.03°N 155.83°W 30/0118 1009.1 30/0118 21 26
Other
Mount Waialeale (WLLH1) 9.27
Kilohana RG (KLOH1) 4.75
Tropical Storm Flossie 7
Puu Kukui (PKKH1) 4.68
Kepuni USGS (KPNH1) 4.07
Puu Alii (PAFH1) 4.05
Ulupalakua Ranch (ULUH1) 3.63
Oahu Forest NWR (OFRH1) 3.32
Kawainui Stream (KWSH1) 3.21
Wailua Ditch (WLDH1) 3.15
Molokai 1 (MLKH1) 3.11
Waialae Ridge (WLGH1) 2.94
Mohihi Crossing (MCRH1) 2.89
Poamoho RG 1 (PMHH1) 2.53
Kamuela Upper (KUUH1) 2.52
Wainiha River (WNHH1) 2.12
Waiakoali (WKRH1) 2.05
Punaluu Stream (PNSH1) 2.02
Manoa Lyon Arboretum (MNLH1)
2.01
a Date/time is for sustained wind when both sustained and gust are listed.
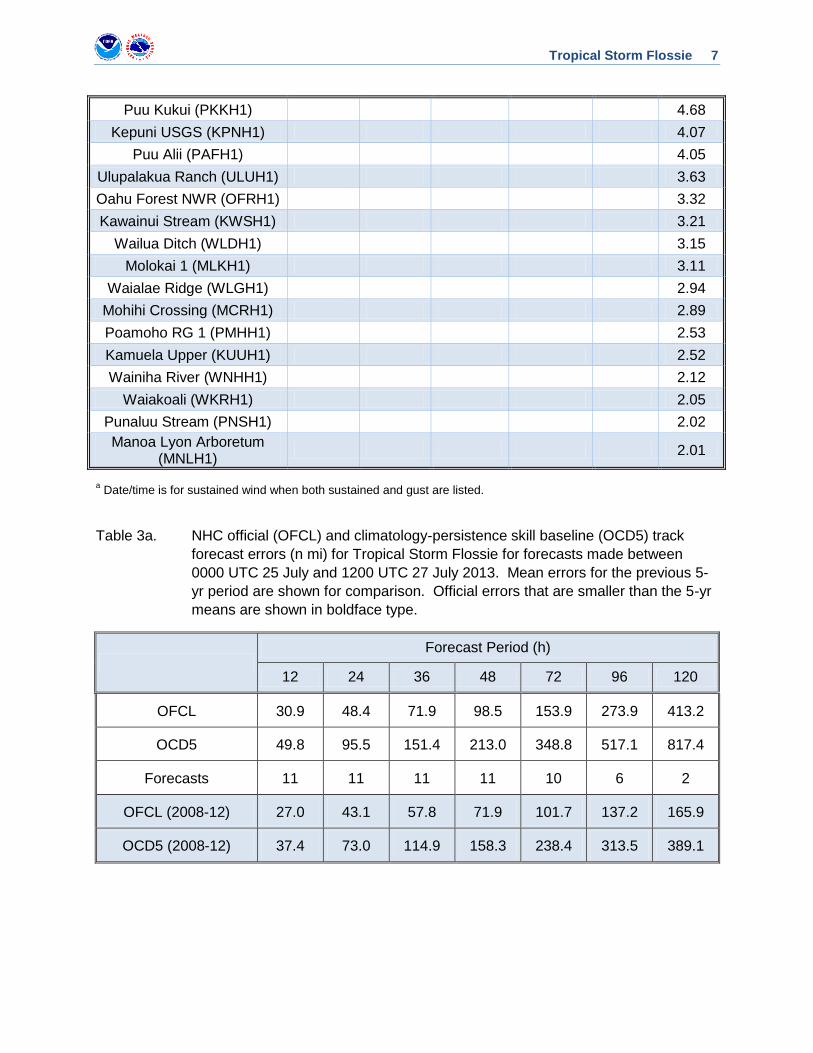
Table 3a. NHC official (OFCL) and climatology-persistence skill baseline (OCD5) track
forecast errors (n mi) for Tropical Storm Flossie for forecasts made between
0000 UTC 25 July and 1200 UTC 27 July 2013. Mean errors for the previous 5-
yr period are shown for comparison. Official errors that are smaller than the 5-yr
means are shown in boldface type.
Forecast Period (h)
12 24 36 48 72 96 120
OFCL 30.9 48.4 71.9 98.5 153.9 273.9 413.2
OCD5 49.8 95.5 151.4 213.0 348.8 517.1 817.4
Forecasts 11 11 11 11 10 6 2
OFCL (2008-12) 27.0 43.1 57.8 71.9 101.7 137.2 165.9
OCD5 (2008-12) 37.4 73.0 114.9 158.3 238.4 313.5 389.1

Tropical Storm Flossie 8
Table 3b. Homogeneous comparison of NHC official forecasts with selected track forecast
guidance models (in n mi) for Tropical Storm Flossie for forecasts made between
0000 UTC 25 July and 1200 UTC 27 July 2013. Errors smaller than the NHC
official forecast are shown in boldface type. The number of official forecasts
shown here will generally be smaller than that shown in Table 3a due to the
homogeneity requirement.
Model ID Forecast Period (h)
12 24 36 48 72 96 120
OFCL 28.7 45.9 70.9 95.2 138.8
OCD5 46.7 88.8 144.9 207.6 312.7
GFSI 26.4 39.9 60.2 82.3 124.8
GHMI 27.2 47.3 61.3 72.7 128.0
HWFI 29.6 43.0 61.4 81.2 158.7
EGRI 30.4 38.7 52.4 74.4 121.0
EMXI 27.1 46.5 72.0 100.5 160.4
CMCI 34.0 53.1 75.6 90.2 143.0
AEMI 24.1 37.4 59.3 82.0 137.5
FSSE 28.6 42.0 60.7 79.2 136.0
TVCE 24.3 32.3 44.4 57.2 106.5
LBAR 35.6 49.3 78.0 109.5 152.5
BAMS 34.5 38.1 48.8 64.3 57.0
BAMM 32.0 52.7 71.3 93.6 117.7
BAMD 40.1 69.1 106.4 149.5 223.3
NAMI 48.2 73.6 87.9 111.3 176.6
Forecasts 9 9 9 8 6

Tropical Storm Flossie 9
Table 3c. Homogeneous comparison of CPHC official forecasts with selected track forecast
guidance models (in n mi) for Tropical Storm Flossie for forecasts made after
1200 UTC 27 July 2013. Errors smaller than the CPHC official forecast are
shown in boldface type.
Model ID Forecast Period (h)
12 24 36 48 72 96 120
OFCL 27.6 38.6 47.7 72.2
GFSI 32.2 46.9 64.4 112.2
GHMI 30.5 49.1 76.6 123.5
HWFI 28.7 42.3 62.0 124.4
EGRI 32.6 33.2 36.8 53.5
EMXI 28.4 42.0 26.6 38.0
CMCI 33.4 52.4 60.6 65.3
AEMI 31.5 40.9 54.4 94.6
TVCE 24.9 34.1 40.6 79.7
LBAR 45.2 71.8 65.6 81.6
BAMS 37.9 69.3 92.7 87.6
BAMM 42.7 60.2 78.3 117.9
BAMD 53.9 88.9 107.2 141.3
Forecasts 9 7 5 3

Tropical Storm Flossie 10
Table 4a. NHC official (OFCL) and climatology-persistence skill baseline (OCD5) intensity
forecast errors (kt) for Tropical Storm Flossie for forecasts made between 0000
UTC 25 July and 1200 UTC 27 July 2013. Mean errors for the previous 5-yr
period are shown for comparison. Official errors that are smaller than the 5-yr
means are shown in boldface type.
Forecast Period (h)
12 24 36 48 72 96 120
OFCL 5.0 5.9 5.9 8.2 8.5 6.7 0.0
OCD5 5.0 6.1 7.5 8.4 6.4 13.0 7.0
Forecasts 11 11 11 11 10 6 2
OFCL (2008-12) 6.3 10.5 13.4 14.5 15.3 17.0 17.3
OCD5 (2008-12) 7.6 12.5 16.5 18.8 20.4 20.3 20.6
Table 4b. Homogeneous comparison of NHC official forecasts with selected intensity
forecast guidance models (in kt) for Tropical Storm Flossie for forecasts made
between 0000 UTC 25 July and 1200 UTC 27 July 2013. Errors smaller than the
NHC official forecast are shown in boldface type. The number of official forecasts
shown here will generally be smaller than that shown in Table 4a due to the
homogeneity requirement.
Model ID Forecast Period (h)
12 24 36 48 72 96 120
OFCL 5.0 6.0 6.0 8.5 8.9 5.0
OCD5 5.5 6.4 7.0 7.4 6.0 12.5
GHMI 4.5 7.6 13.1 13.2 7.1 11.3
HWFI 5.3 4.0 5.7 9.4 11.8 6.3
DSHP 5.2 5.3 4.6 5.0 4.8 6.5
LGEM 5.2 4.1 7.6 8.6 10.4 9.5
FSSE 5.6 4.6 6.4 6.4 8.2 5.3
ICON 4.6 3.3 6.9 7.8 8.8 9.0
Forecasts 10 10 10 10 9 4

Tropical Storm Flossie 11
Table 4c. Homogeneous comparison of CPHC official forecasts with selected intensity
forecast guidance models (in kt) for Tropical Storm Flossie for forecasts made
after 1200 UTC 27 July 2013. Errors smaller than the CPHC official forecast are
shown in boldface type.
Model ID Forecast Period (h)
12 24 36 48 72 96 120
OFCL 4.4 7.9 7.0 3.3
GHMI 6.3 8.1 6.2 4.0
HWFI 5.8 6.4 4.8 1.0
DSHP 5.2 9.4 10.6 6.0
LGEM 6.7 11.7 12.8 8.7
ICON 5.4 8.1 7.2 3.0
Forecasts 9 7 5 3

Tropical Storm Flossie 12
Table 5. Watch and warning summary for Tropical Storm Flossie, 25-30 July 2013.
Date/Time (UTC)
Action Location
28 / 0300 Tropical Storm Watch issued Islands of Hawaii, Maui, Molokai, Lanai, and Kahoolawe
28 / 0900 Tropical Storm Watch issued Island of Oahu
28 / 0900 Tropical Storm Watch changed to Tropical Storm Warning
Islands of Hawaii, Maui, Molokai, Lanai, and Kahoolawe
28 / 2100 Tropical Storm Watch issued Islands of Kauai and Niihau
28 / 2100 Tropical Storm Watch changed to Tropical Storm Warning Island of Oahu
29 / 1500 Tropical Storm Watch changed to Tropical Storm Warning Island of Kauai
30 / 0300 Tropical Storm Warning discontinued All islands

Tropical Storm Flossie 13
Figure 1. Best track positions for Tropical Storm Flossie, 25-30 July 2013. Track west of 140°W longitude was produced by the Central
Pacific Hurricane Center.

Tropical Storm Flossie 14
Figure 2. Selected wind observations and best track maximum sustained surface wind speed curve for Tropical Storm Flossie, 25-30
July 2013. Advanced Dvorak Technique estimates represent the Current Intensity at the nominal observation time. AMSU
intensity estimates are from the Cooperative Institute for Meteorological Satellite Studies technique. Dashed vertical lines
correspond to 0000 UTC. Best track data after 1200 UTC 27 July were produced by the Central Pacific Hurricane Center.

Tropical Storm Flossie 15
Figure 3. Selected pressure observations and best track minimum central pressure curve for Tropical Storm Flossie, 25-30 July 2013.
Advanced Dvorak Technique estimates represent the Current Intensity at the nominal observation time. AMSU intensity
estimates are from the Cooperative Institute for Meteorological Satellite Studies technique. KZC P-W refers to pressure
estimates derived using the Knaff-Zehr-Courtney pressure-wind relationship. Dashed vertical lines correspond to 0000 UTC.
Best track data after 1200 UTC 27 July were produced by the Central Pacific Hurricane Center.

Tropical Storm Flossie 16
Figure 4. SSMI/S microwave (85-GHz) color composite image at 0459 UTC 27 July, around the time of peak intensity. Image courtesy
of Fleet Numerical Meteorology and Oceanography Center.

Tropical Storm Flossie 17
Figure 5. VIIRS Day/Night Band image at 1100 UTC 29 July used to find system center at night. Image courtesy of the Cooperative
Institute for Meteorological Satellite Studies at the University of Wisconsin-Madison.