NATIONAL HOTEL ISSUES AND TRENDS - City of … · 2009-02-12 · Downtown Madison Convention Hotel...
17
Downtown Madison Convention Hotel Study Chapter 4 Page 1 C HAPTER 4 N ATIONAL H OTEL I SSUES AND T RENDS National hotel market trends are important to the development prospects of any hotel, whether it involves macro supply and demand issues, amenity trends, financing trends, or other trends impacting the industry. HSP reviews several areas of the industry that puts the proposed project in perspective and could influence some of the recommendations. U.S. Lodging Industry The U.S. lodging industry has experienced strong expansion with the growth of the travel industry. The table below shows selected characteristics of the U.S. lodging industry from 1992 through 2007.
Transcript of NATIONAL HOTEL ISSUES AND TRENDS - City of … · 2009-02-12 · Downtown Madison Convention Hotel...

Downtown Madison Convention Hotel Study Chapter 4 Page 1
CHAPTER 4 NATIONAL HOTEL ISSUES AND TRENDS
National hotel market trends are important to the development prospects of any hotel, whether it involves macro supply and demand issues, amenity trends, financing trends, or other trends impacting the industry. HSP reviews several areas of the industry that puts the proposed project in perspective and could influence some of the recommendations.
U.S. Lodging Industry
The U.S. lodging industry has experienced strong expansion with the growth of the travel industry.
The table below shows selected characteristics of the U.S. lodging industry from 1992 through 2007.

Downtown Madison Convention Hotel Study Chapter 4 Page 2
Table 4-1
National Lodging Industry Annual Summary
Year Occupancy Change
Average
Daily
Rate Change
Revenue
per
Available
Room Change
1992 61.9% -- $59.62 -- $36.90 --
1993 63.1% 1.9% $61.30 2.8% $38.68 4.8%
1994 64.7% 2.5% $64.24 4.8% $41.56 7.5%
1995 65.1% 0.6% $67.17 4.6% $43.73 5.2%
1996 65.0% -0.2% $70.81 5.4% $46.03 5.3%
1997 64.5% -0.8% $75.31 6.4% $48.57 5.5%
1998 63.8% -1.1% $78.15 3.8% $49.86 2.6%
1999 63.1% -1.1% $81.29 4.0% $51.29 2.9%
2000 63.5% 0.6% $85.24 4.9% $54.13 5.5%
2001 59.8% -5.8% $84.45 -0.9% $50.50 -6.7%
2002 59.0% -1.3% $83.20 -1.5% $49.09 -2.8%
2003 59.2% 0.3% $83.28 0.1% $49.30 0.4%
2004 61.3% 3.5% $86.70 4.1% $53.15 7.8%
2005 63.1% 2.9% $91.29 5.3% $57.61 8.4%
2006 64.2% 1.7% $96.77 6.0% $62.13 7.8%
2007 64.1% -0.2% $102.38 5.8% $65.63 5.6% Compound
Annual
Growth Rate 0.2% 3.7% 3.9%
Source: Smith Travel Research, HSP
Occupancy peaked at an all-time high of 65.1 percent in 1995 and recently was as high as 64.2 percent in 2006. After 9/11 and the recession, occupancy decreased to 59 percent, before rebounding to the 64 percent range. The HSP outlook for 2008 is a decrease in occupancy of up to 1.5 percentage points. Average daily rate (ADR) increased at an average annual rate of 3.7 percent during the period, outpacing inflation (when food and energy are not counted). The last four years have exhibited strong ADR growth from four to six percent. Rate growth is expected to be low in 2008, according to HSP projections. Revenue per available room (RevPar) increased by record amounts in 2004, 2005 and 2006 and was strong in 2007. RevPAR is expected to be flat or negative in 2008 based on overall economic conditions (as it is the product of occupancy and rate). Smith Travel Research expects occupancy to decrease in 2008 and decrease further in 2009, although ADR is expected to increase slightly in 2008 and be stable in 2009.

Downtown Madison Convention Hotel Study Chapter 4 Page 3
Based on the data in the table above, there appears to be a breakpoint at 60 percent national occupancy, above which ADR and RevPAR increase, and below which ADR and RevPAR decline.
The figure below shows the above data in graph form, highlighting the annual change in performance.
Figure 4-1
As the above graph indicates for the years 1996 through 1999, and in 2007, even when occupancy declines, average daily rates can increase. This speaks to the concept of maximum practical occupancy. At a certain average occupancy, there are enough ‘sold-out’ dates and demand pressure to raise prices.
The figure below shows annual changes in supply and demand.

Downtown Madison Convention Hotel Study Chapter 4 Page 4
Figure 4-2
The figure shows that the increase in demand had outpaced the increase in supply in the years 2004 through 2006. However, the change in supply was much higher than the change in demand in 2007 and that trend is projected to continue into 2008. This should result in lower occupancy rates, which hurt the industry’s performance, especially if rates begin to decline.
The figure below shows average daily rate (ADR) change over time.
Figure 4-3

Downtown Madison Convention Hotel Study Chapter 4 Page 5
The projected increase in supply coupled with more moderate demand, as shown in Figure 4-2, is expected to slow growth in average daily rate for 2008 to 4.7 percent, down from 5.9 percent in 2007 and 7.4 percent in 2006.
The figure below shows changes in occupancy from 2002-2008.
Figure 2-4
Occupancy trends are continuing to decline after a 3.5 percent gain in 2004 and a 2.9 percent gain in 2005. There was a 0.2 percent loss in 2007 and occupancy is expected to decrease another 0.8 percent in 2008.
The figure below shows changes in RevPar from 2002 to 2008.
Figure 4-5

Downtown Madison Convention Hotel Study Chapter 4 Page 6
The effect of declining occupancy and the leveling off of ADR growth have slowed RevPar growth. After a high of 8.5 percent growth in 2005, RevPAR has declined to 5.7 percent in 2007 and is expected to dip to 3.9 percent in 2008. These trends show a leveling out of the hotel growth cycle as the post-9/11 recovery in the hotel industry begins to slow. In the past, this leveling of the hotel industry cycle has been accompanied by large increases in inventory. Growth of inventory has been less pronounced in this cycle as inventory levels have been low and new construction has been hampered by high costs and scarcity in materials and labor, due to the volume of construction in emerging markets. Most recently, the real estate mortgage crisis has also affected the hotel market, with higher rates of interest making financing a greater challenge.
Development & Financing
The hotel development pipeline had been increasing by the end of 2006, with a 64.2 percent increase over the previous year. New construction increased despite the labor shortage and high construction prices, which in previous years had diverted many investors to buy existing properties instead of paying the high cost of development. This trend began to soften in 2006 and new construction began to increase, due in large part to ADR increases. This has precipitated the dip in occupancy, as the market has not been able to fully absorb all the new supply.
The figure below shows the average interest rate on hotel development lending from 2002 – 2007.
Figure 4-6
Declining interest rates which spurred real estate investment (and the housing bubble) from 2003 – 2006 also impacted the development of new hotels. The rates in 2008 have spiked dramatically and are currently at eight percent or higher on average.
The loan to value ratio is an important measure of the amount of risk banks are willing to take on real estate investments. Historically, hotels have exhibited a higher

Downtown Madison Convention Hotel Study Chapter 4 Page 7
risk level in the eyes of lenders and as such, have required a substantial equity investment. However, cookie-cutter branded prototype hotels at interstate intersections – very predictable and less risky to bankers in terms of safety and profitability – have achieved loan to value rate of 75 percent or more. The figure below shows the trend in LTV.
Figure 4-7
As the performance of hotels improved, bankers felt more comfortable approving higher loan amounts relative to the value of the project. At its peak in 2005, the LTV was nearly 70.6 percent on average. It has since decreased to 69.8 percent and HSP expects the 2008 rate to decline significantly.
Transactions
The following table shows historical trends for major hotel transactions since 1990.
Figure 4-8

Downtown Madison Convention Hotel Study Chapter 4 Page 8
The above table shows the number of major hotel transactions through 2007, as well as a comparison of January 2007 through April 2007 with January 2008 through April 2008. These transactions are single property transactions of $10 million and above. While transactions in the past four years had been approaching levels of the late 1990s, transactions have declined dramatically in the first quarter of 2008 when compared to the first quarter 2007. The lack of available capital as lenders seek to lend to only very solid deals has slowed new hotel development. This should be ultimately positive for those existing hotels and the general hotel supply-demand balance for the next several years.
The following figure shows average price per room of transactions from 2002 to first quarter 2008.
Figure 4-9
The figure above shows per room average transactions were at a five year high of $203,000 in 2006 and the average has decreased significantly through the first quarter of 2008. This does not necessarily mean that sales prices are dropping, but merely that lower-priced properties are more prevalent and ‘trophy’ properties are not currently being sought. There have been no transactions this year over $100 million as opposed to almost twenty during the same period last year, including six over $200 million. Furthermore, the average size per transaction is down to 198 rooms in contrast to an average of over 300 rooms in 2004 through 2006.
The table below shows the largest single-asset hotel deals in the U.S. last year.

Downtown Madison Convention Hotel Study Chapter 4 Page 9
Table 4-2 Ten Largest U.S. Single-Asset Hotel Transactions in 2007
Property Location Seller Price ($M) Rooms Price per Key Buyer
Maui Prince Makena Maui, HI Seibu, Inc. $575.0 310 $1,854,839Morgan Stanley Real Estate Fund V & Dowling Company, Inc
Hyatt Regency Waikiki Honolulu, HI Azabu Buildings Co. Ltd. $445.0 1,230 $361,789 Hyatt Corporation
Mandarin Oriental New York, NY Apollo Real Estate Advisors, et al. $340.0 248 $1,370,968 Istithmar Hotels
Westin Boston Waterfront Boston, MA Boston Convention Center $330.3 793 $416,520DiamondRock Hospitality Company Hotel, LLC
Knickerbocker Hotel Times Square New York, NY Sitt Asset Management $300.0 264 $1,136,364 Istithmar Hotels
Hilton Washington and Towers Washington, DC Hilton Hotels Corporation $290.0 1,119 $259,392Lowe Enterprises & Canyon-Johnson Urban Fund
Renaissance Mayflower Hotel Washington, DCWalton Street Capital & Rockpoint Group $267.0 657 $406,393 Rockwood Capital
Boston Marriott Long Wharf Boston, MA Boston Properties, Inc. $228.5 402 $567,662 Sunstone Hotel Investors
Hyatt Regency San Francisco San Francisco, CASubsidiary of Strategic Hotels & Resorts $210.0 802 $261,845
Dune Capital Management, LP & DiNapoli Capital Partners
On the Ave Hotel New York, NY Rockpoint Group $201.4 267 $754,120 Highgate Holdings
Source: Jones Lang LaSalle Hotels
New York and Hawaiian properties recorded the highest per-room (key) prices in 2007, with the Maui Prince Makena selling for $1.85 million per key.
The figure below shows where hotel investment capital went geographically in 2007.
Figure 4-10
The vast majority of hotel investment occurred in the U.S. in 2007.
The figure below shows the type of buyer for U.S. hotel sales in 2007.

Downtown Madison Convention Hotel Study Chapter 4 Page 10
Figure 4-11
In 2007, private equity represented the large purchaser of U.S. hotels, with 38 percent of transactions. This is also expected to be a brief trend, as both private equity groups and the hotel industry have essentially fallen off the ‘hot’ list of healthy sectors. Private companies and REITs will likely increase their share in 2008.
The following figure shows the cap rate trend from 2002 through 2007. Cap rates are a measure of risk and reward. The higher the cap rate, the riskier the market expects an investment to be. To determine value, appraisers, buyers and sellers use net operating income divided by the cap rate to determine value. A hotel with $1 million in net operating income and a 10 percent cap rate would have a value of $10 million. However, using a 7 percent cap rate would give a value of $14.3 million. During the height of the hotel buying frenzy in 2005 and 2006, some hotels were sold at effective cap rates of less than five percent, leading to extraordinary values.

Downtown Madison Convention Hotel Study Chapter 4 Page 11
Figure 4-12
Cap rates for hotels have historically been in the 10 to 12 percent range. The rate was below ten percent in 2005 and 2007 and below nine percent in 2006, leading to record sales prices and intense transaction activity. The rate in 2008 is expected to increase to more than 9.5 or 10.0 percent.
Development Costs
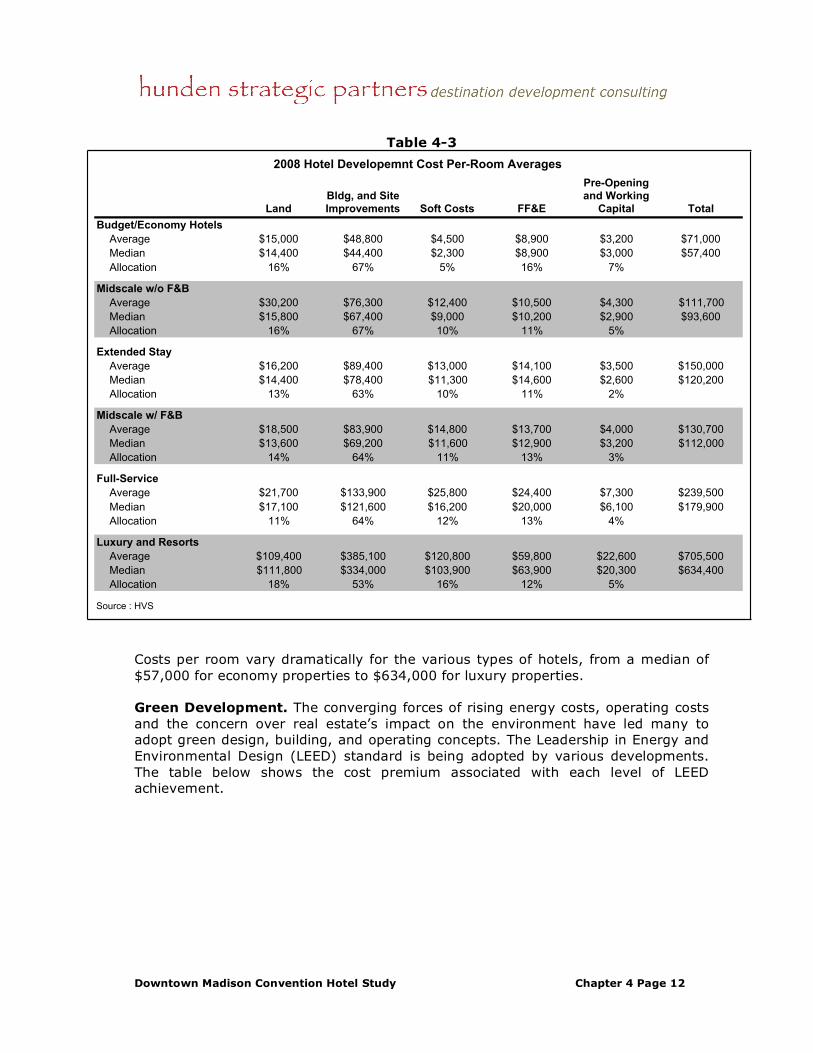
The table below shows the hotel development costs for the different segments of hotels for 2007 (and reported in 2008).
Downtown Madison Convention Hotel Study Chapter 4 Page 12
Table 4-3 2008 Hotel Developemnt Cost Per-Room Averages
Land
Bldg, and Site
Improvements Soft Costs FF&E
Pre-Opening
and Working
Capital Total
Budget/Economy Hotels
Average $15,000 $48,800 $4,500 $8,900 $3,200 $71,000
Median $14,400 $44,400 $2,300 $8,900 $3,000 $57,400
Allocation 16% 67% 5% 16% 7%
Midscale w/o F&B
Average $30,200 $76,300 $12,400 $10,500 $4,300 $111,700
Median $15,800 $67,400 $9,000 $10,200 $2,900 $93,600
Allocation 16% 67% 10% 11% 5%
Extended Stay
Average $16,200 $89,400 $13,000 $14,100 $3,500 $150,000
Median $14,400 $78,400 $11,300 $14,600 $2,600 $120,200
Allocation 13% 63% 10% 11% 2%
Midscale w/ F&B
Average $18,500 $83,900 $14,800 $13,700 $4,000 $130,700
Median $13,600 $69,200 $11,600 $12,900 $3,200 $112,000
Allocation 14% 64% 11% 13% 3%
Full-Service
Average $21,700 $133,900 $25,800 $24,400 $7,300 $239,500
Median $17,100 $121,600 $16,200 $20,000 $6,100 $179,900
Allocation 11% 64% 12% 13% 4%
Luxury and Resorts
Average $109,400 $385,100 $120,800 $59,800 $22,600 $705,500
Median $111,800 $334,000 $103,900 $63,900 $20,300 $634,400
Allocation 18% 53% 16% 12% 5%
Source : HVS
Costs per room vary dramatically for the various types of hotels, from a median of $57,000 for economy properties to $634,000 for luxury properties.
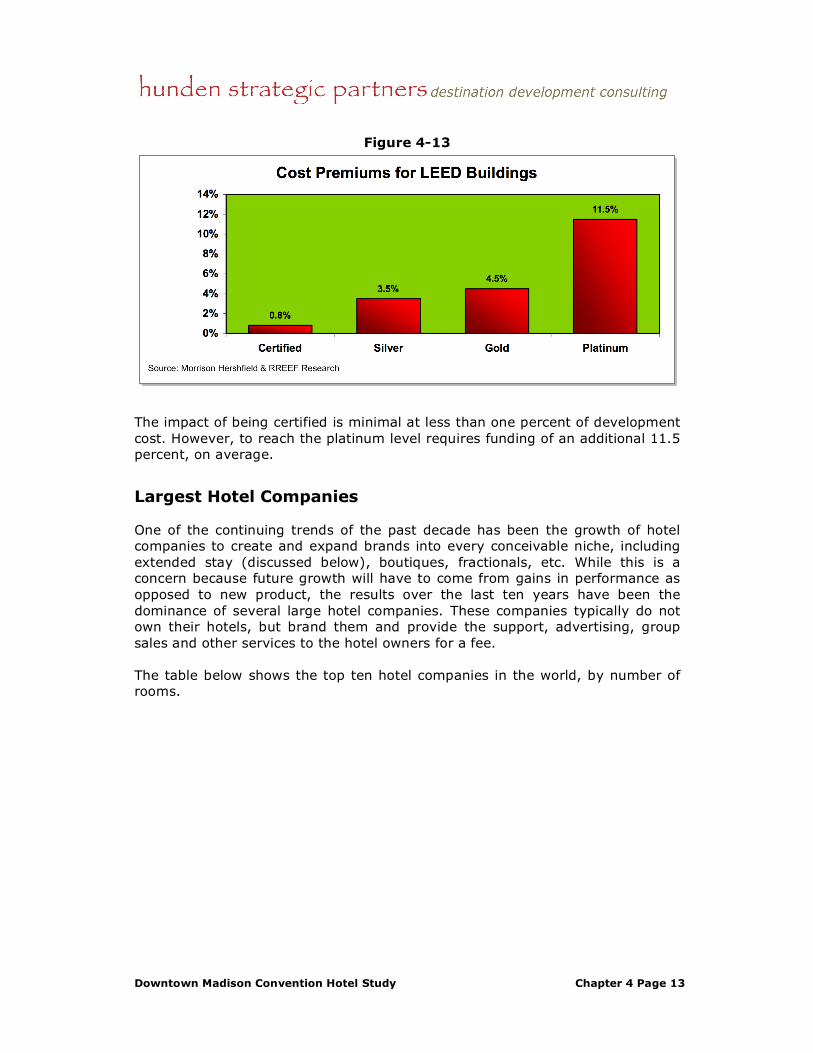
Green Development. The converging forces of rising energy costs, operating costs and the concern over real estate’s impact on the environment have led many to adopt green design, building, and operating concepts. The Leadership in Energy and Environmental Design (LEED) standard is being adopted by various developments. The table below shows the cost premium associated with each level of LEED achievement.
Downtown Madison Convention Hotel Study Chapter 4 Page 13
Figure 4-13
The impact of being certified is minimal at less than one percent of development cost. However, to reach the platinum level requires funding of an additional 11.5 percent, on average.
Largest Hotel Companies
One of the continuing trends of the past decade has been the growth of hotel companies to create and expand brands into every conceivable niche, including extended stay (discussed below), boutiques, fractionals, etc. While this is a concern because future growth will have to come from gains in performance as opposed to new product, the results over the last ten years have been the dominance of several large hotel companies. These companies typically do not own their hotels, but brand them and provide the support, advertising, group sales and other services to the hotel owners for a fee.
The table below shows the top ten hotel companies in the world, by number of rooms.

Downtown Madison Convention Hotel Study Chapter 4 Page 14
Table 4-4
Top Ten Hotel Groups in the World
Rank Company Hotels 2008* Rooms 2008* Rooms/Hotel
1 IHG 3,949 585,094 148
2 Wyndham Worldwide 6,544 550,576 84
3 Marriott International 2,901 517,909 179
4 Hilton Hotels 2,959 497,365 168
5 Accor 3,857 459,494 119
6 Choice International 5,516 445,254 81
7 Best Western 4,035 308,636 76
8 Starwood Hotels & Resorts 897 274,535 306
9 Carleson Hospitality 971 148,551 153
10 Global Hyatt 720 138,503 192
Total 32,349 3,925,917 151
* as of January 2008
Source : MKG Hospitality & HSP
Intercontinental Hotel Group, with its Holiday Inn and other brands, had the most number of rooms in 2008, with 585,000. The largest company in terms of properties is Wyndham, which franchises many of the lower-end hotel brands. Marriott and Hilton are regarded as the large full-spectrum hotel companies, offering quality products in all categories except the economy segment.
The next table shows the largest brands by number of rooms.

Downtown Madison Convention Hotel Study Chapter 4 Page 15
Table 4-5 Top Twenty Global Hotel Brands
Rank Brand Company Hotels 2008* Rooms 2008* Rooms/Hotel
1 Best Western Best Western 4,035 308,636 76
2 Holiday Inn IHG 1,382 256,775 186
3 Comfort Inn & Suites Choice International 2,467 188,596 76
4 Marriott Hotels & Resorts Marriott International 520 188,544 363
5 Hilton Hotels & Resorts Hilton Hotels 511 176,523 345
6 Express by Holiday Inn IHG 1,808 156,531 87
7 Days Inn of America Wyndham Hotels Group 1,883 153,333 81
8 Hampton Inn Hilton Hotels 1,490 147,326 99
9 Sheraton Hotels & Resorts Starwood Hotels & Resorts 399 138,878 348
10 Super 8 Motels Wyndham Hotels Group 2,081 128,587 62
11 Quality Inns & Hotels Choice International 1,210 118,386 98
12 Courtyard Marriott International 767 110,780 144
13 Ramada Worldwide Wyndham Hotels Group 874 106,978 122
14 Motel 6 Accor 956 98,038 103
15 Mercure Accor 756 93,827 124
16 Hyatt Hotels Global Hyatt 213 92,755 435
17 Radisson Hotels Carlson Hospitality/Rezidor 397 87,410 220
18 Ibis Accor 769 86,486 112
19 Crowne Plaza Hotels & Resorts IHG 300 83,661 279
20 Novotel Accor 387 69,234 179
Total 6,629 947,555 182
* as of January 2008
Source : MKG Hospitality & HSP
Best Western has been and continues to be the largest single hotel brand, with more than 4,000 affiliated properties worldwide.
Extended Stay Development
Extended stay hotels have developed as a significant niche hotel market over the last ten years, and most especially during the last five years. This is a response to two prevailing forces in the market. On the demand side, there is a segment of transient travelers, primarily corporate based, that work on longer-term projects of either a few weeks to several months and require a hotel product that suits their needs. From a supply side, major hotel companies have identified a market not previously ‘covered’ by their brand families and that instead was historically accommodated by corporate apartments or limited-service hotels.
Developers are seeing the strength of the national market for extended stay hotels especially in urban settings. Many of the major chains are adding an extended stay brand to their portfolios, as the trends are more consistent and operating costs are much more conservative than traditional full-service hotels. Units in these developments offer guests many of the amenities of their own personal residences. Most offer a full kitchen, a business workspace area with internet capabilities, and larger sleeping accommodations.
The table below shows the room supply for extended stay properties across the U.S.

Downtown Madison Convention Hotel Study Chapter 4 Page 16
Table 4-6
Segment3rd Qtr
2001
3rd Qtr
2002
3rd Qtr
2003
3rd Qtr
2004
3rd Qtr
2005
3rd Qtr
2006
3rd Qtr
2007
Change
06/07
Economy 50,593 51,431 51,143 53,323 52,983 52,805 57,306 8.5%
Mid-Priced 94,579 98,634 102,064 102,880 107,782 113,388 116,125 2.4%
Upsclae 71,122 74,876 80,902 85,613 91,250 97,954 107,343 9.6%
Total 216,294 224,941 234,109 241,816 252,015 264,147 280,774 6.3%
Source: The Highland Group
US Extended Stay Hotel Supply
As shown, the number of rooms in the extended stay hotel segment has increased from 216,000 in the third quarter of 2001 to 281,000 in the third quarter of 2007, a 30 percent increase. The increase was 6.3 percent in the last year. The sub-segment with the most growth was the upscale portion, which increased 51 percent over the period and nearly ten percent from 2006 to 2007.
Other Trends of Note
Several other trends have been occurring in the industry over the past several years. These include:
Amenity Creep. The major brands, led by Starwood, began expecting a higher quality of amenities in their hotels. This began with the “Heavenly Bed” for Westin, and now all major brands have their own premium bedding product. It continued with bathroom products, flat screen televisions, wireless internet, branded gym/spa experiences, and other amenities now expected that previously were considered to be luxuries. These have even crept into the limited service brands.
Brands Multiply. Worldwide, the expansion of brands continues to change the face of the competitive environment. Eager to show earnings and market share for Wall Street, major brands compete fiercely. Using multiple brand products clustered in the same corporate structure, proprietary reservation systems and corporate programs work in tandem to drive business. Larger brand portfolios result in a decreasing value proposition for hotel owners and franchisees that experience increased costs but declining service delivery. Comparing profit potential with a brand or without a brand is becoming a serious exercise for hotel owners. At the same time, the proliferation of brands means fewer independents that struggle for fair share using price as the preferred strategy. While independent hotel operators use the Internet to level the playing field, continued downward pressure on rates results in destabilized markets and further erodes profitability.
Condotels Decline. Selling hotel rooms/units as condominiums was a financing trend and gimmick for several years in order to help front load the

Downtown Madison Convention Hotel Study Chapter 4 Page 17
funding of projects. In most markets, this is not feasible and the trend has abated due to numerous lawsuits and failure of many projects.
Fractionals Increase. Time sharing and fractional developments have continued to increase and in higher-end markets, fractional ownership is a popular trend.
Global Travel and the Impact of Energy Prices and Economic Conditions. As the cost for fuel increases, the disposable income for leisure is increasingly diverted to purchase fuel for cars or is budgeted for higher airline costs. This diminishes the available budget for hotels and other leisure pursuits. While the impact has not yet fully materialized in downward pricing pressure or occupancy declines, it is expected to occur as oil and other energy prices increase. The energy bubble may have burst for now as the world faces a global recession, however, that too will negatively impact travel.
Distribution. The increase in booking travel via the internet has been a major trend in the industry for the past ten years, with 27 percent of revenue booked online in 2006. An additional estimated 30 to 40 percent of bookings were researched online. This has brought transparency and increased competition to the market and all players with a solid internet and distribution strategy are able to compete effectively.
Demographics. The advent of two major demographic shifts will have a positive impact on the hotel business over the foreseeable future. The first is the baby boomer generation reaching retirement. With the largest amount of disposable income and nest egg capital, this large group will have the ability to travel in large numbers for the next 10 to 15 years. Secondly, the BRIC economies (Brazil, Russia, India and China) have exploded in their economic power over the past several years. This has led to a massive increase in the middle classes in these nations and these populations are traveling in increased numbers. Much of this has been driven by high energy costs in Russia, but the trend looks to continue for many years to come.
Conclusion
These trends do not change the need for a convention hotel in Madison, however they will influence the financial structure in terms of cap rates, loan interest rates and potentially the timing of a project if lending remains tight for the next year.