National Health Expenditure Trends, 1975 to 2013
10
Spending and Health Workforce National Health Expenditure Trends, 1975 to 2013 Executive Summary
Transcript of National Health Expenditure Trends, 1975 to 2013

Spending and Health Workforce
National Health Expenditure Trends, 1975 to 2013
Executive Summary

Our VisionBetter data. Better decisions. Healthier Canadians.
Our MandateTo lead the development and maintenance of comprehensive and integrated health information that enables sound policy and effective health system management that improve health and health care.
Our ValuesRespect, Integrity, Collaboration, Excellence, Innovation

1
National Health Expenditure Trends, 1975 to 2013—Executive Summary
Executive Summary
Health Spending Slows
Health spending in Canada is projected to reach $211 billion this year, or $5,988 per person.
Overall, this represents 11.2% of Canada’s gross domestic product (GDP), a share that has
fallen gradually in the past few years—down from 11.3% in 2012, 11.4% in 2011 and the
all-time high of 11.6% in 2010 and 2009.
The rate of growth in health spending (2.6%) is less than inflation and population growth. In fact,
after adjusting for these factors, health spending has decreased by an average of 0.2% per year
in the last three years.
After nearly 15 years of growth in health spending, this recent downward trend may indicate
the start of a “bending of the spending curve.” It reflects, in large part, Canada’s modest
economic growth and government efforts to balance budgets.
How Much Will We Spend on Health in 2013?

2
National Health Expenditure Trends, 1975 to 2013—Executive Summary
Share of Health Dollars Spent on Drugs Declines
About 60% of total health spending is directed to hospitals, drugs and physicians. Although
spending continues to grow in all three categories, the pace has slowed in recent years.
Hospitals account for 30% of total health spending. The share of total health spending on
hospitals decreased from close to 45% in 1975 to approximately 30% in the early 2000s. It
has remained stable since then.
The majority of hospital spending (more than 60%) relates to compensation for the hospital
workforce, which has grown faster than compensation in non-health sectors in the past decade.
Drugs represent 16.3% of total health spending—a share that has edged down from a peak
of 16.8% in 2010. With a government focus on controlling drug costs, the 2013 public-sector
growth rate in drug spending is projected to be flat at 0%.
In recent years, the savings resulting from drug price regulation, expiration of some major
patents and the substitution of brand name drugs for lower-priced generics have offset the
increase in volume and changes in the types of drugs used.
Physicians represent approximately 15% of all health spending, up from 13% in the early
2000s. Physician spending has been among the fastest-growing health categories in recent
years, largely due to increases in physician compensation.
Where Is Most of the Money Being Spent?

3
National Health Expenditure Trends, 1975 to 2013—Executive Summary
Public/Private Split Unchanged
The public share of total health spending has remained relatively stable at around 70% since
the late 1990s. Currently, 65% comes from provincial/territorial governments and 5% from
federal/municipal governments and social security funds such as workers’ compensation boards.
Of the 30% of total health spending financed privately, half (15%) comes directly out of pocket. The
remainder is financed through private health insurance (12%) and other private sources (3%). The
majority of private-sector funding is spent on drugs and dental care, while hospitals and physicians
are financed primarily by the public sector.
Compared with other Organisation for Economic Co-operation and Development (OECD) countries,
Canada is slightly below average in the share of health spending funded by the public sector. In the
Netherlands, Norway and Denmark, 85% of health expenditures are funded by the public sector,
while less than half of health spending in the United States and Mexico is publicly financed (48%
and 47%, respectively).
Public/Private Split, 1995 to Present

4
National Health Expenditure Trends, 1975 to 2013—Executive Summary
Health Spending Continues to Vary Across Canada
How Do the Provinces and Territories Compare?
The map shows variations in per person health spending across the country. It also illustrates
the percentage spent on health by government in each province and territory, relative to the
size of its budget. On average, provincial and territorial governments spend almost 40% of their
budgets on health care.
The amount spent per person reflects the population of each province and territory and its health
care needs, as well as how health services are organized, health personnel compensation and
the sharing of costs between public and private sectors. Note that per person spending on health
is expected to be higher in the territories due to their small, dispersed populations.
5
National Health Expenditure Trends, 1975 to 2013—Executive Summary
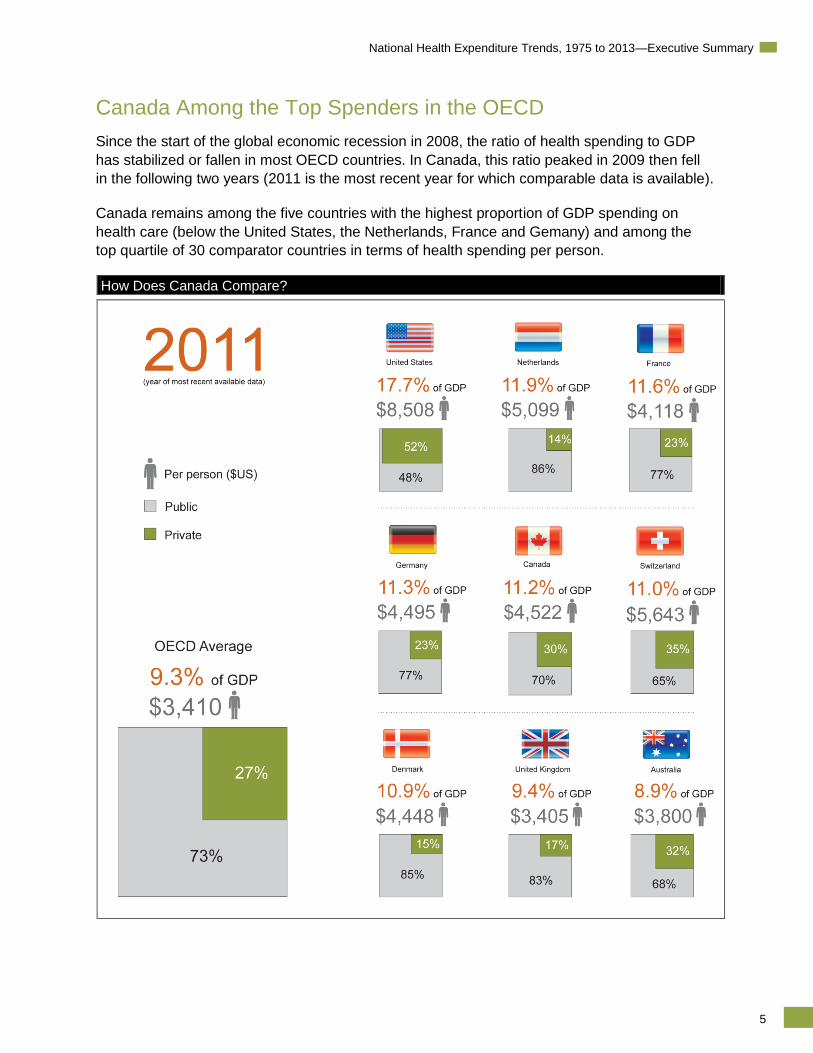
Canada Among the Top Spenders in the OECD
Since the start of the global economic recession in 2008, the ratio of health spending to GDP
has stabilized or fallen in most OECD countries. In Canada, this ratio peaked in 2009 then fell
in the following two years (2011 is the most recent year for which comparable data is available).
Canada remains among the five countries with the highest proportion of GDP spending on
health care (below the United States, the Netherlands, France and Gemany) and among the
top quartile of 30 comparator countries in terms of health spending per person.
How Does Canada Compare?

6
National Health Expenditure Trends, 1975 to 2013—Executive Summary
More Information
The annual report National Health Expenditure Trends, 1975 to 2013 provides an overview of
How much is spent on health care every year;
What the money is used for; and
Where that money comes from.
It features comparative expenditure data at the provincial/territorial and international levels,
as well as Canadian health spending trends from 1975 to the present.
The National Health Expenditure Trends annual report series is based on CIHI’s National Health
Expenditure Database (NHEX), Canada’s most comprehensive source of information on health
spending. NHEX tracks macro-level spending on health goods and services, and capital
investments in health care infrastructure.
To download the latest annual report, information sheets, presentations, methodological notes
or up-to-date data tables, all free of charge, visit our website at www.cihi.ca/nhex.
Feedback and questions are welcome at [email protected].

Production of this report is made possible by financial contributions from Health Canada and provincial and territorial governments. The views expressed herein do not necessarily represent the views of Health Canada or any provincial or territorial government.
All rights reserved.
The contents of this publication may be reproduced unaltered, in whole or in part and by any means, solely for non-commercial purposes, provided that the Canadian Institute for Health Information is properly and fully acknowledged as the copyright owner. Any reproduction or use of this publication or its contents for any commercial purpose requires the prior written authorization of the Canadian Institute for Health Information. Reproduction or use that suggests endorsement by, or affiliation with, the Canadian Institute for Health Information is prohibited.
For permission or information, please contact CIHI:
Canadian Institute for Health Information495 Richmond Road, Suite 600Ottawa, Ontario K2A 4H6
Phone: 613-241-7860Fax: [email protected]
ISBN 978-1-77109-232-6 (PDF)
© 2013 Canadian Institute for Health Information
How to cite this document:Canadian Institute for Health Information. National Health Expenditure Trends, 1975 to 2013—Executive Summary. Ottawa, ON: CIHI; 2013.
Cette publication est aussi disponible en français sous le titre Tendances des dépenses nationales de santé, 1975 à 2013 — Sommaire.ISBN 978-1-77109-233-3 (PDF)

www.cihi.caAt the heart of data
Talk to UsCIHI Ottawa 495 Richmond Road, Suite 600 Ottawa, Ontario K2A 4H6 Phone: 613-241-7860
CIHI Toronto 4110 Yonge Street, Suite 300 Toronto, Ontario M2P 2B7 Phone: 416-481-2002
CIHI Victoria 880 Douglas Street, Suite 600 Victoria, British Columbia V8W 2B7 Phone: 250-220-4100
CIHI Montréal 1010 Sherbrooke Street West, Suite 300 Montréal, Quebec H3A 2R7 Phone: 514-842-2226
CIHI St. John’s 140 Water Street, Suite 701 St. John’s, Newfoundland and Labrador A1C 6H6 Phone: 709-576-7006