National Grid plc Annual Report and Accounts 2020/21
110
Picture by Hadeeja Khan UK Runner-up Age group 6 and under Financial Statements 3. Directors’ statement and independent auditor’s reports Statement of Directors’ responsibilities 116 Independent auditor’s report 117 Consolidated financial statements under IFRS Primary statements Consolidated income statement 129 Consolidated statement of comprehensive income 131 Consolidated statement of changes in equity 132 Consolidated statement of financial position 133 Consolidated cash flow statement 134 Notes to the consolidated financial statements Note 1 – Basis of preparation and recent accounting developments 135 Note 2 – Segmental analysis 138 Note 3 – Revenue 140 Note 4 – Operating costs 144 Note 5 – Exceptional items and remeasurements 146 Note 6 – Finance income and costs 149 Note 7 – Tax 150 Note 8 – Earnings per share (EPS) 154 Note 9 – Dividends 155 Note 10 – Discontinued operations and assets held for sale 155 Note 11 – Goodwill 157 Note 12 – Other intangible assets 158 Note 13 – Property, plant and equipment 159 Note 14 – Other non-current assets 162 Note 15 – Financial and other investments 162 Note 16 – Investments in joint ventures and associates 163 Note 17 – Derivative financial instruments 165 Note 18 – Inventories and current intangible assets 167 Note 19 – Trade and other receivables 168 Note 20 – Cash and cash equivalents 169 Note 21 – Borrowings 170 Note 22 – Trade and other payables 172 Note 23 – Contract liabilities 173 Note 24 – Other non-current liabilities 173 Note 25 – Pensions and other post-retirement benefits 174 Note 26 – Provisions 183 Note 27 – Share capital 185 Note 28 – Other equity reserves 186 Note 29 – Net debt 187 Note 30 – Commitments and contingencies 189 Note 31 – Related party transactions 190 Note 32 – Financial risk management 190 Note 33 – Borrowing facilities 203 Note 34 – Subsidiary undertakings, joint ventures and associates 204 Note 35 – Sensitivities 209 Note 36 – Additional disclosures in respect of guaranteed securities 211 Note 37 – Transition to new accounting standards 211 Note 38 – Acquisitions 216 Note 39 – Post balance sheet events 216 Company financial statements under FRS 101 Basis of preparation Company accounting policies 217 Primary statements Company balance sheet 219 Company statement of changes in equity 220 Notes to the Company financial statements Note 1 – Fixed asset investments 221 Note 2 – Debtors 221 Note 3 – Creditors 222 Note 4 – Derivative financial instruments 222 Note 5 – Investments 222 Note 6 – Borrowings 223 Note 7 – Share capital 223 Note 8 – Shareholders’ equity and reserves 223 Note 9 – Parent Company guarantees 223 Note 10 – Audit fees 223 114 National Grid plc Annual Report and Accounts 2020/21
Transcript of National Grid plc Annual Report and Accounts 2020/21

Picture by Hadeeja KhanUKRunner-upAge group 6 and under
Financial Statements
3.
Directors’ statement and independent auditor’s reportsStatement of Directors’ responsibilities 116Independent auditor’s report 117
Consolidated financial statements under IFRS
Primary statementsConsolidated income statement 129 Consolidated statement of comprehensive income 131 Consolidated statement of changes in equity 132 Consolidated statement of financial position 133 Consolidated cash flow statement 134
Notes to the consolidated financial statementsNote 1 – Basis of preparation and recent
accounting developments 135 Note 2 – Segmental analysis 138 Note 3 – Revenue 140 Note 4 – Operating costs 144 Note 5 – Exceptional items and
remeasurements 146 Note 6 – Finance income and costs 149 Note 7 – Tax 150 Note 8 – Earnings per share (EPS) 154 Note 9 – Dividends 155 Note 10 – Discontinued operations
and assets held for sale 155 Note 11 – Goodwill 157 Note 12 – Other intangible assets 158 Note 13 – Property, plant and equipment 159 Note 14 – Other non-current assets 162 Note 15 – Financial and other investments 162 Note 16 – Investments in joint ventures
and associates 163 Note 17 – Derivative financial instruments 165 Note 18 – Inventories and current
intangible assets 167 Note 19 – Trade and other receivables 168 Note 20 – Cash and cash equivalents 169Note 21 – Borrowings 170 Note 22 – Trade and other payables 172
Note 23 – Contract liabilities 173 Note 24 – Other non-current liabilities 173 Note 25 – Pensions and other
post-retirement benefits 174 Note 26 – Provisions 183 Note 27 – Share capital 185 Note 28 – Other equity reserves 186 Note 29 – Net debt 187 Note 30 – Commitments
and contingencies 189Note 31 – Related party transactions 190 Note 32 – Financial risk management 190 Note 33 – Borrowing facilities 203 Note 34 – Subsidiary undertakings,
joint ventures and associates 204 Note 35 – Sensitivities 209Note 36 – Additional disclosures in
respect of guaranteed securities 211 Note 37 – Transition to new accounting standards 211 Note 38 – Acquisitions 216 Note 39 – Post balance sheet events 216
Company financial statements under FRS 101
Basis of preparationCompany accounting policies 217
Primary statementsCompany balance sheet 219 Company statement of changes in equity 220
Notes to the Company financial statementsNote 1 – Fixed asset investments 221 Note 2 – Debtors 221 Note 3 – Creditors 222 Note 4 – Derivative financial instruments 222 Note 5 – Investments 222 Note 6 – Borrowings 223 Note 7 – Share capital 223 Note 8 – Shareholders’ equity
and reserves 223 Note 9 – Parent Company guarantees 223 Note 10 – Audit fees 223
114
National Grid plc Annual Report and Accounts 2020/21

115
National Grid plc Annual Report and Accounts 2020/21 Financial Statements

The Directors are responsible for preparing the Annual Report and Accounts, including the Group financial statements and the Parent Company financial statements in accordance with applicable law and regulations.
Company law requires the Directors to prepare financial statements for each financial year. Under that law, the Directors are required to prepare the Group financial statements in accordance with International Accounting Standards in conformity with the requirements of the Companies Act 2006 and International Financial Reporting Standards (IFRS) adopted pursuant to Regulation (EC) No. 1606/2002 as it applies in the European Union. The financial statements also comply with IFRS as issued by the IASB. In addition, the Directors have elected to prepare the Parent Company financial statements in accordance with United Kingdom Generally Accepted Accounting Practice (United Kingdom Accounting Standards and applicable law), including FRS 101 ‘Reduced Disclosure Framework’. Under company law, the Directors must not approve the accounts unless they are satisfied that they give a true and fair view of the state of affairs of the Group and Parent Company and of the profit or loss of the Group and Parent Company for that period.
In preparing the Group financial statements, International Accounting Standard 1 requires that Directors:• properly select and apply accounting policies;• present information, including accounting policies, in a manner that
provides relevant, reliable, comparable and understandable information;• provide additional disclosures when compliance with the specific
requirements in IFRS are insufficient to enable users to understand the impact of particular transactions, other events and conditions on the entity’s financial position and financial performance; and
• make an assessment of the Group’s ability to continue as a going concern.
In preparing the Parent Company financial statements, the Directors are required to:• select suitable accounting policies and then apply them consistently;• make judgments and accounting estimates that are reasonable and
prudent;• state whether applicable UK Accounting Standards have been
followed, subject to any material departures disclosed and explained in the financial statements; and
• prepare the financial statements on the going concern basis unless it is inappropriate to presume that the Company will continue in business.
The Directors are responsible for keeping adequate accounting records that are sufficient to show and explain the Group and Parent Company’s transactions and disclose with reasonable accuracy at any time the financial position of the Group and Parent Company on a consolidated and individual basis, and to enable them to ensure that the Group financial statements comply with the Companies Act 2006. They are also responsible for safeguarding the assets of the Parent Company and its subsidiaries and hence for taking reasonable steps for the prevention and detection of fraud and other irregularities.
The Directors are responsible for the maintenance and integrity of the Company’s website. Legislation in the United Kingdom governing the preparation and dissemination of financial statements may differ from legislation in other jurisdictions.
Having made the requisite enquiries, so far as the Directors in office at the date of the approval of this Report are aware, there is no relevant audit information of which the auditors are unaware and each Director has taken all reasonable steps to make themselves aware of any relevant audit information and to establish that the auditors are aware of that information.
Each of the Directors, whose names and functions are listed on pages 72 – 73, confirms that:• to the best of their knowledge, the Group financial statements and the
Parent Company financial statements, which have been prepared in accordance with IFRS as issued by the IASB and IFRS as adopted by the European Union and UK GAAP FRS 101 respectively, give a true and fair view of the assets, liabilities, financial position and profit of the Company on a consolidated and individual basis;
• to the best of their knowledge, the Strategic Report contained in the Annual Report and Accounts includes a fair review of the development and performance of the business and the position of the Company on a consolidated and individual basis, together with a description of the principal risks and uncertainties that it faces; and
• they consider that the Annual Report and Accounts, taken as a whole, are fair, balanced and understandable and provides the information necessary for shareholders to assess the Company’s position and performance, business model and strategy.
This Responsibilities Statement was approved by the Board and signed on its behalf.
Directors’ ReportThe Directors’ Report, prepared in accordance with the requirements of the Companies Act 2006 and the UK Listing Authority’s Listing Rules, and Disclosure Rules and Transparency Rules, comprising pages 1 – 113 and 224 – 268, was approved by the Board and signed on its behalf.
Strategic ReportThe Strategic Report, comprising pages 1 – 66, was approved by the Board and signed on its behalf.
By order of the Board
Justine CampbellGroup General Counsel & Company Secretary
19 May 2021
Company number: 4031152
Statement of Directors’ responsibilities
116
National Grid plc Annual Report and Accounts 2020/21 Financial Statements

Independent auditor’s report to the members of National Grid plcReport on the audit of the financial statements1. Opinion
In our opinion:• the financial statements of National Grid plc (the ‘Parent
Company’) and its subsidiaries (the ‘Group’) give a true and fair view of the state of the Group’s and of the Parent Company’s affairs as at 31 March 2021 and of the Group’s profit for the year then ended;
• the Group financial statements have been properly prepared in accordance with International Accounting Standards in conformity with the requirements of the Companies Act 2006, International Financial Reporting Standards (IFRS) as adopted by the European Union and IFRS as issued by the International Accounting Standards Board (IASB);
• the Parent Company financial statements have been properly prepared in accordance with United Kingdom Generally Accepted Accounting Practice, including Financial Reporting Standard (FRS) 101 ‘Reduced Disclosure Framework’; and
• the financial statements have been prepared in accordance with the requirements of the Companies Act 2006.
We have audited the financial statements which comprise:
Group:• the consolidated income statement;• the consolidated statement of comprehensive income;• the consolidated statement of changes in equity;• the consolidated statement of financial position;• the consolidated cash flow statement; and• the related notes 1 to 39 to the consolidated financial statements.
Parent Company:• the Parent Company accounting policies;• the Parent Company balance sheet;• the Parent Company statement of changes in equity; and • the related notes 1 to 10 to the Parent Company financial
statements.
The financial reporting framework that has been applied in the preparation of the Group financial statements is applicable law, International Accounting Standards in conformity with the requirements of the Companies Act 2006 and IFRS as adopted by the European Union and as issued by the IASB. The financial reporting framework that has been applied in the preparation of the Parent Company financial statements is applicable law and United Kingdom Accounting Standards, including FRS 101 ‘Reduced Disclosure Framework’ (United Kingdom Generally Accepted Accounting Practice).
2. Basis for opinionWe conducted our audit in accordance with International Standards on Auditing (UK) (ISAs (UK)) and applicable law. Our responsibilities under those standards are further described in section 10 of our report.
We are independent of the Group and the Parent Company in accordance with the ethical requirements that are relevant to our audit of the financial statements in the UK, including the Financial Reporting Council’s (the ‘FRC’s’) Ethical Standard as applied to listed public interest entities, and we have fulfilled our other ethical responsibilities in accordance with these requirements. The non-audit services provided to the Group and Parent Company for the year are disclosed in note 4(e) to the financial statements. We confirm that the non-audit services prohibited by the FRC’s Ethical Standard were not provided to the Group or the Parent Company.
We believe that the audit evidence we have obtained is sufficient and appropriate to provide a basis for our opinion.
National Grid plc Annual Report and Accounts 2020/21
117
Financial Statements
3. Summary of our audit approach
Key audit matters The key audit matters that we identified in the current year were:• impact of COVID-19 including the recoverability of US trade and other receivables;• impact of climate change on property, plant and equipment; and• treasury derivative transactions.
The following items were identified as key audit matters in the prior year but not in the current year:• environmental provisions has not been deemed to be a key audit matter in the current year, as unlike in the prior year, there has
been no significant change in the provisions and the judgements used to derive them. Specifically, there is less judgement regarding the most significant of the three US former sites that represent more than half of the total provision and were identified by the Environmental Protection Agency (EPA) as sites of significant contamination (Superfund sites). This is due to the finalisation of design works in the period which has reduced the uncertainty in the expected cash outflows;
• classification of exceptional items has not been deemed to be a key audit matter this year due to the low level of exceptional items and the reduced level of judgement in determining the FY21 exceptional items when compared to the prior year;
• IT user access controls have not been deemed a key audit matter this year as the remediation programme in respect of the deficiencies in user access management was largely completed in the prior year. The remaining deficiencies have not prevented us from adopting a controls based approach this year; and
• in the prior year, we identified net pension obligations as a key audit matter in part due to the increased uncertainty in relation to the valuation of unquoted assets, specifically the Schemes’ property and alternative investment portfolios, with the latter having been based upon valuations performed prior to the significant economic impacts of the COVID-19 pandemic becoming fully clear. In addition, in the prior year the Group entered into two pension buy-in transactions of £2.8 billion and £1.6 billion involving a transfer of certain pension assets in the form of gilts and cash, in return for a bulk annuity policy. In the current year, we note that market volatility in respect of these portfolios has reduced, resulting in lower uncertainty in relation to their valuation. In addition, although the Group entered into one further buy-in policy, the quantum is much smaller and the accounting is consistent with the treatment for the prior year buy-ins. On the basis of these considerations, in FY21 we have not identified a key audit matter in respect of net pension obligations.
Materiality The materiality that we used for our audit of the Group financial statements was £120 million which represents 5.9% of adjusted profit before tax (profit before tax excluding the impact of reported exceptional items and remeasurements) and 5.8% of statutory profit before tax.
Scoping Our scope covered seven components of the Group in addition to procedures performed at the Group level. Of these, three were subjected to a full-scope audit whilst the remaining four were subject to specific procedures on certain account balances.
Our scoping covered 98% of the Group’s revenue; 99% of the Group’s property, plant and equipment; and 99% of the Group’s gross liabilities.

4. Conclusions relating to going concern
In auditing the financial statements, we have concluded that the Directors’ use of the going concern basis of accounting in the preparation of the financial statements is appropriate.
Our evaluation of the Directors’ assessment of the Group’s and Parent Company’s ability to continue to adopt the going concern basis of accounting included:• assessing the financing facilities including the nature of facilities, repayment terms and covenants; • enquiring of management regarding the assumptions used in the going concern models;• testing the clerical accuracy and appropriateness of the model used to prepare the forecasts; • assessing the assumptions used in the forecasts; • assessing management’s identified potential mitigating actions and the appropriateness of the inclusion of these in the going concern assessment; • assessing the historical accuracy of forecasts prepared by management; • reperforming management’s sensitivity analysis; and • evaluating whether the Group’s disclosures in respect of going concern within the financial statements, meet the requirements of IAS 1.
The impact of National Grid’s commitment to acquire Western Power Distribution (WPD) and to dispose of The Narragansett Electric Company (NECO) was considered in management’s assessment. All of our work outlined above, addressed the implication of this commitment.
Based on the work we have performed, we have not identified any material uncertainties relating to events or conditions that, individually or collectively, may cast significant doubt on the Group’s and Parent Company’s ability to continue as a going concern for a period of at least twelve months from when the financial statements are authorised for issue.
In relation to the reporting on how the Group has applied the UK Corporate Governance Code, we have nothing material to add or draw attention to in relation to the Directors’ statement in the financial statements about whether the Directors considered it appropriate to adopt the going concern basis of accounting.
Our responsibilities and the responsibilities of the Directors with respect to going concern are described in the relevant sections of this report.
Independent auditor’s report to the members of National Grid plc continued
118
National Grid plc Annual Report and Accounts 2020/21 Financial Statements

5. Key audit mattersKey audit matters are those matters that, in our professional judgement, were of most significance in our audit of the financial statements of the current period and include the most significant assessed risks of material misstatement (whether or not due to fraud) that we identified. These matters included those which had the greatest effect on: the overall audit strategy, the allocation of resources in the audit; and directing the efforts of the engagement team.
Throughout the course of our audit, we identify risks of material misstatement (‘risks’). We consider both the likelihood of a risk and the potential magnitude of a misstatement in making the assessment. Certain risks are classified as ‘significant’ or ‘higher’ depending on their severity. The category of the risk determines the level of evidence we seek in providing assurance that the associated financial statement item is not materially misstated.
These matters were addressed in the context of our audit of the financial statements as a whole, and in forming our opinion thereon, and we do not provide a separate opinion on these matters.
5.1. Impact of COVID-19 including the recoverability of US trade and other receivables
Key audit matter description
Account balances: Trade and other receivables. Refer to note 19 to the financial statements.
The COVID-19 pandemic has had a significant impact on the UK and US economies with consequences to the judgements and estimates made by the Group, principally in relation to the recoverability of US customer receivables. Refer to note 1 to the financial statements and the Audit Committee’s discussion on pages 83 – 87.
The scale and impact of the COVID-19 pandemic on the markets in which the Group operates remains significant. The various lockdowns imposed throughout the year by the UK government and the US states in which the Group operates had a direct and severe impact on those economies as consumer spending decreased and unemployment rose. As set out on page 9 of the Annual Report and Accounts, this has impacted the FY21 results of the Group.
At the beginning of the financial year, management reassessed their controls framework, which encompassed a review of the ability to operate existing controls remotely and consideration of whether existing controls were suitable for addressing areas of new or increased risk. As a result of this assessment a COVID-19 entity-level control was implemented to assess the completeness of accounting considerations across the Group.
Management’s assessment determined that the primary risk that arose from the COVID-19 pandemic related to the valuation of provisions for bad and doubtful debts in the US due to the increased uncertainty over customers’ ability to settle amounts when they fall due.
In calculating bad and doubtful debts, the key judgement relates to the requirement to incorporate ‘expected credit losses’ into the provision. This requires management to make forward-looking estimates of the expected level of losses which will be incurred on any outstanding receivables. In the US, unlike in the UK, the Group has retail customers. Management has used the experience of cash collections since the start of the pandemic to inform their expected credit loss calculations.
Although a small proportion of US collection activities resumed in the year, for the most part regulator moratoriums continued to be enforced, prohibiting utilities from shutting off customer access to gas and electricity for non-payment, as well as introducing requirements to extend payment plans and waive late fees. The level of estimation uncertainty related to the bad debt calculation in respect of US trade receivables continues to be high and accordingly, we have identified this as an area of ‘higher’ audit risk.
National Grid plc Annual Report and Accounts 2020/21
119
Financial Statements | Independent auditor’s report

5. Key audit matters continued
5.1. Impact of COVID-19 including the recoverability of US trade and other receivables
How the scope of our audit responded to the key audit matter
We assessed whether management appropriately considered the related impact of COVID-19 and remote working on existing controls and tested the incremental COVID-19 entity level control, and where there was a change in a control due to remote working, we challenged the appropriateness of the change and assessed the operating effectiveness of the control in light of the change.
Further, we held discussions with our component engagement teams, with management and within the wider Deloitte network to identify the areas of risk to the financial statements as a result of the wider impacts of the pandemic. We used the outcome of these discussions to update our audit risk assessment and challenge management’s impact assessment.
In challenging management’s assumptions related to the impact of the COVID-19 pandemic on the provision for bad and doubtful debts on US retail customers, we assessed the trend of cash collections during the year and specifically considered the cash received in respect of the balances recorded at 31 March 2020. We considered the economic outlook, including when disconnection moratoria are expected to be eased, forecast unemployment rates and government stimulus packages. We challenged management’s judgement as to the point in the range of calculated possible outcomes which management determined to be their best estimate.
Key observations Our testing confirmed the incremental COVID-19 specific control operated effectively.
We concluded that management’s judgements and estimates made in determining the incremental level of expected credit losses as a consequence of the COVID-19 pandemic are reasonable.
We concluded that management’s disclosures included in note 1E to the financial statements in respect of the key judgements and areas of estimation uncertainty are appropriate.
5.2. The impact of climate change on property, plant and equipment
Key audit matter description
Account balance: Property, plant and equipment. Refer to notes 1E and 13 to the financial statements and the Audit Committee’s discussion on pages 83 – 87.
The UK government and certain US states in which the Group operates have enacted legislation and established targets in respect of net zero carbon emissions by 2050. Accordingly climate change represents a strategic challenge for the Group, which has also set targets for reducing direct greenhouse gas emissions by the same date.
Natural gas, when burned, emits carbon dioxide and is considered a greenhouse gas. Therefore, the strategic challenge relates to the potential future use of the Group’s assets used to facilitate gas transmission services in the UK and gas distribution services in the US in the period approaching 2050 and beyond. The remaining useful economic life of the Group’s gas assets is up to 50 years in the UK and 80 in the US, extending well beyond the 2050 net zero commitment date. As described in note 13 to the financial statements, the impact of changing the useful economic lives of all of the Group’s gas assets, such that they would be fully depreciated by 2050, would be an increase in the annual depreciation expense of £195 million, and such that they would be fully depreciated by 2060, would be an increase in the annual depreciation expense of £82 million.
As the continued use of natural gas as a primary energy source beyond 2050 appears to be in conflict with net zero targets and the impact of shortening the useful lives of the gas assets to 2050 has a material impact on annual depreciation, we identified a ‘higher’ risk related to the financial statement impact of those commitments, specifically pinpointed to management’s judgement in determining the useful lives of gas assets in the context of the net zero commitments.
As described in note 13 to the financial statements and in the Audit Committee Report (page 85), management performed a detailed assessment of the potential uses for the Group’s gas assets as part of their consideration around whether developments in the UK and US towards binding carbon reduction targets should trigger any changes to National Grid’s estimates, judgements or disclosures, especially regarding gas asset lives. Management’s assessment included an overview of the legislative changes in the UK and US, and an evaluation of the possible future use of National Grid’s networks in a net zero carbon energy system.
Management’s best estimate of the useful economic lives of US gas assets, across all states in which it operates, is based on the depreciable life identified through depreciation studies for each asset and are approved by the respective state regulator. Accordingly, in the US, the IFRS asset depreciable lives are identical to those agreed by the Group’s regulators for regulatory purposes. Management concluded it is probable that there will be a role for its US gas networks post 2050 under a range of possible scenarios, and there is nothing at present to suggest that asset lives should be shortened at this point.
In the UK, National Grid Gas Transmission (NGGT) owns and operates the National Transmission System (NTS). Pipelines represent the vast majority of the value that will be undepreciated by 2050. Having analysed the potential decarbonisation pathways, management has identified numerous potential uses for the Group’s UK gas pipeline assets in a net zero energy system including for the continued transmission of natural gas as a back-up fuel or in order for the transmission of hydrogen or other low or zero carbon gases.
Management concluded that the National Transmission System (NTS) pipeline assets in the UK will continue to have an economic use until 2070.
Management operated an entity level control to assess the accounting and disclosure impacts associated with the transitional and reputational risks of climate change to ensure these are considered and reflected appropriately in external reporting.
Management determined that disclosure of a key judgement in relation to the potential future use of the Group’s gas assets post-2050 and disclosure of the gas asset lives as a key estimate (note 1E to the financial statements), with appropriate sensitivity analysis (note 13 to the financial statements), was appropriate.
Independent auditor’s report to the members of National Grid plc continued
120
National Grid plc Annual Report and Accounts 2020/21 Financial Statements

5.2. The impact of climate change on property, plant and equipment continued
How the scope of our audit responded to the key audit matter
We tested management’s internal control over the accounting for and disclosure of the potential impacts associated with the energy transition and climate change.
We challenged management’s judgement that the useful lives of the Group’s gas assets extend beyond 2050 in light of the different goals, commitments and legislation relating to net zero in the UK and the US states in which the Group operates by: • assessing potential strategic pathways to achieve net zero targets;• obtaining and reading government plans in the US and UK for achieving net zero which we compared to the potential strategic
pathways;• evaluating information from the Group’s regulators, including price controls in the UK and rate cases in the US, to consider
whether they presented any contradictory evidence; • performing an assessment of the likelihood of occurrence of alternative scenarios for achieving net zero targets;• considering the potential for re-purposing the Group’s gas networks for alternative uses, and in particular for transporting
hydrogen; and• reading a number of external reports including: The Sixth Carbon Budget, produced by the Committee on Climate Change;
the UK’s Climate Change White Paper, produced by the Department for Business, Energy & Industrial Strategy; and searching for contradictory evidence in respect of management’s judgements.
We utilised our sustainability specialists to review management’s key assumptions and to challenge the viability of some of the technological advances presented within the strategic pathways. We also consulted with Deloitte specialists in other countries regarding the suitability of existing gas infrastructure for transporting hydrogen.
We assessed the disclosures set out in note 1 to the financial statements and the sensitivity analysis set out in note 13 to the financial statements regarding the carrying value of the useful economic lives of the Group’s gas assets.
Key observations Our testing confirmed that the relevant controls over management’s assessment of the impact of the energy transition and climate change operated effectively.
We observe that whilst some indicators do exist suggesting that the useful economic lives of the Group’s gas assets may be limited to 2050, these are mitigated by other statements by governments and advisory bodies which suggest gas, and therefore gas transmission and distribution assets, will continue to have a role beyond 2050. Furthermore, the emergence of a substantial hydrogen infrastructure could introduce another potential longer term role for National Grid gas assets past 2050, if technological developments allow the utilisation of existing assets in this infrastructure.
Whilst the targets, goals and ambitions in respect of net zero have now been formalised in legislation in all jurisdictions in which the Group operates, there is widespread recognition that work needs to be done to define the possible future decarbonisation pathways. We note that whilst state energy policy in the US states in which the Group operates is codified by the legislature, it is the regulators who are charged with implementing state energy policies. We concluded it was reasonable to assume that there will be a valuable use for the Group’s US gas assets beyond 2050 and in the absence of any determination by the Group’s regulators, it continues to be reasonable to use the regulatory asset lives for the calculation of depreciation in accordance with IFRS.
In the UK, we note that there is no alignment between the useful lives of the Group’s gas assets for IFRS depreciation purposes, and the period of recovery of the regulatory asset value under regulation. Nevertheless, we conclude that it is reasonable to assume that there will be a valuable use for these assets until 2070.
We consider the disclosures in note 1 to the financial statements and the sensitivity analysis in note 13 to the financial statements to be appropriate.
We are satisfied that management’s other disclosures in the Annual Report and Accounts relating to the uncertainty surrounding the future use of the Group’s gas assets are consistent with the financial statements and our understanding of the business.
National Grid plc Annual Report and Accounts 2020/21
121
Financial Statements | Independent auditor’s report

5. Key audit matters continued
5.3. Treasury derivative transactions
Key audit matter description
Account balances: Derivative financial assets and derivative financial liabilities. Refer to notes 17 and 32 to the financial statements.
The Group mitigates the exposure to commodity, interest rate and foreign exchange rate risks with risk management activities including the use of derivatives such as forwards, cross-currency swaps and interest rate swaps. The Group designates derivatives in hedge relationships where they judge this to meet the requirements of IFRS 9. Due to the technical nature of this assessment, we have identified it as a ‘higher’ audit risk. At 31 March 2021 the Group had derivative financial assets of £999 million (31 March 2020: £1,342 million) and derivative financial liabilities of £899 million (31 March 2020: £1,334 million).
The valuation of the derivative portfolio requires management to make certain assumptions and judgements in particular around the valuation methodologies adopted and the discount rate to be applied to forecast cash flows.
The portfolio also includes net ‘level 3’ derivative financial liabilities of £195 million (31 March 2020: £233 million) for which unobservable inputs that are significant to the fair value measurement must be used in the valuation models. This results in management having to make estimates in relation to unobservable inputs, which increase the complexity and level of estimation uncertainty, and there is judgement involved in determining the methodology used to fair value these derivatives. Accordingly, we have identified this as an area of ‘higher’ audit risk.
How the scope of our audit responded to the key audit matter
We have tested the controls over the recording and valuation of derivative financial instruments. This has included testing of the review controls performed by management over the valuations and its challenge of the estimates made.
In conjunction with our treasury specialists we have tested a sample of the valuation models used by management, including a challenge of the assumptions therein, to confirm the appropriateness of the valuation methodology adopted and the assumptions applied. Additionally, we have performed independent valuations. We have obtained third party confirmations to test the completeness and accuracy of the information held within the Group’s treasury management system.
We have assessed the appropriateness of the hedge documentation, eligibility of designations, hedge effectiveness testing performed by management and tested the disclosures within the financial statements.
Key observations Our testing confirmed that the relevant controls over the recording and valuation of derivative financial instruments were effective.
We concluded that the valuation of derivatives and the Group’s use of hedge accounting is appropriate.
Independent auditor’s report to the members of National Grid plc continued
122
National Grid plc Annual Report and Accounts 2020/21 Financial Statements

6. Our application of materiality
6.1. Materiality
We define materiality as the magnitude of misstatement in the financial statements that makes it probable that the economic decisions of a reasonably knowledgeable person would be changed or influenced. We use materiality both in planning the scope of our audit work and in evaluating the results of our work.
Based on our professional judgement, we determined materiality for the financial statements as a whole as follows:
Group financial statements Parent Company financial statements
Materiality Materiality has been set at £120 million for the current year (2020: £120 million).
Materiality has been set at £100 million for the current year (2020: £100 million).
Basis for determining materiality
Our determined materiality represents 5.9% (2020: 5.1%) of adjusted profit before tax and 5.8% (2020: 6.8%) of statutory profit before tax.
Adjusted profit before tax is profit before tax, exceptional items and remeasurements as disclosed in the consolidated income statement. Prior year materiality was determined on a similar basis.
We determined materiality for our audit of the Parent Company financial statements using 0.68% of net assets (2020: 1.17%). A significant increase in intercompany receivables accounts for most of the increase in net assets. Despite the increase in net assets, we have maintained the materiality consistent with prior year.
Rationale for the benchmark applied
We consider adjusted profit before tax to be an important benchmark of the performance of the Group. We consider it appropriate to adjust for exceptional items and remeasurements as these items are volatile and not reflective of the underlying performance of the Group.
We conducted an assessment of which line items we understand to be the most important to investors and analysts by reviewing analyst reports and National Grid’s communications to shareholders and lenders, as well as the communications of peer companies. This assessment resulted in us considering the financial statement line items above.
Profit before tax is the benchmark ordinarily considered by us when auditing listed entities. It provides comparability against other companies across all sectors, but has limitations when auditing companies whose earnings are impacted by items which can be volatile from one period to the next, and therefore may not be representative of the volume of transactions and the overall size of the business in a given year, or where the impact of volatility may result in the recognition of material income or charges in a particular year.
Whilst not an IFRS measure, adjusted profit is one of the key metrics communicated by management in National Grid’s results announcements. It excludes some of the volatility arising from changes in fair values of financial assets and liabilities as well as exceptional items. It was also the key measure applied in the prior year.
Group materiality£120m
Componentmateriality range£28m to £90m
Audit Committeereporting threshold£6mKey:
Adjusted PBT £2,050mGroup materiality
As the Company is non-trading, operates primarily as a holding company for the Group’s trading entities, and is not profit orientated, we believe the net asset position is the most appropriate benchmark to use.
National Grid plc Annual Report and Accounts 2020/21
123
Financial Statements | Independent auditor’s report

6. Our application of materiality continued
6.2. Performance materiality
We set performance materiality at a level lower than materiality to reduce the probability that, in aggregate, uncorrected and undetected misstatements exceed the materiality for the financial statements as a whole. Group performance materiality was set at £96 million (2020: £92 million) or 80% of Group materiality (2020: 77%). We set performance materiality for our audit of the Parent Company financial statements at £80 million or 80% of Parent Company materiality, consistent with prior year. In determining performance materiality, we considered the following factors:• our cumulative experience from prior year audits; • the level of corrected and uncorrected misstatements identified; • our risk assessment, including our understanding of the entity and its environment; and • our assessment of the Group’s overall control environment.
Notwithstanding the significant changes in the business environment due to the COVID-19 pandemic, we increased the percentage from that of our 2020 audit to reflect the improving control environment and the continuing low level of adjustments identified by our audit.
6.3. Error reporting threshold
We agreed with the Audit Committee that we would report to the Committee all audit differences in excess of £6 million (2020: £6 million), as well as differences below that threshold that, in our view, warranted reporting on qualitative grounds. We also report to the Audit Committee on disclosure matters that we identified when assessing the overall presentation of the financial statements.
7. An overview of the scope of our audit
7.1. Identification and scoping of components
Our audit was scoped by obtaining an understanding of the Group and its environment and assessing the risks of material misstatements at the Group level. We used data analytics tools and specialists to help inform our understanding of the business, identify key risk areas and evaluate the level of audit coverage required.
The UK Electricity Transmission (including National Grid Electricity System Operator), UK Gas Transmission and US Regulated were subject to a full-scope audit for Group reporting purposes, completed to the individual component materiality levels set out below.
In addition to the above components subject to full scope audit procedures by the component teams, we have identified four other business units which form part of National Grid Ventures and Other, within which there are specific balances identified for audit procedures to be performed. Our audit planning identified the following non-significant components where we consider there to be a reasonable possibility of material misstatement in specific items within the financial statements: Grain LNG, Metering, Interconnectors and UK Property. Accordingly, we have directed component auditors to perform specific audit procedures in relation to material account balances and analytical procedures on the respective income statements and statements of financial position for these components. The work on these components is carried out by the same component audit team as for the UK Electricity Transmission and UK Gas Transmission components. The Grain LNG, Metering and Interconnectors businesses are part of National Grid Ventures. The Property business is part of ‘Other’.
Independent auditor’s report to the members of National Grid plc continued
124
National Grid plc Annual Report and Accounts 2020/21 Financial Statements

7.1. Identification and scoping of components continued
Business unit Audit scope Component materiality
UK Electricity Transmission (including National Grid Electricity System Operator) Full scope audit £52.8 million
UK Gas Transmission Full scope audit £48 million
US Regulated Full scope audit £90 million
Grain LNG Audit of specified account balances £28.8 million
Metering Audit of specified account balances £28.8 million
Interconnectors Audit of specified account balances £28.8 million
Property Audit of specified account balances £28.8 million
In addition to the work performed at a component level the Group audit team also performed audit procedures on the Parent Company financial statements, including but not limited to corporate activities such as treasury and pensions as well as on the consolidated financial statements themselves, including entity-level controls, litigation provisions, the consolidation, financial statement disclosures and risk assessment work on components not included elsewhere in the scope of our audit. The Group audit team also led the work in connection with the impact of climate change on the useful lives of the Group’s gas assets and co-ordinated certain procedures performed on key areas, such as environmental provisions, where audit work is performed by both the Group and component audit teams as well as analytical reviews on out-of-scope components.
The scope and risk assessment of our audit is consistent with the prior year and our audit coverage of ‘Revenue’, ‘Property, plant and equipment’ and ‘Gross liabilities’ is materially the same as in the prior year.
Revenue (%)
Full audit scope 95% Specified audit procedures 3% Review at group level 2%
Property, plant and equipment (%)
Full audit scope 95% Specified audit procedures 4% Review at group level 1%
Gross liabilities (%)
Full audit scope 98% Specified audit procedures 1% Review at group level 1%
National Grid plc Annual Report and Accounts 2020/21
125
Financial Statements | Independent auditor’s report

7. An overview of the scope of our audit continued
7.2. Our consideration of the control environment
Our audit approach was generally to place reliance on management’s relevant controls over all business cycles affecting in scope financial statement line items. We tested controls through a combination of tests of inquiry, observation, inspection and re-performance.
In limited situations where we were not able to take a controls reliance approach due to controls being deficient and there not being sufficient mitigating or alternative controls we could rely on instead, we adopted a non-controls reliance approach. All control deficiencies which we considered to be significant were communicated to the Audit Committee. All other deficiencies were communicated to management. For all deficiencies identified, we considered the impact and updated our audit plan accordingly.
The Group’s financial systems environment relies on a high number of UK and US applications. In the current year, we scoped 42 IT systems as relevant to the audit. These systems are all directly or indirectly relevant to the entity’s financial reporting process.
We planned to rely on the General IT Controls (GITCs) associated with these systems, where the GITCs were appropriately designed and implemented, and these were operating effectively. To assess the operating effectiveness of GITCs, our IT audit specialists performed testing on access security, change management, data centre operations and network operations.
7.3. Working with other auditors
The Group audit team are responsible for the scope and direction of the audit process and provide direct oversight, review and coordination of our component audit teams.
As each of the financially significant components maintains separate financial records we have engaged component auditors from the Deloitte member firms in the US or the UK to perform procedures at these components on our behalf. This approach allows us to engage local auditors who have appropriate knowledge of local regulations to perform this audit work. We issued detailed instructions to the component auditors and directed and supervised their work.
We interacted regularly with the component Deloitte teams during each stage of the audit and reviewed key working papers. We maintained continuous and open dialogue with our component teams in addition to holding formal meetings to ensure that we were fully aware of their progress and results of their procedures.
Our oversight of component auditors focused on the planning of their audit work and key judgements made. In particular, our supervision and direction focused on the work performed in relation to key estimates and judgements made by management. As part of our monitoring of component auditors, we participated in key local audit meetings.
Due to the COVID-19 pandemic and the travel restrictions in place during the year, the senior statutory auditor and other Group audit partners were unable to conduct visits to meet in person with the component teams responsible for the full scope locations. As a result of this, we performed alternative virtual procedures which included attending planning meetings, discussing the audit approach and any issues arising from the component team’s work, meetings with local management, and reviewing key audit working papers on higher and significant-risk areas to drive a consistent and high-quality audit. We are satisfied that the level of involvement of the lead audit partner and team in the component audits has been extensive, despite the restrictions from COVID-19 and the impact of remote working, and has enabled us to conclude that sufficient appropriate audit evidence has been obtained in support of our opinion on the Group financial statements as a whole.
8. Other information
The other information comprises the information included in the Annual Report and Accounts, other than the financial statements and our auditor’s report thereon. The directors are responsible for the other information contained within the Annual Report and Accounts. Our opinion on the financial statements does not cover the other information and, except to the extent otherwise explicitly stated in our report, we do not express any form of assurance conclusion thereon.
Our responsibility is to read the other information and, in doing so, consider whether the other information is materially inconsistent with the financial statements or our knowledge obtained in the course of the audit, or otherwise appears to be materially misstated.
If we identify such material inconsistencies or apparent material misstatements, we are required to determine whether this gives rise to a material misstatement in the financial statements themselves. If, based on the work we have performed, we conclude that there is a material misstatement of this other information, we are required to report that fact.
We have nothing to report in this regard.
9. Responsibilities of directors
As explained more fully in the directors’ responsibilities statement, the directors are responsible for the preparation of the financial statements and for being satisfied that they give a true and fair view, and for such internal control as the directors determine is necessary to enable the preparation of financial statements that are free from material misstatement, whether due to fraud or error.
In preparing the financial statements, the directors are responsible for assessing the Group’s and the Parent Company’s ability to continue as a going concern, disclosing as applicable, matters related to going concern and using the going concern basis of accounting unless the directors either intend to liquidate the Group or the Parent Company or to cease operations, or have no realistic alternative but to do so.
Independent auditor’s report to the members of National Grid plc continued
126
National Grid plc Annual Report and Accounts 2020/21 Financial Statements

10. Auditor’s responsibilities for the audit of the financial statements
Our objectives are to obtain reasonable assurance about whether the financial statements as a whole are free from material misstatement, whether due to fraud or error, and to issue an auditor’s report that includes our opinion. Reasonable assurance is a high level of assurance, but is not a guarantee that an audit conducted in accordance with ISAs (UK) will always detect a material misstatement when it exists. Misstatements can arise from fraud or error and are considered material if, individually or in the aggregate, they could reasonably be expected to influence the economic decisions of users taken on the basis of these financial statements.
A further description of our responsibilities for the audit of the financial statements is located on the FRC’s website at: www.frc.org.uk/auditorsresponsibilities. This description forms part of our auditor’s report.
11. Extent to which the audit was considered capable of detecting irregularities, including fraud
Irregularities, including fraud, are instances of non-compliance with laws and regulations. We design procedures in line with our responsibilities, outlined above, to detect material misstatements in respect of irregularities, including fraud. The extent to which our procedures are capable of detecting irregularities, including fraud is detailed below.
11.1. Identifying and assessing potential risks related to irregularities
In identifying and assessing risks of material misstatement in respect of irregularities, including fraud and non-compliance with laws and regulations, we considered the following:• the nature of the industry and sector, control environment and business performance including the design of the Group’s remuneration policies, key drivers for
directors’ remuneration, bonus levels and performance targets;• the Group’s own assessment of the risks that irregularities may occur either as a result of fraud or error;• results of our enquiries of management, internal audit and the Audit Committee about their own identification and assessment of the risks of irregularities; • any matters we identified having obtained and reviewed the Group’s documentation of their policies and procedures relating to:
• identifying, evaluating and complying with laws and regulations and whether they were aware of any instances of non-compliance;• detecting and responding to the risks of fraud and whether they have knowledge of any actual, suspected or alleged fraud; and• the internal controls established to mitigate risks of fraud or non-compliance with laws and regulations.
• the matters discussed among the audit engagement team including significant component audit teams and relevant internal specialists, including tax, valuations, pensions, IT and treasury specialists regarding how and where fraud might occur in the financial statements and any potential indicators of fraud. The engagement team includes audit partners and staff who have extensive experience of working with companies in the same sectors that National Grid operates in, and this experience was relevant to the discussion about where fraud risks may arise. The discussion was also carried out across the engagement team specific to the potential fraud implications of COVID-19 in relation to added financial pressures as well as in relation to increases in remote working.
In common with all audits under ISAs (UK), we are also required to perform specific procedures to respond to the risk of management override.
We also obtained an understanding of the legal and regulatory frameworks that the Group operates in, focusing on provisions of those laws and regulations that had a direct effect on the determination of material amounts and disclosures in the financial statements. The key laws and regulations we considered in this context included the UK Companies Act, UK Corporate Governance Code, IFRS as issued by the IASB and adopted by the EU, FRS 101, Listing Rules, pensions and tax legislation, US Securities Exchange Act 1934 and relevant SEC regulations, as well as laws and regulations prevailing in each country in which we identified a full scope component.
In addition, we considered provisions of other laws and regulations that do not have a direct effect on the financial statements but compliance with which may be fundamental to the Group’s ability to operate or to avoid a material penalty. These included the Group’s operating licences and environmental regulations.
11.2. Audit response to risks identified
As a result of performing the above, we did not identify any key audit matters related to the potential risk of fraud or non-compliance with laws and regulations. Our procedures to respond to risks identified included the following:• reviewing the financial statement disclosures and testing to supporting documentation to assess compliance with provisions of relevant laws and regulations
described as having a direct effect on the financial statements;• enquiring of management, the Audit Committee and in-house legal counsel concerning actual and potential litigation and claims;• performing analytical procedures to identify any unusual or unexpected relationships that may indicate risks of material misstatement due to fraud; and• reading minutes of meetings of those charged with governance, internal audit reports and reviewing correspondence with relevant regulatory authorities.
In addressing the risk of fraud through management override of controls our procedures included:• making inquiries of individuals involved in the financial reporting process about inappropriate or unusual activity relating to the processing of journal entries and
other adjustments;• using our data analytics tools, we selected and tested journal entries and other adjustments made at the end of a reporting period or which identified activity that
exhibited certain characteristics of audit interest;• assessing whether the judgements made in making accounting estimates are indicative of a potential bias, and evaluating the business rationale of any significant
transactions that are unusual or outside the normal course of business;• performing analytical procedures to identify any unusual or unexpected relationships that may indicate risks of material misstatement due to fraud; and• considering whether there were any significant transactions that are outside the normal course of business, or that otherwise appear to be unusual due to their
nature, timing or size.
We also communicated relevant identified laws and regulations and potential fraud risks to all engagement team members including internal specialists and significant component audit teams, and remained alert to any indications of fraud or non-compliance with laws and regulations throughout the audit.
National Grid plc Annual Report and Accounts 2020/21
127
Financial Statements | Independent auditor’s report

Report on other legal and regulatory requirements
12. Opinions on other matters prescribed by the Companies Act 2006
In our opinion the part of the directors’ remuneration report to be audited has been properly prepared in accordance with the Companies Act 2006.
In our opinion, based on the work undertaken in the course of the audit:• the information given in the strategic report and the directors’
report for the financial year for which the financial statements are prepared is consistent with the financial statements; and
• the strategic report and the directors’ report have been prepared in accordance with applicable legal requirements.
In the light of the knowledge and understanding of the Group and the Parent Company and their environment obtained in the course of the audit, we have not identified any material misstatements in the strategic report or the directors’ report.
13. Corporate Governance StatementThe Listing Rules require us to review the directors’ statement in relation to going concern, longer-term viability and that part of the Corporate Governance Statement relating to the Group’s compliance with the provisions of the UK Corporate Governance Code specified for our review.
Based on the work undertaken as part of our audit, we have concluded that each of the following elements of the Corporate Governance Statement is materially consistent with the financial statements and our knowledge obtained during the audit: • the directors’ statement with regards to the appropriateness of
adopting the going concern basis of accounting and any material uncertainties identified set out on page 135;
• the directors’ explanation as to its assessment of the Group’s prospects, the period this assessment covers and why the period is appropriate set out on pages 28 − 29;
• the directors’ statement on fair, balanced and understandable set out on pages 84 and 86;
• the board’s confirmation that it has carried out a robust assessment of the emerging and principal risks set out on page 25 − 27 and 29;
• the section of the Annual Report and Accounts that describes the review of effectiveness of risk management and internal control systems set out on page 24 − 27; and
• the section describing the work of the Audit Committee set out on pages 83 − 87.
14. Matters on which we are required to report by exception 14.1. Adequacy of explanations received and accounting recordsUnder the Companies Act 2006 we are required to report to you if, in our opinion:• we have not received all the information and explanations we require
for our audit; or• adequate accounting records have not been kept by the Parent
Company, or returns adequate for our audit have not been received from branches not visited by us; or
• the Parent Company financial statements are not in agreement with the accounting records and returns.
We have nothing to report in respect of these matters.
14.2. Directors’ remunerationUnder the Companies Act 2006 we are also required to report if in our opinion certain disclosures of directors’ remuneration have not been made or the part of the directors’ remuneration report to be audited is not in agreement with the accounting records and returns.
We have nothing to report in respect of these matters.
15. Other matters which we are required to address15.1. Auditor tenureWe became independent and commenced our audit transition on 1 January 2017. Following the recommendation of the Audit Committee, we were appointed by the Shareholders at the Annual General Meeting on 31 July 2017 to audit the financial statements for the year ending 31 March 2018 and subsequent financial periods.
The period of total uninterrupted engagement including previous renewals and reappointments of the firm is four years, covering the years ending 31 March 2018 to 31 March 2021.
15.2. Consistency of the audit report with the additional report to the Audit Committee
Our audit opinion is consistent with the additional report to the Audit Committee we are required to provide in accordance with ISAs (UK).
16. Use of our reportThis report is made solely to the Company’s members, as a body, in accordance with Chapter 3 of Part 16 of the Companies Act 2006. Our audit work has been undertaken so that we might state to the Company’s members those matters we are required to state to them in an auditor’s report and for no other purpose. To the fullest extent permitted by law, we do not accept or assume responsibility to anyone other than the Company and the Company’s members as a body, for our audit work, for this report, or for the opinions we have formed.
Douglas King FCA (Senior statutory auditor)For and on behalf of Deloitte LLP Statutory Auditor London, United Kingdom 19 May 2021
Independent auditor’s report to the members of National Grid plc continued
128
National Grid plc Annual Report and Accounts 2020/21 Financial Statements

2021 Notes
Before exceptional items and
remeasurements£m
Exceptional items and remeasurements
(note 5)£m
Total£m
Continuing operations
Revenue 2(a),3 14,779 — 14,779
Provision for bad and doubtful debts 4 (326) — (326)
Other operating costs 4,5 (11,527) (31) (11,558)
Operating profit/(loss) 2(b) 2,926 (31) 2,895
Finance income 5,6 35 23 58
Finance costs 5,6 (977) 49 (928)
Share of post-tax results of joint ventures and associates 5,16 66 (8) 58
Profit before tax 2(b),5 2,050 33 2,083
Tax 5,7 (416) (26) (442)
Total profit for the year 1,634 7 1,641
Attributable to:
Equity shareholders of the parent 1,633 7 1,640
Non-controlling interests from continuing operations 1 — 1
Earnings per share (pence)
Basic earnings per share (continuing) 8 46.6
Diluted earnings per share (continuing) 8 46.3
Basic earnings per share (continuing and discontinued) 8 46.6
Diluted earnings per share (continuing and discontinued) 8 46.3
2020 Notes
Before exceptional items and remeasurements
£m
Exceptional items and remeasurements
(note 5)£m
Total£m
Continuing operations
Revenue 2(a),3 14,540 — 14,540
Provision for bad and doubtful debts 4 (234) — (234)
Other operating costs 4,5 (10,999) (527) (11,526)
Operating profit/(loss) 2(b) 3,307 (527) 2,780
Finance income 5,6 70 (16) 54
Finance costs 5,6 (1,119) (48) (1,167)
Share of post-tax results of joint ventures and associates 5,16 88 (1) 87
Profit/(loss) before tax 2(b),5 2,346 (592) 1,754
Tax 5,7 (433) (47) (480)
Profit/(loss) after tax from continuing operations 5 1,913 (639) 1,274
Profit/(loss) after tax from discontinued operations 10 5 (14) (9)
Total profit/(loss) for the year (continuing and discontinued) 1,918 (653) 1,265
Attributable to:
Equity shareholders of the parent 1,917 (653) 1,264
Non-controlling interests from continuing operations 1 — 1
Earnings per share (pence)
Basic earnings per share (continuing) 8 36.8
Diluted earnings per share (continuing) 8 36.6
Basic earnings per share (continuing and discontinued) 8 36.5
Diluted earnings per share (continuing and discontinued) 8 36.3
National Grid plc Annual Report and Accounts 2020/21 Financial Statements
Consolidated income statementfor the years ended 31 March
129

2019 Notes
Before exceptional items and remeasurements
£m
Exceptional items and remeasurements
(note 5)£m
Total£m
Continuing operations
Revenue 2(a),3 14,933 — 14,933
Provision for bad and doubtful debts 4 (181) — (181)
Other operating costs 4,5 (11,310) (572) (11,882)
Operating profit/(loss) 2(b) 3,442 (572) 2,870
Finance income 5,6 73 15 88
Finance costs 5,6 (1,066) (91) (1,157)
Share of post-tax results of joint ventures and associates 10 40 — 40
Profit/(loss) before tax 2(b),5 2,489 (648) 1,841
Tax 5,7 (488) 149 (339)
Profit/(loss) after tax from continuing operations 5 2,001 (499) 1,502
Profit/(loss) after tax from discontinued operations 10 57 (45) 12
Total profit/(loss) for the year (continuing and discontinued) 2,058 (544) 1,514
Attributable to:
Equity shareholders of the parent 2,055 (544) 1,511
Non-controlling interests from continuing operations 3 — 3
Earnings per share (pence)
Basic earnings per share (continuing) 8 44.3
Diluted earnings per share (continuing) 8 44.1
Basic earnings per share (continuing and discontinued) 8 44.6
Diluted earnings per share (continuing and discontinued) 8 44.4
National Grid plc Annual Report and Accounts 2020/21 Financial Statements
Consolidated income statementfor the years ended 31 March continued
130

2021 2020 2019Notes £m £m £m
Profit after tax from continuing operations 1,641 1,274 1,502
Other comprehensive income from continuing operations
Items from continuing operations that will never be reclassified to profit or loss:
Remeasurement gains/(losses) on pension assets and post-retirement benefit obligations 25 1,408 (724) 68
Net gains/(losses) on equity instruments designated at fair value through other comprehensive income 46 (9) —
Net (losses)/gains on financial liability designated at fair value through profit and loss attributable to changes in own credit risk (11) (3) 7
Net losses in respect of cash flow hedging of capital expenditure (14) (17) (13)
Tax on items that will never be reclassified to profit or loss 7 (422) 212 (15)
Total items from continuing operations that will never be reclassified to profit or loss 1,007 (541) 47
Items from continuing operations that may be reclassified subsequently to profit or loss:
Exchange adjustments¹ (1,347) 561 361
Net gains/(losses) in respect of cash flow hedges 70 (128) (40)
Net gains/(losses) in respect of cost of hedging 14 (78) (66)
Net gains/(losses) on investment in debt instruments measured at fair value through other comprehensive income 80 (15) 2
Share of other comprehensive income/(losses) of associates, net of tax 1 (5) 1
Tax on items that may be reclassified subsequently to profit or loss 7 (8) 35 12
Total items from continuing operations that may be reclassified subsequently to profit or loss (1,190) 370 270
Other comprehensive (loss)/income for the year, net of tax from continuing operations (183) (171) 317
Other comprehensive income for the year, net of tax from discontinued operations² 10 — 6 36
Other comprehensive (loss)/income for the year, net of tax (183) (165) 353
Total comprehensive income for the year from continuing operations 1,458 1,103 1,819
Total comprehensive (loss)/income for the year from discontinued operations 10 — (3) 48
Total comprehensive income for the year 1,458 1,100 1,867
Attributable to:
Equity shareholders of the parent
From continuing operations 1,459 1,101 1,815
From discontinued operations — (3) 48
1,459 1,098 1,863
Non-controlling interests
From continuing operations (1) 2 4
1. Comparative amounts have been revised as described in note 1F.2. The other comprehensive income from discontinued operations relates to the items of other comprehensive income of Cadent (investment through Quadgas HoldCo Limited). Refer to note 10
for details.
National Grid plc Annual Report and Accounts 2020/21 Financial Statements
Consolidated statement of comprehensive incomefor the years ended 31 March
131

Share capital
£m
Share premium account
£m
Retained earnings
£m
Other equity reserves1
£m
Total shareholders’
equity£m
Non- controlling
interests£m
Total equity
£m
At 31 March 2018 (as previously reported) 452 1,321 21,599 (4,540) 18,832 16 18,848
Prior year adjustment² — — 185 — 185 — 185
Impact of transition to IFRS 9 and IFRS 15 — — (268) 72 (196) — (196)
At 31 March 2018 (as restated) 452 1,321 21,516 (4,468) 18,821 16 18,837
Profit for the year — — 1,511 — 1,511 3 1,514
Other comprehensive income for the year — — 89 263 352 1 353
Total comprehensive income for the year — — 1,600 263 1,863 4 1,867
Equity dividends — — (1,160) — (1,160) — (1,160)
Scrip dividend-related share issue³ 6 (7) — — (1) — (1)
Issue of treasury shares — — 18 — 18 — 18
Purchase of own shares — — (2) — (2) — (2)
Share-based payments — — 27 — 27 — 27
Cash flow hedges transferred to the statement of financial position, net of tax — — — (18) (18) — (18)
At 1 April 2019 458 1,314 21,999 (4,223) 19,548 20 19,568
Profit for the year — — 1,264 — 1,264 1 1,265
Other comprehensive (loss)/income for the year — — (509) 343 (166) 1 (165)
Total comprehensive income for the year — — 755 343 1,098 2 1,100
Equity dividends — — (892) — (892) — (892)
Scrip dividend-related share issue³ 12 (13) — — (1) — (1)
Issue of treasury shares — — 17 — 17 — 17
Purchase of own shares — — (6) — (6) — (6)
Share-based payments — — 19 — 19 — 19
Tax on share-based payments — — 3 — 3 — 3
Cash flow hedges transferred to the statement of financial position, net of tax — — — (15) (15) — (15)
At 1 April 2020 470 1,301 21,895 (3,895) 19,771 22 19,793
Profit for the year — — 1,640 — 1,640 1 1,641
Other comprehensive income/(loss) for the year — — 1,001 (1,182) (181) (2) (183)
Total comprehensive income/(loss) for the year — — 2,641 (1,182) 1,459 (1) 1,458
Equity dividends — — (1,413) — (1,413) — (1,413)
Scrip dividend-related share issue³ 4 (5) — — (1) — (1)
Issue of treasury shares — — 17 — 17 — 17
Purchase of own shares — — (2) — (2) — (2)
Share-based payments — — 27 — 27 — 27
Tax on share-based payments — — (2) — (2) — (2)
Cash flow hedges transferred to the statement of financial position, net of tax — — — (17) (17) — (17)
At 31 March 2021 474 1,296 23,163 (5,094) 19,839 21 19,860
1. For further details of other equity reserves, see note 28.2. Comparative amounts have been revised as described in note 1F.3. Included within the share premium account are costs associated with scrip dividends.
National Grid plc Annual Report and Accounts 2020/21 Financial Statements
Consolidated statement of changes in equityfor the years ended 31 March
132

2021 2020 2019Notes £m £m £m
Non-current assets
Goodwill¹ 11 4,588 5,712 5,372
Other intangible assets 12 1,443 1,295 1,084
Property, plant and equipment¹ 13 47,043 49,762 44,859
Other non-current assets 14 293 354 264
Pension assets 25 1,747 1,849 1,567
Financial and other investments 15 755 543 667
Investments in joint ventures and associates 16 867 995 608
Derivative financial assets 17 542 1,249 1,045
Total non-current assets 57,278 61,759 55,466
Current assets
Inventories and current intangible assets 18 439 549 370
Trade and other receivables 19 2,919 2,986 3,153
Current tax assets 67 102 126
Financial and other investments 15 2,342 1,998 1,981
Derivative financial assets 17 457 93 108
Cash and cash equivalents 20 157 73 252
Assets held for sale 10 3,557 — 1,956
Total current assets 9,938 5,801 7,946
Total assets 67,216 67,560 63,412
Current liabilities
Borrowings 21 (3,737) (4,072) (4,472)
Derivative financial liabilities 17 (145) (380) (350)
Trade and other payables 22 (3,517) (3,602) (3,769)
Contract liabilities 23 (66) (76) (61)
Current tax liabilities (75) (86) (161)
Provisions 26 (260) (348) (316)
Liabilities held for sale 10 (1,568) — —
Total current liabilities (9,368) (8,564) (9,129)
Non-current liabilities
Borrowings 21 (27,483) (26,722) (24,258)
Derivative financial liabilities 17 (754) (954) (833)
Other non-current liabilities 24 (843) (891) (808)
Contract liabilities 23 (1,094) (1,082) (933)
Deferred tax liabilities¹ 7 (4,815) (4,446) (4,215)
Pensions and other post-retirement benefit obligations 25 (1,032) (2,802) (1,785)
Provisions 26 (1,967) (2,306) (1,883)
Total non-current liabilities (37,988) (39,203) (34,715)
Total liabilities (47,356) (47,767) (43,844)
Net assets 19,860 19,793 19,568
Equity
Share capital 27 474 470 458
Share premium account 1,296 1,301 1,314
Retained earnings¹ 23,163 21,895 21,999
Other equity reserves¹ 28 (5,094) (3,895) (4,223)
Total shareholders’ equity 19,839 19,771 19,548
Non-controlling interests 21 22 20
Total equity 19,860 19,793 19,568
1. Comparative amounts have been revised as described in note 1F.
The consolidated financial statements set out on pages 129 to 216 were approved by the Board of Directors on 19 May 2021 and were signed on its behalf by:
Sir Peter Gershon Chairman Andy Agg Chief Financial Officer
National Grid plcRegistered number: 4031152
National Grid plc Annual Report and Accounts 2020/21 Financial Statements
Consolidated statement of financial position as at 31 March
133

2021 2020 2019Notes £m £m £m
Cash flows from operating activities
Total operating profit from continuing operations 2(b) 2,895 2,780 2,870
Adjustments for:
Exceptional items and remeasurements 5 31 527 572
Other fair value movements (22) — —
Depreciation, amortisation and impairment 1,672 1,640 1,588
Share-based payments 27 19 27
Changes in working capital 312 269 40
Changes in provisions (195) (169) (110)
Changes in pensions and other post-retirement benefit obligations (55) (92) (123)
Cash flows relating to exceptional items (47) (60) (400)
Cash generated from operations – continuing operations 4,618 4,914 4,464
Tax paid (157) (199) (75)
Net cash inflow from operating activities – continuing operations 4,461 4,715 4,389
Net cash used in operating activities – discontinued operations 10 — (97) (71)
Cash flows from investing activities
Acquisition of financial investments (99) (108) (89)
Acquisition of National Grid Renewables (formerly Geronimo) and Emerald 38 (26) (139) —
Investments in joint ventures and associates (81) (82) (143)
Loans to joint ventures and associates — — (31)
Disposal of financial investments 66 63 18
Disposal of interests in Quadgas HoldCo Limited 10 — 1,965 —
Purchases of intangible assets (426) (317) (306)
Purchases of property, plant and equipment (4,362) (4,583) (3,635)
Disposals of property, plant and equipment 8 68 38
Dividends received from joint ventures and associates 80 75 68
Interest received 16 73 68
Net movements in short-term financial investments (436) 7 822
Cash inflows on derivatives 225 58 17
Cash outflows on derivatives (81) (281) (429)
Net cash flow used in investing activities – continuing operations (5,116) (3,201) (3,602)
Net cash flow used in investing activities – discontinued operations 10 — 6 156
Cash flows from financing activities
Proceeds from issue of treasury shares 16 16 17
Purchase of own shares (2) (6) (2)
Proceeds received from loans 29(c) 5,645 4,218 2,932
Repayment of loans 29(c) (1,663) (3,253) (1,969)
Payments of lease liabilities 29(c) (112) (121) (70)
Net movements in short-term borrowings 29(c) (759) (424) 179
Cash inflows on derivatives 29(c) 58 62 221
Cash outflows on derivatives 29(c) (185) (249) (186)
Interest paid 29(c) (835) (957) (914)
Dividends paid to shareholders (1,413) (892) (1,160)
Net cash flow from/(used in) financing activities – continuing operations 750 (1,606) (952)
Net increase/(decrease) in cash and cash equivalents 29(b) 95 (183) (80)
Reclassification to held for sale 10,29(b) (4) — —
Exchange movements (7) 4 3
Cash and cash equivalents at start of year 73 252 329
Cash and cash equivalents at end of year 20 157 73 252
National Grid plc Annual Report and Accounts 2020/21 Financial Statements
Consolidated cash flow statementfor the years ended 31 March
134

1. Basis of preparation and recent accounting developments
Accounting policies describe our approach to recognising and measuring transactions and balances in the year. The accounting policies applicable across the financial statements are shown below, whereas accounting policies that are specific to a component of the financial statements have been incorporated into the relevant note.
This section also shows areas of judgement and key sources of estimation uncertainty in these financial statements. In addition, we have summarised new International Accounting Standards Board (IASB) and EU endorsed accounting standards, amendments and interpretations and whether these are effective for this year end or in later years, explaining how significant changes are expected to affect our reported results.
National Grid’s principal activities involve the transmission and distribution of electricity and gas in Great Britain and northeastern US. The Company is a public limited liability company incorporated and domiciled in England and Wales, with its registered office at 1–3 Strand, London WC2N 5EH.
The Company, National Grid plc, which is the ultimate parent of the Group, has its primary listing on the London Stock Exchange and is also quoted on the New York Stock Exchange.
These consolidated financial statements were approved for issue by the Board on 19 May 2021.
These consolidated financial statements have been prepared in accordance with International Accounting Standards (IAS) and International Financial Reporting Standards (IFRS) and related interpretations as issued by the IASB and IFRS as adopted by the EU. They are prepared on the basis of all IFRS accounting standards and interpretations that are mandatory for periods ended 31 March 2021 and in accordance with the Companies Act 2006 applicable to companies reporting under IFRS adopted pursuant to Regulation (EC) No. 1606/2002 as it applies in the European Union. The comparative financial information has also been prepared on this basis.
The consolidated financial statements have been prepared on a historical cost basis, except for the recording of pension assets and liabilities, the revaluation of derivative financial instruments and certain commodity contracts and certain financial assets and liabilities measured at fair value.
These consolidated financial statements are presented in pounds sterling, which is also the functional currency of the Company.
The notes to the financial statements have been prepared on a continuing basis unless otherwise stated.
Our income statement and segmental analysis separately identify financial results before and after exceptional items and remeasurements. We continue to use a columnar presentation as we consider it improves the clarity of the presentation, and is consistent with the way that financial performance is measured by management and reported to the Board and the Executive Committee, and assists users of the financial statements to understand the results. The inclusion of total profit for the period from continuing operations before exceptional items and remeasurements is used to derive part of the incentive target set annually for remunerating certain Executive Directors and accordingly we believe it is important for users of the financial statements to understand how this compares to our results on a statutory basis and period on period.
A. Going concernAs part of the Directors’ consideration of the appropriateness of adopting the going concern basis of accounting in preparing these financial statements, the Directors have considered both the impact of COVID-19 on the Group’s operations alongside the impact of the acquisition of PPL WPD Investments Limited (WPD) (see note 38) and subsequent disposal of The Narragansett Electric Company (NECO) (see note 10) and the expected planned disposal of a majority stake of National Grid Gas plc. The Directors have assessed the principal risks discussed on pages 24 – 27, including by modelling both a base case and a reasonable worst case scenario.
Reasonable worst-case: The reasonable worst-case scenario covers the materially adverse cash flow impact associated with a further year of COVID-19 disruption across both the UK and US, with a subsequent phased return to normal operations, increased cash outflows from higher costs (e.g. storms), while still delivering our planned capital investment programme for the year ended 31 March 2022. The continuing economic impact of COVID-19 and the consequential impact on cash collections and capital programmes is the key judgement applied in the analysis. The main cash flow impacts identified in the reasonable worst-case scenario are:• a significant reduction in cash collections driven by lower customer
demand and increased bad debt in our US businesses;• additional working capital required to fund payment term extensions and
charge deferrals in the UK electricity market, intended to help customers and end-user consumers; and
• further increases in other costs such as cleaning, safety equipment and IT; offset by a continued reduction in discretionary spend across all areas (e.g. recruitment, travel and consultancy spend).
Impact of WPD acquisition: The cash flows associated with WPD have been based on historic actuals alongside information obtained as part of the financial due diligence process and associated discussions with WPD management. The Directors noted the impact of the transaction on the Group’s financing position as below:• a new bridge facility of £8.25 billion to finance the acquisition, with the first
repayment of the bridge expected to be from the proceeds of the announced planned business disposals in 2022; and
• c.£1.1 billion of committed facilities to fund WPD working capital.
As part of their analysis, the Board also considered the following potential levers at their discretion to improve the position identified by the analysis if the debt capital markets are not accessible:• the payment of dividends to shareholders;• significant changes in the phasing of the Group’s capital programme with
elements of non-essential works and programmes delayed; and• a number of further reductions in operating expenditure across the Group
primarily related to workforce cost reductions in both the UK and the US.
Having considered the reasonable worst-case scenario, the impact of the acquisition of WPD (and any penalties if the transaction did not proceed), the timing of the NECO and National Grid Gas plc transactions, and the further levers at the Board’s discretion, the Group continues to have headroom against the Group’s committed facilities identified in note 33 to the financial statements.
In addition to the above, the ability to raise new financing was separately included in the analysis, and the Directors noted the c.£5.6 billion debt issuances completed in the period from 1 April 2020 to 31 March 2021 (disclosed in note 21 to the financial statements) as evidence of the Group’s ability to continue to have access to the debt capital markets if needed. Other factors considered by the Board as part of their Going Concern assessment included the final determinations of the UK RIIO-2 price controls process, the Group’s various ongoing rate case determinations in the US alongside inherent uncertainties in cash flow forecasts (such as the impact of storms in our US business).
Based on the above, the Directors have concluded the Group is well placed to manage its financing and other business risks satisfactorily and have a reasonable expectation that the Group will have adequate resources to continue in operation for at least 12 months from the signing date of these consolidated financial statements. They therefore consider it appropriate to adopt the going concern basis of accounting in preparing the financial statements.
National Grid plc Annual Report and Accounts 2020/21 Financial Statements
Notes to the consolidated financial statements
135

1. Basis of preparation and recent accounting developments continued
B. Basis of consolidationThe consolidated financial statements incorporate the results, assets and liabilities of the Company and its subsidiaries, together with a share of the results, assets and liabilities of joint operations.
A subsidiary is defined as an entity controlled by the Group. Control is achieved where the Group is exposed to, or has the rights to, variable returns from its involvement with the entity and has the power to affect those returns through its power over the entity.
The Group accounts for joint ventures and associates using the equity method of accounting, where the investment is carried at cost plus post-acquisition changes in the share of net assets of the joint venture or associate, less any provision for impairment. Losses in excess of the consolidated interest in joint ventures and associates are not recognised, except where the Company or its subsidiaries have made a commitment to make good those losses.
Where necessary, adjustments are made to bring the accounting policies used in the individual financial statements of the Company, subsidiaries, joint operations, joint ventures and associates into line with those used by the Group in its consolidated financial statements under IFRS. Intercompany transactions are eliminated.
The results of subsidiaries, joint operations, joint ventures and associates acquired or disposed of during the year are included in the consolidated income statement from the effective date of acquisition or up to the effective date of disposal, as appropriate.
Acquisitions are accounted for using the acquisition method, where the purchase price is allocated to the identifiable assets acquired and liabilities assumed on a fair value basis and the remainder recognised as goodwill.
C. Foreign currenciesTransactions in currencies other than the functional currency of the Company or subsidiary concerned are recorded at the rates of exchange prevailing on the dates of the transactions. At each reporting date, monetary assets and liabilities that are denominated in foreign currencies are retranslated at closing exchange rates. Non-monetary assets are not retranslated unless they are carried at fair value.
Gains and losses arising on the retranslation of monetary assets and liabilities are included in the income statement, except where the application of hedge accounting requires inclusion in other comprehensive income (see note 32(e)).
On consolidation, the assets and liabilities of operations that have a functional currency different from the Company’s functional currency of pounds sterling, principally our US operations that have a functional currency of US dollars, are translated at exchange rates prevailing at the reporting date. Income and expense items are translated at the average exchange rates for the period where these do not differ materially from rates at the date of the transaction. Exchange differences arising are recognised in other comprehensive income and transferred to the consolidated translation reserve within other equity reserves (see note 28).
D. Disposal of The Narragansett Electric CompanyAs described further in note 10, on 17 March 2021, the Group signed an agreement to sell 100% of the share capital of a wholly owned subsidiary, The Narragansett Electric Company (NECO). The sale is expected to complete in early 2022 once all regulatory approvals are obtained.
As the sale is considered highly probable and is expected to complete within a year, the associated assets and liabilities have been presented as held for sale in the consolidated statement of financial position. However, the transaction has not met the criteria for classification as a discontinued operation and therefore its results for the period are not separately disclosed on the face of the income statement.
E. Areas of judgement and key sources of estimation uncertainty The preparation of financial statements requires management to make estimates and assumptions that affect the reported amounts of assets and liabilities, disclosures of contingent assets and liabilities, and the reported amounts of revenue and expenses during the reporting period. Actual results could differ from these estimates. Information about such judgements and estimations is in the notes to the financial statements, and the key areas are summarised below.
Areas of judgement that have the most significant effect on the amounts recognised in the financial statements are as follows: • categorisation of certain items as exceptional items or remeasurements
and the definition of adjusted earnings (see notes 5 and 8). In applying the Group’s exceptional items framework, we have considered a number of key matters, as detailed in note 5;
• the judgement that notwithstanding legislation enacted and targets committing the UK, New York State and Massachusetts to achieving net zero greenhouse gas emissions by 2050, these do not trigger a reassessment of the remaining useful economic lives of our gas network assets (see estimate below and note 13); and
• following the legal separation of the Electricity System Operator on 1 April 2019, we concluded that the Electricity System Operator acts as an agent in respect of certain Transmission Network Use of Service revenues, principally those collected on behalf of the Scottish and Offshore transmission operators, as detailed in note 3.
Key sources of estimation uncertainty that have a significant risk of causing a material adjustment to the carrying amounts of assets and liabilities within the next financial year are as follows: • the valuation of liabilities for pensions and other post-retirement benefits
(see note 25); and • the cash flows applied in determining the environmental provisions, in
particular relating to three US Superfund sites (see note 26).
In light of the current ongoing impact of the COVID-19 pandemic, valuations of certain assets and liabilities are necessarily more subjective. The main impact at 31 March 2021 is the consideration of the recoverability of customer receivables, particularly in relation to US retail customers, in light of the suspension of debt collection activities and customer termination activities (see note 19), which is an area of estimation uncertainty impacting the Group’s position as at 31 March 2021.
In addition, we also highlight the estimates made regarding the useful economic lives of our gas network assets due to the length over which they are being depreciated, the potential for new and evolving technologies over that period, and the range of potential pathways for meeting net zero targets (see note 13 for details and sensitivity analysis).
In order to illustrate the impact that changes in assumptions for the valuation of pension assets and liabilities and cash flows for environmental provisions could have on our results and financial position, we have included sensitivity analyses in note 35. Information on what we believe a reasonably possible range of outcomes to be on the recoverability of customer receivables are included in note 19.
National Grid plc Annual Report and Accounts 2020/21 Financial Statements
Notes to the consolidated financial statementscontinued
136

1. Basis of preparation and recent accounting developments continued
F. Comparative period revisionsDuring the year, we have revised the comparative balances primarily to reflect adjustments between property, plant and equipment and goodwill related to the accounting performed for acquisitions made by our US business between 2000 and 2007. The adjustments related to the treatment of certain regulatory liabilities recognised under US GAAP on the acquisition balance sheets under UK GAAP and IFRS. This resulted in an overstatement of goodwill and an understatement of property, plant and equipment. The adjustments had a resulting impact on the deferred tax balances that were recognised at the time of the acquisitions and therefore, these have also been updated for all periods presented, also taking into account any subsequent changes in tax rates. The translation reserve on consolidation of these subsidiaries was also updated.
There have been no income statement impacts (and therefore no impact on the previously reported earnings per share) for any of the periods presented. Opening retained earnings have increased to correct the income statement impact of amortising the overstated goodwill from the period after acquisition until the adoption of IFRS in 2005 and for the impact on deferred tax of the tax rate changes noted above. Any foreign exchange impacts are recorded within the translation reserve within other equity reserves.
Below we set out the impacted line items and the adjustments to our opening statement of financial position as at 1 April 2018. In addition, we set out the adjustments to previously presented balances as at 31 March 2019 and 31 March 2020 (with the only movement each period being as a result of foreign exchange movements):
1 April 2018 31 March 2019 31 March 2020£m £m £m
Goodwill (460) (497) (521)
Property, plant and equipment 877 946 992
Deferred tax liability 232 250 262
Retained earnings 185 185 185
Translation reserve — 14 24
G. Accounting policy choicesIFRS provides certain options available within accounting standards. Choices we have made, and continue to make, include the following:• Presentational formats: we use the nature of expense method for our
income statement and aggregate our statement of financial position to net assets and total equity. In the income statement, we present subtotals of total operating profit, profit before tax and profit after tax from continuing operations, together with additional subtotals excluding exceptional items and remeasurements as a result of the three columnar presentation described earlier. Exceptional items and remeasurements are presented in a separate column on the face of the income statement.
• Financial instruments: we normally opt to apply hedge accounting in most circumstances where this is permitted (see note 32(e)).
H. New IFRS accounting standards and interpretations effective for the year ended 31 March 2021 The UK’s Financial Conduct Authority announced that the London Inter-bank Offered Rate (LIBOR) will cease to exist by the end of 2021, and will be replaced by alternative reference rates. In September 2019, the IASB amended IFRS 9 and IFRS 7 by issuing Phase I of Interest Rate Benchmark Reform, which modified certain hedge accounting requirements to allow hedge accounting to continue for affected hedges during the period of uncertainty before the hedged items or hedging instruments were amended as a result of the change in the reference rate. The amendments were endorsed in January 2020 for adoption in the EU. The Group early-adopted these changes to IFRS 9 and IFRS 7 with effect from 1 April 2019. Phase II was issued in August 2020 and endorsed in January 2021 for adoption in the EU, resulting in amendments to IFRS 9, IFRS 7 and IFRS 16. The Group has early-adopted these amendments with effect from 1 April 2020 as they enable the Company and its subsidiaries to reflect the effects of transitioning from LIBOR to alternative benchmark interest rates without giving rise to accounting impacts that would not provide useful information to users of the financial statements. There were no transition adjustments on adoption of either phase and the Group has not restated the prior period, but instead has applied the amendments prospectively. Refer to note 32(d) for further details on the contracts to be transitioned to the new alternative benchmark interest rate and for details of our migration project.
The Group has also adopted the following amendments to standards, which have had no material impact on the Group’s results or financial statement disclosure: • amendments to IFRS 16 ‘Leases – COVID-19 Related Rent
Concessions’; • amendments to IFRS 3 ‘Business Combinations’; • amendments to IAS 1 and IAS 8 ‘Definition of Material’; and • amendments to the References to the Conceptual Framework.
I. New IFRS accounting standards and interpretations not yet adoptedWith effect from the period commencing 1 April 2021, the consolidated financial statements will be prepared in accordance with IAS and IFRS and related interpretations as adopted by the UK, instead of those adopted by the EU. As both sets of accounting standards are currently aligned, there will be no transitional adjustments required and comparative amounts will not be required to be restated.
The following new accounting standards and amendments to existing standards have been issued but are not yet effective or have not yet been endorsed by the EU: • IFRS 17 ‘Insurance Contracts’; • amendments to IFRS 3 ‘Business Combinations’; • amendments to IAS 16 ‘Property, Plant and Equipment’; • amendments to IAS 37 ‘Provisions, Contingent Liabilities and Contingent
Assets’;• amendments to IAS 1 ‘Presentation of Financial Statements’; • amendments to IAS 8 ‘Accounting Policies, Changes in Accounting
Estimates and Errors’; and• annual improvements to IFRS standards 2018-2020.
Effective dates will be subject to the UK endorsement process.
The Group is currently assessing the impact of the above standards, but they are not expected to have a material impact. The Group has not adopted any other standard, amendment or interpretation that has been issued but is not yet effective.
National Grid plc Annual Report and Accounts 2020/21 Financial Statements | Notes to the consolidated financial statements
137
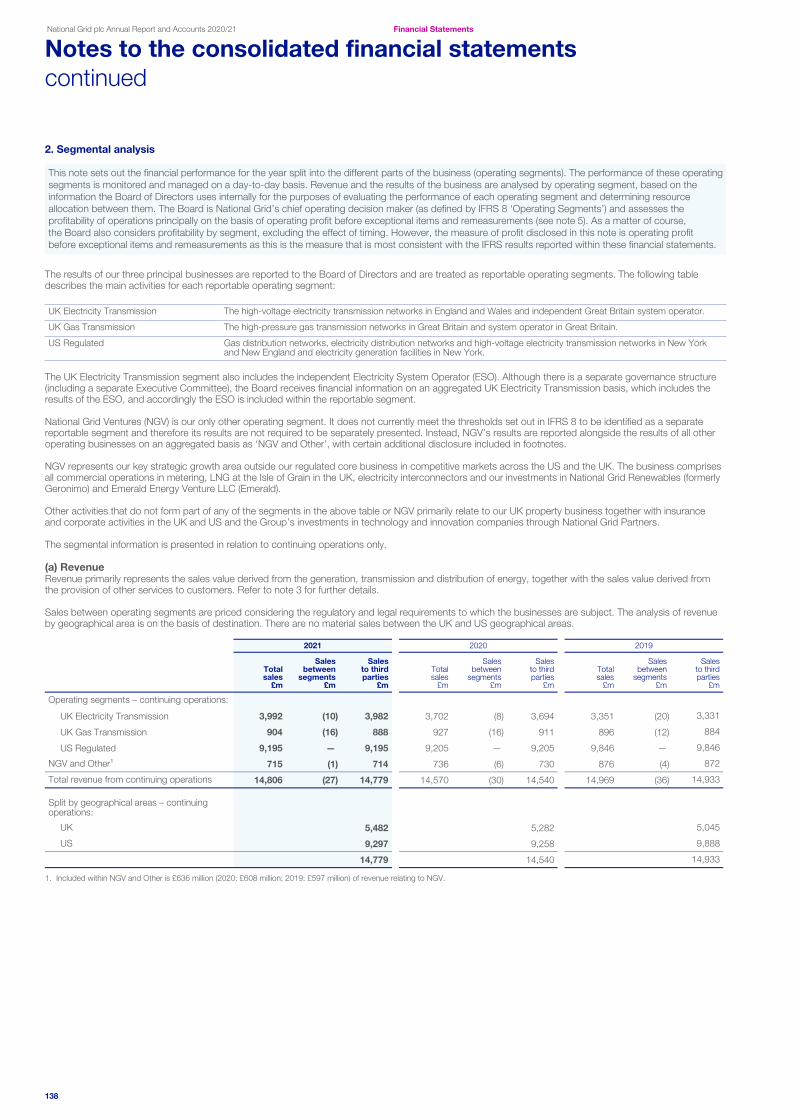
2. Segmental analysis
This note sets out the financial performance for the year split into the different parts of the business (operating segments). The performance of these operating segments is monitored and managed on a day-to-day basis. Revenue and the results of the business are analysed by operating segment, based on the information the Board of Directors uses internally for the purposes of evaluating the performance of each operating segment and determining resource allocation between them. The Board is National Grid’s chief operating decision maker (as defined by IFRS 8 ‘Operating Segments’) and assesses the profitability of operations principally on the basis of operating profit before exceptional items and remeasurements (see note 5). As a matter of course, the Board also considers profitability by segment, excluding the effect of timing. However, the measure of profit disclosed in this note is operating profit before exceptional items and remeasurements as this is the measure that is most consistent with the IFRS results reported within these financial statements.
The results of our three principal businesses are reported to the Board of Directors and are treated as reportable operating segments. The following table describes the main activities for each reportable operating segment:
UK Electricity Transmission The high-voltage electricity transmission networks in England and Wales and independent Great Britain system operator.
UK Gas Transmission The high-pressure gas transmission networks in Great Britain and system operator in Great Britain.
US Regulated Gas distribution networks, electricity distribution networks and high-voltage electricity transmission networks in New York and New England and electricity generation facilities in New York.
The UK Electricity Transmission segment also includes the independent Electricity System Operator (ESO). Although there is a separate governance structure (including a separate Executive Committee), the Board receives financial information on an aggregated UK Electricity Transmission basis, which includes the results of the ESO, and accordingly the ESO is included within the reportable segment.
National Grid Ventures (NGV) is our only other operating segment. It does not currently meet the thresholds set out in IFRS 8 to be identified as a separate reportable segment and therefore its results are not required to be separately presented. Instead, NGV’s results are reported alongside the results of all other operating businesses on an aggregated basis as ‘NGV and Other’, with certain additional disclosure included in footnotes.
NGV represents our key strategic growth area outside our regulated core business in competitive markets across the US and the UK. The business comprises all commercial operations in metering, LNG at the Isle of Grain in the UK, electricity interconnectors and our investments in National Grid Renewables (formerly Geronimo) and Emerald Energy Venture LLC (Emerald).
Other activities that do not form part of any of the segments in the above table or NGV primarily relate to our UK property business together with insurance and corporate activities in the UK and US and the Group’s investments in technology and innovation companies through National Grid Partners.
The segmental information is presented in relation to continuing operations only.
(a) RevenueRevenue primarily represents the sales value derived from the generation, transmission and distribution of energy, together with the sales value derived from the provision of other services to customers. Refer to note 3 for further details.
Sales between operating segments are priced considering the regulatory and legal requirements to which the businesses are subject. The analysis of revenue by geographical area is on the basis of destination. There are no material sales between the UK and US geographical areas.
2021 2020 2019
Total sales
£m
Salesbetween
segments£m
Salesto thirdparties
£m
Total sales
£m
Sales between
segments£m
Sales to third parties
£m
Total sales
£m
Salesbetween
segments£m
Sales to third parties
£m
Operating segments – continuing operations:
UK Electricity Transmission 3,992 (10) 3,982 3,702 (8) 3,694 3,351 (20) 3,331
UK Gas Transmission 904 (16) 888 927 (16) 911 896 (12) 884
US Regulated 9,195 — 9,195 9,205 — 9,205 9,846 — 9,846
NGV and Other¹ 715 (1) 714 736 (6) 730 876 (4) 872
Total revenue from continuing operations 14,806 (27) 14,779 14,570 (30) 14,540 14,969 (36) 14,933
Split by geographical areas – continuing operations:
UK 5,482 5,282 5,045
US 9,297 9,258 9,888
14,779 14,540 14,933
1. Included within NGV and Other is £636 million (2020: £608 million; 2019: £597 million) of revenue relating to NGV.
National Grid plc Annual Report and Accounts 2020/21 Financial Statements
Notes to the consolidated financial statementscontinued
138

2. Segmental analysis continued(b) Operating profit A reconciliation of the operating segments’ measure of profit to profit before tax from continuing operations is provided below. Further details of the exceptional items and remeasurements are provided in note 5.
Before exceptional items and remeasurements
After exceptional items and remeasurements
2021 2020 2019 2021 2020 2019£m £m £m £m £m £m
Operating segments – continuing operations:
UK Electricity Transmission 1,034 1,320 1,015 1,027 1,316 778
UK Gas Transmission 342 348 303 337 347 267
US Regulated 1,313 1,397 1,724 1,344 880 1,425
NGV and Other1 237 242 400 187 237 400
Total operating profit from continuing operations 2,926 3,307 3,442 2,895 2,780 2,870
Split by geographical area – continuing operations:
UK 1,612 1,925 1,695 1,550 1,915 1,422
US 1,314 1,382 1,747 1,345 865 1,448
2,926 3,307 3,442 2,895 2,780 2,870
Below we reconcile total operating profit from continuing operations to profit before tax from continuing operations. Total operating exceptional items and remeasurements of £31 million charge (2020: £527 million charge; 2019: £572 million charge) are detailed in note 5. This is comprised of a £7 million charge (2020: £4 million charge; 2019: £237 million charge) attributable to UK Electricity Transmission; £5 million charge (2020: £1 million charge; 2019: £36 million charge) to UK Gas Transmission; £31 million gain (2020: £517 million charge; 2019: £299 million charge) to US Regulated; and £50 million charge (2020: £5 million charge; 2019: £nil) to NGV and Other.
Reconciliation to profit before tax:
Operating profit from continuing operations 2,926 3,307 3,442 2,895 2,780 2,870
Finance income 35 70 73 58 54 88
Finance costs (977) (1,119) (1,066) (928) (1,167) (1,157)
Share of post-tax results of joint ventures and associates 66 88 40 58 87 40
Profit before tax from continuing operations 2,050 2,346 2,489 2,083 1,754 1,841
1. Included within NGV and Other is £298 million (2020: £269 million; 2019: £263 million) of operating profit before exceptional items and remeasurements and £296 million of operating profit after exceptional items and remeasurements (2020: £268 million; 2019: £263 million), relating to NGV.
(c) Capital expenditureCapital expenditure represents additions to property, plant and equipment and non-current intangibles but excludes additional investments in and loans to joint ventures and associates.
Net book value of property, plant andequipment and other intangible assets Capital expenditure
Depreciation, amortisationand impairment
2021 2020 2019 2021 2020 2019 2021 2020 2019£m £m £m £m £m £m £m £m £m
Operating segments:
UK Electricity Transmission 14,379 13,788 13,288 1,072 1,043 925 (507) (469) (628)
UK Gas Transmission 4,531 4,513 4,412 176 249 308 (165) (171) (181)
US Regulated1,2 27,128 30,615 25,488 3,223 3,228 2,650 (888) (855) (700)
NGV and Other2,3 2,448 2,141 2,755 460 559 438 (112) (145) (226) Total from continuing operations2 48,486 51,057 45,943 4,931 5,079 4,321 (1,672) (1,640) (1,735)
Split by geographical area – continuing operations:
UK 21,352 20,427 19,343 1,708 1,847 1,584 (783) (784) (931)
US2 27,134 30,630 26,600 3,223 3,232 2,737 (889) (856) (804)
Total from continuing operations2 48,486 51,057 45,943 4,931 5,079 4,321 (1,672) (1,640) (1,735)
Asset type:
Property, plant and equipment2 47,043 49,762 44,859 4,510 4,727 4,015 (1,476) (1,464) (1,560)
Non-current intangible assets 1,443 1,295 1,084 421 352 306 (196) (176) (175) Total from continuing operations2 48,486 51,057 45,943 4,931 5,079 4,321 (1,672) (1,640) (1,735)
1. In 2020, we transferred certain software assets and properties which are held outside the US rate base and operate for the benefit of our US Regulated businesses, that were previously included within the NGV and Other segment, to the US Regulated segment. These assets were included within NGV and Other in 2019, and had a net book value of £1,062 million, capital expenditure of £87 million and depreciation, amortisation and impairment of £102 million.
2. Comparative amounts have been revised as described in note 1F.3. Included within NGV and Other are assets with a net book value of £2,396 million (2020: £2,080 million; 2019: £1,635 million), capital expenditure of £431 million (2020: £550 million;
2019: £317 million) and depreciation, amortisation and impairment of £92 million (2020: £124 million; 2019: £114 million) relating to NGV.
National Grid plc Annual Report and Accounts 2020/21 Financial Statements | Notes to the consolidated financial statements
139

3. Revenue
Revenue arises in the course of ordinary activities and principally comprises:• transmission services;• distribution services; and• generation services.
Transmission services, distribution services and certain other services (excluding rental income but including metering) fall within the scope of IFRS 15 ‘Revenue from Contracts with Customers’, whereas generation services (which solely relate to the contract with the Long Island Power Authority (LIPA) in the US) are accounted for under IFRS 16 ‘Leases’ as rental income, also presented within revenue. Revenue is measured based on the consideration specified in a contract with a customer and excludes amounts collected on behalf of third parties and value added tax. The Group recognises revenue when it transfers control over a product or service to a customer.
Below, we include a description of principal activities, by reportable segment, from which the Group generates its revenue. For more detailed information about our segments, see note 2.
(a) UK Electricity TransmissionThe UK Electricity Transmission segment principally generates revenue by providing electricity transmission services (both as transmission owner in England and Wales and independent system operator in Great Britain). Our business operates as a monopoly regulated by Ofgem, which has established price control mechanisms that set the amount of annual allowed returns our business can earn (along with the Scottish and Offshore transmission operators amongst others). The IFRS revenues we record are principally a function of volumes and price. Price is determined prior to our financial year-end with reference to the regulated allowed returns and estimated annual volumes. Where revenue received or receivable exceeds the maximum amount permitted by our regulatory agreement, adjustments will be made to future prices to reflect this over-recovery. No liability is recognised, as such an adjustment to future prices relates to the provision of future services. Similarly, no asset is recognised where a regulatory agreement permits adjustments to be made to future prices in respect of an under-recovery. As part of our regulatory agreements we are entitled to recover certain costs directly from customers (pass-through costs). These amounts are included in the overall calculation of allowed revenue as stipulated by regulatory agreements.
The System Operator earns revenue for balancing supply and demand of electricity on the transmission system, where it acts as principal. Revenue is recognised as the service is provided. The System Operator also collects revenues on behalf of transmission operators, principally National Grid Electricity Transmission plc and the Scottish and Offshore transmission operators, from users who connect to or use the transmission system. In this context, there is a judgement about whether the System Operator acts as a principal or agent in respect of the transmission network revenues collected on behalf of the Scottish and Offshore transmission operators (as set out in note 1). These amounts are paid to the transmission operators before the System Operator has collected payment from the users (electricity suppliers) and therefore the System Operator does hold some exposure to credit losses with electricity suppliers. However, the System Operator must set the charges paid by electricity suppliers by reference to the price control mechanism described above. That mechanism does not grant the System Operator with discretion to deviate from that mechanism. In addition, the transmission operators own and maintain the electricity network and receive direct feedback from electricity suppliers on the quality of the network they provide. As a result, we have concluded that the System Operator acts as an agent in respect of these transmission revenues and therefore records the attributable revenue net of operating costs.
The transmission of high-voltage electricity encompasses the following principal services: • the supply of high-voltage electricity (including both transmission and system operator charges); and • construction work (principally for connections).
For the supply of high-voltage electricity, revenue is recognised based on capacity and volumes. Our performance obligation is satisfied over time as our customers make use of our network. We bill monthly in arrears and our payment terms are up to 60 days.
For construction work relating to connections, customers can either pay over the useful life of the connection or upfront. Revenue is recognised over time, as we provide access to our network, and where the customer pays upfront, revenues are deferred as a contract liability and released over the life of the asset.
For other construction where there is no consideration for any future services, for example diversions (being the re-routing of network assets at our customers’ request), revenues are recognised as the construction work is completed.
(b) UK Gas TransmissionThe UK Gas Transmission segment of the Group principally generates revenue by providing gas transmission services to our customers (both as transmission owner and as system operator) in Great Britain. Similar to our UK Electricity Transmission business, our business operates as a monopoly regulated by Ofgem. The price control mechanism in place that determines our annual allowances is also similar, as is the way in which revenue is recorded.
The transmission of gas encompasses the following principal services: • the supply of high-pressure gas (including both transmission and system operator charges); and • construction work (principally for connections).
For the supply of high-pressure gas, revenue is recognised based on capacity and volumes. Our performance obligation is satisfied over time as our customers make use of our network, and we bill monthly in arrears with payment terms of up to 45 days.
For construction work relating to connections, customers pay for the connection upfront. Revenue is recognised over time, as we provide access to our network. As revenues are received upfront, they are deferred as a contract liability and released over the life of the connection.
For other construction where there is no consideration for any future services (such as diversions), revenues are recognised when the construction work is completed.
National Grid plc Annual Report and Accounts 2020/21 Financial Statements
Notes to the consolidated financial statementscontinued
140

3. Revenue continued(c) US RegulatedThe US Regulated segment of the Group principally generates revenue by providing gas and electricity distribution services in New York and New England, high voltage electricity transmission services in New York and New England, and electricity generation in New York.
Distribution servicesProvision of gas and electricity distribution services in New York and New England. This comprises the following principal services: • Gas and electricity distribution: revenue is recognised based on usage by customers (over time) and billed monthly. Payment terms are 30 days; and • Connections: revenue is recognised over time, as we provide access to our network. Where payments are made upfront, they are deferred as contract
liabilities or customer contributions (where they relate to government entities) and released over the life of the connection.
Transmission servicesProvision of electricity transmission services to customers and operation of electricity transmission facilities. Our principal services are: • Electricity transmission: revenue is recognised based on usage by customers (over time) and billed monthly. Payment terms are 30 days; and • Connections: revenue is recognised over time, as we provide access to our network. Where payments are made upfront, they are deferred as contract
liabilities or customer contributions (where they relate to government entities) and released over the life of the connection.
Electricity generationProvision of energy services and supply capacity to produce energy for the use of customers of the Long Island Power Authority (LIPA) through a power supply agreement where LIPA receives all of the energy and capacity from the asset until at least 2025. The arrangement is treated as an operating lease within the scope of the leasing standard, where we act as lessor with rental income being recorded as other income, which forms part of total revenue. Lease payments (capacity payments) are recognised on a straight-line basis and variable lease payments are recognised as the energy is generated.
(d) NGV and Other NGV and Other generates revenue from electricity interconnectors, LNG at the Isle of Grain, National Grid Renewables, metering, our UK commercial property business, rental income and insurance.
The Group recognises revenue from transmission services through interconnectors and LNG at the Isle of Grain by means of customers’ use of capacity and volumes. Revenue is recognised over time and is billed monthly. Payment terms are up to 30 days.
Other revenue in the scope of IFRS 15 principally includes revenues from our UK metering business and sales of renewables projects from National Grid Renewables to Emerald (see note 38). Revenue is recognised as it is earned. In the case of the UK metering business, revenue is billed monthly and payment terms are up to 30 days.
Other revenue, recognised in accordance with standards other than IFRS 15, includes property sales by our UK commercial property business (including sales to our St William joint venture) and rental income. Property sales are recorded at a point in time (when the sale is legally completed) and rental income is recorded over time.
(e) Disaggregation of revenueIn the following tables, revenue is disaggregated by primary geographical market and major service lines. The table reconciles disaggregated revenue with the Group’s reportable segments (see note 2).
Revenue for the year ended 31 March 2021
UK Electricity Transmission
£m
UK Gas Transmission
£mUS Regulated
£mNGV and Other
£mTotal
£m
Revenue under IFRS 15
Transmission 1,814 603 403 316 3,136
Distribution — — 8,317 — 8,317
System Operator 2,076 240 — — 2,316
Other 67 12 15 302 396
Total IFRS 15 revenue 3,957 855 8,735 618 14,165
Other revenue
Generation — — 376 — 376
Other 25 33 84 96 238
Total other revenue 25 33 460 96 614
Total revenue from continuing operations 3,982 888 9,195 714 14,779
Geographical split for the year ended 31 March 2021
UK Electricity Transmission
£m
UK Gas Transmission
£mUS Regulated
£mNGV and Other
£mTotal
£m
Revenue under IFRS 15
UK 3,957 855 — 553 5,365
US — — 8,735 65 8,800
Total IFRS 15 revenue 3,957 855 8,735 618 14,165
Other revenue
UK 25 33 — 59 117
US — — 460 37 497
Total other revenue 25 33 460 96 614
Total revenue from continuing operations 3,982 888 9,195 714 14,779
National Grid plc Annual Report and Accounts 2020/21 Financial Statements | Notes to the consolidated financial statements
141
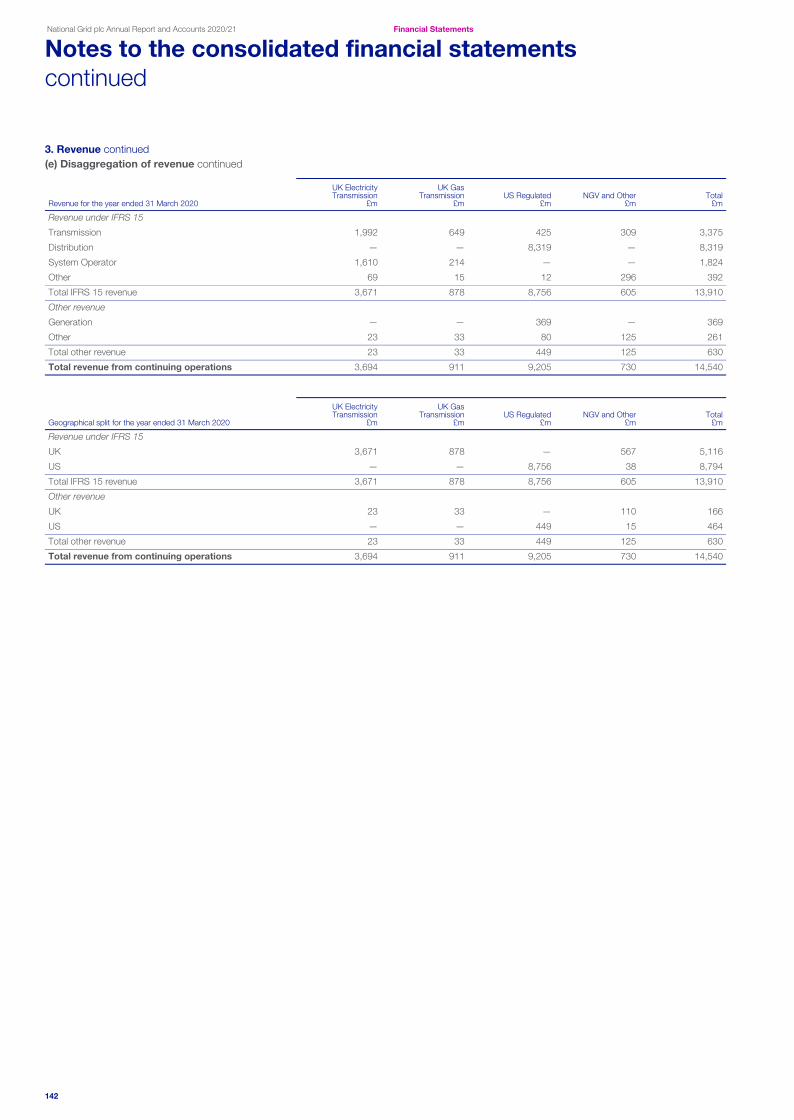
3. Revenue continued(e) Disaggregation of revenue continued
Revenue for the year ended 31 March 2020
UK Electricity Transmission
£m
UK Gas Transmission
£mUS Regulated
£mNGV and Other
£mTotal
£m
Revenue under IFRS 15
Transmission 1,992 649 425 309 3,375
Distribution — — 8,319 — 8,319
System Operator 1,610 214 — — 1,824
Other 69 15 12 296 392
Total IFRS 15 revenue 3,671 878 8,756 605 13,910
Other revenue
Generation — — 369 — 369
Other 23 33 80 125 261
Total other revenue 23 33 449 125 630
Total revenue from continuing operations 3,694 911 9,205 730 14,540
Geographical split for the year ended 31 March 2020
UK Electricity Transmission
£m
UK Gas Transmission
£mUS Regulated
£mNGV and Other
£mTotal
£m
Revenue under IFRS 15
UK 3,671 878 — 567 5,116
US — — 8,756 38 8,794
Total IFRS 15 revenue 3,671 878 8,756 605 13,910
Other revenue
UK 23 33 — 110 166
US — — 449 15 464
Total other revenue 23 33 449 125 630
Total revenue from continuing operations 3,694 911 9,205 730 14,540
National Grid plc Annual Report and Accounts 2020/21 Financial Statements
Notes to the consolidated financial statementscontinued
142

3. Revenue continued(e) Disaggregation of revenue continued
Revenue for the year ended 31 March 2019
UK Electricity Transmission
£m
UK Gas Transmission
£mUS Regulated
£mNGV and Other
£mTotal
£m
Revenue under IFRS 15
Transmission 1,909 661 370 313 3,253
Distribution — — 8,941 — 8,941
System Operator 1,416 172 — — 1,588
Other — — — 284 284
Total IFRS 15 revenue 3,325 833 9,311 597 14,066
Other revenue
Generation — — 367 — 367
Other 6 51 168 275 500
Total other revenue 6 51 535 275 867
Total revenue from continuing operations 3,331 884 9,846 872 14,933
Geographical split for the year ended 31 March 2019
UK Electricity Transmission
£m
UK Gas Transmission
£mUS Regulated
£mNGV and Other
£mTotal
£m
Revenue under IFRS 15
UK 3,325 833 — 585 4,743
US — — 9,311 12 9,323
Total IFRS 15 revenue 3,325 833 9,311 597 14,066
Other revenue
UK 6 51 — 245 302
US — — 535 30 565
Total other revenue 6 51 535 275 867
Total revenue from continuing operations 3,331 884 9,846 872 14,933
Contract liabilities (see note 23) represent revenue to be recognised in future periods relating to contributions in aid of construction of £1,160 million (2020: £1,158 million; 2019: £994 million). Revenue is recognised over the life of the asset. The asset lives for connections in UK Electricity Transmission, UK Gas Transmission, NGV and US Regulated are 40 years, 36 years, 15 years and up to 51 years respectively. The weighted average amortisation period is 19 years.
Future revenues in relation to unfulfilled performance obligations not yet received in cash amount to £4.8 billion (2020: £3.1 billion; 2019: £3.5 billion). £1.6 billion (2020: £1.5 billion; 2019: £1.6 billion) relates to connection contracts in UK Electricity Transmission which will be recognised as revenue over 26 years and £3.0 billion (2020: £1.5 billion; 2019: £1.8 billion) relates to revenues to be earned under Grain LNG contracts until 2045. The remaining amount will be recognised as revenue over 9 years.
The amount of revenue recognised for the year ended 31 March 2021 from performance obligations satisfied (or partially satisfied) in previous periods, mainly due to the changes in the estimate of the stage of completion, is £nil (2020: £nil; 2019: £nil).
National Grid plc Annual Report and Accounts 2020/21 Financial Statements | Notes to the consolidated financial statements
143

4. Operating costs
Below we have presented separately certain items included in our operating costs from continuing operations. These include a breakdown of payroll costs (including disclosure of amounts paid to key management personnel) and fees paid to our auditors.
Before exceptional items and remeasurements
Exceptional items and remeasurements Total
2021 2020 2019 2021 2020 2019 2021 2020 2019£m £m £m £m £m £m £m £m £m
Depreciation, amortisation and impairment 1,672 1,640 1,588 — — 147 1,672 1,640 1,735
Payroll costs 1,749 1,684 1,703 21 — 149 1,770 1,684 1,852
Purchases of electricity 1,181 1,318 1,504 (51) 85 (50) 1,130 1,403 1,454
Purchases of gas 1,233 1,276 1,644 17 40 (2) 1,250 1,316 1,642
Property and other taxes 1,193 1,191 1,108 — — — 1,193 1,191 1,108
Balancing Services Incentive Scheme 1,875 1,317 1,196 — — — 1,875 1,317 1,196
Other 2,624 2,573 2,567 44 402 328 2,668 2,975 2,895
Other operating costs 11,527 10,999 11,310 31 527 572 11,558 11,526 11,882
Provision for bad and doubtful debts 326 234 181 — — — 326 234 181
Total operating costs 11,853 11,233 11,491 31 527 572 11,884 11,760 12,063
Operating costs include:
Inventory consumed 316 328 415
Research and development expenditure 17 14 19
(a) Payroll costs
2021 2020 2019£m £m £m
Wages and salaries¹ 2,282 2,188 2,084
Social security costs 172 168 156
Defined contribution scheme costs 77 75 72
Defined benefit pension costs 136 135 232
Share-based payments 27 19 27
Severance costs (excluding pension costs) 11 1 76
2,705 2,586 2,647
Less: payroll costs capitalised (935) (902) (795)
Total payroll costs 1,770 1,684 1,852
1. Included within wages and salaries are US other post-retirement benefit costs of £43 million (2020: £45 million; 2019: £48 million). For further information refer to note 25.
(b) Number of employees
31 March 2021
Monthly average
202131 March
2020
Monthly average
202031 March
2019
Monthly average
2019
UK 6,657 6,517 6,321 6,151 5,962 6,227
US 17,026 16,821 16,748 16,679 16,614 16,669
Total number of employees 23,683 23,338 23,069 22,830 22,576 22,896
National Grid plc Annual Report and Accounts 2020/21 Financial Statements
Notes to the consolidated financial statementscontinued
144

4. Operating costs continued(c) Key management compensation
2021 2020 2019£m £m £m
Short-term employee benefits 7 7 7
Compensation for loss of office — 1 —
Post-employment benefits 1 1 1
Share-based payments 4 3 3
Total key management compensation 12 12 11
Key management compensation relates to the Board, including the Executive Directors and Non-executive Directors for the years presented.
(d) Directors’ emolumentsDetails of Executive Directors’ emoluments are contained in the Remuneration Report on page 100 and those of Non-executive Directors on page 105.
(e) Auditors’ remunerationAuditors’ remuneration is presented below in accordance with the requirements of the Companies Act 2006 and the principal accountant fees and services disclosure requirements of Item 16C of Form 20-F:
2021 2020 2019£m £m £m
Audit fees payable to the Parent Company’s auditors and their associates in respect of:
Audit of the Parent Company’s individual and consolidated financial statements¹ 2.5 1.9 1.6
The auditing of accounts of any associate of the Company² 8.1 8.7 8.5
Other services supplied³ 6.4 6.3 5.2
17.0 16.9 15.3
Total other services4
All other fees:
Other assurance services5 0.8 0.6 1.1
Other non-audit services not covered above6 2.0 0.5 2.2
2.8 1.1 3.3
Total auditors’ remuneration 19.8 18.0 18.6
1. Audit fees in each year represent fees for the audit of the Company’s financial statements and regulatory reporting for the years ended 31 March 2021, 2020 and 2019.2. The 2019 comparative was updated in 2020 following finalisation of the 2019 audit fee with the Audit Committee in 2020.3. Other services supplied represent fees payable for services in relation to other statutory filings or engagements that are required to be carried out by the auditors. In particular, this includes fees
for reports under section 404 of the US Public Company Accounting Reform and Investor Protection Act of 2002 (Sarbanes-Oxley), audit reports on regulatory returns and the review of interim financial statements for the six-month periods ended 30 September 2020, 2019 and 2018 respectively.
4. There were no tax compliance or tax advisory fees and no audit related fees as described in Item 16C(b) of Form 20-F.5. In all years, principally relates to assurance services provided in relation to comfort letters for debt issuances and, in 2021, also includes amounts related to capacity market auction monitoring
services.6. For 2021, includes the class 1 Circular in respect of the acquisition of WPD announced on 18 March 2021. In 2020, other assurance services include auction monitor work on Contracts for
Difference, a review of controls over our data on New York customers and IT project assurance. In 2019, non-audit services primarily related to the UK Commercial Property business in respect of the evaluation of possible options for the use of property assets.
The Audit Committee considers and makes recommendations to the Board, to be put to shareholders for approval at each AGM, in relation to the appointment, re-appointment, removal and oversight of the Company’s independent auditors. The Committee also considers and approves the audit fees on behalf of the Board in accordance with the Competition and Market Authority Audit Order 2014. The auditors’ remuneration is then put to shareholders at each AGM. Details of our policies and procedures in relation to non-audit services to be provided by the independent auditors are set out on page 87 of the Corporate Governance Report.
Certain services are prohibited from being performed by the external auditors under the Sarbanes-Oxley Act. Of the above services, none were prohibited.
National Grid plc Annual Report and Accounts 2020/21 Financial Statements | Notes to the consolidated financial statements
145

5. Exceptional items and remeasurements
To monitor our financial performance, we use a profit measure that excludes certain income and expenses. We call that measure ‘adjusted profit’. Adjusted profit (which excludes exceptional items and remeasurements as defined below) is used by management to monitor financial performance as it is considered that it aids the comparability of our reported financial performance from year to year. We exclude items from adjusted profit because, if included, these items could distort understanding of our performance for the year and the comparability between periods. This note analyses these items, which are included in our results for the year but are excluded from adjusted profit.
Exceptional items and remeasurements from continuing operations
2021 2020 2019£m £m £m
Included within operating profit
Exceptional items:
Changes in environmental provisions 14 (402) —
New operating model implementation costs (55) — —
Transaction costs (24) — —
Cost efficiency and restructuring programmes — — (204)
Massachusetts Gas labour dispute — — (283)
Impairment of nuclear connection development costs — — (137)
(65) (402) (624)
Remeasurements – commodity contract derivatives 34 (125) 52
(31) (527) (572)
Included within finance income and costs
Remeasurements:
Net (losses)/gains on financing derivatives (41) 1 (40)
Net gains/(losses) on financial assets at fair value through profit and loss 23 (16) 15
Net gains/(losses) on financial liabilities at fair value through profit and loss 90 (49) (51)
72 (64) (76)
Included within share of post-tax results of joint ventures and associates
Remeasurements:
Remeasurements – net losses on financial instruments (8) (1) —
Total included within profit before tax 33 (592) (648)
Included within tax
Exceptional items – movements arising on items not included in profit before tax:
Deferred tax charge arising on the reversal of the reduction in UK corporation tax rate — (192) —
Tax on exceptional items 8 103 144
Tax on remeasurements (34) 42 5
(26) (47) 149
Total exceptional items and remeasurements after tax 7 (639) (499)
Analysis of total exceptional items and remeasurements after tax
Exceptional items after tax (57) (491) (480)
Remeasurements after tax 64 (148) (19)
Total exceptional items and remeasurements after tax 7 (639) (499)
National Grid plc Annual Report and Accounts 2020/21 Financial Statements
Notes to the consolidated financial statementscontinued
146

5. Exceptional items and remeasurements continuedExceptional itemsManagement uses an exceptional items framework that has been discussed and approved by the Audit Committee. This follows a three-step process which considers the nature of the event, the financial materiality involved and any particular facts and circumstances. In considering the nature of the event, management focuses on whether the event is within the Group’s control and how frequently such an event typically occurs. In determining the facts and circumstances, management considers factors such as ensuring consistent treatment between favourable and unfavourable transactions, the precedent for similar items, the number of periods over which costs will be spread or gains earned, and the commercial context for the particular transaction.
Items of income or expense that are considered by management for designation as exceptional items include significant restructurings, write-downs or impairments of non-current assets, significant changes in environmental or decommissioning provisions, integration of acquired businesses, gains or losses on disposals of businesses or investments and significant debt redemption costs as a consequence of transactions such as significant disposals or issues of equity, and the related tax, as well as deferred tax arising on changes to corporation tax rates.
Costs arising from restructuring programmes include redundancy costs. Redundancy costs are charged to the consolidated income statement in the year in which a commitment is made to incur the costs and the main features of the restructuring plan have been announced to affected employees.
Set out below are details of the transactions against which we have considered the application of our exceptional items framework in each of the years for which results are presented.
2021 We have considered certain costs incurred in the period against our Exceptional Items Framework, and concluded £55 million of costs associated with the implementation of our new operating model, the £14 million release of environmental provisions for which the original provision was treated as exceptional and the £24 million of transaction costs associated with the acquisition of Western Power Distribution (WPD) and the sale of NECO should be treated as exceptional items in the current year.
New operating model implementation costs: The Group incurred £55 million of costs in relation to the design and implementation of our new operating model that is built on a foundation of six business units as described further in the Strategic Review. The costs recognised in the year ended 31 March 2021 primarily relate to professional fees incurred in designing the new operating model, alongside the redundancy provisions accrued in relation to those employees where announcements have been made that they will be leaving the organisation as a result of the changes. Whilst the costs incurred this year do not meet the quantitative threshold to be classified as exceptional on a standalone basis, we have concluded that the costs should be classified as exceptional in line with our exceptional items policy, in order to ensure that the costs are treated in a consistent manner with similar costs incurred previously. The total cash outflow for the year was £33 million.
Transaction costs: £24 million of transaction costs were incurred to date in relation to the acquisition of WPD (see note 38) and the sale of NECO (see note 10). The costs relate to legal fees, bankers' fees and professional fees. Whilst the costs incurred in the current year in isolation are not sufficiently material to warrant classification as an exceptional item, we are expecting further costs to be incurred next year, for example, in regards to success fees on completion of the acquisition. When taken in aggregate, the costs incurred over both years will be sufficiently material to be classified as exceptional in line with our policy. The total cash outflow for the year was £14 million.
Changes in environmental provision: In the US, the most significant component of our £1.5 billion environmental provision relates to several Superfund sites, and arose from former manufacturing gas plant facilities, formerly owned or operated by the Group or its predecessor companies. The sites are subject to both State and Federal law in the US. Under Federal and State Superfund laws, potential liability for the historical contamination may be imposed on responsible parties jointly and severally, without regard to fault, even if the activities were lawful when they occurred. The provisions and the Group’s share of estimated costs are re-evaluated at each reporting period.
We have recognised an exceptional gain of £14 million relating to the release of environmental provisions relating to one of our US Superfund sites, for which the original provision was treated as an exceptional item. The reduction in the provision arose as a result of the re-evaluation of the Group’s share of estimated costs following the finalisation of discussions on the scope of certain remediation work with government authorities. The release has been recorded as an exceptional item in line with the treatment of the original provision.
2020We concluded that the increase in costs associated with the changes in our environmental provisions (£402 million) and the additional deferred tax charge reflecting the impact of the remeasurement of the Group’s deferred tax liabilities as a result of a change in the substantively enacted UK corporation tax rate (£192 million) meet the criteria to be classified as exceptional.
A further £10 million of COVID-19 related costs incurred in the year ended 31 March 2020 were similarly not classified as exceptional in view of the quantum involved and all costs associated with the settlement reached with the State of New York in respect of the Downstate New York Gas Moratorium were also treated as part of adjusted profit.
Changes in environmental provisions: As a result of notices issued by governmental authorities and newly developed cost estimates prepared by third-party engineers in relation to our US Superfund sites, we re-evaluated our estimates of total costs and cost sharing allocations borne by the Company, and accordingly increased our provision by £326 million. Under the terms of our rate plans, we are entitled to recovery of environmental clean-up costs from rate payers, but under IFRS no asset can be recognised for this recovery.
Also included in the total environmental charge was the £76 million impact of the change in the real discount rate applied to the environmental provisions across the Group, of which £66 million related to the US and £10 million to the UK. Given the substantial and sustained change in gilts and corporate bond yields, we concluded it was appropriate to reduce the real discount rate from 1% to 0.5%. The weighted average remaining duration of our cash flows is now around 10 years.
National Grid plc Annual Report and Accounts 2020/21 Financial Statements | Notes to the consolidated financial statements
147

5. Exceptional items and remeasurements continued2019 In assessing certain items of income and expenditure against our exceptional items framework, we concluded that the costs associated with the Massachusetts Gas labour dispute (£283 million), our cost efficiency and restructuring programme (£204 million) and impairments relating to two nuclear connection cancellations (£137 million) should be treated as exceptional (as described further below). We also considered whether the £95 million income from two legal settlements received in the period should be classified as exceptional. However, we concluded it was appropriate to recognise the income in earnings before exceptional items (within NGV and Other), in line with the treatment of the original costs.
Cost efficiency and restructuring programmes: Our UK and US businesses incurred restructuring charges as we reviewed organisational structures, operational activities and relevant roles and responsibilities to ensure we are able to operate more efficiently and to continue to drive outperformance for customers and shareholders. The cash outflow for the year was £93 million.
Massachusetts Gas labour dispute: Between June 2018 and January 2019, National Grid implemented a workforce contingency plan across its Massachusetts Gas business following the expiration of contracts for the 1,250 members of the existing workforce. The net incremental cost of the experienced contractors working alongside supervisors and workers from other areas of the business was £283 million, reflecting the financial performance of the US regulated business had the workforce contingency plan not been implemented. The total cash outflow related to the labour dispute was £320 million for the year.
Impairment of nuclear connection development costs: In 2018, Toshiba announced the cancellation of its NuGen project to build a new nuclear power station at Moorside in Cumbria, and NuGen terminated its connection agreement with UK Electricity Transmission. In February 2019, Hitachi terminated its connection agreements in respect of its Horizon projects at Wylfa and Oldbury. As there was no realistic prospect of these schemes continuing in their present form, we concluded that it was appropriate to impair the assets we had been developing for over 10 years. After deducting cash inflows relating to termination fees received of £13 million, the net impairment charge was £137 million.
RemeasurementsRemeasurements comprise unrealised gains or losses recorded in the consolidated income statement arising from changes in the fair value of certain of our financial assets and liabilities accounted for at fair value through profit and loss (FVTPL). Once the fair value movements are realised (for example, when the derivative matures), the previously recognised fair value movements are then reversed through remeasurements and recognised within earnings before exceptional items and remeasurements. These assets and liabilities include commodity contract derivatives and financing derivatives to the extent that hedge accounting is not available or is not fully effective.
The unrealised gains or losses reported in profit and loss on certain additional assets and liabilities treated at FVTPL are also classified within remeasurements. These relate to financial assets (which fail the ‘solely payments of principal and interest test’ under IFRS 9), the money market fund investments used by Group Treasury for cash management purposes and certain financial liabilities which we elected to designate at FVTPL. In all cases, these fair values increase or decrease because of changes in foreign exchange, commodity or other financial indices over which we have no control.
We report unrealised gains or losses relating to certain discrete classes of financial assets accounted for at FVTPL within adjusted profit. These comprise our portfolio of investments made by National Grid Partners, our investment in Sunrun Neptune 2016 LLC and the contingent consideration arising on the acquisition of National Grid Renewables (all within NGV and Other). The performance of these assets (including changes in fair value) are included in our assessment of adjusted profit for the relevant business units.
Remeasurements excluded from adjusted profit are made up of the following categories: i. Net gains/(losses) on commodity contract derivatives represent mark-to-market movements on certain physical and financial commodity contract
obligations in the US. These contracts primarily relate to the forward purchase of energy for supply to customers, or to the economic hedging thereof, that are required to be measured at fair value and that do not qualify for hedge accounting. Under the existing rate plans in the US, commodity costs are recoverable from customers although the timing of recovery may differ from the pattern of costs incurred;
ii. Net gains/(losses) on financing derivatives comprise gains and losses arising on derivative financial instruments used for the risk management of interest rate and foreign exchange exposures. These exclude gains and losses for which hedge accounting has been effective, and have been recognised directly in the consolidated statement of other comprehensive income or are offset by adjustments to the carrying value of debt (see notes 17 and 32);
iii. Net gains/(losses) on financial assets measured at FVTPL comprise gains and losses on the investment funds held by our insurance captives which are categorised as FVTPL (see note 15);
iv. Net gains/(losses) on financial liabilities measured at FVTPL comprise the change in the fair value (excluding changes due to own credit risk) of a financial liability that was designated at FVTPL on transition to IFRS 9 to reduce a measurement mismatch (see note 21); and
v. Unrealised net gains/(losses) on derivatives and other financial instruments within our joint ventures and associates.
Items included within tax2020The Finance Act 2016, which was enacted on 15 September 2016, reduced the main UK corporation tax rate to 17% with effect from 1 April 2020. Deferred tax balances were calculated at this rate for the years ended 31 March 2017 to 2019. On 17 March 2020, the UK Government utilised the Provisional Collection of Taxes Act 1968 to substantively enact a reversal of the reduction in the main UK corporation tax rate to 17% with effect from 1 April 2020, resulting in the rate remaining at 19%. Deferred taxes at 31 March 2020 were measured using enacted tax rates and reflected in these financial statements, resulting in a £192 million deferred tax charge, principally due to the remeasurement of deferred tax liabilities. The treatment of this charge as exceptional was consistent with the treatment for the year ended 31 March 2017 when the original reduction in the tax rate was substantively enacted, resulting in the recognition of an exceptional tax credit of £94 million.
National Grid plc Annual Report and Accounts 2020/21 Financial Statements
Notes to the consolidated financial statementscontinued
148

6. Finance income and costs
This note details the interest income generated by our financial assets and interest expense incurred on our financial liabilities, primarily our financing portfolio (including our financing derivatives). It also includes the net interest on our pensions and other post-retirement assets. In reporting adjusted profit, we adjust net financing costs to exclude any net gains or losses on financial instruments included in remeasurements (see note 5).
Finance income and costs remeasurements include unrealised gains and losses on certain assets and liabilities now treated at FVTPL. The interest income, dividends and interest expense on these items are included in finance income and finance costs before remeasurements, respectively.
2021 2020 2019Notes £m £m £m
Finance income
Interest income on financial instruments:
Bank deposits and other financial assets 33 48 54
Dividends received on equities held at fair value through other comprehensive income (FVOCI) 2 2 2
Other income — 20 17
35 70 73
Finance costs
Net interest on pensions and other post-retirement benefit obligations 25 (38) (23) (22)
Interest expense on financial liabilities held at amortised cost:
Bank loans and overdrafts (72) (73) (72)
Other borrowings¹ (854) (997) (970)
Interest expense on financial liabilities held at fair value through profit and loss (FVTPL) (20) (22) (20)
Interest on derivatives 7 (39) (43)
Unwinding of discount on provisions 26 (78) (77) (74)
Other interest (53) (10) —
Less: interest capitalised² 131 122 135
(977) (1,119) (1,066)
Remeasurements – Finance income
Net gains/(losses) on FVTPL financial assets 23 (16) 15
23 (16) 15
Remeasurements – Finance costs
Net gains/(losses) on FVTPL financial liabilities 90 (49) (51)
Net gains/(losses) on financing derivatives³:
Derivatives designated as hedges for hedge accounting 44 (13) (37)
Derivatives not designated as hedges for hedge accounting (85) 14 (3)
49 (48) (91)
Total remeasurements – Finance income and costs 72 (64) (76)
Finance income 58 54 88
Finance costs (928) (1,167) (1,157)
Net finance costs from continuing operations (870) (1,113) (1,069)
1. Includes interest expense on lease liabilities (see note 13 for details). 2. Interest on funding attributable to assets in the course of construction in the current year was capitalised at a rate of 3.1% (2020: 3.6%; 2019: 3.9%). In the UK, capitalised interest qualifies
for a current year tax deduction with tax relief claimed of £13 million (2020: £15 million; 2019: £19 million). In the US, capitalised interest is added to the cost of plant and qualifies for tax depreciation allowances.
3. Includes a net foreign exchange gain on borrowing activities of £172 million (2020: £66 million gain; 2019: £264 million gain) offset by foreign exchange losses and gains on financing derivatives measured at fair value.
National Grid plc Annual Report and Accounts 2020/21 Financial Statements | Notes to the consolidated financial statements
149

7. Tax
Tax is payable in the territories where we operate, mainly the UK and the US. This note gives further details of the total tax charge and tax liabilities, including current and deferred tax. The current tax charge is the tax payable on this year’s taxable profits. Deferred tax is an accounting adjustment to provide for tax that is expected to arise in the future due to differences in the accounting and tax bases.
The tax charge for the period is recognised in the income statement, the statement of comprehensive income or directly in equity, according to the accounting treatment of the related transaction. The tax charge comprises both current and deferred tax.
Current tax assets and liabilities are measured at the amounts expected to be recovered from or paid to the tax authorities. The tax rates and tax laws used to compute the amounts are those that have been enacted or substantively enacted by the reporting date.
The Group operates internationally in territories with different and complex tax codes. Management exercises judgement in relation to the level of provision required for uncertain tax outcomes. There are a number of tax positions not yet agreed with the tax authorities where different interpretations of legislation could lead to a range of outcomes. Judgements are made for each position having regard to particular circumstances and advice obtained.
Deferred tax is provided for using the balance sheet liability method, and is recognised on temporary differences between the carrying amount of assets and liabilities in the financial statements and the corresponding tax bases.
Deferred tax liabilities are generally recognised on all taxable temporary differences, and deferred tax assets are recognised to the extent that it is probable that taxable profits will be available against which deductible temporary differences can be utilised. However, deferred tax assets and liabilities are not recognised if the temporary differences arise from the initial recognition of goodwill or from the initial recognition of other assets and liabilities in a transaction (other than a business combination) that affects neither the accounting nor the taxable profit or loss.
Deferred tax liabilities are recognised on taxable temporary differences arising on investments in subsidiaries and joint arrangements except where the Company is able to control the reversal of the temporary difference and it is probable that the temporary difference will not reverse in the foreseeable future.
Deferred tax is calculated at the tax rates that are expected to apply in the period when the liability is settled or the asset is realised, based on the tax rates and tax laws that have been enacted or substantively enacted by the reporting date.
The carrying amount of deferred tax assets is reviewed at each reporting date and reduced to the extent that it is no longer probable that sufficient taxable profits will be available to allow all or part of the deferred tax asset to be recovered. Unrecognised deferred tax assets are reassessed at each reporting date and are recognised to the extent that it has become probable that future taxable profits will allow the deferred tax asset to be recovered.
Deferred tax assets and liabilities are offset when there is a legally enforceable right to offset current tax assets against current tax liabilities and when they relate to income taxes levied by the same tax authority and the Company and its subsidiaries intend to settle their current tax assets and liabilities on a net basis.
Tax charged/(credited) to the consolidated income statement – continuing operations
2021 2020 2019£m £m £m
Tax before exceptional items and remeasurements 416 433 488
Exceptional tax on items not included in profit before tax (note 5) — 192 —
Tax on other exceptional items and remeasurements 26 (145) (149)
Total tax reported within exceptional items and remeasurements 26 47 (149)
Total tax charge from continuing operations 442 480 339
Tax as a percentage of profit before tax
2021 2020 2019% % %
Before exceptional items and remeasurements – continuing operations 20.3 18.5 19.6
After exceptional items and remeasurements – continuing operations 21.2 27.4 18.4
National Grid plc Annual Report and Accounts 2020/21 Financial Statements
Notes to the consolidated financial statementscontinued
150
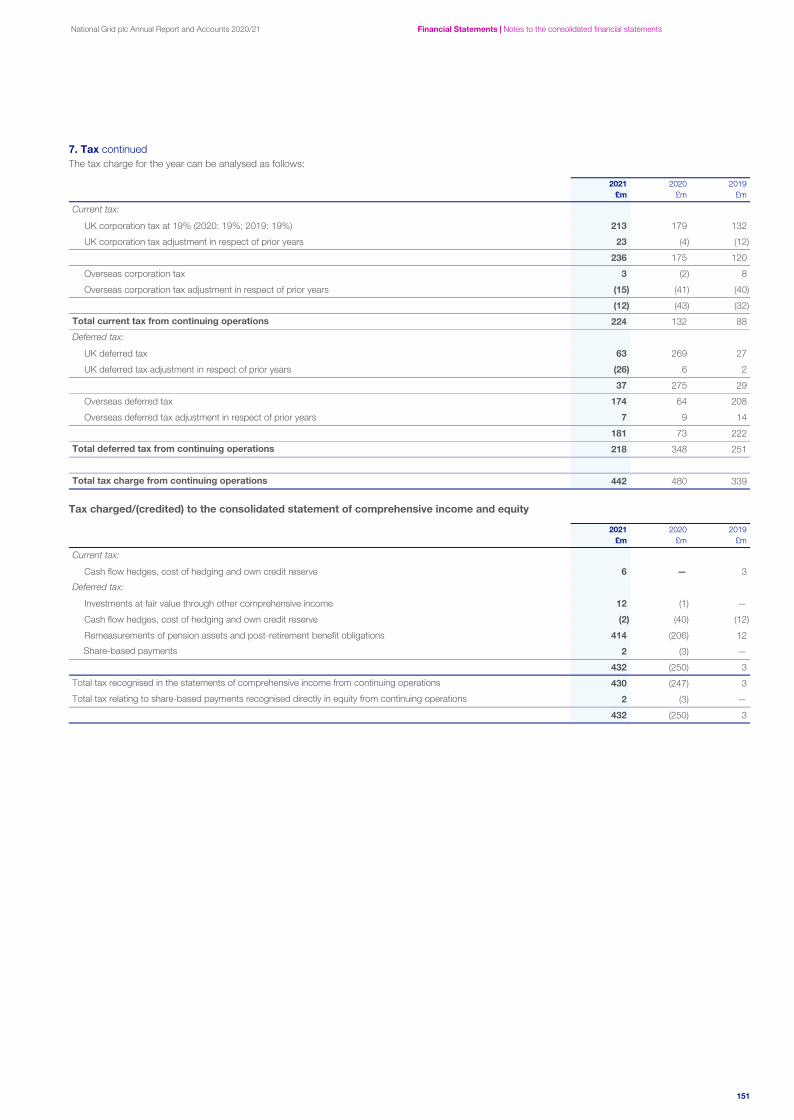
7. Tax continuedThe tax charge for the year can be analysed as follows:
2021 2020 2019£m £m £m
Current tax:
UK corporation tax at 19% (2020: 19%; 2019: 19%) 213 179 132
UK corporation tax adjustment in respect of prior years 23 (4) (12)
236 175 120
Overseas corporation tax 3 (2) 8
Overseas corporation tax adjustment in respect of prior years (15) (41) (40)
(12) (43) (32)
Total current tax from continuing operations 224 132 88
Deferred tax:
UK deferred tax 63 269 27
UK deferred tax adjustment in respect of prior years (26) 6 2
37 275 29
Overseas deferred tax 174 64 208
Overseas deferred tax adjustment in respect of prior years 7 9 14
181 73 222
Total deferred tax from continuing operations 218 348 251
Total tax charge from continuing operations 442 480 339
Tax charged/(credited) to the consolidated statement of comprehensive income and equity
2021 2020 2019£m £m £m
Current tax:
Cash flow hedges, cost of hedging and own credit reserve 6 — 3
Deferred tax:
Investments at fair value through other comprehensive income 12 (1) —
Cash flow hedges, cost of hedging and own credit reserve (2) (40) (12)
Remeasurements of pension assets and post-retirement benefit obligations 414 (206) 12
Share-based payments 2 (3) —
432 (250) 3
Total tax recognised in the statements of comprehensive income from continuing operations 430 (247) 3
Total tax relating to share-based payments recognised directly in equity from continuing operations 2 (3) —
432 (250) 3
National Grid plc Annual Report and Accounts 2020/21 Financial Statements | Notes to the consolidated financial statements
151

7. Tax continuedThe tax charge for the year after exceptional items and remeasurements, for the continuing business, is higher (2020: higher tax charge; 2019: lower tax charge) than the standard rate of corporation tax in the UK of 19% (2020: 19%; 2019: 19%):
Beforeexceptional
items andremeasurements
Afterexceptional
items andremeasurements
Beforeexceptional
items andremeasurements
Afterexceptional
items andremeasurements
Beforeexceptional
items andremeasurements
Afterexceptional
items andremeasurements
2021 2021 2020 2020 2019 2019£m £m £m £m £m £m
Profit before tax from continuing operations
Before exceptional items and remeasurements 2,050 2,050 2,346 2,346 2,489 2,489
Exceptional items and remeasurements — 33 — (592) — (648)
Profit before tax from continuing operations 2,050 2,083 2,346 1,754 2,489 1,841 Profit before tax from continuing operations multiplied by UK corporation tax rate of 19% (2020: 19%; 2019: 19%) 390 396 446 334 473 350
Effect of:
Adjustments in respect of prior years¹ (9) (11) (30) (30) (36) (36)
Expenses not deductible for tax purposes 19 30 26 29 22 28
Non-taxable income² (9) (9) (18) (18) (36) (36)
Adjustment in respect of foreign tax rates 42 42 53 18 78 56
Deferred tax impact of change in UK tax rate — — — 192 (3) (3) Adjustment in respect of post-tax profits of joint ventures and associates included within profit before tax (15) (12) (17) (17) (8) (8)
Other³ (2) 6 (27) (28) (2) (12)
Total tax charge from continuing operations 416 442 433 480 488 339
% % % % % %
Effective tax rate – continuing operations 20.3 21.2 18.5 27.4 19.6 18.4
1. The prior year adjustments are primarily due to agreement of prior period tax returns.2. Includes tax on chargeable disposals after the offset of capital losses. 3. Other primarily comprises the movement in the deferred tax asset on previously unrecognised capital losses and claims for land remediation relief.
Factors that may affect future tax chargesIn the Spring Budget 2021, the UK government announced an increase in the main corporation tax rate from 19% to 25% with effect from 1 April 2023. Since this had not been substantively enacted at the balance sheet date, deferred tax balances as at 31 March 2021 have been calculated at the current main UK corporation tax rate of 19%.
We expect our future deferred tax liabilities to increase reflecting the impact of the rate change. If the amended tax rate of 25% had been used, the deferred tax liability would have been approximately £560 million higher.
US government and US states are also considering changes to federal and state tax rates respectively, but as no changes have been substantively enacted at the balance sheet date deferred tax balances as at 31 March 2021 have been calculated at the prevailing tax rates.
We will continue to monitor the developments driven by Brexit, the OECD’s Base Erosion and Profit Shifting (BEPS) project and European Commission initiatives including fiscal aid investigations. At this time, we do not expect this to have any material impact on our future tax charges. Governments across the world including the UK and the US have introduced various stimulus/reliefs for businesses to cope with the impact of the COVID-19 pandemic, from which we do not currently expect there to be a material impact on our future tax charges.
National Grid plc Annual Report and Accounts 2020/21 Financial Statements
Notes to the consolidated financial statementscontinued
152

7. Tax continuedTax included within the statement of financial positionThe following are the major deferred tax assets and liabilities recognised, and the movements thereon, during the current and prior reporting periods:
Acceleratedtax
depreciation £m
Share-based
payments £m
Pensions and other
post-retirement
benefits £m
Financial instruments
£m
Other net temporary
differences1
£mTotal
£m
Deferred tax liabilities/(assets)
At 1 April 20192 5,727 (9) (170) 7 (1,340) 4,215
Exchange adjustments and other2,3 222 (30) (28) (3) (27) 134
Charged/(credited) to income statement 613 (7) 44 (13) (287) 350
(Credited)/charged to other comprehensive income and equity — (2) (206) (46) 1 (253)
At 1 April 20202 6,562 (48) (360) (55) (1,653) 4,446
Exchange adjustments and other3 (501) 4 51 4 174 (268)
Charged/(credited) to income statement 373 — (12) 1 (147) 215
Charged to other comprehensive income and equity — 2 414 6 — 422
At 31 March 2021 6,434 (42) 93 (44) (1,626) 4,815
1. The deferred tax asset of £1,626 million as at 31 March 2021 (2020: £1,653 million) in respect of other net temporary differences primarily relates to net operating losses of £455 million (2020: £547 million), US environmental provisions of £453 million (2020: £529 million) and US bad debt provision of £184 million (2020: £124 million).
2. Comparative amounts have been revised as described in note 1F.3. Exchange adjustments and other comprises foreign exchange arising on translation of the US dollar deferred tax balances. In 2020, it also included reclassification of £29 million from other
temporary differences to share-based payments.
Deferred tax assets and liabilities are only offset where there is a legally enforceable right of offset and there is an intention to settle the balances net. The deferred tax balances (after offset) for statement of financial position purposes consist solely of deferred tax liabilities of £4,815 million (2020: £4,446 million). This balance is after offset of a deferred tax asset of £455 million (2020: £547 million) which has been recognised in respect of net operating losses (£440 million) and capital losses (£15 million).
Deferred tax assets in respect of some capital losses as well as trading losses and non-trade deficits have not been recognised as their future recovery is uncertain or not currently anticipated. The total deferred tax assets not recognised are as follows:
2021 2020£m £m
Capital losses 1,620 1,626
Non-trade deficits 1 1
Trading losses 7 6
The capital losses arose in the UK on disposal of certain businesses or assets. They are available to carry forward indefinitely but can only be offset against future capital gains. The UK non-trade deficits arose prior to 1 April 2017 and therefore can only be offset against future non-trade profits.
At 31 March 2021 and 31 March 2020, there were no recognised deferred tax liabilities for taxes that would be payable on the unremitted earnings of the Group’s subsidiaries or its associates as there are no significant corporation tax consequences of the Group’s UK, US or overseas subsidiaries or associates paying dividends to their parent companies. There are also no significant income tax consequences for the Group from the payment of dividends by the Group to its shareholders.
National Grid plc Annual Report and Accounts 2020/21 Financial Statements | Notes to the consolidated financial statements
153

8. Earnings per share (EPS)
EPS is the amount of profit after tax attributable to each ordinary share. Basic EPS is calculated on profit after tax for the year attributable to equity shareholders divided by the weighted average number of shares in issue during the year. Diluted EPS shows what the impact would be if all outstanding share options were exercised and treated as ordinary shares at year end. The weighted average number of shares is increased by additional shares issued as scrip dividends and reduced by shares repurchased by the Company during the year. The earnings per share calculations are based on profit after tax attributable to equity shareholders of the Company which excludes non-controlling interests.
Adjusted earnings and EPS, which exclude exceptional items and remeasurements, are provided to reflect the adjusted profit sub-totals used by the Company. We have included reconciliations from this additional EPS measure to earnings for both basic and diluted EPS to provide additional detail for these items. For further details of exceptional items and remeasurements, see note 5.
(a) Basic EPS
Earnings EPS Earnings EPS Earnings EPS2021 2021 2020 2020 2019 2019
£m pence £m pence £m pence
Adjusted earnings from continuing operations 1,633 46.4 1,912 55.2 1,998 59.0
Exceptional items and remeasurements after tax from continuing operations 7 0.2 (639) (18.4) (499) (14.7)
Earnings from continuing operations 1,640 46.6 1,273 36.8 1,499 44.3
Adjusted earnings from discontinued operations — — 5 0.2 57 1.7
Exceptional items and remeasurements after tax from discontinued operations — — (14) (0.5) (45) (1.4)
Earnings from discontinued operations — — (9) (0.3) 12 0.3
Total adjusted earnings 1,633 46.4 1,917 55.4 2,055 60.7
Total exceptional items and remeasurements after tax (including discontinued operations) 7 0.2 (653) (18.9) (544) (16.1)
Total earnings 1,640 46.6 1,264 36.5 1,511 44.6
2021 2020 2019millions millions millions
Weighted average number of ordinary shares – basic 3,523 3,461 3,386
(b) Diluted EPS
Earnings EPS Earnings EPS Earnings EPS2021 2021 2020 2020 2019 2019
£m pence £m pence £m pence
Adjusted earnings from continuing operations 1,633 46.1 1,912 55.0 1,998 58.8
Exceptional items and remeasurements after tax from continuing operations 7 0.2 (639) (18.4) (499) (14.7)
Earnings from continuing operations 1,640 46.3 1,273 36.6 1,499 44.1
Adjusted earnings from discontinued operations — — 5 0.1 57 1.7
Exceptional items and remeasurements after tax from discontinued operations — — (14) (0.4) (45) (1.4)
Earnings from discontinued operations — — (9) (0.3) 12 0.3
Total adjusted earnings 1,633 46.1 1,917 55.1 2,055 60.5
Total exceptional items and remeasurements after tax (including discontinued operations) 7 0.2 (653) (18.8) (544) (16.1)
Total earnings 1,640 46.3 1,264 36.3 1,511 44.4
2021 2020 2019millions millions millions
Weighted average number of ordinary shares – diluted 3,540 3,478 3,401
(c) Reconciliation of basic to diluted average number of shares
2021 2020 2019millions millions millions
Weighted average number of ordinary shares – basic 3,523 3,461 3,386
Effect of dilutive potential ordinary shares – employee share plans 17 17 15
Weighted average number of ordinary shares – diluted 3,540 3,478 3,401
National Grid plc Annual Report and Accounts 2020/21 Financial Statements
Notes to the consolidated financial statementscontinued
154

9. DividendsInterim dividends are recognised when they become payable to the Company’s shareholders. Final dividends are recognised when they are approved by shareholders.
2021 2020 2019
Pence per share
Cash dividend
£m
Scrip dividend
£mPence
per share
Cash dividend
£m
Scrip dividend
£mPence
per share
Cash dividend
£m
Scrip dividend
£m
Interim dividend in respect of the current year 17.00 348 249 16.57 335 241 16.08 450 94
Final dividend in respect of the prior year 32.00 1,065 54 31.26 557 517 30.44 710 319
49.00 1,413 303 47.83 892 758 46.52 1,160 413
The Directors are proposing a final dividend for the year ended 31 March 2021 of 32.16p per share that will absorb approximately £1,141 million of shareholders’ equity (assuming all amounts are settled in cash). It will be paid on 18 August 2021 to shareholders who are on the register of members at 4 June 2021 (subject to shareholders’ approval at the AGM). A scrip dividend will be offered as an alternative.
10. Discontinued operations and assets held for sale
The results and cash flows of significant assets or businesses sold during the year are shown separately from our continuing operations, and presented within discontinued operations in the income statement and cash flow statement. Assets and businesses are classified as held for sale when their carrying amounts are recovered through sale rather than through continuing use. They only meet the held for sale condition when the assets are ready for immediate sale in their present condition, management is committed to the sale and it is highly probable that the sale will complete within one year. Depreciation ceases on assets and businesses when they are classified as held for sale and the assets and businesses are impaired if the proceeds less sale costs fall short of the carrying value.
The Narragansett Electric CompanyOn 17 March 2021, the Group signed an agreement to sell 100% of the share capital of a wholly owned subsidiary, The Narragansett Electric Company (NECO). NECO is part of our US Regulated segment and is a retail distribution company providing electricity and gas to customers in Rhode Island. The expected sale proceeds are £2.8 billion ($3.8 billion), and the sale is expected to complete in March 2022 once all regulatory approvals are obtained.
As the sale is considered highly probable and is expected to complete within a year, the associated assets and liabilities have been presented as held for sale in the consolidated statement of financial position. However, as NECO does not represent a separate major line of business or geographical operations, it has not met the criteria for classification as a discontinued operation and therefore its results for the period are not separately disclosed on the face of the income statement.
The following assets and liabilities of NECO were classified as held for sale at 31 March 2021:
2021£m
Goodwill 562
Intangible assets 3
Property, plant and equipment 2,713
Trade and other receivables 237
Cash and cash equivalents 4
Other assets 38
Total assets held for sale 3,557
Borrowings (1,123)
Pension liabilities (49)
Other liabilities (396)
Total liabilities held for sale (1,568)
Net assets held for sale 1,989
No impairment losses were recognised upon remeasurement of the assets and liabilities prior to classification as held for sale. NECO generated profit after tax of £104 million (2020: £31 million; 2019: £137 million) for the year ended 31 March 2021. Current and deferred tax balances relating to NECO have not been included as held for sale on the basis that those balances will be retained by National Grid rather than transferring with the other assets and liabilities of NECO.
The Group also announced its intention to sell a majority stake in the UK Gas Transmission business. However, as the process is still at an early stage and is not expected to be marketed until later in the year, the business has not been classified as held for sale and has not met the criteria for classification as a discontinued operation as at 31 March 2021.
National Grid plc Annual Report and Accounts 2020/21 Financial Statements | Notes to the consolidated financial statements
155

10. Discontinued operations and assets held for sale continuedQuadgas HoldCo LimitedIn June 2019, the Group sold its remaining 39% interest in Cadent (held through its holding in Quadgas HoldCo Limited (Quadgas)). This interest had been classified as held for sale from 30 June 2018 until the date of disposal, as detailed in the Annual Report and Accounts for the year ended 31 March 2019.
The aggregate carrying value of our investment in Quadgas at the disposal date was £1,956 million. This was comprised of the carrying value of the Group’s equity interest in Quadgas of £1,494 million, a shareholder loan to Quadgas of £352 million and a derivative financial asset with a fair value of £110 million. The total sales proceeds were £1,965 million. The gain on disposal was £9 million.
We considered the disposal of our 39% investment in Quadgas as the final stage of the plan to dispose of our interest in the UK Gas Distribution business first announced in 2015, and accordingly treated the results and cash flows arising from Quadgas as a discontinued operation on the basis that the sale formed the final part of a ‘single coordinated plan’ to dispose of UK Gas Distribution. As a consequence, we classified the various elements of income, expense and cash flows within discontinued operations as set out below. Once the assets were treated as ‘held for sale’, equity accounting ceased for our investment in our associate. We therefore ceased to record our share of profits from 30 June 2018.
The summary income statement for discontinued operations is as follows:
2020 2019£m £m
Revenue — —
Operating costs¹ (23) (1)
Operating loss (23) (1)
Net finance income 6 23
Share of post-tax results of joint ventures and associates² — (5)
(Loss)/profit before tax from discontinued operations (17) 17
Tax from discontinued operations (1) (5)
(Loss)/profit after tax from discontinued operations (18) 12
Gain on disposal 9 —
Total (loss)/profit after tax from discontinued operations³ (9) 12
1. Operating costs for the year ended 31 March 2020 related to final transaction costs and other expenses in relation to Quadgas. 2. For the year ended 31 March 2019, the amount presented is the net of £43 million impairment charge against the investment in Quadgas and £38 million share of Quadgas post-tax profits
recognised prior to classification as held for sale.3. For the year ended 31 March 2020, the £23 million of operating expenses and the £9 million gain on disposal are treated as exceptional. For the year ended 31 March 2019, the £43 million
impairment charge against the investment in Quadgas, net operating costs of £1 million and the tax thereon are classified as exceptional items.
The summary statement of comprehensive income for discontinued operations is as follows:
2020 2019£m £m
(Loss)/profit after tax from discontinued operations (9) 12
Other comprehensive income
Items that will never be reclassified to profit or loss:
Share of other comprehensive income of associate, net of tax — 36
Total items from discontinued operations that will never be reclassified to profit or loss — 36
Items that may be reclassified subsequently to profit or loss:
Net gains in respect of cash flow hedges 6 —
Total items from discontinued operations that may be reclassified subsequently to profit or loss 6 —
Other comprehensive income for the year, net of tax from discontinued operations 6 36
Total comprehensive (loss)/income for the year from discontinued operations (3) 48
The summary cash flows for discontinued operations are as follows:
Cash flows used in operating activities of £97 million in 2020 (2019: £71 million) primarily related to cash outflows in respect of voluntary contributions totalling £66 million paid to the Warm Homes Fund, the utilisation of provisions and the payment of the final transaction fees incurred in the period.
Cash inflows from investing activities of £6 million in 2020 (2019: £156 million) were comprised of dividends received and interest received on the shareholder loan.
There were no cash flows for financing activities in 2020 or 2019.
National Grid plc Annual Report and Accounts 2020/21 Financial Statements
Notes to the consolidated financial statementscontinued
156

11. Goodwill
Goodwill represents the excess of what we paid to acquire businesses over the fair value of their net assets at the acquisition date. We assess whether goodwill is recoverable by performing an impairment review annually or more frequently if events or changes in circumstances indicate a potential impairment.
Goodwill and fair value adjustments arising on the acquisition of a foreign entity are treated as assets and liabilities of the foreign entity and translated at the closing exchange rate. Goodwill is allocated to cash-generating units and this allocation is made to those cash-generating units that are expected to benefit from the acquisition in which the goodwill arose.
Impairment is recognised where there is a difference between the carrying value of the cash-generating unit and the estimated recoverable amount of the cash-generating unit to which that goodwill has been allocated. Any impairment is recognised immediately in the income statement and is not subsequently reversed. Any impairment loss is first allocated to the carrying value of the goodwill and then to the other assets within the cash-generating unit. Recoverable amount is defined as the higher of fair value less costs to sell and estimated value-in-use at the date the impairment review is undertaken. Value-in-use represents the present value of expected future cash flows, discounted using a pre-tax discount rate that reflects current market assessments of the time value of money and the risks specific to the asset for which the estimates of future cash flows have not been adjusted.
Total£m
Net book value at 1 April 2019¹ 5,372
Exchange adjustments¹ 259
Acquisition of National Grid Renewables (note 38) 81
Net book value at 1 April 2020 5,712
Exchange adjustments (562)
Reclassification to held for sale (note 10) (562)
Net book value at 31 March 2021 4,588
1. Comparative amounts have been revised as described in note 1F.
There is no significant accumulated impairment charge as at 31 March 2021 or 31 March 2020.
The amounts disclosed above as at 31 March 2021 relate to the following cash-generating units: New York £3,004 million (2020: £3,334 million); Massachusetts £963 million (2020: £1,069 million); Rhode Island £nil (2020: £438 million); Federal £544 million (2020: £790 million); and National Grid Renewables £77 million (2020: £81 million). Following the announcement of the sale of NECO (see note 10), goodwill balances relating to the Rhode Island cash generating unit and a portion of the goodwill relating to the Federal cash generating unit were reclassified as held for sale in the period.
Goodwill is reviewed annually for impairment and the recoverability of goodwill has been assessed by comparing the carrying amount of our operations described above (our cash-generating units) with the expected recoverable amount on a value-in-use basis. In each assessment, the value-in-use has been calculated based on five-year plan projections that incorporate our best estimates of future cash flows, customer rates, costs (including changes in commodity prices), future prices and growth. Such projections reflect our current regulatory rate plans taking into account regulatory arrangements to allow for future rate plan filings and recovery of investment. The projections also take account of the costs associated with our net zero plans and the associated regulatory arrangements. Our plans have proved to be reliable guides in the past and the Directors believe the estimates are appropriate.
The future economic growth rate used to extrapolate projections beyond five years is 2.1% (2020: 2.1%). The growth rate has been determined having regard to data on projected growth in US real gross domestic product (GDP). Based on the position of our business in the underlying US economy, it is appropriate for the terminal growth rate to be based upon the overall growth in real GDP and, given the nature of our operations, to extend over a long period of time. Cash flow projections have been discounted to reflect the time value of money, using a post-tax discount rate of 5.0% (2020: 4.5%). The equivalent pre-tax discount rate is 5.3% (2020: 4.5%). The discount rate represents the estimated weighted average cost of capital of these operations.
In assessing the carrying value of goodwill, we have sensitised our forecasts to factor in a reduction in revenues and lower tax costs into our cash flow forecasts, but we have not reflected the impact of additional rate base growth on future earnings. While it is possible that a key assumption in the calculation could change, the Directors believe that no reasonably foreseeable change would result in an impairment of goodwill, in view of the long-term nature of the key assumptions and the margin by which the estimated value-in-use exceeds the carrying amount. This remains the case even after taking into account the short-term effects of COVID-19, the most significant of which is an increase in bad debt charges in the short term.
National Grid plc Annual Report and Accounts 2020/21 Financial Statements | Notes to the consolidated financial statements
157

12. Other intangible assets
Other intangible assets mainly comprise software which is written down (amortised) over the period we expect to receive a benefit from the asset. An amortisation expense is charged to the income statement to reflect the reduced value of the asset over time. Amortisation is calculated by estimating the number of years we expect the asset to be used (useful economic life or UEL) and charging the cost of the asset to the income statement equally over this period.
Identifiable intangible assets are recorded at cost less accumulated amortisation and any provision for impairment. Other intangible assets are tested for impairment only if there is an indication that the carrying value of the assets may have been impaired. Impairments of assets are calculated as the difference between the carrying value of the asset and the recoverable amount, if lower. Where such an asset does not generate cash flows that are independent from other assets, the recoverable amount of the cash-generating unit to which that asset belongs is estimated. Impairments are recognised in the consolidated income statement and are disclosed separately. Any assets which suffered impairment in a previous period are reviewed for possible reversal of the impairment at each reporting date.
Internally generated intangible assets, such as software, are recognised only if: i) an asset is created that can be identified; ii) it is probable that the asset created will generate future economic benefits; and iii) the development cost of the asset can be measured reliably. Where no internally generated intangible asset can be recognised, development expenditure is recorded as an expense in the period in which it is incurred.
Other intangible assets are amortised on a straight-line basis over their estimated useful economic lives. Amortisation periods for other intangible assets are:
Years
Software 3 to 10
Software£m
Assets in the course of
construction£m
Total£m
Cost at 1 April 2019 1,784 384 2,168
Exchange adjustments 45 18 63
Additions 38 314 352
Reclassifications 159 (159) —
Cost at 1 April 2020 2,026 557 2,583
Exchange adjustments (102) (43) (145)
Additions 7 414 421
Disposals (47) (2) (49)
Reclassifications¹ 255 (240) 15
Reclassification to held for sale (note 10) (19) — (19)
Cost at 31 March 2021 2,120 686 2,806
Accumulated amortisation at 1 April 2019 (1,084) — (1,084)
Exchange adjustments (28) — (28)
Amortisation charge for the year (176) — (176)
Accumulated amortisation at 1 April 2020 (1,288) — (1,288)
Exchange adjustments 61 — 61
Amortisation charge for the year (196) — (196)
Accumulated amortisation of disposals 44 — 44
Reclassification to held for sale (note 10) 16 — 16
Accumulated amortisation at 31 March 2021 (1,363) — (1,363)
Net book value at 31 March 2021² 757 686 1,443
Net book value at 31 March 2020 738 557 1,295
1. Reclassifications includes amounts transferred from property, plant and equipment (see note 13).2. The Group has capitalised £298 million (2020: £240 million) in relation to the Gas Business Enablement system in the US, of which £82 million (2020: £30 million) is in service and is being
amortised over 10 years, with the remainder included within assets in the course of construction. A further £117 million (2020: £59 million) in relation to our new UK general ledger system is also included within assets in the course of construction as at 31 March 2021, and is expected to be amortised over 10 years once it is commissioned in July 2021.
National Grid plc Annual Report and Accounts 2020/21 Financial Statements
Notes to the consolidated financial statementscontinued
158

13. Property, plant and equipment
Property, plant and equipment are the physical assets controlled by us. The cost of these assets primarily represents the amount initially paid for them. This includes both their purchase price and the construction and other costs associated with getting them ready for operation. A depreciation expense is charged to the income statement to reflect annual wear and tear and the reduced value of the asset over time. Depreciation is calculated by estimating the number of years we expect the asset to be used (useful economic life or UEL) and charging the cost of the asset to the income statement equally over this period.
We operate an energy networks business and therefore have a significant physical asset base. We continue to invest in our networks to maintain reliability, create new customer connections and ensure our networks are flexible and resilient. Our business plan envisages these additional investments will be funded through a mixture of cash generated from operations and the issue of new debt.
Property, plant and equipment is recorded at cost, less accumulated depreciation and any impairment losses. Cost includes the purchase price of the asset; any payroll and finance costs incurred which are directly attributable to the construction of property, plant and equipment; and the cost of any associated asset retirement obligations.
Property, plant and equipment includes assets in which the Group’s interest comprises legally protected statutory or contractual rights of use. Additions represent the purchase or construction of new assets, including capital expenditure for safety and environmental assets, and extensions to, enhancements to, or replacement of, existing assets. All costs associated with projects or activities which have not been fully commissioned at the period end are classified within assets in the course of construction.
Items within property, plant and equipment are tested for impairment only if there is some indication that the carrying value of the assets may have been impaired. Impairments of assets are calculated as the difference between the carrying value of the asset and the recoverable amount, if lower. Where such an asset does not generate cash flows that are independent from other assets, the recoverable amount of the cash-generating unit to which that asset belongs is estimated. Impairments are recognised in the income statement and if immaterial are included within the depreciation charge for the year.
(a) Asset useful economic livesNo depreciation is provided on freehold land or assets in the course of construction. Other items of property, plant and equipment are depreciated, on a straight-line basis, at rates estimated to write off their book values over their estimated useful economic lives. In assessing estimated useful economic lives, consideration is given to any contractual arrangements and operational requirements relating to particular assets. The assessments of estimated useful economic lives and residual values of assets are performed annually.
Unless otherwise determined by operational requirements, the depreciation periods for the principal categories of property, plant and equipment are, in general, as shown in the table below split between the UK and US, along with the weighted average remaining UEL for each class of property, plant and equipment (which is calculated by applying the annual depreciation charge per class of asset to the net book value of that class of asset).
Years
UK US
Weighted average
remainingUEL
Freehold and leasehold buildings up to 60 up to 100 9
Plant and machinery:
Electricity transmission plant and wires 15 to 100 45 to 80 30
Electricity distribution plant n/a 35 to 85 33
Electricity generation plant n/a 20 to 93 10
Interconnector plant and other 5 to 60 5 to 50 16
Gas plant – mains, services and regulating equipment 10 to 65 47 to 95 45
Gas plant – storage 5 to 40 12 to 65 12
Gas plant – meters 7 to 30 14 to 40 20
Motor vehicles and office equipment up to 10 up to 26 4
(b) Gas asset livesThe role that gas networks play in the pathway to achieving the greenhouse gas emissions reductions targets set in the jurisdictions in which we operate is currently uncertain. However, we believe the gas assets which we own and operate today will continue to have a crucial role in maintaining security, reliability and affordability of energy beyond 2050, although the scale and purpose for which the networks will be used is dependent on technological developments and policy choices of governments and regulators. • In the UK, the useful economic life of gas mains, services and regulating assets relating to the National Transmission System (NTS) are frequently reviewed
throughout the year and subject to a detailed review at the year end. The most material components of these are our pipeline assets, which are due to be fully depreciated by 2070, with other assets being depreciated over various periods between now and then. Those reviews considered a number of scenarios, which consider the implications of the UK’s net zero by 2050 legislation for the NTS. Our most recent review concluded that the most likely outcome was for the NTS network assets to remain in use beyond 2050, including in those scenarios where the greenhouse gas emissions of gas networks were largely eliminated.
• With respect to our US gas distribution assets, asset lives are assessed as part of detailed depreciation studies completed as part of each separate rate proceeding. Depreciation studies consider the physical condition of assets and the expected operational life of an asset. We believe these assessments are our best estimate of the UEL of our gas network assets in the US. The weighted average remaining UEL for our US gas distribution fixed asset base is circa 50 years, however a sizeable proportion of our assets are assumed to have UELs which extend beyond 2080. We continue to believe the lives identified by rate proceedings are the best estimate of the assets’ UELs, although we continue to keep this assumption under review as we learn more about possible future pathways towards net zero. Whilst the targets, goals and ambitions have now been formalised in legislation in the states in which we operate, there is widespread recognition that work needs to be done to define the possible future decarbonisation pathways. We continue to actively engage and support our regulators to enable the clean energy transition in a safe, reliable and affordable way.Asset depreciation lives feed directly into our US regulatory recovery mechanisms, such that any shortening of asset lives and regulatory recovery periods as agreed with regulators should be recoverable through future rates, subject to agreement, over future periods, as part of wider considerations around ensuring the continuing affordability of gas in our service territories.
National Grid plc Annual Report and Accounts 2020/21 Financial Statements | Notes to the consolidated financial statements
159

13. Property, plant and equipment continuedGiven the uncertainty described relating to the UELs of our gas assets, below we provide a sensitivity on the depreciation charge for our UK and US regulated segments were a shorter UEL presumed:
Increase in depreciation expense for the year ended 31 March 2021
Increase in depreciation expense for the year ended 31 March 2020
UK regulated £m
US regulated£m
UK regulated £m
US regulated£m
UELs limited to 2050 35 160 37 151
UELs limited to 2060 12 70 13 66
UELs limited to 2070 1 28 — 26
Note that this sensitivity calculation excludes any assumptions regarding the residual value for our asset base and the effect shortening asset depreciation lives would be expected to have on our regulatory recovery mechanisms.
(c) Analysis of property, plant and equipment
Land andbuildings
£m
Plant andmachinery
£m
Assets in the
course of construction
£m
Motor vehicles
and office equipment
£mTotal
£m
Cost at 1 April 2019 (before transition to IFRS 16)1 3,338 53,829 5,049 930 63,146
Right-of-use assets recognised on transition to IFRS 162 381 67 — 20 468
Cost at 1 April 2019 (as restated) 3,719 53,896 5,049 950 63,614
Exchange adjustments1 98 1,484 83 33 1,698
Additions 130 464 4,029 104 4,727
Disposals (79) (486) (9) (65) (639)
Reclassifications3,4 29 4,251 (4,381) 14 (87)
Cost at 1 April 2020 3,897 59,609 4,771 1,036 69,313
Exchange adjustments (213) (3,308) (130) (73) (3,724)
Additions 89 328 4,023 70 4,510
Disposals (6) (344) (26) (48) (424)
Reclassifications3 96 3,007 (3,243) 77 (63)
Reclassification to held for sale (note 10) (111) (3,231) (174) (44) (3,560)
Cost at 31 March 2021 3,752 56,061 5,221 1,018 66,052
Accumulated depreciation at 1 April 20191 (778) (16,918) — (591) (18,287)
Exchange adjustments1 (16) (329) — (20) (365)
Depreciation charge for the year (92) (1,252) — (120) (1,464)
Disposals 36 464 — 58 558
Reclassifications3 3 (7) — 11 7
Accumulated depreciation at 1 April 2020 (847) (18,042) — (662) (19,551)
Exchange adjustments 37 698 — 46 781
Depreciation charge for the year (90) (1,270) — (116) (1,476)
Disposals — 339 — 48 387
Reclassifications3 2 (5) — 6 3
Reclassification to held for sale (note 10) 22 798 — 27 847
Accumulated depreciation at 31 March 2021 (876) (17,482) — (651) (19,009)
Net book value at 31 March 2021 2,876 38,579 5,221 367 47,043
Net book value at 31 March 2020 3,050 41,567 4,771 374 49,762
1. Comparative amounts have been revised as described in note 1F.2. On 1 April 2019, £468 million of additional right-of-use assets were recognised on transition to IFRS 16. See note 37 for details.3. Represents amounts transferred between categories, (to)/from other intangible assets (see note 12), from inventories and reclassifications between cost and accumulated depreciation.4. In 2020, comprised an £87 million reduction in the gross cost of assets in the course of construction in our UK Electricity Transmission business for costs previously capitalised and accrued as due
to a supplier, that were subsequently no longer payable.
2021 2020£m £m
Information in relation to property, plant and equipment
Capitalised interest included within cost 2,233 2,118
Contributions to cost of property, plant and equipment included within:
Trade and other payables 138 84
Non-current liabilities 400 428
Contract liabilities – current 66 76
Contract liabilities – non-current 1,093 1,082
13. Property, plant and equipment continued
National Grid plc Annual Report and Accounts 2020/21 Financial Statements
Notes to the consolidated financial statementscontinued
160
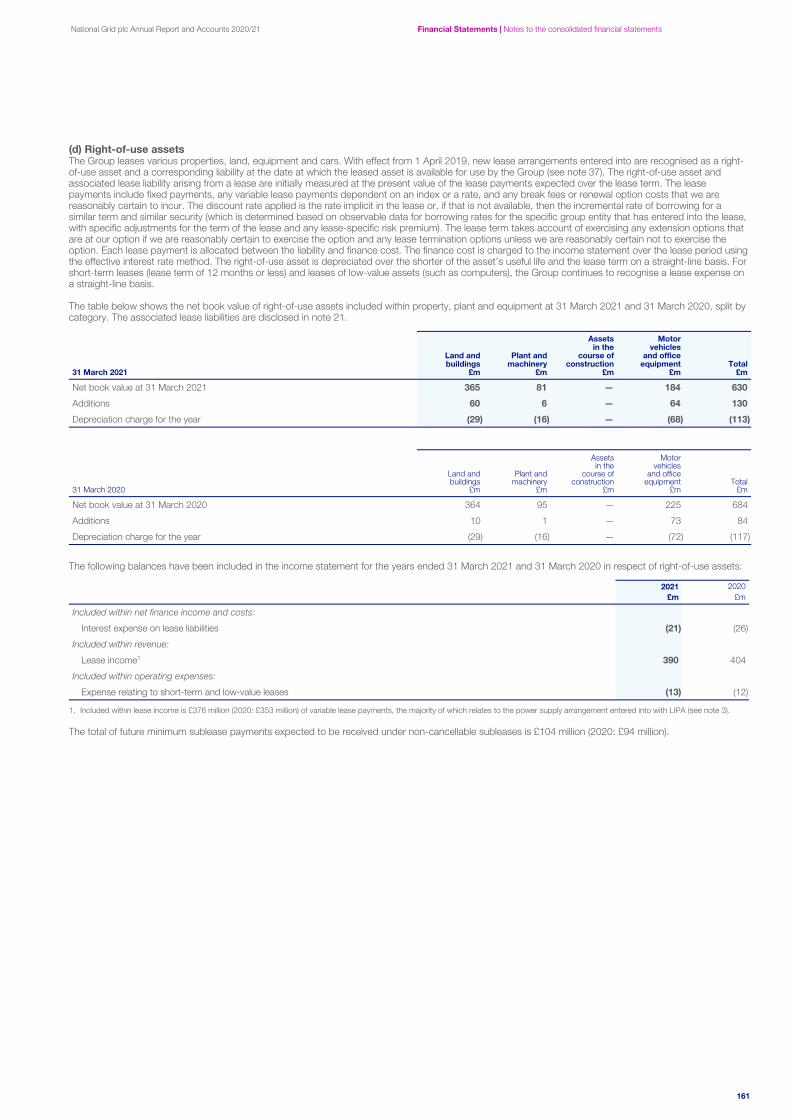
(d) Right-of-use assetsThe Group leases various properties, land, equipment and cars. With effect from 1 April 2019, new lease arrangements entered into are recognised as a right-of-use asset and a corresponding liability at the date at which the leased asset is available for use by the Group (see note 37). The right-of-use asset and associated lease liability arising from a lease are initially measured at the present value of the lease payments expected over the lease term. The lease payments include fixed payments, any variable lease payments dependent on an index or a rate, and any break fees or renewal option costs that we are reasonably certain to incur. The discount rate applied is the rate implicit in the lease or, if that is not available, then the incremental rate of borrowing for a similar term and similar security (which is determined based on observable data for borrowing rates for the specific group entity that has entered into the lease, with specific adjustments for the term of the lease and any lease-specific risk premium). The lease term takes account of exercising any extension options that are at our option if we are reasonably certain to exercise the option and any lease termination options unless we are reasonably certain not to exercise the option. Each lease payment is allocated between the liability and finance cost. The finance cost is charged to the income statement over the lease period using the effective interest rate method. The right-of-use asset is depreciated over the shorter of the asset’s useful life and the lease term on a straight-line basis. For short-term leases (lease term of 12 months or less) and leases of low-value assets (such as computers), the Group continues to recognise a lease expense on a straight-line basis.
The table below shows the net book value of right-of-use assets included within property, plant and equipment at 31 March 2021 and 31 March 2020, split by category. The associated lease liabilities are disclosed in note 21.
31 March 2021
Land andbuildings
£m
Plant andmachinery
£m
Assets in the
course of construction
£m
Motor vehicles
and office equipment
£mTotal
£m
Net book value at 31 March 2021 365 81 — 184 630
Additions 60 6 — 64 130
Depreciation charge for the year (29) (16) — (68) (113)
31 March 2020
Land andbuildings
£m
Plant andmachinery
£m
Assets in the
course of construction
£m
Motor vehicles
and office equipment
£mTotal
£m
Net book value at 31 March 2020 364 95 — 225 684
Additions 10 1 — 73 84
Depreciation charge for the year (29) (16) — (72) (117)
The following balances have been included in the income statement for the years ended 31 March 2021 and 31 March 2020 in respect of right-of-use assets:
2021 2020£m £m
Included within net finance income and costs:
Interest expense on lease liabilities (21) (26)
Included within revenue:
Lease income¹ 390 404
Included within operating expenses:
Expense relating to short-term and low-value leases (13) (12)
1. Included within lease income is £376 million (2020: £353 million) of variable lease payments, the majority of which relates to the power supply arrangement entered into with LIPA (see note 3).
The total of future minimum sublease payments expected to be received under non-cancellable subleases is £104 million (2020: £94 million).
National Grid plc Annual Report and Accounts 2020/21 Financial Statements | Notes to the consolidated financial statements
161

14. Other non-current assets
Other non-current assets include assets that do not fall into any other non-current asset category (such as goodwill or property, plant and equipment) where the benefit to be received from the asset is not due to be received until after 31 March 2022.
2021 2020£m £m
Other receivables 45 35
Non-current tax assets 6 65
Prepayments 5 19
Accrued income¹ 237 235
293 354
1. Includes accrued income in relation to property sales to the St William joint venture.
15. Financial and other investments
The Group holds a range of financial and other investments. These investments include short-term money market funds, quoted investments in equities or bonds of other companies, investments in our venture capital portfolio (National Grid Partners), bank deposits with a maturity of greater than three months, and investments that can not be readily used in operations, principally collateral deposited in relation to derivatives.
The classification of each investment held by the Group is determined based on two main factors: • its contractual cash flows – whether the assets cash flows are solely payments of the principal and interest on the financial asset on pre-determined dates or
whether the cash flows are determined by other factors such as the performance of a company; and • the business model for holding the investments – whether the intention is to hold onto the investment for the longer term (collect the contractual cash flows),
or to sell the asset with the intention of managing any gain or loss on sale or to manage any liquidity requirements.
The four categories of financial and other investments are as follows: • Financial assets at amortised cost – debt instruments that have contractual cash flows that are solely payments of principal and interest, and which are held
within a business model whose objective is to collect contractual cash flows, are held at amortised cost. This category includes our receivables in relation to deposits and collateral;
• FVOCI debt and other investments – debt investments, such as bonds, that have contractual cash flows that are solely payments of principal and interest, and which are held within a business model whose objective is both to collect the contractual cash flows and to sell the debt instruments, are measured at fair value through other comprehensive income (FVOCI), with gains or losses recognised in the consolidated statement of comprehensive income instead of through the income statement. On disposal, any gains or losses are recognised within finance income in the income statement (see note 6). Other investments include insurance contracts, measured at fair value, and held to back the present value of unfunded pension liabilities in note 25;
• FVOCI equity instruments – the Group has elected to measure equity instruments that are shares held as part of a portfolio of financial instruments which back some long-term employee liabilities at FVOCI on the basis that they are not held for trading and so recognising gains and losses on these investments in the income statement would not be representative of performance in the year. On disposal, any realised gains and losses are transferred to retained earnings (see note 28); and
• FVTPL investments – other financial investments are subsequently measured at fair value with any gains or losses recognised in the income statement (FVTPL). This primarily comprises our money market funds, insurance company fund investments and corporate venture capital investments held by National Grid Partners.
Financial and other investments are initially recognised on trade date. Subsequent to initial recognition, the fair values of financial assets that are quoted in active markets are based on bid prices. When independent prices are not available, fair values are determined using valuation techniques used by the relevant markets using observable market data where possible (see note 32(g) for further details).
National Grid plc Annual Report and Accounts 2020/21 Financial Statements
Notes to the consolidated financial statementscontinued
162

15. Financial and other investments continued
2021 2020£m £m
Non-current
FVOCI debt and other investments 416 352
FVOCI equity investments 99 83
FVTPL investments 240 108
755 543
Current
FVTPL investments 1,768 1,278
Financial assets at amortised cost 574 720
2,342 1,998
3,097 2,541
Financial and other investments include the following:
Investments in short-term money market funds 1,412 951
Investments held by National Grid Partners 136 97
Other investments 103 11
Balances that are restricted or not readily used in operations:
Collateral1 540 685
Insurance company and non-qualified plan investments 589 542
Cash surrender value of life insurance policies 283 220
Other investments 34 35
3,097 2,541
1. The collateral balance includes: £480 million (2020: £685 million) of collateral placed with counterparties with whom we have entered into a credit support annex to the International Swaps and Derivatives Association (ISDA) Master Agreement; £42 million (2020: £nil) of collateral paid by operating companies as required security deposits under the Connection and Use of System Code; and £18 million (2020: £nil) of restricted amounts allocated for specific projects within the National Grid Electricity System Operator.
FVTPL and FVOCI investments are recorded at fair value. The carrying value of current financial assets at amortised cost approximates their fair values, primarily due to short-dated maturities. The exposure to credit risk at the reporting date is the fair value of the financial investments. For further information on our credit risk, refer to note 32(a).
For the purposes of impairment assessment, the investments in bonds are considered to be low risk as they are investment grade securities; life insurance policies are held with regulated insurance companies; and deposits, collateral receivable and other financial assets at amortised cost are investment grade. All financial assets held at FVOCI or amortised cost are therefore considered to have low credit risk and have an immaterial impairment loss allowance equal to 12-month expected credit losses.
In determining the expected credit losses for these assets, some or all of the following information has been considered: credit ratings, the financial position of counterparties, the future prospects of the relevant industries and general economic forecasts.
No FVOCI or amortised cost financial assets have had modified cash flows during the period. There has been no change in the estimation techniques or significant assumptions made during the year in assessing the loss allowance for these financial assets. There were no significant movements in the gross carrying value of financial assets during the year that contribute to changes in the loss allowance. No collateral is held in respect of any of the financial investments in the above table. No balances are more than 30 days past due, and no balances were written off during the year.
16. Investments in joint ventures and associates
Investments in joint ventures and associates represent businesses we do not control but over which we exercise joint control or significant influence. They are accounted for using the equity method. A joint venture is an arrangement established to engage in economic activity, which the Group jointly controls with other parties and has rights to a share of the net assets of the arrangement. An associate is an entity which is neither a subsidiary nor a joint venture, but over which the Group has significant influence.
2021 2020
Associates£m
Jointventures
£mTotal
£mAssociates
£m
Joint ventures
£mTotal
£m
Share of net assets at 1 April 341 654 995 291 317 608
Exchange adjustments (22) (36) (58) 20 12 32
Additions 6 75 81 16 156 172
Capitalisation of shareholder loan to Nemo Link Limited — — — — 176 176
Share of post-tax results for the year 30 28 58 40 47 87
Share of other comprehensive income of associates, net of tax 1 — 1 1 — 1
Dividends received (31) (49) (80) (41) (34) (75)
Other movements¹ (96) (34) (130) 14 (20) (6)
Share of net assets at 31 March 229 638 867 341 654 995
1. Within associates, the other movements for the year primarily relates to the reclassification of an investment in an associate to financial investments.
National Grid plc Annual Report and Accounts 2020/21 Financial Statements | Notes to the consolidated financial statements
163

16. Investments in joint ventures and associates continuedA list of joint ventures and associates including the name and proportion of ownership is provided in note 34. Transactions with and outstanding balances with joint ventures and associates are shown in note 31. The joint ventures and associates have no significant contingent liabilities to which the Group is exposed, and the Group has no significant contingent liabilities in relation to its interests in the joint ventures and associates. The Group has capital commitments of £141 million (2020: £240 million) in relation to joint ventures.
At 31 March 2021, the Group had three material joint ventures, being its 50% equity stakes in BritNed and Nemo Link Limited (Nemo) and its 51% stake in Emerald Energy Venture LLC (Emerald). The Group has one material associate, being its 26.25% investment in Millennium Pipeline Company LLC. BritNed is a joint venture with the Dutch transmission system operator, TenneT, and operates the subsea electricity link between Great Britain and the Netherlands, commissioned in 2011. Nemo is a joint venture with the Belgian transmission operator, Elia, and is a subsea electricity interconnector between the UK and Belgium, which became operational on 31 January 2019. BritNed and Nemo have reporting periods ending on 31 December with monthly management reporting information provided to National Grid. Emerald is a joint venture with Washington State Investment Board and builds and operates wind and solar assets. Emerald was acquired on 11 July 2019. Millennium Pipeline Company LLC is an associate that owns a natural gas pipeline from southern New York to the Lower Hudson Valley.
Summarised financial information as at 31 March, together with the carrying amount of the investments, is as follows:
BritNed Development Limited
Millennium Pipeline Company LLC
Nemo Link Limited
Emerald Energy Venture LLC
2021 2020 2021 2020 2021 2020 2021 2020£m £m £m £m £m £m £m £m
Statement of financial position
Non-current assets 409 399 795 910 536 582 559 435
Cash and cash equivalents 47 54 27 33 31 26 112 66
All other current assets 24 4 24 26 8 5 12 6
Non-current liabilities (81) (45) (256) (315) (30) (29) (286) (232)
Current liabilities (22) (16) (38) (43) (19) (10) (27) (2)
Net assets 377 396 552 611 526 574 370 273
Group’s ownership interest in joint venture/associate 189 198 145 160 263 287 189 139
Group adjustment: elimination of profits on sales to joint venture — — — — — — (23) (10)
Carrying amount of the Group’s investment 189 198 145 160 263 287 166 129
BritNed Development Limited
Millennium Pipeline Company LLC
Nemo Link Limited
Emerald Energy Venture LLC
2021 2020 2021 2020 2021 2020 2021 2020£m £m £m £m £m £m £m £m
Income statement
Revenue 72 80 199 206 66 45 28 19
Depreciation and amortisation (15) (14) (43) (46) (24) (23) (14) (7)
Other costs (15) (10) (21) (20) (6) (8) (22) (10)
Operating profit/(loss) 42 56 135 140 36 14 (8) 2
Net interest expense (1) — (18) (22) — — — (3)
Profit/(loss) before tax 41 56 117 118 36 14 (8) (1)
Income tax expense (11) (10) — — (14) (2) — —
Profit/(loss) for the year 30 46 117 118 22 12 (8) (1)
Group’s share of profit/(loss) 15 23 31 31 11 6 (4) (1)
Group adjustment: tax charge — — (9) (9) — — 1 —
Group’s share of post-tax results for the year 15 23 22 22 11 6 (3) (1)
National Grid plc Annual Report and Accounts 2020/21 Financial Statements
Notes to the consolidated financial statementscontinued
164

17. Derivative financial instruments
Derivatives are financial instruments that derive their value from the price of an underlying item such as interest rates, foreign exchange rates, credit spreads, commodities, equities or other indices. In accordance with policies approved by the Board, derivatives are transacted generally to manage exposures to fluctuations in interest rates, foreign exchange rates and commodity prices. Our derivatives balances comprise two broad categories:• financing derivatives: These are used to manage our exposure to interest rates and foreign exchange rates. Specifically, we use these derivatives to
manage our financing portfolio, holdings in foreign operations and contractual operational cash flows; and• commodity contract derivatives: These are used to manage our US customers’ exposure to price and supply risks. Some forward contracts for the
purchase of commodities meet the definition of derivatives. We also enter into derivative financial instruments linked to commodity prices, including index futures, options and swaps, which are used to manage market price volatility.
Derivatives are initially recognised at fair value and subsequently remeasured to fair value at each reporting date. Changes in fair values are recorded in the period they arise, in either the consolidated income statement or other comprehensive income. Where the gains or losses recorded in the income statement arise from changes in the fair value of derivatives to the extent that hedge accounting is not applied or is not fully effective, these are recorded as remeasurements, detailed in notes 5 and 6. Where the fair value of a derivative is positive it is carried as a derivative asset, and where negative as a derivative liability.
The fair value of derivative financial instruments is calculated by taking the present value of future cash flows, primarily incorporating market observable inputs. The various inputs include foreign exchange spot and forward rates, yield curves of the respective currencies, currency basis spreads between the respective currencies, interest rate and inflation curves, the forward rate curves of underlying commodities, and for those positions that are not fully cash collateralised the credit quality of the counterparties.
Certain clauses embedded in non-derivative financial instruments or other contracts are presented as derivatives because they impact the risk profile of their host contracts and they are deemed to have risks or rewards not closely related to those host contracts.
Further information on how derivatives are valued and used for risk management purposes is presented in note 32. Information on commodity contracts and other commitments not meeting the definition of derivatives is presented in note 30.
The fair values of derivatives by category are as follows:
2021 2020
Assets£m
Liabilities£m
Total£m
Assets£m
Liabilities£m
Total£m
Current 457 (145) 312 93 (380) (287)
Non-current 542 (754) (212) 1,249 (954) 295
999 (899) 100 1,342 (1,334) 8
Financing derivatives 942 (767) 175 1,267 (1,134) 133
Commodity contract derivatives 57 (132) (75) 75 (200) (125)
999 (899) 100 1,342 (1,334) 8
(a) Financing derivativesThe fair values of financing derivatives by type are as follows:
2021 2020
Assets£m
Liabilities£m
Total£m
Assets£m
Liabilities£m
Total£m
Interest rate swaps 325 (159) 166 556 (337) 219
Cross-currency interest rate swaps 601 (351) 250 643 (514) 129
Foreign exchange forward contracts¹ 16 (74) (58) 58 (39) 19
Inflation-linked swaps — (183) (183) — (234) (234)
Equity options — — — 10 (10) —
942 (767) 175 1,267 (1,134) 133
1. Included within the foreign exchange forward contracts balance are £32 million (2020: £3 million) of derivative liabilities in relation to the hedging of capital expenditure and a deal-contingent foreign exchange forward contract liability of £9 million (2020: £nil) in relation to the disposal of NECO (see note 10).
National Grid plc Annual Report and Accounts 2020/21 Financial Statements | Notes to the consolidated financial statements
165

17. Derivative financial instruments continued(a) Financing derivatives continuedThe maturity profile of financing derivatives is as follows:
2021 2020
Assets£m
Liabilities£m
Total£m
Assets£m
Liabilities£m
Total£m
Current
Less than 1 year 428 (70) 358 62 (254) (192)
428 (70) 358 62 (254) (192)
Non-current
In 1 to 2 years 10 (14) (4) 480 (51) 429
In 2 to 3 years 24 (12) 12 13 (5) 8
In 3 to 4 years 62 (80) (18) 20 (28) (8)
In 4 to 5 years 4 (42) (38) 31 (109) (78)
More than 5 years 414 (549) (135) 661 (687) (26)
514 (697) (183) 1,205 (880) 325
942 (767) 175 1,267 (1,134) 133
The notional contract amounts of financing derivatives by type are as follows:
2021 2020£m £m
Interest rate swaps (2,259) (3,101)
Cross-currency interest rate swaps (8,389) (8,097)
Foreign exchange forward contracts (4,651) (3,284)
Inflation-linked swaps (500) (500)
Equity options — (800)
(15,799) (15,782)
Derivatives with a notional value of £2,810 million, pay or receive cash flows that reference GBP LIBOR of £2,041 million (maturing between 2023 and 2040) or USD LIBOR of £769 million (maturing between 2023 and 2026). LIBOR is being replaced as an interest rate benchmark by alternative reference rates and therefore negotiations are underway to amend these contracts, with any related hedge documentation then being amended. At 31 March 2021, none of the contracts had yet been amended.
(b) Commodity contract derivativesThe fair values of commodity contract derivatives by type are as follows:
2021 2020
Assets£m
Liabilities£m
Total£m
Assets£m
Liabilities£m
Total£m
Commodity purchase contracts accounted for as derivative contracts
Forward purchases of gas 44 (94) (50) 64 (108) (44)
Derivative financial instruments linked to commodity prices
Electricity capacity 2 — 2 — — —
Electricity swaps 10 (33) (23) 4 (83) (79)
Electricity options — (1) (1) — — —
Gas swaps 1 (3) (2) 7 (8) (1)
Gas options — (1) (1) — (1) (1)
57 (132) (75) 75 (200) (125)
National Grid plc Annual Report and Accounts 2020/21 Financial Statements
Notes to the consolidated financial statementscontinued
166

17. Derivative financial instruments continued(b) Commodity contract derivatives continuedThe maturity profile of commodity contract derivatives is as follows:
2021 2020
Assets£m
Liabilities£m
Total£m
Assets£m
Liabilities£m
Total£m
Current
Less than one year 29 (75) (46) 31 (126) (95)
29 (75) (46) 31 (126) (95)
Non-current
In 1 to 2 years 7 (24) (17) 8 (35) (27)
In 2 to 3 years 7 (16) (9) 9 (24) (15)
In 3 to 4 years 7 (7) — 8 (12) (4)
In 4 to 5 years 6 (5) 1 7 (1) 6
More than 5 years 1 (5) (4) 12 (2) 10
28 (57) (29) 44 (74) (30)
57 (132) (75) 75 (200) (125)
The notional quantities of commodity contract derivatives by type are as follows:
2021 2020
Forward purchases of gas1 36m Dth 102m Dth
Electricity swaps 12,321 GWh 12,836 GWh
Gas swaps 47m Dth 89m Dth
Gas options 40m Dth 26m Dth
1. Forward gas purchases have terms up to five years (2020: four years). The contractual obligations under these contracts are £104 million (2020: £128 million).
18. Inventories and current intangible assets
Inventories represent assets that we intend to use in order to generate revenue in the short term, either by selling the asset itself (for example, fuel stocks) or by using it to fulfil a service to a customer or to maintain our network (consumables).
Inventories are stated at the lower of weighted average cost and net realisable value. Where applicable, cost comprises direct materials and direct labour costs as well as those overheads that have been incurred in bringing the inventories to their present location and condition.
Emission allowances, principally relating to the emissions of carbon dioxide in the UK and sulphur and nitrous oxides in the US, are recorded as intangible assets within current assets. They are initially recorded at cost and subsequently at the lower of cost and net realisable value. A liability is recorded in respect of the obligation to deliver emission allowances, and emission charges are recognised in the income statement in the period in which emissions are made.
2021 2020£m £m
Fuel stocks 94 151
Raw materials and consumables 253 265
Current intangible assets – emission allowances 92 133
439 549
There is a provision for obsolescence of £10 million against inventories as at 31 March 2021 (2020: £21 million).
National Grid plc Annual Report and Accounts 2020/21 Financial Statements | Notes to the consolidated financial statements
167

19. Trade and other receivables
Trade and other receivables include amounts which are due from our customers for services we have provided, accrued income which has not yet been billed, prepayments, contract assets where certain milestones are required to be fulfilled and other receivables that are expected to be settled within twelve months.
Trade and other receivables are initially recognised at fair value and subsequently measured at amortised cost, less any appropriate allowances for estimated irrecoverable amounts.
2021 2020£m £m
Trade receivables 1,503 1,571
Accrued income 863 849
Prepayments 387 408
Contract assets 13 —
Other receivables 153 158
2,919 2,986
Trade receivables are non-interest-bearing and generally have a 30 to 90 days term. Due to their short maturities, the fair value of trade and other receivables approximates their carrying value. The maximum exposure of trade receivables to credit risk is the gross carrying amount of £2,152 million (2020: £2,063 million).
Provision for impairment of receivablesA provision for credit losses is recognised at an amount equal to the expected credit losses that will arise over the lifetime of the trade receivables and accrued income.
2021 2020£m £m
At 1 April 512 394
Exchange adjustments (57) 20
Charge for the year, net of recoveries 326 234
Uncollectible amounts written off (59) (136)
Reclassification to held for sale (note 10) (50) —
At 31 March 672 512
The trade receivables balance, accrued income balance and provisions balance split by geography are as follows:
As at 31 March 2021 As at 31 March 2020
UK US Total UK US Total£m £m £m £m £m £m
Trade receivables 227 1,925 2,152 227 1,836 2,063
Accrued income 547 339 886 461 408 869
Provision for impairment of receivables and accrued income (23) (649) (672) (40) (472) (512)
There are no retail customers in the UK businesses. A provision matrix is not used in the UK as an assessment of expected losses on individual debtors is performed, and the provision is not material.
In the US, £1,852 million (2020: £1,852 million) of the trade receivables and accrued income balance is attributable to retail customers. For non-retail US customer receivables, a provision matrix is not used and expected losses are determined on individual debtors.
The provision for retail customer receivables in the US is calculated based on a series of provision matrices which are prepared by regulated entity and by customer type. The expected loss rates in each provision matrix are based on historical loss rates adjusted for current and forecasted economic conditions at the balance sheet date. The inclusion of forward-looking information in the provision matrix setting process under IFRS 9 resulted in loss rates that reflect expected future economic conditions and the recognition of an expected loss on all debtors even where no loss event has occurred.
In March 2020, the Group’s US distribution businesses ceased certain customer cash collection activities in response to regulatory instructions and to changes in State, Federal and City level regulations and guidance, and actions to minimise risk to the Group’s employees as a result of COVID-19. The Group also ceased customer termination activities as requested by relevant local authorities. Certain collection activities did resume during the year where permitted, but this was a small proportion compared to normal levels.
In calculating our provision for impairment of receivables at 31 March 2021, we were able to incorporate the actual cash collection levels experienced since the start of the pandemic to determine the expected loss rates per category of outstanding receivable by operating company, which is summarised in the provision matrix shown below. For the year ended 31 March 2020, there was limited cash collection data available with regards to the impact that COVID-19 would have on collection of receivables. Therefore, in order to reflect the impact of COVID-19 into our calculation of the charge for the year, we considered the macroeconomic data including unemployment levels and our previous experience regarding debtor recoverability during and in the aftermath of the 2008/09 financial crisis (which impacted all of our service territories) and that following Superstorm Sandy in 2012 which impacted our downstate New York gas business specifically.
National Grid plc Annual Report and Accounts 2020/21 Financial Statements
Notes to the consolidated financial statementscontinued
168

19. Trade and other receivables continuedBased on our review of these factors, we concluded that a reasonable range for the provisions recognised in the current year would be £320 million to £342 million ($440 million to $470 million), which considered the continued application of our previous experience regarding debtor recoverability in the aftermath of historical impactful events, as well as the collections experience seen since the start of the pandemic, and concluded that a total charge of £326 million represented our best estimate based on the information available. For the year ended 31 March 2020, we determined that the additional provision recognised in light of the cessation of customer terminations and collections following the moratoriums introduced would lie between £81 million and £161 million ($100 million and $200 million), and concluded an additional COVID-19 related charge of £117 million represented our best estimate based on the information available, primarily as this represented an impact twice as severe as Superstorm Sandy, adjusted to incorporate all service territories impacted.
The average expected loss rates and gross balances for the retail customer receivables in our US operations are set out below:
2021 2021 2020 2020% £m % £m
Accrued income 7 322 5 395
0 – 30 days past due 7 580 5 651
30 – 60 days past due 24 155 14 194
60 – 90 days past due 36 108 29 109
3 – 6 months past due 52 140 47 121
6 – 12 months past due 66 180 63 105
Over 12 months past due 71 367 79 277
1,852 1,852
US retail customer receivables are not collateralised. Trade receivables are written off when regulatory requirements are met. Write-off policies vary between jurisdictions as they are aligned with the local regulatory requirements, which differ between regulators. There were no significant amounts written off during the period that were still subject to enforcement action. Our internal definition of default is aligned with that of the individual regulators in each jurisdiction.
For further information on our wholesale and retail credit risk, refer to note 32(a).
20. Cash and cash equivalents
Cash and cash equivalents include cash balances, together with short-term investments with an original maturity of less than three months that are readily convertible to cash. Bank overdrafts are only shown net within cash and cash equivalents when there is a legal right to offset unconditionally and an intention to settle net has been demonstrated by the physical movement of cash.
Net cash and cash equivalents reflected in the cash flow statement are net of bank overdrafts, which are reported in borrowings. The carrying amounts of cash and cash equivalents and bank overdrafts approximate their fair values.
Cash at bank earns interest at floating rates based on daily bank deposit rates. Short-term deposits are made for periods varying between one day and three months, depending on the immediate cash requirements, and earn interest at the respective short-term deposit rates.
Cash and cash equivalents held in currencies other than sterling have been converted into sterling at year-end exchange rates. For further information on currency exposures, refer to note 32(c).
2021 2020£m £m
Cash at bank 117 73
Short-term deposits 40 —
Cash and cash equivalents 157 73
National Grid plc Annual Report and Accounts 2020/21 Financial Statements | Notes to the consolidated financial statements
169

21. Borrowings
We borrow money primarily in the form of bonds and bank loans. These are for a fixed term and may have fixed or floating interest rates or are linked to RPI. We use derivatives to manage risks associated with interest rates, inflation rates and foreign exchange. Lease liabilities are also included within borrowings.
Our price controls and rate plans require us to fund our networks within a certain ratio of debt to equity or regulatory value and, as a result, we have issued a significant amount of debt. As we continue to invest in our networks, the value of debt is expected to increase over time. To maintain a strong balance sheet and to allow us to access capital markets at commercially acceptable interest rates, we balance the amount of debt we issue with the value of our assets, and we take account of certain other metrics used by credit rating agencies.
All borrowings are measured at amortised cost, with the exception of one current liability which is measured at fair value through profit and loss in order to eliminate a measurement mismatch.
Borrowings, which include interest-bearing, zero-coupon and inflation-linked debt, overdrafts and collateral payable, are initially recorded at fair value. This normally reflects the proceeds received (net of direct issue costs for liabilities measured at amortised cost). Subsequently, borrowings are stated either: i) at amortised cost; or ii) at fair value though profit and loss. Where a borrowing is held at amortised cost, any difference between the proceeds after direct issue costs and the redemption value is recognised over the term of the borrowing in the income statement using the effective interest method. For the liability held at fair value through profit and loss, interest is calculated using the effective interest method.
Where a borrowing or liability is held at fair value, changes in the fair value of the borrowing due to changes in the issuer’s credit risk are recorded in the own credit reserve within equity (see note 28). All other changes in the fair value of the liability are recognised in the income statement within remeasurements (see notes 5 and 6).
2021 2020£m £m
Current
Bank loans 1,022 1,244
Bonds¹ 1,987 1,446
Commercial paper 628 1,269
Lease liabilities 99 112
Other loans 1 1
3,737 4,072
Non-current
Bank loans 2,532 2,819
Bonds 24,209 23,094
Lease liabilities 586 623
Other loans 156 186
27,483 26,722
Total borrowings 31,220 30,794
1. Includes a liability held at fair value through profit and loss of £682 million (2020: £741 million).
National Grid plc Annual Report and Accounts 2020/21 Financial Statements
Notes to the consolidated financial statementscontinued
170

21. Borrowings continuedTotal borrowings are repayable as follows:
2021 2020£m £m
Less than 1 year 3,737 4,072
In 1 to 2 years 1,745 2,212
In 2 to 3 years 889 1,664
In 3 to 4 years 2,206 757
In 4 to 5 years 1,833 2,122
More than 5 years:
By instalments 927 870
Other than by instalments 19,883 19,097
31,220 30,794
The fair value of borrowings at 31 March 2021 was £34,676 million (2020: £34,174 million). Where market values were available, the fair value of borrowings (Level 1) was £20,333 million (2020: £14,059 million). Where market values were not available, fair value of borrowings (Level 2) was £14,343 million (2020: £20,115 million), and calculated by discounting cash flows at prevailing interest rates. The notional amount outstanding of the debt portfolio at 31 March 2021 was £31,010 million (2020: £30,422 million). There have been no new issuances since the year end.
In 2020, the assets of the Colonial Gas Company were merged with the Boston Gas Company, and have been ringfenced post-merger. Certain gas distribution assets of NECO are subject to liens and other charges and are provided as collateral over borrowings totalling £67 million at 31 March 2021 (2020: £84 million), all of which have been classified as held for sale as at 31 March 2021 (see note 10).
Collateral is placed with or received from any derivative counterparty where we have entered into a credit support annex to the ISDA Master Agreement once the current mark-to-market valuation of the trades between the parties exceeds an agreed threshold. Included in current bank loans is £582 million (2020: £785 million) in respect of cash received under collateral agreements. For further details of our borrowing facilities, refer to note 33. For further details of our bonds in issue, please refer to the debt investor section of our website. Unless included herein, the information on our website is unaudited.
Certain borrowings, primarily some of our USD denominated bank loans and company car lease contracts, have payments that are linked to LIBOR. LIBOR is being replaced as an interest rate benchmark by alternative reference rates and therefore negotiations are underway to amend these contracts. At 31 March 2021, none of the contracts had yet been amended. £328 million of bank loans affected by GBP LIBOR, £59 million of bank loans affected by USD LIBOR and £173 million of lease liabilities affected by USD LIBOR will be impacted.
Financial liability at fair value through profit and lossThe financial liability designated at fair value through profit and loss is analysed as follows:i. the fair value of the liability was £682 million (2020: £741 million), which includes cumulative changes in fair value attributable to changes in credit risk
recognised in other comprehensive income, post tax of £1 million (2020: £10 million);ii. the amount repayable at maturity in November 2021 is £684 million (2020: £759 million); andiii. the difference between carrying amount and contractual amount at maturity is £2 million (2020: £18 million).
This liability has been reclassified in order to eliminate a measurement mismatch with derivatives which provide an economic hedge. The associated derivatives are collateralised and do not contain significant exposure to our own credit risk. The presentation of credit risk in other comprehensive income does not, therefore, create or enlarge an accounting mismatch in profit or loss.
The change in the fair value attributable to a change in credit risk is calculated as the difference between the total change in the fair value of the liability and the change in the value of the liability due to changes in market risk factors alone. The change in the fair value due to market risk factors was calculated using benchmark yield curves as at the end of the reporting period holding the credit risk margin constant. The fair value of the liability was calculated using observed market prices.
National Grid plc Annual Report and Accounts 2020/21 Financial Statements | Notes to the consolidated financial statements
171

21. Borrowings continuedLease liabilitiesThe Group adopted IFRS 16 on 1 April 2019, which resulted in the recognition of £474 million of additional lease liabilities. Refer to note 37 for details.
Lease liabilities are initially measured at the present value of the lease payments expected over the lease term. The discount rate applied is the rate implicit in the lease or if that is not available, then the incremental rate of borrowing for a similar term and similar security. The lease term takes account of exercising any extension options that are at our option if we are reasonably certain to exercise the option and any lease termination options unless we are reasonably certain not to exercise the option. Each lease payment is allocated between the liability and finance cost. The finance cost is charged to the income statement over the lease period using the effective interest rate method.
2021 2020£m £m
Gross lease liabilities are repayable as follows:
Less than 1 year 114 132
1 to 5 years 321 361
More than 5 years 464 481
899 974
Less: finance charges allocated to future periods (214) (239)
685 735
The present value of lease liabilities are as follows:
Less than 1 year 99 112
1 to 5 years 267 297
More than 5 years 319 326
685 735
22. Trade and other payables
Trade and other payables include amounts owed to suppliers, tax authorities and other parties which are due to be settled within 12 months. The total also includes deferred amounts, some of which represent monies received from customers but for which we have not yet delivered the associated service. These amounts are recognised as revenue when the service is provided.
Trade and other payables are initially recognised at fair value and subsequently measured at amortised cost, with the exception of contingent consideration, which is subsequently measured at fair value.
2021 2020£m £m
Trade payables 2,165 2,205
Deferred payables 154 137
Customer contributions¹ 138 84
Social security and other taxes 140 202
Contingent consideration (note 38) 39 30
Other payables 881 944
3,517 3,602
1. Relates to amounts received from government-related entities for connecting to our networks, where we have obligations remaining under the contract.
Due to their short maturities, the fair value of trade payables approximates their carrying value.
National Grid plc Annual Report and Accounts 2020/21 Financial Statements
Notes to the consolidated financial statementscontinued
172

23. Contract liabilities
Contract liabilities primarily relate to the advance consideration received from customers for construction contracts, mainly in relation to connections, for which revenue is recognised over the life of the asset.
2021 2020£m £m
Current 66 76
Non-current 1,094 1,082
1,160 1,158
Significant changes in the contract liabilities balances during the period are as follows:
2021 2020£m £m
As at 1 April 1,158 994
Exchange adjustments (65) 39
Revenue recognised that was included in the contract liability balance at the beginning of the period (96) (60)
Increases due to cash received, excluding amounts recognised as revenue during the period 262 185
Reclassification to held for sale (note 10) (99) —
At 31 March 1,160 1,158
24. Other non-current liabilities
Other non-current liabilities include deferred income and customer contributions which will not be recognised as income until after 31 March 2022. It also includes contingent consideration and other payables that are not due until after that date.
Other non-current liabilities are initially recognised at fair value and subsequently measured at amortised cost, with the exception of contingent consideration, which is subsequently measured at fair value.
2021 2020£m £m
Deferred income¹ 78 101
Customer contributions² 400 428
Contingent consideration (note 38) 18 44
Other payables 347 318
843 891
1. Principally the deferral of profits relating to the sale of property, which we expect to recognise in future years.2. Relates to amounts received from government-related entities for connecting to our networks, where we have obligations remaining under the contract.
There is no material difference between the fair value and the carrying value of other payables.
National Grid plc Annual Report and Accounts 2020/21 Financial Statements | Notes to the consolidated financial statements
173

25. Pensions and other post-retirement benefits
All of our employees are eligible to participate in a pension plan. We have defined contribution (DC) and defined benefit (DB) pension plans in the UK and the US. In the US we also provide healthcare and life insurance benefits to eligible employees, post-retirement. The fair value of associated plan assets and present value of DB obligations are updated annually in accordance with IAS 19 (revised). We separately present our UK and US pension plans to show geographical split. Below we provide a more detailed analysis of the amounts recorded in the primary financial statements and the actuarial assumptions used to value the DB obligations.
National Grid’s UK pension arrangements are held in separate Trustee administered funds. The arrangements are managed by Trustee companies with boards consisting of company- and member-appointed directors. In the US, the assets of the plans are held in trusts and administered by the Retirement Plans Committee comprised of appointed employees of the Company.
Defined contribution plansThese plans are designed to provide members with a pension pot for their retirement. The risks associated with these plans are assumed by the member.
Payments to these DC plans are charged as an expense as they fall due. There is no legal or constructive obligation on National Grid to pay additional contributions into a DC plan if the fund has insufficient assets to pay all employees’ benefits relating to employee service in the current and prior periods.
In March 2021, National Grid announced its intention to move to a new DC plan from 1 April 2021.
The National Grid YouPlan (YouPlan)Up until 31 March 2021, YouPlan was the qualifying UK pension plan that was used for automatic enrolment of new hires. National Grid paid contributions into YouPlan to provide DC benefits on behalf of employees, providing a double match of member contributions, up to a maximum Company contribution of 12% of salary as well as the cost of administration and insured benefits.
National Grid UK Retirement Plan (NGUKRP)The NGUKRP is part of a Master Trust Arrangement managed by Legal & General and is National Grid’s qualifying UK pension plan from 1 April 2021 and is used for the automatic enrolment of new hires. From April 2021, National Grid pays contributions into the NGUKRP to provide DC benefits on behalf of its employees, providing a double match of member contributions up to a maximum Company contribution of 12% of salary.
Defined benefit plansOn retirement, members of DB plans receive benefits whose value is dependent on factors such as salary and length of pensionable service. National Grid’s obligation in respect of DB pension plans is calculated separately for each DB plan by projecting the estimated amount of future benefit payments that employees have earned for their pensionable service in the current and prior periods. These future benefit payments are discounted to determine the present value of the liabilities. Current service cost and any unrecognised past service cost are recognised immediately. The discount rate is set with reference to the yield curve on high-quality corporate bonds at the valuation date.
Advice is taken from independent actuaries relating to the appropriateness of the key assumptions applied, including life expectancy, expected salary and pension increases, and inflation. Comparatively small changes in the assumptions used may have a significant effect on the amounts recognised in the consolidated income statement, the consolidated statement of other comprehensive income and the net asset or liability recognised in the consolidated statement of financial position.
Remeasurements of pension assets and post-retirement benefit obligations are recognised in full in the period in which they occur in the consolidated statement of other comprehensive income.
The COVID-19 pandemicThe COVID-19 pandemic has had a global impact on economies, including on equity and bond markets. This directly affects the value of assets held in our pension schemes, as well as the value of National Grid’s DB obligations. Our UK DB plans operate low-risk investment strategies with limited exposure to equities and other return-seeking assets, reducing the impact of investment volatility. Additionally, the large allocation to bonds leads to significant hedging against changes in the value of DB obligations that result from falling bond yields. Our US plans also hedge much of this market risk, however they do have larger asset allocations in return-seeking assets such as equities. Following the start of the pandemic, US equity markets have performed strongly and therefore our US DB plans have remained in a relatively strong funding position. The markets for unquoted investments are illiquid and therefore given the market volatility at 31 March 2020, there was a risk that the valuations provided by fund managers as at 31 March 2020 were based on valuation models that had unobservable inputs, making them subject to additional estimation uncertainty. Such uncertainty has reduced as at 31 March 2021.
UK pensions plansThe principal UK DB pensions plans are the National Grid UK Pension Scheme (NGUKPS) and the National Grid Electricity Group of the Electricity Supply Pension Scheme (NGEG of ESPS). In the US, we have four principal plans and various healthcare and life insurance plans.
National Grid UK Pension Scheme (NGUKPS)NGUKPS consists of two legally and actuarially separate sections: Section A and Section B. This follows the transfer of Section C, a section supported by an unrelated third party, out of NGUKPS in September 2020. The plan closed to new hires on 1 April 2002.
National Grid plc Annual Report and Accounts 2020/21 Financial Statements
Notes to the consolidated financial statementscontinued
174

25. Pensions and other post-retirement benefits continued
Scheme fundingThe arrangements are subject to independent actuarial funding valuations at least every three years, and following consultation and agreement with us, the qualified actuary certifies the employers’ contributions, which, together with the specified contributions payable by the employees and proceeds from the plans’ assets, are expected to be sufficient to fund the benefits payable.
The results of the most recent actuarial valuations are shown below. See page 176 for the assumptions used for IAS 19 (revised) purposes.
Section A of NGUKPS Section B of NGUKPS NGEG of ESPS
Latest full actuarial valuation 31 March 2019 31 March 2019 31 March 2019
Actuary Willis Towers Watson Willis Towers Watson Aon Hewitt
Market value of plan assets at latest valuation £6,551 million £5,765 million £3,144 million
Actuarial value of benefits due to members £6,502 million £5,831 million £3,381 million
Market value as percentage of benefits 101% 99% 93%
Funding surplus/(deficit) £49 million (£66 million) (£237 million)
Section AFollowing the latest actuarial valuation at 31 March 2019, Section A remains in surplus, and so no deficit funding contributions are required. National Grid and the Trustees have agreed a schedule of contributions whereby the employers will continue to contribute 51.8% of pensionable salary, less member contributions, in respect of future benefit accrual.
Section BThe latest full actuarial valuation at 31 March 2019 determined that Section B was in deficit. To recover the deficit, National Grid paid recovery plan payments of approximately £34 million per annum over two years to September 2020. In addition, the employers contribute 51.4% of pensionable salary, less member contributions, in respect of future benefit accrual.
Investment de-risking transactionsIn December 2020, the Trustees of the NGUKPS exchanged £0.8 billion of gilts from Section A for a buy-in transaction with Rothesay Life. This follows two similar arrangements entered into in the previous year. In Section A, £2.8 billion of gilts were exchanged for a buy-in policy with Rothesay Life, and in Section B, £1.6 billion of gilts were exchanged for a buy-in policy with Legal & General.
These policies provide bulk annuities in respect of some pensioner and dependant members of NGUKPS and were funded by existing assets. All policies are held by the Trustee. For each transaction, the pricing of the policies was highly competitive; however, under IAS 19 the methodology for calculating the value of the buy-ins (as an asset held by the pension plan) differs from the price paid. This resulted in the recognition of actuarial losses on purchase of £0.1 billion (2020: £0.7 billion), recorded within the consolidated statement of other comprehensive income.
National Grid Electricity Group of the Electricity Supply Pension SchemeThe last full actuarial valuation for the NGEG of the ESPS determined that the plan was in deficit. To recover the deficit, National Grid agreed to a payment plan of £54 million per annum over three years to 2022, and a final payment of £26 million in 2023, all adjusted for changes in the Retail Price Index (RPI). In addition, National Grid contributes 44% of pensionable salary, less member contributions, in respect of the ongoing service cost. The plan closed to new hires from 1 April 2006.
The plan holds a longevity insurance contract which covers improvements in longevity, providing long-term protection to the scheme, should some pensioner and dependant members live longer than currently expected.
Administration costsNational Grid pays additional contributions to Section B of NGUKPS and NGEG of ESPS in respect of the costs of plan administration and the Pension Protection Fund (PPF) levies. Section A of NGUKPS will fund these costs from the Section’s assets. Up to 31 March 2020, National Grid was responsible for the costs of plan administration and the Pension Protection Fund (PPF) levies for both Sections A and B of NGUKPS and NGEG of ESPS.
Security arrangementsNational Grid has also established security arrangements with charges in favour of the Trustees.
Section A of NGUKPS Section B of NGUKPS NGEG of ESPS
Value of security arrangements at 31 March 2021 £186 million £nil £100 million
Principal supporting employers National Grid plc and National Grid UK Limited
National Grid Gas plc (NGG) National Grid Electricity Transmission plc (NGET)
Additional amounts payable1 at 31 March 2021 n/a A maximum of £175 million A maximum of £500 million
1. These amounts are payable if certain trigger events occur which have been individually agreed between the plans and their relevant supporting employers.
All of the security is currently provided in the form of surety bonds, but may also be provided as letters of credit or cash. The assets held as security will be paid to the respective section or plan in the event that the relevant supporting employer is subject to an insolvency event or fails to make the required contributions; and applicable to NGEG of ESPS only, if NGET loses its licence to operate under relevant legislation. Counter indemnities have also been taken out to ensure the obligations will be fulfilled.
In addition, a guarantee of £1 billion has been provided to Section A of NGUKPS, with the payment contingent on insolvency or on failure to pay pension obligations to Section A and can be claimed against National Grid plc, National Grid Holdings One plc or Lattice Group Limited (up to £1 billion in total).
National Grid plc Annual Report and Accounts 2020/21 Financial Statements | Notes to the consolidated financial statements
175

25. Pensions and other post-retirement benefits continuedUS pension plansNational Grid has multiple DC pension plans which allow employee as well as Company contributions. Non-union employees hired after 1 January 2011, as well as new hire represented union employees, receive a core contribution into the DC plan, irrespective of the employee’s contribution into the plan.
National Grid sponsors four non-contributory qualified DB pension plans, which provide vested union employees, and vested non-union employees hired before 1 January 2011 with retirement benefits within prescribed limits as defined by the US Internal Revenue Service. National Grid also provides non-qualified DB pension arrangements for a section of current and former employees, which are closed to new entrants. Benefits under the DB plans generally reflect age, years of service and compensation and are paid in the form of an annuity or lump sum. An independent actuary performs valuations annually. The Company funds the DB plans by contributing no less than the minimum amount required, but no more than the maximum tax-deductible amount allowed under US Internal Revenue Service regulations. The range of contributions determined under these regulations can vary significantly depending upon the funded status of the plans. At present, there is some flexibility in the amount that is contributed on an annual basis. In general, the Company’s policy for funding the US pension plans is to contribute the amounts collected in rates and capitalised in the rate base during the year, to the extent that the funding is no less than the minimum amount required. For the current financial year, these contributions amounted to approximately £110 million (2020: £153 million).
US retiree healthcare and life insurance plansNational Grid provides healthcare and life insurance benefits to eligible employees, post-retirement. Eligibility is based on certain age and length of service requirements, and in most cases, retirees contribute to the cost of their healthcare coverage. In the US, there is no governmental requirement to pre-fund post-retirement healthcare and life insurance plans. However, in general, the Company’s policy for funding the US retiree healthcare and life insurance plans is to contribute amounts collected in rates and capitalised in the rate base during the year. For the current financial year, these contributions amounted to £26 million (2020: £18 million).
For the last few years, it has been the Company’s policy to primarily direct contributions to the DB pension plans due to concerns over tax deductible limitations relating to the retiree and healthcare and life insurance plans.
Actuarial assumptionsThe Company has applied the following financial assumptions in assessing DB liabilities:
UK pensions
2021 2020 2019% % %
Discount rate – past service 2.00 2.35 2.40
Discount rate – future service 2.15 2.35 2.45
Salary increases 3.40 2.90 3.50
Rate of increase in RPI – past service 3.15 2.65 3.25
Rate of increase in RPI – future service 3.00 2.45 3.20
At 31 March 2021 and 31 March 2020, single equivalent financial assumptions are shown above for presentational purposes, although full yield curves have been used in our calculations. In 2019, single equivalent financial assumptions were set which reflected the average duration for the aggregate past and future service obligations.
The discount rate is determined by reference to high-quality UK corporate bonds at the reporting date. The rate of increase in salaries has been set using a promotional scale where appropriate. The rates of increases stated are not indicative of historical increases awarded or a guarantee of future increase, but merely an appropriate assumption used in assessing DB liabilities. RPI is the key assumption that determines assumed increases in pensions in payment and deferment in the UK only.
US pensions US other post-retirement benefits
2021 2020 2019 2021 2020 2019% % % % % %
Discount rate 3.25 3.30 3.95 3.25 3.30 3.95
Salary increases 4.30 3.50 3.50 4.30 3.50 3.50
Initial healthcare cost trend rate n/a n/a n/a 7.10 7.00 7.25
Ultimate healthcare cost trend rate n/a n/a n/a 4.50 4.50 4.50
Discount rates for US pension liabilities have been determined by reference to appropriate yields on high-quality US corporate bonds at the reporting date based on the duration of plan liabilities. The healthcare cost trend rate is expected to reach the ultimate trend rate by 2030 (2020: 2030). The table below sets out the projected life expectancies adopted for the UK and US pension arrangements:
2021 2020 2019
UKyears
USyears
UKyears
USyears
UKyears
USyears
Assumed life expectations for a retiree age 65
Males 21.8 21.6 22.1 20.9 22.0 22.1
Females 23.7 24.0 23.8 23.4 23.6 24.2
In 20 years:
Males 23.1 23.2 23.3 22.5 23.3 23.7
Females 25.2 25.5 25.3 25.1 25.2 25.9
National Grid plc Annual Report and Accounts 2020/21 Financial Statements
Notes to the consolidated financial statementscontinued
176
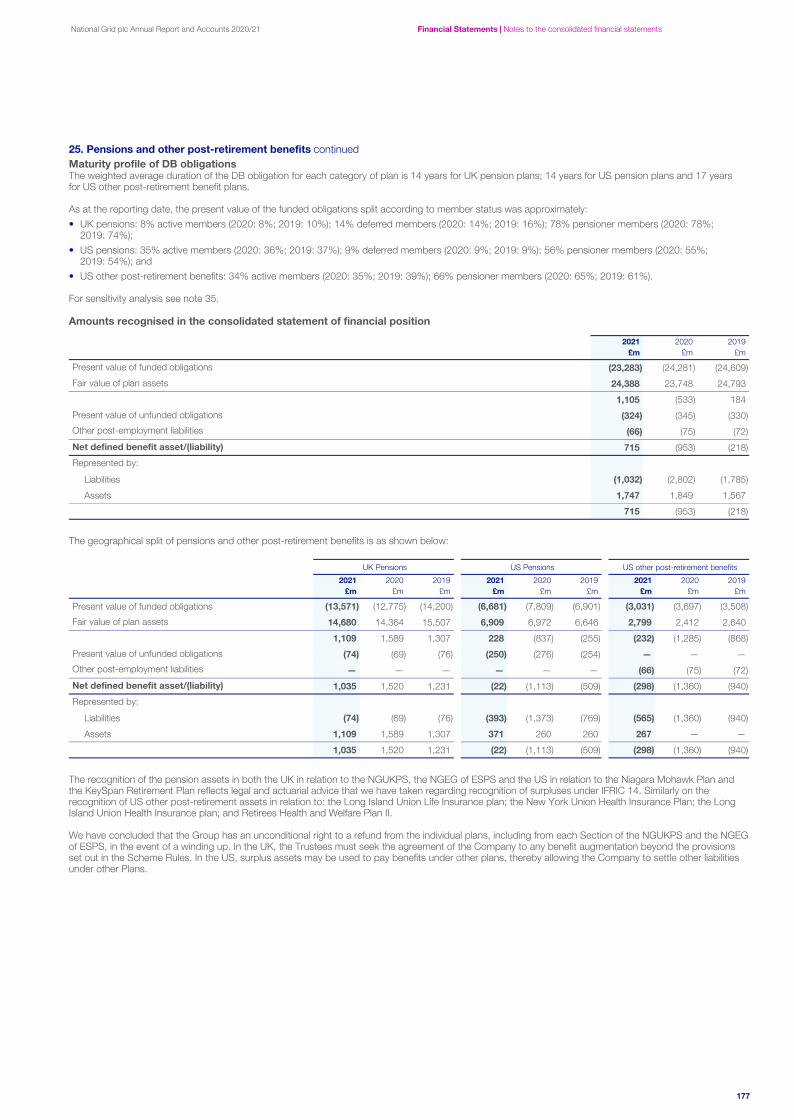
25. Pensions and other post-retirement benefits continuedMaturity profile of DB obligationsThe weighted average duration of the DB obligation for each category of plan is 14 years for UK pension plans; 14 years for US pension plans and 17 years for US other post-retirement benefit plans.
As at the reporting date, the present value of the funded obligations split according to member status was approximately:• UK pensions: 8% active members (2020: 8%; 2019: 10%); 14% deferred members (2020: 14%; 2019: 16%); 78% pensioner members (2020: 78%;
2019: 74%);• US pensions: 35% active members (2020: 36%; 2019: 37%); 9% deferred members (2020: 9%; 2019: 9%); 56% pensioner members (2020: 55%;
2019: 54%); and• US other post-retirement benefits: 34% active members (2020: 35%; 2019: 39%); 66% pensioner members (2020: 65%; 2019: 61%).
For sensitivity analysis see note 35.
Amounts recognised in the consolidated statement of financial position
2021 2020 2019£m £m £m
Present value of funded obligations (23,283) (24,281) (24,609)
Fair value of plan assets 24,388 23,748 24,793
1,105 (533) 184
Present value of unfunded obligations (324) (345) (330)
Other post-employment liabilities (66) (75) (72)
Net defined benefit asset/(liability) 715 (953) (218)
Represented by:
Liabilities (1,032) (2,802) (1,785)
Assets 1,747 1,849 1,567
715 (953) (218)
The geographical split of pensions and other post-retirement benefits is as shown below:
UK Pensions US Pensions US other post-retirement benefits
2021 2020 2019 2021 2020 2019 2021 2020 2019£m £m £m £m £m £m £m £m £m
Present value of funded obligations (13,571) (12,775) (14,200) (6,681) (7,809) (6,901) (3,031) (3,697) (3,508)
Fair value of plan assets 14,680 14,364 15,507 6,909 6,972 6,646 2,799 2,412 2,640
1,109 1,589 1,307 228 (837) (255) (232) (1,285) (868)
Present value of unfunded obligations (74) (69) (76) (250) (276) (254) — — —
Other post-employment liabilities — — — — — — (66) (75) (72)
Net defined benefit asset/(liability) 1,035 1,520 1,231 (22) (1,113) (509) (298) (1,360) (940)
Represented by:
Liabilities (74) (69) (76) (393) (1,373) (769) (565) (1,360) (940)
Assets 1,109 1,589 1,307 371 260 260 267 — —
1,035 1,520 1,231 (22) (1,113) (509) (298) (1,360) (940)
The recognition of the pension assets in both the UK in relation to the NGUKPS, the NGEG of ESPS and the US in relation to the Niagara Mohawk Plan and the KeySpan Retirement Plan reflects legal and actuarial advice that we have taken regarding recognition of surpluses under IFRIC 14. Similarly on the recognition of US other post-retirement assets in relation to: the Long Island Union Life Insurance plan; the New York Union Health Insurance Plan; the Long Island Union Health Insurance plan; and Retirees Health and Welfare Plan II.
We have concluded that the Group has an unconditional right to a refund from the individual plans, including from each Section of the NGUKPS and the NGEG of ESPS, in the event of a winding up. In the UK, the Trustees must seek the agreement of the Company to any benefit augmentation beyond the provisions set out in the Scheme Rules. In the US, surplus assets may be used to pay benefits under other plans, thereby allowing the Company to settle other liabilities under other Plans.
National Grid plc Annual Report and Accounts 2020/21 Financial Statements | Notes to the consolidated financial statements
177
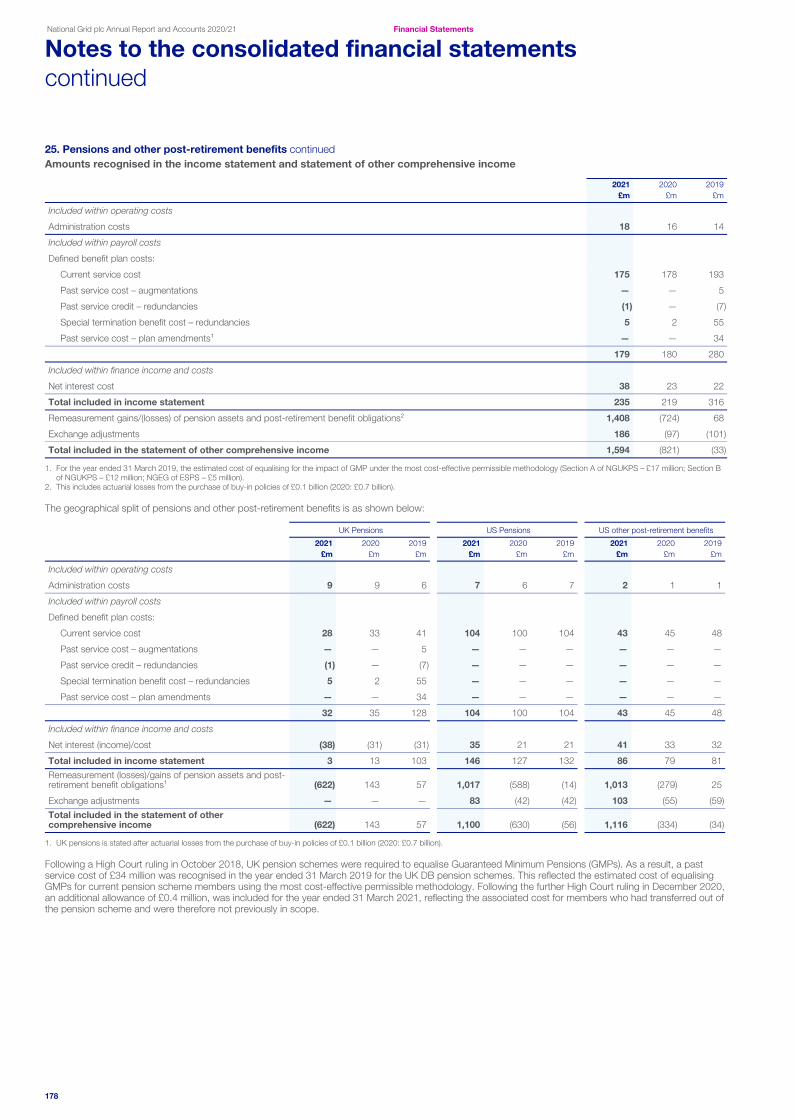
25. Pensions and other post-retirement benefits continuedAmounts recognised in the income statement and statement of other comprehensive income
2021 2020 2019£m £m £m
Included within operating costs
Administration costs 18 16 14
Included within payroll costs
Defined benefit plan costs:
Current service cost 175 178 193
Past service cost – augmentations — — 5
Past service credit – redundancies (1) — (7)
Special termination benefit cost – redundancies 5 2 55
Past service cost – plan amendments¹ — — 34
179 180 280
Included within finance income and costs
Net interest cost 38 23 22
Total included in income statement 235 219 316
Remeasurement gains/(losses) of pension assets and post-retirement benefit obligations² 1,408 (724) 68
Exchange adjustments 186 (97) (101)
Total included in the statement of other comprehensive income 1,594 (821) (33)
1. For the year ended 31 March 2019, the estimated cost of equalising for the impact of GMP under the most cost-effective permissible methodology (Section A of NGUKPS – £17 million; Section B of NGUKPS – £12 million; NGEG of ESPS – £5 million).
2. This includes actuarial losses from the purchase of buy-in policies of £0.1 billion (2020: £0.7 billion).
The geographical split of pensions and other post-retirement benefits is as shown below:
UK Pensions US Pensions US other post-retirement benefits
2021 2020 2019 2021 2020 2019 2021 2020 2019£m £m £m £m £m £m £m £m £m
Included within operating costs
Administration costs 9 9 6 7 6 7 2 1 1
Included within payroll costs
Defined benefit plan costs:
Current service cost 28 33 41 104 100 104 43 45 48
Past service cost – augmentations — — 5 — — — — — —
Past service credit – redundancies (1) — (7) — — — — — —
Special termination benefit cost – redundancies 5 2 55 — — — — — —
Past service cost – plan amendments — — 34 — — — — — —
32 35 128 104 100 104 43 45 48
Included within finance income and costs
Net interest (income)/cost (38) (31) (31) 35 21 21 41 33 32
Total included in income statement 3 13 103 146 127 132 86 79 81
Remeasurement (losses)/gains of pension assets and post-retirement benefit obligations¹ (622) 143 57 1,017 (588) (14) 1,013 (279) 25
Exchange adjustments — — — 83 (42) (42) 103 (55) (59)
Total included in the statement of other comprehensive income (622) 143 57 1,100 (630) (56) 1,116 (334) (34)
1. UK pensions is stated after actuarial losses from the purchase of buy-in policies of £0.1 billion (2020: £0.7 billion).
Following a High Court ruling in October 2018, UK pension schemes were required to equalise Guaranteed Minimum Pensions (GMPs). As a result, a past service cost of £34 million was recognised in the year ended 31 March 2019 for the UK DB pension schemes. This reflected the estimated cost of equalising GMPs for current pension scheme members using the most cost-effective permissible methodology. Following the further High Court ruling in December 2020, an additional allowance of £0.4 million, was included for the year ended 31 March 2021, reflecting the associated cost for members who had transferred out of the pension scheme and were therefore not previously in scope.
National Grid plc Annual Report and Accounts 2020/21 Financial Statements
Notes to the consolidated financial statementscontinued
178

25. Pensions and other post-retirement benefits continuedReconciliation of the net defined benefit liability
2021 2020 2019£m £m £m
Opening net defined benefit liability (953) (218) (263)
Cost recognised in the income statement (235) (219) (316)
Remeasurement and foreign exchange effects recognised in the statement of other comprehensive income 1,594 (821) (33)
Employer contributions 274 327 419
Other movements (14) (22) (25)
Reclassification to held for sale (note 10) 49 — —
Closing net defined benefit asset/(liability) 715 (953) (218)
The geographical split of pensions and other post-retirement benefits is as shown below:
UK pensions US pensions US other post-retirement benefits
2021 2020 2019 2021 2020 2019 2021 2020 2019£m £m £m £m £m £m £m £m £m
Opening net defined benefit asset/(liability) 1,520 1,231 1,104 (1,113) (509) (552) (1,360) (940) (815)
Cost recognised in the income statement (3) (13) (103) (146) (127) (132) (86) (79) (81) Remeasurement and foreign exchange effects recognised in the statement of other comprehensive income (622) 143 57 1,100 (630) (56) 1,116 (334) (34)
Employer contributions 138 156 174 110 153 231 26 18 14
Other movements 2 3 (1) — — — (16) (25) (24)
Reclassification to held for sale (note 10) — — — 27 — — 22 — — Closing net defined benefit asset/(liability) 1,035 1,520 1,231 (22) (1,113) (509) (298) (1,360) (940)
Changes in the present value of defined benefit obligations (including unfunded obligations)2021 2020 2019
£m £m £m
Opening defined benefit obligations (24,626) (24,939) (24,054)
Current service cost (175) (178) (193)
Interest cost (651) (751) (771)
Actuarial gains/(losses) – experience 123 148 (69)
Actuarial (losses)/gains – demographic assumptions (1) 452 266
Actuarial losses – financial assumptions (1,268) (84) (619)
Past service credit – redundancies 1 — 7
Special termination benefit cost – redundancies (5) (2) (55)
Past service cost – augmentations — — (5)
Past service cost – plan amendments — — (34)
Medicare subsidy received (25) (22) (19)
Employee contributions (1) (1) (1)
Benefits paid 1,246 1,282 1,376
Exchange adjustments 1,166 (531) (768)
Reclassification to held for sale (note 10) 609 — —
Closing defined benefit obligations (23,607) (24,626) (24,939)
National Grid plc Annual Report and Accounts 2020/21 Financial Statements | Notes to the consolidated financial statements
179

25. Pensions and other post-retirement benefits continuedThe geographical split of pensions and other post-retirement benefits is as shown below:
UK pensions US pensions US other post-retirement benefits
2021 2020 2019 2021 2020 2019 2021 2020 2019£m £m £m £m £m £m £m £m £m
Opening defined benefit obligations (12,844) (14,276) (14,226) (8,085) (7,155) (6,582) (3,697) (3,508) (3,246)
Current service cost (28) (33) (41) (104) (100) (104) (43) (45) (48)
Interest cost (296) (335) (358) (243) (280) (277) (112) (136) (136)
Actuarial (losses)/gains – experience (21) 113 (56) (72) (45) (52) 216 80 39
Actuarial (losses)/gains – demographic assumptions (1) 140 224 — 78 — — 234 42
Actuarial (losses)/gains – financial assumptions (1,181) 798 (568) (62) (595) (24) (25) (287) (27)
Past service credit – redundancies 1 — 7 — — — — — —
Special termination benefit cost – redundancies (5) (2) (55) — — — — — —
Past service cost – augmentations — — (5) — — — — — —
Past service cost – plan amendments — — (34) — — — — — —
Medicare subsidy received — — — — — — (25) (22) (19)
Employee contributions (1) (1) (1) — — — — — —
Benefits paid 731 752 837 371 374 398 144 156 141
Exchange adjustments — — — 804 (362) (514) 362 (169) (254)
Reclassification to held for sale (note 10) — — — 460 — — 149 — —
Closing defined benefit obligations (13,645) (12,844) (14,276) (6,931) (8,085) (7,155) (3,031) (3,697) (3,508)
Changes in the value of plan assets
2021 2020 2019£m £m £m
Opening fair value of plan assets 23,748 24,793 23,858
Interest income 613 728 749
Return on plan assets in excess of/(less than) interest¹ 2,554 (1,240) 490
Administration costs (18) (16) (14)
Employer contributions 274 327 419
Employee contributions 1 1 1
Benefits paid (1,244) (1,279) (1,377)
Exchange adjustments (980) 434 667
Reclassification to held for sale (note 10) (560) — —
Closing fair value of plan assets 24,388 23,748 24,793
Actual return on plan assets 3,167 (512) 1,239
Expected contributions to plans in the following year 212 269 307
1. This includes actuarial losses from the purchase of buy-in policies of £0.1 billion (2020: £0.7 billion).
The geographical split of pensions and other post-retirement benefits is as shown below:
UK pensions US pensions US other post-retirement benefits
2021 2020 2019 2021 2020 2019 2021 2020 2019£m £m £m £m £m £m £m £m £m
Opening fair value of plan assets 14,364 15,507 15,330 6,972 6,646 6,030 2,412 2,640 2,498
Interest income 334 366 389 208 259 256 71 103 104
Return on plan assets in excess of/(less than) interest¹ 581 (908) 457 1,151 (26) 62 822 (306) (29)
Administration costs (9) (9) (6) (7) (6) (7) (2) (1) (1)
Employer contributions 138 156 174 110 153 231 26 18 14
Employee contributions 1 1 1 — — — — — —
Benefits paid (729) (749) (838) (371) (374) (398) (144) (156) (141)
Exchange adjustments — — — (721) 320 472 (259) 114 195
Reclassification to held for sale (note 10) — — — (433) — — (127) — —
Closing fair value of plan assets 14,680 14,364 15,507 6,909 6,972 6,646 2,799 2,412 2,640
Actual return on plan assets 915 (542) 846 1,359 233 318 893 (203) 75
Expected contributions to plans in the following year 93 137 148 113 125 150 6 7 9
1. This includes actuarial losses from the purchase of buy-in policies of £0.1 billion (2020: £0.7 billion).
National Grid plc Annual Report and Accounts 2020/21 Financial Statements
Notes to the consolidated financial statementscontinued
180

25. Pensions and other post-retirement benefits continuedMain defined benefit risksDB pension plans can pose a significant risk to future cash flows, as National Grid underwrites the financial and demographic risks associated with these plans. Although the governing bodies have sole responsibility for setting investment strategies and managing risks, National Grid closely works with and supports the governing bodies of each plan, to assist them in mitigating the risks associated with their plans and to ensure that the plans are funded to meet their obligations.
The most significant risks associated with the DB plans are:• investment risk – the plans invest in a variety of asset classes, with actual returns likely to differ from the underlying discount rate adopted, impacting the
funding position of the plan through the net balance sheet asset or liability. Each plan seeks to balance the level of investment return required with the risk that it can afford to take, to design the most appropriate investment portfolio. Volatility will be controlled through using liability-matching asset strategies including bulk annuities, as well as interest rate hedging and management of foreign exchange exposure, and diversification of the return-seeking assets;
• changes in bond yields – liabilities are calculated using discount rates set with reference to the yields on high-quality corporate bonds prevailing in the UK and US debt markets and will fluctuate as yields change;
• member longevity – longevity is a key driver of liabilities and changes in life expectancy have a direct impact on liabilities. Improvements in life expectancy will lead to pension payments being paid for longer than expected and benefits ultimately being more expensive. This risk has been partly mitigated by recent scheme investment transactions including a longevity insurance contract (longevity swap) for NGEG of ESPS and three separate buy-in policies for NGUKPS Section A and B;
• counterparty risk – is managed by having a diverse range of counterparties and through having a strong collateralisation process (including for the longevity swap held by NGEG of ESPS). Measurement and management of counterparty risk is delegated to the relevant investment managers. For our bulk annuity policies, various termination provisions were introduced in the contracts, managing our exposure to counterparty risk. The insurers’ operational performance and financial strength are monitored on a regular basis;
• currency risk – fluctuations in the value of foreign denominated assets due to exposure to currency exchange rates is managed through a combination of segregated currency hedging overlay and currency hedging carried out by some of the investment managers; and
• inflation risk – changes in inflation will affect the current and future pensions but are partially mitigated through investing in inflation-matching assets and hedging instruments as well as bulk annuity buy-in policies.
Defined benefit investment strategiesIn the UK, each plan has a Trustee that is the governing body. The Trustees’ responsibilities are set out in the Trust Deed and Rules. In the US, the fiduciary committee for all the retirement plans is the Retirement Plan Committee (RPC). The RPC is structured in accordance with US laws governing retirement plans under the Employee Retirement Income Security Act (ERISA). The Trustees and RPC, after taking advice from professional investment advisors and in consultation with National Grid, set the key principles, including expected returns, risk and liquidity requirements. In setting these they take into account expected contributions, maturity of the pension liabilities, and in the UK, the strength of the covenant. The Trustees and RPC formulate an investment strategy to manage risk through diversification. Where appropriate, the strategies may include interest rate and inflation hedging instruments, and currency hedging to hedge specific risks.
Investments are usually grouped into:
• return-seeking assets – equities, property and diversified funds where the objective is to achieve growth within the constraints of the plans’ risk profiles. These assets should produce returns greater than the liability increase, so improving the funding position, and are assessed by reference to benchmarks and performance targets agreed with the investment managers; and
• liability-matching assets – liability-driven investment (LDI) funds, buy-ins, government securities, corporate bonds and swaps, where the objective is to secure fixed or inflation-adjusted cash flows in future. These investments are generally expected to match the change in liability valuation, so protecting the funding position. Bonds and securities are also measured against certain market benchmarks.
The approximate investment allocations for our plans is as follows:
2021 2020 2019
UK pensions
US pensions
US other post-
retirement benefits UK pensions US pensions
US other post-
retirement benefits UK pensions US pensions
US other post-
retirement benefits
% % % % % % % % %
Return-seeking assets 18 55 74 21 49 71 23 56 73
Liability-matching assets 82 45 26 79 51 29 77 44 27
Investments are predominantly made in assets considered to be of investment grade. Where investments are made in non-investment grade assets, the higher volatility involved is carefully judged and balanced against the expected higher returns. Similarly, investments are made predominantly in regulated markets. Where investments are made either in non-investment grade assets or outside of regulated markets, investment levels are kept to prudent levels and subject to agreed control ranges, to control the risk. Should these investments fall outside the pre-agreed ranges, corrective actions and timescales are agreed with the investment manager to remedy the position.
The governing bodies ensure that the performance of investment managers is regularly reviewed against measurable objectives, consistent with each pension plan’s long-term objectives and accepted risk levels. Where required, the portfolios are amended, or investment managers changed.
The Trustees and RPC can generally delegate responsibility for the selection of specific bonds, securities and other investments to appointed investment managers. Investment managers are selected based on the required skills, expertise of those markets, process and financial security to manage the investments. The investment managers use their skill and expertise to manage the investments competently. In some cases, they may further delegate this responsibility, through appointing sub-managers.
The pension plans hold sufficient cash to meet benefit requirements, with other investments being held in liquid or realisable assets to meet unexpected cash flow requirements. The plans do not borrow money, or act as guarantor, to provide liquidity to other parties (unless it is temporary).
National Grid plc Annual Report and Accounts 2020/21 Financial Statements | Notes to the consolidated financial statements
181
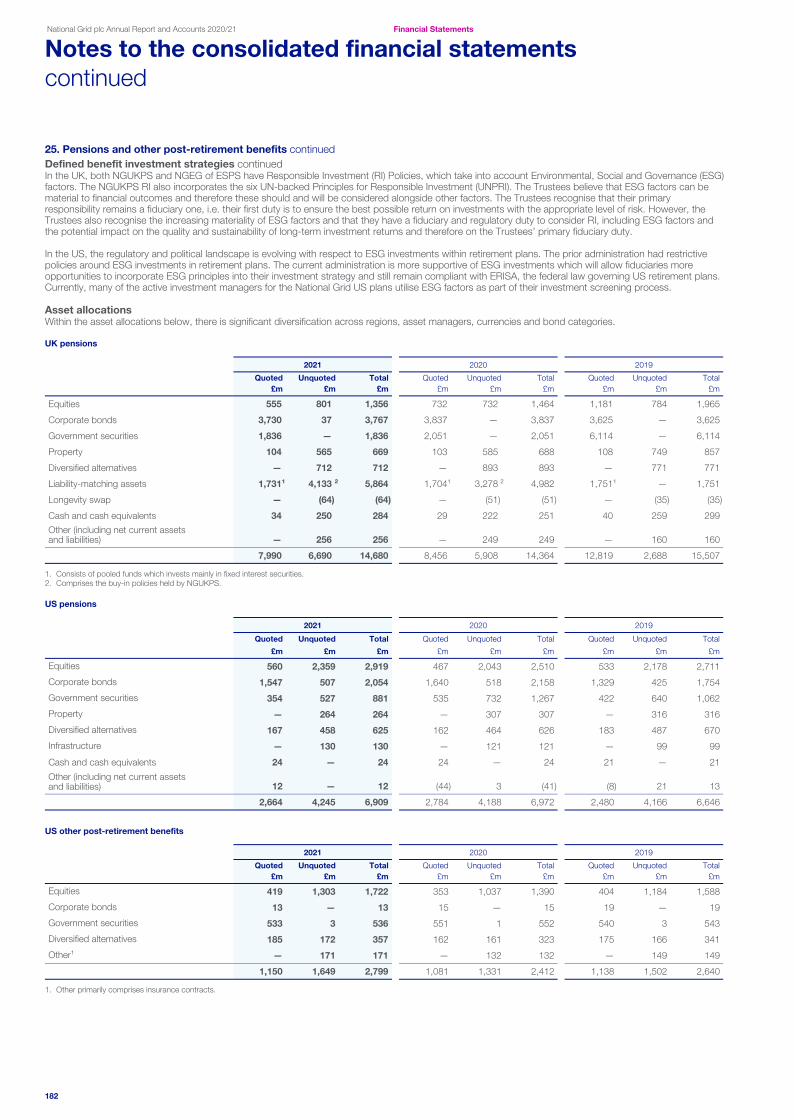
25. Pensions and other post-retirement benefits continuedDefined benefit investment strategies continuedIn the UK, both NGUKPS and NGEG of ESPS have Responsible Investment (RI) Policies, which take into account Environmental, Social and Governance (ESG) factors. The NGUKPS RI also incorporates the six UN-backed Principles for Responsible Investment (UNPRI). The Trustees believe that ESG factors can be material to financial outcomes and therefore these should and will be considered alongside other factors. The Trustees recognise that their primary responsibility remains a fiduciary one, i.e. their first duty is to ensure the best possible return on investments with the appropriate level of risk. However, the Trustees also recognise the increasing materiality of ESG factors and that they have a fiduciary and regulatory duty to consider RI, including ESG factors and the potential impact on the quality and sustainability of long-term investment returns and therefore on the Trustees’ primary fiduciary duty.
In the US, the regulatory and political landscape is evolving with respect to ESG investments within retirement plans. The prior administration had restrictive policies around ESG investments in retirement plans. The current administration is more supportive of ESG investments which will allow fiduciaries more opportunities to incorporate ESG principles into their investment strategy and still remain compliant with ERISA, the federal law governing US retirement plans. Currently, many of the active investment managers for the National Grid US plans utilise ESG factors as part of their investment screening process.
Asset allocationsWithin the asset allocations below, there is significant diversification across regions, asset managers, currencies and bond categories.
UK pensions
2021 2020 2019
Quoted Unquoted Total Quoted Unquoted Total Quoted Unquoted Total£m £m £m £m £m £m £m £m £m
Equities 555 801 1,356 732 732 1,464 1,181 784 1,965
Corporate bonds 3,730 37 3,767 3,837 — 3,837 3,625 — 3,625
Government securities 1,836 — 1,836 2,051 — 2,051 6,114 — 6,114
Property 104 565 669 103 585 688 108 749 857
Diversified alternatives — 712 712 — 893 893 — 771 771
Liability-matching assets 1,731 ¹ 4,133 ² 5,864 1,704 ¹ 3,278 ² 4,982 1,751 ¹ — 1,751
Longevity swap — (64) (64) — (51) (51) — (35) (35)
Cash and cash equivalents 34 250 284 29 222 251 40 259 299
Other (including net current assets and liabilities) — 256 256 — 249 249 — 160 160
7,990 6,690 14,680 8,456 5,908 14,364 12,819 2,688 15,507
1. Consists of pooled funds which invests mainly in fixed interest securities.2. Comprises the buy-in policies held by NGUKPS.
US pensions
2021 2020 2019
Quoted Unquoted Total Quoted Unquoted Total Quoted Unquoted Total
£m £m £m £m £m £m £m £m £m
Equities 560 2,359 2,919 467 2,043 2,510 533 2,178 2,711
Corporate bonds 1,547 507 2,054 1,640 518 2,158 1,329 425 1,754
Government securities 354 527 881 535 732 1,267 422 640 1,062
Property — 264 264 — 307 307 — 316 316
Diversified alternatives 167 458 625 162 464 626 183 487 670
Infrastructure — 130 130 — 121 121 — 99 99
Cash and cash equivalents 24 — 24 24 — 24 21 — 21
Other (including net current assets and liabilities) 12 — 12 (44) 3 (41) (8) 21 13
2,664 4,245 6,909 2,784 4,188 6,972 2,480 4,166 6,646
US other post-retirement benefits
2021 2020 2019
Quoted Unquoted Total Quoted Unquoted Total Quoted Unquoted Total£m £m £m £m £m £m £m £m £m
Equities 419 1,303 1,722 353 1,037 1,390 404 1,184 1,588
Corporate bonds 13 — 13 15 — 15 19 — 19
Government securities 533 3 536 551 1 552 540 3 543
Diversified alternatives 185 172 357 162 161 323 175 166 341
Other¹ — 171 171 — 132 132 — 149 149
1,150 1,649 2,799 1,081 1,331 2,412 1,138 1,502 2,640
1. Other primarily comprises insurance contracts.
National Grid plc Annual Report and Accounts 2020/21 Financial Statements
Notes to the consolidated financial statementscontinued
182

26. Provisions
Provisions are recognised when an obligation exists resulting from a past event, and it is probable that cash will be paid to settle it, but the exact amount of cash required can only be estimated. The majority of our provisions relate to environmental remediation, specifically in relation to certain Superfund sites in the US, being sites we own or have owned in the past where hazardous substances are present as a result of the historic operations of manufactured gas plants in Brooklyn, New York. We also recognise provisions for decommissioning costs for various assets we would be required to remove at the end of their lives, the costs associated with restructuring plans and for lease contracts we have entered into that are now loss-making.
In determining the quantum of the provision we recognise, we make estimates in relation to management’s best judgement of the evaluation of the likelihood and the probability of exposure to potential loss, and the costs that would be incurred. Should circumstances change following unforeseeable developments, the likelihood or quantum could alter.
Provisions are recognised where a legal or constructive obligation exists at the reporting date, as a result of a past event, where the amount of the obligation can be reliably estimated and where the outflow of economic benefit is probable.
The quantum of the provision recognised for decommissioning, environmental, restructuring and other costs is based on estimated future expenditure, discounted to present values. An initial estimate of decommissioning and environmental costs attributable to property, plant and equipment is recorded as part of the original cost of the related property, plant and equipment. Provisions to decommission significant portions of our regulated transmission and distribution assets are not recognised where no legal obligations exist, and a realistic alternative exists to incurring costs to decommission assets at the end of their life. In any case, even if a legal or constructive obligation did exist, it is not currently determinable when remediation work would take place and therefore no provision would be recorded at this point.
Changes in the provision arising from revised estimates, discount rates or changes in the expected timing of expenditure that relates to property, plant and equipment are recorded as adjustments to their carrying value and depreciated prospectively over their remaining estimated useful economic lives; otherwise such changes are recognised in the income statement.
The unwinding of the discount is included within the income statement within finance costs.
Environmental£m
Decommissioning£m
Restructuring£m
Other£m
Totalprovisions
£m
At 1 April 2019 1,639 188 83 289 2,199
Exchange adjustments 82 5 — 10 97
Additions¹ 437 93 7 52 589
Unused amounts reversed (29) (16) (16) (9) (70)
Unwinding of discount 65 5 — 7 77
Utilised (123) (21) (39) (55) (238)
At 31 March 2020 2,071 254 35 294 2,654
Exchange adjustments (185) (9) (1) (21) (216)
Additions 26 42 11 67 146
Unused amounts reversed (38) (27) — (16) (81)
Unwinding of discount 66 7 — 5 78
Utilised (161) (16) (19) (62) (258)
Reclassification to held for sale (note 10) (79) (7) — (10) (96)
At 31 March 2021 1,700 244 26 257 2,227
2021 2020£m £m
Current 260 348
Non-current 1,967 2,306
2,227 2,654
1. For the year ended 31 March 2020, £402 million of additions related to exceptional environmental provisions, of which £76 million related to the impact of the change in the real discount rate from 1% to 0.5% during the year (see note 5 for details).
National Grid plc Annual Report and Accounts 2020/21 Financial Statements | Notes to the consolidated financial statements
183

26. Provisions continuedEnvironmental provisionsThe environmental provision represents the estimated restoration and remediation costs relating to a number of sites owned and managed by subsidiary undertakings, together with certain US sites that National Grid no longer owns. The environmental provision is as follows:
2021 2020
Discounted£m
Undiscounted£m
Real discount
rateDiscounted
£mUndiscounted
£m
Real discount
rate
UK sites 167 171 0.5 % 175 184 0.5 %
US sites 1,533 1,583 0.5 % 1,896 1,955 0.5 %
1,700 1,754 2,071 2,139
The remediation expenditure in the UK relates to old gas manufacturing sites and also to electricity transmission sites. Cash flows are expected to be incurred until 2075, although the weighted average duration of the cash flows is 15 years. A number of estimation uncertainties affect the calculation of the provision, including the impact of regulation, the accuracy of site surveys, unexpected contaminants, transportation costs, the impact of alternative technologies and changes in the real discount rate. This provision incorporates our best estimate of the financial effect of these uncertainties, but future changes in any of the assumptions could materially impact the calculation of the provision. The undiscounted amount is the undiscounted best estimate of the liability having regard to these uncertainties.
The remediation expenditure in the US is expected to be incurred until 2069, of which the majority relates to three Superfund sites (being sites where hazardous substances are present as a result of the historic operations of manufactured gas plants in Brooklyn, New York). The weighted average duration of the cash flows is 10 years. The uncertainties regarding the calculation of this provision are similar to those considered in respect of UK sites. Under the terms of our rate plans, we are entitled to recovery of environmental clean-up costs from rate payers.
Decommissioning provisionsThe decommissioning provisions primarily include £160 million (2020: £174 million) of expenditure relating to asset retirement obligations estimated to be incurred until 2104 and £60 million (2020: £74 million) of expenditure relating to the demolition of gas holders, which is estimated to be incurred until 2026.
Restructuring provisionsIn 2021, we are undertaking the design and implementation of our new operating model in both our UK and US businesses, which resulted in the recognition of a £11 million provision in the year. The income statement expense relating to the provision has been treated as an exceptional item, and details are provided in note 5.
Other provisionsIncluded within other provisions at 31 March 2021 are the following amounts:• £166 million (2020: £164 million) of estimated liabilities in respect of past events insured by insurance subsidiary undertakings, including employer liability
claims. In accordance with insurance industry practice, these estimates are based on experience from previous years, but we currently expect that cash flows will be incurred until 2049;
• £21 million (2020: £37 million) in respect of legacy provisions recognised following the sale of UK Gas Distribution; • £27 million (2020: £31 million) in respect of onerous lease commitments and rates payable on surplus properties with expenditure expected to be incurred
until 2039; and• £13 million (2020: £17 million) in respect of emissions provisions.
National Grid plc Annual Report and Accounts 2020/21 Financial Statements
Notes to the consolidated financial statementscontinued
184

27. Share capital
Ordinary share capital represents the total number of shares issued which are publicly traded. We also disclose the number of treasury shares the Company holds, which are shares that the Company has bought itself, predominantly to actively manage scrip issuances and settle employee share option and reward plan liabilities.
Share capital is accounted for as an equity instrument. An equity instrument is any contract that includes a residual interest in the consolidated assets of the Company after deducting all its liabilities and is recorded at the proceeds received, net of direct issue costs, with an amount equal to the nominal amount of the shares issued included in the share capital account and the balance recorded in the share premium account.
Allotted, called-up and fully paid
million £m
At 1 April 2019 3,687 458
Issued during the year in lieu of dividends¹ 93 12
At 31 March 2020 3,780 470
Issued during the year in lieu of dividends¹ 35 4
At 31 March 2021 3,815 474
1. The issue of shares under the scrip dividend programme is considered to be a bonus issue under the terms of the Companies Act 2006, and the nominal value of the shares is charged to the share premium account.
The share capital of the Company consists of ordinary shares of 12204⁄473 pence nominal value each including ADSs. The ordinary shares and ADSs allow holders to receive dividends and vote at general meetings of the Company. The Company holds treasury shares but may not exercise any rights over these shares including the entitlement to vote or receive dividends. There are no restrictions on the transfer or sale of ordinary shares.
In line with the provisions of the Companies Act 2006, the Company has amended its Articles of Association and ceased to have authorised share capital.
Treasury sharesAt 31 March 2021, the Company held 266 million (2020: 272 million) of its own shares. The market value of these shares as at 31 March 2021 was £2,296 million (2020: £2,574 million).
For the benefit of employees and in connection with the operation of the Company’s various share plans, the Company made the following transactions in respect of its own shares during the year ended 31 March 2021:i. During the year, 4 million (2020: 3 million) treasury shares were gifted to National Grid Employee Share Trusts and 2 million (2020: 2 million) treasury shares
were re-issued in relation to employee share schemes, in total representing approximately 0.2% (2020: 0.1%) of the ordinary shares in issue as at 31 March 2021. The nominal value of these shares was £1 million (2020: £1 million) and the total proceeds received were £17 million (2020: £17 million). National Grid settles share awards under its Long Term Incentive Plan and the Save As You Earn scheme, by the transfer of treasury shares to its employee share trusts.
ii. During the year, the Company made payments totalling £2 million (2020: £6 million) to National Grid Employee Share Trusts to enable the trustees to make purchases of National Grid plc shares to settle share awards in relation to all employee share plans and discretionary reward plans. The cost of such purchases is deducted from retained earnings in the period that the transaction occurs.
The maximum number of ordinary shares held in treasury during the year was 272 million (2020: 277 million) representing approximately 7.1% (2020: 7.3%) of the ordinary shares in issue as at 31 March 2021 and having a nominal value of £34 million (2020: £34 million).
National Grid plc Annual Report and Accounts 2020/21 Financial Statements | Notes to the consolidated financial statements
185

28. Other equity reserves
Other equity reserves are different categories of equity as required by accounting standards and represent the impact of a number of our historical transactions or fair value movements on certain financial instruments that the Company holds.
Other equity reserves comprise the translation reserve (see accounting policy C in note 1), cash flow hedge reserve and the cost of hedging reserve (see note 32), debt instruments at fair value through other comprehensive income reserve (FVOCI debt) and equity investments at fair value through other comprehensive income reserve (FVOCI equity) (see note 15), the capital redemption reserve and the merger reserve.
The merger reserve arose as a result of the application of merger accounting principles under the then prevailing UK GAAP, which under IFRS 1 was retained for mergers that occurred prior to the IFRS transition date. Under merger accounting principles, the difference between the carrying amount of the capital structure of the acquiring vehicle and that of the acquired business was treated as a merger difference and included within reserves. The merger reserve represents the difference between the carrying value of subsidiary undertaking investments and their respective capital structures following the Lattice demerger from BG Group plc and the 1999 Lattice refinancing.
The cash flow hedge reserve will amortise as the committed future cash flows from borrowings are paid or capitalised in fixed assets (as described in note 32). Cost of hedging, FVOCI debt, and FVOCI equity reserves arose as a result of the adoption of IFRS 9 on 1 April 2018. See note 15 for further detail on FVOCI debt and FVOCI equity reserves and note 32 in respect of cost of hedging reserve.
As the amounts included in other equity reserves are not attributable to any of the other classes of equity presented, they have been disclosed as a separate classification of equity.
Translation£m
Cash flow hedge
£m
Cost of hedging
£m
Available-for-sale
£m
FVOCI equity
£m
FVOCI debt
£m
Own credit
£m
Capitalredemption
£mMerger
£mTotal
£m
At 1 April 2018 (as previously reported) 390 128 — 88 — — — 19 (5,165) (4,540)
Transfer on transition to IFRS 9 — (3) 76 (88) 34 46 7 — — 72
At 1 April 2018 (as restated) 390 125 76 — 34 46 7 19 (5,165) (4,468)
Exchange adjustments1,2 360 — — — — — — — — 360
Net (losses)/gains taken to equity — (206) (107) — — 2 7 — — (304)
Share of net gains of associates taken to equity — 1 — — — — — — — 1
Transferred to profit or loss — 166 41 — — — — — — 207
Net losses in respect of cash flow hedging of capital expenditure — (13) — — — — — — — (13)
Tax — 6 7 — — — (1) — — 12
Cash flow hedges transferred to the statement of financial position, net of tax — (18) — — — — — — — (18)
At 1 April 2019 750 61 17 — 34 48 13 19 (5,165) (4,223)
Exchange adjustments1,2 560 — — — — — — — — 560
Net losses taken to equity — (142) (33) — (13) (15) (3) — — (206)
Share of net losses of associates taken to equity — (5) — — — — — — — (5)
Transferred to profit or loss — 14 (45) — — — — — — (31)
Net losses in respect of cash flow hedging of capital expenditure — (17) — — — — — — — (17)
Tax — 29 11 — 4 (2) — — — 42
Cash flow hedges transferred to the statement of financial position, net of tax — (15) — — — — — — — (15)
At 1 April 2020 1,310 (75) (50) — 25 31 10 19 (5,165) (3,895)
Exchange adjustments¹ (1,345) — — — — — — — — (1,345)
Net gains/(losses) taken to equity — 14 11 — 36 80 (11) — — 130
Share of net gains of associates taken to equity — 1 — — — — — — — 1
Transferred to profit or loss — 56 3 — — — — — — 59
Net losses in respect of cash flow hedging of capital expenditure — (14) — — — — — — — (14)
Tax — (13) 8 — (10) — 2 — — (13)
Cash flow hedges transferred to the statement of financial position, net of tax — (17) — — — — — — — (17)
At 31 March 2021 (35) (48) (28) — 51 111 1 19 (5,165) (5,094)
1. The exchange adjustments recorded in the translation reserve comprise a loss of £1,507 million (2020: gain of £545 million; 2019: gain of £896 million) relating to the translation of foreign operations offset by a gain of £183 million (2020: gain of £5 million; 2019: loss of £550 million) relating to borrowings, cross-currency swaps and foreign exchange forward contracts used to hedge the net investment in non-sterling denominated subsidiaries.
2. Comparative amounts have been revised as described in note 1F.
National Grid plc Annual Report and Accounts 2020/21 Financial Statements
Notes to the consolidated financial statementscontinued
186
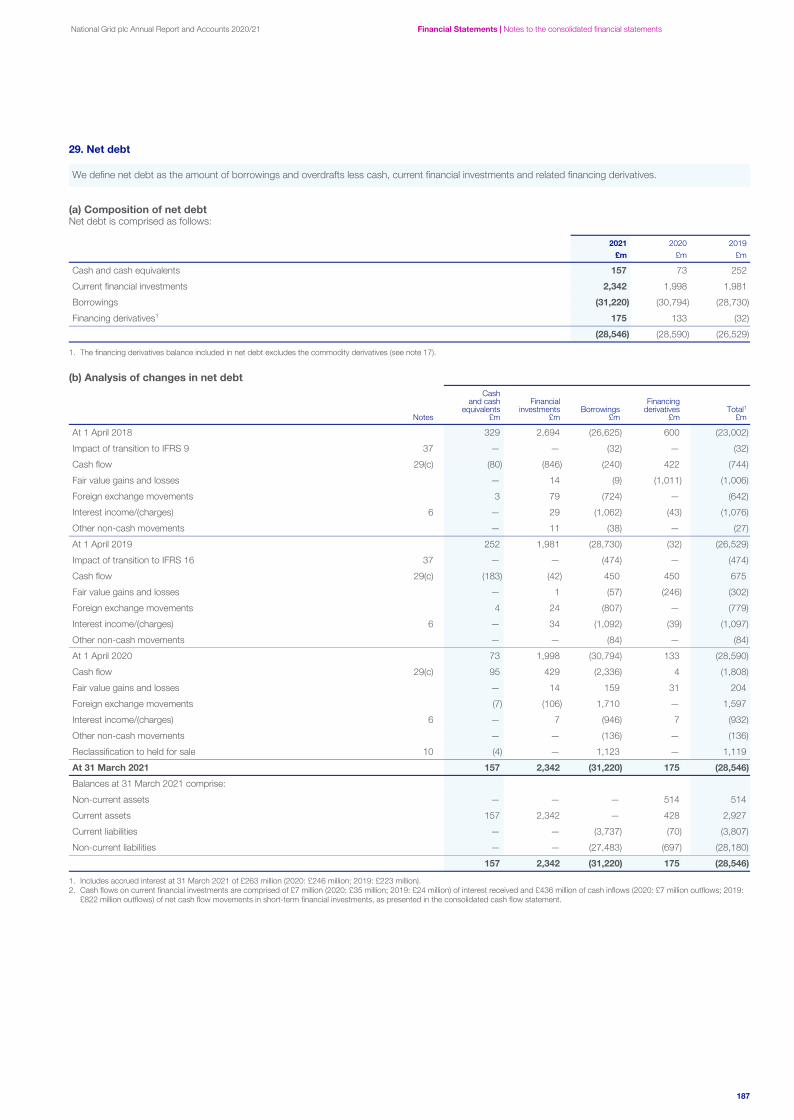
29. Net debt
We define net debt as the amount of borrowings and overdrafts less cash, current financial investments and related financing derivatives.
(a) Composition of net debtNet debt is comprised as follows:
2021 2020 2019£m £m £m
Cash and cash equivalents 157 73 252
Current financial investments 2,342 1,998 1,981
Borrowings (31,220) (30,794) (28,730)
Financing derivatives¹ 175 133 (32)
(28,546) (28,590) (26,529)
1. The financing derivatives balance included in net debt excludes the commodity derivatives (see note 17).
(b) Analysis of changes in net debt
Notes
Cashand cash
equivalents£m
Financial investments
£mBorrowings
£m
Financing derivatives
£mTotal1
£m
At 1 April 2018 329 2,694 (26,625) 600 (23,002)
Impact of transition to IFRS 9 37 — — (32) — (32)
Cash flow 29(c) (80) (846) (240) 422 (744)
Fair value gains and losses — 14 (9) (1,011) (1,006)
Foreign exchange movements 3 79 (724) — (642)
Interest income/(charges) 6 — 29 (1,062) (43) (1,076)
Other non-cash movements — 11 (38) — (27)
At 1 April 2019 252 1,981 (28,730) (32) (26,529)
Impact of transition to IFRS 16 37 — — (474) — (474)
Cash flow 29(c) (183) (42) 450 450 675
Fair value gains and losses — 1 (57) (246) (302)
Foreign exchange movements 4 24 (807) — (779)
Interest income/(charges) 6 — 34 (1,092) (39) (1,097)
Other non-cash movements — — (84) — (84)
At 1 April 2020 73 1,998 (30,794) 133 (28,590)
Cash flow 29(c) 95 429 (2,336) 4 (1,808)
Fair value gains and losses — 14 159 31 204
Foreign exchange movements (7) (106) 1,710 — 1,597
Interest income/(charges) 6 — 7 (946) 7 (932)
Other non-cash movements — — (136) — (136)
Reclassification to held for sale 10 (4) — 1,123 — 1,119
At 31 March 2021 157 2,342 (31,220) 175 (28,546)
Balances at 31 March 2021 comprise:
Non-current assets — — — 514 514
Current assets 157 2,342 — 428 2,927
Current liabilities — — (3,737) (70) (3,807)
Non-current liabilities — — (27,483) (697) (28,180)
157 2,342 (31,220) 175 (28,546)
1. Includes accrued interest at 31 March 2021 of £263 million (2020: £246 million; 2019: £223 million).2. Cash flows on current financial investments are comprised of £7 million (2020: £35 million; 2019: £24 million) of interest received and £436 million of cash inflows (2020: £7 million outflows; 2019:
£822 million outflows) of net cash flow movements in short-term financial investments, as presented in the consolidated cash flow statement.
National Grid plc Annual Report and Accounts 2020/21 Financial Statements | Notes to the consolidated financial statements
187
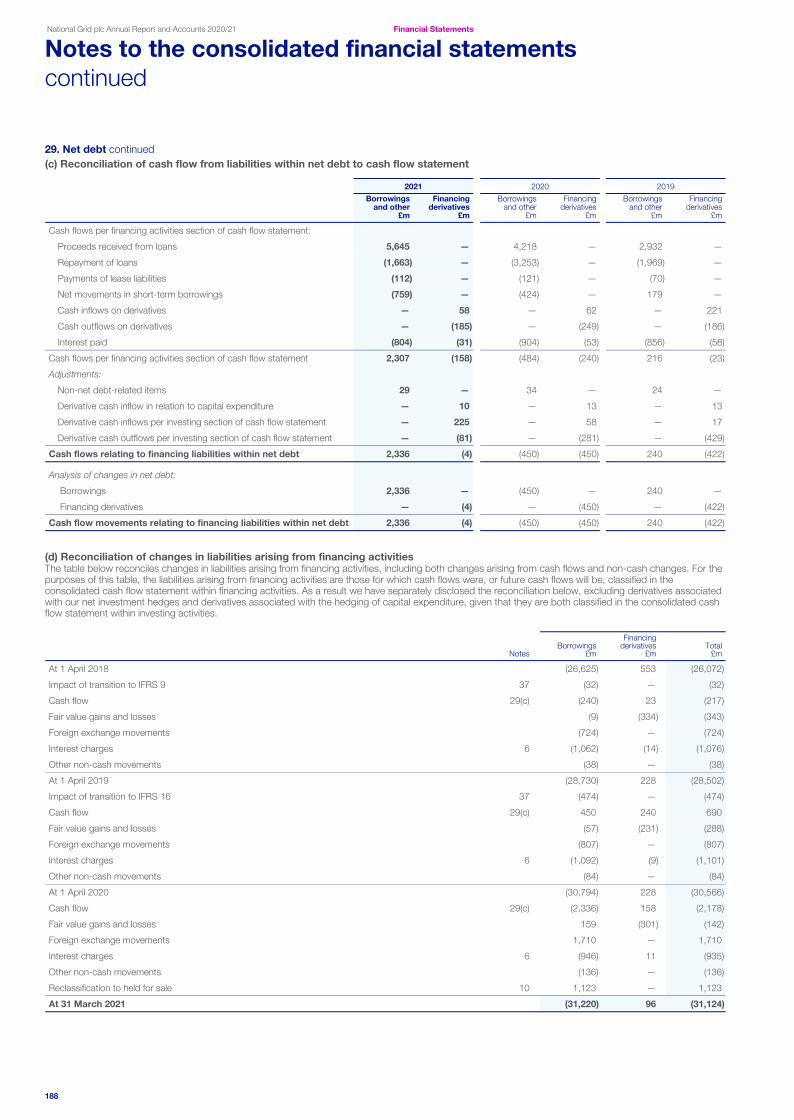
29. Net debt continued(c) Reconciliation of cash flow from liabilities within net debt to cash flow statement
2021 2020 2019
Borrowings and other
£m
Financing derivatives
£m
Borrowings and other
£m
Financing derivatives
£m
Borrowings and other
£m
Financing derivatives
£m
Cash flows per financing activities section of cash flow statement:
Proceeds received from loans 5,645 — 4,218 — 2,932 —
Repayment of loans (1,663) — (3,253) — (1,969) —
Payments of lease liabilities (112) — (121) — (70) —
Net movements in short-term borrowings (759) — (424) — 179 —
Cash inflows on derivatives — 58 — 62 — 221
Cash outflows on derivatives — (185) — (249) — (186)
Interest paid (804) (31) (904) (53) (856) (58)
Cash flows per financing activities section of cash flow statement 2,307 (158) (484) (240) 216 (23)
Adjustments:
Non-net debt-related items 29 — 34 — 24 —
Derivative cash inflow in relation to capital expenditure — 10 — 13 — 13
Derivative cash inflows per investing section of cash flow statement — 225 — 58 — 17
Derivative cash outflows per investing section of cash flow statement — (81) — (281) — (429)
Cash flows relating to financing liabilities within net debt 2,336 (4) (450) (450) 240 (422)
Analysis of changes in net debt:
Borrowings 2,336 — (450) — 240 —
Financing derivatives — (4) — (450) — (422)
Cash flow movements relating to financing liabilities within net debt 2,336 (4) (450) (450) 240 (422)
(d) Reconciliation of changes in liabilities arising from financing activitiesThe table below reconciles changes in liabilities arising from financing activities, including both changes arising from cash flows and non-cash changes. For the purposes of this table, the liabilities arising from financing activities are those for which cash flows were, or future cash flows will be, classified in the consolidated cash flow statement within financing activities. As a result we have separately disclosed the reconciliation below, excluding derivatives associated with our net investment hedges and derivatives associated with the hedging of capital expenditure, given that they are both classified in the consolidated cash flow statement within investing activities.
NotesBorrowings
£m
Financing derivatives
£mTotal
£m
At 1 April 2018 (26,625) 553 (26,072)
Impact of transition to IFRS 9 37 (32) — (32)
Cash flow 29(c) (240) 23 (217)
Fair value gains and losses (9) (334) (343)
Foreign exchange movements (724) — (724)
Interest charges 6 (1,062) (14) (1,076)
Other non-cash movements (38) — (38)
At 1 April 2019 (28,730) 228 (28,502)
Impact of transition to IFRS 16 37 (474) — (474)
Cash flow 29(c) 450 240 690
Fair value gains and losses (57) (231) (288)
Foreign exchange movements (807) — (807)
Interest charges 6 (1,092) (9) (1,101)
Other non-cash movements (84) — (84)
At 1 April 2020 (30,794) 228 (30,566)
Cash flow 29(c) (2,336) 158 (2,178)
Fair value gains and losses 159 (301) (142)
Foreign exchange movements 1,710 — 1,710
Interest charges 6 (946) 11 (935)
Other non-cash movements (136) — (136)
Reclassification to held for sale 10 1,123 — 1,123
At 31 March 2021 (31,220) 96 (31,124)
National Grid plc Annual Report and Accounts 2020/21 Financial Statements
Notes to the consolidated financial statementscontinued
188

30. Commitments and contingencies
Commitments are those amounts that we are contractually required to pay in the future as long as the other party meets its obligations. These commitments primarily relate to energy purchase agreements and contracts for the purchase of assets which, in many cases, extend over a long period of time. We also disclose any contingencies, which include guarantees that companies have given, where we pledge assets against current obligations that will remain for a specific period.
2021 2020£m £m
Future capital expenditure
Contracted for but not provided 2,716 2,629
Energy purchase commitments¹
Less than 1 year 1,255 1,365
In 1 to 2 years 894 890
In 2 to 3 years 975 973
In 3 to 4 years 959 955
In 4 to 5 years 896 861
More than 5 years 10,805 11,314
15,784 16,358
Guarantees²
Guarantee of sublease for US property (expires 2040) 149 173
Guarantees of certain obligations of Grain LNG (expire up to 2025) 33 34
Guarantees of certain obligations for construction of HVDC West Coast Link (expected expiry 2059) 85 92
Guarantees of certain obligations of National Grid North Sea Link Limited (various expiry dates)² 584 683
Guarantees of certain obligations of St William Homes LLP (various expiry dates)³ 53 30
Guarantees of certain obligations of National Grid IFA 2 Limited (expected expiry 2022)² 170 564
Guarantees of certain obligations of National Grid Viking Link Limited (expected expiry 2024) 1,276 1,096
Other guarantees and letters of credit (various expiry dates) 486 150
2,836 2,822
1. Energy purchase commitments relate to contractual commitments to purchase electricity or gas that are used to satisfy physical delivery requirements to our customers or for energy that we use ourselves (i.e. normal purchase, sale or usage) and hence are accounted for as ordinary purchase contracts (see note 32(f)). Details of commodity contract derivatives that do not meet the normal purchase, sale or usage criteria, and hence are accounted for as derivative contracts, are shown in note 17(b).
2. Included within total guarantees are guarantees to both joint ventures and Engineering, Procurement and Construction contractors regarding the construction of interconnectors of £136 million (2020: £358 million).
3. Includes guarantees to related parties.
Through the ordinary course of our operations, we are party to various litigation, claims and investigations. We do not expect the ultimate resolution of any of these proceedings to have a material adverse effect on our results of operations, cash flows or financial position.
National Grid plc Annual Report and Accounts 2020/21 Financial Statements | Notes to the consolidated financial statements
189

31. Related party transactions
Related parties include joint ventures, associates, investments and key management personnel.
The following significant transactions with related parties were in the normal course of business. Amounts receivable from and payable to related parties are due on normal commercial terms:
2021 2020 2019£m £m £m
Sales: Goods and services supplied to a pension plan 3 5 5
Sales: Goods and services supplied to joint ventures¹ 79 101 151
Sales: Goods and services supplied to associates² 1 33 192
Purchases: Goods and services received from joint ventures³ 35 61 26
Purchases: Goods and services received from associates³ 43 56 141
Receivable from joint ventures4 263 255 584
Receivable from associates4 — 1 368
Payable to joint ventures 17 — 8
Payable to associates 3 4 12
Interest income from joint ventures — 2 5
Interest income from associates — 8 23
Dividends received from joint ventures5 49 34 30
Dividends received from associates6 32 41 171
1. During the year, £14 million (2020: £38 million; 2019: £139 million) of property sites were sold to St William Homes LLP, £50 million of sales were made to Emerald Energy Venture LLC (2020: £21 million; 2019: £nil) and a further £6 million (2020: £32 million; 2019; £2 million) of sales were made to NGET/SPT Upgrades Limited.
2. In previous years, sales related to transactions with Quadgas, until the date it ceased to be a related party following the disposal of our 39% stake in June 2019 (see note 10) and included income of £31 million in 2020 and £52 million in 2019 relating to a Transitional Service Agreement following the sale of the UK Gas Distribution business to Quadgas.
3. During the year, the Group received goods and services from a number of US associates, both for the transportation of gas and for pipeline services in the US, most notably, £41 million (2020: £31 million; 2019: £30 million) of purchases from Millennium Pipeline Company LLC. The Group also purchased assets of £5 million (2020: £58 million; 2019: £26 million) from NGET/SPT Upgrades Limited (a joint venture).
4. Amounts receivable from joint ventures include £241 million (2020: £242 million; 2019: £325 million) in relation to St William Homes LLP. There are no longer loans receivable from Quadgas (2020: £nil; 2019: £352 million) and Nemo Link (a joint venture) (2020: £nil; 2019: £258 million).
5. Includes dividends of £18 million (2020: £25 million; 2019: £30 million) received from BritNed Development Limited and £25 million (2020: £8 million; 2019:£ nil) from Nemo Link Limited.6. Includes dividends of £31 million (2020: £32 million; 2019: £24 million) received from Millennium Pipeline Company LLC. Dividends of £133 million were received from Quadgas in 2019.
Details of investments in principal subsidiary undertakings, joint ventures and associates are disclosed in note 34, and information relating to pension fund arrangements is disclosed in note 25. For details of Directors’ and key management remuneration, refer to the Directors’ Remuneration Report on pages 92 – 113 and note 4(c).
32. Financial risk management
Our activities expose us to a variety of financial risks including credit risk, liquidity risk, capital risk, currency risk, interest rate risk, inflation risk and commodity price risk. Our risk management programme focuses on the unpredictability of financial markets and seeks to minimise potential volatility of financial performance from these risks. We use financial instruments, including derivative financial instruments, to manage these risks.
Risk management related to financing activities is carried out by a central treasury department under policies approved by the Finance Committee of the Board. The objective of the treasury department is to manage funding and liquidity requirements, including managing associated financial risks, to within acceptable boundaries. The Finance Committee provides written principles for overall risk management, and written policies covering the following specific areas: foreign exchange risk, interest rate risk, credit risk, liquidity risk, use of derivative financial instruments and non-derivative financial instruments, and investment of excess liquidity. The Finance Committee has delegated authority to administer the commodity price risk policy and credit policy for US-based commodity transactions to the Energy Procurement Risk Management Committee and the National Grid USA Board of Directors. Details of key activities in the current year are set out in the Finance Committee report on page 88.
We have exposure to the following risks, which are described in more detail below:• credit risk;• liquidity risk;• currency risk;• interest rate risk;• commodity price risk; and• capital risk.
Where appropriate, derivatives and other financial instruments used for hedging currency and interest rate risk exposures are formally designated as fair value, cash flow or net investment hedges as defined in IFRS 9. Hedge accounting allows the timing of the profit or loss impact of qualifying hedging instruments to be recognised in the same reporting period as the corresponding impact of hedged exposures. To qualify for hedge accounting, documentation is prepared specifying the risk management objective and strategy, the component transactions and methodology used for measurement of effectiveness.
National Grid plc Annual Report and Accounts 2020/21 Financial Statements
Notes to the consolidated financial statementscontinued
190

32. Financial risk management continuedHedge accounting relationships are designated in line with risk management activities further described below. The categories of hedging entered into are as follows:• currency risk arising from our forecasted foreign currency transactions (capital expenditure or revenues) is designated in cash flow hedges;• currency risk arising from our net investments in foreign operations is designated in net investment hedges; and• currency and interest rate risk arising from borrowings are designated in cash flow or fair value hedges.
Critical terms of hedging instruments and hedged items are transacted to match on a 1:1 ratio by notional values. Hedge ineffectiveness can nonetheless arise from inherent differences between derivatives and non-derivative instruments and other market factors including credit, correlations, supply and demand, and market volatilities. Ineffectiveness is recognised in the remeasurements component of finance income and costs (see note 6). Hedge accounting is discontinued when a hedging relationship no longer qualifies for hedge accounting.
Certain hedging instrument components are treated separately as costs of hedging with the gains and losses deferred in a component of other equity reserves and released systematically into profit or loss to correspond with the timing and impact of hedged exposures, or released in full to finance costs upon an early discontinuation of a hedging relationship.
Refer to sections (c) currency risk and (d) interest rate risk below for further details on hedge accounting.
(a) Credit riskWe are exposed to the risk of loss resulting from counterparties’ default on their commitments including failure to pay or make a delivery on a contract. This risk is inherent in our commercial business activities. Exposure arises from derivative financial instruments, deposits with banks and financial institutions, trade receivables and committed transactions with wholesale and retail customers.
Treasury credit riskCounterparty risk arises from the investment of surplus funds and from the use of derivative financial instruments. As at 31 March 2021, the following limits were in place for investments and derivative financial instruments held with banks and financial institutions:
Maximum limit£m
Long-term limit£m
Triple ‘A’ G7 sovereign entities (AAA) 2,259 1,129
Triple ‘A’ vehicles (AAA) 500 —
Triple ‘A’ range institutions and non-G7 sovereign entities (AAA) 1,232 616
Double ‘A+’ G7 sovereign entities (AA+) 2,054 1,027
Double ‘A’ range institutions (AA) 822 to 1,027 411 to 513
Single ‘A’ range institutions (A) 288 to 411 144 to 205
The maximum limit applies to all transactions, including long-term transactions. The long-term limit applies to transactions which mature in more than 12 months’ time.
As at 31 March 2021 and 2020, we had a number of exposures to individual counterparties. In accordance with our treasury policies, counterparty credit exposure utilisations are monitored daily against the counterparty credit limits. Counterparty credit ratings and market conditions are reviewed continually with limits being revised and utilisation adjusted, if appropriate. Management does not expect any significant losses from non-performance by these counterparties. Further information on financial investments subject to impairment provisioning is included in note 15.
Commodity credit riskThe credit policy for US-based commodity transactions is owned by the Finance Committee to the Board, which establishes controls and procedures to determine, monitor and minimise the credit exposure to counterparties.
Wholesale and retail credit riskOur principal commercial exposure in the UK is governed by the credit rules within the regulated codes: Uniform Network Code and Connection and Use of System Code. These set out the level of credit relative to the RAV for each credit rating. In the US, we are required to supply electricity and gas under state regulations. Our policies and practices are designed to limit credit exposure by collecting security deposits prior to providing utility services, or after utility services have commenced if certain applicable regulatory requirements are met. Collection activities are managed on a daily basis. Sales to retail customers are usually settled in cash, cheques, electronic bank payments or by using major credit cards. We are committed to measuring, monitoring, minimising and recording counterparty credit risk in our wholesale business. The utilisation of credit limits is regularly monitored, and collateral is collected against these accounts when necessary.
Since March 2020, the Group’s US distribution business ceased certain cash collection and termination activities in response to regulatory instructions following the COVID-19 pandemic. This has resulted in the recognition of expected credit losses (see note 19 for further details).
National Grid plc Annual Report and Accounts 2020/21 Financial Statements | Notes to the consolidated financial statements
191
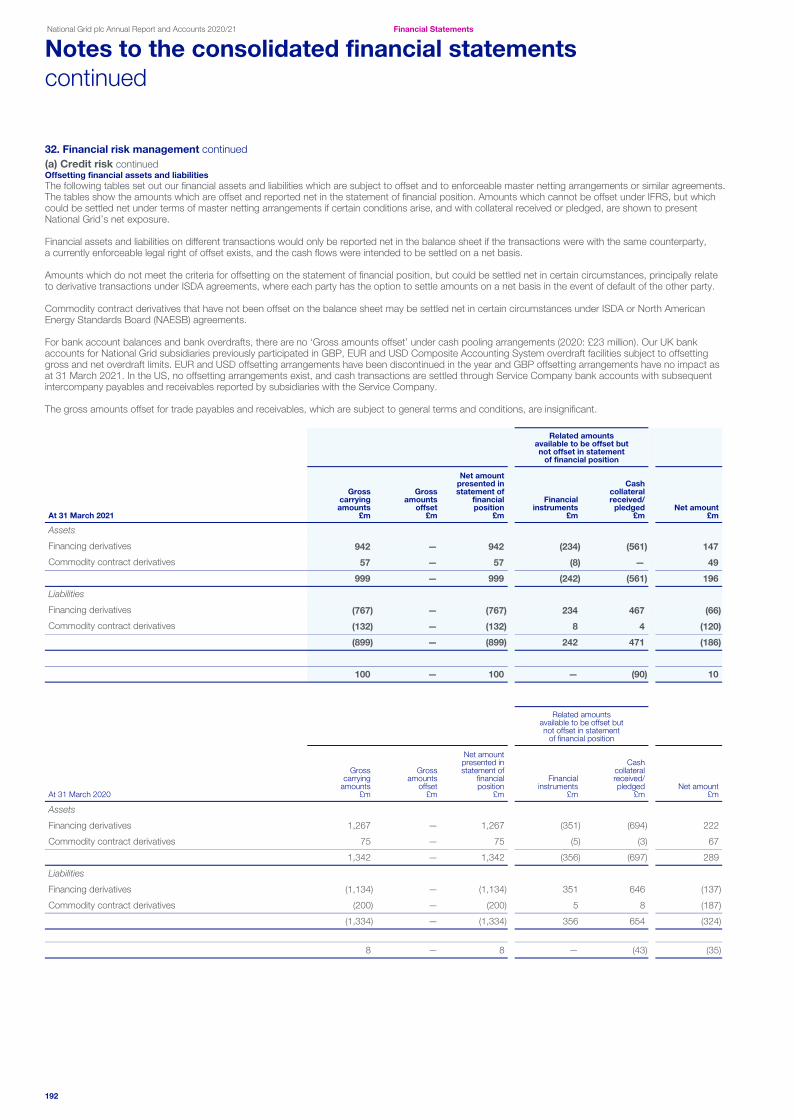
32. Financial risk management continued(a) Credit risk continuedOffsetting financial assets and liabilitiesThe following tables set out our financial assets and liabilities which are subject to offset and to enforceable master netting arrangements or similar agreements. The tables show the amounts which are offset and reported net in the statement of financial position. Amounts which cannot be offset under IFRS, but which could be settled net under terms of master netting arrangements if certain conditions arise, and with collateral received or pledged, are shown to present National Grid’s net exposure.
Financial assets and liabilities on different transactions would only be reported net in the balance sheet if the transactions were with the same counterparty, a currently enforceable legal right of offset exists, and the cash flows were intended to be settled on a net basis.
Amounts which do not meet the criteria for offsetting on the statement of financial position, but could be settled net in certain circumstances, principally relate to derivative transactions under ISDA agreements, where each party has the option to settle amounts on a net basis in the event of default of the other party.
Commodity contract derivatives that have not been offset on the balance sheet may be settled net in certain circumstances under ISDA or North American Energy Standards Board (NAESB) agreements.
For bank account balances and bank overdrafts, there are no ‘Gross amounts offset’ under cash pooling arrangements (2020: £23 million). Our UK bank accounts for National Grid subsidiaries previously participated in GBP, EUR and USD Composite Accounting System overdraft facilities subject to offsetting gross and net overdraft limits. EUR and USD offsetting arrangements have been discontinued in the year and GBP offsetting arrangements have no impact as at 31 March 2021. In the US, no offsetting arrangements exist, and cash transactions are settled through Service Company bank accounts with subsequent intercompany payables and receivables reported by subsidiaries with the Service Company.
The gross amounts offset for trade payables and receivables, which are subject to general terms and conditions, are insignificant.
Related amountsavailable to be offset but not offset in statement
of financial position
At 31 March 2021
Grosscarryingamounts
£m
Grossamounts
offset£m
Net amountpresented instatement of
financialposition
£m
Financial instruments
£m
Cashcollateralreceived/
pledged£m
Net amount£m
Assets
Financing derivatives 942 — 942 (234) (561) 147
Commodity contract derivatives 57 — 57 (8) — 49
999 — 999 (242) (561) 196
Liabilities
Financing derivatives (767) — (767) 234 467 (66)
Commodity contract derivatives (132) — (132) 8 4 (120)
(899) — (899) 242 471 (186)
100 — 100 — (90) 10
Related amounts available to be offset but not offset in statement
of financial position
At 31 March 2020
Gross carrying
amounts£m
Grossamounts
offset£m
Net amountpresented instatement of
financialposition
£m
Financial instruments
£m
Cashcollateralreceived/pledged
£mNet amount
£m
Assets
Financing derivatives 1,267 — 1,267 (351) (694) 222
Commodity contract derivatives 75 — 75 (5) (3) 67
1,342 — 1,342 (356) (697) 289
Liabilities
Financing derivatives (1,134) — (1,134) 351 646 (137)
Commodity contract derivatives (200) — (200) 5 8 (187)
(1,334) — (1,334) 356 654 (324)
8 — 8 — (43) (35)
National Grid plc Annual Report and Accounts 2020/21 Financial Statements
Notes to the consolidated financial statementscontinued
192

32. Financial risk management continued(b) Liquidity riskOur policy is to determine our liquidity requirements by the use of both short-term and long-term cash flow forecasts. These forecasts are supplemented by a financial headroom analysis which is used to assess funding requirements for at least a 24-month period and maintain adequate liquidity for a continuous 12-month period.
We believe our contractual obligations, including those shown in commitments and contingencies in note 30, can be met from existing cash and investments, operating cash flows and other financing that we reasonably expect to be able to secure in the future, together with the use of committed facilities if required.
Our debt agreements and banking facilities contain covenants, including those relating to the periodic and timely provision of financial information by the issuing entity, restrictions on disposals and financial covenants, such as restrictions on the level of subsidiary indebtedness. Failure to comply with these covenants, or to obtain waivers of those requirements, could in some cases trigger a right, at the lender’s discretion, to require repayment of some of our debt and may restrict our ability to draw upon our facilities or access the capital markets.
The following is a payment profile of our financial liabilities and derivatives:
At 31 March 2021
Less than 1 year
£m
1 to 2 years
£m
2 to 3 years
£m
More than3 years
£mTotal
£m
Non-derivative financial liabilities
Borrowings, excluding lease liabilities (3,350) (1,690) (806) (25,562) (31,408)
Interest payments on borrowings¹ (810) (755) (731) (12,018) (14,314)
Lease liabilities (118) (108) (90) (599) (915)
Other non-interest-bearing liabilities (3,207) (350) — — (3,557)
Contingent consideration (40) (24) — — (64)
Derivative financial liabilities
Financing derivatives – receipts² 3,773 749 451 4,326 9,299
Financing derivatives – payments² (3,899) (877) (533) (5,153) (10,462)
Commodity contract derivatives – receipts² 12 — — — 12
Commodity contract derivatives – payments² (83) (23) (14) (12) (132)
Derivative financial assets
Financing derivatives – receipts² 2,162 926 833 1,789 5,710
Financing derivatives – payments² (1,700) (834) (780) (1,536) (4,850)
Commodity contract derivatives – receipts² 21 4 1 1 27
Commodity contract derivatives – payments² (21) (4) (2) — (27)
(7,260) (2,986) (1,671) (38,764) (50,681)
At 31 March 2020
Less than 1 year
£m
1 to 2 years
£m
2 to 3 years
£m
More than 3 years
£mTotal
£m
Non-derivative financial liabilities
Borrowings, excluding lease liabilities (3,672) (2,150) (1,611) (22,214) (29,647)
Interest payments on borrowings¹ (765) (750) (714) (12,002) (14,231)
Lease liabilities (132) (114) (99) (629) (974)
Other non-interest-bearing liabilities (3,149) (318) — — (3,467)
Contingent consideration (32) (16) (32) (16) (96)
Derivative financial liabilities
Financing derivatives – receipts² 2,249 986 1,208 3,510 7,953
Financing derivatives – payments² (2,582) (1,136) (1,463) (4,067) (9,248)
Commodity contract derivatives – receipts² 4 2 — — 6
Commodity contract derivatives – payments² (116) (50) (24) (12) (202)
Derivative financial assets
Financing derivatives – receipts² 2,469 1,063 570 1,775 5,877
Financing derivatives – payments² (2,271) (527) (375) (1,478) (4,651)
Commodity contract derivatives – receipts² 20 1 1 — 22
Commodity contract derivatives – payments² (21) — — — (21)
(7,998) (3,009) (2,539) (35,133) (48,679)
1. The interest on borrowings is calculated based on borrowings held at 31 March without taking account of future issues. Floating rate interest is estimated using a forward interest rate curve as at 31 March. Payments are included on the basis of the earliest date on which the Company can be required to settle.
2. The receipts and payments line items for derivatives comprise gross undiscounted future cash flows, after considering any contractual netting that applies within individual contracts. Where cash receipts and payments within a derivative contract are settled net, and the amount to be received/(paid) exceeds the amount to be paid/(received), the net amount is presented within derivative receipts/(payments).
National Grid plc Annual Report and Accounts 2020/21 Financial Statements | Notes to the consolidated financial statements
193
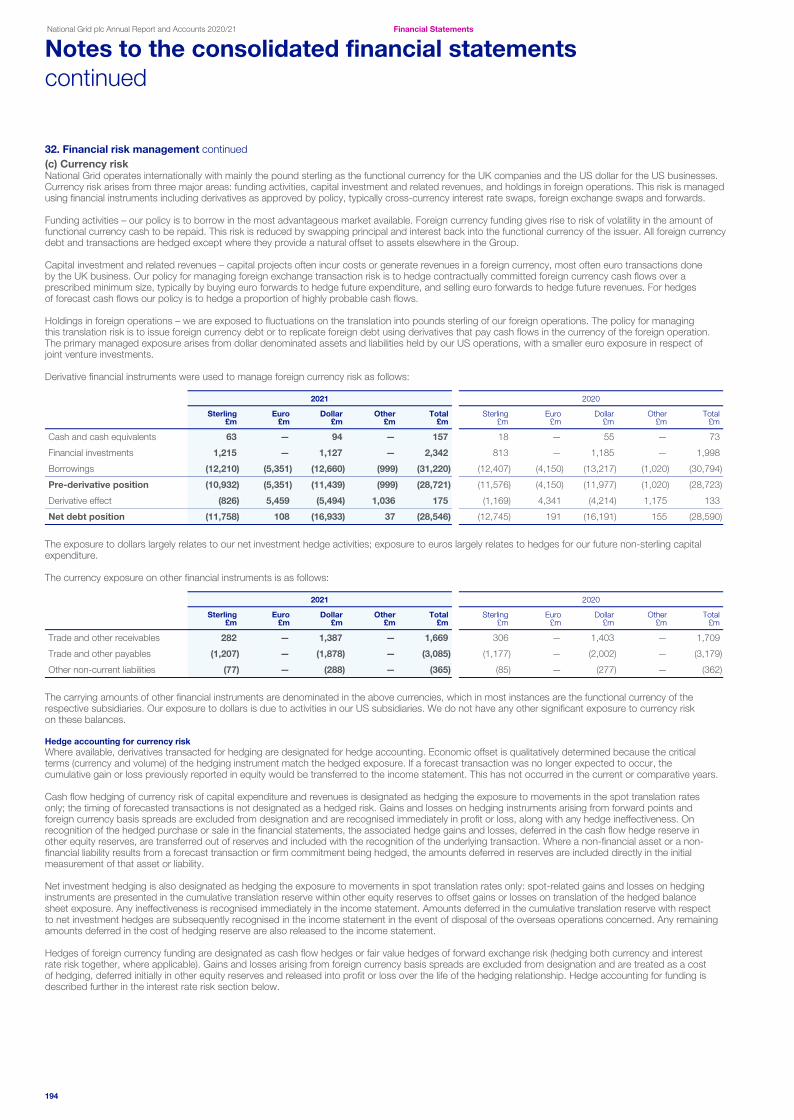
32. Financial risk management continued(c) Currency riskNational Grid operates internationally with mainly the pound sterling as the functional currency for the UK companies and the US dollar for the US businesses. Currency risk arises from three major areas: funding activities, capital investment and related revenues, and holdings in foreign operations. This risk is managed using financial instruments including derivatives as approved by policy, typically cross-currency interest rate swaps, foreign exchange swaps and forwards.
Funding activities – our policy is to borrow in the most advantageous market available. Foreign currency funding gives rise to risk of volatility in the amount of functional currency cash to be repaid. This risk is reduced by swapping principal and interest back into the functional currency of the issuer. All foreign currency debt and transactions are hedged except where they provide a natural offset to assets elsewhere in the Group.
Capital investment and related revenues – capital projects often incur costs or generate revenues in a foreign currency, most often euro transactions done by the UK business. Our policy for managing foreign exchange transaction risk is to hedge contractually committed foreign currency cash flows over a prescribed minimum size, typically by buying euro forwards to hedge future expenditure, and selling euro forwards to hedge future revenues. For hedges of forecast cash flows our policy is to hedge a proportion of highly probable cash flows.
Holdings in foreign operations – we are exposed to fluctuations on the translation into pounds sterling of our foreign operations. The policy for managing this translation risk is to issue foreign currency debt or to replicate foreign debt using derivatives that pay cash flows in the currency of the foreign operation. The primary managed exposure arises from dollar denominated assets and liabilities held by our US operations, with a smaller euro exposure in respect of joint venture investments.
Derivative financial instruments were used to manage foreign currency risk as follows:
2021 2020
Sterling£m
Euro£m
Dollar£m
Other£m
Total£m
Sterling£m
Euro£m
Dollar£m
Other£m
Total£m
Cash and cash equivalents 63 — 94 — 157 18 — 55 — 73
Financial investments 1,215 — 1,127 — 2,342 813 — 1,185 — 1,998
Borrowings (12,210) (5,351) (12,660) (999) (31,220) (12,407) (4,150) (13,217) (1,020) (30,794)
Pre-derivative position (10,932) (5,351) (11,439) (999) (28,721) (11,576) (4,150) (11,977) (1,020) (28,723)
Derivative effect (826) 5,459 (5,494) 1,036 175 (1,169) 4,341 (4,214) 1,175 133
Net debt position (11,758) 108 (16,933) 37 (28,546) (12,745) 191 (16,191) 155 (28,590)
The exposure to dollars largely relates to our net investment hedge activities; exposure to euros largely relates to hedges for our future non-sterling capital expenditure.
The currency exposure on other financial instruments is as follows:
2021 2020
Sterling£m
Euro£m
Dollar£m
Other£m
Total£m
Sterling£m
Euro£m
Dollar£m
Other£m
Total£m
Trade and other receivables 282 — 1,387 — 1,669 306 — 1,403 — 1,709
Trade and other payables (1,207) — (1,878) — (3,085) (1,177) — (2,002) — (3,179)
Other non-current liabilities (77) — (288) — (365) (85) — (277) — (362)
The carrying amounts of other financial instruments are denominated in the above currencies, which in most instances are the functional currency of the respective subsidiaries. Our exposure to dollars is due to activities in our US subsidiaries. We do not have any other significant exposure to currency risk on these balances.
Hedge accounting for currency riskWhere available, derivatives transacted for hedging are designated for hedge accounting. Economic offset is qualitatively determined because the critical terms (currency and volume) of the hedging instrument match the hedged exposure. If a forecast transaction was no longer expected to occur, the cumulative gain or loss previously reported in equity would be transferred to the income statement. This has not occurred in the current or comparative years.
Cash flow hedging of currency risk of capital expenditure and revenues is designated as hedging the exposure to movements in the spot translation rates only; the timing of forecasted transactions is not designated as a hedged risk. Gains and losses on hedging instruments arising from forward points and foreign currency basis spreads are excluded from designation and are recognised immediately in profit or loss, along with any hedge ineffectiveness. On recognition of the hedged purchase or sale in the financial statements, the associated hedge gains and losses, deferred in the cash flow hedge reserve in other equity reserves, are transferred out of reserves and included with the recognition of the underlying transaction. Where a non-financial asset or a non-financial liability results from a forecast transaction or firm commitment being hedged, the amounts deferred in reserves are included directly in the initial measurement of that asset or liability.
Net investment hedging is also designated as hedging the exposure to movements in spot translation rates only: spot-related gains and losses on hedging instruments are presented in the cumulative translation reserve within other equity reserves to offset gains or losses on translation of the hedged balance sheet exposure. Any ineffectiveness is recognised immediately in the income statement. Amounts deferred in the cumulative translation reserve with respect to net investment hedges are subsequently recognised in the income statement in the event of disposal of the overseas operations concerned. Any remaining amounts deferred in the cost of hedging reserve are also released to the income statement.
Hedges of foreign currency funding are designated as cash flow hedges or fair value hedges of forward exchange risk (hedging both currency and interest rate risk together, where applicable). Gains and losses arising from foreign currency basis spreads are excluded from designation and are treated as a cost of hedging, deferred initially in other equity reserves and released into profit or loss over the life of the hedging relationship. Hedge accounting for funding is described further in the interest rate risk section below.
National Grid plc Annual Report and Accounts 2020/21 Financial Statements
Notes to the consolidated financial statementscontinued
194

32. Financial risk management continued(d) Interest rate riskNational Grid’s interest rate risk arises from our long-term borrowings. Our interest rate risk management policy is to seek to minimise total financing costs (being interest costs and changes in the market value of debt). Hedging instruments principally consist of interest rate and cross-currency swaps that are used to translate foreign currency debt into functional currency and to adjust the proportion of fixed-rate and floating-rate in the borrowings portfolio to within a range set by the Finance Committee of the Board. The benchmark interest rates hedged are currently based on LIBOR.
LIBOR is being replaced as an interest rate benchmark by alternative reference rates in certain currencies including our functional currencies, USD and GBP, and foreign currencies in which we operate. This impacts contracts including financial liabilities that pay LIBOR-based cash flows, and derivatives that receive or pay LIBOR-based cash flows. The change in benchmark also affects discount rates which will impact the valuations of certain liabilities. We have disclosed our exposure to LIBOR on our derivative portfolio in note 17, on our borrowings in note 21 and on our hedging arrangements in note 32(e). We are managing the risk by planning to replace LIBOR cash flows with alternative reference rates on our affected contracts. The migration project is underway, with all affected contracts expected to be amended by 31 December 2021. As at 31 March 2021 no contracts had yet been amended. The Finance Committee of the Board have delegated to the treasury department the authority to determine which benchmarks are the most appropriate. A combination of LIBOR and the successor benchmarks, primarily GBP Sterling Overnight Index Average (SONIA) and USD Secured Overnight Financing Rate (SOFR) will be used in the portfolio during the migration period.
We also consider inflation risk and hold some inflation-linked borrowings. We believe that these provide a partial economic offset to the inflation risk associated with our UK inflation-linked revenues.
The table in note 21 sets out the carrying amount, by contractual maturity, of borrowings that are exposed to interest rate risk before taking into account interest rate swaps.
Net debt was managed using derivative financial instruments to hedge interest rate risk as follows:
2021 2020
Fixed rate£m
Floatingrate£m
Inflationlinked
£mOther1
£mTotal
£mFixed rate
£m
Floatingrate£m
Inflationlinked
£mOther1
£mTotal
£m
Cash and cash equivalents 64 67 — 26 157 71 10 — (8) 73
Financial investments — 2,309 — 33 2,342 — 1,966 — 32 1,998
Borrowings (23,163) (1,762) (6,295) — (31,220) (20,969) (3,085) (6,740) — (30,794)
Pre-derivative position (23,099) 614 (6,295) 59 (28,721) (20,898) (1,109) (6,740) 24 (28,723)
Derivative effect 2,869 (2,511) (183) — 175 2,259 (1,892) (234) — 133
Net debt position (20,230) (1,897) (6,478) 59 (28,546) (18,639) (3,001) (6,974) 24 (28,590)
1. Represents financial instruments which are not directly affected by interest rate risk, such as investments in equity or other similar financial instruments.
Hedge accounting for interest rate riskBorrowings paying variable or floating-rates expose National Grid to cash flow interest rate risk, partially offset by cash held at variable rates. Where a hedging instrument results in paying a fixed-rate, it is designated as a cash flow hedge because it has reduced the cash flow volatility of the hedged borrowing. Changes in the fair value of the derivative are initially recognised in other comprehensive income as gains or losses in the cash flow hedge reserve, with any ineffective portion recognised immediately in the income statement.
Borrowings paying fixed-rates expose National Grid to fair value interest rate risk. Where the hedging instrument pays a floating-rate, it is designated as a fair value hedge because it has reduced the fair value volatility of the borrowing. Changes in the fair value of the derivative and changes in the fair value of the hedged item in relation to the risk being hedged are both adjusted on the balance sheet and offset in the income statement to the extent the fair value hedge is effective, with the residual difference remaining as ineffectiveness.
Both types of hedges are designated as hedging the currency and interest rate risk arising from changes in forward points. Amounts accumulated in the cash flow hedge reserve (cash flow hedges only) and the deferred cost of hedging reserve (both cash flow and fair value hedges) are reclassified from reserves to the income statement on a systematic basis as hedged interest expense is recognised. Adjustments made to the carrying value of hedged items in fair value hedges are similarly released to the income statement to match the timing of the hedged interest expense.
When hedge accounting is discontinued, any remaining cumulative hedge accounting balances continue to be released to the income statement to match the impact of outstanding hedged items. Any remaining amounts deferred in the cost of hedging reserve are released immediately to the income statement as finance costs.
The Group early-adopted Phase I of IFRS Interest Rate Benchmark Reform amendments related to hedge accounting with effect from 1 April 2019, and Phase II with effect from 1 April 2020. The amendments impact our fair value hedging relationships where derivative cash flows will be transitioned from paying LIBOR to paying an alternative reference rate. The hedged risk must be re-documented to reflect this, and allow existing hedge designations to continue unchanged during the period of uncertainty relating to the timing and method of benchmark migrations.
The amendments will be applied until the earliest point in time of the Group’s contracts that reference LIBOR being amended, the hedging relationship being formally discontinued or formal market conventions ending uncertainty being published and widely adopted. If amended cash flows do not cause a hedging relationship to be discontinued, then the amendments will cease to be applied only when that relationship is discontinued under IFRS 9.
The IFRS amendments impact fair value and cash flow hedges of interest rate risk and related hedging instruments, and certain net investment hedges that use cross-currency interest rate swaps to pay a foreign currency floating rate and receive a functional currency floating rate. The notional values of hedging instruments, for each type of hedging relationship impacted, are shown in the hedge accounting tables in note 32(e). These amounts also correspond to the exposures designated as hedged.
National Grid plc Annual Report and Accounts 2020/21 Financial Statements | Notes to the consolidated financial statements
195

32. Financial risk management continued(e) Hedge accountingIn accordance with the requirements of IFRS 7, certain additional information about hedge accounting is disaggregated by risk type and hedge designation type in the tables below:
Year ended 31 March 2021
Fair value hedges of foreign currency and interest rate
risk
Cash flow hedges of foreign currency and
interest rate riskCash flow hedges of foreign currency risk Net investment hedges
£m £m £m £m
Consolidated statement of comprehensive income
Net gains/(losses) in respect of:
Cash flow hedges — 14 (14) —
Cost of hedging (15) (24) — 50
Transferred to profit or loss in respect of:
Cash flow hedges — 56 — —
Cost of hedging 1 2 — —
Consolidated statement of changes in equity
Other equity reserves – cost of hedging balances (11) (30) — 6
Consolidated statement of financial position
Derivatives – carrying value of hedging instruments¹
Assets – current — 10 2 5
Assets – non-current 187 59 1 140
Liabilities – current — (12) (24) (17)
Liabilities – non-current (113) (255) (22) —
Profiles of the significant timing, price and rate information of hedging instruments
Maturity range Jan 2023 – Jan 2043 Sep 2021 – Nov 2040 Apr 2021 – Feb 2027 Mar 2022 – Sep 2027
Spot foreign exchange range:
GBP:USD 1.64 1.30 – 1.66 1.31 – 1.41 1.22 – 1.40
GBP:EUR 1.11 – 1.24 1.08 – 1.24 1.04 – 1.29 1.15 – 1.16
EUR:USD 1.13 – 1.17 1.13 – 1.14 n/a n/a
Interest rate range:
GBP LIBOR +30bps/+408bps 0.976% – 5.845% n/a n/a
USD LIBOR +68bps/+115bps 2.513% – 3.864% n/a n/a
1. The use of derivatives may entail a derivative transaction qualifying for more than one hedge type designation under IFRS 9. Therefore, the derivative amounts in the table above are grossed up by hedge type, whereas they are presented net at an instrument level in the statement of financial position.
National Grid plc Annual Report and Accounts 2020/21 Financial Statements
Notes to the consolidated financial statementscontinued
196

32. Financial risk management continued(e) Hedge accounting continued
Year ended 31 March 2020
Fair value hedges of foreign currency and interest rate risk
Cash flow hedges of foreign currency and interest rate
riskCash flow hedges of foreign
currency risk Net investment hedges£m £m £m £m
Consolidated statement of comprehensive income
Net losses in respect of:
Cash flow hedges — (143) (17) —
Cost of hedging 5 (7) — (30)
Transferred to profit or loss in respect of:
Cash flow hedges — 14 — —
Cost of hedging 1 (1) — (45)
Consolidated statement of changes in equity
Other equity reserves – cost of hedging balances 2 (8) — (43)
Consolidated statement of financial position
Derivatives – carrying value of hedging instruments¹
Assets – current 1 — 4 9
Assets – non-current 247 106 8 —
Liabilities – current (1) (105) (8) (82)
Liabilities – non-current (39) (264) (12) (19)
Profiles of the significant timing, price and rate information of hedging instruments
Maturity range May 2020 – Feb 2040 Jul 2020 – Dec 2039 Apr 2020 – Dec 2024 Jun 2020 – Sep 2027
Spot foreign exchange range:
GBP:USD 1.64 1.30 – 1.66 1.24 – 1.41 1.21 – 1.49
GBP:EUR 1.19 – 1.24 1.10 – 1.24 1.04 – 1.30 1.14
EUR:USD 1.13 – 1.17 1.13 – 1.14 n/a n/a
Interest rate range:
GBP LIBOR +30bps/+408bps 1.331% – 5.850% n/a n/a
USD LIBOR –44bps/+115bps 1.103% – 3.864% n/a n/a
1. The use of derivatives may entail a derivative transaction qualifying for more than one hedge type designation under IFRS 9. Therefore, the derivative amounts in the table above are grossed up by hedge type, whereas they are presented net at an instrument level in the statement of financial position.
National Grid plc Annual Report and Accounts 2020/21 Financial Statements | Notes to the consolidated financial statements
197

32. Financial risk management continued(e) Hedge accounting continuedThe following tables show the effects of hedge accounting on financial position and year-to-date performance for each type of hedge. These tables also present notional values of hedging instruments (and equal hedged exposures) impacted by IFRS 9 Interest Rate Benchmark Reform amendments.
(i) Fair value hedges of foreign currency and interest rate risk on recognised borrowings:
As at 31 March 2021Balance of fair value hedge adjustments in borrowings
Change in value used for calculating ineffectiveness
Hedging instrument notional
Continuing hedges
Discontinued hedges Hedged item
Hedging instrument
Hedge ineffectiveness
Hedge type £m £m £m £m £m £m
Foreign currency and interest rate risk on borrowings1,2 (2,755) 121 (85) 153 (127) 26
1. The carrying value of the hedged borrowings is £2,714 million, of which £nil is current and £2,714 million is non-current.2. Included within the hedging instrument notional balance is £2,679 million impacted by Interest Rate Benchmark Reform amendments.
As at 31 March 2020Balance of fair value hedge adjustments in borrowings
Change in value used for calculating ineffectiveness
Hedging instrument notional
Continuing hedges
Discontinued hedges Hedged item
Hedging instrument
Hedge ineffectiveness
Hedge type £m £m £m £m £m £m
Foreign currency and interest rate risk on borrowings1,2 (1,751) (31) (95) (42) 48 6
1. The carrying value of the hedged borrowings was £1,883 million, of which £72 million was current and £1,811 million was non-current.2. Included within the hedging instrument notional balance was £1,675 million impacted by Interest Rate Benchmark Reform amendments.
(ii) Cash flow hedges of foreign currency and interest rate risk:
As at 31 March 2021Balance in cash flow hedge
reserveChange in value used for
calculating ineffectiveness
Hedging instrument notional
Continuing hedges
Discontinued hedges Hedged item
Hedging instrument
Hedge ineffectiveness
Hedge type £m £m £m £m £m £m
Foreign currency and interest rate risk on borrowings¹ (4,884) (11) (6) (16) 16 —
Foreign currency risk on forecasted cash flows (988) (31) 3 17 (17) —
1. Included within the hedging instrument notional balance is £176 million impacted by Interest Rate Benchmark Reform amendments.
As at 31 March 2020 Balance in cash flow hedge reserveChange in value used for calculating ineffectiveness
Hedging instrument notional
Continuing hedges
Discontinued hedges Hedged item
Hedging instrument
Hedge ineffectiveness
Hedge type £m £m £m £m £m £m
Foreign currency and interest rate risk on borrowings¹ (4,127) (69) (22) 142 (143) (1)
Foreign currency risk on forecasted cash flows (794) 8 — 17 (17) —
1. Included within the hedging instrument notional balance was £176 million impacted by Interest Rate Benchmark Reform amendments.
(iii) Net investment hedges of foreign currency risk:
As at 31 March 2021 Balance in translation reserveChange in value used for
calculating ineffectiveness
Hedging instrument notional
Continuing hedges
Discontinued hedges Hedged item
Hedging instrument
Hedge ineffectiveness
Hedge type £m £m £m £m £m £m
Currency risk on foreign operations¹ (2,786) 183 (2,826) (183) 183 —
1. Included within the hedging instrument notional balance is £nil impacted by Interest Rate Benchmark Reform amendments.
As at 31 March 2020 Balance in translation reserveChange in value used for calculating ineffectiveness
Hedging instrument notional
Continuing hedges
Discontinued hedges Hedged item
Hedging instrument
Hedge ineffectiveness
Hedge type £m £m £m £m £m £m
Currency risk on foreign operations¹ (3,064) 45 (2,871) (6) 6 —
1. Included within the hedging instrument notional balance was £nil impacted by Interest Rate Benchmark Reform amendments.
National Grid plc Annual Report and Accounts 2020/21 Financial Statements
Notes to the consolidated financial statementscontinued
198

32. Financial risk management continued(f) Commodity price riskWe purchase electricity and gas to supply our customers in the US and to meet our own energy needs. Substantially all our costs of purchasing electricity and gas for supply to customers are recoverable at an amount equal to cost. The timing of recovery of these costs can vary between financial periods leading to an under- or over-recovery within any particular year that can lead to large fluctuations in the income statement. We follow approved policies to manage price and supply risks for our commodity activities.
Our energy procurement risk management policy and delegations of authority govern our US commodity trading activities for energy transactions. The purpose of this policy is to ensure we transact within pre-defined risk parameters and only in the physical and financial markets where we or our customers have a physical market requirement. In addition, state regulators require National Grid to manage commodity risk and cost volatility prudently through diversified pricing strategies. In some jurisdictions we are required to file a plan outlining our strategy to be approved by regulators. In certain cases, we might receive guidance with regard to specific hedging limits.
Energy purchase contracts for the forward purchase of electricity or gas that are used to satisfy physical delivery requirements to customers, or for energy that the Group uses itself, meet the expected purchase or usage requirements of IFRS 9. They are, therefore, not recognised in the financial statements until they are realised. Disclosure of commitments under such contracts is made in note 30.
US states have introduced a variety of legislative requirements with the aim of increasing the proportion of our electricity that is derived from renewable or other forms of clean energy. Annual compliance filings regarding the level of Renewable Energy Certificates (and other similar environmental certificates) are required by the relevant department of utilities. In response to the legislative requirements, National Grid has entered into long-term, typically fixed-price, energy supply contracts to purchase both renewable energy and environmental certificates. We are entitled to recover all costs incurred under these contracts through customer billing.
Under IFRS, where these supply contracts are not accounted for as leases, they are considered to comprise two components, being a forward purchase of power at spot prices, and a forward purchase of environmental certificates at a variable price (being the contract price less the spot power price). With respect to our current contracts, neither of these components meets the requirement to be accounted for as a derivative. The environmental certificates are currently required for compliance purposes, and at present there are no liquid markets for these attributes. Accordingly, this component meets the expected purchase or usage exemption of IFRS 9. We expect to enter into an increasing number of these contracts, in order to meet our compliance requirements in the short to medium term. In future, if and when liquid markets develop, and to the extent that we are in receipt of environmental certificates in excess of our required levels, this exemption may cease to apply, and we may be required to account for forward purchase commitments for environmental certificates as derivatives at fair value through profit and loss.
National Grid plc Annual Report and Accounts 2020/21 Financial Statements | Notes to the consolidated financial statements
199

32. Financial risk management continued(g) Fair value analysisIncluded in the statement of financial position are financial instruments which are measured at fair value. These fair values can be categorised into hierarchy levels that are representative of the inputs used in measuring the fair value. The best evidence of fair value is a quoted price in an actively traded market. In the event that the market for a financial instrument is not active, a valuation technique is used.
2021 2020
Level 1£m
Level 2£m
Level 3£m
Total£m
Level 1£m
Level 2£m
Level 3£m
Total£m
Assets
Investments held at FVTPL 1,768 — 240 2,008 1,278 — 108 1,386
Investments held at FVOCI 99 416 — 515 83 352 — 435
Investments in associates — — — — — — 103 103
Financing derivatives — 942 — 942 — 1,257 10 1,267
Commodity contract derivatives — 12 45 57 — 9 66 75
1,867 1,370 285 3,522 1,361 1,618 287 3,266
Liabilities
Financing derivatives — (584) (183) (767) — (889) (245) (1,134)
Commodity contract derivatives — (75) (57) (132) — (136) (64) (200)
Liabilities held at fair value (682) — — (682) (741) — — (741)
Contingent consideration1 — — (57) (57) — — (74) (74)
(682) (659) (297) (1,638) (741) (1,025) (383) (2,149)
1,185 711 (12) 1,884 620 593 (96) 1,117
1. Contingent consideration relates to the acquisition of National Grid Renewables (see note 38).
Level 1: Financial instruments with quoted prices for identical instruments in active markets.
Level 2: Financial instruments with quoted prices for similar instruments in active markets or quoted prices for identical or similar instruments in inactive markets, and financial instruments valued using models where all significant inputs are based directly or indirectly on observable market data.
Level 3: Financial instruments valued using valuation techniques where one or more significant inputs are based on unobservable market data.
Our Level 1 financial investments and liabilities held at fair value are valued using quoted prices from liquid markets.
Our Level 2 financial investments held at fair value are valued using quoted prices for similar instruments in active markets, or quoted prices for identical or similar instruments in inactive markets. Alternatively, they are valued using models where all significant inputs are based directly or indirectly on observable market data.
Our Level 2 financing derivatives include cross-currency, interest rate and foreign exchange derivatives. We value these by discounting all future cash flows by externally sourced market yield curves at the reporting date, taking into account the credit quality of both parties. These derivatives can be priced using liquidly traded interest rate curves and foreign exchange rates, and therefore we classify our vanilla trades as Level 2 under the IFRS 13 framework. One FX forward transacted in the year contains deal-contingent terms linked to the sale of NECO. As at the reporting date, these terms have no material impact on the valuation. This will be re-assessed at each relevant reporting date.
Our Level 2 commodity contract derivatives include over-the-counter gas and power swaps as well as forward physical gas deals. We value our contracts based on market data obtained from the New York Mercantile Exchange (NYMEX) and the Intercontinental Exchange (ICE) where monthly prices are available. We discount based on externally sourced market yield curves at the reporting date, taking into account the credit quality of both parties and liquidity in the market. Our commodity contracts can be priced using liquidly traded swaps. Therefore, we classify our vanilla trades as Level 2 under the IFRS 13 framework.
Our Level 3 financing derivatives include cross-currency swaps, inflation-linked swaps and equity options, where the market is illiquid. In valuing these instruments, we use in-house valuation models and obtain external valuations to support each reported fair value.
Our Level 3 commodity contract derivatives primarily consist of our forward purchases of electricity and gas that we value using proprietary models. Derivatives are classified as Level 3 where significant inputs into the valuation technique are neither directly nor indirectly observable (including our own data, which are adjusted, if necessary, to reflect the assumptions market participants would use in the circumstances).
Our Level 3 investments include equity instruments accounted for at fair value through profit and loss. These equity holdings are part of our corporate venture capital portfolio held by National Grid Partners and comprise a series of small unquoted investments where prices or valuation inputs are unobservable. These investments are either recently acquired or there have been recent funding rounds with third parties and therefore the valuation is based on the latest transaction price and any subsequent investment-specific adjustments.
Our Level 3 investments also include our investment in Sunrun Neptune 2016 LLC, which is accounted for at fair value through profit and loss. The investment is fair valued by discounting expected cash flows using a weighted average cost of capital specific to Sunrun Neptune 2016 LLC.
In light of the current ongoing impact of the COVID-19 pandemic, the valuations of certain assets and liabilities can be more subjective. While there have been significant movements in market indices, we are satisfied that there has been no significant impact on the fair values of our financial instruments measured at fair value, and that any impact is reflected in the fair values in the table above.
National Grid plc Annual Report and Accounts 2020/21 Financial Statements
Notes to the consolidated financial statementscontinued
200

32. Financial risk management continued(g) Fair value analysis continued The changes in value of our Level 3 financial instruments are as follows:
Financing derivativesCommodity contract
derivatives Other3 Total
2021 2020 2021 2020 2021 2020 2021 2020£m £m £m £m £m £m £m £m
At 1 April (235) (214) 2 1 137 152 (96) (61)
Net gains/(losses) for the year1,2 51 (20) (16) 6 (2) 26 33 12
Purchases — — (1) 26 32 51 31 77
Acquisition of National Grid Renewables — — — — — (74) — (74)
Settlements 1 (1) (1) (31) 16 (18) 16 (50)
Reclassification to held for sale (note 10) — — 4 — — — 4 —
At 31 March (183) (235) (12) 2 183 137 (12) (96)
1. Gain of £51 million (2020: £20 million loss) is attributable to derivative financial instruments held at the end of the reporting period and has been recognised in finance costs in the income statement.
2. Loss of £46 million (2020: £17 million loss) is attributable to commodity contract derivative financial instruments held at the end of the reporting period.3. Other comprises our investments in Sunrun Neptune 2016 LLC and the investments made by National Grid Partners, which are accounted for at fair value through profit and loss as well as the
contingent consideration arising from the acquisition of National Grid Renewables (see note 38).
The impacts on a post-tax basis of reasonably possible changes in significant Level 3 assumptions are as follows:
Financing derivatives Commodity contract derivatives Other3
2021 2020 2021 2020 2021 2020£m £m £m £m £m £m
10% increase in commodity prices¹ — — 3 2 — —
10% decrease in commodity prices¹ — — (1) — — —
+10% market area price change — — (4) (4) — —
-10% market area price change — — 7 4 — —
+20 basis points change in Limited Price Inflation (LPI) market curve² (83) (95) — — — —
-20 basis points change in LPI market curve² 83 90 — — — —
+50 basis points change in discount rate — — — — (5) (3)
-50 basis points change in discount rate — — — — 5 4
1. Level 3 commodity price sensitivity is included within the sensitivity analysis disclosed in note 35.2. A reasonably possible change in assumption of other Level 3 derivative financial instruments is unlikely to result in a material change in fair values.3. The investments acquired in the period were on market terms, and sensitivity is considered insignificant at 31 March 2021.
The impacts disclosed above were considered on a contract-by-contract basis with the most significant unobservable inputs identified.
National Grid plc Annual Report and Accounts 2020/21 Financial Statements | Notes to the consolidated financial statements
201

32. Financial risk management continued(h) Capital risk managementThe capital structure of the Group consists of shareholders’ equity, as disclosed in the consolidated statement of changes in equity, and net debt (note 29). National Grid’s objectives when managing capital are: to safeguard our ability to continue as a going concern; to remain within regulatory constraints of our regulated operating companies; and to maintain an efficient mix of debt and equity funding thus achieving an optimal capital structure and cost of capital. We regularly review and manage the capital structure as appropriate in order to achieve these objectives.
Maintaining appropriate credit ratings for our operating and holding companies is an important aspect of our capital risk management strategy and balance sheet efficiency. We monitor our balance sheet efficiency using several metrics including retained cash flow/net debt (RCF), regulatory gearing and interest cover. For the year ended 31 March 2021, these metrics for the Group were 6.6% (2020: 9.2%), 65% (2020: 63%) and 4.5x (2020: 4.1x), respectively – see pages 30 and 254 – 255. We believe these are consistent with the current credit ratings for National Grid plc in respect of the main companies of the Group, based on guidance from the rating agencies.
We monitor the RAV gearing within NGET and the regulated transmission businesses within NGG. This is calculated as net debt expressed as a percentage of RAV, and indicates the level of debt employed to fund our UK regulated businesses. It is compared with the level of RAV gearing indicated by Ofgem as being appropriate for these businesses, at around 60% to 62.5%. We also monitor net debt as a percentage of rate base for our US operating companies, comparing this with the allowed rate base gearing inherent within each of our agreed rate plans, typically around 50%.
The majority of our regulated operating companies in the US and the UK are subject to certain restrictions on the payment of dividends by administrative order, contract and/or licence. The types of restrictions that a company may have that would prevent a dividend being declared or paid unless they are met include:• dividends must be approved in advance by the relevant US state regulatory commission;• the subsidiary must have at least two recognised rating agency credit ratings of at least investment grade;• dividends must be limited to cumulative retained earnings, including pre-acquisition retained earnings;• the securities of National Grid plc must maintain an investment grade credit rating, and if that rating is the lowest investment grade bond rating it cannot
have a negative watch/review for downgrade notice by a credit rating agency;• the subsidiary must not carry on any activities other than those permitted by the licences;• the subsidiary must not create any cross-default obligations or give or receive any intra-group cross-subsidies; and• the percentage of equity compared with total capital of the subsidiary must remain above certain levels.
There is a further restriction relating only to NECO, which is required to maintain its consolidated net worth above certain levels.
These restrictions are subject to alteration in the US as and when a new rate case or rate plan is agreed with the relevant regulatory bodies for each operating company and in the UK through the normal licence review process.
As most of our business is regulated, at 31 March 2021 the majority of our net assets are subject to some of the restrictions noted above. These restrictions are not considered to be significantly onerous, nor do we currently expect they will prevent the planned payment of dividends in future in line with our dividend policy.
All the above requirements are monitored on a regular basis in order to ensure compliance. The Group has complied with all externally imposed capital requirements to which it is subject.
National Grid plc Annual Report and Accounts 2020/21 Financial Statements
Notes to the consolidated financial statementscontinued
202

33. Borrowing facilities
To support our liquidity requirements and provide backup to commercial paper and other borrowings, we agree committed credit facilities with financial institutions over and above the value of borrowings that may be required. These committed credit facilities have never been drawn, and our undrawn amounts are listed below.
At 31 March 2021, we had bilateral committed credit facilities of £5,410 million (2020: £5,495 million). In addition, we had committed credit facilities from syndicates of banks of £115 million at 31 March 2021 (2020: £277 million). All committed credit facilities were undrawn in 2021 and 2020. An analysis of the maturity of these undrawn committed facilities is shown below:
2021 2020£m £m
Undrawn committed borrowing facilities expiring:
Less than 1 year — —
In 1 to 2 years 1,668 1,940
In 2 to 3 years 534 1,668
In 3 to 4 years 1,718 277
In 4 to 5 years 1,605 1,887
More than 5 years — —
5,525 5,772
Of the unused facilities at 31 March 2021, £5,410 million (2020: £5,495 million) is available for liquidity purposes, while £115 million (2020: £277 million) is available as backup to specific US borrowings. £1,668 million of the undrawn bilateral facilities due to mature in one to two years, were renegotiated between 1 April 2021 and 19 May 2021, with an uplift in the amount committed to £1,861 million with new expiry dates to May 2024. Of the £534 million of undrawn committed borrowings facilities due to expire within two to three years, £150 million was renegotiated between 1 April 2021 and 19 May 2021, with the expiry extended by a further year to June 2024. £400 million of additional undrawn bilateral facilities were entered into subsequent to the year end with expiry dates in May 2024.
In addition, we have the following facilities which are not included in the table above:• for the separately regulated business of National Grid Electricity System Operator Limited, the Group has a facility of £550 million (2020: £550 million).
This facility is not available as Group general liquidity support;• the Group has Export Credit Agency (ECA) facilities totalling £1,345 million (2020: £901 million), of which £446 million (2020: £233 million) is undrawn; and• the Group has two new loan facilities in place relating to the acquisition of PPL Western Power Distribution Investments Limited (WPD) (see note 38).
A facility of £8,250 million (31 March 2020: £nil) to finance the consideration and a facility of £1,105 million (31 March 2020: £nil) to back up acquired debt which contains change of control provisions, of which £8,250 million and £1,105 million is undrawn. Subsequent to the year end the £1,105 million facility has been cancelled as waivers have been obtained by WPD in relation to the change of control clauses.
National Grid plc Annual Report and Accounts 2020/21 Financial Statements | Notes to the consolidated financial statements
203

34. Subsidiary undertakings, joint ventures and associates
While we present consolidated results in these financial statements as if we were one company, our legal structure is such that there are a number of different operating and holding companies that contribute to the overall result. This structure has evolved through acquisitions as well as regulatory requirements to have certain activities within separate legal entities.
Subsidiary undertakingsA list of the Group’s subsidiaries as at 31 March 2021 is given below. The entire share capital of subsidiaries is held within the Group except where the Group’s ownership percentages are shown. These percentages give the Group’s ultimate interest and therefore allow for the situation where subsidiaries are owned by partly owned intermediate subsidiaries. Where subsidiaries have different classes of shares, this is largely for historical reasons, and the effective percentage holdings given represent both the Group’s voting rights and equity holding. Shares in National Grid (US) Holdings Limited, National Grid (US) Investments 2 Limited, National Grid Hong Kong Limited, National Grid Luxembourg SARL and NGG Finance plc are held directly by National Grid plc. All other holdings in subsidiaries are owned by other subsidiaries within the Group. All subsidiaries are consolidated in the Group’s financial statements.
Principal Group companies are identified in bold. These companies are incorporated and principally operate in the countries under which they are shown. All entities incorporated in the United States are taxed in the United States on their worldwide income other than where indicated in the footnotes below. Other entities are tax resident in their jurisdiction of incorporation other than where indicated in the footnotes below.
Incorporated in England and WalesRegistered office: 1–3 Strand, London WC2N 5EH, UK (unless stated otherwise in footnotes).
Beegas Nominees LimitedBirch Sites LimitedCarbon Sentinel LimitedDroylsden Metering Services LimitedGridcom LimitedIcelink Interconnector LimitedLandranch LimitedLattice Group Employee Benefit Trust LimitedLattice Group LimitedLattice Group Trustees LimitedNatgrid LimitedNatGrid One Limited1
NatgridTW1 Limited1
National Grid Belgium Limited2*National Grid Blue Power Limited2*National Grid Carbon LimitedNational Grid Commercial Holdings LimitedNational Grid Distributed Energy LimitedNational Grid Electricity Group Trustee LimitedNational Grid Electricity System Operator LimitedNational Grid Electricity Transmission plcNational Grid Energy Metering LimitedNational Grid Four Limited2*National Grid Fourteen Limited2*National Grid Gas Holdings LimitedNational Grid Gas plcNational Grid Grain LNG LimitedNational Grid Holdings Limited1
National Grid Holdings One plcNational Grid IFA 2 LimitedNational Grid Interconnector Holdings LimitedNational Grid Interconnectors LimitedNational Grid International Limited1
National Grid Metering LimitedNational Grid North Sea Link LimitedNational Grid Offshore LimitedNational Grid Partners Limited
National Grid Plus LimitedNational Grid Property Holdings LimitedNational Grid Seventeen Limited2*National Grid Smart LimitedNational Grid TenNational Grid Thirty Five Limited2*National Grid Thirty Six LimitedNational Grid Twelve Limited1
National Grid Twenty Eight LimitedNational Grid Twenty-Five Limited2*National Grid Twenty Seven LimitedNational Grid Twenty Three Limited1
National Grid UK LimitedNational Grid UK Pension Services LimitedNational Grid (US) Holdings Limited1
National Grid (US) Investments 2 Limited1
National Grid (US) Investments 4 Limited1
National Grid (US) Partner 1 Limited1
National Grid Ventures LimitedNational Grid Viking Link LimitedNational Grid William LimitedNG Nominees LimitedNGC Employee Shares Trustee LimitedNGG Finance plcNgrid Intellectual Property LimitedNGT Telecom No. 1 Limited2*NGT Two LimitedPort Greenwich LimitedStargas Nominees LimitedSupergrid Electricity LimitedSupergrid Energy Transmission LimitedSupergrid LimitedThamesport Interchange LimitedThe National Grid Group Quest Trustee Company LimitedThe National Grid YouPlan Trustee LimitedTransco LimitedWarwick Technology Park Management Company (No 2) Limited (60.56%)3
1. Companies where National Grid plc has issued guarantees over the liabilities of the companies as at 31 March 2021 and for which the companies are taking the exemption from the requirements of an audit for their individual financial statements as permitted by section 479A of the Companies Act.
2. Registered office: c/o KPMG, 15 Canada Square, London E14 5GL, UK.3. Registered office: Shire Hall, PO Box 9, Warwick CV34 4RL, UK.
* In liquidation.
National Grid plc Annual Report and Accounts 2020/21 Financial Statements
Notes to the consolidated financial statementscontinued
204

34. Subsidiary undertakings, joint ventures and associates continuedSubsidiary undertakings continuedIncorporated in the USRegistered office: National Registered Agents, Inc., 1209 Orange Street, Wilmington, DE 19801, USA (unless stated otherwise in footnotes).
Agave Solar, LLCAltona Solar, LLCApple River Solar, LLCApple Solar, LLCArgenta Solar, LLCArmenia Solar, LLCArtemisia Solar, LLC1
Ashland Solar, LLC
Athens Solar, LLCAudubon Wind Farm, LLCAutauga Solar, LLCBaileyville Solar, LLC (previously Ellison Solar, LLC)**Banner Solar, LLCBazile Creek Wind Farm, LLCBee Hollow Solar, LLCBell Plaine Solar, LLCBenevolent Solar, LLCBirdsong Creek Solar, LLCBlack Bear Solar, LLCBlackhawk Solar, LLCBlaze Solar, LLC2
Blevins Solar, LLCBlue Ridge Wind, LLCBlue Spring Solar, LLCBlues Solar, LLCBluewater Solar, LLCBoone Solar, LLCBoston Gas Company3
Braeburn Solar, LLCBridges Solar, LLCBrilliance Solar, LLCBritish Transco Capital, Inc.4British Transco Finance, Inc.4Brock Solar, LLCBroken Bridge Corp.5Brook Trout Solar, LLCBT Noble Solar, LLC6
Bullsnake Solar, LLCBurley Solar, LLCBurlington Solar, LLCBurr Ridge Wind, LLCCage Ranch Solar, LLCCage Ranch Solar II, LLCCage Ranch Solar III, LLCCaldwell Solar, LLCCaldwell Solar II, LLCCameo Solar, LLCCanary Solar, LLCCanby Solar, LLCCarriere Solar, LLCCass Wind Farm, LLCCattle Ridge Wind Farm 2, LLCCedar Grove Solar, LLCCentennial Solar, LLCChewelah Solar, LLCClear Creek Solar, LLCClermont Solar, LLCClinton County Solar, LLCColes Solar, LLCCommonwealth Solar, LLCCompass Prairie Wind, LLCConeflower Solar, LLC1
Conestoga Wind, LLCCopperhead Solar, LLCCreekview Solar, LLCCrocker Wind Farm 2, LLCDahlia Solar, LLC1
Dakota Hills Wind Farm, LLCDay Lily Solar, LLC1
Deatsville Solar, LLCDeer Trail Solar, LLCDodson Creek Solar, LLC7
Donnellson Solar, LLCEast Galesburg Solar, LLCEast Macomb Solar, LLCEastern Hemlock Solar, LLCEatonville Solar, LLCElba Solar, LLCElburn Solar, LLCEldena Solar, LLCElk Creek Solar, LLCElk Creek Solar 2, LLCEUA Energy Investment Corporation3
Exie Solar, LLC
Falls City Solar, LLCFayette Solar, LLC8
Firstview Wind Farm, LLCFish Creek Solar, LLCForrest Solar, LLCFort Solar, LLCFowlkes Solar, LLCFront Range Wind Farm, LLCFulton Solar, LLCGala Solar, LLCGalesburg Solar, LLCGardenia Solar, LLC1
Genesee Solar Energy, LLCGillis Solar, LLCGlenwood Solar, LLCGolden Solar, LLCGoldendale Solar, LLCGoldenrod Wind Farm, LLCGoldfinch Solar, LLCGrand Junction Solar, LLCGranite State Power Link LLC4
Grant Solar, LLCGrant Solar 2, LLCGrayson Solar, LLCGreenbrier Creek Solar, LLCGreensky Solar, LLCGreenwood Solar, LLCGrid NY LLC9
Grindstone Wind Farm, LLC10
Hale County Solar, LLCHale Solar, LLCHampton Solar, LLCHansford Energy Storage, LLCHarmony Solar ND, LLCHarmony Solar ND 2, LLCHarrington Solar, LLCHartley Solar, LLCHearth Solar, LLCHeyworth Solar, LLCHill River Solar, LLCHoneybee Solar, LLCHoosier Solar, LLCHoskins Solar, LLCIllumination Solar, LLCInnovation Solar, LLCIrwin Solar, LLCItasca Energy Development, LLC1
Itasca Energy Services, LLCJackalope Solar, LLCJack Rabbit Wind, LLCJackson County Solar, LLCJantz Solar, LLCJonagold Solar, LLCJunction Solar, LLCKankakee Solar, LLCKeySpan CI Midstream Limited4
KeySpan Energy Corporation9
KeySpan Energy Services Inc.4KeySpan Gas East Corporation9
KeySpan International Corporation4
KeySpan MHK, Inc.4KeySpan Midstream Inc.4KeySpan Plumbing Solutions, Inc.9Kindle Solar, LLCKingsnake Solar, LLCKnox Solar, LLCKSI Contracting, LLC4
KSI Electrical, LLC4
KSI Mechanical, LLC4
Lake Charlotte Solar, LLCLake Iris Solar, LLCLakeside Solar, LLCLamdin Solar, LLCLand Management & Development, Inc.9Landwest, Inc.9Lansing Solar, LLCLawrence Solar, LLCLeola Wind Farm, LLCLiberty Solar, LLCLilac Solar, LLC1
Limestone Solar, LLCLind Solar, LLCLivingston County Solar, LLCLong Mount Solar, LLC
National Grid plc Annual Report and Accounts 2020/21 Financial Statements | Notes to the consolidated financial statements
205

34. Subsidiary undertakings, joint ventures and associates continuedSubsidiary undertakings continuedIncorporated in the US continued
Lordsburg Solar, LLCLouisa Solar, LLCLowlands Solar, LLCLydia Solar, LLCMacedonia Solar, LLCMadden Creek Solar, LLCMarion County Solar, LLCMassachusetts Electric Company3
Maverick Wind Farm, LLCMazon Solar, LLCMazon Solar 2, LLCMcFadden Solar, LLCMeadowlands Solar, LLCMerton Solar, LLCMetrowest Realty LLC4
Miller Creek Solar, LLCMillers Ferry Solar, LLCMoonrise Solar, LLCMorgan County Solar, LLCMorning Glory Solar, LLC1
Mountain Laurel Solar, LLCMuddy Creek Solar, LLCMustang Ridge Wind Farm, LLCMystic Steamship Corporation7
Nantucket Electric Company3
National Grid Algonquin LLC4
National Grid Connect Inc.4National Grid Development Holdings Corp.4National Grid Electric Services LLC9
National Grid Energy Management LLC4
National Grid Energy Services LLC4
National Grid Energy Trading Services LLC9
National Grid Engineering & Survey Inc.9National Grid Generation LLC9
National Grid Generation Ventures LLC11
National Grid Glenwood Energy Center, LLC4
National Grid IGTS Corp.9National Grid Insurance USA Ltd12
National Grid Islander East Pipeline LLC4
National Grid LNG GP LLC4
National Grid LNG LLC4
National Grid LNG LP LLC4
National Grid Millennium LLC4
National Grid NE Holdings 2 LLC3
National Grid North America Inc.4National Grid North East Ventures Inc.4National Grid Partners Inc.9National Grid Partners LLC4
National Grid Port Jefferson Energy Center LLC4
National Grid Renewables, LLC (previously NGV Emerald Acquisition Co., LLC)4National Grid Renewables Development, LLC (previously Geronimo Energy, LLC)National Grid Renewables E Wind, LLC (previously Geronimo E Wind LLC)1National Grid Renewables Operations, LLC4
National Grid Renewables Projects, LLC (previously Geronimo Solar Energy, LLC)1National Grid Renewables Stutsman, LLC (previously Geronimo Stutsman Wind Farm, LLC)National Grid Services Inc.4National Grid Transmission Services Corporation3
National Grid US 6 LLC4,†
National Grid US LLC4
National Grid USA4
National Grid USA Service Company, Inc.3NEES Energy, Inc.3New England Electric Transmission Corporation5
New England Energy Incorporated3
New England Hydro Finance Company, Inc. (53.704%)3New England Hydro-Transmission Corporation (53.704%)5New England Hydro-Transmission Electric Company, Inc. (53.704%)3New England Power Company3
Newport America Corporation13
Newton Solar, LLCNG Renewables Energy Marketing, LLC4
NG Renewables Energy Services, LLCNGNE LLC4
NGV Emerald Energy Venture Holdings, LLC4
NGV OSW Holdings, LLC4
NGV US Distributed Energy Inc.4NGV US, LLC (previously NGV Emerald Holdings, LLC)4NGV US Transmission Inc.4Niagara Mohawk Energy, Inc.4Niagara Mohawk Holdings, Inc.9Niagara Mohawk Power Corporation9
Niobrara Wind, LLCNM Properties, Inc.9Noble Storage, LLCNordic VOS, LLC
North Adair Solar, LLCNortheast Renewable Link LLC4
North East Transmission Co., Inc.4North Fork Wind, LLCNorth Rock Solar, LLCOnton Solar, LLCOpinac North America, Inc.4Oreana Solar, LLCParklawn Solar, LLCPatriotic Solar, LLCPearl River County Solar, LLCPennington Solar, LLCPeony Solar, LLCPhiladelphia Coke Co., Inc.4Pierce County Solar, LLCPike County Solar, LLCPinon Pine Solar, LLCPiper Solar, LLCPipestone Solar, LLCPlacedo Solar, LLCPleasant Plains Solar, LLCPlum Creek Wind Farm, LLCPlum Creek Wind Farm 2, LLCPortage Solar, LLCPort of the Islands North, LLC9
Prairie Oasis Solar, LLCPrairie Rose Wind 2, LLC1
Prosperity Wind Farm, LLCProsperity Wind Farm 2, LLCRadiance Solar, LLC1
Red Rock Solar SD, LLCRed Wolf Solar, LLCRegal Solar, LLCRegal Solar 2, LLCRiver North Solar, LLCRobertson Solar, LLCRochester Solar, LLC1
Rock Ridge Wind Farm, LLCRocky Meadow Solar, LLCRolling Hills Solar, LLCRoss County Solar, LLC7
Royal Solar, LLCRoyal Solar 2, LLCRoyerton Solar, LLCSaddle Solar, LLCSaginaw Bay Solar, LLCSandstone Creek Solar, LLCSandstone Creek Solar 2, LLCSapphire Sky Wind Farm, LLCScorpion Solar, LLCSerenity Solar, LLC1
Shelby Solar, LLCSherco Solar, LLC1
Sherco Solar 2, LLC1
Silver City Solar, LLCSimpson Solar, LLC (previously Geronimo White Pine Solar, LLC)South Belleville Solar, LLCSouth Macomb Solar, LLCSpotlight Solar, LLCSpring Brook Solar, LLCSpringfield Solar Farm, LLCSpring River Solar, LLCStockton Solar, LLCStony Brook Wind, LLCStony Point Solar, LLCStove Creek Solar, LLCSturgis Solar, LLCSummit Lake Solar, LLCSunbeam Solar, LLCSunray Solar, LLCSunrise Solar, LLCSycamore Creek Solar, LLCThacker Solar, LLCThe Brooklyn Union Gas Company9
The Narragansett Electric Company13
Tilton Solar, LLCTorchlight Solar, LLC1
Transgas Inc.3Tri-City Solar, LLCTurquoise Solar, LLCUintah Solar, LLCUnbridled Solar, LLC (previously Henderson Solar, LLC)Union City Solar, LLCUpper Hudson Development Inc.9Valley Appliance and Merchandising Company13
National Grid plc Annual Report and Accounts 2020/21 Financial Statements
Notes to the consolidated financial statementscontinued
206

34. Subsidiary undertakings, joint ventures and associates continuedSubsidiary undertakings continued
Valley Solar, LLCVermont Green Line Devco, LLC (90%)4Vibrant Solar, LLCVirgo Community Solar Gardens, LLC1
Virtue Solar, LLCVivid Solar, LLCWallowa Solar, LLCWayfinder Group, Inc.3Wayside Solar, LLCWestern Hemlock Solar, LLCWheatfield Solar, LLCWhite Elm Wind Farm, LLCWild Springs Solar, LLC1
Wildcat Ridge Wind Farm, LLCWildhorse Creek Solar, LLCWillard Solar, LLCWilliams County Solar, LLCWiregrass Solar, LLCWolf River Solar, LLCWonder Lake Solar, LLCWoodlands Solar, LLCWorthington Solar, LLCYellowbud Solar, LLCYellowhammer Solar, LLCYoung County Solar, LLCYucca Solar, LLC
Incorporated in AustraliaRegistered office: Level 7, 330 Collins Street, Melbourne, VIC 3000, Australia
National Grid Australia Pty Limited
Incorporated in CanadaRegistered office: Stewart McKelvey LLP, c/o Charles Reagh, Queen’s Marque, 600-1741 Lower Water Street, Halifax, Nova Scotia, B3J 0J2, Canada
KeySpan Energy Development Co.
Incorporated in Hong KongRegistered office: Level 54, Hopewell Centre, 183 Queen’s Road East, Hong Kong
National Grid Hong Kong Limited†
Incorporated in the Isle of ManRegistered office: Third Floor, St George’s Court, Upper Church Street, Douglas, IM1 1EE, Isle of Man, UK
National Grid Insurance Company (Isle of Man) LimitedNGT Holding Company (Isle of Man) Limited*†
Incorporated in JerseyRegistered office: 44 Esplanade, St Helier, JE4 9WG, Jersey, UK
National Grid Jersey Investments Limited*†
NG Jersey Limited*†
Incorporated in LuxembourgRegistered office: 412F, Route d’Esch, L-2086, Luxembourg, Grand Duchy of Luxembourg
National Grid Luxembourg SARL
Incorporated in the NetherlandsRegistered office: Westblaak 89, 3012 KG Rotterdam, PO Box 21153, 3001 AD, Rotterdam, Netherlands
British Transco International Finance B.V.
Incorporated in the Republic of IrelandRegistered office: c/o Moore Stephens Nathans, Third Floor, Ulysses House, 23/24 Foley Street, Dublin, D01 W2T2, Ireland
National Grid Company (Ireland) Designated Activity Company*
1. Registered office: National Grid Renewables Development, LLC, 8400 Normandale Lake Blvd. Suite 1200, Bloomington, MN 55437, USA.2. Registered office: National Registered Agents, Inc., 160 Greentree Drive, Suite 101, Dover DE 19904, USA. 3. Registered office: Corporation Service Company, 84 State Street, Boston MA 02109, USA.4. Registered office: Corporation Service Company, 251 Little Falls Drive, Wilmington DE 19808, USA.5. Registered office: Corporation Service Company, 10 Ferry Street, Suite 313, Concord NH 03301, USA.6. Registered office: National Registered Agents, Inc., 1999 Bryan St, Bryan Street, Dallas, Dallas County TX 75201, USA. 7. Registered office: The Corporation Trust Company, Corporation Trust Center, 1209 Orange Street, Wilmington, Delaware, 19801, USA.8. Registered office: 60 Mine Lake Ct, Mine Lake Court, Suite 200, Raleigh, Wake County, NC 27615, USA.9. Registered office: Corporation Service Company, 80 State Street, Albany NY 12207, USA.10. Registered office: National Registered Agents, Inc., 30600 Telegraph Road, Suite 2345, Bingham Farms, MI 48025-5720, USA. 11. Registered office: Corporation Service Company, 84 State Street, Albany NY 12207, USA.12. Registered office: One MetroTech Center, Brooklyn NY 11201, USA.13. Registered office: Corporation Service Company, 222 Jefferson Boulevard, Suite 200, Warwick RI 02888, USA.
* In liquidation.** Name change post 31 March 2021.† Entity is tax resident in the United Kingdom.
National Grid plc Annual Report and Accounts 2020/21 Financial Statements | Notes to the consolidated financial statements
207

34. Subsidiary undertakings, joint ventures and associates continuedJoint venturesA list of the Group’s joint ventures as at 31 March 2021 is given below. All joint ventures are included in the Group’s financial statements using the equity method of accounting. Principal joint ventures are identified in bold.
Incorporated in England and WalesRegistered office: 1–3 Strand, London WC2N 5EH, UK (unless stated otherwise in footnotes).
BritNed Development Limited (50%)*Joint Radio Company Limited (50%)1**National Places LLP (50%)2Nemo Link Limited (50%)NGET/SPT Upgrades Limited (50%)†St William Homes LLP (50%)3
Incorporated in the USRegistered office: Corporation Service Company, 251 Little Falls Drive, Wilmington, DE 19808, USA (unless stated otherwise in footnotes).
Bight Wind Holdings, LLC (30%)4Clean Energy Generation, LLC (50%)Emerald Energy Venture LLC (51%)Island Park Energy Center, LLC (50%)Islander East Pipeline Company, LLC (50%)4LI Energy Storage System, LLC (50%)LI Solar Generation, LLC (50%)
Incorporated in FranceRegistered office: 1 Terrasse Bellini, Tour Initiale, TSA 41000 – 9291, Paris La Defense, CEDEX, France
IFA2 SAS (50%)
AssociatesA list of the Group’s associates as at 31 March 2021 is given below. Unless otherwise stated, all associates are included in the Group’s financial statements using the equity method of accounting. Principal associates are identified in bold.
Incorporated in the USRegistered office: Corporation Service Company, 251 Little Falls Drive, Wilmington, DE 19808, USA (unless stated otherwise in footnotes).
Clean Line Energy Partners LLC (32%)4Connecticut Yankee Atomic Power Company (19.5%)5Direct Global Power, Inc. (26%)4Energy Impact Fund LP (9.41%)6KHB Venture LLC (33.33%)7Maine Yankee Atomic Power Company (24%)8Millennium Pipeline Company, LLC (26.25%)4New York Transco LLC (28.3%)9NYSEARCH RMLD, LLC (22.63%)The Hive IV, LLC (28.2%)4Yankee Atomic Electric Company (34.5%)10
Incorporated in BelgiumRegistered office: Avenue de Cortenbergh 71, 1000 Brussels, Belgium
Coreso SA (15.84%)
Other investmentsA list of the Group’s other investments as at 31 March 2021 is given below.
Incorporated in England and WalesRegistered office: 1 More London Place, London SE1 2AF, UK
Energis plc (33.06%)‡
1. Registered office: Friars House, Manor House Drive, Coventry CV1 2TE, UK.2. Registered office: 80 Cheapside, London, EC2V 6EE, UK.3. Registered office: Berkeley House, 19 Portsmouth Road, Cobham, Surrey KT11 1JG, UK.4. Registered office: The Corporation Trust Company, Corporation Trust Center, 1209 Orange Street, Wilmington DE 19801, USA.5. Registered office: Carla Pizzella, 362 Injun Hollow Road, East Hampton CT 06424-3099, USA.6. Registered office: Harvard Business Services, Inc., 16192 Coastal Highway, Lewes DE 19958, Sussex County, USA.7. Registered office: De Maximus Inc., 135 Beaver Street, 4th Floor, Waltham MA 02452, USA.8. Registered office: Joseph D Fay, 321 Old Ferry Road, Wiscasset ME 04578, USA.9. Registered office: Corporation Service Company, 80 State Street, Albany NY 12207, USA.10. Registered office: Karen Sucharzewski, 49 Yankee Road, Rowe MA 01367, USA.
* National Grid Interconnector Holdings Limited owns 284,500,000 €0.20 C Ordinary shares and one £1.00 Ordinary A share.** National Grid Gas plc owns all £1.00 A Ordinary shares.† National Grid Electricity Transmission plc owns 50 £1.00 A Ordinary shares.‡ In administration.
Our interests and activities are held or operated through the subsidiaries, joint arrangements or associates as disclosed above. These interests and activities (and their branches) are established in – and subject to the laws and regulations of – these jurisdictions.
The following UK subsidiaries will take advantage of the audit exemption set out within section 479A of the Companies Act 2006 for the year ended 31 March 2021:
Company name Company number
NatGrid One Limited 5521240
Natgrid TW1 Limited 7579324
National Grid Holdings Limited 3096772
National Grid International Limited 2537092
National Grid Twelve Limited 4355616
National Grid Twenty Three Limited 6999009
National Grid (US) Holdings Limited 2630496
National Grid (US) Investments 2 Limited 3784528
National Grid (US) Investments 4 Limited 3867128
National Grid (US) Partner 1 Limited 4314432
National Grid plc Annual Report and Accounts 2020/21 Financial Statements
Notes to the consolidated financial statementscontinued
208

35. Sensitivities
In order to give a clearer picture of the impact on our results or financial position of potential changes in significant estimates and assumptions, the following sensitivities are presented. These sensitivities are based on assumptions and conditions prevailing at the year-end and should be used with caution. The effects provided are not necessarily indicative of the actual effects that would be experienced because our actual exposures are constantly changing.
The sensitivities in the tables below show the potential impact in the income statement (and consequential impact on net assets) for a reasonably possible range of different variables each of which have been considered in isolation (i.e. with all other variables remaining constant). There are a number of these sensitivities which are mutually exclusive, and therefore if one were to happen, another would not, meaning a total showing how sensitive our results are to these external factors is not meaningful.
The sensitivities included in the tables below broadly have an equal and opposite effect if the sensitivity increases or decreases by the same amount unless otherwise stated.
(a) Sensitivities on areas of estimation uncertaintyThe table below sets out the sensitivity analysis for certain areas of estimation uncertainty set out in note 1E. These estimates are those that have a significant risk of resulting in a material adjustment to the carrying values of assets and liabilities in the next year. Note that the sensitivity analysis for the useful economic lives of our gas network assets is included in note 13.
2021 2020
Income statement
£m
Netassets
£m
Incomestatement
£m
Net assets
£m
Pensions and other post-retirement benefit liabilities (pre-tax)¹:
UK discount rate change of 0.5%² 4 952 6 877
US discount rate change of 0.5%² 17 730 10 514
UK RPI rate change of 0.5%³ 3 723 4 670
UK long-term rate of increase in salaries change of 0.5% 1 42 1 39
US long-term rate of increase in salaries change of 0.5% 3 42 2 47
UK change of one year to life expectancy at age 654 1 612 1 545
US change of one year to life expectancy at age 65 4 429 4 456
Assumed US healthcare cost trend rates change of 1% 26 437 31 507
Environmental provision:
10% change in estimated future cash flows 170 170 210 210
1. The changes shown are a change in the annual pension or other post-retirement benefit service charge and change in the defined benefit obligations.2. A change in the discount rate is likely to occur as a result of changes in bond yields and as such would be expected to be offset to a significant degree by a change in the value of the bond assets
held by the plans. In the UK, there would also be a £257 million (2020: £205 million) net assets offset from the buy-in policies, where the accounting value of the buy-in asset is set equal to the associated liabilities.
3. The projected impact resulting from a change in RPI reflects the underlying effect on pensions in payment, pensions in deferment and resultant increases in salary assumptions. The buy-in policies would have a £190 million (2020: £152 million) net assets offset to the above.
4. In the UK, the buy-in policies and the longevity swap entered into, would have a £183 million (2020: £223 million) net assets offset to the above.
Pensions and other post-retirement benefits assumptionsSensitivities have been prepared to show how the defined benefit obligations and annual service costs could potentially be impacted by changes in the relevant actuarial assumption that were reasonably possible as at 31 March 2021. In preparing sensitivities, the potential impact has been calculated by applying the change to each assumption in isolation and assuming all other assumptions remain unchanged. This is with the exception of RPI in the UK where the corresponding change to increases to pensions in payment, increases to pensions in deferment and increases in salary are recognised.
National Grid plc Annual Report and Accounts 2020/21 Financial Statements | Notes to the consolidated financial statements
209
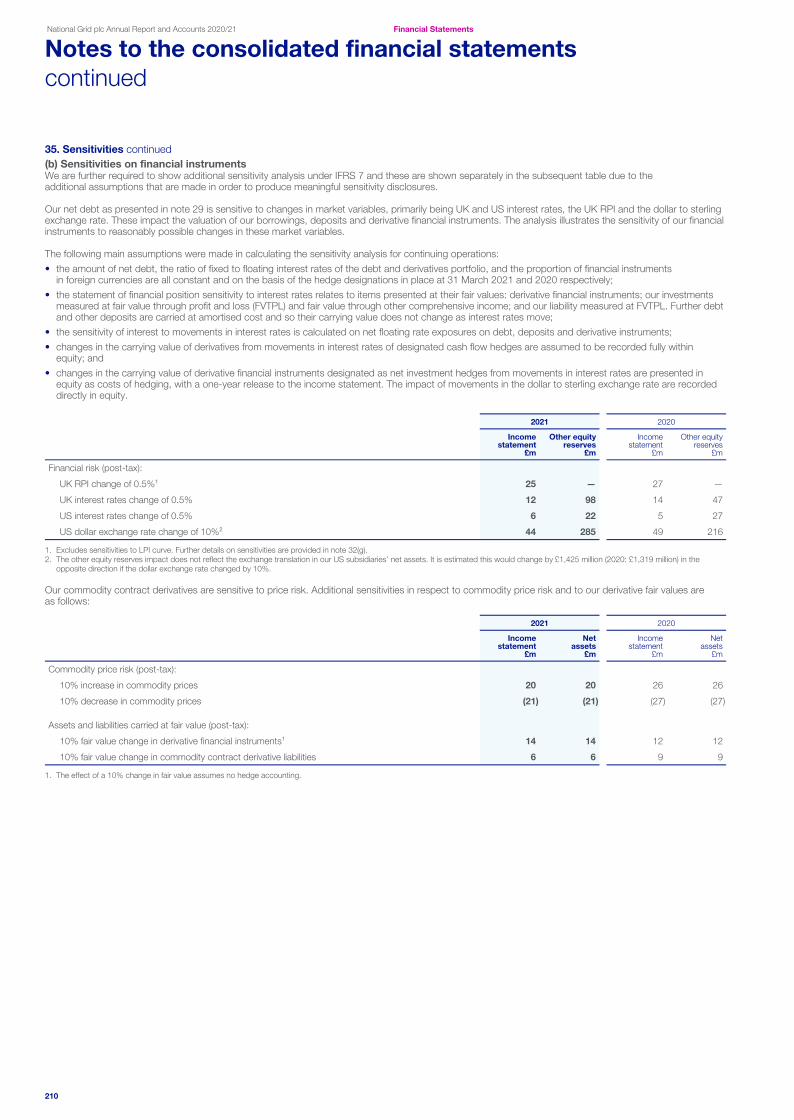
35. Sensitivities continued(b) Sensitivities on financial instrumentsWe are further required to show additional sensitivity analysis under IFRS 7 and these are shown separately in the subsequent table due to the additional assumptions that are made in order to produce meaningful sensitivity disclosures.
Our net debt as presented in note 29 is sensitive to changes in market variables, primarily being UK and US interest rates, the UK RPI and the dollar to sterling exchange rate. These impact the valuation of our borrowings, deposits and derivative financial instruments. The analysis illustrates the sensitivity of our financial instruments to reasonably possible changes in these market variables.
The following main assumptions were made in calculating the sensitivity analysis for continuing operations:• the amount of net debt, the ratio of fixed to floating interest rates of the debt and derivatives portfolio, and the proportion of financial instruments
in foreign currencies are all constant and on the basis of the hedge designations in place at 31 March 2021 and 2020 respectively;• the statement of financial position sensitivity to interest rates relates to items presented at their fair values: derivative financial instruments; our investments
measured at fair value through profit and loss (FVTPL) and fair value through other comprehensive income; and our liability measured at FVTPL. Further debt and other deposits are carried at amortised cost and so their carrying value does not change as interest rates move;
• the sensitivity of interest to movements in interest rates is calculated on net floating rate exposures on debt, deposits and derivative instruments;• changes in the carrying value of derivatives from movements in interest rates of designated cash flow hedges are assumed to be recorded fully within
equity; and• changes in the carrying value of derivative financial instruments designated as net investment hedges from movements in interest rates are presented in
equity as costs of hedging, with a one-year release to the income statement. The impact of movements in the dollar to sterling exchange rate are recorded directly in equity.
2021 2020
Incomestatement
£m
Other equityreserves
£m
Incomestatement
£m
Other equityreserves
£m
Financial risk (post-tax):
UK RPI change of 0.5%¹ 25 — 27 —
UK interest rates change of 0.5% 12 98 14 47
US interest rates change of 0.5% 6 22 5 27
US dollar exchange rate change of 10%² 44 285 49 216
1. Excludes sensitivities to LPI curve. Further details on sensitivities are provided in note 32(g).2. The other equity reserves impact does not reflect the exchange translation in our US subsidiaries’ net assets. It is estimated this would change by £1,425 million (2020: £1,319 million) in the
opposite direction if the dollar exchange rate changed by 10%.
Our commodity contract derivatives are sensitive to price risk. Additional sensitivities in respect to commodity price risk and to our derivative fair values are as follows:
2021 2020
Incomestatement
£m
Netassets
£m
Incomestatement
£m
Netassets
£m
Commodity price risk (post-tax):
10% increase in commodity prices 20 20 26 26
10% decrease in commodity prices (21) (21) (27) (27)
Assets and liabilities carried at fair value (post-tax):
10% fair value change in derivative financial instruments¹ 14 14 12 12
10% fair value change in commodity contract derivative liabilities 6 6 9 9
1. The effect of a 10% change in fair value assumes no hedge accounting.
National Grid plc Annual Report and Accounts 2020/21 Financial Statements
Notes to the consolidated financial statementscontinued
210
36. Additional disclosures in respect of guaranteed securities
We have preferred shares that are listed on a US national securities exchange and are guaranteed by a company in the Group. This guarantor commits to honour any liabilities should the company issuing the debt have any financial difficulties. In order to provide debt holders with information on the financial stability of the company providing the guarantee, we are required to disclose individual financial information for this company. We have chosen to include this information in the Group financial statements rather than submitting separate stand-alone financial statements.
Niagara Mohawk Power Corporation, a wholly owned subsidiary of the Group, has issued preferred shares that are listed on a US national securities exchange and are guaranteed by National Grid plc. In order to provide preferred shareholders with information on the financial stability of the company providing the guarantee, we are required to disclose individual financial information for these companies. We have chosen to include this information in the Group financial statements rather than submitting separate stand-alone financial statements.
The following summarised financial information is given in respect of Niagara Mohawk Power Corporation as a result of National Grid plc’s guarantee, dated 29 October 2007, of Niagara Mohawk Power Corporation’s 3.6% and 3.9% issued preferred shares, which amount to £29 million. National Grid plc’s guarantee of Niagara Mohawk Power Corporation’s preferred shares is full and unconditional. There are no restrictions on the payment of dividends by Niagara Mohawk Power Corporation or limitations on National Grid plc’s guarantee of the preferred shares, and there are no factors that may affect payments to holders of the guaranteed securities.
The following summarised financial information for National Grid plc and Niagara Mohawk Power Corporation is presented on a combined basis and is intended to provide investors with meaningful and comparable financial information, and is provided pursuant to the early adoption of Rule 13-01 of Regulation S-X in lieu of the separate financial statements of Niagara Mohawk Power Corporation.
Summarised financial information is presented, on a combined basis, as at 31 March 2021. The combined amounts are presented under IFRS measurement principles. Inter-company transactions have been eliminated. Investments in other non-issuer and non-guarantor subsidiaries are included at cost, subject to impairment.
Summarised financial information for the year ended 31 March 2021 – IFRS
National Grid plc and Niagara Mohawk
Power Corporation combined
£m
Combined statement of financial position
Non-current loans to other subsidiaries —
Non-current assets 8,940
Current loans to other subsidiaries 20,692
Current assets 1,553
Current loans from other subsidiaries (17,589)
Current liabilities (1,342)
Non-current loans from other subsidiaries (2,059)
Non-current liabilities (6,363)
Net assets¹ 3,832
Equity 3,832
Combined income statement – continuing operations
Revenue 2,462
Operating costs (4,562)
Operating profit (2,100)
Other income from other subsidiaries 9,978
Other income and costs, including taxation (182)
Profit after tax 7,696
1. Excluded from net assets above are investments in other consolidated subsidiaries with a carrying value of £14,415 million.
37. Transition to new accounting standards(a) Transition to IFRS 16The Group adopted IFRS 16 ‘Leases’, with effect from 1 April 2019. IFRS 16 introduced a single lease accounting model for lessees (rather than the previous distinction between operating and finance leases). A contract is, or contains, a lease, if it provides the right to control the use of an identified asset for a specific period of time in exchange for consideration. The new standard resulted in our operating leases being accounted for in the consolidated statement of financial position as ‘right-of-use’ assets with corresponding lease liabilities also recognised. It therefore increased both our assets and liabilities (including net debt). It also changed the timing and presentation in the consolidated income statement as it resulted in an increase in finance costs and depreciation largely offset by a reduction in the previously straight-line operating costs.
Transition optionsWe applied IFRS 16 using the modified retrospective approach. Comparatives were not restated on adoption. Instead, on the opening balance sheet date, right-of-use assets (net of accrued rent or rent-free periods, and reported within property, plant and equipment), additional lease liabilities (reported within borrowings) and any associated deferred tax were recognised, with no cumulative transition adjustment to reflect through retained earnings. For short-term leases (lease term of 12 months or less) and leases of low-value assets (such as computers), the Group continues to recognise a lease expense on a straight-line basis as permitted by IFRS 16.
National Grid plc Annual Report and Accounts 2020/21 Financial Statements | Notes to the consolidated financial statements
211

37. Transition to new accounting standards continued(a) Transition to IFRS 16 continuedWe elected to apply the practical expedient to grandfather our previous assessments of whether contracts were previously accounted for as a lease, as permitted by the standard, instead of reassessing all significant contracts as at the date of initial application to determine whether they met the IFRS 16 definition of a lease.
We elected to apply the practical expedient on transition, which permitted right-of-use assets to be measured at an amount equal to the lease liability on adoption of the standard (adjusted for any prepaid or accrued lease expenses).
In addition, we also elected the option to adjust the carrying amounts of the right-of-use assets as at 1 April 2019 for any onerous lease provisions that had been recognised on the Group consolidated statement of financial position as at 31 March 2019, rather than performing impairment assessments on transition.
Impact of transitionAt 31 March 2019, the Group disclosed non-cancellable operating lease commitments of £0.3 billion, of which the majority were in the US. A further £0.4 billion of lease liabilities were recognised due to the requirement in IFRS 16 to recognise lease liabilities for the term that we are reasonably certain to exercise lease extension or lease termination options for, rather than only for the period of the minimum contractual term that was used in determining our lease liability commitments. This was partially offset by the £0.2 billion impact of discounting our lease liabilities at the incremental borrowing rate for each lease. The weighted average discount rate applied to lease liabilities recognised on the transition date was 2.8%. There were some immaterial short-term and low-value leases, which were recognised on a straight-line basis as an expense in the consolidated income statement over the remaining lease term.
As a result, the Group recognised additional right-of-use assets of £0.5 billion and lease liabilities (which are included within net debt) of £0.5 billion at 1 April 2019. No additional net deferred tax was recognised. The transition adjustment was in addition to the £270 million of finance leases already recognised on the consolidated statement of financial position under IAS 17. There was no impact on net assets as shown in the table below, which shows the impacted balances from the Group consolidated statement of financial position.
Impact of transition
31 March 2019 (before the impact
of IFRS 16)1£m
IFRS 16transition
adjustments£m
1 April 2019 As restated
£m
Property, plant and equipment – Right-of-use assets
Land and buildings 2,560 381 2,941
Plant and machinery 36,911 67 36,978
Assets in the course of construction 5,049 — 5,049
Motor vehicles and office equipment 339 20 359
Total property, plant and equipment 44,859 468 45,327
Borrowings – Lease liabilities
Current (65) (48) (113)
Non-current (205) (426) (631)
Total lease liabilities (270) (474) (744)
Other liabilities
Trade and other payables (3,769) 3 (3,766)
Other non-current liabilities (808) 3 (805)
Net assets 19,568 — 19,568
Equity
Total equity 19,568 — 19,568
1. Comparative amounts have been revised as described in note 1F.
The impact of IFRS 16 on profit after tax as a result of adopting the new standard was not material. However, it resulted in an increase in operating profit due to the operating costs now being replaced with depreciation and interest charges.
The impact on the cash flow statement was also not material, although there was an increase in operating cash flows and decrease in financing cash flows, because repayment of the principal portion of the lease liabilities is now classified as cash flows from financing activities rather than operating cash flows.
Ongoing accounting policyWith effect from 1 April 2019, new lease arrangements entered into are recognised as a right-of-use asset and a corresponding liability at the date at which the leased asset is available for use by the Group. The right-of-use asset and associated lease liability arising from a lease are initially measured at the present value of the lease payments expected over the lease term, plus any other costs. The discount rate applied is the rate implicit in the lease or if that is not available, then the incremental rate of borrowing for a similar term and similar security.
The lease term takes account of exercising any extension options that are at our option if we are reasonably certain to exercise the option and any lease termination options unless we are reasonably certain not to exercise the option.
Each lease payment is allocated between the liability and finance cost. The finance cost is charged to the income statement over the lease period using the effective interest rate method. The right-of-use asset is depreciated over the shorter of the asset’s useful life and the lease term on a straight-line basis. For short-term leases (lease term of 12 months or less) and leases of low-value assets (such as computers), the Group continues to recognise a lease expense on a straight-line basis.
National Grid plc Annual Report and Accounts 2020/21 Financial Statements
Notes to the consolidated financial statementscontinued
212

37. Transition to new accounting standards continued(b) Transition to IFRS 9 and IFRS 15On 1 April 2018, the Group adopted IFRS 9 and IFRS 15. Both standards were applied using the modified retrospective approach whereby comparative amounts were not restated on transition, but a cumulative adjustment was made to retained earnings in the opening consolidated statement of financial position as at 1 April 2018. The impact of the transition on the opening consolidated statement of financial position is set out in the following table:
Impact of transition
31 March 2018 (Before the impact of
transition adjustments)*
Transition adjustments
1 April 2018IFRS 9 IFRS 15£m £m £m £m
Non-current assets
Goodwill 4,984 — — 4,984
Other intangible assets 899 — — 899
Property, plant and equipment 40,730 — — 40,730
Other non-current assets 115 — — 115
Pension assets 1,409 — — 1,409
Financial and other investments 899 —1 — 899
Investments in joint ventures and associates 2,168 — — 2,168
Derivative financial assets 1,319 — — 1,319
Total non-current assets 52,523 — — 52,523
Current assets
Inventories and current intangible assets 341 — — 341
Trade and other receivables 2,798 —2 (3) 2,795
Current tax assets 114 — — 114
Financial and other investments 2,694 —1 — 2,694
Derivative financial assets 405 — — 405
Cash and cash equivalents 329 — — 329
Total current assets 6,681 — (3) 6,678
Total assets 59,204 — (3) 59,201
Current liabilities
Borrowings (4,447) — — (4,447)
Derivative financial liabilities (401) — — (401)
Trade and other payables (3,453) — 597 (3,394)
Contract liabilities — — (53)7 (53)
Current tax liabilities (123) — — (123)
Provisions (273) — — (273)
Total current liabilities (8,697) — 6 (8,691)
Non-current liabilities
Borrowings (22,178) (32)3 — (22,210)
Derivative financial liabilities (660) — — (660)
Other non-current liabilities (1,317) — 5677 (750)
Contract liabilities — — (813)7 (813)
Deferred tax liabilities (3,868) 54 748 (3,789)
Pensions and other post-retirement benefit obligations (1,672) — — (1,672)
Provisions (1,779) — — (1,779)
Total non-current liabilities (31,474) (27) (172) (31,673)
Total liabilities (40,171) (27) (166) (40,364)
Net assets 19,033 (27) (169) 18,837
Equity
Share capital 452 — — 452
Share premium account 1,321 — — 1,321
Retained earnings 21,784 (99)5 (169)9 21,516
Other equity reserves (4,540) 726 — (4,468)
Total shareholders’ equity 19,017 (27) (169) 18,821
Non-controlling interests 16 — — 16
Total equity 19,033 (27) (169) 18,837
*Comparative amounts have been revised as described in note 1F.
National Grid plc Annual Report and Accounts 2020/21 Financial Statements | Notes to the consolidated financial statements
213

37. Transition to new accounting standards continued(b) Transition to IFRS 9 and IFRS 15 continuedIFRS 9: Financial InstrumentsIFRS 9 has changed the rules concerning the classification and measurement of financial instruments, impairment of financial assets, and hedge accounting. Details of the impact of applying IFRS 9 for the year ended 31 March 2019 are set out below.
Adjustments arising in the year ended 31 March 2019 as a result of the transition to IFRS 9:
1. The available-for-sale category for financial assets was replaced with investments held at fair value through profit and loss (FVTPL) and investments held at fair value through other comprehensive income (FVOCI). Changes to the classification and measurement of financial assets did not alter the carrying value of any financial assets held by the Group. The net impact to retained earnings of the reclassification on transition was an £8 million gain.
As described in note 15, all recognised financial assets that are within the scope of IFRS 9 are initially recorded at fair value and subsequently measured at amortised cost or fair value based on the Group’s business model for managing the financial assets and the contractual cash flow characteristics of the financial assets. Therefore on 1 April 2018, the Group reclassified its investments as follows:• Money market funds and fund investments held by captive insurance companies were classified as financial assets at FVTPL because their contractual
cash flows are not solely payments of principal and interest;• Investments in debt securities that have contractual payments that are solely payments of principal and interest, and which are held as part of the
liquidity portfolio or to back employee benefit liabilities, were classified as financial assets at FVOCI because they are held in a business model whose objective is to collect the contractual cash flows and to sell the debt instruments;
• The Group has elected to hold investments in equity securities, which are held to back employee benefit liabilities, as financial assets at FVOCI as the Group does not believe that changes in their fair value is reflective of the financial performance of the Group; and
• Loans to joint ventures and associates, cash at bank, and short-term deposits are classified at amortised cost as they have contractual cash flows which are solely payments of principal and interest and the Group holds them to collect contractual cash flows.
Aside from derivative financial instruments, which remain classified as FVTPL, the Group did not previously have any financial assets or liabilities classified at FVTPL.
The table below illustrates those financial assets and liabilities that were reclassified at 1 April 2018:
Financial asset/liability Note Original measurement category under IAS 39New measurement category under IFRS 9
Original carrying
amount under IAS 39
£m
Change to measurement
basis under IFRS 9
£m
New carrying amount under
IFRS 9£m
Money market funds and fund investments in equities and bonds
15 Available-for-sale investments Financial assets at FVTPL 2,294 — 2,294
Cash surrender value of life insurance policies and investments in debt securities
15 Available-for-sale investments Financial assets at FVOCI 343 — 343
Investments in equity securities 15 Available-for-sale investments Financial assets at FVOCI (equity instruments)
84 — 84
Loans to joint ventures and associates and restricted balances
15 Loans and receivables Financial assets at amortised cost
872 — 872
Borrowings 21 Financial liabilities at amortised cost Financial liabilities at fair value through profit and loss
(570) (32) (602)
Note that the table above does not include derivative assets, derivative liabilities, trade receivables, cash at bank and short-term deposits, borrowings measured at amortised cost or trade payables. This is because neither the classification nor the measurement of these items has changed on transition to IFRS 9.
2. The change from the incurred loss impairment model of IAS 39 to the expected loss model in IFRS 9 did not have a material impact on the Group’s credit loss provision. The Group calculates its impairment provision on trade receivables using a sophisticated provisions matrix. The inclusion of forward-looking information did not have a significant impact on the matrix as the relevant short-term future economic conditions affecting our retail customers in the US are expected to be similar to recent experience.
3. The Group elected to reclassify an existing liability with a carrying value of £570 million from amortised cost to fair value through profit and loss to reduce a measurement mismatch. At transition, the resultant impacts included an increase in the carrying value of the liability of £32 million, a reduction in retained earnings of £40 million and the establishment of an own credit reserve (within other equity reserves) of £7 million.
4. Deferred tax was recognised on the adjustments recorded on the transition to IFRS 9. Reserve impacts are stated net of related deferred tax.
5. Retained earnings included the impact from adjustments 1, 3 and 6.
6. The Group adopted the hedge accounting requirements of IFRS 9, which more closely align with the Group’s risk management policies. On transition, it was concluded that all IAS 39 hedge relationships are qualifying IFRS 9 relationships with the treatment of the cost of hedging being the main change. The effect was a reclassification in reserves of a £67 million gain from retained earnings and a £10 million gain from the cash flow hedge reserve, into a new cost of hedging reserve (within other equity reserves). In this reserve, qualifying unrealised gains and losses excluded from hedging relationships are deferred and released systematically into profit or loss to match the timing of hedged items.
National Grid plc Annual Report and Accounts 2020/21 Financial Statements
Notes to the consolidated financial statementscontinued
214

37. Transition to new accounting standards continued(b) Transition to IFRS 9 and IFRS 15 continuedIFRS 15: Revenue from Contracts with CustomersIFRS 15 primarily changed the accounting for our connection and diversion revenues in our regulated businesses. No practical expedients on transition were applied.
The accounting for revenue under IFRS 15 did not represent a substantive change from the Group’s previous practice under IAS 18 for recognising revenue from sales to customers with the exception of the following items:• Certain pass-through revenues (principally revenues collected on behalf of the Scottish and Offshore transmission operators) were recorded net of operating
costs, whereas previously they were recognised gross of operating costs. Had we not adopted IFRS 15, our revenues and operating costs for the year ended 31 March 2019 would have been £1,197 million higher, with no impact to operating profits;
• Contributions for capital works relating to connections for our customers were deferred as contract liabilities on our consolidated statement of financial position on transition, and released over the life of the connection assets. This was a change for our US Regulated business and our UK Gas Transmission business, where previously revenues were recorded once the work was completed. Had we not adopted IFRS 15, our revenues and operating profit for the year ended 31 March 2019 would have been £57 million higher; and
• In the UK, contributions for capital works relating to diversions were recognised as the works are completed. This was a change for the UK regulated businesses where revenues were previously deferred over the life of the asset. Had we not adopted IFRS 15, our revenues and operating profit for the year ended 31 March 2019 would have been £26 million and £23 million lower, respectively.
Adjustments arising in the year ended 31 March 2019 as a result of the transition to IFRS 15:
7. Deferred income from contributions for capital works were reclassified to contract liabilities. In addition, these liabilities for capital works relating to connections have increased as these capital contributions for connections were cumulatively adjusted for on 1 April 2018 and are now deferred and released over the life of the connection assets. This was a change for our US Regulated business and our UK Gas Transmission business where previously revenues were recorded once the work was completed.
Partially offsetting the increase in contract liabilities for connections was the change in accounting treatment for contributions relating to diversions in our UK businesses. These contributions are recognised as revenue as the works are completed where previously revenue was recognised over the life of the assets.
8. Deferred tax was recorded on the incremental amounts recorded against capital contributions and contract liabilities on the transition to IFRS 15. Deferred tax balances have been calculated at the rate substantively enacted at the balance sheet date.
9. The transition adjustment reflected the net of adjustments 7 and 8 above.
National Grid plc Annual Report and Accounts 2020/21 Financial Statements | Notes to the consolidated financial statements
215

38. Acquisitions
This note outlines the acquisition announced during the year and the acquisition made in the prior year.
Acquisition of PPL Western Power Distribution Investments LimitedOn 17 March 2021, National Grid plc entered into an agreement to acquire 100% of the share capital of PPL WPD Investments Limited (WPD), the holding company of Western Power Distribution plc, which is the UK’s largest electricity distribution network operator. The total consideration for the transaction is £7.8 billion. The transaction is expected to complete in July 2021.
Acquisition of Geronimo Energy LLC and Emerald Energy Venture LLCOn 11 July 2019, National Grid Ventures acquired 100% of the share capital of National Grid Renewables (formerly known as Geronimo Energy LLC) and 51% of Emerald Energy Venture LLC (Emerald), which is jointly controlled by National Grid and Washington State Investment Board (WSIB). National Grid Renewables Development LLC is a leading developer of wind and solar generation based in Minneapolis in the US, and the acquisition is a significant step in National Grid’s commitment to the decarbonisation agenda, towards developing and growing a large-scale renewable generation business in the US, and delivering sustainable, reliable and efficient energy. This is National Grid’s first ownership stake in wind generation and an expansion of our activities in solar generation. Whilst National Grid Renewables develops the assets, Emerald has a right of first refusal to buy, build and operate those assets.
The total consideration was £209 million, satisfied by a combination of cash and contingent consideration. The contingent consideration was recorded within trade and other payables for the amount payable within one year, with the remainder recorded within other non-current liabilities. The fair value of contingent consideration recognised was determined as the present value of our best estimate of the value that we will be required to pay, taking into consideration management’s estimates of the volume of successful development activity by National Grid Renewables over the relevant period.The contingent consideration will be payable over a number of years.
The fair values of the assets and liabilities recognised at the acquisition date for both the acquisition of the subsidiary, National Grid Renewables, and the joint venture, Emerald, are set out below.
£m
Intangible assets 5
Property, plant and equipment 1
Investment in joint venture – Emerald 90
Cash 2
Other identifiable assets and liabilities 30
Total identifiable assets 128
Goodwill 81
Total consideration transferred 209
Satisfied by:
Contingent consideration – National Grid Renewables 70
Cash consideration – National Grid Renewables 49
Cash consideration – Emerald 90
209
The goodwill arising from the acquisition comprised the value associated with the potential future projects that will be developed by National Grid Renewables as well as the expertise of the management team that was acquired, neither of which qualify for recognition as tangible or intangible assets. At the acquisition date, there were no material contingent liabilities.
Total acquisition-related costs of £3 million were recognised within operating costs within the consolidated income statement, of which £1 million was recognised in the year ended 31 March 2020.
National Grid Renewables earns revenue from selling its development stage assets to Emerald and other third parties. Emerald generates revenue from the assets it purchases from National Grid Renewables once they are operational and has no other business (see note 16). Neither entity has generated significant revenues or profits for the period between the acquisition date and 31 March 2020. Even if the acquisition had completed on 1 April 2019, there would have been no significant revenues or profits for the year ended 31 March 2020.
39. Post balance sheet eventsIn the period between 1 April 2021 and 19 May 2021, there have been no significant post balance sheet events.
National Grid plc Annual Report and Accounts 2020/21 Financial Statements
Notes to the consolidated financial statementscontinued
216

We are required to include the stand-alone balance sheet of our ultimate Parent Company, National Grid plc, under the Companies Act 2006. This is because the publicly traded shares are actually those of National Grid plc (the Company) and the following disclosures provide additional information to shareholders.
A. Basis of preparationNational Grid plc is the Parent Company of the National Grid Group, which is engaged in the transmission and distribution of electricity and gas in Great Britain and northeastern US. The Company is a public limited company, limited by shares. The Company is incorporated and domiciled in England, with its registered office at 1–3 Strand, London, WC2N 5EH.
The financial statements of National Grid plc for the year ended 31 March 2021 were approved by the Board of Directors on 19 May 2021. The Company meets the definition of a qualifying entity under Financial Reporting Standard 100 (FRS 100) issued by the Financial Reporting Council. Accordingly, these individual financial statements of the Company have been prepared in accordance with Financial Reporting Standard 101 ‘Reduced Disclosure Framework’ (FRS 101). In preparing these financial statements the Company applies the recognition and measurement requirements of International Financial Reporting Standards (IFRS) as adopted by the EU, but makes amendments where necessary in order to comply with the provisions of the Companies Act 2006 and sets out below where advantage of the FRS 101 disclosure exemptions has been taken.
These individual financial statements have been prepared on an historical cost basis, except for the revaluation of financial instruments, and are presented in pounds sterling, which is the currency of the primary economic environment in which the Company operates. The comparative financial information has also been prepared on this basis.
These individual financial statements have been prepared on a going concern basis, which presumes that the Company has adequate resources to remain in operation, and that the Directors intend it to do so, for at least one year from the date the financial statements are signed. As the Company is part of a larger group it participates in the Group’s centralised treasury arrangements and so shares banking arrangements with its subsidiaries. The Company is expected to generate positive cash flows or be in a position to obtain finance via intercompany loans to continue to operate for the foreseeable future.
As described further in note 1 to the consolidated financial statements, the Directors have considered the impact of COVID-19 on the Group. Based on this analysis, they have concluded that the Company will have adequate resources to continue in operation for at least 12 months from the signing date of these financial statements. Therefore, they continue to adopt the going concern basis of accounting in preparing the financial statements.
In accordance with the exemption permitted by section 408 of the Companies Act 2006, the Company has not presented its own profit and loss account or statement of comprehensive income.
The following exemptions from the requirements of IFRS have been applied in the preparation of these financial statements of the Company in accordance with FRS 101:• a cash flow statement and related notes;• disclosures in respect of transactions with wholly owned subsidiaries;• disclosures in respect of capital management; and• the effects of new but not yet effective IFRS standards.
The exemption from disclosing key management personnel compensation has not been taken as there are no costs borne by the Company in respect of employees, and no related costs are recharged to the Company.
As the consolidated financial statements of National Grid plc, which are available from the registered office, include the equivalent disclosures, the Company has also taken the exemptions under FRS 101 in respect of certain disclosures required by IFRS 13 ‘Fair value measurement’ and the disclosures required by IFRS 7 ‘Financial instruments: Disclosures’.
There are no areas of judgement or key sources of estimation uncertainty that are considered to have a significant effect on the amounts recognised in the financial statements.
The balance sheet has been prepared in accordance with the Company’s accounting policies approved by the Board and described below.
B. Fixed asset investmentsInvestments held as fixed assets are stated at cost less any provisions for impairment. Investments are reviewed for impairment if events or changes in circumstances indicate that the carrying amount may not be recoverable. Impairments are calculated such that the carrying value of the fixed asset investment is the lower of its cost or recoverable amount. Recoverable amount is the higher of its fair value less costs of disposal and its value-in-use. The Company accounts for common control transactions at cost.
C. TaxCurrent tax for the current and prior periods is provided at the amount expected to be paid or recovered using the tax rates and tax laws that have been enacted or substantively enacted by the balance sheet date.
Deferred tax is provided in full on temporary differences which result in an obligation at the balance sheet date to pay more tax, or the right to pay less tax, at a future date, at tax rates expected to apply when the temporary differences reverse based on tax rates and tax laws that have been enacted or substantively enacted by the balance sheet date. Deferred tax is provided for using the balance sheet liability method and is recognised on temporary differences between the carrying amount of assets and liabilities in the financial statements and the corresponding tax bases used in the computation of taxable profit.
Deferred tax assets are recognised to the extent that it is regarded as more likely than not that they will be recovered. Deferred tax assets and liabilities are not discounted.
National Grid plc Annual Report and Accounts 2020/21 Financial Statements
Company accounting policies
217

D. Foreign currenciesTransactions in currencies other than the functional currency of the Company are recorded at the rates of exchange prevailing on the dates of the transactions. At each balance sheet date, monetary assets and liabilities that are denominated in foreign currencies are retranslated at closing exchange rates. Gains and losses arising on retranslation of monetary assets and liabilities are included in the profit and loss account.
E. Financial instrumentsThe Company’s accounting policies are the same as the Group’s accounting policies under IFRS, namely IAS 32 ‘Financial Instruments: Presentation’, IFRS 9 ‘Financial Instruments’ and IFRS 7 ‘Financial Instruments: Disclosures’. The Company applies these policies only in respect of the financial instruments that it has, namely investments, derivative financial instruments, debtors, cash at bank and in hand, borrowings and creditors.
The policies are set out in notes 15, 17, 19, 20, 21 and 22 to the consolidated financial statements. The Company is taking the exemption for financial instruments disclosures, because IFRS 7 disclosures are given in notes 32 and 35 to the consolidated financial statements.
F. Hedge accountingThe Company applies the same accounting policy as the Group in respect of fair value hedges and cash flow hedges. This policy is set out in note 32 to the consolidated financial statements.
G. Parent Company guaranteesThe Company has guaranteed the repayment of the principal sum, any associated premium and interest on specific loans due by certain subsidiary undertakings primarily to third parties. Such guarantees are accounted for by the Company as insurance contracts. In the event of default or non-performance by the subsidiary, a liability is recorded in accordance with IAS 37.
H. Share awards to employees of subsidiary undertakings The issuance by the Company to employees of its subsidiaries of a grant over the Company’s options represents additional capital contributions by the Company to its subsidiaries. An additional investment in subsidiaries results in a corresponding increase in shareholders’ equity. The additional capital contribution is based on the fair value of the option at the date of grant, allocated over the underlying grant’s vesting period. Where payments are subsequently received from subsidiaries, these are accounted for as a return of a capital contribution and credited against the Company’s investments in subsidiaries. The Company has no employees.
I. DividendsInterim dividends are recognised when they are paid to the Company’s shareholders. Final dividends are recognised when they are approved by shareholders.
J. Directors’ remunerationFull details of Directors’ remuneration are disclosed on pages 92 to 113.
National Grid plc Annual Report and Accounts 2020/21 Financial Statements
Company accounting policies continued
218

2021 2020Notes £m £m
Fixed assets
Investments 1 14,389 14,362
Current assets
Debtors (amounts falling due within one year) 2 20,699 12,427
Debtors (amounts falling due after more than one year) 2 143 398
Investments 5 784 752
Cash at bank and in hand 40 2
Total current assets 21,666 13,579
Creditors (amounts falling due within one year) 3 (18,312) (16,836)
Net current assets/(liabilities) 3,354 (3,257)
Total assets less current liabilities 17,743 11,105
Creditors (amounts falling due after more than one year) 3 (3,085) (2,620)
Net assets 14,658 8,485
Equity
Share capital 7 474 470
Share premium account 1,296 1,301
Cash flow hedge reserve (3) (28)
Cost of hedging reserve (15) (6)
Other equity reserves 426 399
Profit and loss account 8 12,480 6,349
Total shareholders’ equity 14,658 8,485
The Company’s profit after tax for the year was £5,107 million (2020: £3,684 million profit). Profits available for distribution by the Company to shareholders were £9.9 billion at 31 March 2021. The financial statements of the Company on pages 217 to 223 were approved by the Board of Directors on 19 May 2021 and were signed on its behalf by:
Sir Peter Gershon ChairmanAndy Agg Chief Financial Officer
National Grid plcRegistered number: 4031152
National Grid plc Annual Report and Accounts 2020/21 Financial Statements
Company balance sheetas at 31 March
219
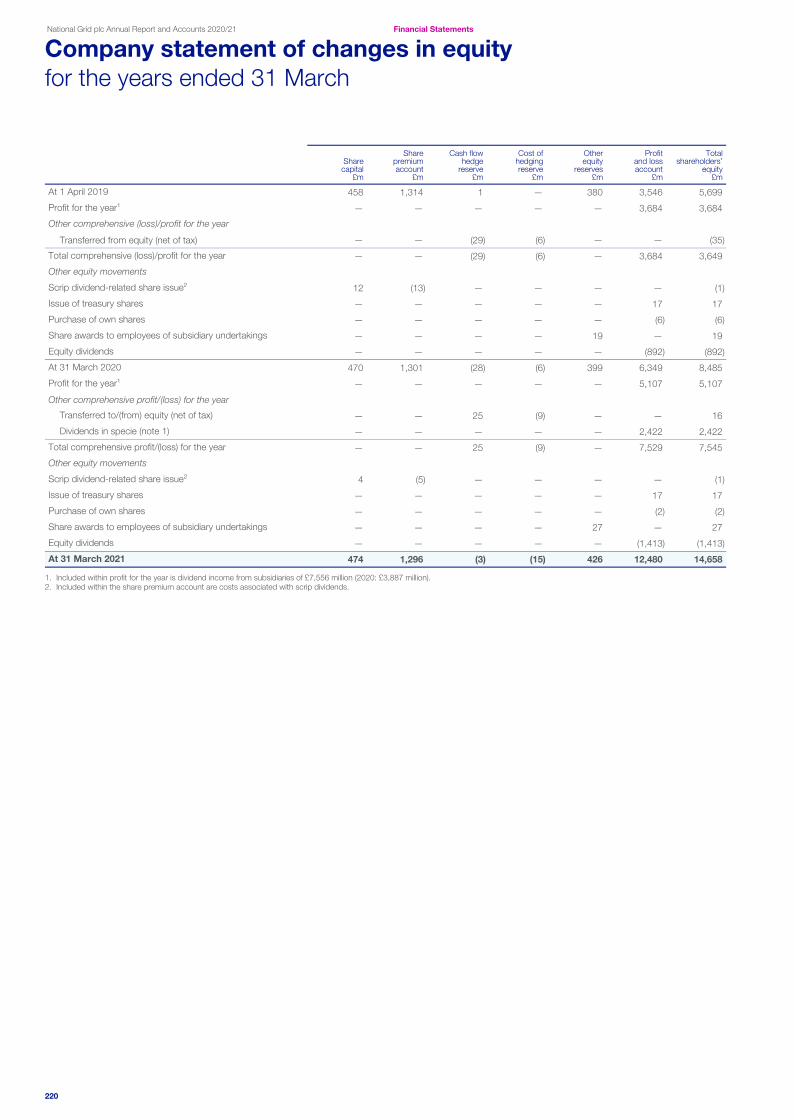
Share capital
£m
Share premium account
£m
Cash flow hedge
reserve£m
Cost of hedging reserve
£m
Other equity
reserves£m
Profit and lossaccount
£m
Total shareholders’
equity£m
At 1 April 2019 458 1,314 1 — 380 3,546 5,699
Profit for the year¹ — — — — — 3,684 3,684
Other comprehensive (loss)/profit for the year
Transferred from equity (net of tax) — — (29) (6) — — (35)
Total comprehensive (loss)/profit for the year — — (29) (6) — 3,684 3,649
Other equity movements
Scrip dividend-related share issue² 12 (13) — — — — (1)
Issue of treasury shares — — — — — 17 17
Purchase of own shares — — — — — (6) (6)
Share awards to employees of subsidiary undertakings — — — — 19 — 19
Equity dividends — — — — — (892) (892)
At 31 March 2020 470 1,301 (28) (6) 399 6,349 8,485
Profit for the year¹ — — — — — 5,107 5,107
Other comprehensive profit/(loss) for the year
Transferred to/(from) equity (net of tax) — — 25 (9) — — 16
Dividends in specie (note 1) — — — — — 2,422 2,422
Total comprehensive profit/(loss) for the year — — 25 (9) — 7,529 7,545
Other equity movements
Scrip dividend-related share issue² 4 (5) — — — — (1)
Issue of treasury shares — — — — — 17 17
Purchase of own shares — — — — — (2) (2)
Share awards to employees of subsidiary undertakings — — — — 27 — 27
Equity dividends — — — — — (1,413) (1,413)
At 31 March 2021 474 1,296 (3) (15) 426 12,480 14,658
1. Included within profit for the year is dividend income from subsidiaries of £7,556 million (2020: £3,887 million).2. Included within the share premium account are costs associated with scrip dividends.
National Grid plc Annual Report and Accounts 2020/21 Financial Statements
Company statement of changes in equityfor the years ended 31 March
220

1. Fixed asset investments
Shares in subsidiary
undertakings£m
Cost at 1 April 2019 9,923
Additions 7,011
Disposals (2,572)
Cost at 31 March 2020 14,362
Additions 2,447
Cost at 31 March 2021 16,809
Provision at 1 April 2019 and 1 April 2020 —
Charge for the year (2,420)
Provision at 31 March 2021 (2,420)
Net book value at 31 March 2021 14,389
Net book value at 31 March 2020 14,362
During the year, there was a capital contribution of £27 million (2020: £19 million) which represents the fair value of equity instruments granted to subsidiaries’ employees arising from equity-settled employee share schemes.
In addition, the Company acquired a 100% investment in National Grid (US) Investments 2 Limited and National Grid Hong Kong Limited from its subsidiary undertaking, National Grid Luxembourg SARL, for a total consideration of £2,420 million in the form of a dividend in specie. Then as part of a wider group restructuring project, National Grid (US) Investments 2 Limited, was identified as a subsidiary no longer required and hence a number of accounting steps were implemented to reduce the net assets of that company to a nominal value. These steps included a capital reduction and the payment of dividends to the Company of £2,422 million. Following the receipt of these dividends the carrying value of the investment was reviewed and an impairment charge was made to the profit and loss account of £2,420 million. It is anticipated that National Grid (US) Investments 2 Limited will be placed into voluntary liquidation in the next financial year.
During the year ended 31 March 2020, the Company made a further investment of £2,000 million in National Grid (US) Holdings Limited, following a rights issue by that company; acquired National Grid (US) Investments 2 Limited from an indirect subsidiary undertaking for £2,420 million; and disposed of its investments in National Grid Holdings One plc and National Grid (US) Investments 2 Limited in exchange for an investment in National Grid Luxembourg SARL at a cost of £2,572 million.
The Company’s direct subsidiary undertakings as at 31 March 2021 were as follows: National Grid (US) Holdings Limited, National Grid (US) Investments 2 Limited, National Grid Hong Kong Limited, National Grid Luxembourg SARL and NGG Finance plc. The names of indirect subsidiary undertakings, joint ventures and associates are included in note 34 to the consolidated financial statements.
The Directors believe that the carrying value of the investments is supported by the fair value of their underlying net assets.
2. Debtors
2021 2020£m £m
Amounts falling due within one year
Derivative financial instruments (note 4) 86 37
Amounts owed by subsidiary undertakings 20,613 12,390
20,699 12,427
Amounts falling due after more than one year
Derivative financial instruments (note 4) 139 27
Amounts owed by subsidiary undertakings — 363
Deferred tax 4 8
143 398
The carrying values stated above are considered to represent the fair values of the assets. For the purposes of the impairment assessment, loans to subsidiary undertakings are considered low credit risk as the subsidiaries are solvent and are covered by the Group’s liquidity arrangements.
A reconciliation of the movement in deferred tax in the year is shown below:
Deferred tax£m
At 1 April 2019 —
Charged to equity 8
At 31 March 2020 8
Credited to equity (4)
At 31 March 2021 4
National Grid plc Annual Report and Accounts 2020/21 Financial Statements
Notes to the Company financial statements
221

3. Creditors
2021 2020£m £m
Amounts falling due within one year
Borrowings (note 6) 635 666
Derivative financial instruments (note 4) 34 278
Amounts owed to subsidiary undertakings 17,589 15,834
Other creditors 54 58
18,312 16,836
Amounts falling due after more than one year
Borrowings (note 6) 823 355
Derivative financial instruments (note 4) 203 160
Amounts owed to subsidiary undertakings 2,059 2,105
3,085 2,620
Amounts owed to subsidiary undertakings falling due after more than one year are repayable as follows:
In 1 to 2 years — —
In 2 to 3 years — —
In 3 to 4 years 1,061 —
In 4 to 5 years 998 443
More than 5 years — 1,662
2,059 2,105
The carrying values stated above are considered to represent the fair values of the liabilities.
4. Derivative financial instrumentsThe fair values of derivative financial instruments are:
2021 2020
Assets£m
Liabilities£m
Total£m
Assets£m
Liabilities£m
Total£m
Amounts falling due within one year 86 (34) 52 37 (278) (241)
Amounts falling due after more than one year 139 (203) (64) 27 (160) (133)
225 (237) (12) 64 (438) (374)
For each class of derivative, the notional contract1 amounts are as follows:
2021 2020£m £m
Cross-currency interest rate swaps (3,604) (3,804)
Foreign exchange forward contracts (9,517) (7,886)
(13,121) (11,690)
1. The notional contract amounts of derivatives indicate the gross nominal value of transactions outstanding at the balance sheet date.
5. Investments
2021 2020£m £m
Investments in short-term money funds 697 572
Restricted balances – collateral 87 180
784 752
National Grid plc Annual Report and Accounts 2020/21 Financial Statements
Notes to the Company financial statementscontinued
222

6. BorrowingsThe following table analyses the Company’s total borrowings:
2021 2020£m £m
Amounts falling due within one year
Bank loans 8 46
Bonds 362 2
Commercial paper 265 618
635 666
Amounts falling due after more than one year
Bonds 823 355
1,458 1,021
The maturity of total borrowings is as follows:
2021 2020£m £m
Total borrowings are repayable as follows:
Less than 1 year 635 666
In 1 to 2 years — 355
In 2 to 3 years — —
In 3 to 4 years — —
In 4 to 5 years — —
More than 5 years 823 —
1,458 1,021
The notional amount of borrowings outstanding as at 31 March 2021 was £1,480 million (2020: £1,018 million).
7. Share capitalThe called-up share capital amounting to £474 million (2020: £470 million) consists of 3,814,951,606 ordinary shares of 12204/473 pence each (2020: 3,780,237,016 ordinary shares of 12204/473 pence each). For further information on share capital, refer to note 27 of the consolidated financial statements.
8. Shareholders’ equity and reservesAt 31 March 2021, the profit and loss account reserve stood at £12,480 million (2020: £6,349 million) of which profits available for distribution by the Company to shareholders were £9.9 billion (2020: £5 billion). The Company bore no employee costs in either the current or prior year.
For further details of dividends paid and payable to shareholders, refer to note 9 of the consolidated financial statements.
9. Parent Company guaranteesThe Company has guaranteed the repayment of the principal sum, any associated premium and interest on specific loans due by certain subsidiary undertakings primarily to third parties. At 31 March 2021, the sterling equivalent amounted to £2,108 million (2020: £2,169 million). The guarantees are for varying terms from less than one year to open-ended.
In addition, as part of the sectionalisation of the National Grid UK Pension Scheme on 1 January 2017, a guarantee of £1 billion has been provided to Section A. This payment is contingent on insolvency or on failure to pay pensions obligations to Section A and can be claimed against National Grid plc, National Grid Holdings One plc or Lattice Group Limited (up to £1 billion in total). Refer to note 25 of the consolidated financial statements.
10. Audit feesThe audit fee in respect of the Parent Company was £28,000 (2020: £27,000). Fees payable to Deloitte for non-audit services to the Company are not required to be disclosed as they are included within note 4 to the consolidated financial statements.
National Grid plc Annual Report and Accounts 2020/21 Financial Statements | Notes to the Company financial statements
223