NATIONAL FLUID MILK PROCESSOR ROMOTION … - Dairy... · Activities of the National Fluid Milk...
184
NATIONAL DAIRY PROMOTION AND RESEARCH PROGRAM NATIONAL FLUID MILK PROCESSOR PROMOTION PROGRAM JULY 1, 2008 JULY 1, 2008 R E P O R T T O C O N G R E S S R E P O R T T O C O N G R E S S USDA AMS Dairy Programs Report to Congress • Vol 24 • 2008 USDA AMS Dairy Programs Report to Congress • Vol 24 • 2008 NATIONAL DAIRY PROMOTION AND RESEARCH PROGRAM NATIONAL FLUID MILK PROCESSOR PROMOTION PROGRAM
-
Upload
phungkhanh -
Category
Documents
-
view
216 -
download
0
Transcript of NATIONAL FLUID MILK PROCESSOR ROMOTION … - Dairy... · Activities of the National Fluid Milk...

NATIONAL DAIRY PROMOTION
AND RESEARCH PROGRAM
NATIONAL FLUID MILK
PROCESSOR PROMOTION PROGRAM
J U L Y 1 , 2 0 0 8J U L Y 1 , 2 0 0 8
R E P O R T T O C O N G R E S SR E P O R T T O C O N G R E S S
US
DA
A
MS
D
ai
ry
P
ro
gr
am
s
Re
po
rt
t
o
Co
ng
re
ss
•
V
ol
2
4
•
2
00
8
US
DA
A
MS
D
ai
ry
P
ro
gr
am
s
Re
po
rt
t
o
Co
ng
re
ss
•
Vo
l
24
•
20
08
NATIONAL DAIRY PROMOTION
AND RESEARCH PROGRAM
NATIONAL FLUID MILK
PROCESSOR PROMOTION PROGRAM

Report to Congress
National Dairy Promotion and Research Program
and the
National Fluid Milk Processor Promotion Program
2007 Program Activities

ii
[This page is intentionally blank.]

iii
Contact Information
To obtain additional copies of this Report to Congress on the National Dairy Promotion and Research Program and the National Fluid Milk Processor Promotion Program and the complete independent analysis of the programs, please contact:
Promotion and Research Branch Dairy Programs, Agricultural Marketing Service, USDA Stop 0233, Room 2958-South 1400 Independence Avenue, SW Washington, DC 20250-0233 (202) 720-6909
To obtain copies of the complete independent analysis report or for questions on Chapter 3, please contact:
Harry M. Kaiser, Ph.D. Cornell Commodity Promotion Research Program Department of Agricultural, Resource and Managerial Economics Cornell University 349 Warren Hall Ithaca, NY 14853 (607) 255-1620 http://www.cornell.edu
To obtain copies or for questions on the Fluid Milk Market and Promotion Assessment by Beverage Marketing Corporation of New York, please contact:
Gary Hemphill Beverage Marketing Corporation of New York 850 Third Avenue, 14th Floor New York, NY 10022 (212) 688-7640 http://www.beveragemarketing.com
For additional information about the National Dairy Promotion and Research Board and Dairy Management Inc., please contact:
National Dairy Promotion and Research Board Dairy Management Inc. 10255 West Higgins Road, Suite 900 Rosemont, IL 60018-5616 (847) 803-2000 http://www.dairyinfo.com
http://www.ams.usda.gov/Dairy
iv
For additional information about the National Fluid Milk Processor Promotion Board, please contact:
National Fluid Milk Processor Promotion Board 1250 H Street, NW, Suite 950 Washington, DC 20005 (202) 737-0153 http://www.whymilk.com
The Department of Agriculture (USDA) prohibits discrimination in all of its programs and activities on the basis of race, color, national origin, age, disability, and where applicable, sex, marital status, familial status, parental status, religion, sexual orientation, genetic information, political beliefs, reprisal, or because all or part of an individual’s income is derived from any public assistance program. (Not all prohibited bases apply to all programs.) Persons with disabilities who require alternative means for communication of program information (Braille, large print, audiotape, etc.) should contact USDA’s TARGET Center at (202) 720-2600 (voice and TDD).
To file a complaint of discrimination, write USDA, Director, Office of Civil Rights,1400 Independence Avenue, S.W., Washington, D.C. 20250-9410, or call (800) 795-3272 (voice) or (202) 720-6382 (TDD). USDA is an equal opportunity provider and employer.
Report printed on recycled paper using vegetable-based ink.

v
Contents
Contact Information ................................................................................................................iiiExecutive Summary .................................................................................................................1
Chapter 1: The Dairy and Fluid Milk Promotion Programs ...................................................5
National Dairy Promotion and Research Board .......................................................................5 National Dairy Council®/ School Marketing ...........................................................................7 National Dairy Council®/ Nutrient Rich Foods Coalition .......................................................8 Research .................................................................................................................................9Export and Dry Ingredients ......................................................................................................93-A-Day™of Dairy for Stronger Bones ..................................................................................13 Foodservice/Partnerships .......................................................................................................14Communications and Technology .........................................................................................14 Qualified State or Regional Dairy Product Promotion, Research, or Nutrition Education Programs .........................................................................................15 National Fluid Milk Processor Promotion Board ..................................................................16 Medical and Scientific Activities ...........................................................................................17National Fluid Milk Programs ...............................................................................................17 Sponsorships ..........................................................................................................................18Advertising .............................................................................................................................18Promotions .............................................................................................................................19Public Relations .....................................................................................................................20Strategic Thinking ..................................................................................................................21School Marketing ...................................................................................................................21
Chapter 2: USDA Activities .................................................................................................23
National Dairy Promotion and Research Board Oversight Nominations and Appointments ............................................................................................23 Organic Exemption ................................................................................................................24Amendment to the Dairy Act .................................................................................................24 Foreign Agricultural Service ..................................................................................................25Contracts ................................................................................................................................25Contractor Audits ...................................................................................................................25Collections .............................................................................................................................25Compliance ............................................................................................................................26Qualified Programs ................................................................................................................25National Fluid Milk Processor Promotion Board Oversight Nominations and Appointments ............................................................................................27 Program Development ...........................................................................................................27Contractor Audits ...................................................................................................................27Compliance ............................................................................................................................28

vi
Contents, continued
Chapter 3: Impact of Generic Fluid Milk and Dairy Advertising and Promotion on Dairy Markets: An Independent Analysis ......................................................................29
Highlights ...............................................................................................................................30Analysis of Generic Fluid Milk Marketing ............................................................................31 Fluid Milk Model Estimation .................................................................................................38Fluid Milk Model Simulation ................................................................................................41 Analysis of All-Dairy Product Generic Marketing ................................................................41 Benefit-Cost Analysis of the Dairy Program .........................................................................47
Chapter 4 ................................................................................................................................51
Part I – Fluid Milk Market and Promotion Assessment: Beverage Marketing Corporation ........................................................................................51 Introduction ............................................................................................................................51Key Highlights and Trends for 2007 .....................................................................................51 Fluid Milk Category Performance .........................................................................................51 Fluid Milk Competitive Position and Performance ...............................................................52 Analysis of Key Beverage Category Growth Drivers ............................................................56 Category and Consumer Positioning .....................................................................................56 Branding and Media Spending...............................................................................................57 Retail Channel Distribution ...................................................................................................59Consumer Pricing ...................................................................................................................60New Product Activity ............................................................................................................61Beverage Marketing’s Assessment of 2007 Milk Marketing Programs ................................62 Part II – National Fluid Milk Processor Promotion Program: Highlights by the National Fluid Milk Processor Promotion Board ....................................66 Sustaining Milk Sales Despite Historically High Pricing ......................................................66 Addressing At-Risk Flavored Milk in School Channel .........................................................69 In Summary ............................................................................................................................73Part III – National Dairy Promotion and Research Program: Highlights by Dairy Management Inc. .................................................................................74 Introduction: DMI’s Changing Role .....................................................................................74 Fully Executed Model: Quick Serve Restaurants .................................................................74 New Product Development: A New Test for the Model .......................................................77 Incremental Sales Definition, Explanation and Results .........................................................78 Conclusion .............................................................................................................................80The Evaluation Model............................................................................................................80Sum Cost of Program/Sum Impact on Producer Revenue .....................................................80 Definitions..............................................................................................................................81
Appendix A: Membership.....................................................................................................83

vii
Contents, continued
Appendix B: Finances .............................................................................................................89
Appendix C: Independent Auditors’ Reports .........................................................................97
Appendix D: Contracts Reviewed by USDA........................................................................139
Appendix E: Research Activities, National Dairy Promotion and Research Board .............147
Appendix F: Qualified State or Regional Dairy Product Promotion, Research, or Nutrition Education Programs ........................................................................................153
Appendix G: Thumbnail Images of Advertising, Promotion, and Public Relations ............157
Appendix H: Maps ................................................................................................................174

viii
[This page is intentionally blank.]

1
Executive Summary
The enabling legislation of the dairy producer and fluid milk processor promotion programs requires the Department of Agriculture (USDA) to submit an annual report to the House Committee on Agriculture and the Senate Committee on Agriculture, Nutrition, and Forestry.The producer and processor programs are conducted under the Dairy Production and Stabilization Act of 1983 (7 U.S.C. 4501 et seq.) (Dairy Act); the Dairy Promotion and Research Order (7 CFR § 1150) (Dairy Order); the Fluid Milk Promotion Act of 1990 (7 U.S.C. 6401 et seq.) (Fluid Milk Act); and the Fluid Milk Promotion Order (7CFR § 1160) (Fluid Milk Order), respectively. This report includes summaries of the activities for the producer and processor programs, including an accounting of funds collected and spent; USDA activities; an independent analysis of the effectiveness of the advertising campaigns of the two programs; an industry-commissioned review of fluid milk markets and program operations; and highlights from each of the boards’ perspectives. Unless otherwise noted, this report addresses program activities for the fiscal period January 1 through December 31, 2007, of the Dairy Promotion and Research Program and the Fluid Milk Processor Promotion Program.
Producer Dairy Promotion and Research Program
Mandatory assessments collected under the Dairy Act totaled $282.6 million in 2007. The National Dairy Promotion and Research Board (Dairy Board) portion of the revenue from the 15-cent per hundredweight producer assessment was $93.6 million for 2007, and Qualified Programs revenue from the producer assessment was $189.0 million. Expenditures by the Dairy Board and many of the Qualified Programs are integrated through a joint process of planning and program implementation so that the programs on the national, regional, State, and local level work together. The Dairy Board continued to develop and implement programs to expand the human consumption of dairy products by focusing on partnerships and innovation, product positioning with consumers, and new places for dairy product consumption. One such endeavor was accomplished through continuing to integrate single- serve plastic bottled milk into the menus of quick-serve restaurants such as Burger King®, Wendy’s®, and Subway®. The Dairy Board also continued to promote its 3-A-Day™ for Stronger Bones, a nutrition-based marketing and education program developed to help solve the Nation’s calcium crisis and increase consumption of milk, cheese, and yogurt; as well as its “New Look of School Milk” campaign which includes efforts to improve the school milk experience for the Nation’s children through improvements in packaging, flavors, and availability. Details of the 2007 activities of the dairy producer program are presented in Chapter 1.
National Fluid Milk Processor Promotion Program
The National Fluid Milk Processor Promotion Board (Fluid Milk Board) continued to administer a generic fluid milk promotion and consumer education program funded by America’s fluid milk processors. The program is designed to educate Americans about the benefits of milk, increase milk consumption, and maintain and expand markets and uses for fluid milk products in the 48 States and the District of Columbia. During 2007, the Fluid Milk Board evolved its messaging to use the role of calcium-rich fluid milk products in successful weight maintenance as a central

2
theme and focal point for its activities. In its promotion programs such as “Another Reason, Another Season,” and “Give Your Family Something Smarter,” the Fluid Milk Board encouraged moms to choose milk to help maintain a healthy weight. For teens, the 2007 integrated Body By MilkSM campaign, combining advertising, promotion, and public relations components, stressed the importance of maintaining a healthy weight through a healthy diet, and keeping fit and strong by drinking three glasses a day of lowfat or fat-free of milk instead of sugar-sweetened beverages. Assessments generated $107.7 million in 2007. The Fluid Milk Order requires the Fluid Milk Board to return 80 percent of the funds received from California processors to the California Milk Processor Board. The amount returned to California from the 2007 assessments was $10.3 million. The California fluid milk processor promotion program uses the funds to conduct its promotion activities, which include the got milk?® advertising campaign. The fluid milk marketing programs are research based and message focused. Activities of the National Fluid Milk Processor Promotion Program for 2007 are presented in the Fluid Milk Board section in Chapter 1 of this report.
USDA Oversight
USDA has oversight responsibility for the dairy and fluid milk promotion programs. The oversight objectives ensure that the Boards and Qualified Programs properly account for all program funds and that they administer the programs in accordance with the respective Acts and Orders. All advertising, promotional, research, and educational materials are developed under established guidelines. All Board budgets, contracts, and advertising materials are reviewed and approved by USDA. USDA employees attend all Board and Committee meetings, monitor all Board activities, and have responsibility for obtaining an independent evaluation of the programs. Additional USDA responsibilities relate to nominating and appointing Board members, amending the Orders, conducting referenda, assisting with noncompliance cases, and conducting periodic program audits. The Boards reimburse the Secretary, as required by the Acts, for all of USDA’s costs of program oversight and for the independent analysis. In 2007 the Secretary of Agriculture appointed 12 members to the Dairy Board and 10 members to the Fluid Milk Board. Approximately 863 dairy producers were granted organic exemptions in 2007, representing approximately 1 billion pounds of production. Compliance for both Boards continues in a timely manner and at a high rate. Chapter 2 details USDA’s oversight activities.
Independent Analysis and Fluid Milk Market and Program Assessment
Chapter 3 presents the results of the independent econometric analysis, conducted by Cornell University (Cornell), of the effectiveness of the dairy and fluid milk promotion programs. It is estimated that the generic fluid milk marketing efforts activities sponsored by fluid milk processors and dairy farmers have helped mitigate the decline of fluid milk consumption. The generic fluid milk marketing activities increased fluid milk consumption by 30 billion cumulative pounds from 1998 to 2007, or 3 billion pounds per year on average. Had there not been generic fluid milk marketing conducted by the two National Programs, fluid milk consumption would have been 5.4 percent lower. Cornell concluded that these marketing efforts have had a positive and statistically significant impact on per capita fluid milk consumption. Details of Cornell’s independent evaluation are presented in Chapter 3.
3
Chapter 4, part I presents the industry-commissioned fluid milk market and program operations assessment conducted by Beverage Marketing Corporation (BMC). The review offers an evaluation of the effectiveness of the fluid milk advertising and promotion programs from a marketing perspective. In 2007, the fluid milk volume decreased by 0.1 percent from 6.26 to 6.25 million gallons. Consumer awareness of the generic milk advertising program remained high, but lack of branded advertising kept milk at a competitive disadvantage. BMC believes that the marketing campaigns developed under the Dairy Act and the Fluid Milk Act have played a key role in maintaining the category’s growth, and volume declines would have been more significant without the major programs and initiatives implemented in 2007.
Additionally, the National Fluid Milk Board and Dairy Management Inc., (DMI) provide individual highlights of 2007 program successes from the Boards’ perspective in Parts II and III.In Part II, the Fluid Milk Board presents highlights regarding sustained milk sales despite historically high pricing, at-risk flavored milk in the school channel, and a summary assessment of the program’s effectiveness. The Fluid Milk Board concludes that the 2007 campaigns were successful in advancing the effectiveness of the program by driving incremental volume and helping to mitigate the long-term loss of market share. The short-term comparison of retail sales to Board expenditures ($6.60 for every dollar spent) remains highly favorable – basically flat compared to 2006 ($6.61 for every dollar spent). The Fluid Milk Board continues to promote the fluid milk industry through the National Fluid Milk Processor Promotion Program (MilkPEP), supporting the Federal nutrition goals such as those outlined in the enabling legislation, the U.S. Dietary Guidelines for Americans, and USDA’s Food Guide Pyramid. MilkPEP is a national marketing voice for milk in a marketing environment subject to a high degree of Federal and State regulation, helping to maintain the strength and stability of the fluid milk industry, to the benefit of the Nation’s health.
In Part III, DMI provides highlights regarding the dairy producer promotion program’s successes through DMI’s changing role, the executed model for quick serve restaurants, and new product development efforts based on an in-depth segmentation study. DMI concluded that positioning the right product to the right consumer at the right place and time is the key to growth for the milk category. DMI will continue to maximize dairy farmer investments through innovation, by increasing dairy demand, and by identifying and analyzing what works best to move dairy sales.

4
[This page is intentionally blank.]

5
Chapter 1 The Dairy and Fluid Milk Promotion Programs
The Dairy Board and the Fluid Milk Board continued to develop and implement programs to expand the human consumption of fluid milk and dairy products. Each promotion program had many unique activities. The Dairy Board continued its focus on partnerships and innovation to provide consumers with dairy products “how they want them, when they want them, and where they want them.” The Fluid Milk Board used the role of calcium-rich fluid milk products in successful weight loss for the first half of 2007 and weight maintenance for the second half of the year as a central theme and focal point for its activities.
National Dairy Promotion and Research Board
The mission of the Dairy Board is to coordinate a promotion and research program that maintains and expands domestic and foreign markets for fluid milk and dairy products produced in the United States. The Dairy Board is responsible for administering the Dairy Order, developing plans and programs, and approving budgets. Its dairy farmer board of directors administers these plans and monitors the results of the programs.
The Secretary of Agriculture (Secretary) appoints 36 dairy farmers to administer the Dairy Order. The appointments are made from nominations submitted by producer organizations, general farm organizations, qualified State or regional dairy products promotion, research or nutrition education programs (Qualified Programs), and by other means as determined by the Secretary (7 CFR §1150.133(a)). Dairy Board members serve 3-year terms and represent 1 of 13 regions in the contiguous 48 States. Dairy Board members elect four officers: Chair, Vice Chair, Treasurer, and Secretary. Current Dairy Board members are listed in Appendix A–1. A map of the contiguous 48 States depicting the 13 geographic regions is shown inAppendix H–1.
Total Dairy Board actual revenue for 2007 was $93.6 million (including assessments and interest). This amount was more than the Dairy Board Budget of $91.4 million for that period. The Dairy Board amended its budget to $114.3 million by incorporating program development funds not budgeted previously and a $15.2 million carry-forward from their 2006 budget. The Dairy Board budget for 2008 projects total revenue of $91.6 million from domestic assessments and interest. The Dairy Board administrative budget continued to be within the 5-percent-of-revenue limitation required by the Dairy Order. A list of actual income and expenses for 2006–2007 is provided in Appendix B–1. USDA’s oversight and evaluation expenses for 2006–2007 are listed in Appendix B–2. Appendix B–3 displays the Dairy Board’s approved budget for 2008. An independent auditor’s report for 2007 is provided in Appendix C–1.
The Dairy Board has two standing committees: the Finance and Administration (F&A) Committee and the Executive Committee. The F&A Committee is made up of the Dairy Board officers and appointees named by the Dairy Board Chair. The Dairy Board Treasurer is the Chair of the F&A Committee, and the full Dairy Board serves as the Executive Committee.

6
The remaining committees for the Dairy Board are joint program committees with the United Dairy Industry Association (UDIA).
In March 1994, the Dairy Board approved the creation of Dairy Management Inc. (DMI), a management and staffing corporation. DMI is a joint undertaking between the Dairy Board and UDIA. UDIA is a federation of 18 of the 58 Qualified Programs under the direction of a board of directors. DMI merged the staffs of the Dairy Board and UDIA to manage the Dairy Board programs as well as those of the American Dairy Association® and National Dairy Council®
throughout the contiguous 48 States. DMI serves both boards and is structured into product platform and mission areas. These platform and mission areas include: Platforms, Partners, Sales and Marketing; Export, International Marketing, and Ingredients; Research, Regulatory and Scientific Affairs; Strategic Planning, Business Development and Information Management; Child Nutrition and Fitness Initiative, Nutrition Leadership, and Integrated Marketing Communications; and Image and Industry Relations; and Finance and Administration, Human Resources, Strategic Operations. During 2007, DMI successfully implemented a national staffing structure which utilizes personnel throughout DMI and the UDIA federation to plan and execute the national programs.
Since January 1, 1995, the Dairy Board and UDIA have developed their marketing plans and programs through DMI. DMI facilitates the integration of producer promotion funds through a joint process of planning and program implementation so that the programs on the national, regional, State, and local level work together. The mission of DMI is to drive increased sales of and demand for U.S. dairy products and ingredients, on behalf of U.S. dairy farmers. DMI works proactively, and in partnership with leaders and innovators, to increase and apply knowledge that leverages opportunities to expand dairy markets.
DMI funds 1 to 3-year research projects that support marketing efforts. Six Dairy Foods Research Centers and one Nutrition Institute provide much of the research. Their locations and the research objectives are listed in Appendix E–1. Additionally, lists of DMI’s dairy foods and nutrition projects can be found in Appendices E–2 and E–3, respectively. Universities and other industry researchers throughout the United States compete for these research contracts.
At its inception, the DMI Board of Directors consisted of 12 dairy farmers from the Dairy Board and 12 dairy farmers from the UDIA Board. An amendment to the articles of incorporation of DMI to expand the DMI Board size took effect January 1, 2001, and the expanded DMI Board (77) now comprises all Dairy Board (36) and all UDIA (41) members. Voting is equalized between the Dairy Board and UDIA.
The committees for program activities are comprised of board members from both the Dairy and UDIA Boards. The Dairy Board and UDIA Board separately must approve the DMI budget and annual plan before they can be implemented. In November 2006, both boards approved the 2007 unified dairy promotion plan budget and national implementation programs. Similar to previous plans, the 2007 unified dairy promotion plan continued to support the underlying theme of investing dollars where the consumers are – not where dairy cows are. The unified dairy

7
promotion plan was consistently implemented in the top 150 demand-building consumer markets nationwide.
DMI, through Qualified Programs, again hosted dairy director regional planning forums across the country to review and create marketing strategies for development of the unified dairy promotion plan. These forums are designed to create one unified dairy promotion plan and allow opportunity for Qualified Program board members to ask questions, raise concerns, and offer their thinking on the plan’s direction and development.
At the 2007 forums, dairy directors across the country reviewed and endorsed a unified marketing plan that continued to focus on (1) 3-A-Day of Dairy™ for Stronger Bones, a nutrition–based marketing and education program developed to help solve the Nation’s calcium crisis and increase consumption of milk, cheese, and yogurt; (2) New Look of School Milk which includes efforts to improve the school milk experience for the Nation’s children through improvements in packaging, flavors, and availability; (3) Foodservice, where dairy checkoff funds are invested to help promote the expansion of flavors and the range of packaging for milk in foodservice and restaurants, as well as other dairy product offerings; (4) Partnerships and Innovation, which include efforts to help provide consumers dairy products when, where, and how they want them; and (5) Dairy Image/Confidence, which aims to protect and enhance consumer confidence in dairy products and the dairy industry through correcting misinformation and inaccurate claims against dairy. The success of the unified marketing plan relies heavily upon DMI’s ability to expand partnerships with processors, retailers, schools, health professional organizations, and manufacturers.
The joint Dairy Board and UDIA Board committee structure provides the framework for DMI program activities. The Dairy Board and UDIA Board Chairs assign their respective board members to the following joint program committees: Products and Relationships; Producer and Industry Relations; Industry Priorities; and Export, Ingredients and Science. Each committee elects a Chair and Vice-Chair. The joint committees and the DMI staff are responsible for setting program priorities, planning activities and projects, and evaluating results. The Joint Evaluation Committee continued to operate in 2007. During 2007, the Dairy Board and UDIA Board met jointly six times.
The following information describes Dairy Board and UDIA program activities along with new programs and initiatives implemented in 2007.
National Dairy Council®/School Marketing
The National Dairy Council® www.nationaldairycouncil.org (NDC), the nutrition marketing arm of DMI, has been the leader in dairy nutrition research, education, and communication since 1915. NDC provides timely, scientifically sound nutrition information to the media, physicians, dieticians, nurses, educators, consumers, and other health professionals. NDC continues to work closely with school foodservice professionals and milk processors vis-à-vis the benefits of offering an enhanced milk

8
product in the school cafeteria. The foundation of these efforts is comprised of the results of a year-long School Milk Pilot Test conducted in 2002. Currently, more than 50 processors now offer milk in single-serve plastic resealable containers on the school meal line and supply 9,200 schools representing nearly 5 million students nationwide. This number grows each year as DMI continues to implement its “New Look of School Milk” initiative and represents over 55 million pounds of additional milk sold each year. DMI-funded market research shows that improving students’ school milk experience can help recapture school milk consumption of up to 400 million gallons lost since 1993. NDC was honored at the 2007 Global Dairy Innovation Awards for “Best School Milk Initiative” category for its partnership with local dairy processors and school districts to encourage milk consumption among students.
NDC also continued its active support and participation in the Action For Healthy Kids® (AFHK) initiative. AFHK
to the Healthy Schools Summit in 2002 and its mission is to inform, motivate, and mobilize schools, school districts, and States to chart a healthier course for the Nation’s children and adolescents. AFHK is comprised of 51 State teams (including all 50 States and the District of Columbia) and a partnership of more than 40 national organizations and Government agencies spanning
education, health, fitness, and nutrition arenas. AFHK, in partnership with the National Football League, continued to promote ReCharge! Energizing After-school™, the first nationally distributed after-school program that fully integrates nutrition and physical activity through teamwork-based strategies for youth in grades 3-6. According to AFHK, ReCharge! has been distributed to over 8,000 after-school programs across the country, reaching over half a million students.
National Dairy Council®/Nutrient Rich Foods Coalition
The activities of the Nutrient Rich Foods Coalition (Coalition) continued in 2007, with the National Dairy Council® and other Coalition members from all food groups dedicated to working with scientific researchers to develop an approach to address the complete nutrient package of a food and how to maximize nutrients from the calories they consume. Through research and education, the Coalition aims to shift the way people choose foods and beverages, from focusing on single “nutrients to avoid” to understanding the complete nutrient package as a way to build better diets and improve diet quality. On the science front, the Coalition worked in 2007 to complete a scientifically sound and validated definition of nutrient density, which was called for by the advisory committee of the 2005 Dietary Guidelines for Americans. The Coalition also developed tools to help health professionals and media spread the word about the importance and ease of choosing nutrient-rich foods first. The Coalition published several studies on nutrient-rich foods in academic journals and garnered the support of prominent nutrition thought-leaders, with its scientific advisory panel of third-party experts continuing to guide the science.
(www.actionforhealthykids.org) was created in response

9
In addition to reaching kids through the classroom with “Pyramid Cafè” and “Pyramid Explorations™,” NDC continued its distribution of “Little D’s Nutrition Expedition” and “Arianna’s Nutrition Expedition” as the primary focus of nutrition education activities in 2007. Similar to “Pyramid Cafè” and “Pyramid Explorations™,” these two programs also are targeted to second and fourth grades and reach millions of students with messages that milk and dairy products are a key part of a healthy diet. Survey results continue to show a high utilization rate for these programs. These programs and other resources are available for teachers, school foodservice professionals, and consumers at: www.nutritionexplorations.org.
Research
In 2007, milk and dairy-related nutrition and product research was continued in the following areas:
1. The role of milk and milk products in the prevention of colon cancer and reduction of blood pressure.
2. Establishing the genetic basis for the activity of probiotic cultures.3. Demonstration of milk consumption by teens to meet their calcium needs without adversely
affecting weight.4. The contribution of dairy’s nutrient package in the development and maintenance of strong
bones.5. Investigation of the added value of fortification through the use of probiotics, nutraceuticals,
nutrient delivery, and flavor enhancement. 6. The impact of differing milk options and experiences in schools on childhood fluid milk
consumption behavior and attitudes. 7. The role of dairy as part of a heart-healthy diet. 8. The role of calcium-rich dairy products in weight loss and maintenance.
Export and Dry Ingredients
DMI’s export enhancement program is implemented by the U.S. Dairy Export Council (USDEC). USDEC receives primary funding from three sources: DMI, USDA’s Foreign Agricultural Service (FAS), and membership dues from dairy cooperatives, processors, exporters, and suppliers. In 2007, USDEC received $9.7 million from DMI; $5.6 million from USDA’s Market Access Program, Foreign Market Development Program, and other FAS programs that support commodity groups in promotion of their commodities in foreign markets; and $750,000 from membership dues. USDEC began its 12th year of operation in 2007 and its total budget was $16.6 million.

10
Figure 1–1. USDEC Offices
USDEC has offices in Washington, D.C.; Mexico City, Mexico; Tokyo, Japan; Seoul, South Korea; Hong Kong, Taipei, and Shanghai, China; Bangkok, Thailand; Beirut, Lebanon; London, England; and São Paulo, Brazil (Figure 1–1). In 2007, a weak dollar and strong global demand for dairy protein led to another record year for dairy exports.
Final 2007 export data confirm that U.S. dairy product exports reached $3.06 billion in 2007 (Figure 1–2). Dairy solids export volume is also a record high at 2.19 billion pounds, more than double the export volume of 5 years ago, according to analysis of trade date conducted by USDEC (Figure 1–3). This volume represented nearly 9.5 percent of the total U.S. milk production (Figure 1–4).
On a value basis, U.S. exports of milk powder, whey, cheese, lactose, butterfat and other dairy products were up 62 percent from the prior year, and nearly triple the export value posted in 2002. It was the fifth straight year U.S. dairy exports increased in both volume and value.
Figure 1–2. Value of U.S. Dairy Exports
Source: USDEC, USDA
Mexico City, Mexico
Washington, DC
London, England
Seoul, South Korea
Tokyo, Japan Shanghai and Taipei, China
Hong Kong, China
Bangkok, Thailand
Beirut,Lebanon
São Paulo, Brazil

11
Figure 1–3. Volume of U.S. Dairy Exports (total milk solids)
Additionally, USDEC notes that although the trend had been developing for several years, a variety of elements converged to create worldwide “structural shortage” of dairy products in 2007. Markets were characterized by strong global dairy demand, lower exportable surpluses from Europe and Oceania, and a lack of stocks to fall back on.
Export gains in 2007 occurred in nearly all product categories. By value, the major U.S. dairy exports were skim milk powder/nonfat dry milk ($865 million), whey proteins ($759 million), cheese ($387 million), and lactose ($304 million). Mexico, Southeast Asia, and Canada remained the largest destinations for U.S. dairy products. USDEC continued working to improve the export capabilities of domestic dairy companies by providing up-to-date information on market conditions, global trade trends, and regulatory requirements for export.
Figure 1–4. Exports as a percentage of U.S. Milk Production
Source: USDEC, USDA

12
Ongoing reverse trade mission activities provide opportunities for domestic dairy product suppliers to meet potential importers visiting the United States.
DMI’s 2007 ingredients program was conducted through DMI’s Innovation and Ingredients
DMI’s Innovation Program supports dairy product and nutrition research, ingredient applications development and technical assistance for the dairy, food, and beverage industries. DMI-assisted product development now in the marketplace include: (1) Hershey’s® PayDay™ Pro Bars, which use 200,000 pounds of U.S. dairy proteins annually, requiring about 15 million pounds of milk and (2) Yoplait® Ultra-Low Carb Yogurt, which created an outlet for 4 million pounds of additional milk volume during the year following the launch and more than 250,000 pounds of whey protein concentrate, which requires 25 million pounds of milk. Additionally, various Schwan’s® products, including Wolfgang Puck Frozen Pizza, Freshcetta Build and Bake Pizza, Toastwich grilled cheese sandwiches, and trans-fat free school pizzas, move more than 150 million pounds of additional milk annually. Producer-funded product research and innovation, along with insights into consumer preferences are tools that DMI provides to U.S. dairy ingredient suppliers to help sell U.S. dairy ingredients to food and beverage manufacturers. Dairy, food, and beverage manufacturers look to DMI as a partner and resource. With food and beverage manufacturers, DMI provides know-how and laboratory and professional resources to help develop or improve foods using dairy ingredients.
DMI’s Innovation Program hosted the 2007 Dairy Innovation Forum (Forum) in Scottsdale, Arizona. The invitation-only Forum, continued a DMI tradition of bringing together top decision makers in science and marketing to develop ways to increase consumption of dairy products. The forum attracted a record 189 participants and included industry representatives such as dairy processors and cooperatives, food manufacturers, Government officials, ingredient suppliers, State and regional representatives, and university researchers. Similar to 2006, the Forum continued to focus on innovation – a key to the future of the dairy and dairy ingredient industries.Additionally, DMI co-sponsored the 10th Annual Dairy Ingredients Symposium in San Francisco, California, which highlighted research, manufacturing technology, market trends, and application of value-added dairy ingredients. Attendees included scientists, research and development managers, directors and decision-makers responsible for production, quality, marketing and sales of dairy ingredients, plus food and beverage industry professionals who buy or use dairy ingredients.
DMI publications that support the Innovation Program include: (1) Dairy Council Digest–published six times per year and focuses on the latest dairy nutrition research relevant to dairy, food and beverage manufacturers and health professionals; (2) Ingredient Specification Sheets–cover technical basics of a variety of dairy ingredients and are updated as new data is available; (3) Dairy Herald–reports periodically on how food formulators and markets can take advantage of taste, cost, functional, and nutritional appeal of dairy ingredients; (4) Application Monographs–published as necessary, provide a comprehensive look at how whey protein and other dairy ingredients can be used in foods and beverages for different functionality needs; (5) Tools for Innovation–a periodic supplement from DMI and Dairy Foods magazine that covers
Program (Innovation Program) and through the new Web site www.innovatewithdairy.com.

13
dairy product trends and research; (6) Innovations in Dairy–a technical bulletin, published two to three times a year on specific topics in dairy products, ingredients, processing, and packaging;and (7) Dairy Business View–an e-newsletter published bi-monthly with Dairy Foods magazine and covers dairy industry news, new technologies, business trends, innovative ideas, and research.
3-A-Day™ of Dairy for Stronger Bones
The 3-A-Day™ of Dairy for Stronger Bones (3-A-Day™) marketing and nutrition education campaign was officially launched on March 3, 2003, and continued in 2007. The program objectives are to increase total consumption of dairy products and reinforce dairy as the leading source of calcium by providing simple guidance about dairy food selections. The development of the program was a joint dairy industry effort led by DMI. A key component of the 3-A-Day™ program is the logo, which appears on packages and labels of milk, cheese, and yogurt products containing 20 percent or more of the daily value of calcium.
Health professional outreach remained a critical component of the 3-A-Day™ program. The American Academy of Family Physicians, the American Academy of Pediatrics, the American Dietetic Association, and the National Medical Association all continued their support and partnership with DMI and 3-A-Day™. The National Hispanic Medical Association and the School Nutrition Association are the latest health professional organizations to partner with dairy to educate the public about dairy’s role in a healthy diet and the need to consume three serving of milk, cheese, and yogurt daily. By working with key health professional partners like these, DMI continued to provide a clear, practical message to the public on the importance of dealing with the Nation’s calcium crisis. Combined, these organizations represent more than 250,000 health professionals nationwide. DMI’s 3-A-Day™ advisory panel, comprised of leaders from these organizations along with other nutrition experts, continued to help guide the overall campaign as well as nutrition philosophy and principles.
In alignment with the 3-A-Day™ program, DMI continued to execute its overall strategy of promoting three servings of dairy a day, encouraging the public to consume, and health professionals to support, the government-recommended three servings. One aspect of the three servings strategy is to encourage industry to meet consumer needs by developing and marketing innovative products that fit changing consumer lifestyles. Through its Fluid Milk Platform, DMI worked with industry to develop and test milk products customized to meet specific consumer needs, such as lactose-free products or milk products fortified with Omega-3 for heart health. In addition to fluid milk, DMI’s Cheese Platform identified opportunities to build sales for cheese through industry innovation, including: developing new products to meet consumer health needs such as reduced-fat and low-fat cheeses; expanding the use of Hispanic-style and other specialty cheeses; and leveraging convenience and new uses for cheese with pizza, burgers, snacks, and sandwiches.

14
Foodservice/Partnerships
DMI continued to work closely with top national restaurant chains, including Subway® and Domino’s Pizza®, to ensure that milk and cheese were featured prominently in menu items and offerings. Building upon previous efforts leading to the introduction of new milk offerings at McDonald’s® and Wendy’s®, DMI helped to motivate a single-serve milk launch in Subway®,which represents 20,000-plus restaurants nationwide. To date, there are more than 60,000 restaurants in the U.S. offering milk in single serve plastic resealable containers. Over the next year, more than one billion units of milk will be sold at foodservice, or 250 million pounds of additional milk sold.
Also, DMI helped increase cheese use by partnering with national restaurant chains to introduce cheese-friendly items and drive innovation. DMI partnered with Domino’s Pizza® to develop the new “Cheesy Garlic Bread Pizza” that was offered at more than 6,000 restaurants nationwide. In support of this launch, Domino’s® unveiled its new website and offered free music downloads by up-and coming artists, and a chance to appear in a television commercial. DMI provided funding for culinary and other marketing assistance during this effort.
Additionally, DMI is working at supermarkets by partnering with retailers on a “dairy aisle reinvention” project that identifies new ways to position milk, cheese, and yogurt in the dairy case and throughout the store. The new merchandising ideas aim to increase traffic and sales in the dairy aisle. Partners include Kraft®Foods, Dannon®, Marva Maid, and major regional retail partners.
Communications and Technology
Consumers receive mixed messages through the media about the nutritional value and benefits of food. DMI worked to provide consumers with education and information based on sound nutritional science and communicated the value of dairy products to consumers as well as to health professionals and educators. DMI also worked to inform dairy farmers about how their assessment dollars were being used. The organization continued to communicate to dairy producers and other industry audiences through publications (such as the annual report, joint newsletters with Qualified Programs, and dairy cooperative check inserts), dairy industry events (including major trade shows and producer meetings) and media relations (including press releases, feature placement, and farm broadcast interviews). DMI continued its “Dairy Ambassadors” program which uses a select group of board members to deliver consistent messages about the dairy promotion program to producers and other industry audiences.
DMI continued its support for butter through cooperation and public relations activities with the
center with current cooking trends and ideas, butter recipes, and links to other butter-related Web sites. DMI also continued to work with Wisconsin Milk Marketing Board to execute co-funded
American Butter Institute, including the Web site www.butterisbest.com, a consumer resource
15
retail butter promotion activities. The national effort helped to drive incremental retail butter sales in select markets across the United States.
Another activity of the Communications and Technology program was the issues management program. The objective of this program is to identify, monitor, and manage key issues that may influence consumer perceptions of dairy products. DMI coordinated its issues management activities with Qualified Programs as well as with other dairy and agricultural groups. The organization worked with these groups to bring forth sound, science-based information to address consumer issues. Dairy Reputation Management, and industry-wide efforts that interact with the Issues Management, Industry Relations, and Dairy Image programs, continued a proactive program to educate consumers and to reinforce the positive attributes of dairy foods, dairy farmers, and dairy farming practices to this audience.
As part of an effort to help protect the image of dairy producers and the dairy industry among the
about how today’s dairy producers care for their animals, protect the land, and produce safe, wholesome milk.
Qualified State or Regional Dairy Product Promotion, Research, or Nutrition Education Programs
Qualified Programs are certified annually by the Secretary. To receive certification, the Qualified Program must: (1) conduct activities that are intended to increase human consumption of milk and dairy products generally; (2) have been active and ongoing before passage of the Dairy Act, except for programs operated under the laws of the United States or any State; (3) be primarily financed by producers, either individually or through cooperative associations; (4) not use a private brand or trade name in its advertising and promotion of dairy products (unless approved by the Dairy Board and USDA); and (5) not use program funds for the purpose of influencing governmental policy or action (7 CFR §1150.153). A list of the Qualified Programs is provided in Appendix F.
The aggregate revenue from the producers’ 15-cent per hundredweight assessment directed to the Qualified Programs in 2007 was $189 million (approximately 10 cents out of the 15-cent assessment). See Appendix B–7 and Appendix B–8 for aggregate income and expenditure data of the Qualified Programs.
Some of these Qualified Programs participate in cooperative efforts conducted and coordinated by other Qualified Programs and/or other organizations such as DMI, the Dairy Board, and UDIA. Their goal in combining funding and coordinating projects is more effective and efficient management of producers’ promotion dollars through larger, broad-based projects. For example, UDIA coordinates nationally through DMI the programs and resources of 18 federation members and their affiliated units to support the unified marketing plan.
public, DMI continued its Website, www.dairyfarmingtoday.org. The site educates the public

16
National Fluid Milk Processor Promotion Board
The National Fluid Milk Processor Promotion Board (Fluid Milk Board) as authorized in the Fluid Milk Act, administers a fluid milk promotion and consumer education program that is funded by fluid milk processors. The program is designed to educate Americans about the benefits of milk, increase fluid milk consumption, and maintain and expand markets and uses for fluid milk products in the contiguous 48 States and the District of Columbia.
The Secretary of Agriculture appoints 20 members to the Fluid Milk Board. Fifteen members are fluid milk processors who each represent a separate geographical region, and five are at-large members. Of the five at-large members, at least three must be fluid milk processors and at least one must be from the general public. Four fluid milk processors and one public member serve as at-large members on the current Fluid Milk Board. The members of the Fluid Milk Board serve 3-year terms and are eligible to be appointed to two consecutive terms. The Fluid Milk Promotion Order (Fluid Milk Order) provides that no company shall be represented on the Board by more than three representatives. Current Fluid Milk Board members are listed in Appendix A–2. A map of the Fluid Milk Board regions is shown in Appendix H–2.
The Fluid Milk Board elects four officers: Chair, Vice-Chair, Secretary, and Treasurer. Fluid Milk Board members are assigned by the Chair to the following committees: Advertising, Finance, Promotions, Public Relations, Hispanic, Medical/Scientific, and Strategic Thinking/Research. The program committees are responsible for setting program priorities, planning activities and projects, and evaluating results. The Finance Committee reviews all program authorization requests for funding sufficiency, the Fluid Milk Board’s independent financial audit, and the work of the Board’s accounting firm. The Fluid Milk Board met three times during 2007.
The National Fluid Milk Processor Promotion Program (MilkPEP) is funded by a 20-cent per hundredweight assessment on fluid milk products processed and marketed commercially in consumer-type packages in the contiguous 48 States and the District of Columbia. The program exempts from assessment those processors who process and market 3 million pounds or less of fluid milk products each month, excluding fluid milk products delivered to the residence of a consumer. Assessments generated $107.7 million in 2007. The Fluid Milk Order requires the Fluid Milk Board to return 80 percent of the funds received from California processors to the California Milk Processor Board. The amount returned to California from 2007 assessments was $10.3 million. The California fluid milk processor promotion program uses the funds to conduct its promotion activities, which include the “got milk?®” advertising campaign.
The actual income and expenses for 2006–2007 are provided in Appendix B–4. The Fluid Milk Board’s administrative expenses continued to be within the 5-percent-of-assessments limitation required by the Fluid Milk Order. USDA’s oversight and evaluation expenses for 2006–2007 are detailed in Appendix B–5. Appendix B–6 contains the Fluid Milk Board’s approved budget for 2008. Appendix C–2 contains an independent auditor’s reports for the period of January 1 through December 31, 2007.

17
The following sections summarize the Fluid Milk Board medical and scientific; sponsorship; advertising; promotion; public relation; strategic thinking; and school marketing programs and activities for 2007.
Medical and Scientific Activities
The Fluid Milk Board’s Medical Advisory Board (MAB), comprised of academic, medical, and health care professionals with expertise relevant to the health benefits of fluid milk, met twice in 2007. The MAB provides guidance to the Fluid Milk Board’s development of key nutritional and health messages for consumers and health professionals. MAB members assisted the Fluid Milk Board in continuing relationships with health and health professional organizations such as the American Academy of Pediatrics, the American Dietetic Association, the American Heart Association, the National Cancer Institute, and the National Medical Association. They also appeared as medical professionals in the media, providing science-based statements supporting the health benefits of milk.
The medical and scientific activities of the Fluid Milk Board also included preparing press materials and acting as spokespersons on breaking research with relevance to fluid milk. The MAB worked extensively over the past year to inform others in the scientific community of the new and emerging research showing that three servings of milk each day as part of a daily nutrition plan may help people maintain a healthy weight. These communications and activities continue to highlight milk’s nutritional profile that includes nine essential vitamins and minerals.
The “Good For You” (GFY) program, with the primary goal of promoting milk’s nutritional benefits, continued to leverage breaking research with relevance to milk and is supported with advertising and public relations. The focus of GFY efforts was to inform consumers and the public about emerging research regarding the role milk may play in preventing weight gain and maintaining a healthy weight. The MAB was very involved in helping the Fluid Milk Board explore ways to leverage the information in public relations and advertising messages surrounding breaking research. A detailed accounting of 2007 research may be found in the
National Fluid Milk Programs
The Fluid Milk Board continued to execute a generic national fluid milk processor promotion program. The fluid milk marketing programs are research based and message focused for the purpose of positively changing the attitudes and purchase behavior of Americans regarding fluid milk. MilkPEP’s primary objectives are to increase the consumption of fluid milk and to identify and support growth opportunities for the fluid milk industry. The first half of 2007, the fluid milk marketing plans were designed to conduct marketing and promotional activities emphasizing milk’s role in supporting healthy weight loss. The latter half of the year, the messaging focused on milk’s weight maintenance benefits. Many communication media were used to accomplish these objectives, including television and print advertising, press releases, promotions, internet, and others. The program’s target audiences included women and moms, teens, and Hispanics.
MilkPEP newsroom’s got news? section of www.milkpep.org.

18
The got milk?®/Milk Mustache advertising campaign, continued to provide the basis for advertising activities and other program delivery methods. A description of the 2007 program activities follows.
Sponsorships
The Fluid Milk Board continued leveraging its multi-year partnership with Walt Disney Corporation®. The sponsorship provides a unique opportunity to raise milk’s image among teens and young adults by highlighting the message that milk is a great beverage of choice for active teens and for athletes of all ages. As part of the partnership, milk continued to be “the official training fuel” of Disney’s Wide World of Sports™, while the “Milk House,” a state-of-the art facility that hosts more than 30 championships and 20 tournaments for more than 40 different amateur sports (including baseball, football, soccer, volleyball, and inline hockey) annually, remained the centerpiece arena. The “Milk House” features prominently displayed got milk?® signage and milk mustache posters throughout the complex.
The Fluid Milk Board sponsored the Scholar Athlete Milk Mustache of the Year (SAMMY) program for the tenth year and awarded 25 high school students from various regions across the United States a $7,500 scholarship. Each applicant was required to list his/her high school achievements and tell why milk is an important beverage to include in his/her daily regimens. This year SAMMY received more than 66,000 applications. In addition to the scholarship award, each of the 25 winners were inducted into the SAMMY Hall of Fame and featured in a special milk mustache advertisement (Appendix G) which appeared in USA Today, SportsIllustrated, and ESPN magazine. Winners were selected by milk mustache celebrity judges.
Advertising
The Fluid Milk Board advertising program consisted of television and print advertising as well as media-driven promotions. The advertisements highlighted specific, relevant health-benefit messages about milk and its nutrient content, while media-driven promotions served to extend the advertising campaign.
The “Little Victories” television advertisement was created encouraging women to include 24 ounces daily of lowfat or fat-free milk as part of their daily diet to promote milk’s benefits. As the Fluid Milk Board evolved it’s messaging the ad was subsequently revised to promote milk’s weight maintenance benefits. The ad prominently featured women being active with their families and consuming milk. Additionally, a public-service type vignette was created featuring actress Mariska Hargitay extolling the benefits of consuming more lowfat or fat-free milk and encouraging moms to think about their drink.
Fluid milk print advertisements produced in 2007 included celebrity advertisements targeting moms and women; celebrity advertisements with the active, bone growth, and healthy weight

19
messages targeting teen boys and girls; contest and sweepstakes announcements and winners; Hispanic; school milk posters; and trade advertisements. The Fluid Milk Board leveraged a new logo for milk’s message: “Think About Your Drink”. Appendix G includes thumbnail images of the Fluid Milk Board’s television and print advertisements, public relations, and promotion efforts.
The national Hispanic advertising campaign continued as part of industry outreach to the growing Hispanic population. The advertisements continued to feature the popular tagline,“Más leche, Más logro” (“More milk, More achievement”), which reminds Hispanic moms to include 24 ounces daily of lowfat or fat-free milk to promote milk’s healthy weight benefits. Print advertising featured celebrities Maria Celeste, Barbara Mori, and Sara Ramirez, along with several Hispanic advertorials designed to compliment the general market’s weight maintenance message with an integrated Hispanic overlay. Hispanic consumers were directed to
Promotions
The Fluid Milk Board conducted promotions to help increase fluid milk sales in retail outlets.The promotions worked to move more milk out of the grocery store refrigerator and to increase sales in other retail outlets such as convenience stores, independent grocery stores, drug stores, and mass merchandisers. For some promotions, the Fluid Milk Board worked with partners to increase the appeal to consumers. Promotional activities continued to focus on feature incentives to increase advertisements, displays of milk, and programs offering prizes directly to consumers to help drive incremental purchases. Qualified Programs play an important role in the execution of these retail programs.
The Fluid Milk Board conducted four national promotions in 2007. The first promotion, “Think About Your Drink” was launched in January featuring personal fitness trainer Kathy Smith encouraging consumers to include lowfat or fat-free milk to support a healthy weight. The promotion offered consumers a chance to win 1 of 24 trips for 2 to La Costa Resort and Spa by
Spanish versions.
The second promotion, “Another Reason. Another Season.,” a 4-week retail promotion program launched in May, included a life-size refrigerator shipper in-store display encouraging women to think about their drink. Consumers were given free magnets with motivational slogans when
win a 2-week free membership at Curves® fitness centers.
The third promotion, “Give Your Family Something Smarter”, held in the August/September back-to-school period encouraged mom to give her family a beverage which could provide numerous health benefits for the whole family.
www.2424leche.com for more information on Hispanic healthy weight activities.
registering at www.2424milk.com. Promotional materials were available in both English and
they purchased milk and could enter online at www.thinkaboutyourdrink.com for a chance to

20
The final promotion, “Chocolate Milk – the Official Drink of Halloween,” held in October, focused on flavored milk as a healthy treat for moms to give her kids at Halloween. Retailers could choose prizes such as MP3 players to offer as in-store giveaways, employee incentives, or other ways to help increase flavored milk sales. Promotional point-of-sale materials included banners, wobblers, and static clings to aid retailers in creating exciting in-store displays. This promotion also included a Hispanic component. Appendix G includes thumbnail images of the Fluid Milk Board’s promotional activities.
Public Relations
The public relations programs continued to focus on (1) the nutritional benefits of milk; (2) emerging scientific studies that highlight milk’s benefits; (3) leveraging the high interest generated by the celebrities and the got milk?®/Milk Mustache campaign; and (4) preparing for and responding to misinformation and negative news about milk or the educational campaign. A wide variety of initiatives were implemented to reach specific target audiences. Almost 2 billion media impressions were garnered through the integrated public relations program. The program provided support for the four national retail promotions by helping to build public awareness and increase retailer participation.
For the tenth consecutive year, the Milk Mustache Mobile Tour made its way around the United States. This year’s tour, “Think About Your Drink,” (TAYD) ran from April through August, covering 75 cities nationwide, with 8 cities conducting Hispanic overlays. Events included Curves® workout equipment, fluid milk sampling, and health assessments by a nutritional expert. This year the tour trucks’ signage was again dedicated solely to moms and women, and featured celebrity moms. The TAYD tour provided consumers a “What America Drinks” report detailing Americans’ beverage consumption habits and encouraging choosing three glasses oflowfat or fat free milk daily as part of a healthy diet.
The 2007 “Healthy Student Bodies” program encouraged students to get fit and healthy. Students could write testimonials regarding their school’s fitness and nutrition efforts toward students. Fifty schools were awarded $1,000 grants to support fitness and nutrition programs and a special got milk?® recognition assembly. The students nominating
the winning schools were awarded sports gear and apparel from Adidas® and a year’s subscription to Sports Illustrated and Teen People.
MilkPEP continued to raise consumer awareness of a recent study through television, radio, print, and online stories as well as visiting cities nationwide to promote lowfat chocolate milk as a recovery drink to athletes in local walk/runs and other sporting events and by engaging local processors. The February 2006 issue of the International Journal of Sport Nutrition and Exercise Metabolism, featured a study which touted lowfat chocolate milk as a recovery beverage after strenuous exercise. The study, conducted at Indiana University, had nine endurance cyclists pedal bicycles until their muscles were depleted of energy, rest 4 hours, then bike again until exhaustion on three separate occasions. During the rest period, the cyclists

21
drank lowfat chocolate milk, a carbohydrate replacement sports drink, or a traditional fluid replacement sports drink. Cyclists who drank the lowfat chocolate milk were able to pedal nearly twice as long in the second round of exercise than those who consumed the carbohydrate replacement drink, and as long as those who consumed the fluid replacement drink.
continued to help processors with their local media efforts. This feature gave processors access to customizable media materials from National Programs such as the Milk Mustache Mobile to use in their own public relations efforts. Additionally, the Web site provided a
daily email to processors for breaking news, a list of dietetic spokespersons for use as a resource, processor success stories, and links to a searchable library of medical research studies.
Brochures, news releases, and other information on milk were made available to consumers
Strategic Thinking
The Fluid Milk Strategic Thinking Initiative (FMSTI) is a joint effort of the Fluid Milk Board, processors, and suppliers. This ongoing effort was established to address barriers to fluid milk consumption not targeted by the advertising, promotion, and public relations activities.
Over the years, FMSTI has conducted market tests and studies in various business channels to develop proven ways to increase milk sales and subsequently turned these studies into customer-
include reports on milk’s opportunities in vending, foodservice, convenience and drug store, supermarket and school foodservice channels. Some of the materials included are brochures focusing on new ways to get kids to drink more milk; vending sales kits containing results from the 2003 Multi-Channel Vending Test; and many other reports and studies published in prior years highlighting opportunities for increased milk sales.
Complete reports, studies, executive summaries, and press releases for FMSTI’s ongoing
School Marketing
FMSTI continued to conduct several seminars to educate processors on how to increase their milk sales at schools. The seminars were part of the “Capturing the School Milk Opportunity” program, which presents processors with a myriad of options they can implement to improve school milk. Seminar schedules continued to include presentations to representatives of the School Nutrition Association at various locations across the United States.
The MilkPEP newsroom’s “got news?” section at www.milkpep.org
through Web sites www.whymilk.com, www.milkpep.org, www.bodybymilk.com, and www.thinkaboutyourdrink.com.
friendly processor materials which may be found at www.milkdelivers.org. These materials
initiatives are available for processors on Web site www.milkpep.org and for customers at
the milk hotline at 1-800-945-MILK (6455.) www.milkdelivers.org. The presentations, videos, and printed materials are available by calling

22
The “Spotlight On” program continued in 2007 and recognized school professionals such as principals and food service directors who actively encouraged students to improve their health by consuming more milk. The program rewarded one contestant per month and a grand prize winner at the end of the year. Monthly winners received got milk?® cooler barrels for their schools and iPods® for themselves. Entrants shared their stories via essays submitted on
officials or members, and all school administrators. Winners were selected by a panel of dairy industry experts. MilkPEP posted all entries on the Web site in order to inspire more entries and to help inspire schools to improve milk opportunities to students such as introducing new flavors and packaging, hosting milk sampling days, or adding milk to the à la carte selections.
The Fluid Milk Board expanded its School Image Poster Program for the 2007–08 school year to help educate students and school food service professionals about the role milk plays in good nutrition. Kits were sent to 45,000 participating public middle and high school foodservice directors in August for the beginning of the school year
promoting the new BodyByMilkSM (BBMSM) campaign which spoke to teens directly about a healthy lifestyle which included drinking milk. Kits contained truck-sized posters, static clings, and banners to be displayed in school cafeterias. Smaller posters were sent to schools with cafeteria size limitations. More than 60,000 public elementary schools received posters with traditional health messages such as the “nine essential nutrients active bodies need.”
This year’s posters featured various artists, actors, and athletes such as Amanda Bynes, Steve Nash, Shrek, the cast of High School Musical, Olympic athletes (male and female versions), Laila Ali, Hayden Panettiere, and Masi Oka. The posters and other school materials are displayed in Appendix G. The BBMSM message encouraged teens to drink three glasses of lowfat or fat-free milk daily to give their bodies the nutrients they need, like protein to build muscle. Additionally, some studies suggest teens that choose milk tend to be leaner than those who choose sugary beverages. The BBMSM program integrated messaging in print advertising and promotion in the schools’ cafeterias, online, and at retail. Students were encouraged to save their UPC codes from milk containers and redeem them online for free music downloads at
www.milkdelivers.org. The program was open to school nutrition professionals, school board
www.bodybymilk.com.

23
Chapter 2 USDA Activities
The Dairy Programs unit of USDA’s Agricultural Marketing Service has day–to–day oversight responsibilities for the Dairy Board and the Fluid Milk Board. Dairy Programs oversight activities include reviewing and approving the Dairy and Fluid Milk Boards’ budgets, budget amendments, contracts, advertising campaigns, and investment plans. Approval of program materials is a major responsibility of Dairy Programs. Program materials are monitored for conformance with provisions of the respective Acts and Orders, USDA’s My Pyramid, the U.S. Dietary Guidelines for Americans, and with other legislation such as the Nutrition Labeling and Education Act.
Dairy Programs continues to ensure that the collection, accounting, auditing, and expenditure of promotion funds is consistent with the enabling legislation and orders; to certify Qualified Programs; and to provide for evaluation of the effectiveness of both promotion programs’ advertising campaigns. Dairy Programs assists the Boards in their assessment collection, compliance, and enforcement actions.
Other Dairy Programs responsibilities relate to nominating and appointing Board members, amending the orders, conducting referenda, and conducting periodic management reviews. Dairy Programs representatives attend full Board and committee meetings, and other meetings of consequence to the program.
National Dairy Promotion and Research Board Oversight
Nominations and Appointments
The 36 members of the Dairy Board who administer the program serve 3-year terms, with no member serving more than two consecutive terms. Dairy Board members must be active dairy producers and are selected by the Secretary of Agriculture from nominations submitted by producer organizations, general farm organizations representing dairy producers, Qualified Programs, or other interested parties.
Thirty-eight nominations were received by USDA for the 12 Dairy Board members whose terms expired October 31, 2007. A press release issued on October 16, 2007, announced the appointment of seven new members and five incumbents. All will serve 3–year terms ending October 31, 2010. Newly appointed were: James L. Zielinski, St. Paul, Oregon (Region 1); James L. Ahlem, Hilmar, California (Region 2); Stephen D. Maddox, Riverdale, California (Region 2); Brad J. Scott, Moreno Valley, California (Region 2); Pauline Tjaarda, Shafter, California (Region 2); William J. Herr, Greenwood, Wisconsin (Region 6); and Corrine M. Banker, Morrisville, New York (Region 12). Reappointed to serve second terms were: Grant Kohler, Midway, Utah (Region 3); Jose L. Gonzalez, Mesquite, New Mexico (Region 4); Paul L. Broering, Saint Henry, Ohio (Region 9); John M. Larson, Okeechobee, Florida (Region 10); and Paula A. Meabon, Wattsburg, Pennsylvania (Region 11).
24
A list of current Dairy Board members appears in Appendix A–1. Appendix H–1 is a map of the contiguous 48 States depicting the 13 geographic regions under the Dairy Promotion and Research Order (Dairy Order).
Organic Exemption
Effective February 14, 2005, any persons producing and marketing solely 100 percent organic products were exempted from paying assessments to any research and promotion program administered by the Agricultural Marketing Service (70 FR 2743, published January 14, 2005).The final rule amended Section 1150.157 of the Dairy Order. In States that have mandatory assessment laws, dairy producers are only exempt from the Federal assessment. Producers are still responsible for remittance of State assessments. In 2007, approximately 863 dairy producers were granted exemptions representing approximately 1 billion pounds of production. The Dairy Order requires producers to re-apply annually to continue to receive the exemption.
Amendment to the Dairy Act
On November 10, 2005, the President signed the Agriculture Appropriations Bill (Bill), which modified Section 781 of the Dairy Production Stabilization Act of 1983 (7 U.S.C. et seq.). The modification implemented a one-year allowance (during fiscal year 2006) for the National Dairy Promotion and Research Board to obligate and to expend funds for any activity to improve the environment and public health. Additionally, the Bill required the Secretary to review the impact of any expenditure pursuant to this change and include the review in the 2007 report of the Secretary to Congress on the dairy promotion program.
At its January 2006 meeting, the Dairy Board passed a motion authorizing expenditure of up to $6 million, administered and overseen by the National Milk Producers Federation (NMPF), to fund a portion of the National Air Emissions Monitoring Study (NAEMS). The NAEMS is intended to collect air emission data and create tools that all dairies can use, whether they are participating in the Environmental Protection Agency Air Quality Compliance Agreement (Consent Agreement) or not, to determine whether their air emission levels are in excess of the Clean Air Act thresholds and Comprehensive Environmental Response, Compensation and Liability Act and Emergency Planning and Community Right to Know Act reporting requirements. The Consent Agreement was developed to offer protection to operations while research is conducted to determine the size and type of farms that may have regulatory responsibilities. Currently, little air emissions data exists for dairy operations.
NMPF is responsible for representing the interests of the Dairy Board with the Agriculture Air Research Council (AARC), through two board members on the AARC. The AARC is the non-profit organization formed to administer the air emission study and manage the accounting of the funds for all livestock and poultry groups involved.
The latest report of the AARC notes that the study is approximately 50 percent complete. The study is projected to conclude in the first half of 2010; and the focus will shift to wrap-up, equipment reconciliation, site decommissioning, and final data transfer to the Environmental Protection Agency (EPA). EPA will have up to 18 months to complete the data interpretation.

25
Foreign Agricultural Service
The Secretary of Agriculture has delegated oversight responsibility for all foreign market development activities outside the United States to the Foreign Agricultural Service (FAS) (7 CFR 2.43(a)(24)). FAS reviews the USDEC foreign market development plan and related export contracts. USDEC export contracts also are reviewed by AMS Dairy Programs to ensure conformance with the Dairy Production Stabilization Act of 1983 (Dairy Act), Dairy Order, and with established USDA policies. In 2007, the USDA’s Foreign Market Access Program and the Market Promotion Program provided matching funds to USDEC for dairy product promotion and market research in Japan, Mexico, Southeast Asia, South Korea, and Latin America.
Contracts
The Dairy Act and Dairy Order require that all contracts expending assessment funds be approved by the Secretary (7 CFR 1150.140). During 2007, Dairy Programs reviewed and approved 343 Dairy Board and Dairy Management Inc. (DMI) agreements, amendments, and annual plans. Funding approvals were from the 2005 and 2006 fiscal periods. Appendix D–1 lists the contractors and corresponding Board initiatives approved by USDA.
Contractor Audits
During 2007, DMI retained the certified public accounting firm Ernst & Young to audit the records of the following contractors: Edelman Public Relations Worldwide (public relations and communication), WebMD (marketing communications), Children’s Hospital, Oakland Research Institute (research), The NPD Group (marketing), and Arab Marketing Finance, Inc. (export).These contractors represented expenditures totaling approximately $11.4 million. One of the five audits had minor findings, and the contractor has agreed to take corrective action based on the auditor’s recommendation. DMI continues to enhance procedures to improve management and internal controls over contracts.
Collections
The Dairy Act specifies that each person making payments to a producer for milk produced in the United States and purchased from the producer shall, in the manner as prescribed by the order, collect an assessment based upon the number of hundredweights of milk for commercial use handled for account of the producer and remit the assessment to the Dairy Board. The current rate of assessment is 15 cents per hundredweight of milk for commercial use or the equivalent thereof as determined by the Secretary.
The Dairy Act provides that dairy farmers can direct up to 10 cents of their 15-cent per hundredweight assessment to Qualified Programs. During 2007, the Dairy Board receivedabout 5.04 cents of the 15-cent assessment.

26
Compliance
Compliance by responsible persons in filing reports and remitting assessments continues in a timely manner and at a high rate. No significant differences were discovered when comparing the audit results to what was reported by the responsible persons. The Dairy Board verifies that the credits claimed by responsible persons are actually sent to Qualified Programs. This verification is done by contract with each Qualified Program. When noncompliance exists, the Dairy Board takes initial action on the matter. If the Dairy Board is unsuccessful in resolving the violation, the matter is referred to USDA for further action.
Qualified Programs
Dairy Programs reviewed applications for continued qualification from 58 Qualified Programs. A list of the active Qualified Programs is provided in Appendix F. Consistent with its responsibility for monitoring the Qualified Programs, Dairy Programs obtained and reviewed income and expenditure data from each of the programs. The data reported from the Qualified Programs are included in aggregate form for 2006 and 2007 in Appendix B–7 andAppendix B–8.

27
National Fluid Milk Processor Promotion Board Oversight
Nominations and Appointments
The 20 members of the Fluid Milk Board serve 3-year terms, with no member serving more than two consecutive terms. The Fluid Milk Promotion Order (Fluid Order) provides that no company shall be represented on the board by more than three representatives. Fluid MilkBoard members who fill vacancies with a term of 18 months or less are permitted to serve 2 additional 3-year terms. Fluid Milk Board members are selected by the Secretary from nominations submitted by fluid milk processors, interested parties, and eligible organizations.
In a news release issued on February 29, 2008, the Secretary announced three reappointments and six new appointments to the Fluid Milk Board. Reappointed to serve a second term were:Brian Haugh, Dallas, Texas (Region 8); and Michael A. Krueger, Phoenix, Arizona (At-Large Processor). Re-appointed to serve a first term after filling a vacancy lasting less than 18 months was Jay B. Simon, Stockton, California (Region 14). Newly appointed were: James F. Walsh, Lynnfield, Massachusetts (Region 2); Michael R. Smith, Lakeland, Florida (Region 5); and Steven M. Turner, Covington, Tennessee (Region 11). The reappointed and newly appointed members were officially seated at the July 17-19, 2008, meeting. The terms for these appointees will expire on June 30, 2010. Filling vacancies with less than 18 months remaining were: John R. Zuroweste, Dallas, Texas (Region 12); Charles S. Mayfield, Jr. (At-Large Processor); and Janey K. Thornton, Ph.D. (At-Large Public), who were officially seated at the April meeting. Additionally, in a press release issued June 3, 2008, Jay S. Bryant, Reston, Virginia (Region 6) was appointed to fill a vacancy with less than 18 months remaining. The term for these positions expires June 30, 2009.
A list of current Fluid Milk Board members appears in Appendix A–2. Appendix H–2 shows a map depicting the 15 geographic regions under the Fluid Milk Order.
Program Development
The Fluid Milk Board contracted with the International Dairy Foods Association (IDFA) to manage the program. Mid-year, the Fluid Milk Board restructured its operations and contracted directly with Lowe Worldwide; DRAFTFCB; Weber Shandwick; and Siboney, USA, to develop its mom and teen advertising, promotions, consumer education/public relations, and Hispanic advertising/public relations, respectively.
Contractor Audits
The Fluid Milk Board retained the certified public accounting firm of Synder, Cohn, Collyer, Hamilton & Associates, P.C., to audit the records of Lowe Worldwide, in order to determine if the agency had conformed to the financial compliance requirements specified in its agreement with the Board for the period of January 1 through December 31, 2007.

28
The Board continues to enhance its internal contract control system in order to ensure that the amounts invoiced to the Board are in compliance with established contracts and procedures.
Compliance
Compliance by fluid milk processors in filing reports and remitting assessments continues in a timely manner and at a high rate.

29
Chapter 3 Impact of Generic Fluid Milk and Dairy Advertising and Promotion on
Dairy Markets: An Independent Analysis
The Dairy Production and Stabilization Act of 1983 (Dairy Act; 7 U.S.C. 4514) and the Fluid Milk Promotion Act of 1990 (Fluid Milk Act; 7 U.S.C. 6407) require an annual independent analysis of advertising and promotion programs that operate to increase consumer awareness and sales of fluid milk and related dairy products. From 1988 through 1994, USDA conducted the independent analyses of the National Dairy Promotion and Research Program (Dairy Program), as authorized by the Dairy Act, and issued an annual Report to Congress on the effectiveness of the Dairy Program. From 1995 through 1997, the USDA analyses evaluated the effectiveness of the Dairy Program in conjunction with the National Fluid Milk Processor Promotion Program (Fluid Milk Program), authorized by the Fluid Milk Act. Since 1998, these independent analyses have been conducted by agricultural economists from Cornell University.
The economic evaluation focuses on generic marketing activities by dairy farmers and fluid milk processors that are designed to increase the demand for fluid milk and dairy products. The results of two separate models are presented. The first model is a fluid milk-only demand model used to evaluate the economic impacts of all generic fluid milk marketing activities of both programs on fluid milk demand. The generic fluid milk marketing activities include fluid milk advertising and non-advertising marketing activities used to increase demand. Similar to last year’s study, the marketing activities are divided into two general categories: advertising and non-advertising marketing activities. Advertising includes all media activities such as television, print, radio, and outdoor advertising. Non-advertising marketing includes retail programs, school marketing, food service and manufacturing programs, integrated communications, public relations, sales promotions, nutrition education, retail programs, and sponsorships conducted by fluid milk processors and dairy farmers. The advertising and non-advertising marketing variables represent all demand enhancing activities by fluid milk processors and dairy farmers. They do not include expenditures on overhead, longer-term business development programs, research, loan and grants, technical support, industry relations, and corporate technology. While the dairy farmers’ and fluid milk processors’ programs utilize various types of marketing strategies to increase fluid milk consumption, the effects of fluid milk marketing under both programs are combined because the objectives of both programs are the same and data cannot be satisfactorily segregated to evaluate the two programs separately.
The second model is a combined fluid milk and dairy product demand model (measured in terms of domestic commercial disappearance) used to evaluate the economic impacts of all generic marketing activities for those products. This model, which is hereafter referred as the “all-dairy products” model, is included because the dairy farmer programs now emphasize an “all dairy” promotion strategy over product-specific campaigns. As in the first model, marketing activities in the second include generic advertising and non-advertising marketing activities. Also, advertising and non-advertising marketing strategies are included as two separate variables in the demand model. Unlike the first model, the marketing activities in the second model include activities for all-dairy products (fluid and manufactured dairy products). This model provides a

30
measure of the economic impact of all demand-enhancing, generic marketing activities by processors and farmers.
Highlights
While per capita fluid milk consumption has been declining for decades in the United States, generic fluid milk marketing activities sponsored by fluid milk processors and dairy farmers have helped mitigate some of this decline. We estimate that these marketing efforts have had a positive and statistically significant impact on per capita fluid milk consumption. Specifically, over the period 1995 through 2007, we estimate that a 1.0 percent increase in generic fluid milk advertising expenditures resulted in a 0.057 percent increase in per capita fluid milk consumption when holding all other demand factors constant. Over the same period, we estimate that a 1.0 percent increase in generic fluid milk non-advertising marketing expenditures resulted in a 0.062 percent increase in per capita fluid milk consumption when holding all other demand factors constant.
In terms of total consumption of fluid milk, generic fluid milk marketing activities increased fluid milk consumption by 30 billion cumulative pounds from 1998 to 2007, or 3 billion pounds per year on average. Put differently, had there not been generic fluid milk marketing conducted by the two National Programs, fluid milk consumption would have been 5.4 percent less than it actually was over this time period. Hence, the combined fluid milk marketing efforts by dairy farmers and fluid milk processors have had a positive and statistically significant impact that is partially mitigating declines in fluid milk consumption. Moreover, it appears that the performance of these marketing programs has become more effective over time. For instance, in 1998, it is estimated that fluid milk consumption would have been 4.8 percent lower in the absence of the two programs, while in 2007, milk consumption would have been 6.1 percent lower in the programs’ absence.
In terms of the all-dairy product demand analysis, the average generic dairy advertising elasticity for this period on a non-fat and a fat basis was 0.027 and 0.029, respectively; a 1.0 percent increase in media advertising expenditures would increase per capita all-dairy product demand by 0.027 (non-fat basis) and 0.029 (fat basis) percent. The average non-advertising marketing elasticity for this period was 0.016 (non-fat) and 0.029 (fat); a 1.0 percent increase in media advertising expenditures would increase per capita all-dairy product demand by 0.016 (non-fat) and 0.029 (fat) percent. Thus, the total marketing (advertising and non-advertising) effort by dairy farmers and fluid milk processors has had a positive and statistically significant impact on dairy consumption.
Cornell calculated the benefit–cost ratio (BCR) for the Dairy Program for the period 1998 through 2007. The benefits of the Dairy Program were calculated as the change in dairy farmers’ net revenue (producer surplus) due to demand enhancement from all marketing activities under the Dairy Program by way of increased sales and higher prices. The costs of the Dairy Program were calculated as the difference in total assessment revenues before and after the National Program was enacted. The results show that the average BCR for the Dairy Program was 5.52 (non-fat solids basis) and 5.94 (milk-fat basis) from 1998 through 2007. This means that each dollar invested in generic dairy marketing by dairy farmers during the period would return
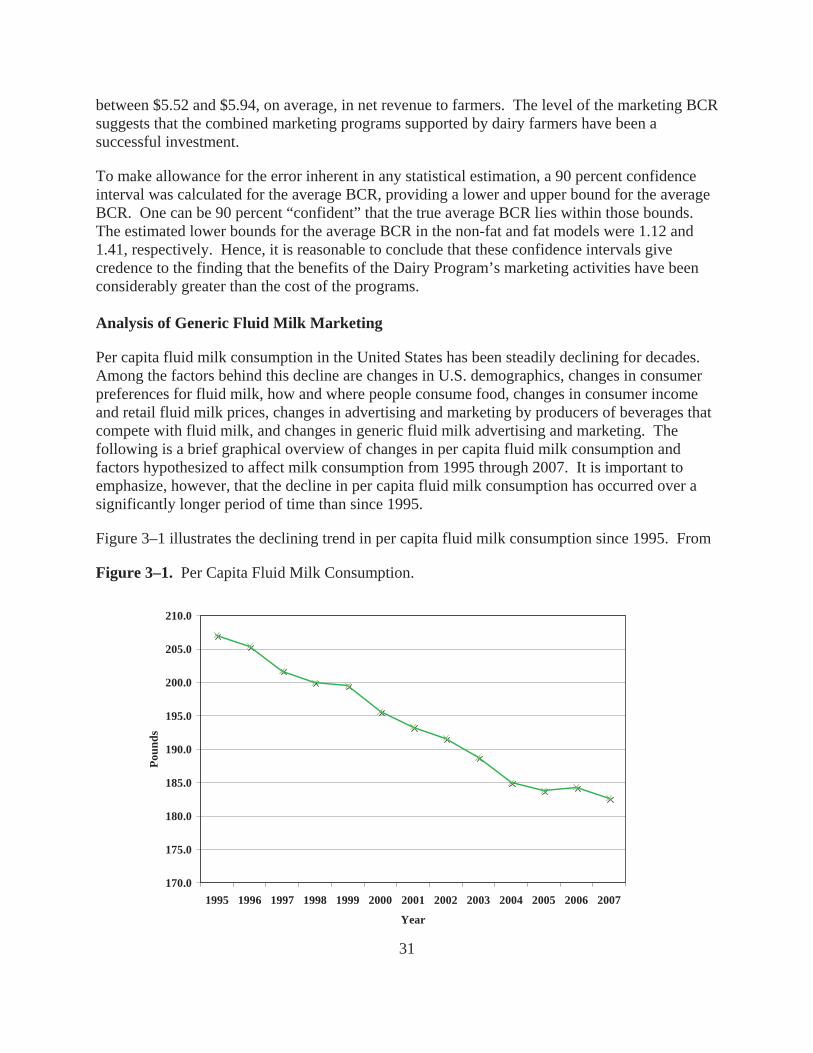
31
between $5.52 and $5.94, on average, in net revenue to farmers. The level of the marketing BCR suggests that the combined marketing programs supported by dairy farmers have been a successful investment.
To make allowance for the error inherent in any statistical estimation, a 90 percent confidence interval was calculated for the average BCR, providing a lower and upper bound for the average BCR. One can be 90 percent “confident” that the true average BCR lies within those bounds. The estimated lower bounds for the average BCR in the non-fat and fat models were 1.12 and 1.41, respectively. Hence, it is reasonable to conclude that these confidence intervals give credence to the finding that the benefits of the Dairy Program’s marketing activities have been considerably greater than the cost of the programs.
Analysis of Generic Fluid Milk Marketing
Per capita fluid milk consumption in the United States has been steadily declining for decades. Among the factors behind this decline are changes in U.S. demographics, changes in consumer preferences for fluid milk, how and where people consume food, changes in consumer income and retail fluid milk prices, changes in advertising and marketing by producers of beverages that compete with fluid milk, and changes in generic fluid milk advertising and marketing. The following is a brief graphical overview of changes in per capita fluid milk consumption and factors hypothesized to affect milk consumption from 1995 through 2007. It is important to emphasize, however, that the decline in per capita fluid milk consumption has occurred over a significantly longer period of time than since 1995.
Figure 3–1 illustrates the declining trend in per capita fluid milk consumption since 1995. From
Figure 3–1. Per Capita Fluid Milk Consumption.
170.0
175.0
180.0
185.0
190.0
195.0
200.0
205.0
210.0
1995 1996 1997 1998 1999 2000 2001 2002 2003 2004 2005 2006 2007
Year
Pou
nds
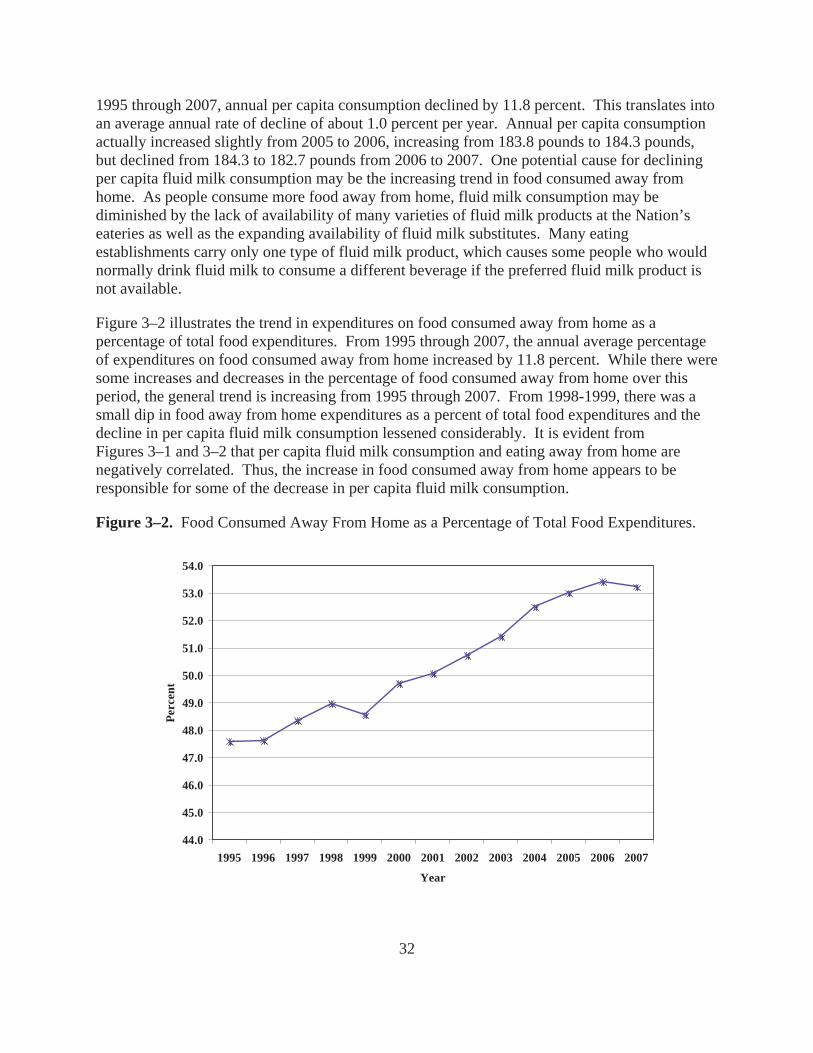
32
1995 through 2007, annual per capita consumption declined by 11.8 percent. This translates into an average annual rate of decline of about 1.0 percent per year. Annual per capita consumption actually increased slightly from 2005 to 2006, increasing from 183.8 pounds to 184.3 pounds, but declined from 184.3 to 182.7 pounds from 2006 to 2007. One potential cause for declining per capita fluid milk consumption may be the increasing trend in food consumed away from home. As people consume more food away from home, fluid milk consumption may be diminished by the lack of availability of many varieties of fluid milk products at the Nation’s eateries as well as the expanding availability of fluid milk substitutes. Many eating establishments carry only one type of fluid milk product, which causes some people who would normally drink fluid milk to consume a different beverage if the preferred fluid milk product is not available.
Figure 3–2 illustrates the trend in expenditures on food consumed away from home as a percentage of total food expenditures. From 1995 through 2007, the annual average percentage of expenditures on food consumed away from home increased by 11.8 percent. While there were some increases and decreases in the percentage of food consumed away from home over this period, the general trend is increasing from 1995 through 2007. From 1998-1999, there was a small dip in food away from home expenditures as a percent of total food expenditures and the decline in per capita fluid milk consumption lessened considerably. It is evident from Figures 3–1 and 3–2 that per capita fluid milk consumption and eating away from home are negatively correlated. Thus, the increase in food consumed away from home appears to be responsible for some of the decrease in per capita fluid milk consumption.
Figure 3–2. Food Consumed Away From Home as a Percentage of Total Food Expenditures.
44.0
45.0
46.0
47.0
48.0
49.0
50.0
51.0
52.0
53.0
54.0
1995 1996 1997 1998 1999 2000 2001 2002 2003 2004 2005 2006 2007
Year
Per
cent

33
A second factor for declining per capita fluid milk consumption may be changes in U.S. demographics. One important change is the declining proportion of young children in the population since 1995 (the decline has leveled out since 2002). Since young children are one of the largest milk-consuming cohorts, any decline in that cohort negatively impacts per capita fluid milk consumption. Figure 3–3 shows the percentage of the population that was under 6 years old from 1995 through 2007, a segment of the population that decreased 9 percent between 1995 and 2002. Therefore, there is a positive correlation between per capita fluid milk consumption and this age cohort—both are declining.
Since 1995, the retail price of fluid milk products has generally been rising relative to other nonalcoholic beverages. This pattern is displayed in Figure 3–4 (note that any value above1.0 means the consumer price index for fluid milk is higher than the consumer price index for nonalcoholic beverages). While there have been some periods since 1995 where retail fluid milk prices declined relative to other beverage prices, there is clearly an increasing trend over time making milk more expensive than other nonalcoholic beverages. From 1995 through 2007, annual average fluid milk prices rose 34.3 percent relative to other beverages. These retail fluid milk price increases are likely responsible for some of the decline in per capita fluid milk consumption. Between 2004 and 2006, the price of fluid milk declined relative to other beverages, which may be an important reason for the slight increase in per capita consumption in 2006. However, in 2007, the retail price of milk increased by almost 9 percent and per capita consumption declined by 0.9 percent.
Fluid milk’s loss of market share to other beverages also may be due to aggressive marketing by
Figure 3–3. Percent of Population Under 6 Years of Age.
7.6
7.8
8.0
8.2
8.4
8.6
8.8
9.0
1995 1996 1997 1998 1999 2000 2001 2002 2003 2004 2005 2006 2007
Year
Per
cent

34
Figure 3–4. Retail Price of Fluid Milk Relative to Other Nonalcoholic Beverage Prices.
0.90
0.95
1.00
1.05
1.10
1.15
1.20
1.25
1.30
1.35
1.40
1995 1996 1997 1998 1999 2000 2001 2002 2003 2004 2005 2006 2007
Year
CP
I M
ilk/C
PI
Oth
er B
ever
ages
competing beverage producers. Indeed, both dairy farmers and fluid milk processors started generic marketing programs to combat competing marketing from other beverage producers.
Figure 3–5 displays the combined real advertising expenditures (in 2007 dollars) of several
Figure 3–5. Real Bottled Water, Soy Beverage, and Fruit Juice Advertising (in 2007 dollars).
0
100
200
300
400
500
600
700
800
900
1995 1996 1997 1998 1999 2000 2001 2002 2003 2004 2005 2006 2007
Year
Mill
ion
$
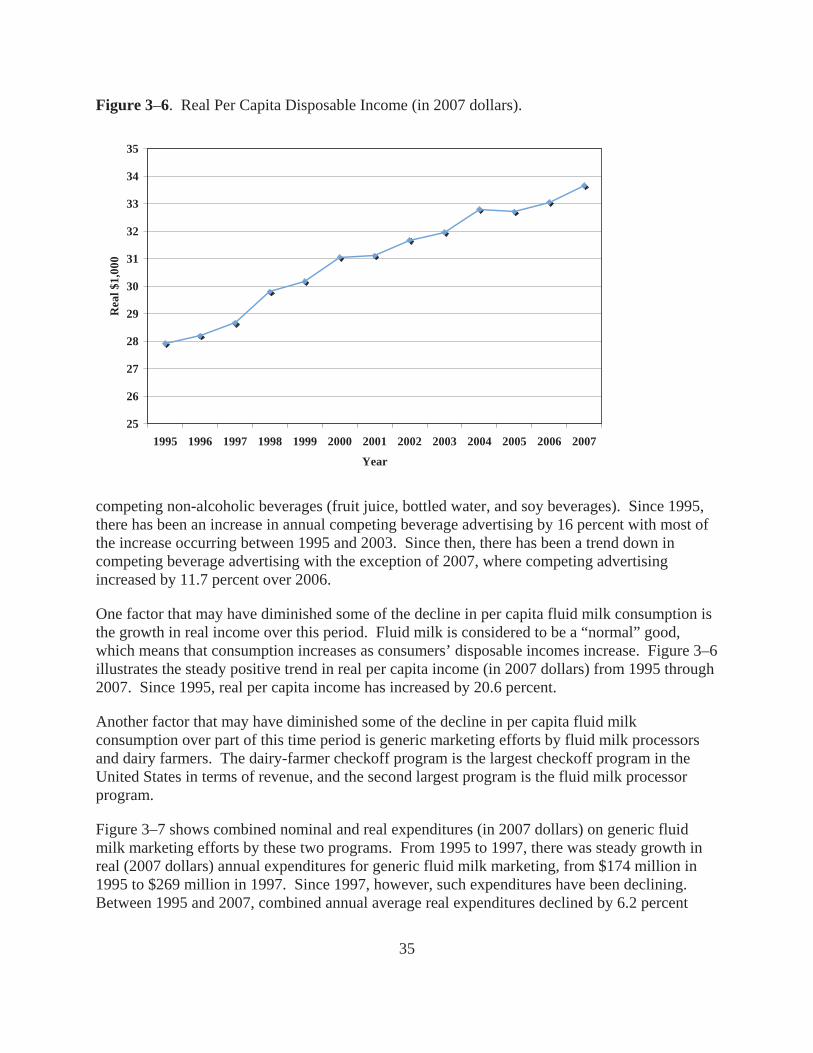
35
Figure 3–6. Real Per Capita Disposable Income (in 2007 dollars).
25
26
27
28
29
30
31
32
33
34
35
1995 1996 1997 1998 1999 2000 2001 2002 2003 2004 2005 2006 2007
Year
Rea
l $1,
000
competing non-alcoholic beverages (fruit juice, bottled water, and soy beverages). Since 1995, there has been an increase in annual competing beverage advertising by 16 percent with most of the increase occurring between 1995 and 2003. Since then, there has been a trend down in competing beverage advertising with the exception of 2007, where competing advertising increased by 11.7 percent over 2006.
One factor that may have diminished some of the decline in per capita fluid milk consumption is the growth in real income over this period. Fluid milk is considered to be a “normal” good, which means that consumption increases as consumers’ disposable incomes increase. Figure 3–6 illustrates the steady positive trend in real per capita income (in 2007 dollars) from 1995 through 2007. Since 1995, real per capita income has increased by 20.6 percent.
Another factor that may have diminished some of the decline in per capita fluid milk consumption over part of this time period is generic marketing efforts by fluid milk processors and dairy farmers. The dairy-farmer checkoff program is the largest checkoff program in the United States in terms of revenue, and the second largest program is the fluid milk processor program.
Figure 3–7 shows combined nominal and real expenditures (in 2007 dollars) on generic fluid milk marketing efforts by these two programs. From 1995 to 1997, there was steady growth in real (2007 dollars) annual expenditures for generic fluid milk marketing, from $174 million in 1995 to $269 million in 1997. Since 1997, however, such expenditures have been declining. Between 1995 and 2007, combined annual average real expenditures declined by 6.2 percent

36
Figure 3–7. Real and Nominal Total Fluid Milk Marketing Expenditures.
0
50
100
150
200
250
300
1995 1996 1997 1998 1999 2000 2001 2002 2003 2004 2005 2006 2007
Year
Mill
ion
$
Nominal Real
reaching a low of $163 million in 2007. This decline may have had an impact on declining per capita fluid milk consumption over this period. In nominal terms, there has actually been a53 percent increase in total annual generic fluid milk marketing expenditures since 1995. In 1995, nominal annual expenditures totaled $106 million for the two programs, while in 2007 nominal annual expenditures totaled $162 million. Hence, the erosion in real expenditures has been entirely due to inflation.
Most of the decline in fluid milk marketing has been due to decreases in expenditures by dairy farmers. Figure 3–8 displays real marketing expenditures fluid milk processors and dairy farmers separately 1995. Dairy farmers have significantly decreased their real marketing expenditures for fluid milk since 1995, from $174 million to $74 million, a 57.2 percent decrease. Fluid milk processors have had a slight decline in real expenditures from their peak in 2001, but have not decreased expenditures nearly as much as dairy farmers.
Figure 3-9 displays real generic fluid milk advertising expenditures and generic non-advertising marketing expenditures by dairy farmers and fluid milk processors. It is clear from this figure that there has been a shift away from advertising towards non-advertising marketing activities over this period. Indeed, real generic fluid milk non-advertising marketing expenditures increased by $57 million annually. The shift away from advertising has been primarily done by the dairy farmer program.

37
Figure 3–8. Real Generic Fluid Milk Marketing Expenditures by Fluid Milk Processors and Dairy Farmers.
0
20
40
60
80
100
120
140
160
180
200
1995 1996 1997 1998 1999 2000 2001 2002 2003 2004 2005 2006 2007
Year
Mill
ion
$
Processor Farmer
Figure 3–9. Real Generic Fluid Milk Advertising and Non-advertising Marketing Expenditures.
0
50
100
150
200
250
1995 1996 1997 1998 1999 2000 2001 2002 2003 2004 2005 2006 2007
Year
Mill
ion
$
Advertising Nonadvertising marketing

38
Fluid Milk Model Estimation
To more formally evaluate the relationship between per capita fluid milk consumption and factors hypothesized to influence that consumption, we used an econometric modeling approach. Because there are factors other than generic advertising by dairy farmers and fluid milk processors that influence the demand for fluid milk, we used this model to identify the effects of individual factors affecting demand. The following variables were included as factors influencing per capita fluid milk demand: the consumer price index (CPI) for fluid milk; the CPI for nonalcoholic beverages, which was used as a proxy for fluid milk substitutes; the percentage of the U.S. population under 6 years old; per capita disposable income; variables to capture seasonality in fluid milk demand; expenditures on food consumed away from home as a percentage of total food expenditures; expenditures on competing beverage advertising (bottled-water, juice, and soy beverage advertising combined), expenditures on generic fluid milk advertising, and expenditures on generic fluid milk non-advertising marketing activities.1 Since the goals of the farmer and processor marketing programs are the same with regards to fluid milk, all generic fluid milk advertising by both programs were aggregated into a single advertising variable, and all generic fluid milk non advertising marketing by both programs were aggregated into a single advertising variable, and all generic fluid milk non-advertising marketing by both programs were aggregated into a single non-advertising marketing variable.
The model was estimated with national quarterly data from 1995 through 2007. To account for the effects of inflation, prices and income were deflated by the consumer price index. Generic fluid milk advertising and competing advertising expenditures were deflated by a media cost index computed from annual changes in advertising costs by media type. Generic fluid milk advertising and competing advertising expenditures were deflated by the CPI for all items. Because both advertising and non-advertising marketing have a carry-over effect on demand, past fluid milk marketing expenditures also were included in the model as explanatory variables using a distributed-lag structure.2 Similar procedures were used to capture this carry-over effect for competing advertising.
The impacts of variables affecting demand can be represented with what economists call “elasticities.” Elasticities measure the percentage change in per capita demand given a1.0 percent change in one of the identified demand factors while holding all other factors constant. Table 3–1 provides average elasticities for the period 1995 through 2007 for model
1 As mentioned in the introduction, the advertising expenditures include media expenditures for television, radio, print, and outdoor advertising, while the non-advertising marketing expenditures included funds spent on fluid milk public relations, sales promotions, nutrition education, retail programs, and sponsorships by dairy farmers and fluid milk processors. 2 Specifically, a second-degree polynomial lag structure with both end point restrictions was imposed. The demand model included current advertising expenditures and eleven quarters of lagged advertising expenditures to capture the carry-over effect of advertising. Similarly, current non-advertising marketing expenditures and seven quarters of lagged expenditures were included to capture the carry-over effect of non-advertising marketing. Competing advertising included current and five quarters of lagged expenditures. The length of lag used here indicates that such demand enhancing activities as the got milk?®, the 3-A-Day of Dairy™ promotional campaign, and the milk mustache campaigns have long-lasting effects on consumers.

39
Table 3–1. Average Elasticity Values (1995–2007) for Factors Affecting the Per Capita Retail Demand for Fluid Milk.*
Demand Factor Elasticity
Percent of population under 6 years of age 1.585**Percent of food away from home expenditures –0.489**Retail fluid milk price –0.096**Per capita income 0.141**Bottled-water + soy beverage + fruit juice advertising –0.018**Generic fluid milk advertising 0.057**Generic fluid milk non-advertising marketing 0.062**
*Example: A 1.0 percent increase in the retail price of fluid milk is estimated to reduce per capita sales of fluid milk by 0.096 percent. For more information on the data used, see Table 3–3 at the end of this chapter. ** Statistically significant at the 1.0 percent significance level or less.
variables all of which have a statistically significant effect on consumption.3 For example, aprice elasticity of demand for fluid milk equal to –0.096 means that a 1.0 percent increase in the real (inflation-adjusted) retail fluid milk price decreases per capita fluid milk quantity demanded by 0.096 percent when holding all other demand factors constant.
The most important factors influencing per capita fluid milk demand are demographic changes and the proportion of food expenditures on food eaten away from home. While not as large in magnitude, retail fluid milk prices, income, expenditures on generic fluid milk advertising and non-advertising marketing efforts, and competing beverage advertising expenditures also impacted per capita fluid milk demand. Each factor is further discussed in detail.
The percentage of the population under 6 years of age was the most important factor affecting fluid milk consumption. This factor has an estimated elasticity of 1.585, which means that a1.0 percent increase in this age cohort measure would result in a 1.585 percent increase in per capita fluid milk demand when holding all other demand factors constant. This result is consistent with previous studies,4 that show that one of the largest fluid milk-consuming segments of the population is young children. While this age cohort has declined since 1995, it has been slowly rising the last several years, which should have a mitigating influence on declining per capita fluid milk consumption.
3 The estimated model fits the data extremely well. All variables were statistically significant at the 1.0 percent significance level or better. The adjusted goodness-of-fit measure indicated that the explanatory variables explained over 98 percent of the variation in per capita fluid milk consumption. Various statistical diagnostics were performed and no statistical problems were found except for auto-correlation, which was corrected for using a moving average error correction procedure. 4 A fluid supply equation was also estimated in order to estimate the price response to the simulated increase in demand. The own price elasticity of supply was estimated to be 0.046 and was incorporated into this simulation.

40
The amount of food that is consumed away from home, measured in this model as real per capita expenditures on food eaten away from home as a percentage of total expenditures on food, has an elasticity of –0.489. This means that a 1.0 percent increase in the food consumed away from home would measure result in a 0.489 percent decrease in fluid milk demand when holding all other demand factors constant. As mentioned previously, this negative relationship may be due to the limited availability of fluid milk products and high availability of fluid milk substitutes at many eating establishments, which frequently offer only one or two types of milk beverages. One can hypothesize that because of these limited choices, some people who would ordinarily choose fluid milk choose another beverage instead. This result suggests the need to target the retail food service industry in an effort to increase away from home consumption. Efforts to increase the variety of fluid milk beverages offered to customers may increase the competitiveness of fluid milk. Indeed, this year’s estimated elasticity is lower than last year’s which may be due to successful efforts by the dairy industry in expanding the availability of fluid milk products for away from home consumption.
Not surprisingly, the retail price of fluid milk has a negative and statistically significant impact on per capita demand. The results indicate that a 1.0 percent increase in the real retail price of fluid milk would result in a 0.096 percent decrease in per capita fluid milk quantity demanded. The magnitude of this elasticity is relatively small, which indicates that U.S. consumers’ fluid milk purchasing behavior is relatively insensitive to changes in the retail price. This result, which is consistent with the other studies, is likely due to the fact that fluid milk is generally regarded as a staple commodity in the United States. However, as described in the previous section, the retail price of fluid milk has increased substantially since 1995 (34.3 percent) relative to the price of other beverages. Consequently, the increase in fluid milk prices has significantly contributed to the decline in per capita consumption. For instance, had the real price remained constant since 1995 instead of increasing by 34.3 percent, per capita fluid milk consumption would have been 3.3 percent higher today than it actually is.
Per capita disposable income has a positive and statistically significant impact on per capita fluid milk consumption. A 1.0 percent increase in real per capita income would result in a0.141 percent increase in per capita fluid milk demand, holding all other demand factors constant. Similar to the price elasticity in magnitude, the income elasticity is consistent with the notion of fluid milk products as a staple commodity in the United States. With income up by 20.6 percent since 1995, this has lessoned the decline in per capita fluid milk consumption. Holding all other factors constant, this 20.6 percent increase in real income increased per capita fluid milk consumption by 2.9 percent.
Combined soy beverage, juice, and bottled-water advertising also has had a negative impact on fluid milk demand during the study period. The estimated fluid milk demand elasticity with respect to soy beverage, juice, and bottled-water advertising is –0.018, and statistically significant. There has been a 16 percent increase in advertising expenditures for these three commodities since 1995, and hence, this likely had a negative impact on fluid milk consumption over this time period. In other words, had there been no increase in competing advertising since 1995, per capita fluid milk consumption would have been almost 0.3 percent higher today than it actually is.

41
Finally, the generic fluid milk marketing activities conducted by fluid milk processors and dairy farmers have had a positive and statistically significant impact on per capita fluid milk demand. The average advertising elasticity is computed to be 0.057 and is statistically significantly different from zero at the 1.0 percent significance level. Thus, a 1.0 percent increase in generic fluid milk advertising would increase per capita fluid milk consumption by 0.057 percent holding all other demand factors constant. The generic non-advertising marketing elasticity is computed to be 0.062 and is statistically significant at the 1.0 percent significance level. In terms of relative elasticities, there is no statistical difference in estimated advertising and non-advertising elasticities. One could say estimated effects of advertising and non-advertising are virtually the same.
Fluid Milk Model Simulation
To examine the impact of dairy farmer and fluid milk processor marketing on total consumption of fluid milk, the estimated demand equation was simulated for two scenarios for the period from 1998 through 2007: (1) a baseline scenario in which the combined fluid milk marketing (advertising and non-advertising) expenditures were equal to actual marketing expenditures under the two programs, and (2) a no-national-Dairy-Program, no-Fluid-Milk-Processor-Program scenario in which there was no fluid milk-processor-sponsored marketing and dairy-farmer-sponsored fluid milk marketing was reduced to 42 percent of actual levels to reflect the difference in assessment before the National Program was enacted. A comparison of these two scenarios provided a measure of the impact of the national Dairy and Fluid Milk Programs.
Figure 3–10 displays the simulation results for annual fluid milk consumption for the two scenarios. From 1998 through 2007, these marketing activities were responsible for creating30 billion cumulative pounds of fluid milk consumption, which averages to 3 billion pounds per year. Put differently, had there not been generic fluid milk marketing conducted by the two National Programs, fluid milk consumption would have been 5.4 percent less than it actually was over this time period. Hence, the bottom line is that the fluid milk marketing efforts by dairy farmers and fluid milk processors combined have had a positive and statistically significant impact that is partially mitigating declines in per capita fluid milk consumption. Moreover, it appears that the performance of these marketing programs has become more effective over time. This can be seen by the widening of the gap in fluid milk disappearance between the two scenarios over time in Figure 3–10. For instance, in 1998, it is estimated that fluid milk consumption would have been 4.8 percent lower in the absence of the two programs, while in 2007, milk consumption would have been 6.1 percent lower in the programs’ absence.
Analysis of All-Dairy Product Generic Marketing
Unlike fluid milk, all-dairy product consumption (i.e., fluid milk plus dairy products) in the United States has been steadily increasing for decades. Among the factors behind this increase are changes in consumer preferences for dairy products, changes in income and retail dairy prices, and changes in generic advertising and marketing of milk and dairy products. The following is a brief graphical overview of changes in per capita all dairy product consumption and factors hypothesized to affect it from 1995 through 2007.
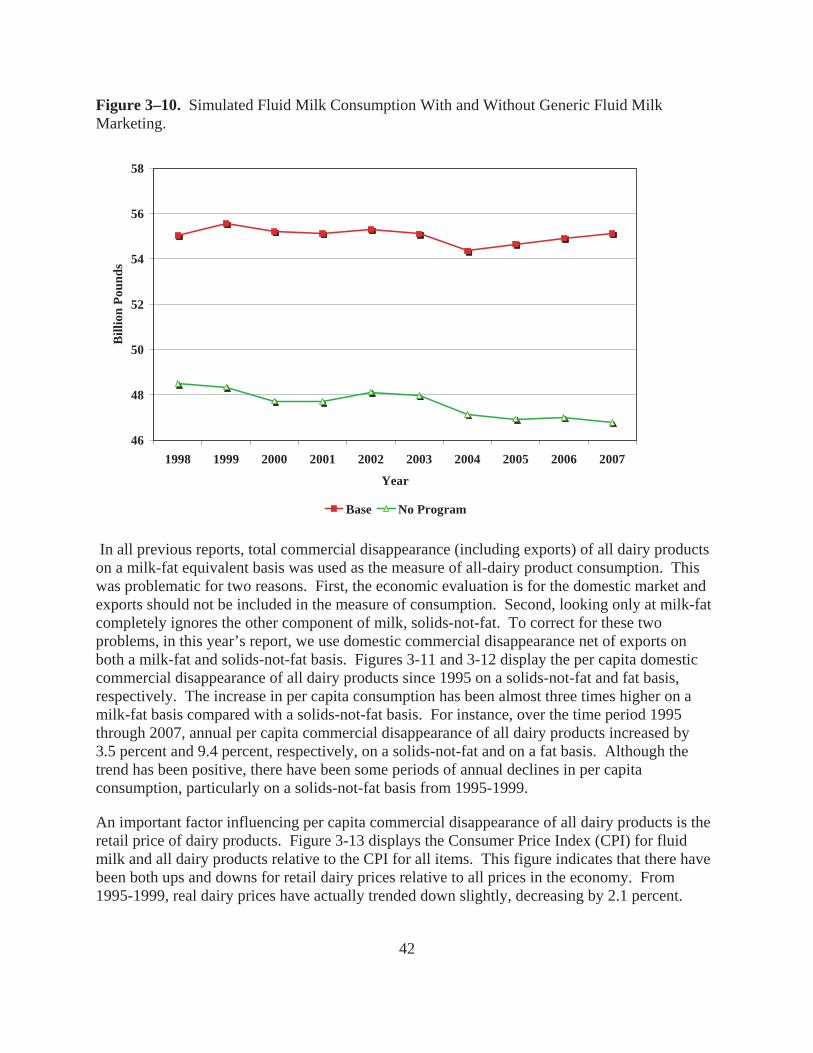
42
Figure 3–10. Simulated Fluid Milk Consumption With and Without Generic Fluid Milk Marketing.
46
48
50
52
54
56
58
1998 1999 2000 2001 2002 2003 2004 2005 2006 2007
Year
Bill
ion
Pou
nds
Base No Program
In all previous reports, total commercial disappearance (including exports) of all dairy products on a milk-fat equivalent basis was used as the measure of all-dairy product consumption. This was problematic for two reasons. First, the economic evaluation is for the domestic market and exports should not be included in the measure of consumption. Second, looking only at milk-fat completely ignores the other component of milk, solids-not-fat. To correct for these two problems, in this year’s report, we use domestic commercial disappearance net of exports on both a milk-fat and solids-not-fat basis. Figures 3-11 and 3-12 display the per capita domestic commercial disappearance of all dairy products since 1995 on a solids-not-fat and fat basis, respectively. The increase in per capita consumption has been almost three times higher on a milk-fat basis compared with a solids-not-fat basis. For instance, over the time period 1995 through 2007, annual per capita commercial disappearance of all dairy products increased by3.5 percent and 9.4 percent, respectively, on a solids-not-fat and on a fat basis. Although the trend has been positive, there have been some periods of annual declines in per capita consumption, particularly on a solids-not-fat basis from 1995-1999.
An important factor influencing per capita commercial disappearance of all dairy products is the retail price of dairy products. Figure 3-13 displays the Consumer Price Index (CPI) for fluid milk and all dairy products relative to the CPI for all items. This figure indicates that there have been both ups and downs for retail dairy prices relative to all prices in the economy. From 1995-1999, real dairy prices have actually trended down slightly, decreasing by 2.1 percent.

43
Figure 3–11. Domestic Per Capita Commercial Disappearance of Fluid Milk and Dairy Products (Solids-not-fat milk Equivalent).
535
540
545
550
555
560
565
570
575
580
1995 1996 1997 1998 1999 2000 2001 2002 2003 2004 2005 2006 2007
Year
Pou
nds
Figure 3–12. Domestic Per Capita Commercial Disappearance of Fluid Milk and Dairy Products (Milk-Fat Equivalent).
525
535
545
555
565
575
585
595
605
615
625
1995 1996 1997 1998 1999 2000 2001 2002 2003 2004 2005 2006 2007
Year
Pou
nds

44
Figure 3–13. Retail Dairy Prices Relative to Price of All Items.
0.82
0.84
0.86
0.88
0.90
0.92
0.94
0.96
0.98
1995 1996 1997 1998 1999 2000 2001 2002 2003 2004 2005 2006 2007
Year
CP
I F
luid
Milk
and
All
Dai
ry P
rodu
cts/
CP
I A
ll It
ems
A factor that had a positive impact on per capita commercial disappearance of all dairy products is the growth in real income over this period. All dairy products are considered to be “normal” goods, which means that consumption increases as consumers’ disposable incomes increase. Figure 3-6 illustrates the steady positive trend in real per capita income (in 2007 dollars) from 1995 through 2007. Since 1995, real per capita income has increased by 20.6 percent.
Another factor that may have contributed to increasing per capita domestic commercial disappearance of all dairy products over part of this time period is generic marketing efforts by fluid milk processors and dairy farmers. Figure 3-14 shows combined nominal and real expenditures (in 2007 dollars) on generic dairy product marketing efforts by these two programs. From 1995 to 1997, there was steady growth in real (2007 dollars) annual expenditures for generic dairy product marketing, from $342 million in 1995 to $452 million in 1997. Since 1997, however, such expenditures have been declining. Between 1995 and 2007, combined annual average real expenditures declined by 13.5 percent reaching a low of $294 million in 2006. In nominal terms, there has actually been a 38.2 percent increase in total annual generic dairy product marketing expenditures since 1995. In 1995, nominal annual expenditures totaled $212 million for the two programs, while in 2007 nominal annual expenditures totaled $293 million. Hence, the erosion in real expenditures has been entirely due to inflation.
Figure 3-15 shows real generic marketing expenditures for fluid milk processors and dairy farmers (all dairy). Dairy farmers’ total marketing expenditures have consistently declined since 1995 in real terms, falling by 39.4 percent since 1995. Fluid milk processors’ marketing expenditures peaked in 1997, but have fallen by 24.4 percent in real terms since then.

45
Figure 3–14. Real and Nominal Generic Dairy Marketing Expenditures.
0
50
100
150
200
250
300
350
400
450
500
1995 1996 1997 1998 1999 2000 2001 2002 2003 2004 2005 2006 2007
Year
Mill
ion
$
Real Nominal
To examine the overall impact of the fluid milk processor and dairy farmer programs on overall dairy demand, we estimated a combined fluid milk/dairy product demand model that included all generic dairy advertising activities as one demand determinant, and all non-advertising dairy marketing activities as another demand determinant. Expenditures for the following advertising activities were aggregated into one variable assumed to impact the all-dairy product demand model: television, radio, print, and outdoor media advertising for fluid milk and manufactured dairy products by dairy farmers and fluid milk processors. Expenditures for the following non-advertising, marketing activities were aggregated into one variable: school marketing, food service and manufacturing programs, integrated communications, public relations, sales promotions, nutrition education, retail programs, and sponsorships conducted by fluid milk processors and dairy farmers. In addition, the following variables were included as factors influencing per capita all-dairy product demand: the CPI for all-dairy products, per capita disposable income, and variables to capture seasonality in dairy product demand. Similar to the fluid milk demand model, the all-dairy products demand model was estimated on a per capita basis to control for the influence of population increases on demand.
The model was estimated with national quarterly data for 1995 through 2007. To account for the impact of inflation, all prices and income variables were deflated by the CPI for all items. Generic fluid milk and cheese advertising expenditures were deflated by a weighted average media cost index (television, radio, print, and outdoor) for fluid milk and cheese. Generic fluid milk and cheese non-advertising marketing expenditures were deflated by the CPI for all items.

46
Figure 3–15. Real Generic Dairy Marketing Expenditures By Fluid Milk Processors and Dairy Farmers.
0
50
100
150
200
250
300
350
400
1995 1996 1997 1998 1999 2000 2001 2002 2003 2004 2005 2006 2007
Year
Mill
ion
$
Processor Farmer
Table 3–2 provides selected elasticities for the all-dairy product demand models on a fat and non-fat solids basis. (The models are for milk-equivalent, calculated on a fat solids basis and non-fat solids basis. Not to be confused with models for nonfat solids and fat solids. See cautionary statement below.) All variables were statistically significant. The most important factor impacting per capita disappearance of all-dairy products was per capita income. The results indicate that a 1.0 percent increase in per capita income would result in a 0.540 percent and 0.662 percent increase in combined per capita all-dairy product demand on a non-fat and fat basis, respectively, holding all other variables constant. The average price elasticity for 1995 through 2007, using the CPI for all-dairy products, was –0.343 (non-fat basis) and –0.244 (fat basis); in other words, a 1.0 percent increase in the retail price of dairy products would result in a0.343 (non-fat) and 0.244 (fat) percent decrease in per capita quantity demanded for all–dairy products holding all other variables constant.
The major interest here is the advertising and non-advertising marketing elasticities. The average advertising elasticity for this period on a non-fat and fat basis was 0.027 and 0.029, respectively; a 1.0 percent increase in media advertising expenditures would increase per capita all-dairy product demand by 0.027 (non-fat basis) and 0.29 (fat basis) percent. The average non-advertising marketing elasticity for this period was 0.016 (non-fat) and 0.29 (fat), respectively; a 1.0 percent increase in media advertising expenditures would increase per capita all-dairy product demand by 0.016 (non-fat) and 0.029 (fat) percent.

47
Table 3–2. Average Elasticity Values (1995–2007) for Factors Affecting Per Capita All-dairy Products Demand.
Nonfat-solids basis Fat basis Demand Factor elasticity elasticity
CPI for all-dairy products –0.343* –0.244* Per capita income 0.540* 0.662* Generic dairy advertising 0.027** 0.029** Generic dairy non-advertising marketing 0.016* 0.029*
* Statistically significant at the 1.0 percent level or better. ** Statistically significant at the 10 percent level.
Benefit-Cost Analysis of the Dairy Program
One way to measure whether the benefits of a program outweigh the cost is to compute a benefit–cost ratio (BCR). A BCR can be computed as the change in net revenue5 due to generic dairy marketing divided by the cost of the checkoff program. While we were able to estimate a BCR for producers for the Dairy Program, we could not compute one at this time for fluid milk processors under the Fluid Milk Program because data on packaged fluid milk wholesale prices, which are necessary in calculating processor net revenue, are proprietary and, therefore, not available.
It should be pointed out that Dairy Management Inc., (DMI) has made a significant shift in their marketing programs in 2007. Previously, the bulk of DMI’s marketing expenditures were allocated to media advertising and to non-advertising marketing activities. In 2007, these traditional marketing activities represented 57 percent of DMI’s marketing budget. The remaining 43 percent was spent on their new business plan of strategic business development with dairy processors and manufacturers. In the analysis that follows, this part of DMI’s marketing budget is not included. DMI has stated that they do not expect any short-term benefits of these programs for 2007, but rather expect to see these benefits to accrue in the longer-term. Hence, the BCR that follows only includes the advertising and non-advertising marketing activities.
Cornell calculated BCRs6 by simulating two scenarios: (1) a baseline scenario in which combined marketing (advertising and non-advertising marketing) levels were equal to actual marketing expenditures under the two programs, and (2) a no-national-Dairy-Program scenario in which there was fluid milk-processor-sponsored marketing but dairy-farmer-sponsored
5 “Net revenue” is defined as the aggregate gain in total revenue from price and product disappearance enhancements due to generic dairy advertising and non-advertising marketing less the increase in supply costs for the additional milk marketed by dairy farmers. Economists refer to this notion of net revenue as “producer surplus.” 6 To measure market impacts, we estimated supply equations at the retail and farm levels to simulate supply response to any price increase due to a marketing-induced increase in demand. The results of these estimates are available from the authors upon request.

48
marketing was reduced to 42 percent of actual levels to reflect the difference in assessment before and after the National Program was enacted. A comparison of these two scenarios provided a measure of the impact of the Dairy Program. The benefits of the Dairy Program were calculated as the change in dairy farmer net revenue (what economists call “producer surplus”) due to demand enhancement from all marketing activities under the Dairy Program (i.e., the difference in net revenue between scenarios 1 and 2). The demand enhancement reflects increases in quantity and price as a result of the marketing program. The costs of the Dairy Program were calculated as the difference in total assessment revenue before and after the National Program was enacted. These scenarios were run for the time period 1998 through 2007 for the two milk-equivalent models: milk-fat and non-fat.
The average all milk price from 1998 through 2007 in the base line scenario was $14.49 per hundredweight. In the counter-factual no-national-Dairy-Program scenario for the nonfat-solids model, the average all milk price was $14.17 per hundredweight, which is 32 cents lower. Thus, had there been no national Dairy Program over this period, the price farmers receive for their milk would have been 2.23 percent lower than it actually was. In the counter-factual no-national-Dairy-Program scenario for the milk-fat model, the average all milk price was $13.91 per hundredweight, which is 58 cents lower. Thus, had there been no national Dairy Program over this period, the price farmers receive for their milk would have been 4.02 percent lower than it actually was.
The results show that the average BCR for the Dairy Program was 5.52 (non-fat solids basis) and 5.94 (milk-fat basis) from 1998 through 2007. This means that each dollar invested in generic dairy marketing by dairy farmers during the period would return between $5.52 and $5.94, on average, in net revenue to farmers. The level of the marketing BCR suggests that the combined marketing programs supported by dairy farmers have been a successful investment.7
In another interpretation of the BCR, the increase in real 2007 dollars generic dairy marketing expenditures resulting from the Dairy Program costs dairy producers an additional $117 million per year on average from 1998 through 2007. The additional generic dairy marketing resulted in higher demand, prices, and net revenue for dairy producers nationwide. Based on the simulations conducted, Cornell estimates that the average annual increase in producer surplus (reflecting changes in both revenues and costs) due to the additional generic marketing under the Dairy Program was $645.8 million on a non-fat basis and $695 million on a fat basis. Dividing $645.8 (or $695) million by the additional Dairy Program cost of $117 million results in the estimated benefit-cost ratios of 5.52 (non-fat basis) and 5.94 (fat basis).
To make allowance for the error inherent in any statistical estimation, a 90 percent confidence interval was calculated for the average BCR, providing a lower and upper bound for the average BCR. One can be 90 percent “confident” that the true average BCR lies within those bounds. The estimated lower bound for the average BCR in the non-fat and fat model is 1.12 and 1.41, respectively. Since both lower bounds are above 1.0, it is reasonable to conclude that these
7 To see how the BCR has varied over time, the models were simulated for an earlier time period (1998–99) and the latest time period (2006–07). The results indicate that the estimated BCR for the earlier and later time periods were almost identical.

49
confidence intervals give credence to the finding that the benefits of the Dairy Program’s marketing activities have been greater than the cost of the programs.
Questions often arise with respect to the accuracy of these BCR estimates. BCRs for commodity promotion programs are generally found to be large because marketing expenditures in relation to product value are small and, as such, only a small demand effect is needed to generate large positive returns. For example, the change in generic dairy marketing expenditures noted previously is a mere 0.48 percent of the recent average annual value of farm milk marketings from 1998 through 2007 ($24.63 billion). The marketing activities resulted in modest gains in the quantity of dairy products and a positive effect on milk prices, resulting in large positive net revenue from the marketing investment.

50
Table 3–3. Description of Variables Used in Econometric Models.a
Variable Description Units Meanb
Consumption Variables RFDPC Quarterly retail fluid demand per capita lbs. 48.44
(2.32)RDDPCNF Quarterly retail all-dairy product demand per capita on a
non-fat basis lbs. 138.66
(3.30)RDDPCF Quarterly retail all-dairy product demand per capita on a fat
basis lbs. 146.14
(6.23)
Price IndicesRFPCPI Consumer retail price index for fresh milk and cream
deflated by consumer price index for nonalcoholic beverages (1982–84=1)
# 1.17 (0.10)
RDPCPI Consumer retail price index for all-dairy products deflated by consumer retail price index for all items (1982–84=1)
# 0.93 (0.03)
RBEVCPI Consumer retail price index for non-alcoholic beverages (1982–84=100)
# 138.65 (6.74)
Demographic and Income VariablesINCPC Quarterly per capita disposable income, deflated by the
consumer retail price index for all items (2007=1) $ 30,980
(1,860)AGE5 Percent of the population under age 6 % 8.32
(0.25)FAFH% Food away from home expenditures as percent of total food
expenditures% 50.41
(2.09)
Marketing ExpendituresGMA Quarterly generic fluid milk advertising expenditures
deflated by media cost index (2007 $) $mil 35.28
(14.93)GMN Quarterly generic fluid milk non-advertising marketing
expenditures deflated by consumer price index (2007 $)
$mil 16.07 (7.55)
GDA Quarterly generic milk and dairy advertising expenditures, deflated by media cost index (2007 $)
$mil 61.89 (19.37)
GDN Quarterly generic milk and dairy non-advertising marketing expenditures, deflated by media cost index (2007 $)
$mil 30.95 (13.70)
CBA Quarterly soy beverage + juice + bottled-water advertising expenditures deflated by media cost index (2007 $)
$mil 166.71 (52.31)
a Quarterly dummy variables are also included in the model to account for seasonality in demand. b Computed over the period 1995–2007. Standard deviation in parentheses.

51
Chapter 4 Part I – Fluid Milk Market and Promotion Assessment:
Beverage Marketing Corporation
Introduction
In this report, Beverage Marketing Corp. (BMC) reviews the 2007 research and marketing programs for fluid milk, for inclusion in the USDA’s Report to Congress. These programs are authorized by the Dairy Production and Stabilization Act of 1983 (Dairy Act; 7 U.S.C. 4501)and the Fluid Milk Promotion Act of 1990 (Fluid Milk Act; 7 U.S.C. 6401). The programs are intended to increase the appeal of milk and develop incremental consumption opportunities, and thus increase the overall sales of fluid milk and related dairy products.
BMC’s review offers an objective evaluation of the effectiveness of the research and marketing programs implemented to drive fluid milk sales, and provides a third-party perspective on the competitive position of fluid milk in the broader U.S. beverage marketplace. Specifically, in this report BMC evaluates milk’s position relative to a growing competitive beverage set that now includes soy beverages, value-added bottled waters, energy drinks and ready-to-drink (RTD) coffee (in addition to carbonated soft drinks [CSDs], RTD teas, fruit beverages, bottled water and sports beverages), which are targeted to capturing the growing desire for health and wellness offerings in beverages. In addition, in the report BMC examines both the overall milk industry’s performance as well as the apparent impact of targeted advertising, promotion and specific messaging on milk’s consumer and channel targets. The following summarizes BMC’s findings based on the analysis of available data.
Key Highlights And Trends For 2007
Fluid Milk Category Performance
BMC believes the producer and processor generic milk programs continued to effectively and efficiently use the available resources in 2007 to drive the relevance, consumer appeal and consumption of fluid milk. The generic milk programs achieved this by focusing on high-opportunity consumer and channel targets, communicating meaningful messages about milk to these targets, and supporting these strategies with effective research, advertising, promotion, public relations and grassroots activities.
A key marketplace factor for fluid milk in 2007 was the high level of milk pricing, which created consumer price increases of approximately 13 percent from 2006 to 2007. In some regions, the increase was even higher. Prices reached an historical high in the last half of 2007.In addition, consumers had a broader variety of healthier beverages to choose from than ever before, with more offerings such as enhanced waters and RTD teas, soy beverages, andenhanced fruit beverages targeted toward nutrition and wellness.8 Yet, the fluid milk category
8 Healthy beverages include milk, bottled water, fruit beverages, teas, sports drinks, and soy beverages, among others.

52
Figure 4–1
avoided significant volume declines in 2007, and achieved flat volume performance vs. 2006, at 6,252 million gallons, a -0.1 percent change from the prior year (see Figure 4–1).
In the past few years, the competitive environment for healthier beverages has grown dramatically across a wide variety of chilled and shelf-stable categories, creating more robust competition for milk usage occasions. Thus, it is an indicator of the positive effect of the milk marketing programs that from 2005-2007, fluid milk volume grew slightly at a +0.45 percent 2-year compound annual growth rate (CAGR).
Over the last 5 years, fluid milk volume has essentially been stable, fluctuating within a narrow band of volume between 6.2 and 6.3 billion gallons. Milk’s 5-year CAGR from 2002 to 2007 was essentially flat, at -0.1 percent.
Fluid Milk Competitive Position and Performance
As noted in the Introduction, the competitive set for milk in the 2007 analysis has been expanded to include additional competitively relevant beverage offerings (e.g., enhanced waters, soy beverages, energy drinks, RTD coffees). In terms of overall volume, milk maintained its position as the third largest beverage category, following bottled water by about 7 share points (see Figure 4–2). In 2007, the beverage categories outside the top 3, approached the 20 percent volume share mark (at 19.6 percent share), indicating the strong, continued growth in demand for perceived healthier beverage offerings by consumers.
6,2816,252
6,2026,196
6,2586,252
5,000
5,500
6,000
6,500
2002 2003 2004 2005 2006 2007
Fluid Milk Volume and Growth*2002 - 2007
* Not adjusted for leap year Source: Beverage Marketing Corporation, USDA
+0.3% -0.5%-0.8% -0.1%
+1.0%
CAGR 02/07: -0.1%
CAGR 02/07: -0.1%
-0.1%
Mill
ion
s of
Gal
lon
s

53
Figure 4–2
Source: Beverage Marketing Corporation
Within the broader competitive set, milk was the sixth largest contributor to volume growth from 2005 through 2007 (see Figure 4–3).
As a whole, the total volume of the combined competitive set categories increased by 1 percent in 2007, or 1.4 million gallons, to 37 billion gallons in 2007. From 2002 to 2007, the competitive set grew by a 2.3 percent 5-year CAGR,9 a moderate compound 5-year growth rate (see Figure 4–4).
Figure 4–3
9 CAGR stands for compound annual growth rate. It’s a growth rate measurement using the first and last values over the period. It is the geometric mean growth rate that generates the end value starting from the beginning value. As such, it smoothes out deviations from the trend.
Milk’s Competitive Set Volume Shares 2007
Soy0.6%
Value-Added Water1.5%
Energy0.8%
RTD Coffee0.1%Carbonated Soft
Drinks39.7%
Bottled Water23.8%
Milk16.9% Fruit Bevs
10.5%Sports Bevs
3.7%
RTD Tea2.4%
Milk Competitive SetShare of Volume Growth – Millions of Gallons
2005- 2007
100%+1,41037,02235,612Total Competitive Set
+1%+54540RTD Coffee
+10%+142303161Energy Drinks
+2%+31217186Soy Beverages
+17%+240547307Enhanced Waters
+19%+272875603RTD Tea
+12%+1641,3551,191Sports Beverages
-16%-2193,9004,119Fruit Beverages
+4%+566,2526,196Milk
+91%+1,2858,8227,537Bottled Water
-40%-56514,70715,272CSDs
2005 – 2007Share of Growth
2005 – 2007Vol. Change(1)
2007 Volume (1)2005 Volume (1)
100%+1,41037,02235,612Total Competitive Set
+1%+54540RTD Coffee
+10%+142303161Energy Drinks
+2%+31217186Soy Beverages
+17%+240547307Value-Added Waters
+19%+272875603RTD Tea
+12%+1641,3551,191Sports Beverages
-16%-2193,9004,119Fruit Beverages
+4%+566,2526,196Milk
+91%+1,2858,8227,537Bottled Water
-40%-56514,70715,272Carbonated Soft Drinks
2005 – 2007Share of Growth
2005 – 2007Vol. Change2007 Volume 2005 Volume
Source: Beverage Marketing Corp.

54
Figure 4–4
Without milk, the performance of the competitive set would have been slightly better – increasing at a 5-year CAGR of 2.8 percent from 2002 to 2007. Excluding the primary growth category, bottled water, the competitive set grew by a 5-year CAGR of just 0.7 percent (see Figure 4–5).
To better understand the performance of milk against its key competitor categories over time, Beverage Marketing has indexed milk’s share of volume growth vs. its share of the overall competitive set (specifically, the index calculates milk’s share of total competitive volume change, divided by milk’s volume share of the total competitive set at the onset of the year).
Figure 4–5
33,03833,740 34,557
35,61236,626
37,022
10,000
15,000
20,000
25,000
30,000
35,000
40,000
Mill
ions
of
Gal
lons
2002 2003 2004 2005 2006 2007
(1) Includes milk, CSDs, fruit beverages, bottled water, RTD tea, sports beverages, RTD coffee, soy beverages, energy drinks and value-added water Source: Beverage Marketing Corporation
Total Competitive Beverage Set(1) Volume and Growth2002 – 2007
CAGR 02/07: +2.3%
Competitive Beverage Set Growth 5 Year CAGR2002 – 2007
Milk CompetitiveSet
CompetitiveSet w/o Milk
-0.1%
2.3%
2.8% 2.8%
0.7%
-0.5%
0.0%
0.5%
1.0%
1.5%
2.0%
2.5%
3.0%
Source: Beverage Marketing Corporation
Competitive Set w/o Bottled
Water
Competitive Set w/o Fruit
Beverages

55
Figure 4–6
This index shows whether milk has gained or lost competitive ground year-to-year. An index greater than 1 indicates milk is gaining competitive volume share, thus outperforming the competitive set; an index less than 1 shows that milk is losing volume share to competitors. As seen in Figure 4–6, milk has consistently lost competitive share over the past 20 years.
As shown in Figure 4–7 below, the major competitive volume gains in 2007 were realized by the value-added water and energy drink categories, followed by RTD teas. Each of these categories offered an array of beverages positioned to address both general and specific health and wellness benefit areas. Value-added waters, in particular, were able to successfully position themselves within the “healthy” beverage arena by adding specific ingredients/flavors/functionalities to the plain bottled water platform, which had already achieved broad consumer appeal and acceptance as a healthy beverage alternative.
Figure 4–7
(1) Share of competitive turnover divided by share of competitive set Source: Beverage Marketing Corporation
6.0
-2.9
2.3
12.2
21.9
18.5
6.1
1.3
-0.1
-2.5-5.0
0.0
5.0
10.0
15.0
20.0
25.0
CSD B. Water Milk FruitBeverages
Sports RTD Tea Value-AddedWater
EnergyDrinks
Soy Bevs RTD Coffee
Indexed Share of Competitive Turnover(1)
2007
-100.1% 143.7% -1.5% -30.4% 8.3% 28.8% 32.3% 15.1% 3.6% 0.2%
39.7% 23.8% 16.9% 10.5% 3.7% 2.4% 1.5% 0.8% 0.6% 0.1%
1.0 = maintain competitive position
Categories that captured more than fair share of incremental volume
Categories that captured less than fair share of incremental volume Share of Competitive Turnover
Share of Competitive Set
1.0 = maintain competitive position
-1.0-0.8-0.6-0.4-0.20.00.20.40.60.81.0
'87 '88 '89 '90 '91 '92 '93 '94 '95 '96 '97 '98 '99 '00 '01 '02 '03 '04 '05 '06 '07
Milk Indexed Share of Competitive Turnover(1)
1987 – 2007
(1) Share of competitive turnover divided by share of competitive set Source: Beverage Marketing Corporation
Inde
xed
Shar
e of
Com
peti
tive
Tu
rnov
er

56
Analysis Of Key Beverage Category Growth Drivers
In this section, Beverage Marketing analyzes and discusses specific marketplace factors that affect the overall performance of the fluid milk category, particularly within the context of the competitive and market landscape. These factors are:
Category and Consumer Positioning Branding and Media Spending Retail Channel Distribution Consumer Pricing New Product Activity
Historically, the milk category has been disadvantaged relative to the other competitive categories across most of these areas. However, the milk category has begun to make progress in many of them, by strategically focusing its resources against key growth opportunity areas.
Category and Consumer Positioning
In recent years, the growth in beverages positioned to address “wellness and functional” need-states/benefit areas has outpaced the growth in all other types of beverages (e.g., those addressing basic refreshment, hydration, mood enhancement, etc.), and is having a significant influence on the marketplace. From 2006-07, wholesale sales of wellness and functional beverages more than doubled the growth rate of “all other” beverages (see Figure 4–8). Indeed, when redefining the beverage landscape by need-state/benefit area, the “wellness/nutrition” category is the largest competitive space among beverages.
This consumer demand dynamic presents an opportunity for fluid milk to capture a portion of this sizeable and growing beverage market, with the evolution to its Healthy Weight messaging/category positioning. In 2007, the shift from the Weight Loss to the Healthy Weight messaging in the second quarter appeared to have a slight effect on overall awareness of the linkage of milk consumption to weight loss, with recall of the Weight Loss/Healthy Weight message and milk consumption link among moms going from 77 percent awareness in Q1 2007 to 75 percent in Q2-Q3 2007, and to 66 percent in Q4 2007 (source: DDW/Lowe). In terms of believability of the milk consumption and Weight Loss/Healthy Weight claims in 2007, the level
Figure 4–8
* Wellness and functional categories include milk, bottled water, fruit juice, RTD tea, soy milk, meal replacement drinks, flavored water, protein drinks, sports beverages, energy drinks and nutrient-enhanced drinks. Source: Beverage Marketing Corporation
Wellness & Functional Beverage Market vs. Total Liquid Refreshment BeveragesVolume, Share and Growth 2001 – 2007
Change CAGR
Categories 2001 2006 2007 2001 2007 06/07 01/07
Wellness & Functional $45,728 $57,854 $61,105 29.4% 32.2% 5.6% 4.9%
All Other $109,949 $126,216 $128,855 70.6% 67.8% 2.1% 2.7%
Total $155,677 $184,070 $189,960 100.0% 100.0% 3.2% 3.4%
Millions of Wholesale Dollars Share

57
of believability among adult women increased from 45 percent in Q1 2007 to 54 percent in Q4 2007. For moms, the level of believability of the claims dipped slightly, from 50 percent in Q1 2007 to 45 percent in Q4 2007.
Branding and Media Spending
While target consumer awareness of the generic milk advertising messaging and programs is high, the category continues to spend less on media, as compared to other key categories, placing it at a competitive disadvantage. One of the more significant differences between milk and its competitive set is the dominance of private label milk in the category, and the lack of major national brands to compete with significant brands in competitive categories.
In 2007, private label milk comprised 69 percent volume and branded milk 31 percent volume, compared with very high branded volume levels in categories such as sports beverages(99 percent branded volume), energy drinks (98 percent branded volume), RTD tea (93 percent branded volume), and carbonated soft drinks (89 percent branded volume). BMC believes this disparity places milk at a definite disadvantage with regard to the rest of the competitive set because of the challenges inherent in marketing a category versus brands. Additionally, many private label products, across most categories, are generally sold in less-premium, undifferentiated packages and with little or no marketing support. Thus, the high share of private label milk reinforces milk’s commodity image, making competitive premium-image branded products more attractive to consumers.
In 2007, a year which saw significant retail price increases on fluid milk, the fluid milk generic advertising budget decreased 3.2 percent from $56.7 million in 2006 to $54.9 million. Within this 2007 budget, advertising dollars allocated to the key consumer target, moms, increased by 4.7 percent from $40.5 million in 2006 to $42.4 million in 2007, while advertising budget for teens dropped by nearly 23 percent in 2007 (Figure 4–9).
Figure 4–9
Fluid Milk Generic Advertising Budget(1)
2000 – 2007
$59.8
$10.4
$11.4
$56.5
$15.0
$10.5
$37.6
$8.0
$28.4
$37.4
$5.9
$25.2
$25.1
$4.6
$36.0
$16.3
$42.7
$16.2
$40.5
$12.5
$42.4
$0
$10
$20
$30
$40
$50
$60
$70
$80
$90
2000 2001 2002 2003 2004 2005 2006 2007e
Adults Teens
Kids Women/Moms$81.6 $82.0
$68.5$74.0
$65.7$59
$56.7 $54.9
Source: Beverage Marketing Corporation; Lowe
Mill
ion
s of
Dol
lars
(1) These figures represent only national advertising spending and not State/Regional spendinge=estimated; based on MilkPEP actual plus DMI estimated; DMI total media advertising spending allocated to Women/Moms

58
In addition, total estimated media spending for fluid milk in 2007 (i.e., national/regional spending and brand-specific spending) of $70.5 million, constitutes a 24.5 percent drop in spending from 2006, and generated a per-gallon spending rate of 1.1 cents per gallon – the second-lowest media spending rate among milk’s competitive beverage set. As the industry has diverted marketing dollars to public relations programs, school programs and other promotions, media spending has declined. (Figure 4–10).
Within the competitive set, media spending growth was realized for only a handful of categories in 2007: energy drinks (57 percent), RTD teas (53 percent), value-added waters (40 percent), and fruit drinks (20 percent). Overall media spending for the total competitive beverage set decreased by 11.7 percent in 2007, driven mostly by a decline in carbonated soft drinks (per-gallon spending down nearly 18 percent). In comparison to other categories in the competitive set, bottled water’s success has been primarily driven by pervasive distribution, convenient packaging, aggressive pricing and local promotions/marketing, without major, national advertising expenditures.
As a result of the declines in fluid milk media spending in 2007, milk’s share of voice dropped to 6.6 percent among its competitive set from 8.7 percent in 2006, creating a share of voice vs. market share index of 39, vs. an index of 53 only 5 years ago. Milk’s low share of voice, declining over a number of years, is likely to have a current and cumulative negative impact on milk consumption, despite the category’s highly relevant and differentiated messaging.
It should be noted that the tracking of media spending does not signify the effectiveness of the advertising, nor does it measure the impact of millions of dollars spent on promotions and other non-media programs. While promotional spending cannot be tracked across competitive
Figure 4–10
Source: Beverage Marketing Corp.; Lowe; Ad Views
Competitive Set Media Spending per Gallon 2007
$0.263
$0.173
$0.121
$0.055 $0.044 $0.039
$0.011 $0.006
$0.317 $0.317
$0.00
$0.05
$0.10
$0.15
$0.20
$0.25
$0.30
$0.35
RTD Coffee EnergyDrinks
Value-AddedWater
SportsDrinks
Soy Bevs RTD Tea FruitBeverages
Soft Drinks Milk PETBottledWater
Do
llars
per
Gal
lon
’06-’07 Change NA NA NA -12.9% NA 292.6% -40.7% -17.8% -46.5% -76.2% ’06-’07 Change NA NA NA -12.9% NA 292.6% -40.7% -17.8% -46.5% -76.2%

59
Figure 4–11
* Local in-market activities by MilkPEP such as Milk Mustache Mobile Source: Marketing Management Analytics
categories, MilkPEP promotions targeted to mom and Hispanics as measured by Marketing Management Analytics (MMA), have shown a highly positive impact (see Figure 4–11).
According to MMA, each of MilkPEP’s programs has had some positive incremental volume benefit, and some had a growth impact, comparing 2007 versus 2006.10 Even with this positive impact, it is BMC’s belief based on its decades of industry knowledge and experience that the milk category continues to be outspent in promotions by some of the major competitive categories, such as carbonated soft drinks, sports beverages, bottled water and perhaps even energy drinks.
Retail Channel Distribution
The availability of fluid milk across the continually expanding and fragmenting retail channels has historically been an area of competitive disadvantage for the category. In 2007, the estimated volume of milk sold in retail channels primarily serving at-home consumption was 80.2 percent, and the estimated volume of milk sold in channels primarily serving on-the-go, immediate consumption was 19.8 percent, showing very little growth in the ratio of immediate vs. take home volume from 2006. This take-home vs. immediate consumption retail channel sales balance is in sharp contrast to competitive categories such as CSDs, sports beverages, energy drinks and enhanced waters, and is likely driven by a combination of more limited single-serve packaging, flavor variety and distribution reach in immediate consumption retail channels, when compared to competitive categories, as well as inherent product drawbacks like being more viscous and thus less refreshing and gulpable (see Figure 4–12).
However, the milk category is continuing to achieve more diversified availability in non-traditional take-home channels such as club stores and dollar stores, with an estimated 16.4 percent volume coming from Drug, Mass and Club retail channels in 2007, up from
10 Source: 2007 MilkPEP Marketing Mix Analysis, conducted by MMA, which builds regression based econometric models using actual sales, marketing and non-marketing factors to decompose the volume impact of various in-market stimuli, while controlling for outside variables
Incremental Gallons Generated (MM) by MilkPEP Marketing Programs
26.3
1.43.2
26.0
1.0 1.64.7 5.1
18.9
0.4
36.0
6.6 5.93.5
11.514.3
2.6
18.2
32.2
6.2 7.3 7.1
22.218.7
0.7 1.6
Moms TV Hisp TV Moms Prt Teens Prt Hisp Prt Nat'l PR GrassrootsPR*
Hisp PR In-Store/Promo
BBMPosters
Word ofMouth
InternetAdvert.
Hisp.Internet
Advert.
2006 (Through 11/5)
2007 (Through 11/4)

60
Figure 4–12
10 percent total volume in 2002 (see Figure 4–13). This distribution channel shift is important to fluid milk’s overall growth and market presence, as consumers continue to fragment their shopping trips across a wider variety of outlets, and non-traditional grocery outlets continue to proliferate.
Consumer Pricing
As mentioned earlier in this report, the average retail price for milk in 2007 increased by approximately 15 percent, from $2.42/gallon in 2006 to $2.78/gallon in 2007 (source: IRI).Based on the Consumer Price Index for 2007, the milk category experienced an 11.6 percent
Figure 4–13
e = EstimatedSource: Beverage Marketing Corporation
U.S. Fluid Milk MarketShare of Volume by Distribution Channel
2002 - 2007
Distribution Channels 2002 2003 2004 2005 2006 2007eSupermarkets 74.6% 73.7% 70.9% 68.3% 67.2%Drug Stores 1.3% 1.4% 1.6% 1.8% 2.2%Mass Merchandisers 5.2% 6.8% 7.7% 8.6% 8.8%Club Stores 3.5% 2.9% 4.0% 4.8% 5.0%Down-the-Street 1.3% 1.3% 1.3% 1.3% 1.3%Foodservice 3.2% 3.1% 3.2% 3.3% 3.3%Convenience/Gas 3.3% 3.0% 3.3% 3.5% 3.5%Others 6.5% 6.6% 6.8% 7.0% 7.3%Vending 1.1% 1.1% 1.3% 1.4% 1.5%
TOTAL 100.0% 100.0% 100.0% 100.0% 100.0%
66.5%2.3%9.0%5.1%1.3%3.4%3.5%7.4%1.5%
100.0%
CAGR02/07
-2.3%11.2%11.6%7.9%0.0%1.1%1.4%2.5%6.4%
Source: Beverage Marketing Corp.; Information Resources, Inc.
53.8 49.3 51.3
27.5 29.419.8
46.2 50.7 48.7
72.5 70.680.2
0%
10%
20%
30%
40%
50%
60%
70%
80%
90%
100%
SportsBeverages
RTD Tea CSD FruitBeverages
BottledWater
Milk
Shar
e of
Vol
ume
Immediate Consumption Take Home
Immediate Consumption2006/2007 Growth +2.0% +17.0% -3.0% -2.0% +8.8% +1.7%
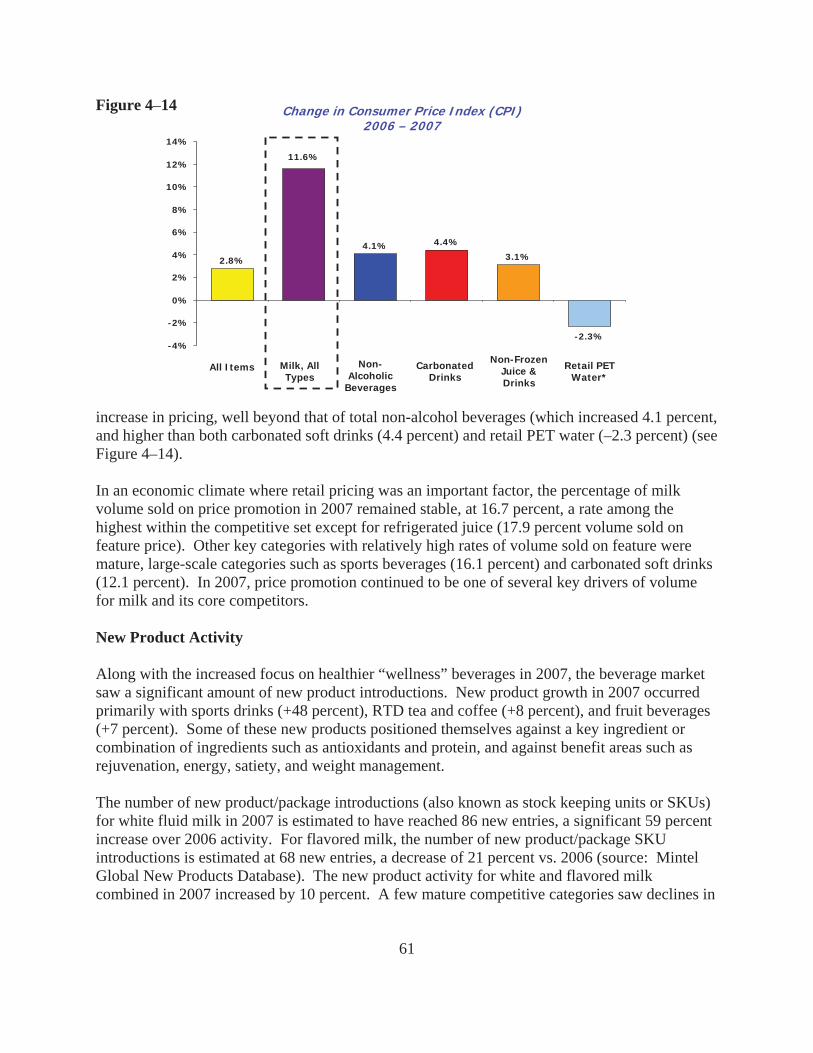
61
Figure 4–14
increase in pricing, well beyond that of total non-alcohol beverages (which increased 4.1 percent, and higher than both carbonated soft drinks (4.4 percent) and retail PET water (–2.3 percent) (see Figure 4–14).
In an economic climate where retail pricing was an important factor, the percentage of milk volume sold on price promotion in 2007 remained stable, at 16.7 percent, a rate among the highest within the competitive set except for refrigerated juice (17.9 percent volume sold on feature price). Other key categories with relatively high rates of volume sold on feature were mature, large-scale categories such as sports beverages (16.1 percent) and carbonated soft drinks (12.1 percent). In 2007, price promotion continued to be one of several key drivers of volume for milk and its core competitors.
New Product Activity
Along with the increased focus on healthier “wellness” beverages in 2007, the beverage market saw a significant amount of new product introductions. New product growth in 2007 occurred primarily with sports drinks (+48 percent), RTD tea and coffee (+8 percent), and fruit beverages (+7 percent). Some of these new products positioned themselves against a key ingredient or combination of ingredients such as antioxidants and protein, and against benefit areas such as rejuvenation, energy, satiety, and weight management.
The number of new product/package introductions (also known as stock keeping units or SKUs) for white fluid milk in 2007 is estimated to have reached 86 new entries, a significant 59 percent increase over 2006 activity. For flavored milk, the number of new product/package SKU introductions is estimated at 68 new entries, a decrease of 21 percent vs. 2006 (source: Mintel Global New Products Database). The new product activity for white and flavored milk combined in 2007 increased by 10 percent. A few mature competitive categories saw declines in
4.1% 4.4%
3.1%
-2.3%
2.8%
11.6%
-4%
-2%
0%
2%
4%
6%
8%
10%
12%
14%
Change in Consumer Price Index (CPI) 2006 – 2007
All Items Milk, All Types
Non-Alcoholic
Beverages
CarbonatedDrinks
Non-Frozen Juice & Drinks
Retail PETWater*

62
Figure 4–15
new product activity in 2007, with carbonated soft drinks introductions dropping by 11 percent, and bottled water introductions declining by 15 percent (see Figure 4–15)
Going forward, to remain well-positioned within the competitive environment, the milk category will need to continue to innovate, in both products (e.g., flavors, ingredients, functions) and packaging (e.g., sizes, designs, formats, new technologies). Many competitive new products are geared to the specific needs, ingredients, functional benefits, package sizes/shapes of highly specific consumer targets and usage occasions. The net result is that consumers have more choices than ever outside of milk, and the milk category will need to provide innovation to capture some of the growth in “healthier” beverage alternatives.
Beverage Marketing’s Assessment Of 2007 Milk Marketing Programs
In 2007, the fluid milk category performed surprisingly well, given the increasingly tough market and competitive environment. Specifically, milk maintained a steady volume level, sustaining the increases achieved in 2006 despite the high price increases that occurred forconsumers (particularly toward the latter half of the year). This volume performance may indicate the strength of milk’s benefit positioning and relevance in the marketplace.
In addition, the competitive landscape again in 2007 became more challenging for fluid milk, with a growing number of entries into the “healthier” beverage arena striving to capture some of the nutrition and “wellness” usage occasions. In particular, milk’s new product activity, relevant messaging and promotional/communications strategies, and expanding availability for out-of- home occasions all helped to sustain milk’s current volumes. Because of milk’s superior health characteristics, the emphasis on health may enhance milk’s competitive stature in the market.
Change in New Product Introductions*
2006 – 2007
7.6%6.8%
-10.8%
10.0%
-15.4%-13.1%
48.4%
-20%
-10%
0%
10%
20%
30%
40%
50%
60%
BottledWater
Fruit Beverages
SportsBeverages
CSDs
* Includes SKU’s for White and Flavored MilkSource: Beverage Marketing Corporation; Mintel
Milk*Energy Drinks
RTD Coffee & Tea
New SKUsfor 2007 46 166 187 154 149 438 170

63
Beverage Marketing believes that the marketing campaigns developed under the Dairy Act and the Fluid Milk Act have played a key role in maintaining the category’s growth, and volume declines would have been more significant without the major programs and initiatives implemented in 2007. Moreover, Beverage Marketing believes the key initiatives implemented by MilkPEP and DMI for the milk category are successfully targeting and addressing the strategic growth opportunity areas evident in the marketplace:
On-trend messaging continued in 2007 with the Healthy Weight message Effective use of both traditional and non-traditional media, to reach key consumer targets in a cost-efficient approach Identifying Quick Service Restaurants (QSRs) as a key strategic retail channel to capture out-of-home usage occasions Both the New Look of School Milk program from DMI and Capturing the School Milk Opportunity program from MilkPEP are reaching Teens/Kids by positioning milk as a relevant, appealing beverage choice in schools Promotion programs are geared to moms making purchase decisions for the family as the nutrition gatekeeper Hispanics are being targeted in a culturally relevant way with communications on the core benefits of milk consumption
Beverage Marketing believes the positioning strategy for the milk category was an important driver of sustained consumer demand in 2007, with the evolution from the Weight Loss to Healthy Weight messaging fitting with consumers’ shifting consumption habits toward healthier, more natural beverages. The Healthy Weight messaging and related Body by Milk program/messaging for teens enabled milk to compete more effectively as a viable beverage alternative within an expanding competitive set of beverages aimed at health and wellness needs/occasions. As a result, Beverage Marketing believes milk is increasingly seen as a key component in the wellness and nutrition offerings in a wide variety of occasions and venues.
In 2007, overall MilkPEP spending generated an estimated 3.2 percent share of total milk volume, or approximately 140 million gallons (source: Marketing Management Analytics). This is a solid performance, given the steep milk price increases experienced by the category, as well as the growing competitive set in 2007. Overall, the MMA analysis conducted for MilkPEP in 2007 continues to show that the advertising and promotional campaigns of MilkPEP are effective in generating incremental milk volume.
The communications strategy utilized by MilkPEP for the milk category also continued to evolve into meaningful new media for key consumer targets, resulting in improved media spending efficiencies and strong messaging impact in 2007. In 2007, the spending allocations were strategically allocated by consumer target, with moms as the core consumer target. The “Think about Your Drink” platform for moms and their families focused on public relations and specific website communications about increasing milk consumption.
In 2007, teen print advertising continued to feature the Milk Mustache celebrity campaign, which has built very strong equity among teens over the years. In addition, spending on the teen target

64
in 2007 utilized the Internet (Web sites, social networking, etc.), as well as traditional print. In addition, school communications utilized banners and expanded beyond cafeterias into gymnasiums, and also reached into elementary schools with age-appropriate messaging.
The Body by Milk campaign to reach, educate and reward teens (originally launched in 2006) was continued in 2007 with a strong array of available in-school and interactive, online materials to help communicate the nutritional value of milk in a compelling, relevant format. In schools which ran the Body by Milk “Music to Move You” poster program, weekly milk servings per student in secondary schools increased an estimated 4.5 percent the fall 2007 (source: PCI tracking report).
This Body by Milk program was one component of an overall school channel outreach effort by MilkPEP in 2007, incorporating the School Nutrition Association, dairy processors, school trade publication advertising and trade show attendance, and in-school materials, to educate school nutrition professionals about increasing milk consumption in schools. In addition, MilkPEP worked to increase milk consumption in schools through the Capturing the School Milk Opportunity program, which shows schools and processors how to improve school milk sales.
Beyond the teen demographic, the Milk Mustache campaign continued to be utilized to deliver the Healthy Weight message to moms. This iconic and highly-recognizable campaign has helped milk to cut through the clutter to reach both moms and teens in a marketplace in which milk has been heavily outspent by competitive categories.
For the QSR initiative, DMI continued partnering with chains to establish single-serve milk as a viable beverage choice for kids in immediate consumption outlets. In late spring 2007, DMI succeeded in partnering with the Subway chain of 22,000 outlets to offer 12-ounce plastic bottles of lowfat white and chocolate milk. This initiative continued to expand milk’s visibility and relevance as a contemporary beverage alternative in on-the-go, impulse venues such as QSRs, reaching an estimated 60,000 outlets in 2007.
The New Look of School Milk program, begun in 2002, continues to focus on enhancing the visibility and merchandising of plastic bottled single-serve milk in schools. In 2007, DMI worked with large foodservice management companies to promote and implement the core strategies of New Look of School Milk, and also continued to convert school districts to the program. As a result, New Look of School Milk has generated an estimated 200.6 million pounds of incremental milk volume in schools from 2002 through 2007, reaching 9,200 schools and an estimated 5.5 million students.11 In addition, DMI continues to develop and implement the Expanding Breakfast Program, with the goal of promoting breakfast consumption, including milk, as part of the overall child nutrition program.
As part of the strategic emphasis of driving school milk consumption, both MilkPEP and DMI are assisting processors in a variety of ways with flavored milk reformulations, to address the
11National Dairy Council and School Nutrition Association. School Milk Pilot Test. Beverage Marketing Corporation, 2002.
School Market Access database - National Dairy Council, 2007.
65
needs of school “wellness” policies. These programs involved efforts such as identifying flavored milk products that meet nutrition, wellness and taste requirements, conducting flavored milk testing with kids, and developing and making flavored milk formulations available to processors.
Finally, the MilkPEP efforts targeting Hispanics across TV/print advertising and public relations, increased in effectiveness and spending efficiency in 2007, with noteworthy increases in incremental volume generated with Hispanic moms (source: Marketing Management Analytics).
Overall, Beverage Marketing’s assessment of the performance and impact of the milk marketing programs in 2007 is positive. We believe the efforts to support ongoing improvements in all retail channel availability, product/package innovation, and utilization of consumer relevant messaging and media utilization are critical to the short and long-term growth and competitive viability of the fluid milk category.

66
Part II – National Fluid Milk Processor Promotion Program: Highlights by the National Fluid Milk Processor Promotion Board
In addition to the independent econometric analysis of dairy industry performance in Chapter 3 and the overall assessment of the impact of dairy promotion in 2007 submitted by Beverage Marketing Corp. in Part I of Chapter 4, the purpose of this analysis is to demonstrate the beneficial effect of the National Fluid Milk Processor Promotion Program (MilkPEP) by providing specific examples of the program’s success. Though it is encouraging that the marketing/communication community continues to laud the national Milk Mustache/“got milk?” campaign as among the most notable and successful communication efforts in history, it is important to know that the program is responsible for real and measurable improvement in the milk market.
An extensive range of marketing and communication disciplines are utilized to execute the program, and these are integrated in every manner possible to achieve the greatest impact. This section will: 1) explain the unexpected and favorable results of this integrated approach on industry sales in 2007, and 2) provide a specific example of how MilkPEP is playing the lead role to reduce the calories in flavored school milk as the Nation and education community address the growing childhood obesity issue.
Sustaining Milk Sales Despite Historically High Pricing
Milk prices, which actually began to rise in the last quarter of 2006, gradually increased through the second quarter of 2007 and then remained at historically high levels through the remainder of the year, with the average annual price 14.4 percent above 2006 in major retail channels, according to IRI (FDMx). (Figure 4–16) For consumers and processors, 2007 was arguably the worst pricing environment for milk in history, with milk prices at their greatest disparity compared to the overall grocery products and soft drinks. (Figure 4–17) The historically high milk prices in 2007 might have predicated a decline in sales. In fact, however, actual sales remained essentially unchanged, declining only 0.1 percent between 2006 and 2007.
One potential contributor to the unexpected stability of milk sales despite significantly higher prices may have been the fact that the price increase did not occur as quickly or as dramatically as in prior periods, e.g., 2004. Thus, the ‘sticker shock’ was not as great as in 2004. Another market factor was likely that the price of orange juice, a key competitor for milk, increased even more than milk price. Additionally, however, consumer research conducted on the effects of MilkPEP’s “weight loss/healthy weight” messaging indicates it has positively influenced consumer awareness, attitudes and perceptions of milk and milk’s benefits. This message has been timely and relevant in light of the country’s health/obesity crisis and MilkPEP has maintained the message for 4 years, possibly leading consumers to value milk at such a level as to sustain milk sales in an environment of higher pricing, and thus lending support to sustained and positive effect of MilkPEP messaging.

67
Figure 4–16 Fluid Milk Sales and Retail Price Changes – 2004 - 2007
Source: Information Resources, Inc. (FDMx)
Using the full range of our program’s measurement resources, we are able to assess the impact and value of the program in terms of providing the industry with a Retail Return on Investment (RROI) estimate for its marketing investment, and in achieving the national nutritional goals specified in its congressional mandate. MilkPEP’s Marketing Mix Analysis12 showed that the
Figure 4–17 Relative Pricing of Milk, Soft Drinks and "Food Basket CPI"
156
132
119
80
90
100
110
120
130
140
150
160
170
Jan00
May Sep
Jan01
May Sep
Jan02
May Sep
Jan03
May Sep
Jan04
May Sep
Jan05
May Sep
Jan06
May Sep
Jan07
May Sep
Price Index
Whole Milk
Food at Home
Carbonated Soft-drinks
Source: Bureau of Labor Statistics
12 Source: 2007 MilkPEP Marketing Mix Analysis, conducted by MMA, which builds regression based econometric models using actual sales, marketing and non-marketing factors to decompose the volume impact of various in-market stimuli, while controlling for outside variables
-0.15
-0.1
-0.05
0
0.05
0.1
0.15
0.2
0.25
0.3
Jan04
Feb0
4Mar
AprMay
Jun Jul
Aug SepOct
NovDec
Jan05
Feb05
MarApr
May Jun JulAug Sep
OctNov
Dec
Jan06
Feb06 Mar
AprMay
Jun JulAug
SepOct
NovDec
Jan07
Feb07
MarApr
May Jun Ju
lAug Sep
per
cen
t ch
ang
es
$0.00
$0.50
$1.00
$1.50
$2.00
$2.50
$3.00
$3.50
$4.00
$4.50
aver
age
pri
ce p
er e
q.
gal
lon
% Change Price/Eq. Gallon
% Change Volume
Monthly Average Price

68
share of total milk volume attributable to the short term MilkPEP activities, though down slightly from 3.5 percent in 2006, remained a significant 3.3 percent in 2007. In actual volume, that 2007 contribution represents approximately 173 million gallons, or an estimated $522 million in retail sales revenue nationwide. This represents a retail impact of $6.60 for every dollar spent by fluid milk processors in 2007. The short term RROI to the fluid milk industry, measured in terms of total retail sales ($6.60 for every dollar spent) remains highly favorable, basically flat compared to 2006 ($6.61 for every dollar spent).
While incremental volume is defined as volume directly attributable to specific marketing activity in the current year, base volume reflects “intrinsic demand” and is defined as volume that can not be directly linked to current or very recent (within the current year) marketing activities such as in-store promotion or advertising. Base volume is a product of consumers’ long-term affinity for a product and is affected over time by marketing programs, particularly awareness and equity building media such as advertising and public relations.
In 2007, despite the historically high prices for milk, the base volume as measured by the Marketing Mix Analysis was roughly flat versus 2006, thus not diminishing the recent growth.The continued strength of base volume is likely a function of the long-term behavior change advocated by the campaign, and adopted by consumers for what is a very “habitual consumption” product (Figure 4–18).
Continuing a long-term trend, once again in 2007, lower-fat milks volume increased and whole milk volume declined. (Figure 4–19). All of MilkPEP’s ongoing messaging specifies low-fat and fat free milk, and the healthy weight message awareness and believability among target consumers are very high, (69 percent and 54 percent of adult women in Q4 2007, respectively13).
Figure 4–18 Growth of Base during Modeled Time Period
Source: 2007 Marketing Mix Analytics Corporation Study; 2007 is a year-end estimate based on actual base volume generated through 11/4/07
13 Source: Data Development Worldwide Q4, 2007 tracker
5.5 5.45.75.7
0.0
1.0
2.0
3.0
4.0
5.0
6.0
7.0
2004 2005 2006 2007 Projected
Base Volume
(Billions of Gallons)

69
Figure 4–19 Milk Volume Changes by Segment – 2006-2007
78.5
-77.7
-100
-80
-60
-40
-20
0
20
40
60
80
100
USDA
Vol
ume
Cha
nges
(mil
gal)
Whole
Fat Reduced
Source: USDA-AMS; IRI-FDMw
Thus, it seems likely that the program is influencing consumers to choose the lower-fat products.Also based on the quarterly consumer tracking studies, both of MilkPEP’s key targets, Moms and Teens, indicate they are drinking more milk, with general health sited as the primary reason. (Figures 4–20 and 4–21)14
Based on the Marketing Mix Analysis and other indicators as detailed above, in this highly competitive beverage marketplace, the MilkPEP program in 2007 was effective in driving incremental volume and helping to mitigate the long-term loss of market share. The program advanced its effectiveness by focusing on new ideas, such as science supporting the positive impact of milk consumption on maintaining a healthy weight and data showing that those with higher milk consumption and lower consumption of sugary drinks have lower BMI (Body Mass Index)15 and healthier diets overall. MilkPEP’s public relations efforts communicated the emerging science linking milk with anti-aging, bone health and lowered risk of diabetes and certain types of cancer. 16
Addressing At-Risk Flavored Milk in School Channel
Continued concern for the growing childhood obesity epidemic has created heightened attention to, and scrutiny of the foods and beverages marketed and sold to children, with schools in
14 Source: Data Development Worldwide quarterly advertising, attitude and consumption tracking study utilizing an Internet panel of over 450,000 households, built as a randomly sampled construct of the U.S. consumer population, continuously interviewing 300 adult women, 150 mothers of kids 2 to 14 and 300 teens (split between boys and girls) each month 15 BMI provides a reliable indicator of body fatness for most people and is used to screen for weight categories that may lead to health problems (Source: Centers for Disease Control) 16 Detailed findings and published studies can be found on whymilk.com

70
Figure 4–20 Drinking More/Less White Milk Compared to Six Months Ago (Moms)
Question: “Do you feel that you are drinking more, less or the same amount of white milk as six months ago?”
Source: Data Development Worldwide
Figure 4–21 Drinking More/Less White Milk Compared to Six Months Ago (Teens)
Question: “Do you feel that you are drinking more, less or the same amount of white milk as six months ago?”
Total Teens Less More
Q4 2007 Q3 2007 Q2 2007 Q1 2007 Q4 2006 Q3 2006 Q2 2006 Q1 2006 Q4 2005 Q3 2005 Q2 2005
6%9%
8%
7%6%
7%7%
10%
6%8%
10%
34%31%
30%
36%26%
36%30%
33%
29%33%
31%
11%
14%
9%
11%
6%
11%
11%
12%
13%
32%
24%
29%
29%
26%
26%
21%
26%
25%
Source: Data Development Worldwide, 3/08 report.
Reasons For Drinking More Milk2006 2007
Q3 Q4 Q1 Q2 Q3 Among Those Drinking More (36)* (45)* (45)* (41)* (35)* % % % % % Healthier For Me/Child 13 32 23 21 31 Pregnant/Nursing My Baby 4 12 7 5 18 Trying To Cut Back On Fats/Trying To Lose Weight 11 24 14 22 12
Just Have/Have More Around Lately/It's What Is Available At The Time
2 2 2 8 11
Just Like It 12 14 17 17 11 Like It More/Prefer It With Certain Foods/Drink/Meals 8 2 2 0 10
Good for bones 5 7 4 5 9 Need The Calcium 7 4 7 12 6
Reasons For Drinking More Milk2006 2007 Q4 Q1 Q2 Q3 Q4
Among Those Drinking More (89*) (107) (90*) (97*) (270) % % % % % Healthier for me 31 32 27 29 28 Just like it 19 18 24 12 15 Like the taste/Child likes the taste 8 12 5 14 11 Like it more/Prefer it with certain foods/drink/meals 7 1 4 8 8 Enjoy it with cereal 4 5 6 11 7 Good for bones 6 3 2 7 6 Trying to cut back on fats/ lose weight 13 8 3 6 6
Total Moms Less More
Q4 2007 Q3 2007 Q2 2007 Q1 2007 Q4 2006 Q3 2006 Q2 2006 Q1 2006
Q4 2005

71
Figure 4–22 Share of Flavored Milks in Schools that Met Initial AHG Guidelines – 2006/07 School Year
Source: School Marketing Access database – DMI and Prime Consulting
particular targeted for changes. Pressure to reduce fat, sugar and calorie levels of flavored milk in schools is being applied at every level, from government to consumer advocacy organizations.
Several public interest groups have initiated action to address childhood obesity in schools, inparticular the Alliance for a Healthier Generation (AHG), a partnership of the American Heart Association, the Clinton Foundation, and the American Beverage Association. The AHG “School Beverage Guidelines” have gained significant influence in schools and have been adopted by the major beverage companies. The AHG voluntary guidelines call for 150 calories per 8 ounce beverage serving. When the AHG guidelines were announced in 2006, only about 1/3 of the chocolate milk and less than 30 percent of other flavor offerings in schools met the 150-calorie criteria. (Figure 4–22)
Flavored milk, with the same nine essential nutrients as white milk, plays a very important role in child nutrition and the school meal programs (Figure 4–23). An estimated 70 percent of milk sold in schools is flavored milk. Research has shown that when students have a variety of milk flavors to choose from, more milk is consumed (Figure 4–24). In schools that served 2 flavorsin addition to white and chocolate, weekly per student consumption was 0.42 ounces, or 12.2 percent, higher than in schools where only white and chocolate milk were available, according to PCI’s Annual School Survey. In addition, intake of nutrients such as calcium, magnesium and phosphorus increases. Children who drink flavored milk tend to drink fewer nutrient-poor sodas and sugary fruit drinks, and flavored milk contributes only a fraction of the total added sugars (<2.0 percent) consumed by children and adolescents; and children who drink flavored milk tend to be leaner than those who do not. 17
The risk of negatively impacting milk consumption among school-aged children is real and serious. Already, milk consumption declines dramatically during the teen years. (Figure 4–25) Limiting the availability and/or the appeal of flavored milk in schools is likely to result in lower
17 Detailed findings and published studies can be found on whymilk.com
30% 70%
36%
22%
28% 72%
78%
64%
AALLLL FFLLAAVVOORRSS
CChhooccoollaattee
SSttrraawwbbeerrrryy
OOtthheerrss
<< 115500 CCaalloorriieess >> 115500 CCaalloorriieess

72
Figure 4–23 Children Who Drink Flavored Milk have Better Nutritional Profiles
Source: What America Drinks: How Beverages Relate to Nutrient Intakes & Body Weight; Jan 2007
consumption at school, and potentially translate to lower consumption of milk overall by the students currently as well as later in life.
Recognizing that milk’s long standing position on the school lunch line will be in jeopardy if processors do not move quickly to meet the AHG guidelines, MilkPEP made a commitment to protect our current ability to deliver nutrient-rich flavored milk to children, improve the health profile of flavored milk via lower calories and deliver the healthiest flavored milk product possible.
Figure 4–24 Students Consume More Milk In School When Offered More Flavors Weekly Servings of Milk per Student
Source: Annual School Survey ‘06/’07, Prime Consulting Inc.
3.69
3.45
3.773.87
TOTAL White + Choc + 1
Flavor
White + Choc Only
White + Choc + 2 or More
26.3%
32.9%
24.4%21.7%
2.6%Whole Milk Flavored
MilkSoft Drink Sports
DrinksNon-MilkDrinkers
% of Children Who Meet or Exceed Calcium RDI
And Who Are Heavy Users of

73
Figure 4–25 Milk Consumption Declines in Teen Years
Source: Share of Intake Panel 2004, TNS-NFO
The industry has thus far invested approximately $1 million toward addressing the issue through research, flavor testing and training the industry on ways to improve flavored milk health profiles through the School Milk Flavor Formulation Workshops. The Workshops reach out to milk processors to provide potential solutions for reducing calories in flavored school milk by August 2008. The first workshop was held in August 2007, and to date about 25 dairies and 225 fluid milk processors have participated in the program. This cadre of processors represents roughly 60 percent of milk volume in the U.S., and all participants have committed to having 150-calorie flavored milk offerings by August 2008, with some already having attained this goal.
In Summary
MilkPEP continues to promote the fluid milk industry, supporting the Federal nutrition goals outlined in the legislative act establishing the program – as well as the nutrition goals as outlined in the U.S. Dietary Guidelines for Americans and USDA’s Food Guide Pyramid. MilkPEP is a national marketing voice for milk in a marketing environment subject to a high degree of Federal and State regulation, helping to maintain the strength and stability of the fluid milk industry, to the benefit of the Nation’s health.
0
10
20
30
40
50
60
70
80
90
100
Under 6 6 to 12 13 to 17 18 to 24 25 to 34 35 to 49 50 to 59 60 yrs+
Per Capita Milk Volume (oz per week)

74
Part III – National Dairy Promotion and Research Program: Highlights by Dairy Management Inc.
Introduction: DMI’s Changing Role
In 2007, dairy checkoff organizations continued the transition from direct consumer programming to a more aggressive business strategy focused on working with influential industry partners with the goal of meeting dairy demand. DMI is working with industry partners to identify the products customers want, where and how they want them.
Over the years, the buying power of promotion dollars has decreased due to inflation. At the same time, consumers are becoming more sophisticated, and accustomed to niche marketers meeting their needs. Rather than continuing to fund programs to promote only the products that are currently available, dairy farmers have shifted their focus to address the issue of unmet demand: the products consumers want, need, and are willing to pay for.
With limited promotional funding, it has become increasingly important to find the most cost-effective way to fund programming to drive sales. The Board of Dairy Management Inc. has made a strategic decision to maximize the dollars available by partnering with leaders and innovators in the dairy industry in order to find synergies between branded and generic efforts.Several years ago, dairy checkoff staff tested the theory that if the market leader in a given category could be persuaded to enhance the milk experience, soon the rest of the category would have to follow suit in order to compete. While the initial outlay in money and manpower may have been more than in years past, the theory proposed that once the market leader converted, it would take less involvement to convert the next tier of players, and finally, the marketplace – and consumers themselves – would demand the change of the rest of the category. This theory is referred to as the Analytic/Catalytic Concept.
This theory is demonstrated graphically in Figure 4–26: The very top of the pyramid represents the highest level of involvement by DMI/dairy checkoff staff. This phase could include productdevelopment, market testing, and support of advertising concepts. It represents the highest level of input in both dollar value and staff time. This is referred to as the Analytic phase – the direct expenditure of time and money. Tier two represents where the change has been shown to be valuable to other market participants, and competitors realize they must make similar changes or risk losing market share. Finally, at the base of the pyramid lies the third tier, where the change becomes an accepted part of doing business, with little or no involvement from dairy checkoff.
This pyramid shows the Catalytic Concept with a Return on Investment indicator. As shown, dairy farmer resources allocated to these projects will be the greatest in the beginning stages, and will decrease exponentially downward as the greater impact within the market is demonstrated.
Fully Executed Model: Quick Serve Restaurants (QSRs)
An example of the fully executed pyramid is the 2004 launch of single-serve, low- fat white and chocolate milk, in plastic, re-sealable containers at two of the top five quick serve restaurant

75
Figure 4–26
Measurement PyramidDMI Initiative Model
Tier 1 = Direct DMI involvement
with industry rollout
Tier 2 = Catalytic Impact Multiple partners; industry
acceptance; competitors copy leader
Tier 3 = Mass acceptance by industry; initiative becomes ‘price of doing business’
DM
I In
flue
nce
Level of Industry Impact
Source: Dairy Management Inc.
chains in the country. Foodservice – a traditionally under-developed, away-from-home business segment for milk – is a critical channel to reach kids despite the historical market dominance of carbonated soft drinks.
DMI staff approached key foodservice chains with the proposition that milk as part of a balanced diet could be part of a solution to the rising obesity levels among children. The excellent results of the School Milk Pilot Test conducted by DMI was the basis for proving that, given more attractive packaging and flavors, children would increase their milk consumption dramatically. In order to convince franchisees that promotion of single serve milk in plastic bottles would pay both long-term and short-term dividends, a four-market test was conducted using milk as a part of the kid’s meal offerings. The test was successful. Key competitors in the four test markets observed the success and began to push their national offices for a similar program. The race was on to be first to launch the product nationally.
One of the barriers to overcome was the habitual ordering of soft drinks by both moms and children. The decision was made to offer a broad spectrum of marketing and merchandising techniques to break this traditional pattern. DMI collaborated on advertising that announced the new meal offerings and developed point-of-sale materials both in-store and at the drive-through.In-store materials prominently featured milk and tied in with restaurant/movie promotions and

76
other themes throughout the promotional period. At the grassroots level, local promotion agencies created incentives for the restaurant staff to suggest milk with kid’s meals, cookie and milk promotions, and public relations events that featured nutrition and exercise tips.
In this Analytic phase of the program DMI enabled these fast food giants to build the business case for single-serve milk in plastic containers by providing milk sales/trend information, consumer insights, milk-specific consumption data, and the results of the School Milk Pilot Test.The success realized by these chains, in terms of milk sales, merchandising and overall restaurant traffic gains, has served as a catalyst for other quick-serve competitors to add milk to their menus in 2007 and beyond (Figure 4–27).
In the following years additional top-ten chains were supported with selling propositions and point of sale materials. The program entered the Catalytic Phase and the model was proving to be more than a theory. These chains were given a decreasing amount of assistance in both monetary and staff resources. As this program progressed additional chains began to adopt single-serve milk in plastic containers, without assistance from DMI, as a way to build traffic and their nutrition profile.
Now, more than 60,000 quick-serve outlets nationwide offer single-serve milk, in plastic resalable containers, and they support this offering with attractive marketing.
Figure 4–27
183.0 190.6 195.9
285.8
378.1
427.1449.4
2001 2002 2003 2004 2005 2006 2007Source: NPD CREST ¹ QSR Hamburger + QSR other Sandwich Categories
Continued Growth in Milk
Milk Servings (MM)
+4% +46+3% +32 +13 +5% % Chg vs Yr
Servings at QSRs¹

77
New Product Development: A New Test For The Model
In April 2006, DMI conducted an in-depth segmentation study involving 3,000 consumers. From a marketing management viewpoint, market segmentation divides a market into distinct groups who might be attracted to different products or services. This technique is widely accepted as one of the requirements for successful marketing. By dividing the market into relatively homogenous subgroups or target markets, both strategy formulation and tactical decision making can be more effective.
The survey offered insights on how milk can better address beverage-consumption occasions, packaging, process and product development, and marketing and merchandising efforts. A goal of the study was to identify the key occasions upon which one consumes a beverage. In addition, the survey report offers insights into how milk and dairy-based beverages can better address those occasions through package, process and product development and marketing and merchandising efforts. The study uncovered seven beverage “need-states” which are needs that drive consumers to buy certain products. Of these, DMI identified four need-states as having great potential for value-added milk: Health Focused, Replenish, Meal Replacement/Other and Comfort/Indulgence. These are the segments where milk has a significant opportunity to gain share, and together, they represent 62 percent of total beverage consumption.
Value-added milk is broken down into two categories: 100 percent milk products, which include products made with 100 percent milk with specific benefits such as flavoring, reduced lactose, extra nutrients and single serve bottles; and milk-based beverages, which are beverages where milk is a key ingredient but less than 100 percent. This includes drinks such as lattes, nutritional drinks and smoothies.
Around the same time, DMI partners were trying to grow the fortified milk category. A1.0 percent lowfat milk product with the rich creamy taste of whole milk, plus additional protein (25 percent) and calcium (20 percent) was trying to find the right niche. Some of these products use the ultra-filtration process to remove extra liquid from the milk to create the creamy consistency and mouth feel of whole milk.
Positioning the right product to the right consumer at the right place and time is the key to growth for the milk category. Market research from DMI on who those customers might be, combined with the reach and influence of State and regional units from throughout the Northeast and Southern States, helped position protein fortified milks in these markets (Figure 4–28). Marketing support included traditional efforts, such as sampling, radio tags and print advertising.In addition, through State and regional organizations’ close relationships with local health professional groups, the chocolate version of this product gained access to key influencers – namely dietitians, pediatricians, and other members of medical groups, including American Academy of Pediatricians, National Medical Association, American Academy of Family Physicians, and the American Dietetic Association. These health professional groups received information explaining the nutritional attributes of the product and received samples at industry meetings in order to encourage endorsement of the product to clients and the media.

78
Figure 4–28
As of this writing, this value added program is work in progress, and remains at the analytic phase of the evaluation.
Together, the repositioning of this value-added milk through increased marketing support plus the introduction of a chocolate product is working positively to turn around the brand. This increase in brand sales was sufficient to lift the entire category of enhanced milk products in the face of declining fluid milk sales overall. The information gathered in this test concerning value- added milks is available to all brands in the market and with proper marketing should further build fluid milk category sales, which is the ultimate goal of the checkoff program.
Incremental Sales Definition, Explanation and Results
Incremental sales, as defined by The American Marketing Association, is, Units of the product sold to retailers or consumers through a sales promotion effort over and above the amount that would have been sold in the absence of the promotional deal.
Growth in sales is converted into pounds based on the amount of milk used within the product.The resulting sales are reported by DMI’s partners as agreed with DMI in the beginning of the program.
Careful consideration is given to interpreting what sales occurred specifically due to the program and what dairy product consumption may have been replaced by the promoted product, resulting in lower sales increases for the dairy farmer.

79
Single-Serve Milk in QSRs: The growth in sales shown in Table 4–1 is based on the average unit sales of milk per store per week provided by the partnering Quick Serve Restaurants for both pre-plastic bottle and post-plastic bottle time periods. Total milk unit sales were tracked for the year, establishing a baseline prior to the plastic bottle switch. The calculation for incremental sales in a given month for a QSR is (Average Weekly Sales Units – Pre-Existing Weekly Sales Units) x Number of Stores x Number of Weeks. Those units are then converted into pounds of milk using the following calculation: Units x 8 fluid ounces per unit/128 fluid ounces per gallon x 8.6 pounds per gallon.
Value-added Milk (Table 4–2): The equation for calculating incremental sales for enhanced milk that DMI partnered on in established markets is the Current 18 months – Previous 18 Month Sales (Base Line), provided the category experienced overall growth. The partner’s growth rate, 3.6 percent was compared to the category growth rate of 7.5 percent, both of which outpaced total fluid milk growth rate of –3.9 percent.
Table 4–1
YearGrowth in Sales, lbs.
Cost of Program
Change in Production,
lbs.
Change in All-Milk Price,
$/cwt.
Change in Gross
Producer Revenue
Change in Net Producer Revenue
2004 Fluid milk, 2%, ndm fortified 66,587,737 $8,272,000 7,422,645 $0.0150 $30,399,133 $29,307,583
2005 Fluid milk, 2%, ndm fortified 53,282,118 $60,000 25,381,313 $0.0234 $49,525,817 $45,793,322
2006 Fluid milk, 2%, ndm fortified 7,551,546 $560,000 38,560,574 $0.0215 $47,637,598 $41,967,003
2007 Fluid milk, 2%, ndm fortified 35,968,029 $750,000 49,318,298 $0.0276 $61,139,487 $53,886,895
Fluid milk, 2%, ndm fortified 0 $0 61,203,975 $0.0240 $55,999,174 $46,998,712
$9,642,000 181,886,805 $0.0223 $244,701,209 $217,953,514Estimated Project Benefit:Cost ratio: 21.60:1
Assessment of QSR Single Serve Program
Present Value of First 5 Years
Table 4–2
YearGrowth in Sales, lbs.
Cost of Program
Change in Production,
lbs.
Change in All-Milk Price,
$/cwt.
Change in Gross
Producer Revenue
Change in Net Producer Revenue
2007 Fluid milk, 2%, ndm fortified 3,127,556 $1,243,740 348,634 $0.0007 $1,427,815 $1,376,546
2008¹ Fluid milk, 2%, ndm fortified 1,563,778 $0 1,087,481 $0.0009 $1,897,575 $1,737,654
Fluid milk, 2%, ndm fortified 0 $0 0 $0.0000 $0 $0
Fluid milk, 2%, ndm fortified 0 $0 0 $0.0000 $0 $0
Fluid milk, 2%, ndm fortified 0 $0 0 $0.0000 $0 $0
$1,243,740 1,436,115 $0.0003 $3,325,391 $3,114,200Estimated Project Benefit:Cost ratio: 1.50:1
¹ 2008 Growth in sales is the result of the first 2 quarters off the year.
Assessment of Added Value Milk Program
Present Value of First 5 Years
The tables above show that these programs generate positive returns.

80
The balance of the incremental sales came from new markets in the southeast region to which the partner’s brand was expanded. According to branded sales information from the processor, in the southeast region the new product expansion grew the category 84.2 percent, and the new product represented 92.3 percent of that growth.
Conclusion
Dairy checkoff has long been viewed as an innovation leader and catalyst for change in the industry. As we continue to move forward with fresh ideas for maximizing dairy farmer investments, we will need not only to look critically at our initiatives and activities, but take further steps to determine how best to analyze what works best to move dairy sales. Based on the experience detailed above, we are confident our direction of working with industry leaders to develop ways to serve unmet markets will lead to increased sales and future dairy consumers.
The Evaluation Model
In order to effectively measure the past performance and future potential of producer invested programs, DMI is measuring the impact of each program’s sales increases on the value of farm milk. The evaluation tool developed for this purpose has the flexibility to measure impacts of sales over time in all classes of milk by converting incremental unit sales into pounds of protein and milkfat, then assessing the market-wide impacts.
This spreadsheet model was developed for DMI by Dr. Roger Cryan of the National Milk Producers Federation. The demand analysis in the model is adapted from demand elasticities for milk components calculated and provided by Dr. Scott Brown at the Food and Agriculture Policy Research Institute. The supply analysis is adapted from supply equations developed by USDA/AMS, Dairy Programs.18 Other model parameters include baseline milk and component prices and supply. The primary raw inputs for the model are the costs of each promotion project and the incremental pounds of dairy product sales generated by each project; these are generally projected or estimated in connection with the project itself; in the model they are assumed to be additions to overall demand (i.e., they represent an outward shift of the demand curve).
The model calculates estimated changes in producer prices, gross producer revenue, and producer revenue net of the cost of additional production. Finally, it generates a project rate of return to dairy farmers, based on the promotion cost and net revenue benefit.
Sum Cost of Program / Sum Impact on Producer Revenue
The objective in using this model is to look at the future value of today’s investment and analyze potential payback. This also allows us to evaluate programs where the payback is not expected within the same year of the investment or where there is an expected catalytic impact on sales stemming from a direct investment.
18 USDA Agricultural Marketing Service (AMS) Dairy Programs National Econometric Model Documentation.April 2007. Available at http://www.ams.usda.gov/AMSv1.0/getfile?dDocName=STELPRDC5056334
81
This model has the flexibility to compare projects across all dairy product types. Therefore, DMI can rank projects based on value added to the industry whether the sales source is fluid milk, cheese, ingredient, or some other processed dairy product. The spreadsheet allows us to investigate various incremental sales and investment scenarios by easily changing input assumptions, and is, therefore, a usable tool for valuation and budgeting exercises. This model may also be used to measure investment projects in which maintaining existing volume is the measure of success.
In summary, this model evaluates investments by the amount of value that the investors will receive by measuring the base elements from which processor’s payments derive. It looks at a multiple-year period allowing the programs time to gain acceptance with the initiating partner and consumer. Additionally, it allows us to apply consistent quantitative thinking to projects across all areas of dairy investment.
Definitions
• Growth in Sales (lbs.) – The increase in annual sales of the specified dairy product that were sold over and
above the previous year due to a particular program. (If a project increases sales for only 1 year, there is an offsetting negative change in the second year.)
• Cost of Program – The total dollar investment made each year by check-off organizations for the
project.
• Change in Production (lbs.) – The estimated increase in U.S. production resulting from the price impacts of the
project.
• Change in the All-Milk Price ($/cwt.) – The estimated impact on the all-milk price, relative to the baseline, for each year,
including the impact from shifting demand and a change in the “blend” value based on the Class price for the product.
• Change in Gross Producer Revenue – The estimated change in total producer revenue, resulting from changes in price
and production.
• Change in Net Producer Revenue – The estimated change in net producer revenue, based on the change in price and
the net returns from new milk production. Benefit Cost Ratio
– The change in the total Net Producer Revenue divided by the total Cost of the Program.

82
[This page is intentionally blank.]

83
Appendix A–1National Dairy Promotion and Research Board
Current Member Listing
Region 1 (Oregon and Washington) Elizabeth I. Anderson James Zielinski Onalaska, Washington St. Paul, Oregon Term expires 10/31/2009 Term expires 10/31/2010
Region 2 (California) James L. Ahlem Mary E. Cameron Hilmar, California Hanford, California Term expires 10/31/2010 Term expires 10/31/2009
Kimberly K. Clauss Ronald L. Koetsier Hilmar, California Visalia, California Term expires 10/31/2009 Term expires 10/31/2008
Stephen D. Maddox Brad J. Scott Riverdale, California Moreno Valley, California Term expires 10/31/2010 Term expires 10/31/2010
Pauline Tjaarda Shafter, California Term expires 10/31/2010
Region 3 (Arizona, Colorado, Idaho, Montana, Nevada, Utah, and Wyoming) Lester E. Hardesty Grant B. Kohler Greeley, Colorado Midway, Utah Term expires 10/31/2008 Term expires 10/31/2010
William C. Stouder Wendell, Idaho Term expires 10/31/2009
Region 4 (Arkansas, Kansas, New Mexico, Oklahoma, and Texas) William R. Anglin Jose L. Gonzalez Bentonville, Arkansas Mesquite, New Mexico Term expires 10/31/2008 Term expires 10/31/2010
Lawrence A. Hancock Muleshoe, Texas Term expires 10/31/2009
AP
PE
ND
IX A
ME
MB
ER
SHIP
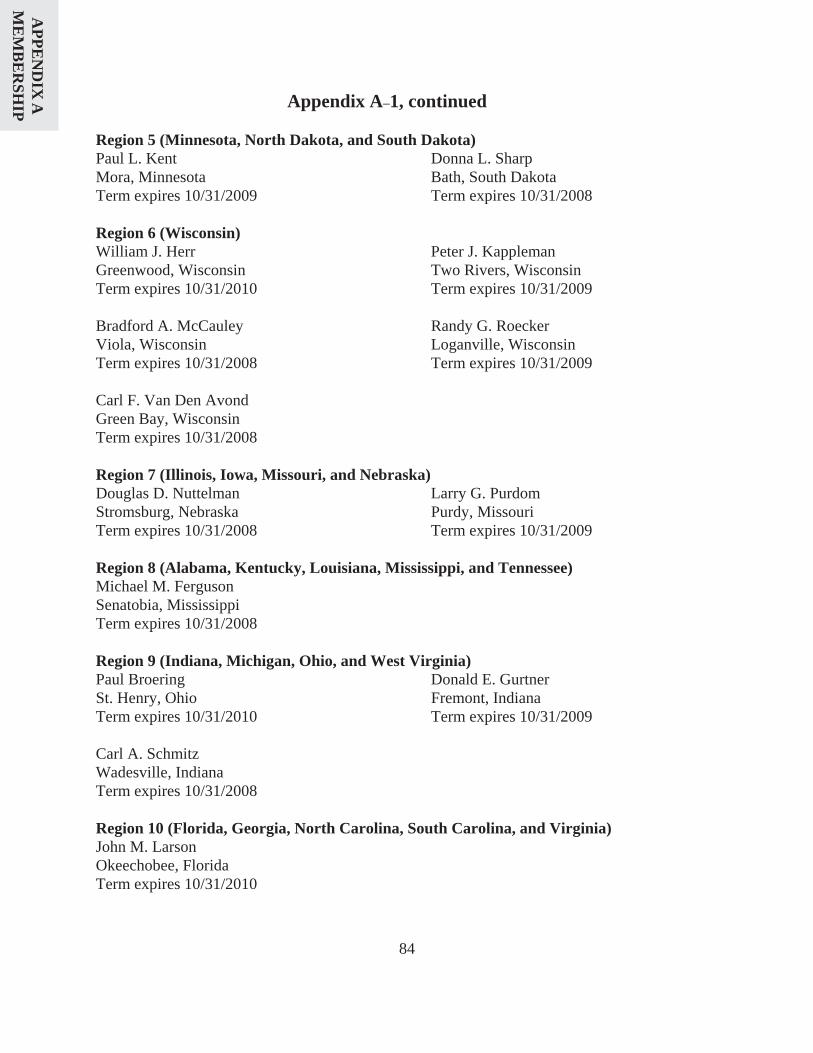
84
Appendix A–1, continued
Region 5 (Minnesota, North Dakota, and South Dakota) Paul L. Kent Donna L. Sharp Mora, Minnesota Bath, South Dakota Term expires 10/31/2009 Term expires 10/31/2008
Region 6 (Wisconsin) William J. Herr Peter J. Kappleman Greenwood, Wisconsin Two Rivers, Wisconsin Term expires 10/31/2010 Term expires 10/31/2009
Bradford A. McCauley Randy G. Roecker Viola, Wisconsin Loganville, Wisconsin Term expires 10/31/2008 Term expires 10/31/2009
Carl F. Van Den Avond Green Bay, Wisconsin Term expires 10/31/2008
Region 7 (Illinois, Iowa, Missouri, and Nebraska) Douglas D. Nuttelman Larry G. Purdom Stromsburg, Nebraska Purdy, Missouri Term expires 10/31/2008 Term expires 10/31/2009
Region 8 (Alabama, Kentucky, Louisiana, Mississippi, and Tennessee) Michael M. Ferguson Senatobia, Mississippi Term expires 10/31/2008
Region 9 (Indiana, Michigan, Ohio, and West Virginia) Paul Broering Donald E. Gurtner St. Henry, Ohio Fremont, Indiana Term expires 10/31/2010 Term expires 10/31/2009
Carl A. Schmitz Wadesville, Indiana Term expires 10/31/2008
Region 10 (Florida, Georgia, North Carolina, South Carolina, and Virginia) John M. Larson Okeechobee, Florida Term expires 10/31/2010
AP
PE
ND
IX A
ME
MB
ER
SHIP

85
Appendix A–1, continued
Region 11 (Delaware, Maryland, New Jersey, and Pennsylvania) Joyce A. Bupp Rita P. Kennedy Seven Valleys, Pennsylvania Valencia, Pennsylvania Term expires 10/31/2008 Term expires 10/31/2009
Paula A. Meabon Wattsburg, Pennsylvania Term expires 10/31/2010
Region 12 (New York) Corinne M. Banker Ronald R. McCormick Morrisville, New York Java Center, New York Term expires 10/31/2010 Term expires 10/31/2008
Sanford Stauffer Nicholville, New York Term expires 10/31/2009
Region 13 (Connecticut, Maine, Massachusetts, New Hampshire, Rhode Island, and Vermont)Debora A. Erb Landaff, New Hampshire Term expires 10/31/2008
AP
PE
ND
IX A
ME
MB
ER
SHIP

86
Appendix A–2National Fluid Milk Processor Promotion Board
Current Member Listing
Region 1 (Connecticut, Maine, Massachusetts, New Hampshire, Rhode Island, and Vermont)Michael F. Touhey, Jr. Dean Foods Company Franklin, Massachusetts Term expires 06/30/2010
Region 2 (New Jersey and New York) James F. Walsh H.P. Hood, L.L.C. Lynnfield, Massachusetts Term expires 06/30/2011
Region 3 (Delaware, District of Columbia, Maryland, Pennsylvania, and Virginia) Michael F. Nosewicz The Kroger Company Cincinnati, OhioTerm expires 06/30/2009
Region 4 (Georgia, North Carolina, and South Carolina) Charles L. Gaither, Jr. Milkco, Inc. Asheville, North Carolina Term expires 06/30/2010
Region 5 (Florida) Michael R. Smith Publix Super Markets, Inc. Lakeland, Florida Term expires 06/30/2011
Region 6 (Ohio and West Virginia) Jay S. Bryant Maryland and Virginia Milk Producer’s Cooperative Association, Inc. Reston, Virginia Term expires 06/30/2009
AP
PE
ND
IX A
ME
MB
ER
SHIP

87
Appendix A–2, continued
Region 7 (Michigan, Minnesota, North Dakota, South Dakota, and Wisconsin) James B. Green Kemps, L.L.C. (a subsidiary of HP Hood, L.L.C.) St. Paul, Minnesota Term expires 06/30/2010
Region 8 (Illinois and Indiana) Brian Haugh National Dairy Holdings Dallas, Texas Term expires 06/30/2011
Region 9 (Alabama, Kentucky, Louisiana, Mississippi, and Tennessee) Edward L. Mullins Prairie Farms Dairy, Inc. Carlinville, Illinois Term expires 06/30/2009
Region 10 (Texas) Robert Bruce McCullough H. E. Butt Grocery Company San Antonio, Texas Term expires 06/30/2010
Region 11 (Arkansas, Iowa, Kansas, Missouri, Nebraska, and Oklahoma) Steven M. Turner Turner Dairy, L.L.C. (a subsidiary of Prairie Farms Dairy, Inc.) Covington, Tennessee Term expires 06/30/2011
Region 12 (Arizona, Colorado, Nevada, New Mexico, and Utah) John R. Zuroweste Dean Foods Company Dallas, Texas Term expires 06/30/2009
Region 13 (Idaho, Montana, Oregon, Washington, and Wyoming) Jerry N. Tidwell Safeway, Inc.Pleasanton, California Term expires 06/30/2010
AP
PE
ND
IX A
ME
MB
ER
SHIP

88
Appendix A–2, continued
Region 14 (Northern California) Jay B. Simon Super Store Industries Stockton, California Term expires 06/30/2011
Region 15 (Southern California) Paul W. Bikowitz Heartland Farms City of Industry, California Term expires 06/30/2009
Members-At-Large (Processors) Charles S. Mayfield, Jr. Mayfield Dairy (a subsidiary of Dean Foods Company) Athens, Tennessee Term expires 06/30/2009
Michael A. Krueger Shamrock Foods Company Phoenix, Arizona Term expires 06/30/2011
Randy D. Mooney Hiland Dairy Foods Company, L.L.C. Springfield, Missouri Term expires 06/30/2010
Teresa E. Webb Farmland Dairies, L.L.C. Wallington, New Jersey Term expires 06/30/2010
Members-At-Large (Public) Janey K. Thornton, PhD.Elizabethtown, Kentucky Term expires 06/30/2009
AP
PE
ND
IX A
ME
MB
ER
SHIP

89
Appendix B–1National Dairy Promotion and Research Board
Actual Income and Expenses (Thousands)
2006 2007 IncomeAssessments $90,320 $91,951 Program Development Fund (NAEMS1 Study) - 2,000 Interest 965 1,720Total Income $91,285 $95,671 General Expenditures General and Administrative $3,759 $3,753 USDA Oversight 757 712 Total General Expenditures $4,516 $4,465 Program Expenditures Communications and Member Relations $15,474 $25,405 Domestic Marketing 40,143 34,681 Export Enhancement 5,199 6,432 Disbursement for NAEMS1 Study 6,000 2,000 Investment in NAEMS1 Study (5,833) - Planning and Research 3,078 3,519 Total Program Expenditures $64,061 $72,037 Excess of Revenue (Under) Over Expenditures $22,708 $19,169 Fund Balance, Beginning of Year $15,321 $37,966
Fund Balance, End of Year $38,029 $55,135
1National Air Emissions Monitoring Study. Source: Independent Auditor’s Report of the National Dairy Board and USDA records.
AP
PE
ND
IX B
FIN
AN
CE
S

90
Appendix B–2
USDA Oversight Costs for the National Dairy Promotion and Research Board
(Thousands) 2006 20073
USDA Oversight Costs Salaries and Benefits $382,865 $370,581 Travel 46,394 62,733 Miscellaneous1 51,688 66,920 Equipment 5,131 5,016 Printing 5,269 6,604 USDA Oversight Total $491,347 $511,854 Independent Evaluation $95,154 $122,062 Total2 $586,501 $633,916 1Includes overhead, transportation, rent, communications, utilities, postage, contracts, supplies, photocopying, and Office of the General Counsel costs. 2The totals for USDA expenses differ slightly from those shown in Appendix B–1 because of end-of-year estimates which are adjusted in the following year. 3The 2007 totals correspond to the Federal fiscal year, which runs from October1 through September 30. Source: USDA accounting reports.
AP
PE
ND
IX B
FIN
AN
CE
S

91
Appendix B–3National Dairy Promotion and Research Board
2008 Approved Budget (Thousands)
2008 RevenuesAssessments $91,000 Program Development Fund Draw 27,915 Carryover from Prior Year 11,110 Interest 600Total Income $130,625 ExpensesGeneral and Administrative $4,100 Amortization of NAEMS1 Study 2,000 USDA Oversight 800 Subtotal $6,900 Program Budget Milk $10,075 Cheese 8,330 Ingredients 6,136 Export Enhancement 11,731 Children’s Fitness and Nutrition Initiative 21,688 Product Research 6,598 Nutrition Research 9,669 Nutrition Affairs 9,614 3-A-Day 3,400 Public and Industry Communications 8,419 Foodservice 3,261 Retail 5,972 Strategy and Insights 11,172 Other2 8,042 Subtotal $124,107* Total Budget Expenditures $131,007 1National Air Emissions Monitoring Study. 2Other includes fixed commitments, butter promotion, value added milk, value-added cheese, value-added milk and cheese. *UDIA Expense share of total is $26,897. Source: Budgets received and approved by USDA from the National Dairy Board.
AP
PE
ND
IX B
FIN
AN
CE
S

92
Appendix B–4National Fluid Milk Processor Promotion Board
Actual Income and Expenses (Thousands)
2006 2007 IncomeAssessments $107,850 $107,736 Late-Payment Charges 91 102 Interest 990 899 Other 1 71 Total Income 108,932 108,808 General Expenditures California Refund $10,308 $10,257 Administrative 2,140 2,875 USDA Oversight 508 425 USDA Assessment Verification 107 89 Total General Expenditures $13,063 $13,646 Program Expenditures Media $66,335 $72,122 Public Relations 11,566 12,662 Promotions 10,372 12,468 Strategic Thinking 1,303 1,157 Medical Advisory Panel 271 268 American Heart Association 120 - Medical Research 71 100 Research, Local Markets, and Program Measurement 1,991 2,228 Program Management - 120 Total Program Expenditures $92,029 $101,125 Excess of Revenue (Under) Over Expenditures $3,840 ($5,963) Fund Balance, Beginning of Year $24,427 $28,268
Fund Balance, End of Year $28,267 22,304 Source: Independent Auditor’s Report of the Fluid Milk Board and USDA Records
AP
PE
ND
IX B
FIN
AN
CE
S

93
Appendix B–5USDA Oversight Costs for the
National Fluid Milk Processor Promotion Board (Thousands)
2006 2007 USDA Oversight Costs Salaries and Benefits $340,185 $309,978 Travel 24,441 18,506 Miscellaneous1 49,737 54,813 Equipment 3,164 494 Printing 2,306 6,629 USDA Oversight Total $419,833 $390,420 Independent Evaluation $31,718 $16,995 Total2 $451,551 $407,415 1 Includes overhead, transportation, rent, communications, utilities, postage, contracts, supplies, photocopying, and Office of the General Counsel costs. 2 The totals for USDA expenses differ slightly from those shown in Appendix B–4 because of end-of-year estimates which are adjusted in the following year. Source: USDA accounting reports.
AP
PE
ND
IX B
FIN
AN
CE
S

94
Appendix B–6National Fluid Milk Processor Promotion Board
Approved Budgets (Thousands)
2008 RevenuesAssessments $107,800 Interest 340Total Income $108,140 Carryover from Previous Fiscal Year $4,646 Total Available Funds $112,786 ExpensesGeneral and Administrative $2,865 USDA Oversight 567 California Refund 10,210 Subtotal $13,642 Program Budget Advertising $67,500 Public Relations 15,619 Promotions 11,236 Strategic Thinking 1,115 Medical Advisory Panel 400 Research 2835 Medical Research 205 Program Management - Program Measurement 230 Subtotal $99,140 Unallocated 4 Total Budget Expenditures $112,786 1Independent Evaluation costs are included in Program Measurement Expenses. 2Processor Compliance is included in General and Administrative Expenses. Source: Budgets from the National Fluid Milk Board received and approved by USDA.
AP
PE
ND
IX B
FIN
AN
CE
S

95
Appendix B–7Aggregate Income and Expenditure Data Reported to USDA
by the Qualified Programs (Thousands)
2006 2007 IncomeCarryover from Previous Years $53,8101 $60,6721 Producer Remittances 181,262 189,043 Transfers from Other Qualified Programs2 55,818 51,676 Transfers to Other Qualified Programs 52,009 -51,501 Other Income 7,941 9,037 Total Adjusted Annual Income $246,822 $258,927 Expenditures General and Administrative $8,056 $8,435 Advertising and Sales Promotion 72,403 74,982 Unified Marketing Plan4 63,534 67,249 Dairy Foods and Nutrition Research 5,122 5,717 Public and Industry Communications 14,019 14,556 Nutrition Education 15,130 15,831 Market and Economic Research 2,641 1,394 Other5 1,538 2,126 Total Annual Expenditures $182,443 $190,290
Total Available for Future Year Programs $64,379 $68,637 1 Differences are due to audit adjustments and varying accounting periods. 2 Payments transferred between Qualified Programs differ due to different accounting methods and accounting periods. 3 Includes interest, income from processors and handlers, sales of supplies and materials, contributions, and rental income. 4 Unified Marketing Plan: Reported local spending by United Dairy Industry Association units participating in the DMI unified marketing plan to fund national implementation programs. 5 Includes capital expenses.
Source: Aggregate income and expenditure data reported by the Qualified Programs.
AP
PE
ND
IX B
FIN
AN
CE
S

96
Appendix B–8
Aggregate Advertising Expenditure Data Reported to USDA by the Qualified Programs
(Thousands) 2006 2007 Advertising Programs Fluid Milk $12,658 [17.5%] $13,763 [18.5%] Cheese 46,343 [64.0%] 48,008 [64.6%] Butter 2,717 [3.7%] 2,786 [3.8%] Frozen Dairy Products 411 [0.6%] 259 [0.3%] Other1 10,274 [14.2%] 9,554 [12.8%] Total $72,403 [100%] $74,370 {100%]
1 Includes “Real Seal,” holiday, multi-product, calcium, evaporated milk, foodservice, product donation at State fairs, and other events and contributions for displays or promotional events. Source: Aggregate income and expenditure data reported by the Qualified Programs.
AP
PE
ND
IX B
FIN
AN
CE
S

AP
PE
ND
IX C
AU
DIT
S

AP
PE
ND
IX C
AU
DIT
S

AP
PE
ND
IX C
AU
DIT
S

AP
PE
ND
IX C
AU
DIT
S

AP
PE
ND
IX C
AU
DIT
S

AP
PE
ND
IX C
AU
DIT
S

AP
PE
ND
IX C
AU
DIT
S

AP
PE
ND
IX C
AU
DIT
S

AP
PE
ND
IX C
AU
DIT
S

AP
PE
ND
IX C
AU
DIT
S

AP
PE
ND
IX C
AU
DIT
S

AP
PE
ND
IX C
AU
DIT
S

AP
PE
ND
IX C
AU
DIT
S

AP
PE
ND
IX C
AU
DIT
S

AP
PE
ND
IX C
AU
DIT
S

AP
PE
ND
IX C
AU
DIT
S

AP
PE
ND
IX C
AU
DIT
S
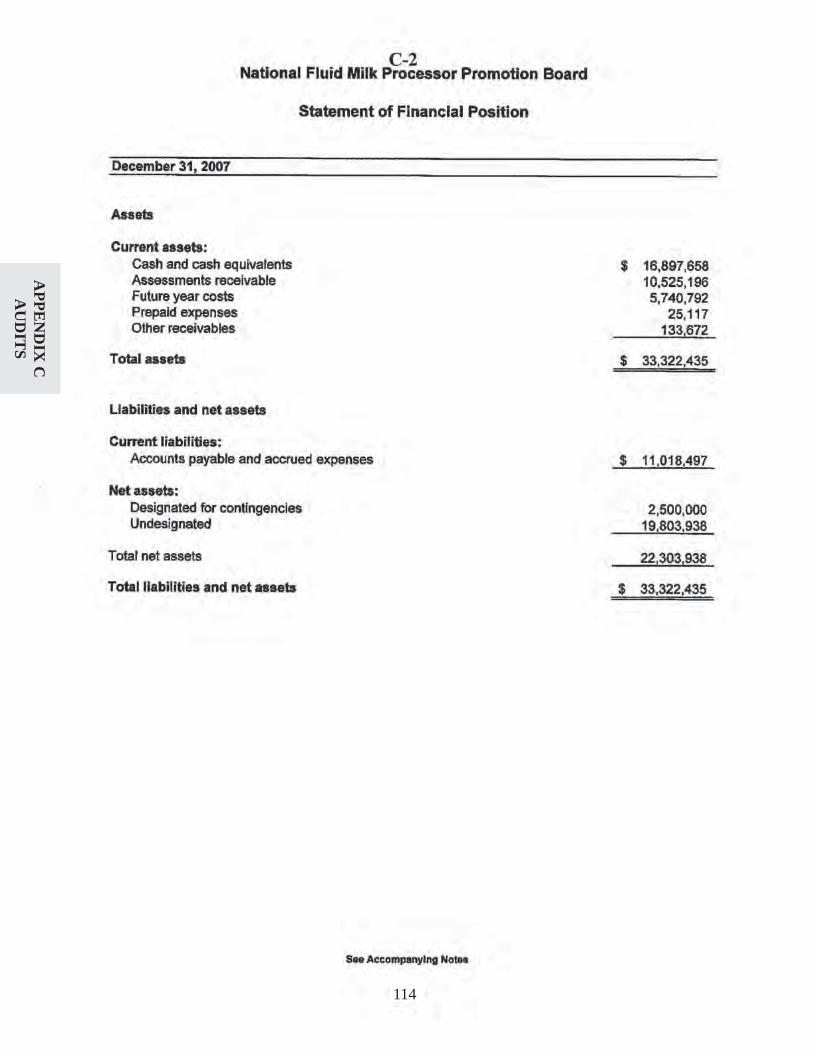
114
AP
PE
ND
IX C
AU
DIT
S
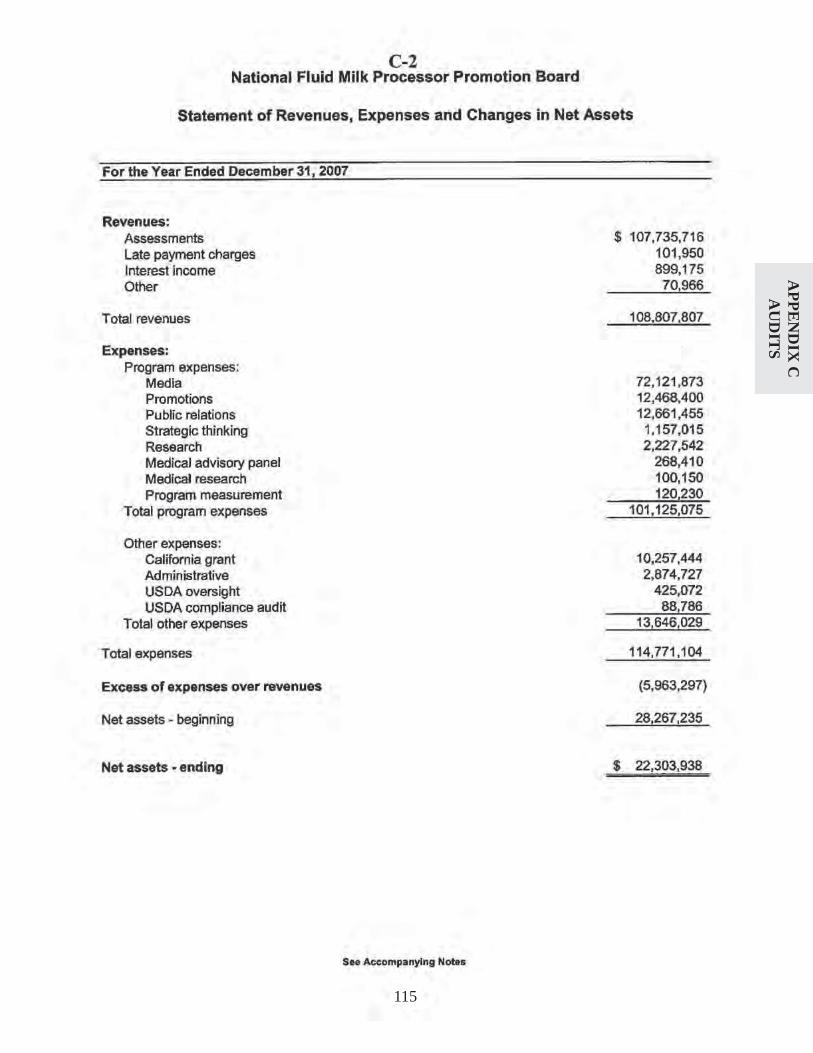
115
AP
PE
ND
IX C
AU
DIT
S
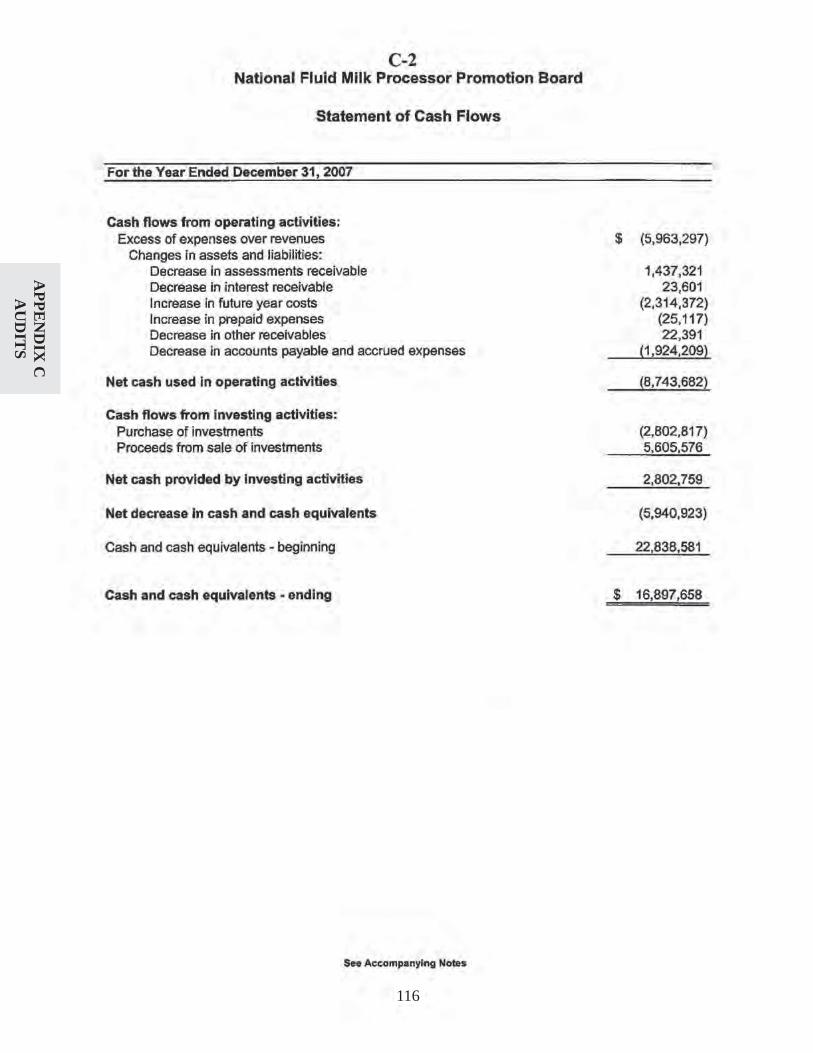
116
AP
PE
ND
IX C
AU
DIT
S

117
AP
PE
ND
IX C
AU
DIT
S

118
AP
PE
ND
IX C
AU
DIT
S

119
AP
PE
ND
IX C
AU
DIT
S

120
AP
PE
ND
IX C
AU
DIT
S

121
AP
PE
ND
IX C
AU
DIT
S

122
AP
PE
ND
IX C
AU
DIT
S

AP
PE
ND
IX C
AU
DIT
S

AP
PE
ND
IX C
AU
DIT
S

125
AP
PE
ND
IX C
AU
DIT
S

AP
PE
ND
IX C
AU
DIT
S

127
AP
PE
ND
IX C
AU
DIT
S

128
AP
PE
ND
IX C
AU
DIT
S

AP
PE
ND
IX C
AU
DIT
S

AP
PE
ND
IX C
AU
DIT
S
AP
PE
ND
IX C
AU
DIT
S

AP
PE
ND
IX C
AU
DIT
S

AP
PE
ND
IX C
AU
DIT
S

AP
PE
ND
IX C
AU
DIT
S

AP
PE
ND
IX C
AU
DIT
S

AP
PE
ND
IX C
AU
DIT
S

AP
PE
ND
IX C
AU
DIT
S

138
[This page is intentionally blank.]
AP
PE
ND
IX C
AU
DIT
S

139
Appendix D-1 National Dairy Promotion and Research Board
and Dairy Management Inc.Contracts Reviewed by USDA
Advertising and Marketing ServicesAmerican Academy of Family Physicians–Sponsorship; 3-A-Day™ of Dairy ActivitiesAmerican Academy of Pediatrics–Sponsorship; 3-A-Day™ of Dairy Activities American Association of School Administrators–Journal Advertising American Association of School Business–Sponsorship Activities American Dairy Association/Dairy Council, Inc.–Professional Staff ServicesAmerican Dietetic Association–Sponsorship; 3-A-Day™ of Dairy Activities American School Food Service Association–School Foodservice Publications Broadcast Traffic and Residuals, Inc.–Fluid Milk and Cheese Broadcast Materials and Talent Activities DDB Chicago–Media Services Dairy Farmers, Inc.–Professional Services Demo Sales–Product Demo Program Domino’s Pizza–Cheese Promotion Activity Flair Communications Agency–Marketing and Program Management Services G2 Promotional Marketing–Retail ActivitiesGlobal Dairy Platform–Management Services Initiative Media Worldwide–Advertising Commissions Review Interior Systems–Ultimate School Restyle Mass Connections–Value-Added Milk Demonstrations Media Management Services–School Marketing Program Support Midwest Dairy Association–National Retail Account Services; UMP Implementation NFL Properties, L.L.C.–Promotional Activities; Logo Usage Rights National School Board Association–Marketing Partnership; Conference Exhibits; Journal Space Novak Birch–Marketing and Creative ServicesOlson Communications–School Foodservice Merchandising Materials; Mealtime Sampler Activities; Milk Vending Promotion Kits; School Cafeteria Promotion Activities; Foodservice Program Activities; School Promotion Activities; ADA Trade Booth
RTC–Dairy Aisle Reinvention School Foodservice and Nutrition–Nutrition Magazine Inserts Shook Kelley–Cheese Case Design Slack Barshinger and Partners–Integrated Marketing Communications Stagnito Communications–LISN Awards ProgramTeam Services, L.L.C.–NFL and Sports Marketing Services VNU, Inc.–Licensing Agreement WebMD–Newsletter and Quick Quiz Activities (Web-based) Willard Bishop–Category Management Consulting Wisconsin Milk Marketing Board–National Butter Program
Richter Bros., Inc.–www.Dairyfarming.org Strategy
AP
PE
ND
IX D
CO
NT
RA
CT
S

140
Appendix D-1, continued
Communications, Public Relations, and Nutrition EducationAction for Healthy Kids, Inc.–SponsorshipAudrey Welper–Media Consulting Blu Skye Sustainability–Dairy Industry Sustainability InitiativeChild Nutrition Foundation–School Foodservice Program Activities Christopher Klose–Editorial Consulting, Communications Cleveland Dovington Partners, Inc.–Information Technology Services and Consulting;
Dairy Farmers, Inc.–Communication Activities, UMP ImplementationDestination Imagination, Inc.–Destination Imagination Sponsorship; CNFI Research Edelman Public Relations Worldwide–Health Professional Public Relations; Dairy Spokesperson Network, Nutrition Communications Program; Dairy Image Media Relations; 3-A-Day Public Relations-Retail/Foodservice; Dairy Image Program FoodMinds L.L.C.–Health Professional Public Relations; Nutrition and Scientific Affairs Public Relations Food, Research, and Action Center–Food Breakfast Expansion The Fratelli Group–Dairy Image Protection Gagen MacDonald L.L.C.–Internal Communications Support Health and Nutrition Network–Media Training and Consulting Services IA Collaborative–Nutrient Rich Coalition-Systemic Brand Development I-Site Web Design–School Marketing Web Program Image Base Corporation–Video News Release Production; School Milk Video Project Integer Group–Dairy Producer Communications Program JDG Consulting–Dairy Issues Management John Folse & Co.–Cheese Friendly Ideation and Prototypes Kelley Czerwonka–Consulting Services LevCom–Communications Activity Media Management Services–Pyramid Café/Pyramid Explorations Newsletter National Cattleman’s Beef Association–Naturally Nutrient Rich Score Project National Dairy Shrine–Dairy Scholarship Program Novations Group, Inc.–Custom 360 Feedback Process Nutrition Impact L.L.C.–Nutrient Density IndexOsborn and Barr–Communications; Industry Relations Consulting ProjectResults Direct–DMI Website Activities Richter Brothers–www.dairyfarmingtoday.org Web site activities Valecor Services–Industry Relations and Market Intelligence Weber Shandwick, Inc.–Issues Monitoring and Response; Crisis Communications Program
Export and Ingredients 3 A Business Consulting–European Newsletter; Milk Protein Ingredient Study ABC Translation Services–Technical and Safety Evaluation AssessmentsAmerican-Mexican Marketing–Mexican Market Representation and Program Activities; Mexican Trade Show and Cheese Promotion Activities; Dairy Deserts Promotion
www.TeamDairy.com and www.3aday.org Web site activities
AP
PE
ND
IX D
CO
NT
RA
CT
S

141
Appendix D-1, continued
Export and Ingredients, continuedAnother Color, Inc.–USDEC Publications Development and Design Arab Marketing Finance, Inc.–Middle East Market Representation and Program Activities Brooke Scientific Consulting–USDEC Export Guide Burson-Marsteller–Dairy Ingredient Vulnerability Audit Captive Media–Whey Sampling and Panel Advertising Campaign Contacts International Consulting, Ltd.–South American Market Representation and Program Activities DH Business Consulting–Milk Permeate StudyData Development Worldwide–Evaluation Study David L. Stiefer–USDEC Consulting Services GVI Productions–Development and Production of Promotional Video Garrison Group, L.L.C.–Consulting, Editorial, and Promotional Services Global Trade Information Services–Purchase of World Trade AtlasGrassland Media–Production of Deli Training Video IFP–Supplement Packet Product; Whey Protein Formulations International Dairy Foods Association–Export Manual Updates International School of Baking–Dairy Ingredient Application in Bakery Products International Trade Services–International Manuals Updates IntNet–Korean Market Representation and Program Activities iRIS Consulting–Mexican Dairy Market Assessment; Middle East Ingredient Study JDG Consulting–USDEC Domestic Communications Plan Knechtel, Inc.–Design and Develop Dairy Protein Based Products Landell Mills–Global Dairy Ingredients Market Study; Brazilian Market Research; Milk Minerals Research; Chinese Dairy Ingredient Market Study; East African Dairy and Soy Markets Research LBC Consulting–Canadian Marketing Research Levitt Communication–International Consulting Services Market Makers–High Value Whey Product Development; Japanese Market Representative and Program Activities Mistral Group, Ltd.–European Market Representation and Program Activities National Milk Producers Federation–Global and Domestic Research Activities; Trade Barriers Novak Birch–USDEC Website Redesign PR Consultants–Chinese Market Representation and Program Activities Pacrim Associates–Southeast Asian Market Representation and Program Activities Patricia R. Fuchs & Associates–USDEC Print Project Management Promar International–Consulting Services RB International–Consulting Services
Schonrock Consulting–Export Guide AnalysisStanton, Emms, and Sia–Asian Market Study-Consumer Packaged Dry Formulas Story Consulting–Consulting ServicesStrategic Pathfinders–Evaluation of Japanese Marketing Programs
Results Direct–USDEC Web site Activities www.usdec.org
AP
PE
ND
IX D
CO
NT
RA
CT
S

142
Appendix D-1, continued
Export and Ingredients, continuedTCE Consulting Group–Food and Nutrition Conference ActivitiesUniflex Marketing–Japanese Market Representation and Program Activities; Japanese Dry Ingredients Program World Perspectives–Evaluation of Southeast Asia Export Program Zenith International–Middle East Cheese Market Research; Caribbean Cheese Study
Market and Economic Research, Consulting Services AC Nielson–Information Data Purchase Academic Network–Food Guide Pyramid Strategic Counseling ARS Group–Print Advertising Evaluation Baker Communications–Selling Skills Workshop Beverage Marketing Corporation of New York–Evaluation of the Effectiveness of Generic Milk Programs; Contract Packer Directory Borden Dairy–Milk in Single-Serve Plastic Containers for Schools Burelle’s–Media Monitoring and Analysis CFE Solutions, Inc.–Consulting Services C & R Research–Educational Materials Research Evaluation Convert Marketing–Away From Home Yogurt Consumption TestsCreamland Dairies–Milk in Single-Serve Plastic Containers for SchoolsCustom Research, Inc.–Cheese and 3-A-Day™ Advertising Campaign Impact Assessment; Health Professional Dairy Nutrition Tracking StudyDatacore Marketing–Database Management and Consulting Data Development WorldWide–Marketing Publication Evaluation Decision Insights–Pizza Concept Screener Demeter Communication–Large Herd Producer PanelDoyle Research Associates–Web Site Usability Qualitative Research; Business to Business Qualitative Research; Chocolate/White Milk Qualitative Research Ellen Tuchler–Strategic Counseling Environ–Flavored Milk Research; Nutrition Research Farmland Dairies, L.L.C.– Milk in Single-Serve Plastic Containers for Schools Focus Management Services–U.S. Milk Industry School Audit Fresh Look Marketing Group–Deli Cheese Tracking DataGFK Custom Research–3-A-Day™ Tracking Study; Health Professional Tracking Study; Kids Milk Tracking Green House Communications–Foodservice Program ActivitiesHarris Interactive, Inc.–New York City Milk Taste TestInformation Resources, Inc.–Milk and Cheese Category Volume Reports Kiddie-i-OH–Lactose Intolerance Study KRC Research–3-A-Day™ Tracking Survey Lori Stanwood–Strategic Counsel MSW–Qualitative Research
AP
PE
ND
IX D
CO
NT
RA
CT
S

143
Appendix D-1, continued
Market and Economic Research, Consulting Services continuedMarketecture–Attitudes and Usage Trends Study Analysis; Tracking Activities of Public Opinion Toward Dairy Products and the Dairy Industry (Issues Tracker); Whey Protein Study Marketing Concepts–Product Innovation and Research Program; Real Seal Administration Maskowitz-Jacobs–Hispanic Research; Chocolate Milk Sensory Research Meyers Research Center–Hispanic Cheese Market Research; Dairy Aisle Reinvention Mintel International Group–New Products Database and Market Intelligence ReportsModel People–Milk and Cereal Breakfast Research National Milk Producers Federation–Domestic Research Program Activities/Animal Health and Welfare Issues Activities; Air Emissions Monitoring Study New American Dimensions–Hispanic Market ResearchNFO Research–INFOfast Subscription; Dairy Restrictors Research; Purchase and Analysis of Marketing Data; Milk Segmentation (Value-Added) NPD Group–Snack Tracker; Cheese Consumption Tracking Activity; CREST Foodservice Data; Eating Patterns Data Report; Food Safety and Dieting Monitor Report; Eating Trends and Beverage Study; Breakfast in America Report; Food World Subscription; Hispanic Market Database; Shopper Insight Analysis Palma Companies–Qualitative ResearchPHD Technologies–Meat Applications and Consulting; Trade Mission Activities Prevail!–Hispanic Consumer ResearchPromar International–School Milk Analysis and Consultation Promata-Leemiss Services–Online Advertising Activity Data Pursuant, Inc.–Milk-Producing Livestock Cloning/Dairy Consumption Research; Dairy Production Practices Attitude Research; Dairy Web Site Focus Groups Results Direct–Database Development; Multi-Lingual Activity SupportShainwright Consulting–Consulting and Research Services Smith Dairy Products Company–Milk in Single-Serve Plastic Containers for SchoolsSouthern Foods Group, L.P.–Milk in Single-Serve Plastic Containers for SchoolsSpectra Marketing Systems–Marketing Research Activities Summit Research, Inc.–Whey Protein Research Sunderg-Fear–Cereal and Milk On-the-Go Project Synovate–Milk Packaging Messages; Health Focused Beverage Research; Meal Replacement ResearchSynetics–Lactose Intolerance Research Talent Partners–Broadcast Traffic Services Technomic–Foodservice Trend Drivers Teri Gacek Associates–Qualitative Market Research Assignments; Focus Group Testing; Organic Milk Focus Groups; Naturally-Nutrient Rich Qualitative Research; Specialty Cheese Study TNS Custom Research–SIP Data, iNFOfast Subscription Trion Group LP–Value-Added Milk; Consulting ServicesTurover Straus Group–Strategic CounselUpshot Corporation–Sales Force Outreach and Data Delivery System
AP
PE
ND
IX D
CO
NT
RA
CT
S

144
Appendix D-1, continued
Market and Economic Research, Consulting Services continuedUpstate Farms Cooperative–School Milk Research Activities Video Monitoring Services–Broadcast MonitoringWatson Mulhern LLC–Consulting Services Werely Marketing–Non-Yogurt User Research Wirthlin Worldwide–Producer Communications Survey; Pyramid Education Program Research
AP
PE
ND
IX D
CO
NT
RA
CT
S

145
Appendix D-2 National Fluid Milk Processor Promotion Board
Contracts Reviewed by USDA
Medical Advisory BoardSteve Abrams, M.D.-Baylor College of Medicine–Medical Advisory Board Member ServicesSusan Barr, Ph.D.–Medical Advisory Board Member ServicesChristine Economos, Ph. D.–Medical Advisory Board Member Services Frank R. Greer, M.D.–Medical Advisory Board Member ServicesRobert P. Heaney, M.D.-Creighton University–Medical Advisory Board Member Services James O. Hill, Ph.D. –Medical Advisory Board Member ServicesRachel Johnson, Ph.D., R.D.–Medical Advisory Board Member Services Ronald M. Krauss, M.D.–Medical Advisory Board Member Services
Advertising, Promotion, and Public RelationsAmerican Heart Association–Licensing Agreement CMGRP, Inc., d.b.a. Weber Shandwick–Public Relations Services and Website Activities Draft, Inc.–Promotional Services Fastspot–Website Service and Support Lowe Worldwide–Advertising Services Outloud, L.L.C.–Marketing Communications Plan Publicidad Siboney–Hispanic Marketing Program
Market Research and Evaluation, and Consulting ServicesAutomatic Merchandiser–Market Analysis Beverage Marketing Corporation–Consulting/Competitive Strategy Development; Tracking Study Click IQ, Inc. –Online SurveyC&R Research Services–Market Research Data Development Corporation–Market ResearchEnergy Infuser–Focus GroupsEnviron International Corporation–Research AnalysisFoley and Lardner, L.L.P. –Processor Survey Foresee Results–Consulting Services Greenfield Consulting–Consulting Services Harris Interactive–Market Research Information Resources, Inc.–Market Analysis International Dairy Foods Association–Professional Management Services Kelly Fisher–Consulting Services MarketMaker Interactive–Website Analysis Marketing Management Analytics–Marketing Mix Analysis Mc3staffing–Consulting Services Outloud–Marketing Communications/Strategic Planning
AP
PE
ND
IX D
CO
NT
RA
CT
S

146
Appendix D-2, continued
Phoenix Marketing–Hispanic Market Research P.O.V. Marketing–Consulting ServicesPrime Consulting Group–Consulting Services, Survey Analyses; Conducting Training Workshops; and Strategic Planning RealMediaValue Company–Media Evaluation Services Technomic, Inc.–Market Study and Analysis
Other AgreementsHay Group–Organizational Structure Assessment Inland Printing–Customer Service ActivitiesSnyder, Cohn, Collyer, Hamilton & Associates, P.C.–Audit Services
AP
PE
ND
IX D
CO
NT
RA
CT
S
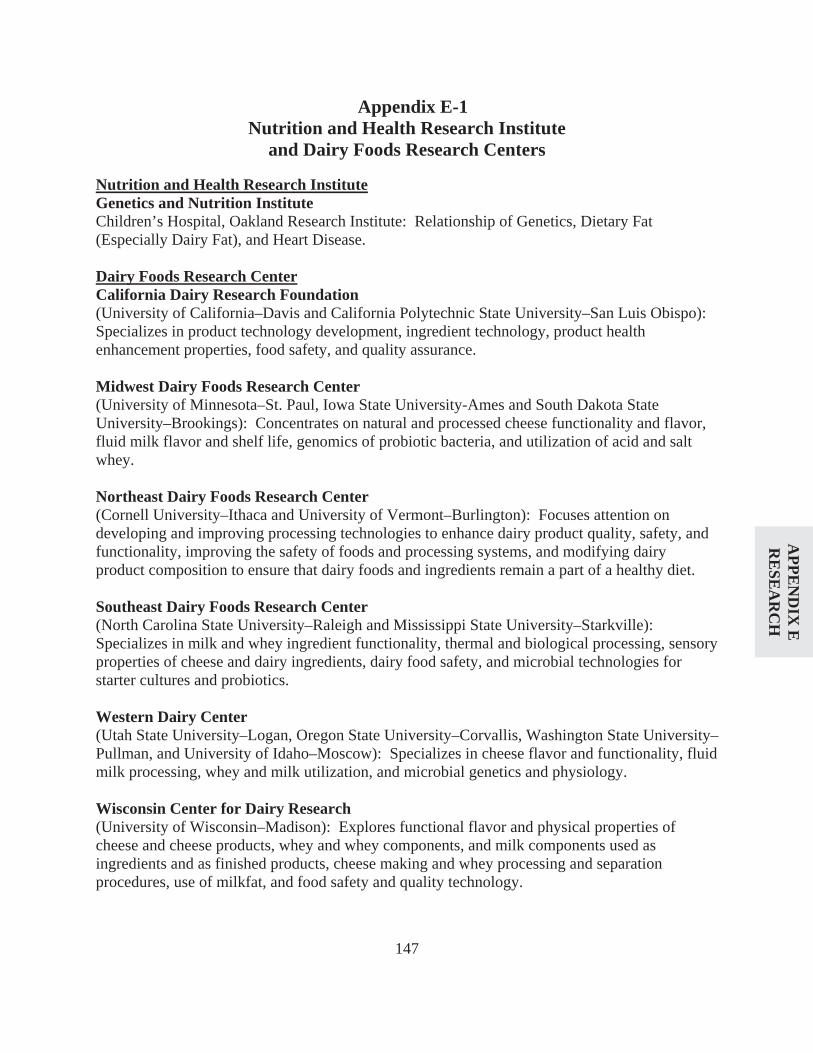
147
Appendix E-1 Nutrition and Health Research Institute
and Dairy Foods Research Centers
Nutrition and Health Research InstituteGenetics and Nutrition InstituteChildren’s Hospital, Oakland Research Institute: Relationship of Genetics, Dietary Fat (Especially Dairy Fat), and Heart Disease.
Dairy Foods Research CenterCalifornia Dairy Research Foundation (University of California–Davis and California Polytechnic State University–San Luis Obispo): Specializes in product technology development, ingredient technology, product health enhancement properties, food safety, and quality assurance.
Midwest Dairy Foods Research Center(University of Minnesota–St. Paul, Iowa State University-Ames and South Dakota State University–Brookings): Concentrates on natural and processed cheese functionality and flavor, fluid milk flavor and shelf life, genomics of probiotic bacteria, and utilization of acid and salt whey.
Northeast Dairy Foods Research Center (Cornell University–Ithaca and University of Vermont–Burlington): Focuses attention on developing and improving processing technologies to enhance dairy product quality, safety, and functionality, improving the safety of foods and processing systems, and modifying dairy product composition to ensure that dairy foods and ingredients remain a part of a healthy diet.
Southeast Dairy Foods Research Center (North Carolina State University–Raleigh and Mississippi State University–Starkville): Specializes in milk and whey ingredient functionality, thermal and biological processing, sensory properties of cheese and dairy ingredients, dairy food safety, and microbial technologies for starter cultures and probiotics.
Western Dairy Center (Utah State University–Logan, Oregon State University–Corvallis, Washington State University–Pullman, and University of Idaho–Moscow): Specializes in cheese flavor and functionality, fluid milk processing, whey and milk utilization, and microbial genetics and physiology.
Wisconsin Center for Dairy Research (University of Wisconsin–Madison): Explores functional flavor and physical properties of cheese and cheese products, whey and whey components, and milk components used as ingredients and as finished products, cheese making and whey processing and separation procedures, use of milkfat, and food safety and quality technology.
AP
PE
ND
IX E
RE
SEA
RC
H

148
Appendix E-2 Dairy Foods Competitive Research Activities
Principal Investigator, Institution, and Project TitleNIZO Food Research (Private Company): Solubility of Milk Protein Concentrate [continued in 2007]
Devin Peterson, Ph.D. (Pennsylvania State University): Inhibition of Off-Flavor Development in Non-Refrigerated Milk by Phenolic Chemistry [began in 2007]
Hua Wang, Ph.D. (Ohio State University Research Foundation): Methods to Maintain Dairy Culture Genotypes [began in 2007]
Shan-Tian Yang, Ph.D. (Ohio State University Research Foundation): Production of Galacto-Oligosaccharides from Whey Lactose [continued in 2007]
AP
PE
ND
IX E
RE
SEA
RC
H

149
Appendix E-3 Nutrition Competitive Research Activities
Principal Investigator, Institution, and Project TitleSean Adams, Ph.D. (USDA-Agricultural Research Service-Western Human Nutrition Research Center): Evaluation of the Anti-Inflammatory Effects of Calcium and Dairy in a Polygenic Obese Mouse Model [began in 2007]
David J. Baer, Ph.D. (USDA-Agricultural Research Service): Effects of Trans-Fatty Acids from Ruminant Sources on Risk Factor for Cardiovascular Disease [continued in 2007]; Effect of When Protein on Blood Pressure [began in 2007]
Leann L. Birch, Ph.D. (Pennsylvania State University): Parental Influence on Girls’ Calcium Intake and Bone Mineral Content and Weight Status–Phase III [continued in 2007]
Robert Brannan, Ph.D. (Ohio University): Whey Protein Inhibition of Oil Absorption in Fried Foods [began in 2007]
Joseph Donnelly, Ph.D. (University of Kansas Center for Research, Inc.): The Effects of Dairy Intake on Weight Maintenance and Metabolic Profile [completed in 2007]
Ellen M. Evan, Ph.D. (University of Illinois): Higher Protein Diet and Exercise for Optimal Weight Loss in Elderly Women [began in 2007]
Michael Holick, Ph.D., M.D. (Boston University School of Medicine): The Effect of Dietary Calcium and Vitamin D on Prostate Cancer [continued in 2007]
Michael Huncharek, Ph.D. (Meta-Analysis Research Group and Marshfield Clinic): Impact of Dairy Foods and Dairy Associated Nutrients on the Risk of Colorectal Cancer [completed in 2007]; and Impact of Dairy Foods and Dairy-Associated Nutrients on the Risk of Prostate Cancer [completed in 2007]
Elsa M. Janle, Ph.D. (Purdue University): Potential of Dietary Whey Protein to Ameliorate the Development of Diabetes in the Zucker Diabetic Rat [continued in 2007]
Marlena C. Kruger, Ph.D. (Massey University): Investigation of Physiological Responses to Consumption of Whey or Soy Protein in the Obese Rat [completed in 2007]
Donald K. Layman, Ph.D. (University of Illinois): Meal Responses to Whey Proteins Enhance Adult Health [continued in 2007]
Joan M. Lappe, Ph.D. (Creighton University): Pilot Project Preparatory to a Definitive Study of the Efficacy of Milk Minerals in Human Bone Health [continued in 2007]
AP
PE
ND
IX E
RE
SEA
RC
H

150
Appendix E-3, continued
Roy Martin, Ph.D., Jun Zhou (Pennington biomedical Research Center): Mechanisms of Reduced Appetite with Whey Protein [began in 2007]
Lynn L. Moore, Ph.D. (Boston University School of Medicine): The Effect of Dietary Calcium on Body Fat Levels in Children and Adults– Phase II [completed in 2007]; Dairy Intake: Its Determinants and Relation to a Healthy Diet [completed in 2007]; Dairy Intake and Metabolic Risk in Adolescent Girls [began in 2007]; Effects of Early Dairy Intake on Adolescent Bone Density and Content [completed in 2007]; and The Effects of Dairy Intake in Girls Over Ten Years Old [completed in 2007]
Mary Murphy, M.S., R.D. (ENVIRON): Nutrient and Energy Intakes of Children and Adolescents Consuming Flavored Milk in Schools [began and completed in 2007]; Nutrient Intakes by School Age Children and Adolescents [began and completed in 2007]
Theresa Nicklas, Ph.D. (Baylor College of Medicine): Dietary Calcium Intake and Dairy Product Consumption by Minority Mothers: Nutritional Impact and Health Outcomes [completed in 2007]
Troy Ott, Ph.D. (Pennsylvania State University): A Critical Evaluation of Sterols in Milk and Dairy Products [continued in 2007]
Stuart Phillips, Ph.D. (McMaster University): Impact of Whey, Casein, and Soy Supplementation on Human Muscle Protein Turnover after Resistance Training [completed in 2007]; and Responses of Muscle and Whole-Body Protein Turnover to Ingestion of Differing Doses of Whey and Soy Protein with and without Resistance Exercise in Elderly Men [began in 2007]
Karen Rafferty, M.S., R.D., Robert Heaney, M.D. (Creighton University): A Project to Advance a Research Data Infrastructure by Creating a Master Data Bank [began in 2007]
Nancy Rodriguez, Ph.D. (University of Connecticut): Milk’s Impact on Protein Turnover-Specific Intracellular Signaling Protein in Human Skeletal Muscle During Recovery from Endurance Exercise [began in 2007]
Dale Schoeller, Ph.D. (University of Wisconsin-Madison): A Novel Stable Isotope Measurement to Monitor Macronutrient Intake for Future Use in the Study of Interactions of Diet and Dairy on BMI and Bone Health [continued in 2007]
Debra Sullivan, Ph.D. (University of Kansas Medical Center): A Qualitative Study of Children’s Perceptions of Dairy Foods [began in 2007]
Angelo Tremblay, Ph.D. (Hopital Laval): Effect of Milk Supplementation on Appetite Control in Obese Women Following a Weight Loss Program [began in 2007]
AP
PE
ND
IX E
RE
SEA
RC
H

151
Appendix E-3, continued
Frances Tylavsky, Ph.D. (University of Tennessee): Role of Dairy Products in Decreasing Insulin Resistance and Modulating the Release of Glucagon-Like Peptide-1 in Obese African American Adolescents [began in 2007]
Marta VanLoan, Ph.D. (USDA-Agricultural Research Service-Western Human Nutrition Research Center): The Role of Dairy Foods in Enhancing Central Fat Loss and Weight Loss with Moderate Energy Restriction in Overweight and Obese Adults [continued in 2007];
Jeff Volek, Ph.D. (University of Connecticut): Investigation of Whey Protein Supplementation for Physiological Enhancement to Resistance Training and Dietary Regimes in Young Adults [began in 2007]
Richard A. Washburn, Ph.D. (University of Kansas Center for Research): Whey Protein Supplementation with Resistance Training: Effect on Body Composition of Young Adults [began in 2007]
Connie Weaver, Ph.D. (Purdue University): Influence of Dairy on Bone Mass Accrual, Bone Size and Fat and Lean Body Mass in Early Pubertal Overweight vs Healthy Weight Girls [began in 2007]; and Calcium, Dairy, and Body Fat in Adolescents [continued in 2007]
Michael B. Zemel, Ph.D. (University of Tennessee Research Foundation): Dairy Attenuation of Oxidative and Inflammatory Stress in Metabolic Syndrome [began in 2007]; Dietary Calcium and Dairy Modulation of Oxidative and Inflammatory Stress in Mice [completed in 2007]; and Dairy Modulation of Oxidative and Inflammatory Stress in Overweight and Obese Subject [continued in 2007]
AP
PE
ND
IX E
RE
SEA
RC
H

152
[This page is intentionally blank.]
AP
PE
ND
IX E
RE
SEA
RC
H

153
Appendix F Qualified State or Regional Dairy Product Promotion,
Research, or Nutrition Education Programs
Allied Milk Producers’ Cooperative495 Blough Road Hooversville, PA 15936–8207
American Dairy Association and DairyCouncil Mid East5950 Sharon Woods Blvd. Columbus, OH 43229
American Dairy Association and Dairy Council, Inc. 219 South West Street, Suite 100 Syracuse, NY 13202
American Dairy Association of Alabama 5340 West Fayetteville Road Atlanta, GA 30349–5416
American Dairy Association of Georgia5340 West Fayetteville Road Atlanta, GA 30349–5416
American Dairy Association of Kentucky 5340 West Fayetteville Road Atlanta, GA 30349–5416
American Dairy Association of Michigan 2163 Jolly Road Okemos, MI 48864
American Dairy Association of Mississippi 5340 West Fayetteville Road Atlanta, GA 30349–5416
American Dairy Association of Nebraska 8205 F Street Omaha, NE 68127–1779
American Dairy Association of North Carolina 5340 West Fayetteville Road Atlanta, GA 30349–5416
American Dairy Association of South Carolina 5340 West Fayetteville Road Atlanta, GA 30349–5416
American Dairy Association of South Dakota 2015 Rice Street St. Paul, MN 55113
American Dairy Association of Virginia 5340 West Fayetteville Road Atlanta, GA 30349–5416
California Manufacturing Milk Producers Advisory Board 3800 Cornucopia Way, Suite D Modesto, CA 95358–9492
California Milk Producers Advisory Board 3800 Cornucopia Way, Suite D Modesto, CA 95358–9492
Dairy Council of California 1101 National Drive, Suite B Sacramento, CA 95834–1945
Dairy Council of Michigan 2163 Jolly Road Okemos, MI 48864
AP
PE
ND
IX F
QP
’S

154
Appendix F, continued
Dairy Council of Nebraska8205 F Street Omaha, NE 68127–1779
Dairy Farmers, Inc. 166 Lookout Place, Suite 100 Maitland, FL 32751–4496
DairyMAX2214 Paddock Way Drive, Suite 600 Grand Prairie, TX 75050
Dairy Promotion, Inc. 10220 NW Ambassador Drive Kansas City, MO 64153
Georgia Agricultural Commodity Commission for Milk19 Martin Luther King Jr., Dr., SW, Room 328 Atlanta, GA 30334
Granite State Dairy Promotion c/o New Hampshire Department of Agriculture 25 Capitol Street, Box 2042 Concord, NH 03302–2042
Idaho Dairy Products Commission 10221 West Emerald, Suite 180 Boise, ID 83704
Illinois Milk Promotion Board 1701 Towanda Avenue Bloomington, IL 61701
Indiana Dairy Industry Development Board 9360 Castlegate Drive Indianapolis, IN 46256
Louisiana Dairy Industry Promotion Board c/o Louisiana Department of Agriculture and Forestry P.O. Box 3334 Baton Rouge, LA 70821–3334
Maine Dairy and Nutrition Council 333 Cony Road Augusta, ME 04330
Maine Dairy Promotion Board 333 Cony Road Augusta, ME 04330
Michigan Dairy Market Program P.O. Box 8002 Novi, MI 48376–8002
Mid–Atlantic Dairy Association 325 Chestnut Street, Suite 600 Philadelphia, PA 19106
Midwest Dairy Association 2015 Rice Street St. Paul, MN 55113
Midwest Dairy Council 2015 Rice Street St. Paul, MN 55113
Milk for Health on the Niagara Frontier, Inc. 4185 Seneca Street West Seneca, NY 14224
Milk Promotion Services of Indiana, Inc. 9360 Castlegate Drive Indianapolis, IN 46256
AP
PE
ND
IX F
QP
’ S

155
Appendix F, continued
Minnesota Dairy Research and Promotion Council2015 Rice Street St. Paul, MN 55113
Nebraska Dairy Industry Development Board 8205 F Street Omaha, NE 68127–1779
Nevada Farm Bureau Dairy Producers Committee
2165 Green Vista Drive, Suite 205 Sparks, NV 89431
New England Dairy and Food Council, Inc. 1034 Commonwealth Avenue Boston, MA 02215
New England Dairy Promotion Board 1034 Commonwealth Avenue Boston, MA 02215
New Jersey Dairy Industry Advisory Council c/o New Jersey Dept. of AgriculturePO Box 330 Trenton, NJ 08625–0330
New York State Dept. of Agriculture and Markets Division of Milk Control and Dairy Services 10 B Airline Drive Albany, NY 12235–0001
North Dakota Dairy Promotion Commission2015 Rice Street St. Paul, MN 55113
Oregon Dairy Products Commission 10505 Southwest Barbur Boulevard Portland, OR 97219
Pennsylvania Dairy Promotion Program c/o Pennsylvania Department of Agriculture 2301 North Cameron Street Harrisburg, PA 17110–9408
Promotion Services, Inc. 5340 West Fayetteville Road Atlanta, GA 30349–5416
Rochester Health Foundation, Inc. c/o ADADC, Inc.219 South West Street, Suite 100 Syracuse, NY 13202
St. Louis District Dairy Council 1254 Hanley Industrial Court St. Louis, MO 63144–1912
Southeast United Dairy Industry Association 5340 West Fayetteville Road Atlanta, GA 30349-5416
Southwest Dairy Museum P.O. Box 936 Sulphur Springs, TX 75483
Tennessee Dairy Promotion Committee 5340 West Fayetteville Road Atlanta, GA 30349–5416
United Dairymen of Arizona 2008 S. Hardy Drive Tempe, AZ 85282
Utah Dairy Commission 1213 East 2100 South Salt Lake City, UT 84106
Vermont Dairy Promotion Council 116 State Street, Drawer 20 Montpelier, VT 05620–2901
AP
PE
ND
IX F
QP
’S

156
Appendix F, continued
Washington State Dairy Council 4201 198th Street, SW, Suite 102 Lynnwood, WA 98036–6751
Washington State Dairy Products Commission
4201 198th Street, SW, Suite 101 Lynnwood, WA 98036
Western Dairyfarmers’ Promotion Association12000 North Washington Street, Suite 200 Thornton, CO 80241
Wisconsin Milk Marketing Board, Inc. 8418 Excelsior Drive Madison, WI 53717
AP
PE
ND
IX F
QP
’ S

157
Appendix G National Fluid Milk Processor Promotion Board
Active, Weight Loss, and Healthy Weight Messages Target Audience: Moms/Women Source: MilkPEP/Lowe Worldwide
Mariska Hargitay Dancing with the Stars Semi Finalists
Laila Ali
Dancing with the Stars Tour
Sara Ramirez Dancing with the Stars
Winners
Kathy Smith Bill Germanakos
Jillian Michaels, Bob Harper, and Kim Lyons
AP
PE
ND
IX G
IMA
GE
S

158
Appendix G, continued
Active, Bone Growth, and Healthy Weight Messages Target Audience: Teen Girls and Teen Boys Source: MilkPEP/Lowe Worldwide
High School Musical Masi Oka Rex Grossman and Marvin Harrison
Vince Carter Marvin Harrison Steve Nash
Avery Johnson andJosh Howard
Hayden Panettiere Fantastic Four
AP
PE
ND
IX G
IMA
GE
S

159
Appendix G, continued
Active, Bone Growth, and Healthy Weight Messages Target Audience: Teen Girls and Teen Boys Source: MilkPEP/Lowe Worldwide
Amanda Bynes Alex Rodriguez Teddy Geiger and Rebecca Eden
Beyoncé and Solange Knowles
Sasha Cohen
AP
PE
ND
IX G
IMA
GE
S

160
Appendix G, continued
School Milk PostersSource: MilkPEP/Lowe Worldwide
Elementary Schools:
Amanda Bynes High School Musical
Shrek Steve Nash
Middle and High Schools:
Fantastic Four Masi Oka
Laila Ali Vince Carter
AP
PE
ND
IX G
IMA
GE
S

161
Appendix G, continued
Middle and High Schools:
Amanda Bynes Hayden Panettiere
Female Olympic Athletes Male Olympic Athletes
Steve Nash High School Musical
AP
PE
ND
IX G
IMA
GE
S

162
Appendix G, continued
School Materials Source: MilkPEP/DRAFTFCB
Posters:
Alien Girl Rocker Soccer Girl Pro Wrestler
Milk The Rewards – Girl Milk The Rewards – Boy
Clings:
Alien Girl Robot Rocker Pro Wrestler
Grab a Milk Reward Your Body Bar Codes Reward Yourself
AP
PE
ND
IX G
IMA
GE
S

163
Appendix G, continued
BBMSM Web Banners Source: MilkPEP/Lowe Worldwide, Weber Shandwick, and DRAFTFCB
BBMSM – Steve Nash BBMSM - Amanda Bynes BBMSM – Fantastic Four
BBMSM – Heroes BBMSM – Vince Carter BBMSM – Marvin Harrison
BBMSM – Steve Nash BBMSM – Beyoncé and Solange Knowles
BBMSM – Hayden Panettiere
AP
PE
ND
IX G
IMA
GE
S

164
Appendix G, continued
Hispanic Materials Source: MilkPEP/Siboney, U.S.A.
Maria Celeste Barbara Mori Lili Estefan and Family
Barbara Mori Web Banner Recipe Booklet En Español Sara Ramirez En Español
Dr. Aliza Advertorial Lili Estefan And Family Sofia Vergara Mobile
Lili Estefan - Halloween Lili Estefan –Chocolate Milk Advertorial
AP
PE
ND
IX G
IMA
GE
S

165
Appendix G, continued
Hispanic Materials Source: MilkPEP/Siboney, U.S.A.
Another Reason Another Season En Español
Another Reason Another Season En Español
Halloween POS En Español
Lili Estefan – Halloween Advertorials
Maria Celeste and Family Web Banner
Mom Summit Tips and Booklet Meredith Advertorial
AP
PE
ND
IX G
IMA
GE
S

166
Appendix G, continued
Public Relations MaterialsSource: MilkPEP/Weber Shandwick
MMM Tour Information Kit
Body By MilkSM Logo
MilkPEP Web Banner
TAYD Handout 2007 SAMMY Logo
2007 SAMMY Winners
TAYD Family Challenge Healthiest Student Bodies
TAYD Homepage
TAYD Logo
Chocolate Milk Recovery Beverage
TAYD Table Top Sign
AP
PE
ND
IX G
IMA
GE
S

167
Appendix G, continued
Promotions MaterialsSource: MilkPEP/DRAFTFCB
Give Your Family Something Smarter (GYFSS) Cling GYFSS Wobbler
GYFSS Cling
GYFSS Wobbler
GYFSS Channel Strip 1
GYFSS Wobbler
GYFSS Cling
GYFSS Channel Strip 2
GYFSS Hispanic Wobblers
GYFSS Monster Cling
GYFSS Cling En Español
AP
PE
ND
IX G
IMA
GE
S

168
Appendix G, continued
Retail Promotions Materials Source: MilkPEP/DRAFTFCB
Another Reason / Season POS Another Reason / Season POS
Another Reason / Season POS Another Reason / Season POS
Another Reason / Season POS Another Reason / Season POS
Another Reason / Season POS Curves In-Club Poster Curves Web Banner
Web Banner Web Banner Web Banner Web Banner
AP
PE
ND
IX G
IMA
GE
S

169
Appendix G, continued
Promotions MaterialsSource: MilkPEP/DRAFTFCB
Official Drink of Halloween Horizontal Cling
Official Drink of Halloween Chocolate Milk Banner
Official Drink of Halloween Gallon Channel Strip
Official Drink of Halloween Vertical Cling
Official Drink of Halloween Frankenstein and Dracula Clings
Official Drink of Halloween Hispanic Vertical Cling
Official Drink of Halloween Hispanic Channel Strip
AP
PE
ND
IX G
IMA
GE
S

170
Appendix G, continued
Sweepstakes Promotional Web Banners and Local Marketing POS Source: MilkPEP DRAFTFCB
Web Banner
Web Banner
WebBanner
Web Banner Web Banner WebBanner
Local Marketing Cling
Vertical Cling
Wobbler Carton Art Local Marketing Cap Art
Gallon Art A
PP
EN
DIX
GIM
AG
ES

171
Appendix G, continued
Television Advertisements – Little Victories and Milk Vignette Source: MilkPEP/Lowe Worldwide
Little Victories:
Milk Icon Woman in Park
“My secret admirer?” “My husband.”
“40 is the new 20.” “I still love my little black dress.”
“Summer? Bring it on.” “My daughter steals my clothes.”
AP
PE
ND
IX G
IMA
GE
S

172
Appendix G, continued
“High school reunion? Can’t wait.” Woman drinking milk
Think about your drink got milk?
Milk Vignette:
Mariska Hargitay Mariska Hargitay
Mariska Hargitay Mariska Hargitay
AP
PE
ND
IX G
IMA
GE
S

173
Appendix G, continued
Hispanic Television Advertisements Source: MilkPEP/Siboney, U.S.A.
Flamenco Dancer Girl Flamenco Dancer Girl
Superhero Boy Superhero Boy
Milk Vignette:
Dr. Aliza Dr. Aliza
AP
PE
ND
IX G
IMA
GE
S

174A
pp
end
ix H
-1R
egio
ns
of t
he
Nat
ion
al D
airy
Pro
mot
ion
an
d R
esea
rch
Boa
rd
Reg
ion
1[1
]
Reg
ion
2[8
]
Reg
ion
3[4
]
Reg
ion
4[4
]
Reg
ion
5[2
]
Reg
ion
7[2
]
Reg
ion
6[5
]
Reg
ion
9[3
]
Reg
ion
11[2
]
Reg
ion
12[2
]
Reg
ion
8[1
]
Reg
ion
10[1
]
Reg
ion
13[1
]
No
te:
The
num
ber
in b
rack
ets
belo
w e
ach
regi
on
indi
cate
s th
e nu
mbe
r o
f m
embe
rs w
ithi
n th
at r
egio
n.
AP
PE
ND
IX H
MA
PS

175
App
endi
x H
-2
Reg
ions
of t
he N
atio
nal F
luid
Milk
Pro
cess
or P
rom
otio
n B
oard
Reg
ion
13
Reg
ion
14 Reg
ion
15R
egio
n 12
Reg
ion
7
Reg
ion
11
Reg
ion
10
Reg
ion
8
Reg
ion
2
Reg
ion
1
Reg
ion
3R
egio
n 6
Reg
ion
9R
egio
n 4
Reg
ion
5
AP
PE
ND
IX H
MA
PS