
Financial Management of Flood Risk€¦ · Financial Management of Flood Risk

National Flood Risk AssessmentMethodology

3
Contents
1. Introduction
1.1. National Flood Risk Assessment (NFRA)1.2. NFRA Principles1.3. Flood Risk Receptors and Indicators1.4. Flood Risk Receptor Weightings1.5. Hazard and Grid Data1.6. Probability1.7. Catchment approach
2. Human Health2.1. Human Health (A) – People2.2. Human Health (B) – Community
3. Economic Activity3.1. Economic Activity (A) – Businesses3.2. Economic Activity (B) – Transport3.3. Economic Activity (C) – Agriculture
4. The Environment
5. Cultural Heritage
6. Flood Defences
7. Climate Change
8. Future Developments
9. Historical Flood Events
10. Infrastructure
11. Uncertainties
12. Sub Catchment Unit Categorisation
Appendices
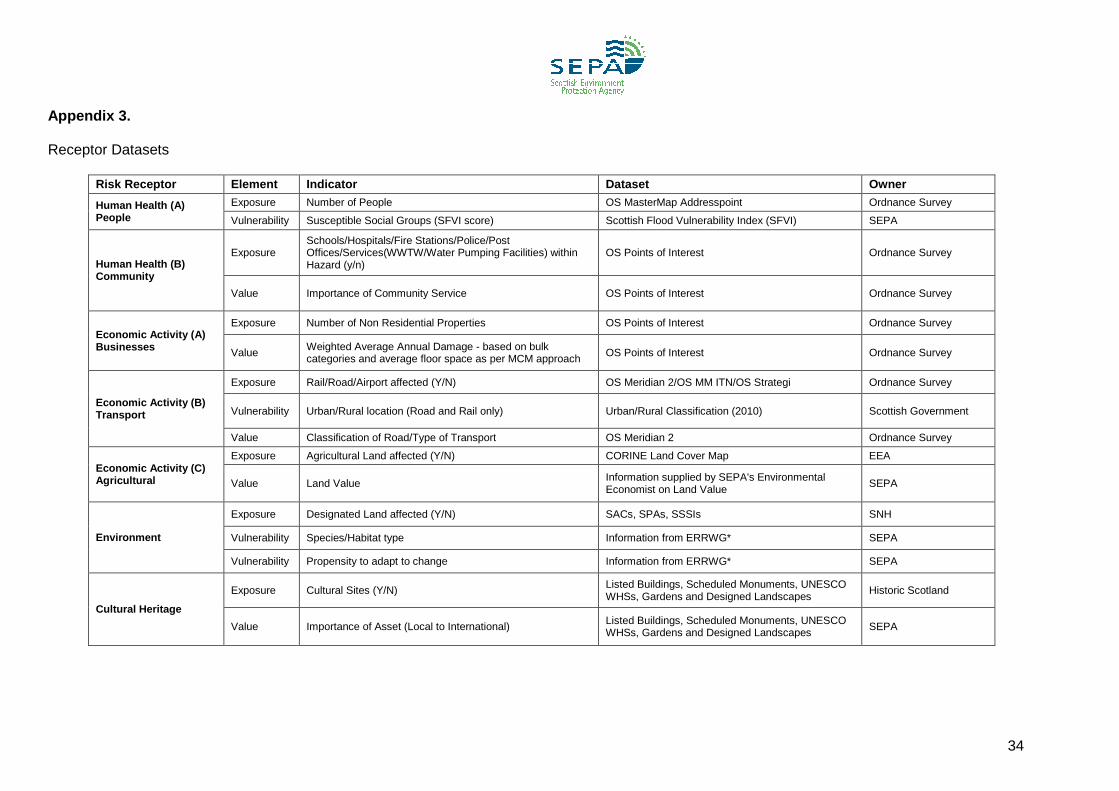
1. Human Health (B) Value Categories2. Estimated Land Values3. Receptor Datasets4. Catchment Unit Categorisation Process Diagram

4
1. Introduction
The Flood Risk Management (Scotland) Act 2009 (FRM Act) transposes EuropeanDirective 2007/60/EC (i.e. the Floods Directive) into Scots Law. It introduces aframework for the holistic and sustainable management of flood risk across Scotlandfrom all sources.
The FRM Act places duties on SEPA to prepare flood risk assessments for eachflood risk management district. SEPA’s approach has been to develop a nationalflood risk assessment (NFRA) to identify those areas most vulnerable to the impactsof flooding (Potentially Vulnerable Areas – PVAs), flood hazard and flood risk mapsfor these areas and national flood risk management plans outlining objectives andmeasures to reduce the overall flood risk.
This paper aims to provide a comprehensive summary of the methodologyundertaken in order to produce the NFRA for Scotland.
1.1. National Flood Risk Assessment (NFRA)
The first stage in the sustainable management of flood risk is the preparation of anational flood risk assessment (NFRA). This is a high level screening tool that SEPAis responsible for developing which assesses the relative adverse consequences offlooding across the country. It must be based on reliable, available and readilyderivable information and will inform the identification of those areas most vulnerableto the impacts of flooding (PVAs). The NFRA should also provide sufficientinformation to inform the early development of draft objectives and measures tomanage flood risk.
The Floods Directive and the FRM Act requires a consideration of all sources offlooding. The NFRA has been developed so that it can accommodate a range ofreturn periods from all sources of flooding when information becomes available. Byutilising the information currently available in this first cycle, the NFRA concentrateson flooding from rivers, the coast and heavy rainfall with a further consideration of theinfluence of groundwater.
A flood risk assessment is dependent upon the consideration of factors representingphysical, social, economic and environmental elements. The NFRA principles ofestimating flood risk follow definitions in the Floods Directive and FRM Act1 while thedefinition of individual components of flood risk are informed by studiescommissioned by the European Community2. Flood risk can be described by a rangeof factors to provide a more refined understanding of potential adverseconsequences. Box 1 (below) provides an indication of the elements comprising anassessment of flood risk:
Box 1
Flood Risk = f (likelihood, hazard, vulnerability, exposure, value)(FLOODsite reports (www.floodsite.net))
Vulnerability can be assessed as a factor of susceptibility (the propensity of areceptor to suffer harm from flooding) and resilience (the ability of a receptor torecover from damage incurred as a result of flooding).
1The FRM Act defines flood risk as “the combination of the probability of a flood and of the
potential adverse consequences, associated with a flood, for human health, the environment,cultural heritage and economic activity.”2
FLOODsite reports (www.floodsite.net)

5
1.2. NFRA Principles
The following principles have been developed to define the overall approach to thecreation of a national flood risk assessment.
Predictive approach – the NFRA will take a predictive, proactive approach toassessing flood risk by focusing on the identification of areas of significant floodrisk arising from information on where flooding is predicted to occur rather thanreacting to information on past floods.
Climate change – in assessing flood risk the NFRA will consider the sensitivity ofcatchments to climate change (this will develop existing UK studies on catchmentcharacterisation with a particular Scottish focus). The NFRA will therefore seek tocharacterise the sensitivity of Scottish catchments and coasts to climate changeand develop new information to improve the overall understanding of future floodrisk.
A verified approach - historic flood information will be collated in a nationalrepository and used to validate the output of the future flood assessment. This willprovide further information on areas previously affected by flooding and, wherereliable information indicates significant past flooding or clusters of flood events,SEPA will endeavour to take this into account when identifying PVAs.
Multiple flood sources – the NFRA will consider flood sources as mutuallyexclusive of each other. However, it will endeavour to identify and understand thelinks and interaction between multiple sources to enable a more detailed,focussed assessment of the interaction of multiple sources in the most at riskareas. Therefore, as further information becomes available through theproduction of detailed flood hazard and risk maps, the NFRA will be reviewed.
Flood defences and residual risk – the true performance of defences –including the protection they afford and the chance that they may be overtoppedor fail – will be built into the NFRA.
Catchment characteristics – the NFRA will seek to consider the impactscatchment hydrology and geomorphology will have in relation to flood risk. TheNFRA will also characterise natural features that may have a role managing floodrisk.
Reservoirs – the NFRA will take account of reservoirs and other impoundedwater sources in the assessment of risk – including the chance of failure andresulting consequences. This will be done in line with current SEPA securityrequirements as reliable and consistent information becomes available.Consideration of risk from Reservoirs will not be included in this first NFRA cycle.
Links to other planning systems – the information produced by the NFRA willprovide a link to existing and new planning systems, assisting in the proactiveidentification of development potential for land use planning, surface watermanagement, river basin and national & local flood risk management plans.
Understanding uncertainty – the NFRA will be based on best available andreadily derivable information that is considered as being reliable. It will utiliseinformation held at a national level by SEPA, Scottish Government andassociated organisations such as Historic Scotland and Scottish Natural Heritage.

6
The NFRA will be delivered at a scale that is appropriate for a nationally-appliedmethodology using national level datasets. However, SEPA will endeavour torecord elements of uncertainty, improve its understanding of uncertainty and howthis is communicated.
Draft objectives and measures – a proactive assessment of flood risk will drivethe development of the identification of those areas most vulnerable to theimpacts of flooding. Appropriate information will be made available from theNFRA to inform the early consideration of draft objectives for the most vulnerableareas and measures that can be taken to reduce flood risk.
Flood probability – the NFRA will utilise the best available flood hazard mappinginformation (i.e. the Indicative River and Coastal Flood Map) and incorporatederived information on other flood sources (i.e. indicative pluvial and groundwaterhazard mapping information). The NFRA will focus on 200-year flood events butwill be extended to incorporate other events as we develop our knowledge andtechnical capacities. In this first NFRA cycle, the 1 in 200 year fluvial, coastal andpluvial return periods will be utilised.

7
1.3. Flood Risk Receptors and Indicators
The NFRA must utilise available and readily derivable information that is consideredreliable, and therefore the NFRA uses national datasets held by SEPA, the ScottishGovernment or associated organisations to provide information on the potentialadverse consequences of flooding.
The FRM Act requires that the impact of flooding is assessed in terms of potentialadverse consequences on human health, economic activity, the environment andcultural heritage. It was deemed necessary to further split the receptor categories toensure a like for like assessments (e.g. to avoid assessing transport and agriculturalin the same analysis). This will also provide further information on issues andbenefits to the FRM planning process. The receptor groups were thereforecategorised as:
1. Human Health (A) – People (No. of Residential Properties and the socialvulnerability of the area)
2. Human Health (B) - Community (Important facilities that could causecommunity disruption if affected e.g. schools, hospitals)
3. Economic Activity (A) - Businesses (No. of business properties and theestimated weighted annual average damage related to the property)
4. Economic Activity (B) - Transport (Roads, railways and airports)
5. Economic Activity (C) - Agriculture (Agricultural land and forestry areas)
6. The Environment (Areas designated for natural heritage purposes and theirvulnerability to flooding)
7. Cultural Heritage (Cultural sites such as UNESCO World Heritage Sites)

8
1.4. Flood Risk Receptor Weightings
A weighting has been applied to each category in terms of the influence eachreceptor may have on the output of the NFRA. This weighting has been applied byrestricting which receptors can be assessed at each risk level. The receptors havebeen assessed using the below risk categories from Very Low to Very High.
The below table illustrates the score each type of receptor may receive. For example,a post office (Human Health (B)) within a flood extent will be given a ‘Low’ score. Agrid cell containing a post office will therefore be attributed with a score of 0.5. Ahospital (Human Health (A)) within a flood extent will be given a ‘Very High’ score. Agrid cell containing a hospital will therefore be attributed with a score of 250.
For residential properties and non-residential properties, a continual scale is used.This score is dependant on the number of properties within a cell, and thevulnerability/damage score associated with those properties. Further detail on thescoring for each receptor is provided in the next chapters.
The scores allocated to each receptor type have been subject to sensitivity testing toensure that the risk is represented appropriately.
Very Low Low Medium High Very High
Cell Score: 0 Cell Score: 0.5 Cell Score: 2.5 Cell Score: 25 Cell Score: 250
Economic Activity (C)
Agriculture
Natural vegetation,forests, scrub and/or
herbaceous vegetation
associations and openspaces with little or no
vegetation
Pastures, complexcultivation patterns and
agro-forestry areas
Arable land, permanent
crops and annual crops
Cultural HeritageNo cultural sites located
within a flood extentCategory C Listed
Buildings
Category B ListedBuildings, Gardens andDesigned Landscapes
UNESCO WorldHeritage Sites,
ScheduledMonuments, Category
A Listed Buildings
Environment
Designated areascontaining
species/habitatsdeemed to be of very
low' vulnerability(resilience x
susceptibility)
Designated areascontaining
species/habitatsdeemed to be of low
vulnerability (resilience xsusceptibility)
Designated areascontaining
species/habitats deemedto be of medium
vulnerability (resilience xsusceptibility)
Possible to get a highscore but no
designated areas
resulted in a scorehigher than medium
All residentialhomes/education
facilities and
police/fire stationslocated in a rural area
Motorway/ 'A'
Road/Railway or other
roads in rural areas
Maximum number of
residential propertiesper 1km² cell
All hospitals/ambulance
depots and residential
homes/educationfacilities located in a
rural area
Maximum number of
non-residentialproperties per 1km² cell
Airports
Continual scale dependant on number of residential properties per 1km² celland social flood vulnerability score in cell
Continual scale dependant on number of non-residential properties per1km² cell and weighted annual average damage score in cell
Postoffices/GPs/dentists
Minor roads or main
roads/rail in less ruralareas
All waste water treatmentworks/water pumping
facilities/police/fire stations
and post
offices/GPs/Dentistslocated in a rural area
B' Roads or minor roads
in rural areas or main
roads/rail in less ruralareas
Economic Activity (B)
Transport
No residential properties
located within a floodextent
No community serviceslocated within a flood
extent
No non-residential
properties located withina flood extent
No roads or rail linkslocated within a flood
extent
Human Health (A)
People
Human Health (B)
Community
Economic Activity (A)
Businesses

9
1.5. Hazard and Grid Data
In relation to the definition and assessment of future flood risk, hazard is consideredas the geophysical event that could result in harm (to flood receptors). It is thereforeregarded as a function of the characteristics of a flood (e.g. depth, velocity, etc).
SEPA’s 1 in 200 year indicative river and coastal flood extents3 were utilised for theassessment (these are readily available datasets within SEPA).
A national indicative pluvial dataset and a national indicative groundwater datasethave been developed have been integrated into the assessment. Pluvial extentsgenerated using a 0.1m depth contour and a 0.3m depth contour were used withinthe assessment.
The assessment follows a grid based approach which offers a standardgeographical-sized unit from which comparisons of flood risk across Scotland may bemade.
A 1km² grid cell provides a relatively high resolution for analysis within a nationalscale assessment. At this scale, small settlements (e.g. population ~1000) are stillindividually identified. This resolution and data size is much more efficient than at aneven higher resolution such as a 500m² grid cell scale. At larger scales (e.g. 2km²and 5km² cell size) the granularity of the assessment is not as great, which ultimatelyleads to a less accurate assessment. Discussions at SAIFF4 with regards to thevarious grid resolution options informed the decision that the 1km² grid cell was themost suitable cell size for the national assessment.
A similar grid cell resolution also informs approaches used by the EnvironmentAgency (England and Wales), and by the Rivers Agency (Northern Ireland) in theirpreliminary Flood Risk Assessments.
1.6. Probability
The NFRA framework allows the consideration of flooding from a range of sourcesand therefore a range of probabilities. Separate assessments were carried out foreach source of flooding in order to identify where areas are impacted by multipleflood sources. As the 1 in 200 year return period has been utilised for the Fluvial,Coastal and Pluvial flood extents, the annual exceedance probability factor of 0.5was applied. This ensures that the method is expandable if and when different returnperiods are incorporated in the future.
1.7. Catchment approach
The first stage of producing the NFRA is to identify areas potentially at risk at a 1km2
grid level. However, in order to translate this output into catchment units ofmanagement, the Inter Confluence Catchments (ICCs) dataset has been utilised.ICCs are generated from each confluence on the baseline river network, i.e. wheretwo or more rivers, each with a catchment area greater than 10 km², meet. They arederived from the work undertaken to generate the Water Framework Directive river
3SEPA Flood Maps http://map.sepa.org.uk/floodmap/map.htm
4SAIFF - Scottish Advisory and Implementation Forum on Flooding – incorporating advisory
and task & finish groups

10
typology dataset and the sub-catchment level of informationrepresented by ICCs will be the unit of management used to derive PVAs.
Various other units of management were considered in discussion at SAIFF (e.g.amalgamation of grids, ‘buffered areas’ etc.). SAIFF regarded the sub-catchment/ICCapproach as the most appropriate option. ICCs translate the NFRA grid output to asub-catchment level, allowing future measures and objectives to be related tocatchments as required by the principles of the FRM Act.
Before use within the NFRA assessment, the ICC dataset was reviewed, tested andamended to ensure it was appropriate for use. The resulting ‘Sub Catchment Unit’dataset (SCU) is an amended version of the ICCs, created for the purposes of theNFRA.
A large range of thresholds and methods have been tested to ensure that that theresulting categorisation most accurately represents flood risk in Scotland. Thepreferred process of transferring the grid outputs to the sub catchment level involvessplitting the 1km grid by the Sub Catchment Units before any analysis is carried out.All scores are therefore attributed depending on the receptors that are located withineach split cell area.
Example:
1km grid split using SCU boundaries. Receptor A’s score would be attributed to the northportion of the cell, receptor B’s score would be attributed to the south portion of the grid.
The 7 NFRA grid outputs in table 1 below, for fluvial, coastal and pluvial floodingsources, are combined to provide a total score for each cell and a groundwater factorhas been included for areas which have been classified to have a High or Very Highsusceptibility to groundwater flooding. The final grid scores are used to inform thecategorisation of SCUs as per below (Table 1):
Table 1
Human Health (A) Score Greater of the two HumanHealth Scores
Final cell score is sumof 4 outputs
Human Health (B) ScoreEconomic Activity (A) Score
Greatest of the three EconomicActivity Scores
Economic Activity (B) Score
Economic Activity (C) Score
Cultural Heritage Score Cultural Heritage Score
Environment Score Environment Score
A
B
A
11
2. Human Health
2.1 Human Health (A) - People
Flood risk in terms of Human Health (A) has been assessed as a factor of Exposure xVulnerability where:
Exposure: Number of residential properties (RPs) per km²Vulnerability: Social Vulnerability of the area using a Social Flood Vulnerability
Index (SFVI)
‘Exposure’ and ‘Vulnerability’ was applied to the grid cells and the overall outputscore was calculated as Exposure Score x Vulnerability multiplier
Property point data used for this assessment was the OS MasterMap Addresspointdataset. The number of Residential Properties (RPs) within the hazard (flooded area)per cell was calculated and equates to the exposure score.
In order to assess the Vulnerability aspect, a Social Flood Vulnerability Index (SFVI)(Tapsell et al. 2002)5 has been utilised as a means of deriving social vulnerability.The SFVI methodology was developed as a means of measuring impacts thatflooding can have on a community and uses three social characteristics and fourfinancial deprivation indices:
Social Characteristics: Long Term SickLone ParentsElderly (over 75 years old)
Financial Indices: UnemploymentOvercrowdingNon-car ownershipNon-home ownership
Information on the above categories was obtained from census data (2001) andrelates to the census ‘Datazones’ which are geographic areas defined according tokey characteristics common to the population in that grouping, used by the ScottishGovernment.
In order to assign a vulnerability score to each Datazone, the scoring method below(defined by Tapsell et al.) was used:
SFVI Score = ((Unemployed + Overcrowding + Non-car ownership + Nonhomeownership) / 4) + Single Parents + Over 75s + Long Term Sick))
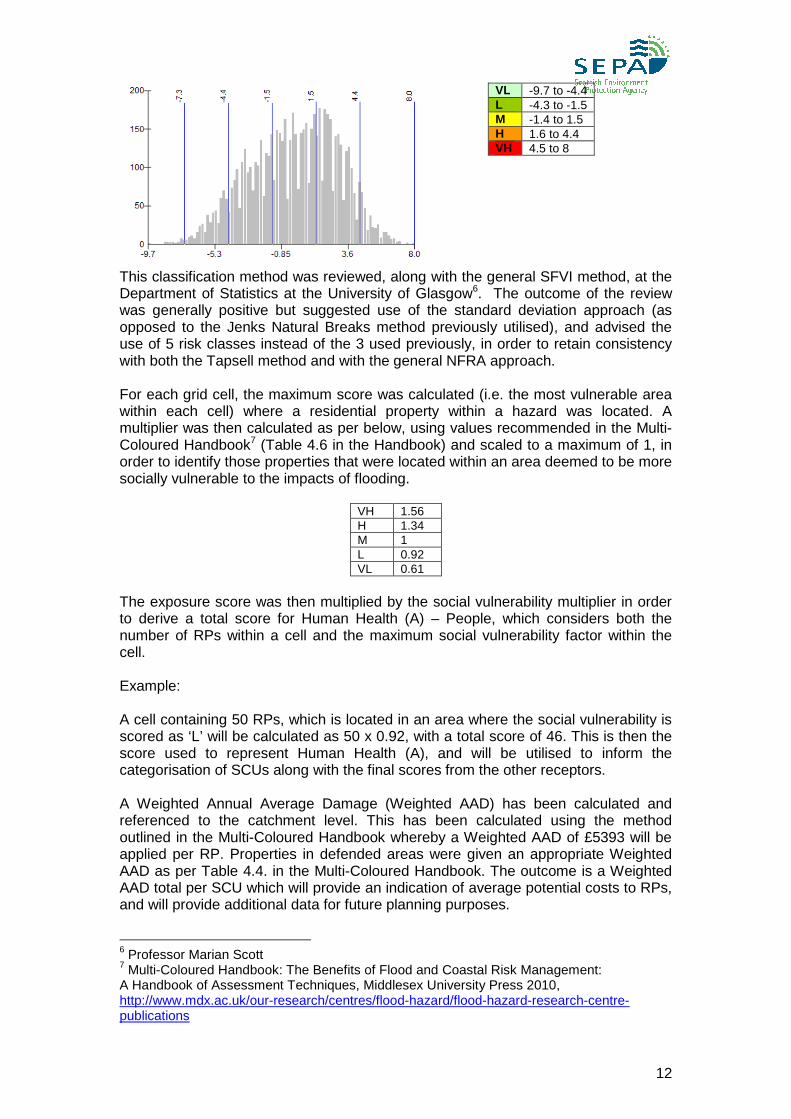
This equation considers percentages and z-scores (a standard score used tocompare means from different normally distributed sets of data), with resulting scoresranging from -9.7 (low vulnerability) to 8 (high vulnerability).
The scores were categorised as per below based upon a standard deviationclassification:
5‘Vulnerability to flooding: health and social dimensions’, S. M. Tapsell, E. C. Penning-
Rowsell, S. M. Tunstall and T. L. Wilson - Flood Hazard Research Centre, MiddlesexUniversity, Queensway, Enfield, Middlesex EN3 4SF, UK, Published online 24 May 2002
Cat Score
12
This classification method was reviewed, along with the general SFVI method, at theDepartment of Statistics at the University of Glasgow6. The outcome of the reviewwas generally positive but suggested use of the standard deviation approach (asopposed to the Jenks Natural Breaks method previously utilised), and advised theuse of 5 risk classes instead of the 3 used previously, in order to retain consistencywith both the Tapsell method and with the general NFRA approach.
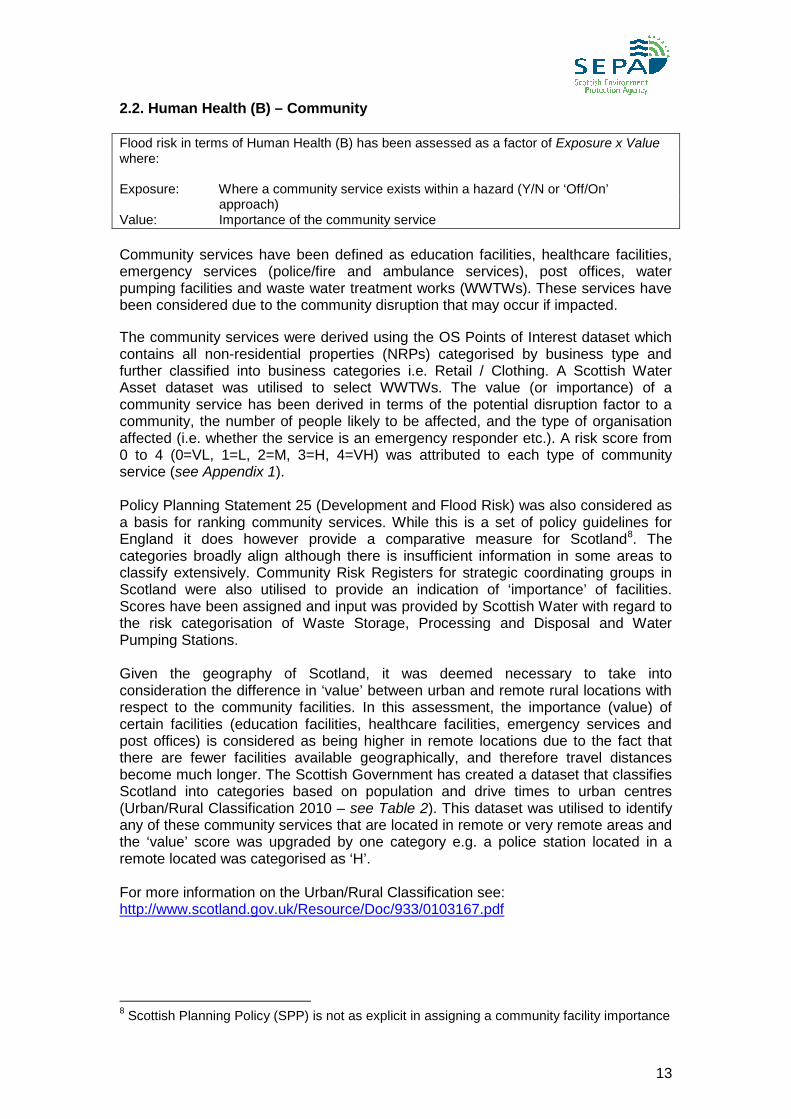
For each grid cell, the maximum score was calculated (i.e. the most vulnerable areawithin each cell) where a residential property within a hazard was located. Amultiplier was then calculated as per below, using values recommended in the Multi-Coloured Handbook7 (Table 4.6 in the Handbook) and scaled to a maximum of 1, inorder to identify those properties that were located within an area deemed to be moresocially vulnerable to the impacts of flooding.
VH 1.56H 1.34M 1L 0.92VL 0.61
The exposure score was then multiplied by the social vulnerability multiplier in orderto derive a total score for Human Health (A) – People, which considers both thenumber of RPs within a cell and the maximum social vulnerability factor within thecell.
Example:
A cell containing 50 RPs, which is located in an area where the social vulnerability isscored as ‘L’ will be calculated as 50 x 0.92, with a total score of 46. This is then thescore used to represent Human Health (A), and will be utilised to inform thecategorisation of SCUs along with the final scores from the other receptors.
A Weighted Annual Average Damage (Weighted AAD) has been calculated andreferenced to the catchment level. This has been calculated using the methodoutlined in the Multi-Coloured Handbook whereby a Weighted AAD of £5393 will beapplied per RP. Properties in defended areas were given an appropriate WeightedAAD as per Table 4.4. in the Multi-Coloured Handbook. The outcome is a WeightedAAD total per SCU which will provide an indication of average potential costs to RPs,and will provide additional data for future planning purposes.
6Professor Marian Scott
7Multi-Coloured Handbook: The Benefits of Flood and Coastal Risk Management:
A Handbook of Assessment Techniques, Middlesex University Press 2010,http://www.mdx.ac.uk/our-research/centres/flood-hazard/flood-hazard-research-centre-publications
VL -9.7 to -4.4L -4.3 to -1.5M -1.4 to 1.5H 1.6 to 4.4VH 4.5 to 8
13
2.2. Human Health (B) – Community
Flood risk in terms of Human Health (B) has been assessed as a factor of Exposure x Valuewhere:
Exposure: Where a community service exists within a hazard (Y/N or ‘Off/On’approach)
Value: Importance of the community service
Community services have been defined as education facilities, healthcare facilities,emergency services (police/fire and ambulance services), post offices, waterpumping facilities and waste water treatment works (WWTWs). These services havebeen considered due to the community disruption that may occur if impacted.
The community services were derived using the OS Points of Interest dataset whichcontains all non-residential properties (NRPs) categorised by business type andfurther classified into business categories i.e. Retail / Clothing. A Scottish WaterAsset dataset was utilised to select WWTWs. The value (or importance) of acommunity service has been derived in terms of the potential disruption factor to acommunity, the number of people likely to be affected, and the type of organisationaffected (i.e. whether the service is an emergency responder etc.). A risk score from0 to 4 (0=VL, 1=L, 2=M, 3=H, 4=VH) was attributed to each type of communityservice (see Appendix 1).
Policy Planning Statement 25 (Development and Flood Risk) was also considered asa basis for ranking community services. While this is a set of policy guidelines forEngland it does however provide a comparative measure for Scotland8. Thecategories broadly align although there is insufficient information in some areas toclassify extensively. Community Risk Registers for strategic coordinating groups inScotland were also utilised to provide an indication of ‘importance’ of facilities.Scores have been assigned and input was provided by Scottish Water with regard tothe risk categorisation of Waste Storage, Processing and Disposal and WaterPumping Stations.
Given the geography of Scotland, it was deemed necessary to take intoconsideration the difference in ‘value’ between urban and remote rural locations withrespect to the community facilities. In this assessment, the importance (value) ofcertain facilities (education facilities, healthcare facilities, emergency services andpost offices) is considered as being higher in remote locations due to the fact thatthere are fewer facilities available geographically, and therefore travel distancesbecome much longer. The Scottish Government has created a dataset that classifiesScotland into categories based on population and drive times to urban centres(Urban/Rural Classification 2010 – see Table 2). This dataset was utilised to identifyany of these community services that are located in remote or very remote areas andthe ‘value’ score was upgraded by one category e.g. a police station located in aremote located was categorised as ‘H’.
For more information on the Urban/Rural Classification see:http://www.scotland.gov.uk/Resource/Doc/933/0103167.pdf
8Scottish Planning Policy (SPP) is not as explicit in assigning a community facility importance

14
Table 2
Classification Description Use in NFRA
1 Large Urban Areas Population >125,000
2 Other Urban Areas Population between 10,000 and 125,000
3Accessible SmallTowns
Population between 3000 and 10,000 and within a 30min drive time to a settlement of 10,000 or more
4Remote SmallTowns
Population between 3000 and 10,000 and a drivetime between 30 to 60 mins to a settlement of 10,000or more
Category usedto increasescores
5Very Remote SmallTowns
Population between 3000 and 10,000 and a drivetime over 60 mins to a settlement of 10,000 or more
Category usedto increasescores
6Accessible RuralAreas
Population <3000 and within a 30 min drive time to asettlement of 10,000 or more
7 Remote Rural AreasPopulation <3000 and a drive time between 30 to 60mins to a settlement of 10,000 or more
Category usedto increasescores
8Very Remote RuralAreas
Population <3000 and a drive time over 60 mins to asettlement of 10,000 or more
Category usedto increasescores
The maximum score was applied to each cell where a service was located (Exposure= ‘On’) therefore the highest risk score present in a cell returns the cell value.
15
3. Economic Activity
3.1. Economic Activity (A) - Business
Flood risk in terms of Economic Activity (A) has been assessed in terms of the Exposure xValue of Non Residential Properties (NRPs) where
Exposure: Number of NRPs per km²Value: Weighted Average Annual Damage (WAAD) Score
The OS Points of Interest dataset has been used to select NRPs. Each point wasattributed with a ‘bulk class’ using the Multi-Coloured Handbook. According to thehandbook, there are 5 bulk classes (Retail, Warehouse, Office, Factory, Non-Bulk)and these can be used to derive an average floor space and weighted AAD. In orderto relate each NRP to a single RP (i.e. NRPs vs. RPs), a factor relating theresidential property weighted AAD (£5393)9 was applied to the NRPs per cell usingthe below formula:
NRP WAAD Score = (Bulk Class Average Flood Space (m²) x Bulk Class WAAD) /Residential Property WAAD
e.g.: Where Bulk Class is Retail: (Average Floor Space (194m²) x AAD (£69.40/m²)) /£5393 = NRP score of 2.49.
There is an option to use a ‘with basement’ figure, or a ‘without basement’ figure forcalculating weighted AADs for NRPs (tables 5.1a and 5.1b in the Multi-ColouredHandbook). The ‘with basements’ figures were utilised for this assessment as thesefigures ensured a more precautionary approach.
Each cell was attributed with the sum of the NRP scores within the cell e.g. a cellcontaining 5 ‘retail’ properties would have a total score of 12.45.
A weighted AAD total per SCU was also calculated. Both the ‘with basement’ and the‘without basement’ figures were used and the inclusion of 2 sets of values allowedthe generation of an upper and lower banding.
Properties in defended areas were given an appropriate weighted AAD as per tables5.1a and 51.b. in the Multi-Coloured Handbook. The outcome is a weighted AAD totallower and upper band per SCU. This will be for information purposes and will provideadditional data for future planning purposes.
9Figure from Multi-Coloured Handbook: The Benefits of Flood and Coastal Risk
Management:A Handbook of Assessment Techniques, Middlesex University Press 2010http://www.mdx.ac.uk/our-research/centres/flood-hazard/flood-hazard-research-centre-publications
16
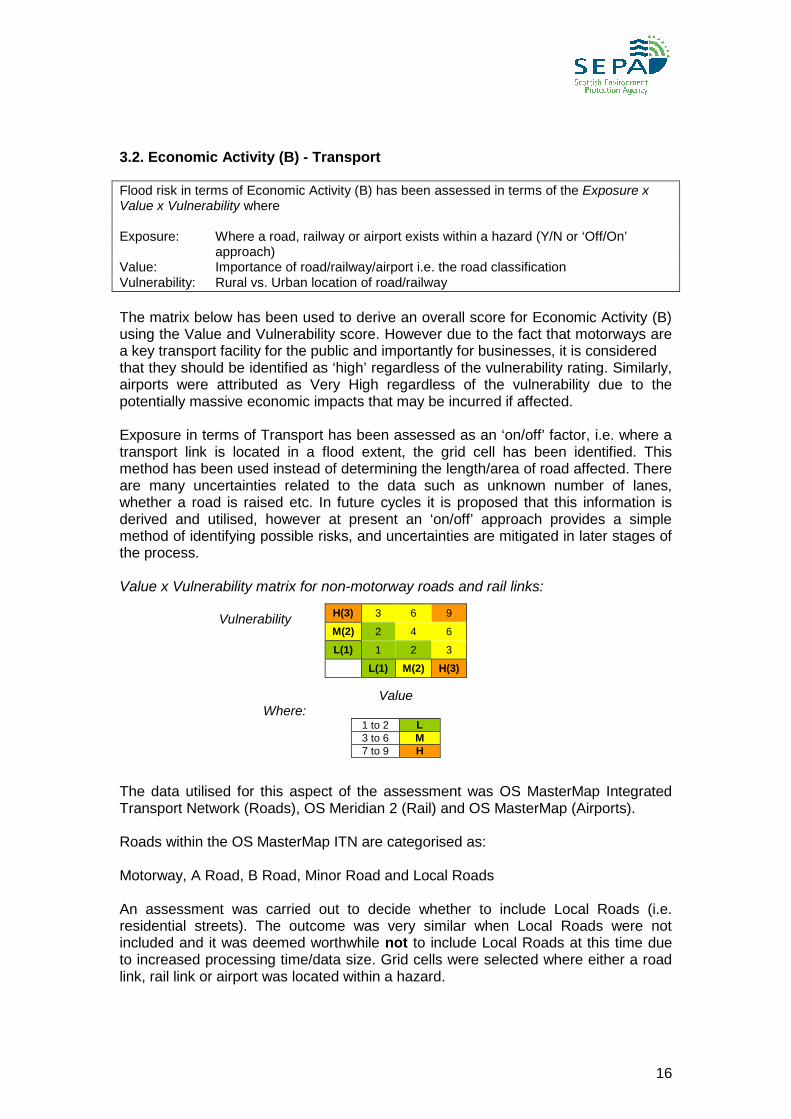
3.2. Economic Activity (B) - Transport
Flood risk in terms of Economic Activity (B) has been assessed in terms of the Exposure xValue x Vulnerability where
Exposure: Where a road, railway or airport exists within a hazard (Y/N or ‘Off/On’approach)
Value: Importance of road/railway/airport i.e. the road classificationVulnerability: Rural vs. Urban location of road/railway
The matrix below has been used to derive an overall score for Economic Activity (B)using the Value and Vulnerability score. However due to the fact that motorways area key transport facility for the public and importantly for businesses, it is consideredthat they should be identified as ‘high’ regardless of the vulnerability rating. Similarly,airports were attributed as Very High regardless of the vulnerability due to thepotentially massive economic impacts that may be incurred if affected.
Exposure in terms of Transport has been assessed as an ‘on/off’ factor, i.e. where atransport link is located in a flood extent, the grid cell has been identified. Thismethod has been used instead of determining the length/area of road affected. Thereare many uncertainties related to the data such as unknown number of lanes,whether a road is raised etc. In future cycles it is proposed that this information isderived and utilised, however at present an ‘on/off’ approach provides a simplemethod of identifying possible risks, and uncertainties are mitigated in later stages ofthe process.
Value x Vulnerability matrix for non-motorway roads and rail links:
Vulnerability
ValueWhere:
The data utilised for this aspect of the assessment was OS MasterMap IntegratedTransport Network (Roads), OS Meridian 2 (Rail) and OS MasterMap (Airports).
Roads within the OS MasterMap ITN are categorised as:
Motorway, A Road, B Road, Minor Road and Local Roads
An assessment was carried out to decide whether to include Local Roads (i.e.residential streets). The outcome was very similar when Local Roads were notincluded and it was deemed worthwhile not to include Local Roads at this time dueto increased processing time/data size. Grid cells were selected where either a roadlink, rail link or airport was located within a hazard.
H(3) 3 6 9
M(2) 2 4 6
L(1) 1 2 3
L(1) M(2) H(3)
1 to 2 L3 to 6 M7 to 9 H

17
The ‘value’ of a road or rail link has been defined as the importanceof the road/railway. For the purpose of this assessment, Value is related to the roadclassification/type of transport link where:
VH AirportH Motorway or ‘A’ Road, RailwayM ‘B’ RoadL Minor Road
It should be noted that a road classification exists (trunk roads only) based on theeconomic, social and integrated transport factors (Transport Scotland). Thisinformation is currently unavailable but it is intended that this dataset or similarshould be used to refine this assessment in future cycles.
In addition, Transport Scotland has provided data for the ‘Number of Road Users’ perday. This was investigated for use as an indicator for ‘value’. However, a largeamount of manual work is required to ensure monitoring sites are attributing thecorrect roads, and that erroneous counts such as ‘9999’ are removed from theassessment. This dataset is also only provided for trunk roads. After an initial review,it was decided that further investigation was required to ensure this dataset could beused effectively and that the required level of reliability from the dataset was notreadily derivable. This may impact the ‘importance’ level of the road network in futurecycles.
Grid cells were attributed with the maximum value per cell i.e. the most importantvalue per cell.
Vulnerability in terms of transport can be determined by the vulnerability to roadusers/communities that may be affected by road closures. Rural areas will be mostimpacted as diversion routes are likely to be longer if available at all.
Using the Scottish Government Urban/Rural Classification (see Table 2), avulnerability score was applied as below (Table 3) to ensure roads in ‘very remote’areas were classed with a ‘H’ vulnerability score, whilst roads in ‘remote’ areas wereclassed with an ‘M’ vulnerability score:
Table 3.
Using the matrix illustrated above a risk score was applied considering both the valueand the vulnerability of the transport link.
ClassificationVulnerabilityScore
1 Large Urban Areas L
2 Other Urban Areas L
3 Accessible Small Towns L
4 Remote Small Towns M
5 Very Remote Small Towns H
6 Accessible Rural Areas L
7 Remote Rural Areas M
8 Very Remote Rural Areas H

18
Transport Scotland has reviewed the approach and datasets used,and has provided a broad approval. It will continue to be involved in the process tohelp ensure that the best available datasets are utilised.
3.3. Economic Activity (C) – Agriculture
Flood risk in terms of Economic Activity (C) has been assessed in terms of the Exposure xValue where
Exposure: Where an area of agricultural land exists within a hazard (Y/N or‘Off/On’ approach)
Value: Importance of land class
The CORINE Land Cover Map (CLC2000)10 was selected for analysis in terms ofcalculating the area of agricultural land affected by flooding. CORINE 2000 is theyear 2000 update of the first CLC database which was finalised in the early 1990s aspart of the European Commission program to COoRdinate INformation on theEnvironment (Corine). It provides consistent information on land cover changesduring the past decade across Europe. The CLC2000 database covers 32 countries.
CLC2000 was derived from the Land Cover Map 2000 (LCM). The LCM2000 is amore detailed dataset however the CLC2000 provided a simpler version which wasmore useable for the purposes of this assessment. A third alternative dataset ‘LandCover of Scotland 1988’ (Macaulay Land Use Research Institute) was deemed to beless reliable because of the age of the dataset, although the resolution is good.
It should also be noted that there are some potential new datasets that could beutilised when available such as the year 2007 version of the LCM and a new land usedataset currently being created by the Scottish Government. These will be reviewedand considered for future NFRA updates.
Grid cells were selected where any area of agricultural land/forestry was locatedwithin a hazard.
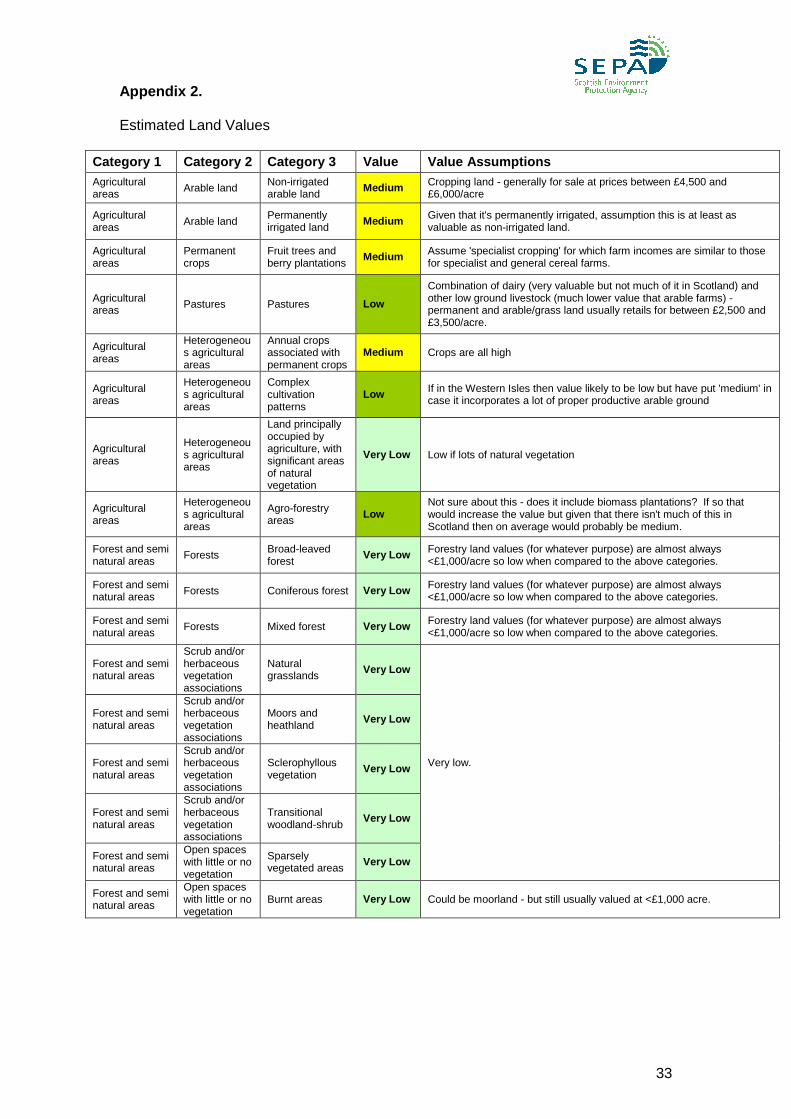
In order to derive an estimated land value, SEPA’s Environmental EconomyDepartment classified the CORINE agricultural and forestry land categories usingaverage land values which were assumed to be a reasonable reflection of agriculturalland values in Scotland. These were used to classify the data into broad ‘value’categories (see Appendix 2).
Using these values the above CORINE land classes were assigned a risk categoryfrom Very Low to Medium. The maximum value per cell was used.
An estimated AAD total per catchment has also been calculated. Table 9.8. in theMulti-Coloured Manual presents estimates of costs from a single flood according toan Agricultural Land Class (ALC). In order to create a national estimate of damage toagriculture, a value has been calculated based on areas within a range of floodenvelopes and with a range of land classes. Initial values have been weighted usingan estimate of the percentage of land within different return period flood envelopes(values derived from the Multi-Coloured Handbook, Table 4.5). These values were
10http://www.eea.europa.eu/data-and-maps/data/corine-land-cover-2000-clc2000-seamless-
vector-database

19
then multiplied by the percentage of land within Scotland which fallswithin each ALC11. The value for each ALC was then summarised to give a value of£538/ km2.
4. The Environment
The impacts of flooding on the natural environment have been considered in this assessmentas a factor of the Exposure x Vulnerability of protected areas (and the species and habitatswithin these areas) where:
Exposure: Where an area of designated land exists within a hazard (Y/N or‘Off/On’ approach)
Vulnerability: A factor of the susceptibility of the species/habitat to flooding andthe resilience of that species/habitat
To support the development of appropriate methods, the identification of appropriatedatasets and he establishment of a Vulnerability rating, an Environmental RiskReceptor Working Group (ERRWG) was set up which includes key SEPA staff fromEcology and representatives from Scottish Natural Heritage.
The below datasets were utilised for this element of the assessment. These werereadily available and were deemed the most suitable by the ERRWG:
SACs (Special Areas of Conservation) – EU Legislation SPAs (Special Protection Areas) – EU Legislation SSSIs (Sites of Special Scientific Interest) – UK Legislation
Grid cells were selected where any of the above designated areas were locatedwithin a hazard. Vulnerability in terms of the natural environment has been assessedas a function of ‘Susceptibility’ x ‘Resilience’.
The ERRWG applied a score (0 to 3 where 0=VL and 3=H) for susceptibility and forresilience to each broad category that was identified as being located within adesignated area, within the floodplain.
A total score was applied to each broad category using the below matrix:
H (3) 0 3 6 9
M (2) 0 2 4 6
L (1) 0 1 2 3
VL(0) 0 0 0 0
VL(0) L(1) M(2) H(3)
Susceptibility
Where:0 VL
1 to 2 L
3 to 6 M
Over 6 H
11Figure from the Macaulay Land Use Research Institute - The Potential use of the Land
Capability for Agriculture Classification for Determining Support to Disadvantaged Areas ofScotland (2006)
Resilience

20
The maximum score was applied to each designated area, and in turn to each gridcell. For example, a designated area containing a species deemed to have a ‘M’vulnerability score, and a species deemed to have a ‘L’ vulnerability score would getan overall score of ‘M’. The grid cell containing this designated area would thereforealso get a score of ‘M’.
5. Cultural Heritage
The impacts of flooding on the cultural heritage have been considered in this assessment asa factor of the Exposure x Value of cultural sites where:
Exposure: Where a cultural site exists within a hazard (Y/N or ‘Off/On’ approach)Value: Importance or level of designation of the cultural site
The below datasets were utilised for this element of the assessment. These werereadily available and were deemed the most suitable by Historic Scotland.
Listed Buildings (All categories) Scheduled Monuments (Monument of national importance) World Heritage Sites Gardens and Designed Landscapes
Grid cells were selected where a listed building, scheduled monument, world heritagesite or garden and designed landscape site was located within a hazard.
The method of applying a value to Cultural Heritage Receptors has been informed bythe ‘Cultural Importance’ of a site based on recognised designations of local,regional, national and international importance. A measure of this has beenundertaken in the SEPA Water Framework Directive guidance paper ‘Assessing thesignificance of Impacts – Social, Economic, Environmental (WAT-SG-67) whereby anindicative guide to assessing the importance of an impacted built heritage interest asbeen created. The categories produced (with relevance to this exercise) are asbelow:
Low Listed Buildings Grade C(s)Medium Listed Buildings Grade B
HighScheduled MonumentsListed Buildings Grade A
Very HighUNESCO World Heritage Site for which Built heritage was an importantfactor in its designation
A categorisation of the available data utilised for this assessment has been derivedfrom this as below:
VL L M H
Score 0 1 2 3
Description
ListedBuildings/WHS/Monumentsnot locatedwithin definedhazard
Listed BuildingsCategory C
Listed BuildingsCategory B,Gardens andDesignedLandscapes
ScheduledMonuments, ListedBuildings Category A,UNESCO WHS

21
Using these values the grid cells were assigned a risk category fromLow to High.
Historic Scotland has been involved throughout the assessment process byreviewing the methods and datasets as well as providing expert input. HistoricScotland has also been involved through its role in SAIFF task and finish groups andin future it is hoped that this area of the assessment can be developed in partnershipin order to attain a ‘vulnerability’ score based on the susceptibility and resilience ofthe site to impacts of flooding.
6. Flood Defences
A number of options were considered as to how Flood Protection Schemes (FPS)could be incorporated into the NFRA. The complexity of the issue and the availabledata were taken into consideration to identify the method which was deemed to bethe most appropriate. The approaches taken by the other UK Agencies were alsoinvestigated.
The selected method investigates the impact of FPS in two phases: the first phaseprovides a quantitative assessment for schemes with available data, identifying theprotection offered by the defences; the second phase is a qualitative assessment,which will be undertaken for all FPS.
There are currently 113 formal schemes in Scotland as recorded in the ScottishFlood Defence Asset Database (SFDAD) and of these, 40 have been assessed at adetailed level. Data identifying the ‘areas of benefit’ for these 40 schemes, whichillustrates the area behind a defence that benefits from the protection, has beensupplied by consultants Jeremy Benn Associates (JBA) that hosts and maintains thisdataset for the Scottish Government. This data was used to identify the potentialbenefit offered by the 40 schemes.
The phase 1 assessment identifies receptors within the ‘area of benefit’. Thereceptors utilised for this stage of the assessment are residential properties (RPs)and non-residential properties (NRPs). Generally, these are the receptors for whichdefences were originally created to protect and are most likely to benefit from existingdefence schemes. These are also the most influential elements of the assessment.The RPs and NRPs located within the ‘areas benefiting’ were selected, and form anew set of receptor data, to identify protected properties.
To supplement these areas an assessment of the defence has also been conducted,based on the scheme age, condition, standard of protection and any reduction of thestated standard of protection, which allows the development of a ‘defence category’.Those deemed to require further maintenance or those where the information isunreliable or incomplete have been identified as requiring further review in phase 2.
A weighting based on the defence category has been applied to the propertiesbenefiting from defence. This value output has been subtracted from the originalassessment for these two receptors to provide a new receptor figure.
Very Good: 1Good: 0.75Fair: 0.5Poor: 0

22
Example:
The second phase of the FPS assessment has been carried out within the SubCatchment Unit Review process (section 12). This includes a consideration of amongother things: required maintenance of the FPS and residual risk posed by thestructures. The rating of that Sub Catchment Unit could then be upgraded ordowngraded, based on the criteria below.
rating of the defence the number of properties behind the defence maintenance history /cost defence height
7. Climate Change
SEPA has coordinated a project to assess the vulnerability of Scotland’s rivercatchments and coasts to the impact of climate change. For fluvial flooding, this wasassessed as a Scotland-focused version of the established DEFRA12 method, andthe impact to the Scottish coastline was assessed through the development anddeterministic assessment of a series of Coastal Behavioural Systems.
The sensitivity of catchments is identified by the Scotland focused method. Thisestimates a catchment’s sensitivity to climatic change then combines it withinformation on climatic hazard in order to estimate the risk in terms of the impacts onpeak river flows. As part of this work, catchment sensitivity (response type) wasestimated from catchments’ properties. This study allowed the response type to bemore applicable to Scotland. This approach is intended to be scenario-neutral (i.e.based on catchment response rather than the time-varying outcome of individualscenarios) in order to provide a strong base assessment of the potential impact ofclimate change and thus secure confidence in setting future objectives andmeasures.
The coastal element of the study included a review of the implications of climatechange on coastal landforms and processes around Scotland and an assessment offuture behaviour and vulnerability of the coastline. The approach included thedefinition of climate change predictions, coastal behaviour systems and associatedsensitivity analysis, identification of assets exposed to hazards and finally anassessment of coastal vulnerability.
The sensitivity of catchments has been considered in the definition andcharacterisation of SCUs which will inform the identification of Potentially VulnerableAreas. A factor relating to the potential impacts that climate change would cause hasbeen applied to each SCU. The factor is based on the increase in economic costs
12Department for Environment, Food and Rural Affairs
Original score for lCC = 250
44 Properties within the areabenefitting from defences
Defence Category = Good (0.75)
Cell score for this receptor (e.g.Human Health (A) =(250-(44*0.75)) = 217
This will be the score used to takethrough to the PVA assessment

23
which would be expected due to a greater flooding depth toidentified receptors. The factor does not include additional receptors being placed inthe floodplain13.
8. Future Development within Flood Risk Areas
The FRM Act requires the adoption of a forward looking approach that considersfuture developments. Information of future strategic developments has been obtainedfrom the National Planning Framework 2 and data identifying the locations of
strategic areas of development has been created. This data has been used incombination with other information such as climate change impacts, to aid in thedefinition of PVAs.
As the assessment of potential future climate change is improved SEPA will seek toconsider the potential future impacts on flood risk in planning appropriate measuresand objectives.
9. Historic Flood Events
The FRM Act requires the inclusion of significant past flood events as part of theNFRA to ensure that any areas previously affected by flooding are considered. SEPAhas gathered information on historic flood events from Local Authorities, ScottishWater, Network Rail and SEPA data held internally. An exercise was also carried outto collect historical flood event data from archived information. This data has beencollated and reviewed, as part of the review process the significance of the floodrecorded has been determined. Significant flood events have been identified using ascoring method that considers the impact, source and reliability of the recordedevent.
In some instances a general location of a flooding record has been provided,referenced by town or street rather than individual properties. As a result it is moreappropriate to include this information at the catchment unit level rather than gridlevel when flooding incidents may be incorrectly attributed.
The historical flood event data was used in the validation of the NFRA grid output, inorder to ensure that significant past flood events have been a) identified and b)analysed to inform the categorisation of SCUs and therefore the definition of PVAs.
10. Infrastructure
The presence of utility infrastructure within a flood extent has been utilised to informthe definition of PVAs. The Ordnance Survey Points of Interest Dataset has beenused to identify energy production sites (power stations, generating stations etc.),telecommunications features (broadcasting stations, exchanges etc.) and oilextraction, refinery and product manufacture sites (e.g. oil refineries). This is a fullyavailable dataset derived from a range of sources and provides spatial information oncommercial features across Great Britain highlighting location and functioninformation, with a postal address for all addressable points.
13Factor derived from Multi-Coloured Handbook Appendix Chapter 4
http://www.mdx.ac.uk/our-research/centres/flood-hazard/flood-hazard-research-centre-publications

24
The location of these sites have helped inform the PVA creationdecision making process. More details can be found in the Sub Catchment UnitCategorisation chapters (section 12) of this document.
11. Uncertainties
The NFRA grid output has been created using readily available and derivable data asspecified in the Flood Risk Management (Scotland) Act 2009. Whilst the bestavailable data has been utilised, there remain uncertainties associated withdeveloping any flood risk assessment methodology. The main areas of datauncertainty are presented below.
Hazard Data
Fluvial and CoastalThe Indicative 1 in 200 year fluvial and coastal flood maps have been utilised as ahazard for the NFRA. Uncertainty contained within this data and therefore thederived outputs is present within this assessment, due to issues such as the verticalerror associated within the digital terrain model (Nextmap DTM).
PluvialSEPA has derived a national scale pluvial flood modelling programme, the goal ofwhich was to generate a pluvial flood map for Scotland. The greatest uncertaintiesassociated with this work are the inaccuracies in the ground model used (NextmapDTM) and losses to sewer systems. The modelling software used (ISIS FAST) has afunctionality which allows for sewer system losses, which has been assumed to be12mm per hour which is a standard loss figure currently being used in England,Wales and Northern Ireland.
GroundwaterThere are inherent uncertainties in mapping groundwater flood hazards at a nationalscale. Uncertainties are associated with the groundwater data that was derived usinga variety of sources, including SEPA’s 1 in 200 year fluvial and coastal flood maps,which were used as a proxy to indicate areas vulnerable to flooding in low lyingareas. Limitations with certain geology datasets (e.g. karstic limestone and fracturezones) were identified and the geological mapping in urban areas is uncertain due tothe effect that building processes can have by potentially disturbing or removing thenatural occurrence of geological deposits. However, the best available geological andaquifer mapping information has been used within this methodology.
Climate Change Data
In terms of flooding, climate change impact is based on the probability of increasedlikelihood of floods occurring, and is therefore inherently uncertain. There is also aninherent uncertainty within climate change models. SEPA has undertaken aScotland-specific project to determine the likely changes in flow based on the bestavailable data and methodologies. The wide ranging sensitivity analysis approach toassess the catchment response to climate change adopted by the project takesaccount of a number of the uncertainties.
25
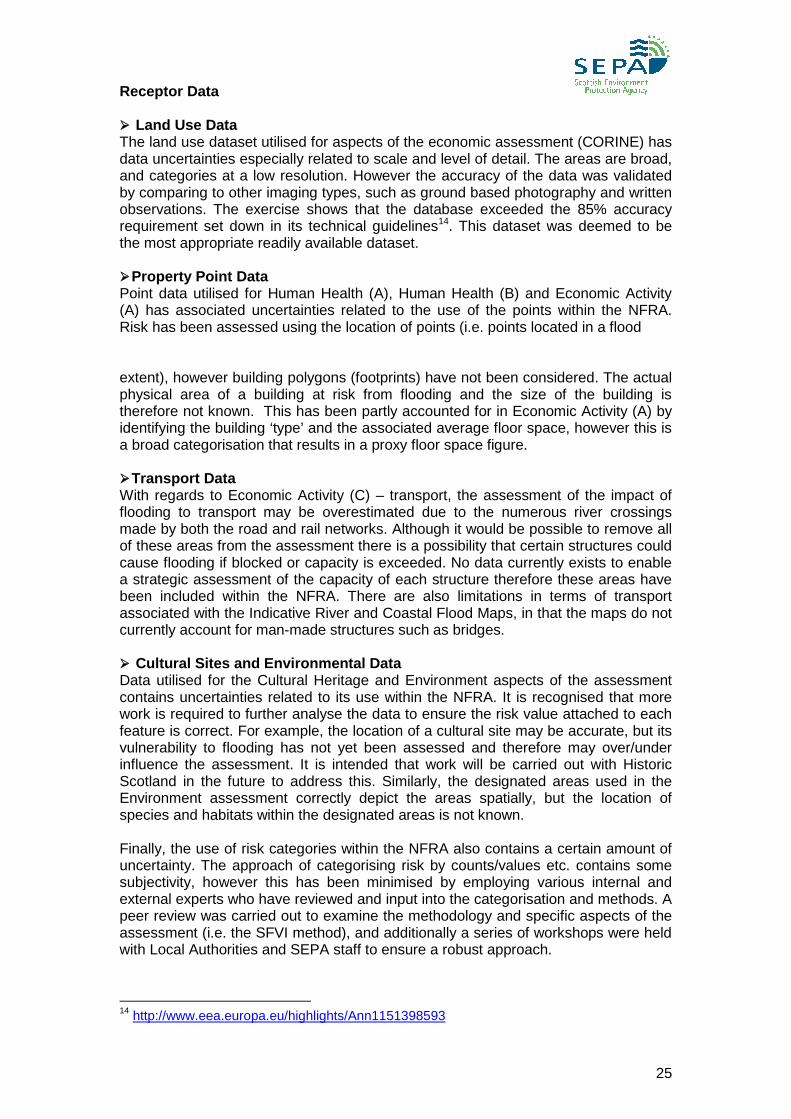
Receptor Data
Land Use DataThe land use dataset utilised for aspects of the economic assessment (CORINE) hasdata uncertainties especially related to scale and level of detail. The areas are broad,and categories at a low resolution. However the accuracy of the data was validatedby comparing to other imaging types, such as ground based photography and writtenobservations. The exercise shows that the database exceeded the 85% accuracyrequirement set down in its technical guidelines14. This dataset was deemed to bethe most appropriate readily available dataset.
Property Point DataPoint data utilised for Human Health (A), Human Health (B) and Economic Activity(A) has associated uncertainties related to the use of the points within the NFRA.Risk has been assessed using the location of points (i.e. points located in a flood
extent), however building polygons (footprints) have not been considered. The actualphysical area of a building at risk from flooding and the size of the building istherefore not known. This has been partly accounted for in Economic Activity (A) byidentifying the building ‘type’ and the associated average floor space, however this isa broad categorisation that results in a proxy floor space figure.
Transport DataWith regards to Economic Activity (C) – transport, the assessment of the impact offlooding to transport may be overestimated due to the numerous river crossingsmade by both the road and rail networks. Although it would be possible to remove allof these areas from the assessment there is a possibility that certain structures couldcause flooding if blocked or capacity is exceeded. No data currently exists to enablea strategic assessment of the capacity of each structure therefore these areas havebeen included within the NFRA. There are also limitations in terms of transportassociated with the Indicative River and Coastal Flood Maps, in that the maps do notcurrently account for man-made structures such as bridges.
Cultural Sites and Environmental DataData utilised for the Cultural Heritage and Environment aspects of the assessmentcontains uncertainties related to its use within the NFRA. It is recognised that morework is required to further analyse the data to ensure the risk value attached to eachfeature is correct. For example, the location of a cultural site may be accurate, but itsvulnerability to flooding has not yet been assessed and therefore may over/underinfluence the assessment. It is intended that work will be carried out with HistoricScotland in the future to address this. Similarly, the designated areas used in theEnvironment assessment correctly depict the areas spatially, but the location ofspecies and habitats within the designated areas is not known.
Finally, the use of risk categories within the NFRA also contains a certain amount ofuncertainty. The approach of categorising risk by counts/values etc. contains somesubjectivity, however this has been minimised by employing various internal andexternal experts who have reviewed and input into the categorisation and methods. Apeer review was carried out to examine the methodology and specific aspects of theassessment (i.e. the SFVI method), and additionally a series of workshops were heldwith Local Authorities and SEPA staff to ensure a robust approach.
14http://www.eea.europa.eu/highlights/Ann1151398593

26
12. Sub Catchment Unit (SCU) Categorisation
The grid output provides a semi-quantitative analysis of the impact of ‘future’ andhistoric (recorded) floods could have to Human Health, Economic Activity,Environment and Cultural Heritage, from strategic flooding information. Thecatchment analysis is based on reliable information that is available or readilyderivable and provides a nationally consistent data set which can be used to prioritiseareas and identify where further work may be required.
Strategic studies by their nature cannot replicate the detail of local studies and somegeneralisations are required at both the hazard and receptor level. Theseuncertainties within the data, identified in the previous chapter, are taken intoconsideration within the Sub Catchment Unit categorisation process. In order toconsider the uncertainty, an initial categorisation of SCUs based on the grid outputalone has been used to determine the required review process and additional datarequired to identify the area as a PVA. During the process it is possible for areas tobe upgraded or downgraded based on further national or local information.
The method for categorising Sub Catchment Units is a two stage process:
1. SCUs categorised (from ‘Very Low’ to ‘Very High’) using the scores from thegrid output
2. Manual review of SCUs undertaken that considers supplementary catchment-scale information
The sections below detail the methods undertaken in each of these stages (SeeAppendix 4 for the Sub Catchment Unit Categorisation Process Diagram).
12.1. Sub Catchment Unit Category from Grid Scores
Given the definition of flood risk and the need to consider a range of flood riskreceptors, the setting of catchment unit categories must be done sensitively and withconsideration as to how these might influence the identification of measures andobjectives for management planning and future investment.
Chapter 1.4 of this paper highlights the maximum score possible from the differentreceptor categories. In summary the five categories of catchment units aredetermined from the initial threshold assessment:
Very High Areas with combined complex flooding issues where more than onereceptor is at very high risk
High Areas with predominately single source flooding issues where eitherone category shows a very high flood risk or a number of categoriesshow a high flood risk
Medium Areas with predominately single source flooding issues where eitherone category shows a high flood risk or a number of categories showa medium flood risk
Low Areas which show some risk of flooding to a number of categoriesVery Low Areas which show limited flood risk to a small number of categories
The below table (Table 4) illustrates the initial categorisation of the SCUs using thegrid output:
27
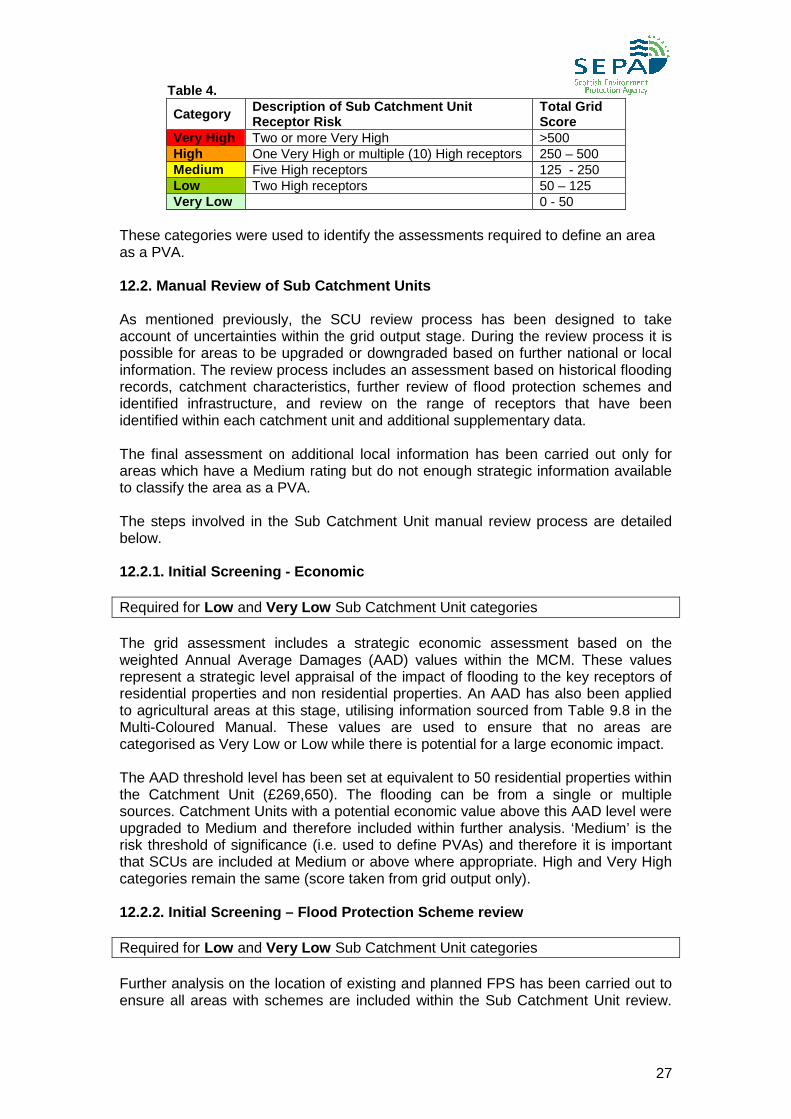
Table 4.
CategoryDescription of Sub Catchment UnitReceptor Risk
Total GridScore
Very High Two or more Very High >500High One Very High or multiple (10) High receptors 250 – 500Medium Five High receptors 125 - 250Low Two High receptors 50 – 125Very Low 0 - 50
These categories were used to identify the assessments required to define an areaas a PVA.
12.2. Manual Review of Sub Catchment Units
As mentioned previously, the SCU review process has been designed to takeaccount of uncertainties within the grid output stage. During the review process it ispossible for areas to be upgraded or downgraded based on further national or localinformation. The review process includes an assessment based on historical floodingrecords, catchment characteristics, further review of flood protection schemes andidentified infrastructure, and review on the range of receptors that have beenidentified within each catchment unit and additional supplementary data.
The final assessment on additional local information has been carried out only forareas which have a Medium rating but do not enough strategic information availableto classify the area as a PVA.
The steps involved in the Sub Catchment Unit manual review process are detailedbelow.
12.2.1. Initial Screening - Economic
Required for Low and Very Low Sub Catchment Unit categories
The grid assessment includes a strategic economic assessment based on theweighted Annual Average Damages (AAD) values within the MCM. These valuesrepresent a strategic level appraisal of the impact of flooding to the key receptors ofresidential properties and non residential properties. An AAD has also been appliedto agricultural areas at this stage, utilising information sourced from Table 9.8 in theMulti-Coloured Manual. These values are used to ensure that no areas arecategorised as Very Low or Low while there is potential for a large economic impact.
The AAD threshold level has been set at equivalent to 50 residential properties withinthe Catchment Unit (£269,650). The flooding can be from a single or multiplesources. Catchment Units with a potential economic value above this AAD level wereupgraded to Medium and therefore included within further analysis. ‘Medium’ is therisk threshold of significance (i.e. used to define PVAs) and therefore it is importantthat SCUs are included at Medium or above where appropriate. High and Very Highcategories remain the same (score taken from grid output only).
12.2.2. Initial Screening – Flood Protection Scheme review
Required for Low and Very Low Sub Catchment Unit categories
Further analysis on the location of existing and planned FPS has been carried out toensure all areas with schemes are included within the Sub Catchment Unit review.

28
The first phase of the defence assessment is outlined in the gridmethodology in chapter 6. The Sub Catchment Unit review has been carried out forall areas with a FPS regardless of the information held. All areas with a FPS wereupgraded to a Medium category to ensure that further assessment of flooding in thearea is made. These areas were upgraded in part due to the previously identifiedflood risk in the area but also due to the ongoing maintenance that may be requiredto retain scheme effectiveness.
12.2.3. Initial screening – Infrastructure
Required for Low and Very Low Sub Catchment Unit categories
An assessment on infrastructure was initially made to identify any area containingthese features (energy production sites, oil extraction and refineries,telecommunications features) within the floodplain. Due to the lack of accompanyinginformation held on these features (i.e. resilience and vulnerability to flooding), theseSub Catchment Units will remain as ‘Low’ or ‘Very Low’ categories until the assetowners can provide evidence to prove that these Sub Catchment Units should indeedbe included for further analysis. A workshop was held with asset owners and no‘important’ assets were identified outside of PVAs.
12.2.4. Historic Data Review
Required for Low Sub Catchment Unit category
SEPA has gathered information on historic flood events from Local Authorities,Scottish Water, Network Rail and SEPA data held internally. An exercise was alsocarried out to collect historical flood event data from archived information. This datahas been collated and reviewed, as part of the review process the significance of theflood recorded has been determined. Significant flood events have been identifiedusing a scoring method that considers the impact, source and reliability of therecorded event.
This data has been used to identify the number of recorded flood events within eachSub Catchment Unit, the review identifies those areas which have not been pickedup by the future floods assessment but have records of flooding. Assessment of thesource, significance, spatial information and date of the flood record will be madebefore increasing the category of the Sub Catchment Unit. Based on this data a SubCatchment Unit category can be upgraded from Low to Medium
12.2.5. Catchment Characteristics
Required for Medium and High Sub Catchment Unit categories
Catchment Characteristics have been taken into consideration within the gridassessment during the generation of hazard outlines namely within the hydrologicinflows for Fluvial and Pluvial extents calculated from FEH15 parameters. In additionSEPA has undertaken a separate study to identify the hydrological characteristics ofa Sub Catchment Unit and the Morphological Pressures within each of these areas.
The output of this study has been used to inform the decision making process withinthe Sub Catchment Unit review.
15Flood Estimation Handbook

29
12.2.6. Supplementary Strategic Information
Required for Medium and High Sub Catchment Unit categories
There is a large amount of data held within the NFRA and which contribute to theoverall assessment. The detail within these projects has been utilised within thesupplementary strategic information review.
The data used within this assessment includes
categorisation of flood defences and the requirement to maintain thesedefences
flood warning systems currently in place the financial cost of flooding based on Human Health (A) and Economic
Activity (A) including impact of flood defences and flood warning areas a full breakdown of the grid assessment information on future development within flood risk areas
The review for a particular Sub Catchment depends on the issues within the SubCatchment Unit based on any areas of uncertainty and sources of flooding. Areashave been upgraded or downgraded based on the supplementary information. Thisreview has been used in conjunction with the catchment characteristics information todetermine if a) the flood risk has been underestimated within the grid output and b) ifthis area is likely to have a significant flood risk in the future.
12.2.7. Single Receptor Review
Required for all Sub Catchment Unit categories above Very Low
Sub Catchment Units which have a large value based primarily from one receptortype may be falsely categorised due to uncertainties or characteristics of the data.For example a road that is in the floodplain for a number of kilometres may provide alarge Sub Catchment Unit value although the real impact of the road closure is onlyfelt once (see Figure 1)
Figure 1. Illustrates a road that has been identified multiple times in the gridassessment, which may exaggerate the total score of the Sub Catchment Unit to whichit belongs.

30
The single receptor review is intended to identify any areas thathave a large value based on one receptor and whether uncertainties which havecome from the receptor data or hazard data have raised the Sub Catchment Unitcategory falsely.
The single receptor review has been carried out for Sub Catchment Units whereCultural Heritage, Economic Activity (B) - Transport or Environment receptorscontributed to 30% or more of the Sub Catchment Unit value. The reason for this isthat these three receptor datasets and grid outputs have the most uncertainty isrelated to them.
Any areas which show Sub Catchment Unit values based on Human Health A or Bprimarily have been left as is - no additional information can be obtained to influencea manual review. This is also the case for Economic Activity (A) – Businesses andEconomic Activity (C) – Agriculture.
Economic Activity (B) -Transport Review:
Sub Catchment Units which are shown to have a value based largely from the impactto transport have been reviewed and may be downgraded by up to three categories
based on the source of flooding and presence of alternative routes. The rationalebehind this is that the grid assessment may overestimate the impact of flooding. Forexample a road closure may have the same impact if it is closed in one location orfive locations depending on the number / presence of detours. In addition a knownarea of uncertainty within the assessment occurs at structures. Only a simpleassessment of this risk can be made at this stage as further local information wouldbe required however, at present, all road bridges have been identified as a potentialrisk although this may not be a true reflection of the actual risk to transport routes.Any Sub Catchment Units that have been downgraded to below medium have beenreviewed by Transport Scotland and in those cases where the receptor is actuallyvulnerable to the impacts of flooding the Sub Catchment Unit has been upgradedback to medium.
Environment Review:
Sub Catchment Units that are shown to have a value based largely from the impactto environmental designations may be downgraded by up to two categories, basedon the source of flooding, the location and the designation. This is due to the broadscale information contained within the environmental designation and the fact that thegrid assessment uses the highest vulnerability designation to derive the scores. Theassessment considers if the designation is likely to occur within the floodplain. Forexample, some areas are designated due to features only found in upland areas, andothers where the same areas are designated more than once (i.e. as an SPA andalso an SSSI). Any Sub Catchment Units that have been downgraded to belowmedium were reviewed by Scottish Natural Heritage and where the receptor isconsidered as actually being vulnerable to the impacts of flooding, the SubCatchment Unit was upgraded back to medium.
Cultural Heritage Review:
Sub Catchment Units which are shown to have a value based largely from the impactto Cultural Heritage were downgraded by up to two categories, based on the sourceof flooding, the location and the designation. Any Sub Catchment Units that havebeen downgraded to below medium were reviewed by Historic Scotland and where

31
the receptor is actually vulnerable to the impacts of flooding, theSub Catchment Unit was upgraded back to medium.
12.2.8. Supplementary Local Information
This is the final section of the Sub Catchment Unit review process. The NFRAprovides a strategic assessment of flood risk within Scotland. The assessment hasbeen carried out using reliable data that is available and readily derivable. Whilst theNFRA provides a good indication of the large scale flooding issues faced withinScotland it may miss some of the local issues which may have a significant impact.Historic records from Local Authorities have been collected and used to inform theSub Catchment Unit categories however local flooding issues may contribute toincrease the overall risk.
Supplementary information was therefore sought on local issues which may have notbeen included within the NFRA initially, and could increase flood risk. Data wasprovided by Local Authorities and includes:
the presence of restrictive structures Further records of significant flooding Sewerage system flooding – identification of poor sewerage capacity Details of any planned Flood Protection Schemes Planned future developments within or close to the floodplain
Based on the above review the final categorisation of Sub Catchment Unit areaswere generated. All Sub Catchment Units categorised as Very High, High or Mediumcategories were included as PVAs.

32
Appendix 1.
Human Health (B) Value Categories
Community ServiceRisk
CategoryRisk
ScoreReasoning
Hospitals/AmbulanceDepots *
VH 4
Potential for large number of peopleto be affected, highly vulnerablepopulation, 24 hour occupation ofbuilding, required in the case of anemergency
Residential Homes(Care/Nursing/Elderly)**
H 3
Potential for large number of peopleto be affected, high number ofvulnerable people located inproperty with buildings having 24hour occupation
Education Facilities(Schools, Nurseries,Universities)**
H 3
Potential for large number of peopleto be affected, high level ofcommunity disruption if buildingclosure occurs, some propertiesmay have 24 hour occupation (i.e.boarding schools, halls ofresidence)
WWTWs, WaterPumping Stations
M 2
Potential to affect large population ifsite affected by flooding. ScottishWater advised these facilities shouldnot be ‘H’ or ‘VH’ and PPS2516
supports this.
Police Stations** M 2
Potential for emergency respondersto be affected, facility is well placedand better prepared foremergencies
Health Centres/Clinics** M 2Potential to cause relatively highlevels of disruption to a number ofpeople
Fire Stations** M 2
Potential for emergency respondersto be affected, well placed to dealwith flooding (vehicles able to passthrough flood water)
GPs/Dental Surgeries** L 1Low level community disruption apotential
Post Offices** L 1Low level community disruption apotential
Pharmacies** L 1Low level community disruption apotential
*To be rated ‘VH’ until further information (Hospital Catchments) is made available from ScottishGovernment.
** Value score increased by a factor of one where located in a remote area
16Policy Planning Statement 25 (Development and Flood Risk)
33
Appendix 2.
Estimated Land Values
Category 1 Category 2 Category 3 Value Value Assumptions
Agriculturalareas
Arable landNon-irrigatedarable land
MediumCropping land - generally for sale at prices between £4,500 and£6,000/acre
Agriculturalareas
Arable landPermanentlyirrigated land
MediumGiven that it's permanently irrigated, assumption this is at least asvaluable as non-irrigated land.
Agriculturalareas
Permanentcrops
Fruit trees andberry plantations
MediumAssume 'specialist cropping' for which farm incomes are similar to thosefor specialist and general cereal farms.
Agriculturalareas
Pastures Pastures Low
Combination of dairy (very valuable but not much of it in Scotland) andother low ground livestock (much lower value that arable farms) -permanent and arable/grass land usually retails for between £2,500 and£3,500/acre.
Agriculturalareas
Heterogeneous agriculturalareas
Annual cropsassociated withpermanent crops
Medium Crops are all high
Agriculturalareas
Heterogeneous agriculturalareas
Complexcultivationpatterns
LowIf in the Western Isles then value likely to be low but have put 'medium' incase it incorporates a lot of proper productive arable ground
Agriculturalareas
Heterogeneous agriculturalareas
Land principallyoccupied byagriculture, withsignificant areasof naturalvegetation
Very Low Low if lots of natural vegetation
Agriculturalareas
Heterogeneous agriculturalareas
Agro-forestryareas
LowNot sure about this - does it include biomass plantations? If so thatwould increase the value but given that there isn't much of this inScotland then on average would probably be medium.
Forest and seminatural areas
ForestsBroad-leavedforest
Very LowForestry land values (for whatever purpose) are almost always<£1,000/acre so low when compared to the above categories.
Forest and seminatural areas
Forests Coniferous forest Very LowForestry land values (for whatever purpose) are almost always<£1,000/acre so low when compared to the above categories.
Forest and seminatural areas
Forests Mixed forest Very LowForestry land values (for whatever purpose) are almost always<£1,000/acre so low when compared to the above categories.
Forest and seminatural areas
Scrub and/orherbaceousvegetationassociations
Naturalgrasslands
Very Low
Very low.
Forest and seminatural areas
Scrub and/orherbaceousvegetationassociations
Moors andheathland
Very Low
Forest and seminatural areas
Scrub and/orherbaceousvegetationassociations
Sclerophyllousvegetation
Very Low
Forest and seminatural areas
Scrub and/orherbaceousvegetationassociations
Transitionalwoodland-shrub
Very Low
Forest and seminatural areas
Open spaceswith little or novegetation
Sparselyvegetated areas
Very Low
Forest and seminatural areas
Open spaceswith little or novegetation
Burnt areas Very Low Could be moorland - but still usually valued at <£1,000 acre.
34
Appendix 3.
Receptor Datasets
Risk Receptor Element Indicator Dataset Owner
Human Health (A)People
Exposure Number of People OS MasterMap Addresspoint Ordnance Survey
Vulnerability Susceptible Social Groups (SFVI score) Scottish Flood Vulnerability Index (SFVI) SEPA
Human Health (B)Community
ExposureSchools/Hospitals/Fire Stations/Police/PostOffices/Services(WWTW/Water Pumping Facilities) withinHazard (y/n)
OS Points of Interest Ordnance Survey
Value Importance of Community Service OS Points of Interest Ordnance Survey
Economic Activity (A)Businesses
Exposure Number of Non Residential Properties OS Points of Interest Ordnance Survey
ValueWeighted Average Annual Damage - based on bulkcategories and average floor space as per MCM approach
OS Points of Interest Ordnance Survey
Economic Activity (B)Transport
Exposure Rail/Road/Airport affected (Y/N) OS Meridian 2/OS MM ITN/OS Strategi Ordnance Survey
Vulnerability Urban/Rural location (Road and Rail only) Urban/Rural Classification (2010) Scottish Government
Value Classification of Road/Type of Transport OS Meridian 2 Ordnance Survey
Economic Activity (C)Agricultural
Exposure Agricultural Land affected (Y/N) CORINE Land Cover Map EEA
Value Land ValueInformation supplied by SEPA's EnvironmentalEconomist on Land Value
SEPA
Environment
Exposure Designated Land affected (Y/N) SACs, SPAs, SSSIs SNH
Vulnerability Species/Habitat type Information from ERRWG* SEPA
Vulnerability Propensity to adapt to change Information from ERRWG* SEPA
Cultural Heritage
Exposure Cultural Sites (Y/N)Listed Buildings, Scheduled Monuments, UNESCOWHSs, Gardens and Designed Landscapes
Historic Scotland
Value Importance of Asset (Local to International)Listed Buildings, Scheduled Monuments, UNESCOWHSs, Gardens and Designed Landscapes
SEPA
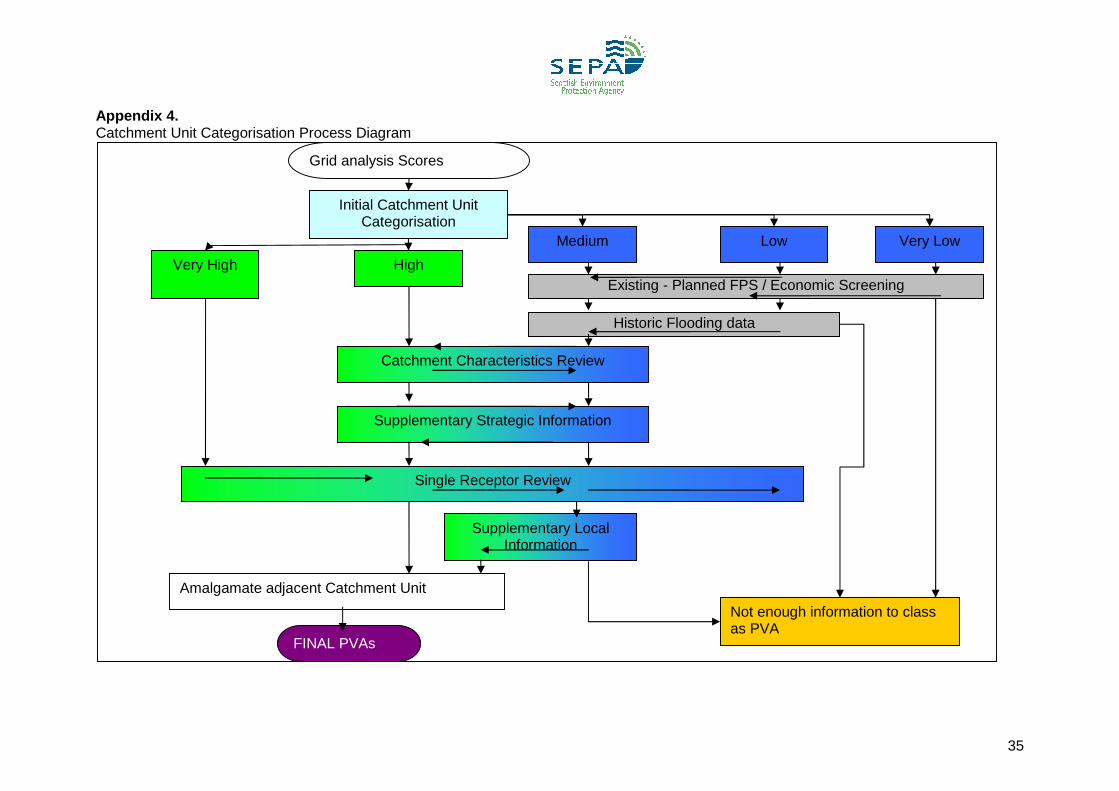
35
Appendix 4.Catchment Unit Categorisation Process Diagram
Amalgamate adjacent Catchment Unit
Single Receptor Review
Supplementary Strategic Information
Catchment Characteristics Review
Grid analysis Scores
FINAL PVAs
Initial Catchment UnitCategorisation
Very High High
Medium
Historic Flooding data
Supplementary LocalInformation
Not enough information to classas PVA
Existing - Planned FPS / Economic Screening
Low Very Low