Meditation:Pathway to Well Being. Well-Being Physical Mental Spiritual.
September 2017
National Financial Well-Being Survey Public Use File Codebook

2 NATIONAL FINANCIAL WELL-BEING SURVEY: PUBLIC USE FILE CODEBOOK
Table of contents Table of contents......................................................................................................... 2
1. Introduction ........................................................................................................... 3
2. Variable List .......................................................................................................... 4
3. Data Dictionary ................................................................................................... 16
4. Variable Summaries ........................................................................................... 82

3 NATIONAL FINANCIAL WELL-BEING SURVEY: PUBLIC USE FILE CODEBOOK
1. Introduction This document is the Codebook for the Consumer Financial Protection Bureau’s (CFPB)
National Financial Well-Being Survey Public Use File (PUF).1 The PUF is a dataset containing
(1) data collected in the National Financial Well-Being Survey, (2) data about members of the
GfK KnowledgePanel collected prior to the survey, and (3) data on poverty levels in respondents’
counties of residence. Section 2 of the Codebook lists the variables found in the PUF. Section 3 is
a data dictionary that presents the variable names, variable labels, value labels, who was asked
each survey item (“Base”), and unweighted frequencies and percentages of responses. Section 4
provides summary statistics for variables in the PUF.
See the companion Public Use File User’s Guide2 for a description of the survey, instructions on
how to use the PUF, documentation of variables included in the PUF that were created for
analysis or otherwise modified from the form in which they were originally collected during the
survey, and the survey instrument.
1 The research team responsible for developing and conducting the National Financial Well-Being Survey, subsequent data analyses and reports, and the Public Use File and related documentation, included CFPB staff as well as a team of research contractors led by Abt Associates and including University of Wisconsin-Madison’s Center for Financial Security and GfK. The research was funded under a competitive award; contract number TPDCFPBPA130014.
2 The PUF User’s Guide is available at: consumerfinance.gov/data-research/financial-well-being-survey-data/
4 NATIONAL FINANCIAL WELL-BEING SURVEY: PUBLIC USE FILE CODEBOOK
2. Variable List In total, there are 217 variables in the public use dataset (Public Use File or PUF). In some cases,
it was necessary to shorten variable labels due to software file format limitations. Please consult
the survey instrument in Appendix A of the CFPB National Financial Well-Being Survey Public
Use File User’s Guide to see the exact question text.
Table 1, below, provides an overview of each variable contained in the PUF, along with a
descriptive label. The variable source column identifies the source of each variable. Within the
source column, the parenthetical suffix modified indicates that the item was modified from the
form in which it was originally collected during the survey. Details on these modifications are
given in Section 4.3 of the User’s Guide.
Analysis variables were created post hoc by the research team, and details on their
coding are provided in the User’s Guide.
Frame data are variables describing the survey’s sampling frame.
ID variable is an integer uniquely identifying each respondent.
5 NATIONAL FINANCIAL WELL-BEING SURVEY: PUBLIC USE FILE CODEBOOK
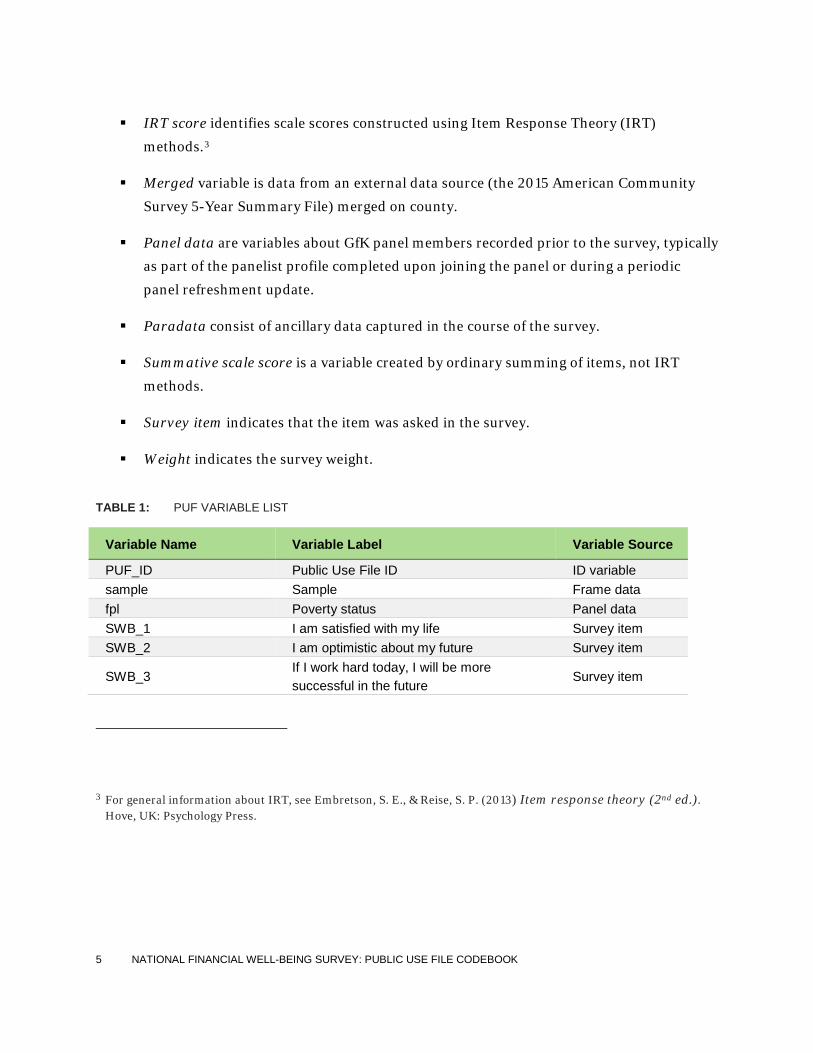
IRT score identifies scale scores constructed using Item Response Theory (IRT)
methods.3
Merged variable is data from an external data source (the 2015 American Community
Survey 5-Year Summary File) merged on county.
Panel data are variables about GfK panel members recorded prior to the survey, typically
as part of the panelist profile completed upon joining the panel or during a periodic
panel refreshment update.
Paradata consist of ancillary data captured in the course of the survey.
Summative scale score is a variable created by ordinary summing of items, not IRT
methods.
Survey item indicates that the item was asked in the survey.
Weight indicates the survey weight.
TABLE 1: PUF VARIABLE LIST
Variable Name Variable Label Variable Source
PUF_ID Public Use File ID ID variable sample Sample Frame data fpl Poverty status Panel data SWB_1 I am satisfied with my life Survey item SWB_2 I am optimistic about my future Survey item
SWB_3 If I work hard today, I will be more successful in the future
Survey item
3 For general information about IRT, see Embretson, S. E., & Reise, S. P. (2013) Item response theory (2nd ed.). Hove, UK: Psychology Press.

6 NATIONAL FINANCIAL WELL-BEING SURVEY: PUBLIC USE FILE CODEBOOK
Variable Name Variable Label Variable Source
FWBscore Financial well-being scale score4 IRT score
FWB1_1 I could handle a major unexpected expense
Survey item
FWB1_2 I am securing my financial future Survey item
FWB1_3 Because of my money situation...I will never have the things I want in life
Survey item
FWB1_4 I can enjoy life because of the way I’m managing my money
Survey item
FWB1_5 I am just getting by financially Survey item
FWB1_6 I am concerned that the money I have or will save won’t last
Survey item
FWB2_1 Giving a gift...would put a strain on my finances for the month
Survey item
FWB2_2 I have money left over at the end of the month
Survey item
FWB2_3 I am behind with my finances Survey item FWB2_4 My finances control my life Survey item FSscore Financial skill scale score5 IRT score
FS1_1 I know how to get myself to follow through on my financial intentions
Survey item
FS1_2 I know where to find the advice I need to make decisions involving money
Survey item
FS1_3 I know how to make complex financial decisions
Survey item
FS1_4 I am able to make good financial decisions that are new to me
Survey item
FS1_5 I am able to recognize a good financial investment
Survey item
4 For more information about this scale, see CFPB Financial Well-Being Scale: Scale development technical report, available at: consumerfinance.gov/data-research/research-reports/financial-well-being-technical-report/
5 The CFPB Financial Skill Scale is an unpublished IRT-based scale developed in a prior phase of the CFPB’s financial well-being research project.
7 NATIONAL FINANCIAL WELL-BEING SURVEY: PUBLIC USE FILE CODEBOOK
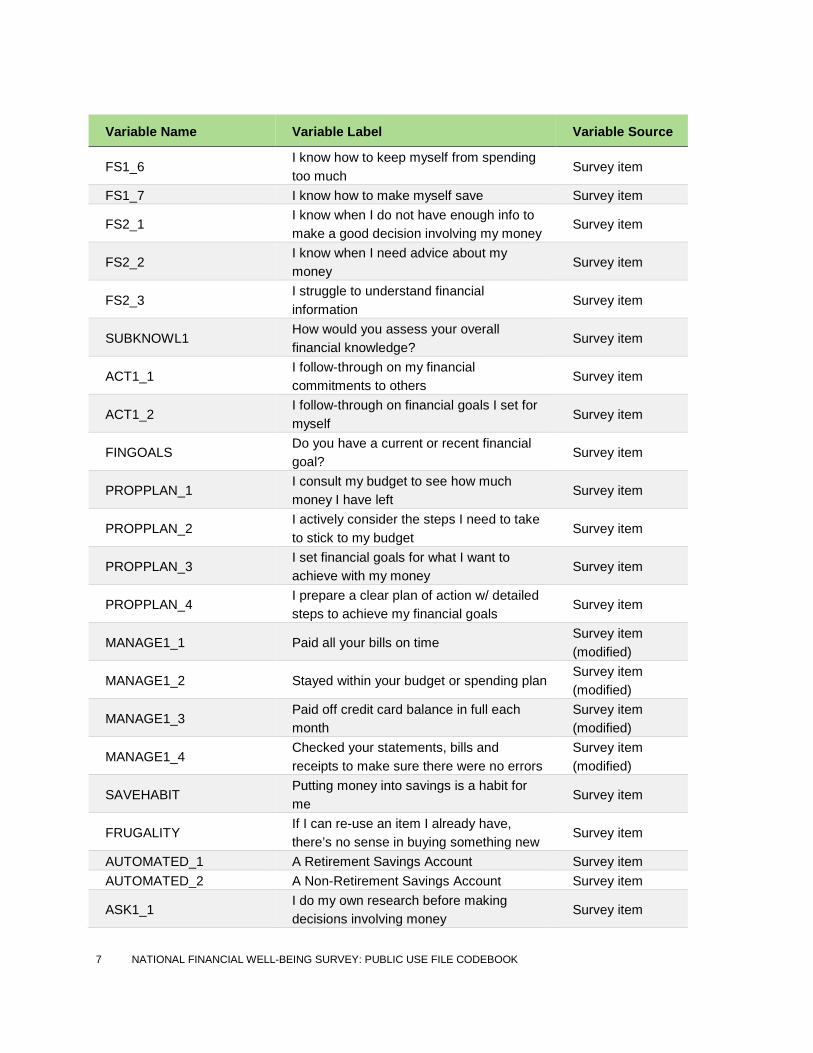
Variable Name Variable Label Variable Source
FS1_6 I know how to keep myself from spending too much
Survey item
FS1_7 I know how to make myself save Survey item
FS2_1 I know when I do not have enough info to make a good decision involving my money
Survey item
FS2_2 I know when I need advice about my money
Survey item
FS2_3 I struggle to understand financial information
Survey item
SUBKNOWL1 How would you assess your overall financial knowledge?
Survey item
ACT1_1 I follow-through on my financial commitments to others
Survey item
ACT1_2 I follow-through on financial goals I set for myself
Survey item
FINGOALS Do you have a current or recent financial goal?
Survey item
PROPPLAN_1 I consult my budget to see how much money I have left
Survey item
PROPPLAN_2 I actively consider the steps I need to take to stick to my budget
Survey item
PROPPLAN_3 I set financial goals for what I want to achieve with my money
Survey item
PROPPLAN_4 I prepare a clear plan of action w/ detailed steps to achieve my financial goals
Survey item
MANAGE1_1 Paid all your bills on time Survey item (modified)
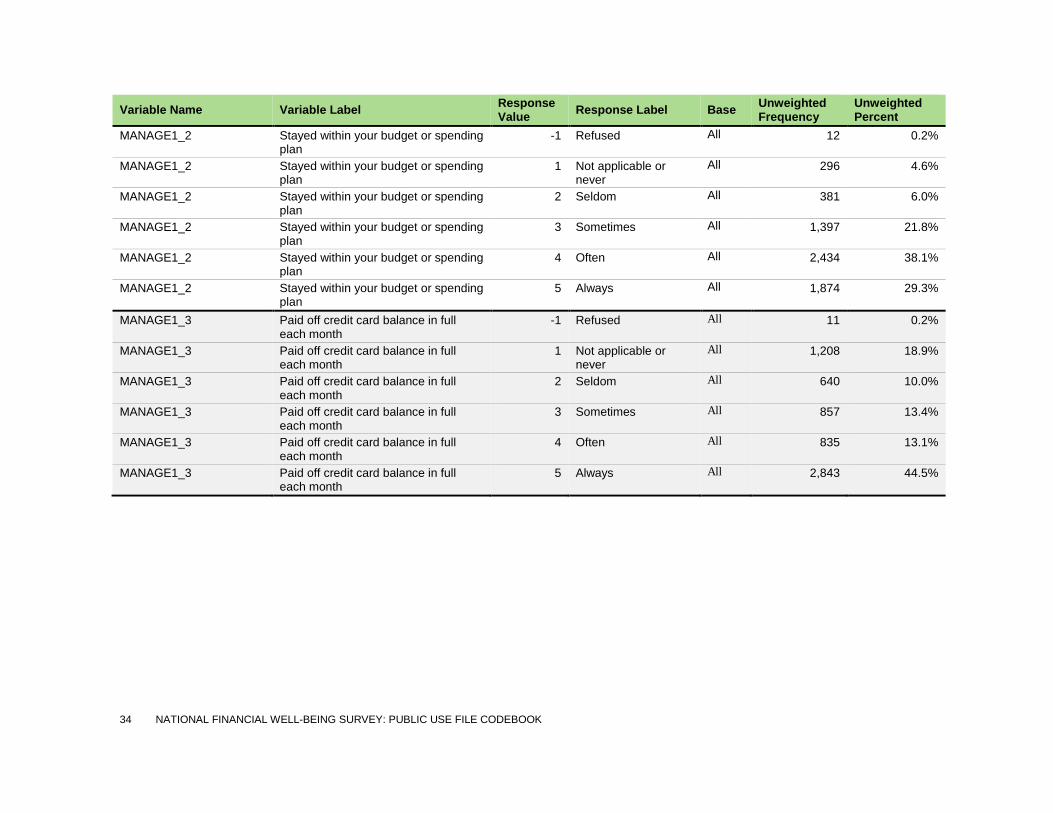
MANAGE1_2 Stayed within your budget or spending plan Survey item (modified)
MANAGE1_3 Paid off credit card balance in full each month
Survey item (modified)
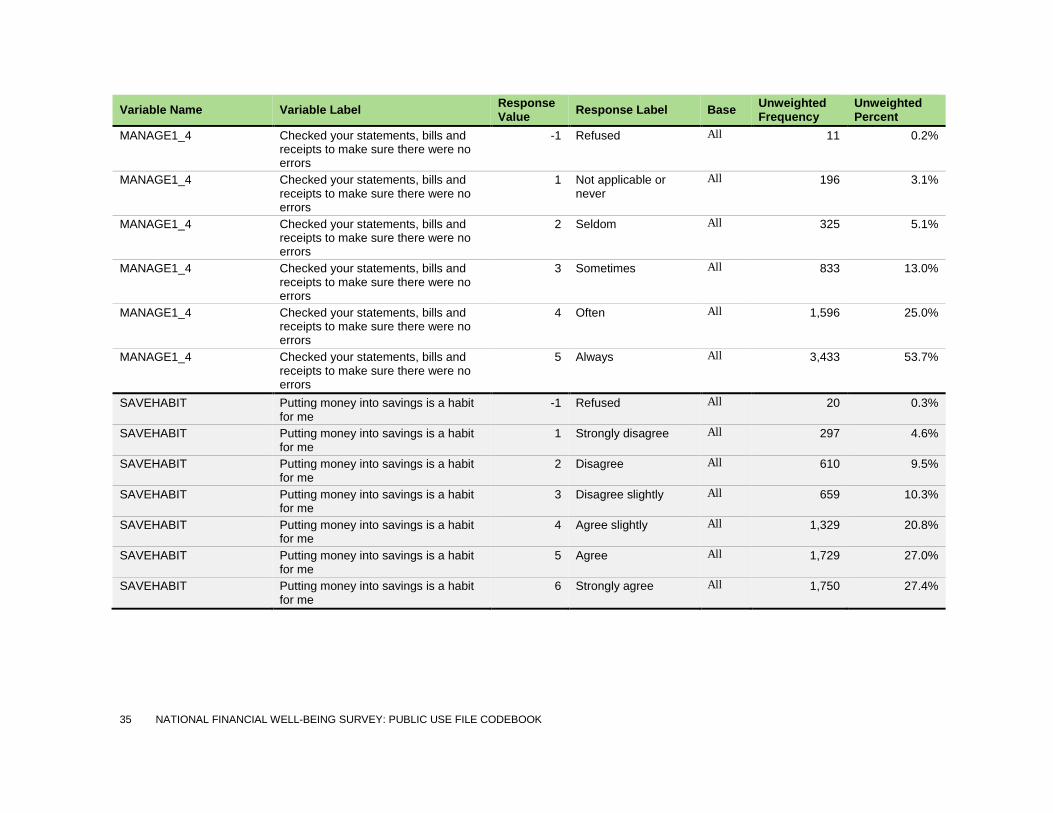
MANAGE1_4 Checked your statements, bills and receipts to make sure there were no errors
Survey item (modified)
SAVEHABIT Putting money into savings is a habit for me
Survey item
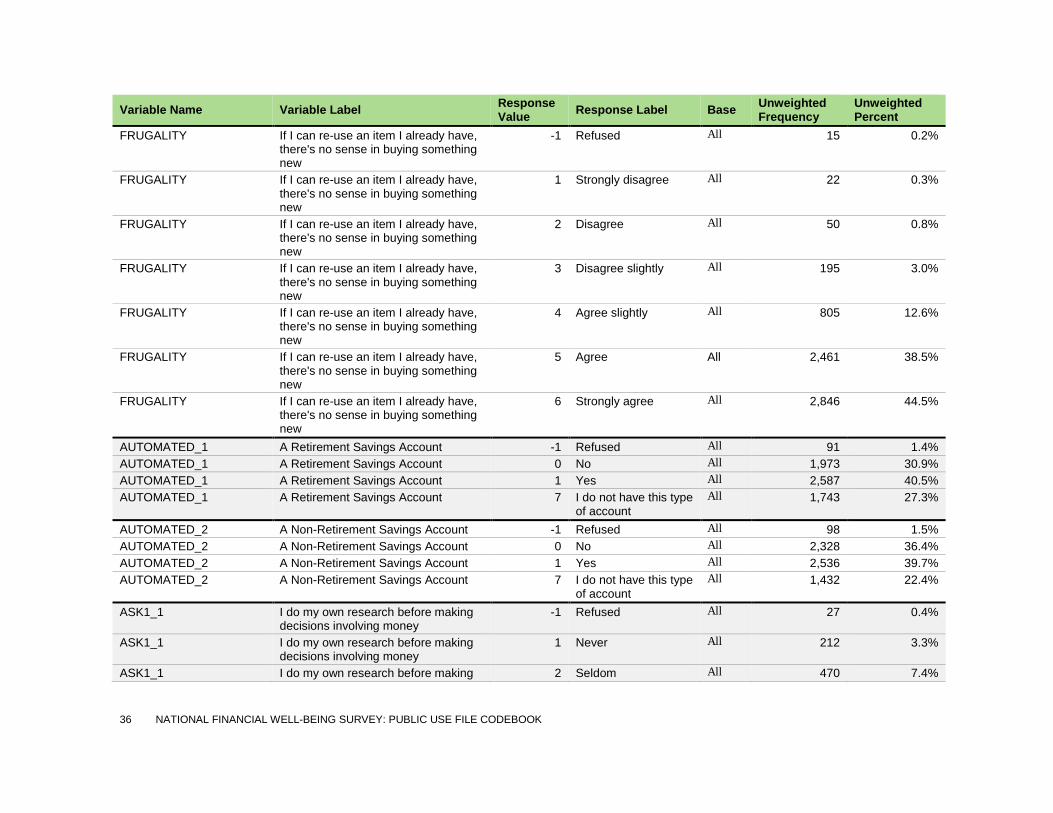
FRUGALITY If I can re-use an item I already have, there’s no sense in buying something new
Survey item
AUTOMATED_1 A Retirement Savings Account Survey item AUTOMATED_2 A Non-Retirement Savings Account Survey item
ASK1_1 I do my own research before making decisions involving money
Survey item

8 NATIONAL FINANCIAL WELL-BEING SURVEY: PUBLIC USE FILE CODEBOOK
Variable Name Variable Label Variable Source
ASK1_2 I ask other people their opinions before making decisions involving money
Survey item
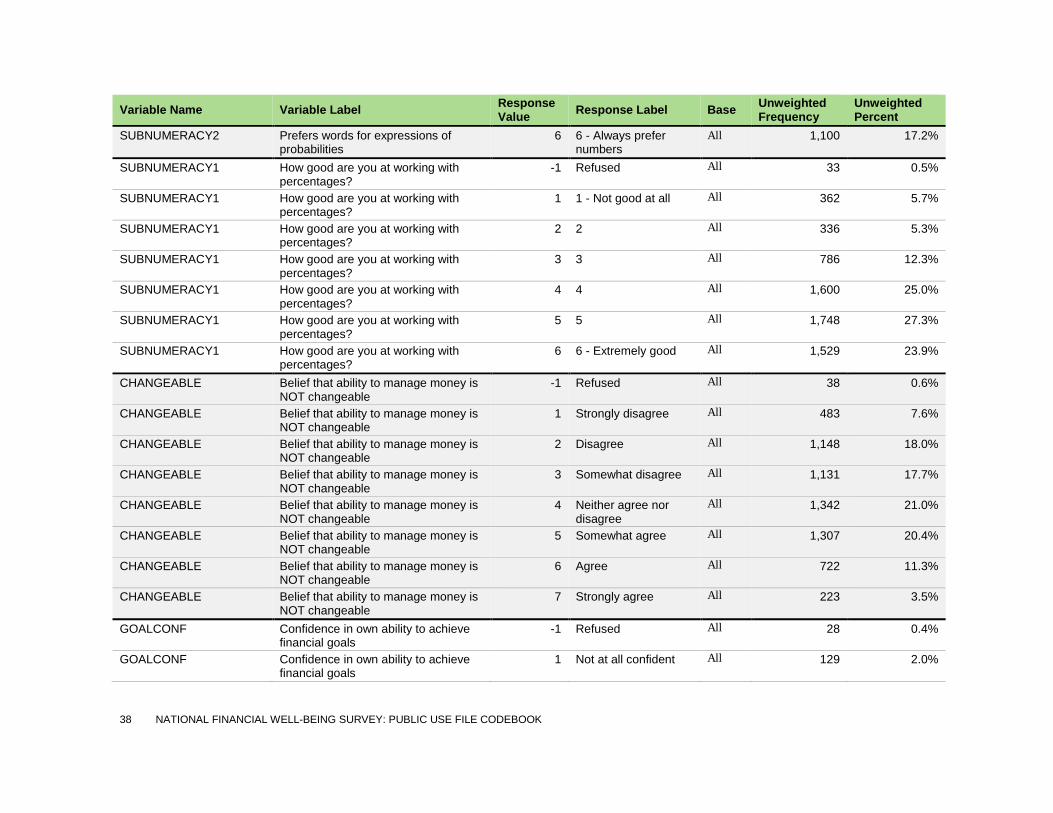
SUBNUMERACY2 Prefers words for expressions of probabilities
Survey item
SUBNUMERACY1 How good are you at working with percentages?
Survey item
CHANGEABLE Belief that ability to manage money is NOT changeable
Survey item
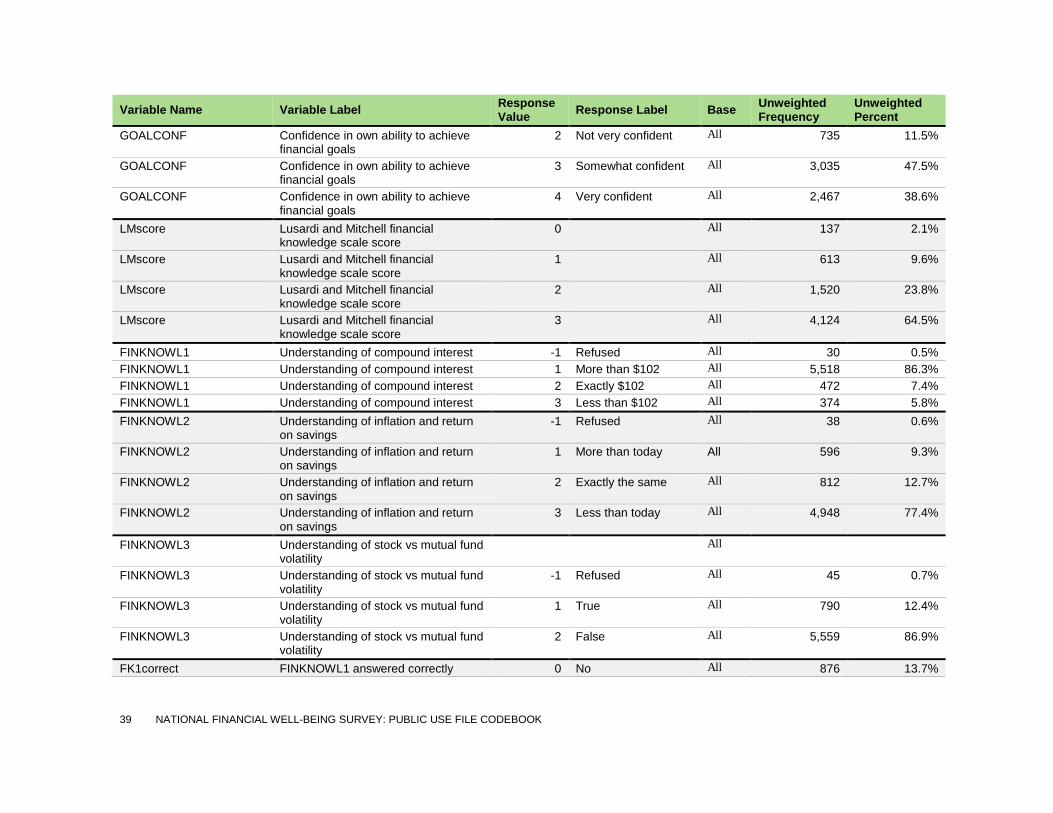
GOALCONF Confidence in own ability to achieve financial goals
Survey item
LMscore Lusardi and Mitchell financial knowledge scale score6
Summative scale score
FINKNOWL1 Understanding of compound interest Survey item
FINKNOWL2 Understanding of inflation and return on savings
Survey item
FINKNOWL3 Understanding of stock vs mutual fund volatility
Survey item
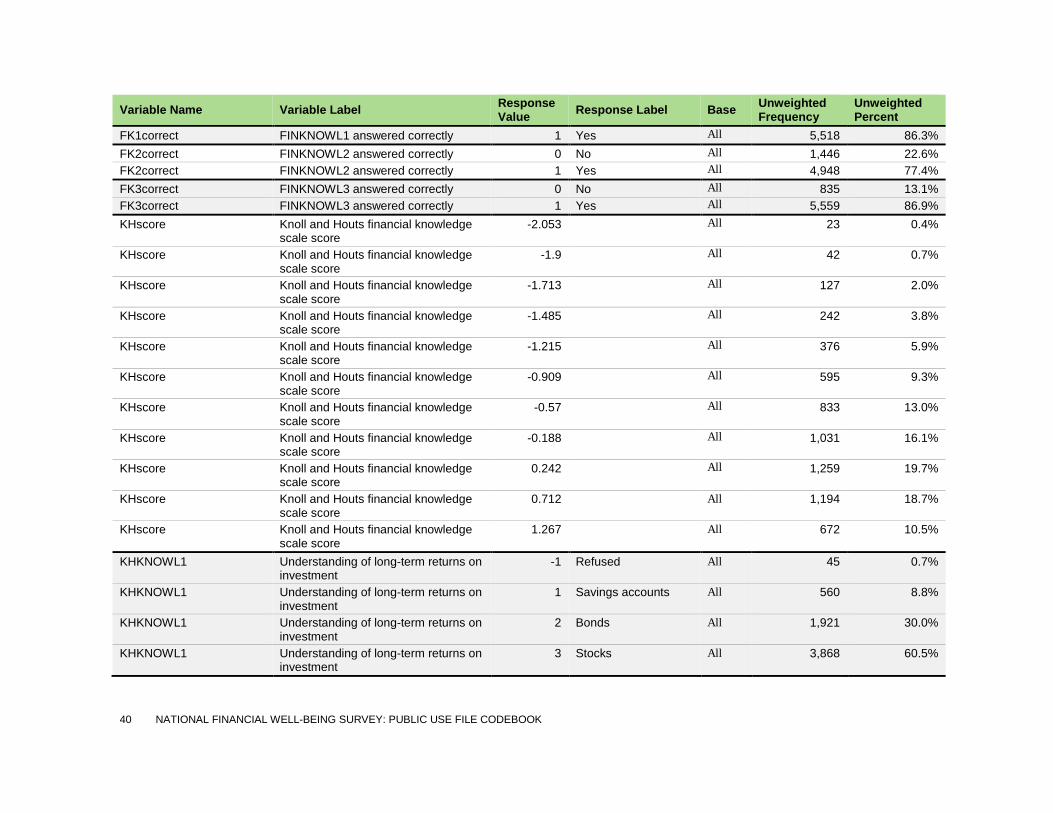
FK1correct FINKNOWL1 answered correctly Analysis variable FK2correct FINKNOWL2 answered correctly Analysis variable FK3correct FINKNOWL3 answered correctly Analysis variable
KHscore Knoll and Houts financial knowledge scale score7
IRT score8
KHKNOWL1 Understanding of long-term returns on Survey item
6 This is a summative scale score for a 3 item financial knowledge scale, presented in Lusardi, Annamaria and Olivia S. Mitchell. 2008. “Planning and Financial Literacy: How Do Women Fare?” NBER Working Paper No. 13750. National Bureau of Economic Research, Cambridge, MA.
7 This is a 10 item scale which is an unpublished short version of the financial knowledge scale described in Knoll, Melissa A. and Carrie R. Houts. 2012. “The Financial Knowledge Scale: An Application of Item Response Theory to the Assessment of Financial Literacy.” Journal of Consumer Affairs 46(3):381-410.
8 The IRT score was produced based on the number of items answered correctly using a look-up table which provides IRT-based scores that correspond to raw totals of items answered correctly.
9 NATIONAL FINANCIAL WELL-BEING SURVEY: PUBLIC USE FILE CODEBOOK
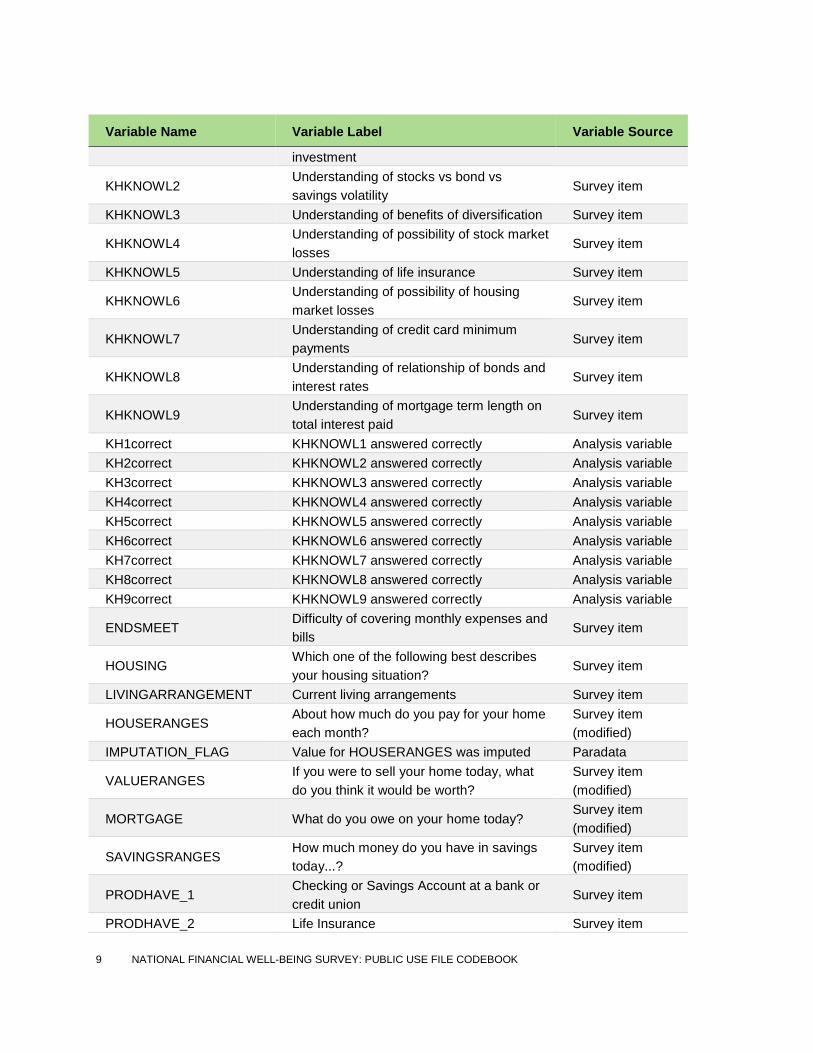
Variable Name Variable Label Variable Source
investment
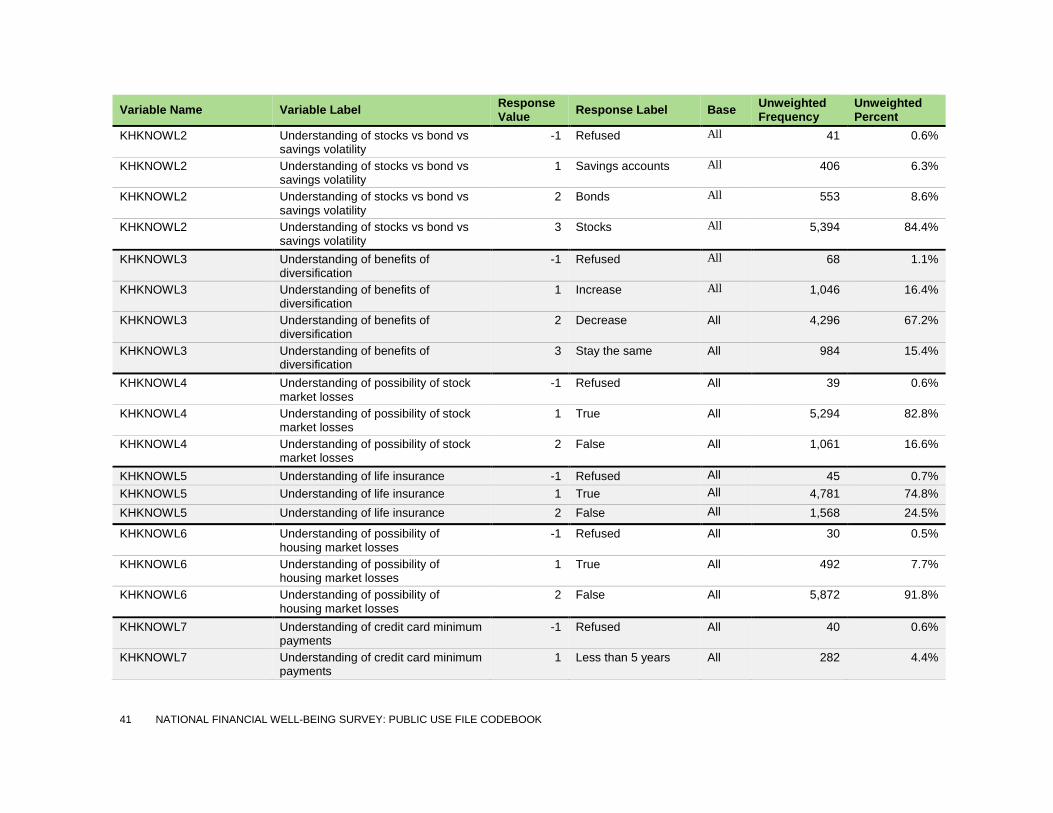
KHKNOWL2 Understanding of stocks vs bond vs savings volatility
Survey item
KHKNOWL3 Understanding of benefits of diversification Survey item
KHKNOWL4 Understanding of possibility of stock market losses
Survey item
KHKNOWL5 Understanding of life insurance Survey item
KHKNOWL6 Understanding of possibility of housing market losses
Survey item
KHKNOWL7 Understanding of credit card minimum payments
Survey item
KHKNOWL8 Understanding of relationship of bonds and interest rates
Survey item
KHKNOWL9 Understanding of mortgage term length on total interest paid
Survey item
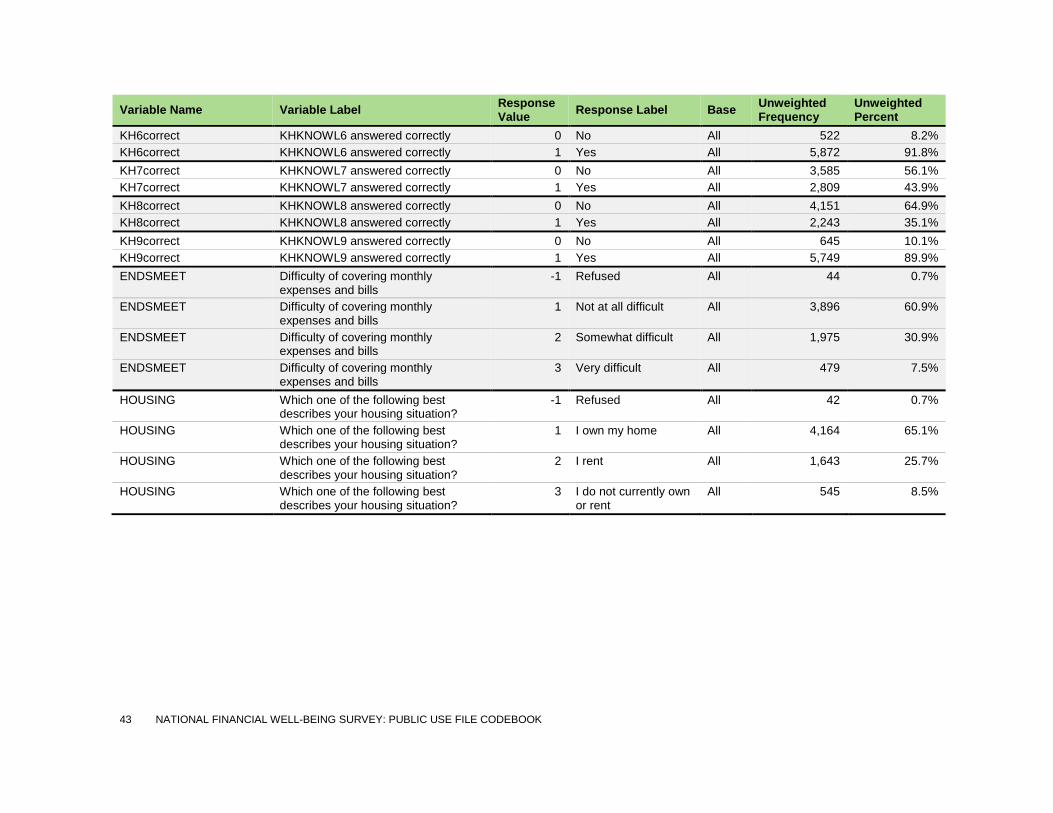
KH1correct KHKNOWL1 answered correctly Analysis variable KH2correct KHKNOWL2 answered correctly Analysis variable KH3correct KHKNOWL3 answered correctly Analysis variable KH4correct KHKNOWL4 answered correctly Analysis variable KH5correct KHKNOWL5 answered correctly Analysis variable KH6correct KHKNOWL6 answered correctly Analysis variable KH7correct KHKNOWL7 answered correctly Analysis variable KH8correct KHKNOWL8 answered correctly Analysis variable KH9correct KHKNOWL9 answered correctly Analysis variable
ENDSMEET Difficulty of covering monthly expenses and bills
Survey item
HOUSING Which one of the following best describes your housing situation?
Survey item
LIVINGARRANGEMENT Current living arrangements Survey item
HOUSERANGES About how much do you pay for your home each month?
Survey item (modified)
IMPUTATION_FLAG Value for HOUSERANGES was imputed Paradata
VALUERANGES If you were to sell your home today, what do you think it would be worth?
Survey item (modified)
MORTGAGE What do you owe on your home today? Survey item (modified)
SAVINGSRANGES How much money do you have in savings today...?
Survey item (modified)
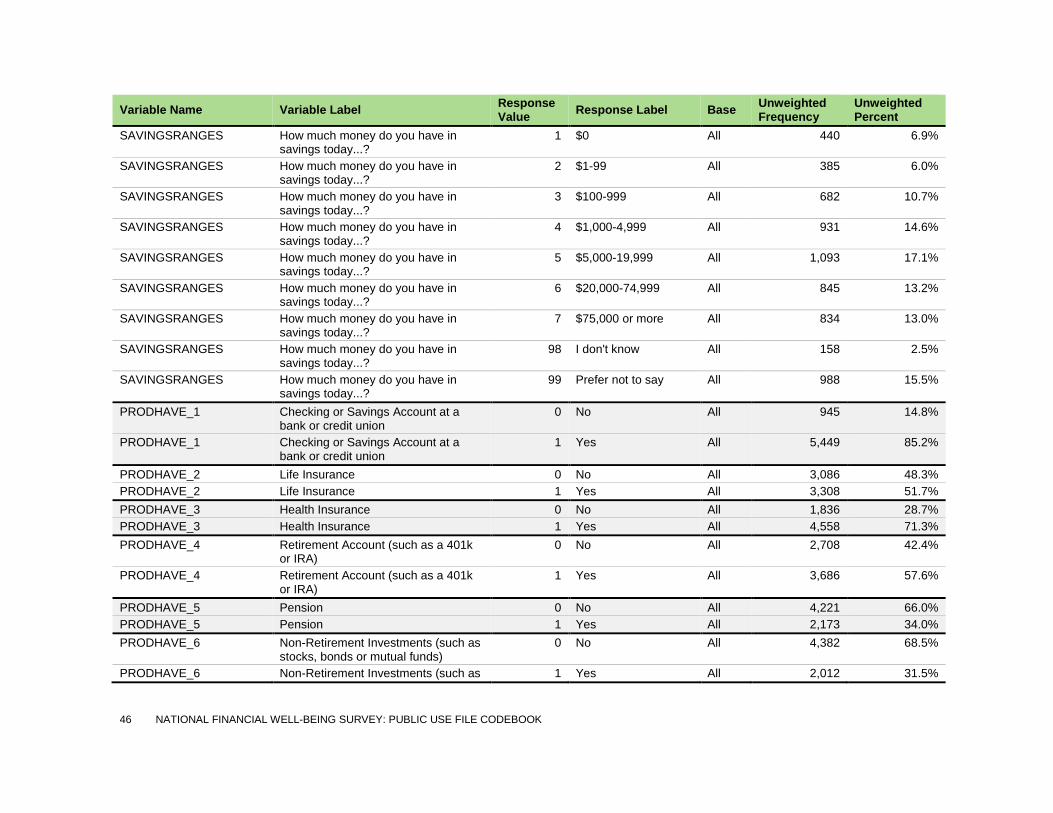
PRODHAVE_1 Checking or Savings Account at a bank or credit union
Survey item
PRODHAVE_2 Life Insurance Survey item
10 NATIONAL FINANCIAL WELL-BEING SURVEY: PUBLIC USE FILE CODEBOOK
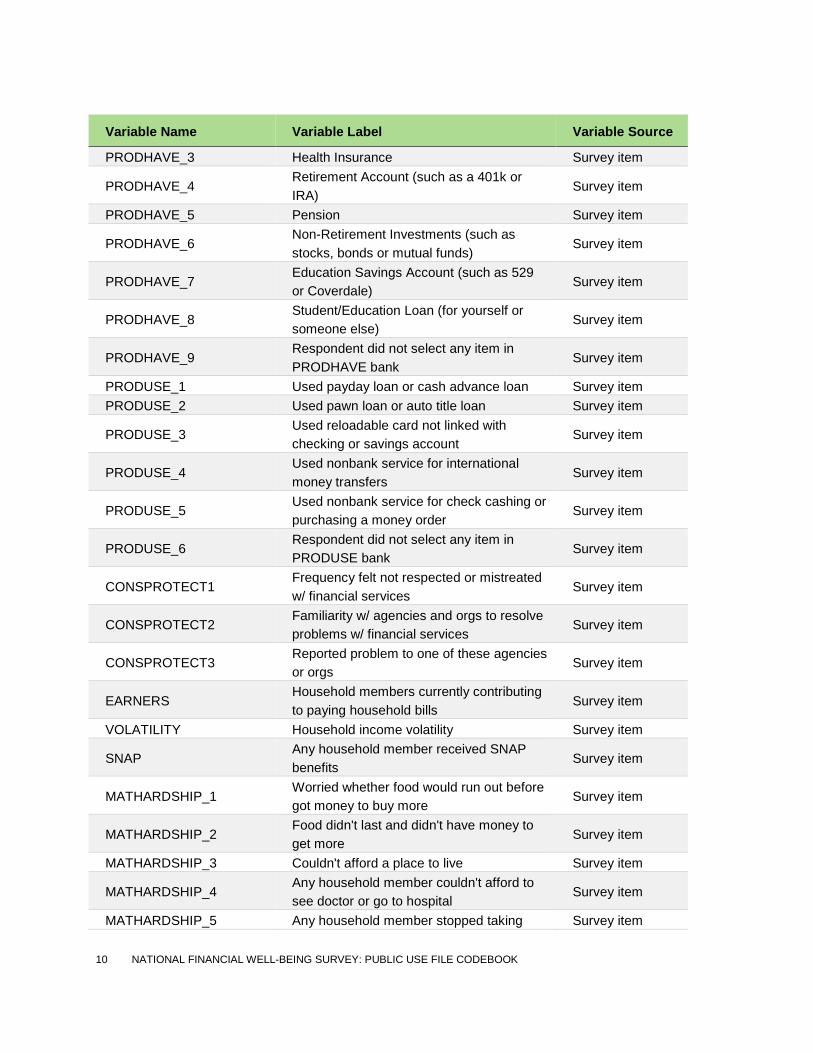
Variable Name Variable Label Variable Source
PRODHAVE_3 Health Insurance Survey item
PRODHAVE_4 Retirement Account (such as a 401k or IRA)
Survey item
PRODHAVE_5 Pension Survey item
PRODHAVE_6 Non-Retirement Investments (such as stocks, bonds or mutual funds)
Survey item
PRODHAVE_7 Education Savings Account (such as 529 or Coverdale)
Survey item
PRODHAVE_8 Student/Education Loan (for yourself or someone else)
Survey item
PRODHAVE_9 Respondent did not select any item in PRODHAVE bank
Survey item
PRODUSE_1 Used payday loan or cash advance loan Survey item PRODUSE_2 Used pawn loan or auto title loan Survey item
PRODUSE_3 Used reloadable card not linked with checking or savings account
Survey item
PRODUSE_4 Used nonbank service for international money transfers
Survey item
PRODUSE_5 Used nonbank service for check cashing or purchasing a money order
Survey item
PRODUSE_6 Respondent did not select any item in PRODUSE bank
Survey item
CONSPROTECT1 Frequency felt not respected or mistreated w/ financial services
Survey item
CONSPROTECT2 Familiarity w/ agencies and orgs to resolve problems w/ financial services
Survey item
CONSPROTECT3 Reported problem to one of these agencies or orgs
Survey item
EARNERS Household members currently contributing to paying household bills
Survey item
VOLATILITY Household income volatility Survey item
SNAP Any household member received SNAP benefits
Survey item
MATHARDSHIP_1 Worried whether food would run out before got money to buy more
Survey item
MATHARDSHIP_2 Food didn't last and didn't have money to get more
Survey item
MATHARDSHIP_3 Couldn't afford a place to live Survey item
MATHARDSHIP_4 Any household member couldn't afford to see doctor or go to hospital
Survey item
MATHARDSHIP_5 Any household member stopped taking Survey item

11 NATIONAL FINANCIAL WELL-BEING SURVEY: PUBLIC USE FILE CODEBOOK
Variable Name Variable Label Variable Source
medication or took less due to costs MATHARDSHIP_6 Utilities shut off due to non-payment Survey item
COLLECT Contacted by debt collector in past 12 months
Survey item
REJECTED_1 I applied for credit and was turned down Survey item
REJECTED_2 I did not apply for credit because I thought would be turned down
Survey item
ABSORBSHOCK Confidence in ability to raise $2,000 in 30 days
Survey item
BENEFITS_1 Health Insurance Survey item
BENEFITS_2 401(k) or Other Employer-Sponsored Retirement Savings Account
Survey item
BENEFITS_3 Defined-Benefit Pension Survey item
BENEFITS_4 Tuition Reimbursement and/or Student Debt Repayment
Survey item
BENEFITS_5 Work/Life Benefits Survey item
FRAUD2 Victim of financial fraud or attempted financial fraud in past 5 years
Survey item
COVERCOSTS Course of action if income did not cover living costs
Survey item
BORROW_1 My friends or family would lend me the money and expect me to repay them
Survey item
BORROW_2 My friends or family would give me the money with no expectation of repayment
Survey item
SHOCKS_1 Lost a job Survey item
SHOCKS_2 Work hours/pay reduced or business owned by self/HH mem had financial difficulty
Survey item
SHOCKS_3 Received a foreclosure notice Survey item SHOCKS_4 Had a major car or home repair Survey item SHOCKS_5 Had a health emergency Survey item SHOCKS_6 Got a divorce or separation Survey item SHOCKS_7 Added a child to the household Survey item
SHOCKS_8 Experienced the death of primary breadwinner
Survey item
SHOCKS_9 Received a large sum of money beyond normal income
Survey item
SHOCKS_10 Had a child start daycare or college Survey item
SHOCKS_11 Provided unexpected financial support to a family member or friend
Survey item
SHOCKS_12 Respondent did not select any item in Survey item

12 NATIONAL FINANCIAL WELL-BEING SURVEY: PUBLIC USE FILE CODEBOOK
Variable Name Variable Label Variable Source
SHOCKS bank
MANAGE2 Who in household makes financial decisions
Survey item
PAIDHELP Do you pay the person who helps take care of money matters in your household?
Survey item
HSLOC Where did you live at age 17? Survey item (modified)
PAREDUC Highest level of education by person/people who raised respondent
Survey item (modified)
FINSOC2_1 Discussed family financial matters with me Survey item
FINSOC2_2 Spoke to me about the importance of saving
Survey item
FINSOC2_3 Discussed how to establish a good credit rating
Survey item
FINSOC2_4 Taught me how to be a smart shopper Survey item
FINSOC2_5 Taught me that my actions determine my success in life
Survey item
FINSOC2_6 Provided me with a regular allowance Survey item FINSOC2_7 Provided me with a savings account Survey item
OBJNUMERACY1 Which of the following represents the biggest risk of getting a disease?
Survey item
ON2correct9 OBJNUMERACY2 answered correctly Analysis variable ON1correct OBJNUMERACY1 answered correctly Analysis variable
MATERIALISM_1 I admire people who own expensive homes, cars and clothes
Survey item
MATERIALISM_2 The things I own say a lot about how well I’m doing in life
Survey item
MATERIALISM_3 I like to own things that impress people Survey item CONNECT Psychological connectedness Survey item
9 This variable indicates if the respondent provided the correct answer to the question “In the Bingo Lottery, the chance of winning a $10 prize is 1%. What is your best guess about how many people will win a $10 prize if 1,000 people each buy a single ticket for the Bingo Lottery?”
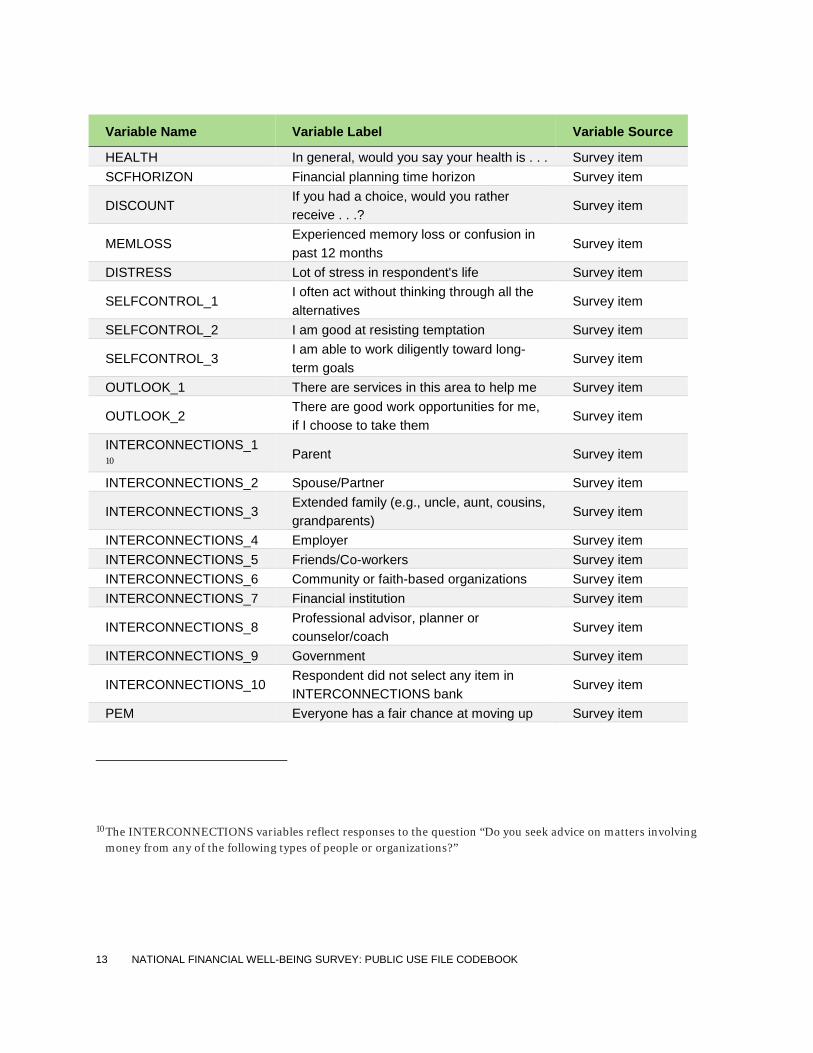
13 NATIONAL FINANCIAL WELL-BEING SURVEY: PUBLIC USE FILE CODEBOOK
Variable Name Variable Label Variable Source
HEALTH In general, would you say your health is . . . Survey item SCFHORIZON Financial planning time horizon Survey item
DISCOUNT If you had a choice, would you rather receive . . .?
Survey item
MEMLOSS Experienced memory loss or confusion in past 12 months
Survey item
DISTRESS Lot of stress in respondent's life Survey item
SELFCONTROL_1 I often act without thinking through all the alternatives
Survey item
SELFCONTROL_2 I am good at resisting temptation Survey item
SELFCONTROL_3 I am able to work diligently toward long-term goals
Survey item
OUTLOOK_1 There are services in this area to help me Survey item
OUTLOOK_2 There are good work opportunities for me, if I choose to take them
Survey item
INTERCONNECTIONS_110
Parent Survey item
INTERCONNECTIONS_2 Spouse/Partner Survey item
INTERCONNECTIONS_3 Extended family (e.g., uncle, aunt, cousins, grandparents)
Survey item
INTERCONNECTIONS_4 Employer Survey item INTERCONNECTIONS_5 Friends/Co-workers Survey item INTERCONNECTIONS_6 Community or faith-based organizations Survey item INTERCONNECTIONS_7 Financial institution Survey item
INTERCONNECTIONS_8 Professional advisor, planner or counselor/coach
Survey item
INTERCONNECTIONS_9 Government Survey item
INTERCONNECTIONS_10 Respondent did not select any item in INTERCONNECTIONS bank
Survey item
PEM Everyone has a fair chance at moving up Survey item
10The INTERCONNECTIONS variables reflect responses to the question “Do you seek advice on matters involving money from any of the following types of people or organizations?”

14 NATIONAL FINANCIAL WELL-BEING SURVEY: PUBLIC USE FILE CODEBOOK
Variable Name Variable Label Variable Source
the economic ladder
HOUSESAT How satisfied are you with the place you live currently?
Survey item
SOCSEC1 Have you started receiving social security retirement benefits?
Survey item
SOCSEC2 At what age did you begin receiving benefits?
Survey item (modified)
SOCSEC3 Age likely to start receiving Social Security retirement benefits
Survey item (modified)
LIFEEXPECT How likely do you believe it is that you will live beyond age 75?
Survey item
HHEDUC Highest level of education of all household members
Survey item (modified)
KIDS_NoChildren I have no children that I support financially Survey item
KIDS_1 Less than 7 years old Survey item (modified)
KIDS_2 7 to 12 years old Survey item (modified)
KIDS_3 13 to 17 years old Survey item (modified)
KIDS_4 More than 18 years old Survey item (modified)
EMPLOY Primary or only employment status Analysis variable EMPLOY1_1 Self-employed Survey item
EMPLOY1_2 Work full-time for an employer or the military
Survey item
EMPLOY1_3 Work part-time for an employer or the military
Survey item
EMPLOY1_4 Homemaker Survey item EMPLOY1_5 Full-time student Survey item
EMPLOY1_6 Permanently sick, disabled or unable to work
Survey item
EMPLOY1_7 Unemployed or temporarily laid off Survey item EMPLOY1_8 Retired Survey item
EMPLOY1_9 Respondent did not select any item in EMPLOY1 bank
Survey item
RETIRE Actual date of retirement vs date planned Survey item
MILITARY Current/former member of US Armed Forces or spouse/dependent of service member
Survey item (modified)
Military_Status Military status Analysis variable

15 NATIONAL FINANCIAL WELL-BEING SURVEY: PUBLIC USE FILE CODEBOOK
Variable Name Variable Label Variable Source
agecat Age Panel data generation Generation Panel data
PPEDUC Education (Highest Degree Received) Panel data (modified)
PPETHM Race / Ethnicity Panel data (modified)
PPGENDER Gender Panel data
PPHHSIZE Household Size Panel data (modified)
PPINCIMP Household Income Panel data (modified)
PPMARIT Marital Status Panel data (modified)
PPMSACAT MSA Status Panel data PPREG4 Census Region Panel data PPREG9 Census Division Panel data
PPT01 Presence of Household Members - Children 0-1
Panel data (modified)
PPT25 Presence of Household Members - Children 2-5
Panel data (modified)
PPT612 Presence of Household Members - Children 6-12
Panel data (modified)
PPT1317 Presence of Household Members - Children 13-17
Panel data (modified)
PPT18OV Presence of Household Members - Adults 18+
Panel data (modified)
PCTLT200FPL County pct less than 200% of poverty level (ACS 2015 5-year SF)
Merged (modified)
finalwt Final weight Weight
16 NATIONAL FINANCIAL WELL-BEING SURVEY: PUBLIC USE FILE CODEBOOK
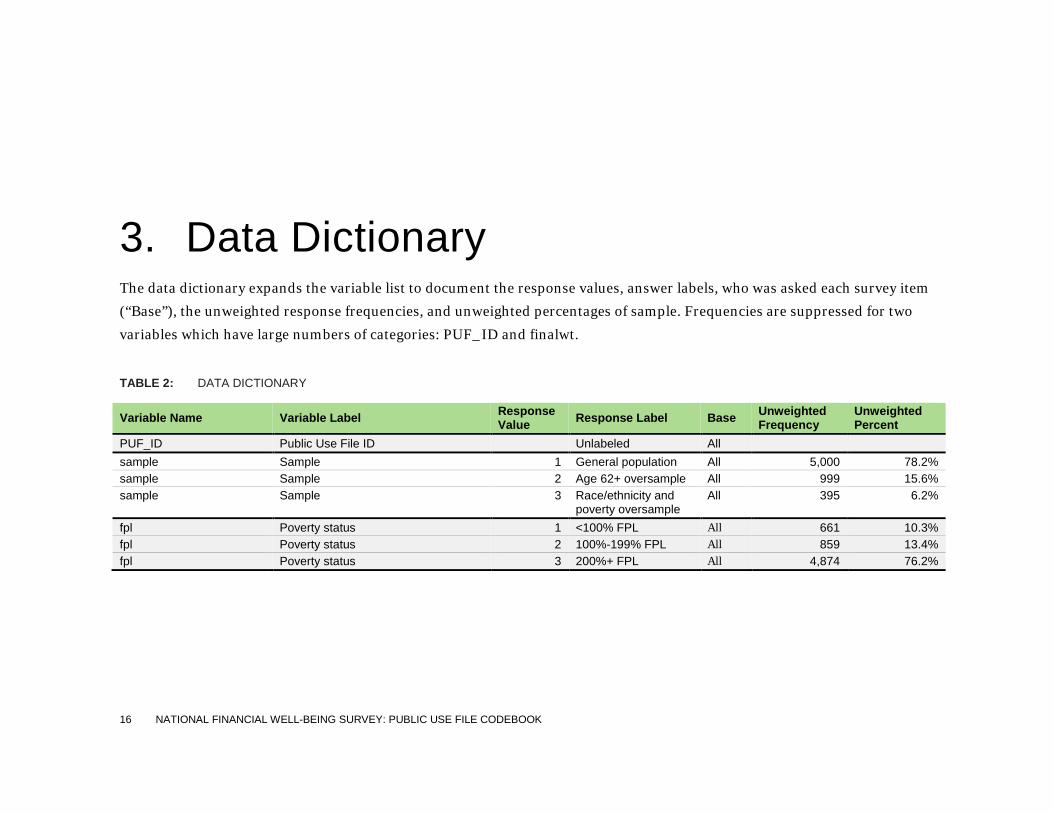
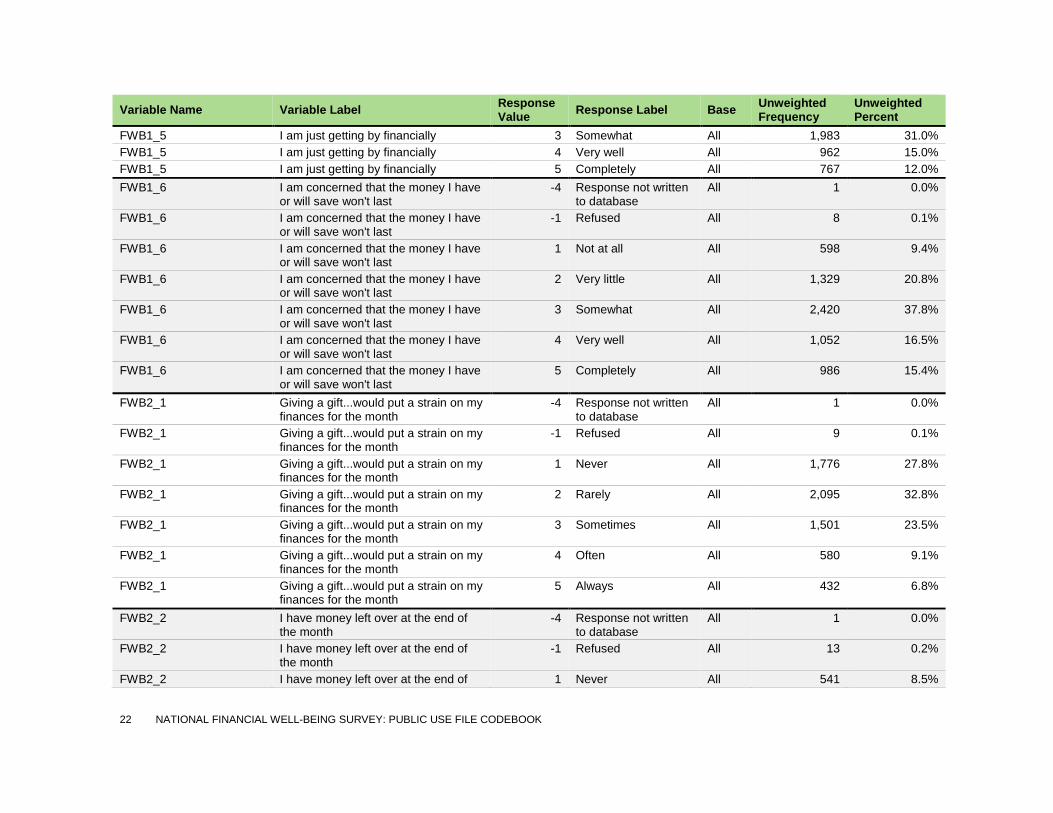
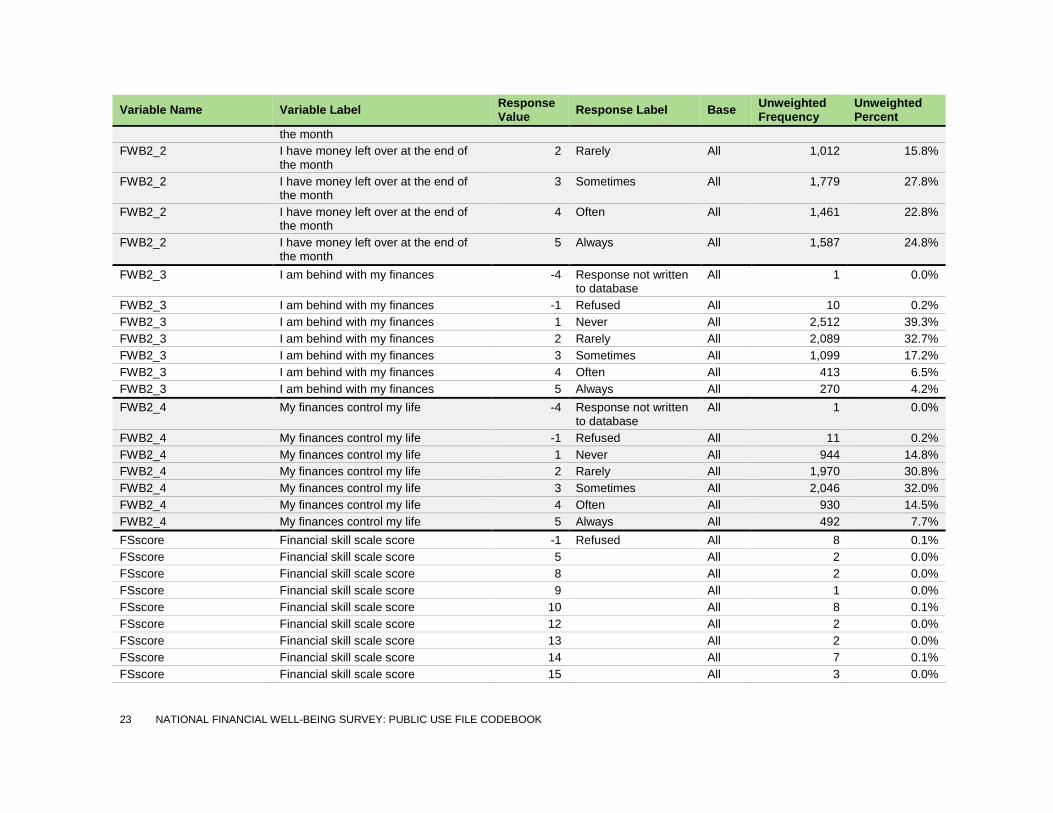
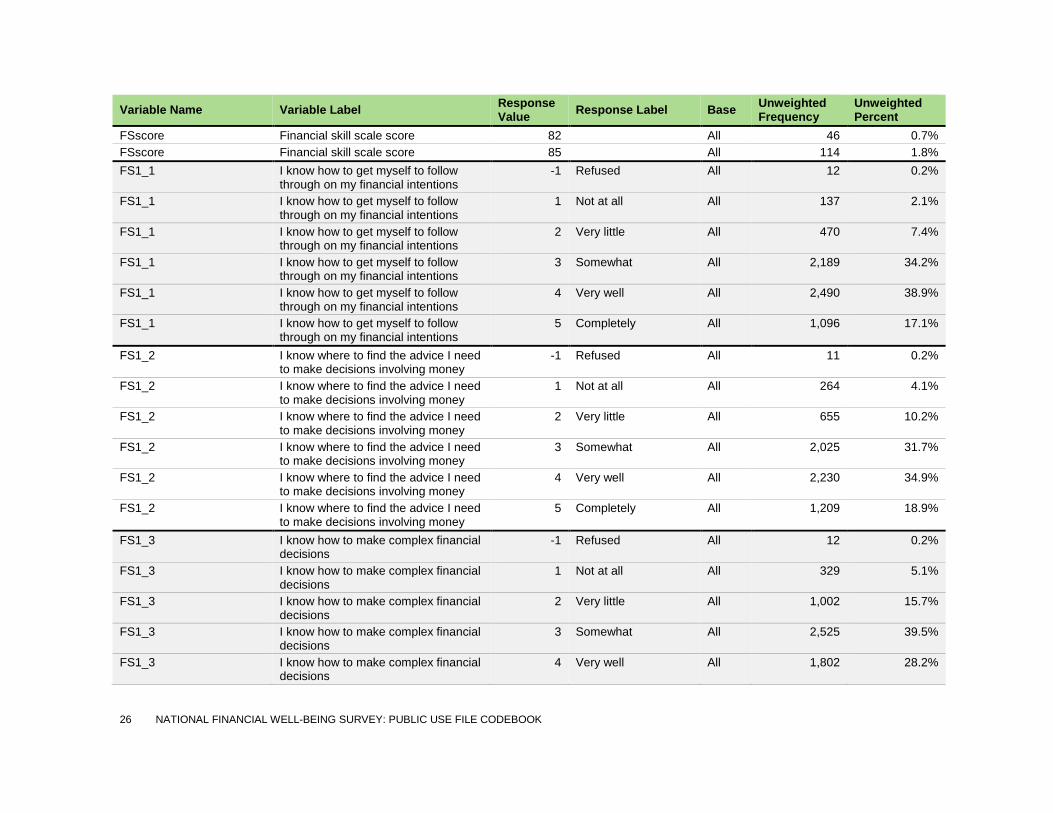
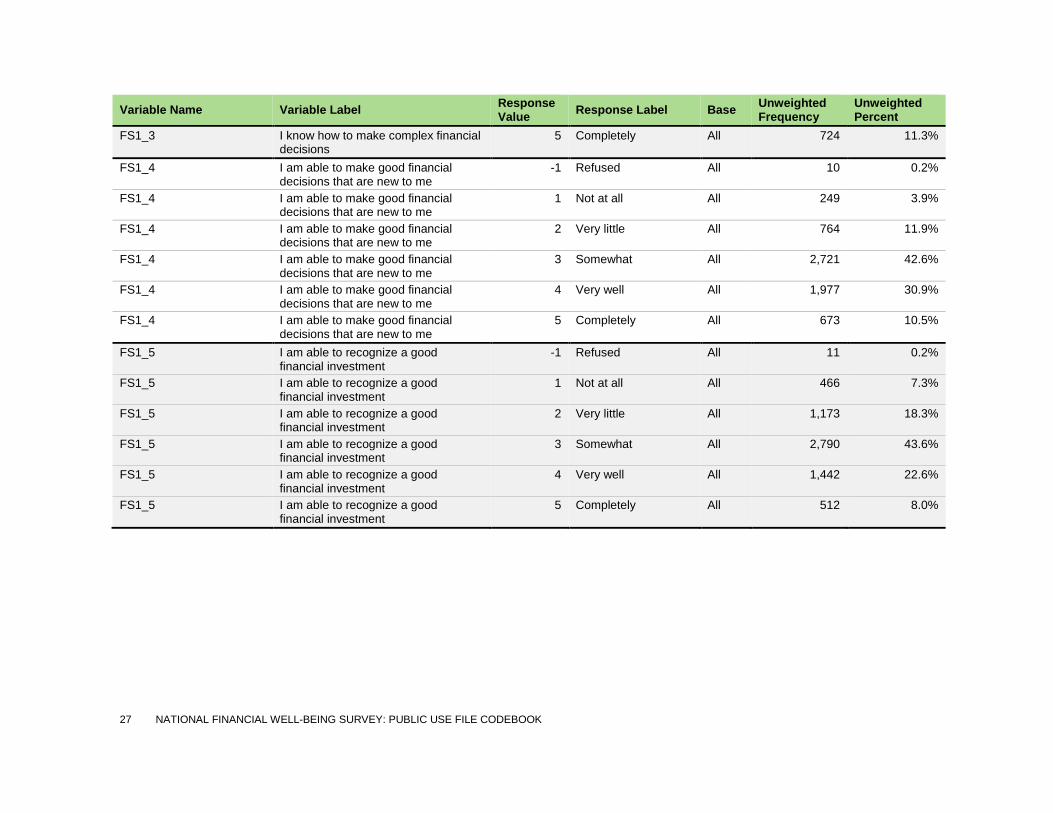
3. Data Dictionary The data dictionary expands the variable list to document the response values, answer labels, who was asked each survey item
(“Base”), the unweighted response frequencies, and unweighted percentages of sample. Frequencies are suppressed for two
variables which have large numbers of categories: PUF_ID and finalwt.
TABLE 2: DATA DICTIONARY
Variable Name Variable Label Response Value Response Label Base Unweighted
Frequency Unweighted Percent
PUF_ID Public Use File ID Unlabeled All sample Sample 1 General population All 5,000 78.2% sample Sample 2 Age 62+ oversample All 999 15.6% sample Sample 3 Race/ethnicity and
poverty oversample All 395 6.2%
fpl Poverty status 1 <100% FPL All 661 10.3% fpl Poverty status 2 100%-199% FPL All 859 13.4% fpl Poverty status 3 200%+ FPL All 4,874 76.2%

17 NATIONAL FINANCIAL WELL-BEING SURVEY: PUBLIC USE FILE CODEBOOK
Variable Name Variable Label Response Value Response Label Base Unweighted
Frequency Unweighted Percent
SWB_1 I am satisfied with my life -4 Response not written to database
All 1 0.0%
SWB_1 I am satisfied with my life -1 Refused All 30 0.5% SWB_1 I am satisfied with my life 1 1 Strongly disagree All 154 2.4% SWB_1 I am satisfied with my life 2 2 All 152 2.4% SWB_1 I am satisfied with my life 3 3 All 335 5.2% SWB_1 I am satisfied with my life 4 4 All 803 12.6% SWB_1 I am satisfied with my life 5 5 All 1,458 22.8% SWB_1 I am satisfied with my life 6 6 All 1,926 30.1% SWB_1 I am satisfied with my life 7 7 Strongly agree All 1,535 24.0% SWB_2 I am optimistic about my future -4 Response not written
to database All 1 0.0%
SWB_2 I am optimistic about my future -1 Refused All 56 0.9% SWB_2 I am optimistic about my future 1 1 Strongly disagree All 132 2.1% SWB_2 I am optimistic about my future 2 2 All 144 2.3% SWB_2 I am optimistic about my future 3 3 All 335 5.2% SWB_2 I am optimistic about my future 4 4 All 839 13.1% SWB_2 I am optimistic about my future 5 5 All 1,399 21.9% SWB_2 I am optimistic about my future 6 6 All 1,846 28.9% SWB_2 I am optimistic about my future 7 7 Strongly agree All 1,642 25.7% SWB_3 If I work hard today, I will be more
successful in the future -4 Response not written
to database All 1 0.0%
SWB_3 If I work hard today, I will be more successful in the future
-1 Refused All 64 1.0%
SWB_3 If I work hard today, I will be more successful in the future
1 1 Strongly disagree All 167 2.6%
SWB_3 If I work hard today, I will be more successful in the future
2 2 All 138 2.2%
SWB_3 If I work hard today, I will be more successful in the future
3 3 All 267 4.2%
SWB_3 If I work hard today, I will be more successful in the future
4 4 All 862 13.5%
SWB_3 If I work hard today, I will be more successful in the future
5 5 All 1,251 19.6%
SWB_3 If I work hard today, I will be more 6 6 All 1,653 25.9%

18 NATIONAL FINANCIAL WELL-BEING SURVEY: PUBLIC USE FILE CODEBOOK
Variable Name Variable Label Response Value Response Label Base Unweighted
Frequency Unweighted Percent
successful in the future SWB_3 If I work hard today, I will be more
successful in the future 7 7 Strongly agree All 1,991 31.1%
FWBscore Financial well-being scale score -4 Response not written to database
All 1 0.0%
FWBscore Financial well-being scale score -1 Refused All 4 0.1% FWBscore Financial well-being scale score 14 All 21 0.3% FWBscore Financial well-being scale score 16 All 3 0.0% FWBscore Financial well-being scale score 17 All 8 0.1% FWBscore Financial well-being scale score 18 All 5 0.1% FWBscore Financial well-being scale score 19 All 5 0.1% FWBscore Financial well-being scale score 20 All 4 0.1% FWBscore Financial well-being scale score 21 All 13 0.2% FWBscore Financial well-being scale score 22 All 13 0.2% FWBscore Financial well-being scale score 23 All 18 0.3% FWBscore Financial well-being scale score 24 All 17 0.3% FWBscore Financial well-being scale score 25 All 16 0.3% FWBscore Financial well-being scale score 26 All 30 0.5% FWBscore Financial well-being scale score 27 All 20 0.3% FWBscore Financial well-being scale score 28 All 20 0.3% FWBscore Financial well-being scale score 29 All 42 0.7% FWBscore Financial well-being scale score 30 All 31 0.5% FWBscore Financial well-being scale score 31 All 29 0.5% FWBscore Financial well-being scale score 32 All 31 0.5% FWBscore Financial well-being scale score 33 All 49 0.8% FWBscore Financial well-being scale score 34 All 55 0.9% FWBscore Financial well-being scale score 35 All 44 0.7% FWBscore Financial well-being scale score 36 All 51 0.8% FWBscore Financial well-being scale score 37 All 68 1.1% FWBscore Financial well-being scale score 38 All 58 0.9% FWBscore Financial well-being scale score 39 All 77 1.2% FWBscore Financial well-being scale score 40 All 88 1.4% FWBscore Financial well-being scale score 41 All 77 1.2% FWBscore Financial well-being scale score 42 All 94 1.5%
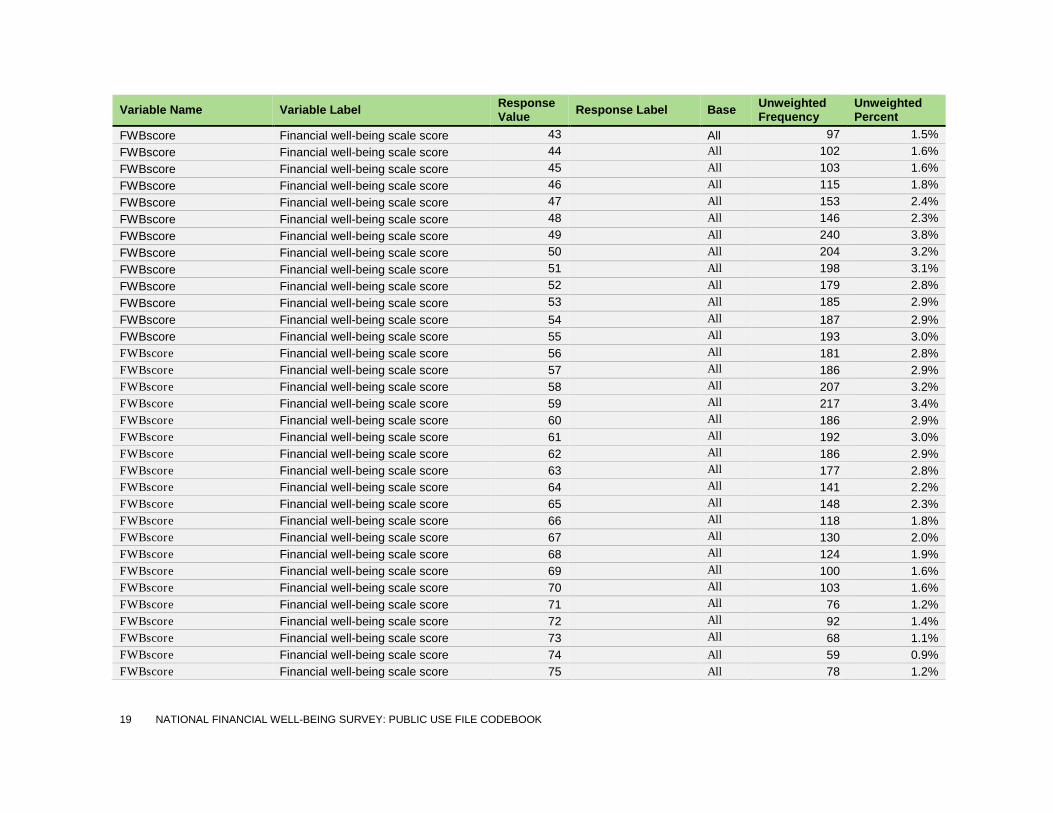
19 NATIONAL FINANCIAL WELL-BEING SURVEY: PUBLIC USE FILE CODEBOOK
Variable Name Variable Label Response Value Response Label Base Unweighted
Frequency Unweighted Percent
FWBscore Financial well-being scale score 43 All 97 1.5% FWBscore Financial well-being scale score 44 All 102 1.6% FWBscore Financial well-being scale score 45 All 103 1.6% FWBscore Financial well-being scale score 46 All 115 1.8% FWBscore Financial well-being scale score 47 All 153 2.4% FWBscore Financial well-being scale score 48 All 146 2.3% FWBscore Financial well-being scale score 49 All 240 3.8% FWBscore Financial well-being scale score 50 All 204 3.2% FWBscore Financial well-being scale score 51 All 198 3.1% FWBscore Financial well-being scale score 52 All 179 2.8% FWBscore Financial well-being scale score 53 All 185 2.9% FWBscore Financial well-being scale score 54 All 187 2.9% FWBscore Financial well-being scale score 55 All 193 3.0% FWBscore Financial well-being scale score 56 All 181 2.8% FWBscore Financial well-being scale score 57 All 186 2.9% FWBscore Financial well-being scale score 58 All 207 3.2% FWBscore Financial well-being scale score 59 All 217 3.4% FWBscore Financial well-being scale score 60 All 186 2.9% FWBscore Financial well-being scale score 61 All 192 3.0% FWBscore Financial well-being scale score 62 All 186 2.9% FWBscore Financial well-being scale score 63 All 177 2.8% FWBscore Financial well-being scale score 64 All 141 2.2% FWBscore Financial well-being scale score 65 All 148 2.3% FWBscore Financial well-being scale score 66 All 118 1.8% FWBscore Financial well-being scale score 67 All 130 2.0% FWBscore Financial well-being scale score 68 All 124 1.9% FWBscore Financial well-being scale score 69 All 100 1.6% FWBscore Financial well-being scale score 70 All 103 1.6% FWBscore Financial well-being scale score 71 All 76 1.2% FWBscore Financial well-being scale score 72 All 92 1.4% FWBscore Financial well-being scale score 73 All 68 1.1% FWBscore Financial well-being scale score 74 All 59 0.9% FWBscore Financial well-being scale score 75 All 78 1.2%

20 NATIONAL FINANCIAL WELL-BEING SURVEY: PUBLIC USE FILE CODEBOOK
Variable Name Variable Label Response Value Response Label Base Unweighted
Frequency Unweighted Percent
FWBscore Financial well-being scale score 76 All 54 0.8% FWBscore Financial well-being scale score 77 All 51 0.8% FWBscore Financial well-being scale score 78 All 58 0.9% FWBscore Financial well-being scale score 79 All 45 0.7% FWBscore Financial well-being scale score 80 All 33 0.5% FWBscore Financial well-being scale score 81 All 37 0.6% FWBscore Financial well-being scale score 82 All 25 0.4% FWBscore Financial well-being scale score 83 All 17 0.3% FWBscore Financial well-being scale score 84 All 22 0.3% FWBscore Financial well-being scale score 85 All 24 0.4% FWBscore Financial well-being scale score 86 All 62 1.0% FWBscore Financial well-being scale score 87 All 7 0.1% FWBscore Financial well-being scale score 88 All 14 0.2% FWBscore Financial well-being scale score 89 All 11 0.2% FWBscore Financial well-being scale score 90 All 2 0.0% FWBscore Financial well-being scale score 95 All 69 1.1% FWB1_1 I could handle a major unexpected
expense -4 Response not written
to database All 1 0.0%
FWB1_1 I could handle a major unexpected expense
-1 Refused All 10 0.2%
FWB1_1 I could handle a major unexpected expense
1 Not at all All 927 14.5%
FWB1_1 I could handle a major unexpected expense
2 Very little All 989 15.5%
FWB1_1 I could handle a major unexpected expense
3 Somewhat All 2,103 32.9%
FWB1_1 I could handle a major unexpected expense
4 Very well All 1,531 23.9%
FWB1_1 I could handle a major unexpected expense
5 Completely All 833 13.0%
FWB1_2 I am securing my financial future -4 Response not written to database
All 1 0.0%
FWB1_2 I am securing my financial future -1 Refused All 10 0.2% FWB1_2 I am securing my financial future 1 Not at all All 538 8.4% FWB1_2 I am securing my financial future 2 Very little All 974 15.2%
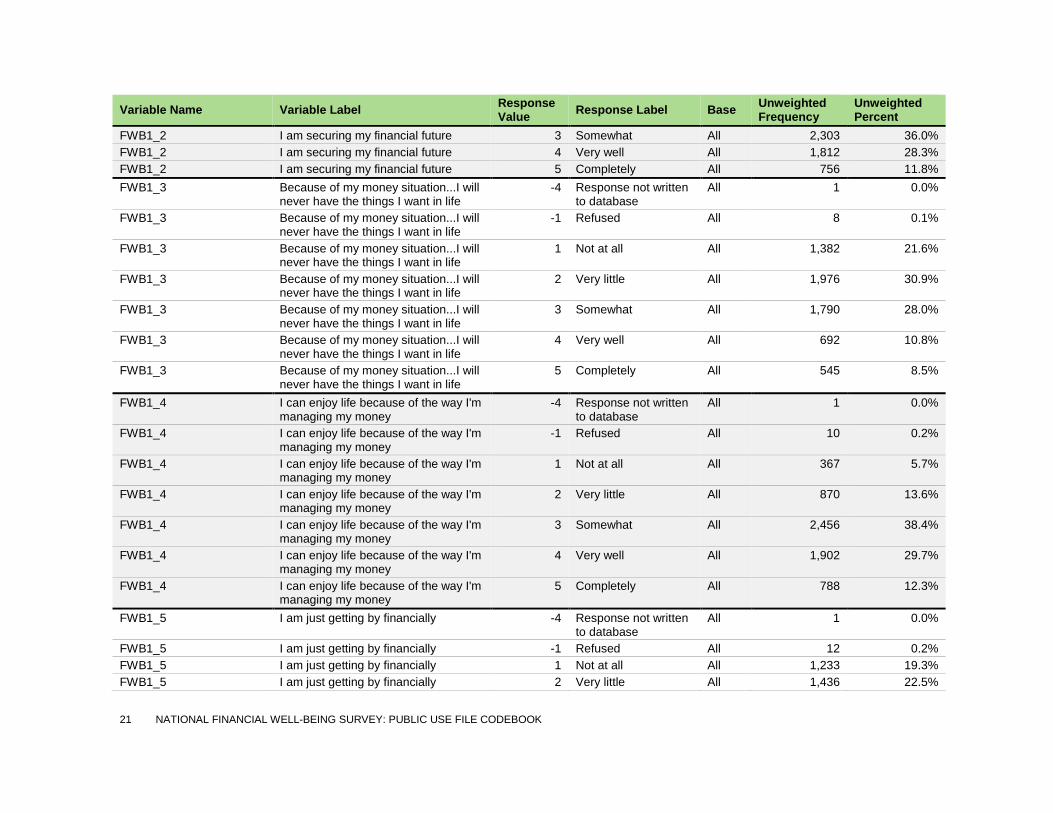
21 NATIONAL FINANCIAL WELL-BEING SURVEY: PUBLIC USE FILE CODEBOOK
Variable Name Variable Label Response Value Response Label Base Unweighted
Frequency Unweighted Percent
FWB1_2 I am securing my financial future 3 Somewhat All 2,303 36.0% FWB1_2 I am securing my financial future 4 Very well All 1,812 28.3% FWB1_2 I am securing my financial future 5 Completely All 756 11.8% FWB1_3 Because of my money situation...I will
never have the things I want in life -4 Response not written
to database All 1 0.0%
FWB1_3 Because of my money situation...I will never have the things I want in life
-1 Refused All 8 0.1%
FWB1_3 Because of my money situation...I will never have the things I want in life
1 Not at all All 1,382 21.6%
FWB1_3 Because of my money situation...I will never have the things I want in life
2 Very little All 1,976 30.9%
FWB1_3 Because of my money situation...I will never have the things I want in life
3 Somewhat All 1,790 28.0%
FWB1_3 Because of my money situation...I will never have the things I want in life
4 Very well All 692 10.8%
FWB1_3 Because of my money situation...I will never have the things I want in life
5 Completely All 545 8.5%
FWB1_4 I can enjoy life because of the way I'm managing my money
-4 Response not written to database
All 1 0.0%
FWB1_4 I can enjoy life because of the way I'm managing my money
-1 Refused All 10 0.2%
FWB1_4 I can enjoy life because of the way I'm managing my money
1 Not at all All 367 5.7%
FWB1_4 I can enjoy life because of the way I'm managing my money
2 Very little All 870 13.6%
FWB1_4 I can enjoy life because of the way I'm managing my money
3 Somewhat All 2,456 38.4%
FWB1_4 I can enjoy life because of the way I'm managing my money
4 Very well All 1,902 29.7%
FWB1_4 I can enjoy life because of the way I'm managing my money
5 Completely All 788 12.3%
FWB1_5 I am just getting by financially -4 Response not written to database
All 1 0.0%
FWB1_5 I am just getting by financially -1 Refused All 12 0.2% FWB1_5 I am just getting by financially 1 Not at all All 1,233 19.3% FWB1_5 I am just getting by financially 2 Very little All 1,436 22.5%
22 NATIONAL FINANCIAL WELL-BEING SURVEY: PUBLIC USE FILE CODEBOOK
Variable Name Variable Label Response Value Response Label Base Unweighted
Frequency Unweighted Percent
FWB1_5 I am just getting by financially 3 Somewhat All 1,983 31.0% FWB1_5 I am just getting by financially 4 Very well All 962 15.0% FWB1_5 I am just getting by financially 5 Completely All 767 12.0% FWB1_6 I am concerned that the money I have
or will save won't last -4 Response not written
to database All 1 0.0%
FWB1_6 I am concerned that the money I have or will save won't last
-1 Refused All 8 0.1%
FWB1_6 I am concerned that the money I have or will save won't last
1 Not at all All 598 9.4%
FWB1_6 I am concerned that the money I have or will save won't last
2 Very little All 1,329 20.8%
FWB1_6 I am concerned that the money I have or will save won't last
3 Somewhat All 2,420 37.8%
FWB1_6 I am concerned that the money I have or will save won't last
4 Very well All 1,052 16.5%
FWB1_6 I am concerned that the money I have or will save won't last
5 Completely All 986 15.4%
FWB2_1 Giving a gift...would put a strain on my finances for the month
-4 Response not written to database
All 1 0.0%
FWB2_1 Giving a gift...would put a strain on my finances for the month
-1 Refused All 9 0.1%
FWB2_1 Giving a gift...would put a strain on my finances for the month
1 Never All 1,776 27.8%
FWB2_1 Giving a gift...would put a strain on my finances for the month
2 Rarely All 2,095 32.8%
FWB2_1 Giving a gift...would put a strain on my finances for the month
3 Sometimes All 1,501 23.5%
FWB2_1 Giving a gift...would put a strain on my finances for the month
4 Often All 580 9.1%
FWB2_1 Giving a gift...would put a strain on my finances for the month
5 Always All 432 6.8%
FWB2_2 I have money left over at the end of the month
-4 Response not written to database
All 1 0.0%
FWB2_2 I have money left over at the end of the month
-1 Refused All 13 0.2%
FWB2_2 I have money left over at the end of 1 Never All 541 8.5%
23 NATIONAL FINANCIAL WELL-BEING SURVEY: PUBLIC USE FILE CODEBOOK
Variable Name Variable Label Response Value Response Label Base Unweighted
Frequency Unweighted Percent
the month FWB2_2 I have money left over at the end of
the month 2 Rarely All 1,012 15.8%
FWB2_2 I have money left over at the end of the month
3 Sometimes All 1,779 27.8%
FWB2_2 I have money left over at the end of the month
4 Often All 1,461 22.8%
FWB2_2 I have money left over at the end of the month
5 Always All 1,587 24.8%
FWB2_3 I am behind with my finances -4 Response not written to database
All 1 0.0%
FWB2_3 I am behind with my finances -1 Refused All 10 0.2% FWB2_3 I am behind with my finances 1 Never All 2,512 39.3% FWB2_3 I am behind with my finances 2 Rarely All 2,089 32.7% FWB2_3 I am behind with my finances 3 Sometimes All 1,099 17.2% FWB2_3 I am behind with my finances 4 Often All 413 6.5% FWB2_3 I am behind with my finances 5 Always All 270 4.2% FWB2_4 My finances control my life -4 Response not written
to database All 1 0.0%
FWB2_4 My finances control my life -1 Refused All 11 0.2% FWB2_4 My finances control my life 1 Never All 944 14.8% FWB2_4 My finances control my life 2 Rarely All 1,970 30.8% FWB2_4 My finances control my life 3 Sometimes All 2,046 32.0% FWB2_4 My finances control my life 4 Often All 930 14.5% FWB2_4 My finances control my life 5 Always All 492 7.7% FSscore Financial skill scale score -1 Refused All 8 0.1% FSscore Financial skill scale score 5 All 2 0.0% FSscore Financial skill scale score 8 All 2 0.0% FSscore Financial skill scale score 9 All 1 0.0% FSscore Financial skill scale score 10 All 8 0.1% FSscore Financial skill scale score 12 All 2 0.0% FSscore Financial skill scale score 13 All 2 0.0% FSscore Financial skill scale score 14 All 7 0.1% FSscore Financial skill scale score 15 All 3 0.0%

24 NATIONAL FINANCIAL WELL-BEING SURVEY: PUBLIC USE FILE CODEBOOK
Variable Name Variable Label Response Value Response Label Base Unweighted
Frequency Unweighted Percent
FSscore Financial skill scale score 16 All 8 0.1% FSscore Financial skill scale score 17 All 4 0.1% FSscore Financial skill scale score 18 All 9 0.1% FSscore Financial skill scale score 19 All 4 0.1% FSscore Financial skill scale score 20 All 3 0.0% FSscore Financial skill scale score 21 All 4 0.1% FSscore Financial skill scale score 22 All 10 0.2% FSscore Financial skill scale score 23 All 9 0.1% FSscore Financial skill scale score 24 All 14 0.2% FSscore Financial skill scale score 25 All 15 0.2% FSscore Financial skill scale score 26 All 14 0.2% FSscore Financial skill scale score 27 All 19 0.3% FSscore Financial skill scale score 28 All 28 0.4% FSscore Financial skill scale score 29 All 38 0.6% FSscore Financial skill scale score 30 All 44 0.7% FSscore Financial skill scale score 31 All 45 0.7% FSscore Financial skill scale score 32 All 44 0.7% FSscore Financial skill scale score 33 All 50 0.8% FSscore Financial skill scale score 34 All 68 1.1% FSscore Financial skill scale score 35 All 82 1.3% FSscore Financial skill scale score 36 All 75 1.2% FSscore Financial skill scale score 37 All 84 1.3% FSscore Financial skill scale score 38 All 112 1.8% FSscore Financial skill scale score 39 All 132 2.1% FSscore Financial skill scale score 40 All 161 2.5% FSscore Financial skill scale score 41 All 190 3.0% FSscore Financial skill scale score 42 All 377 5.9% FSscore Financial skill scale score 43 All 213 3.3% FSscore Financial skill scale score 44 All 203 3.2% FSscore Financial skill scale score 45 All 218 3.4% FSscore Financial skill scale score 46 All 171 2.7% FSscore Financial skill scale score 47 All 200 3.1% FSscore Financial skill scale score 48 All 181 2.8%

25 NATIONAL FINANCIAL WELL-BEING SURVEY: PUBLIC USE FILE CODEBOOK
Variable Name Variable Label Response Value Response Label Base Unweighted
Frequency Unweighted Percent
FSscore Financial skill scale score 49 All 212 3.3% FSscore Financial skill scale score 50 All 209 3.3% FSscore Financial skill scale score 51 All 241 3.8% FSscore Financial skill scale score 52 All 197 3.1% FSscore Financial skill scale score 53 All 211 3.3% FSscore Financial skill scale score 54 All 216 3.4% FSscore Financial skill scale score 55 All 233 3.6% FSscore Financial skill scale score 56 All 246 3.8% FSscore Financial skill scale score 57 All 212 3.3% FSscore Financial skill scale score 58 All 207 3.2% FSscore Financial skill scale score 59 All 103 1.6% FSscore Financial skill scale score 60 All 128 2.0% FSscore Financial skill scale score 61 All 102 1.6% FSscore Financial skill scale score 62 All 73 1.1% FSscore Financial skill scale score 63 All 66 1.0% FSscore Financial skill scale score 64 All 81 1.3% FSscore Financial skill scale score 65 All 66 1.0% FSscore Financial skill scale score 66 All 50 0.8% FSscore Financial skill scale score 67 All 54 0.8% FSscore Financial skill scale score 68 All 43 0.7% FSscore Financial skill scale score 69 All 60 0.9% FSscore Financial skill scale score 70 All 46 0.7% FSscore Financial skill scale score 71 All 43 0.7% FSscore Financial skill scale score 72 All 24 0.4% FSscore Financial skill scale score 73 All 36 0.6% FSscore Financial skill scale score 74 All 16 0.3% FSscore Financial skill scale score 75 All 34 0.5% FSscore Financial skill scale score 76 All 32 0.5% FSscore Financial skill scale score 77 All 28 0.4% FSscore Financial skill scale score 78 All 26 0.4% FSscore Financial skill scale score 79 All 44 0.7% FSscore Financial skill scale score 80 All 15 0.2% FSscore Financial skill scale score 81 All 16 0.3%
26 NATIONAL FINANCIAL WELL-BEING SURVEY: PUBLIC USE FILE CODEBOOK
Variable Name Variable Label Response Value Response Label Base Unweighted
Frequency Unweighted Percent
FSscore Financial skill scale score 82 All 46 0.7% FSscore Financial skill scale score 85 All 114 1.8% FS1_1 I know how to get myself to follow
through on my financial intentions -1 Refused All 12 0.2%
FS1_1 I know how to get myself to follow through on my financial intentions
1 Not at all All 137 2.1%
FS1_1 I know how to get myself to follow through on my financial intentions
2 Very little All 470 7.4%
FS1_1 I know how to get myself to follow through on my financial intentions
3 Somewhat All 2,189 34.2%
FS1_1 I know how to get myself to follow through on my financial intentions
4 Very well All 2,490 38.9%
FS1_1 I know how to get myself to follow through on my financial intentions
5 Completely All 1,096 17.1%
FS1_2 I know where to find the advice I need to make decisions involving money
-1 Refused All 11 0.2%
FS1_2 I know where to find the advice I need to make decisions involving money
1 Not at all All 264 4.1%
FS1_2 I know where to find the advice I need to make decisions involving money
2 Very little All 655 10.2%
FS1_2 I know where to find the advice I need to make decisions involving money
3 Somewhat All 2,025 31.7%
FS1_2 I know where to find the advice I need to make decisions involving money
4 Very well All 2,230 34.9%
FS1_2 I know where to find the advice I need to make decisions involving money
5 Completely All 1,209 18.9%
FS1_3 I know how to make complex financial decisions
-1 Refused All 12 0.2%
FS1_3 I know how to make complex financial decisions
1 Not at all All 329 5.1%
FS1_3 I know how to make complex financial decisions
2 Very little All 1,002 15.7%
FS1_3 I know how to make complex financial decisions
3 Somewhat All 2,525 39.5%
FS1_3 I know how to make complex financial decisions
4 Very well All 1,802 28.2%
27 NATIONAL FINANCIAL WELL-BEING SURVEY: PUBLIC USE FILE CODEBOOK
Variable Name Variable Label Response Value Response Label Base Unweighted
Frequency Unweighted Percent
FS1_3 I know how to make complex financial decisions
5 Completely All 724 11.3%
FS1_4 I am able to make good financial decisions that are new to me
-1 Refused All 10 0.2%
FS1_4 I am able to make good financial decisions that are new to me
1 Not at all All 249 3.9%
FS1_4 I am able to make good financial decisions that are new to me
2 Very little All 764 11.9%
FS1_4 I am able to make good financial decisions that are new to me
3 Somewhat All 2,721 42.6%
FS1_4 I am able to make good financial decisions that are new to me
4 Very well All 1,977 30.9%
FS1_4 I am able to make good financial decisions that are new to me
5 Completely All 673 10.5%
FS1_5 I am able to recognize a good financial investment
-1 Refused All 11 0.2%
FS1_5 I am able to recognize a good financial investment
1 Not at all All 466 7.3%
FS1_5 I am able to recognize a good financial investment
2 Very little All 1,173 18.3%
FS1_5 I am able to recognize a good financial investment
3 Somewhat All 2,790 43.6%
FS1_5 I am able to recognize a good financial investment
4 Very well All 1,442 22.6%
FS1_5 I am able to recognize a good financial investment
5 Completely All 512 8.0%
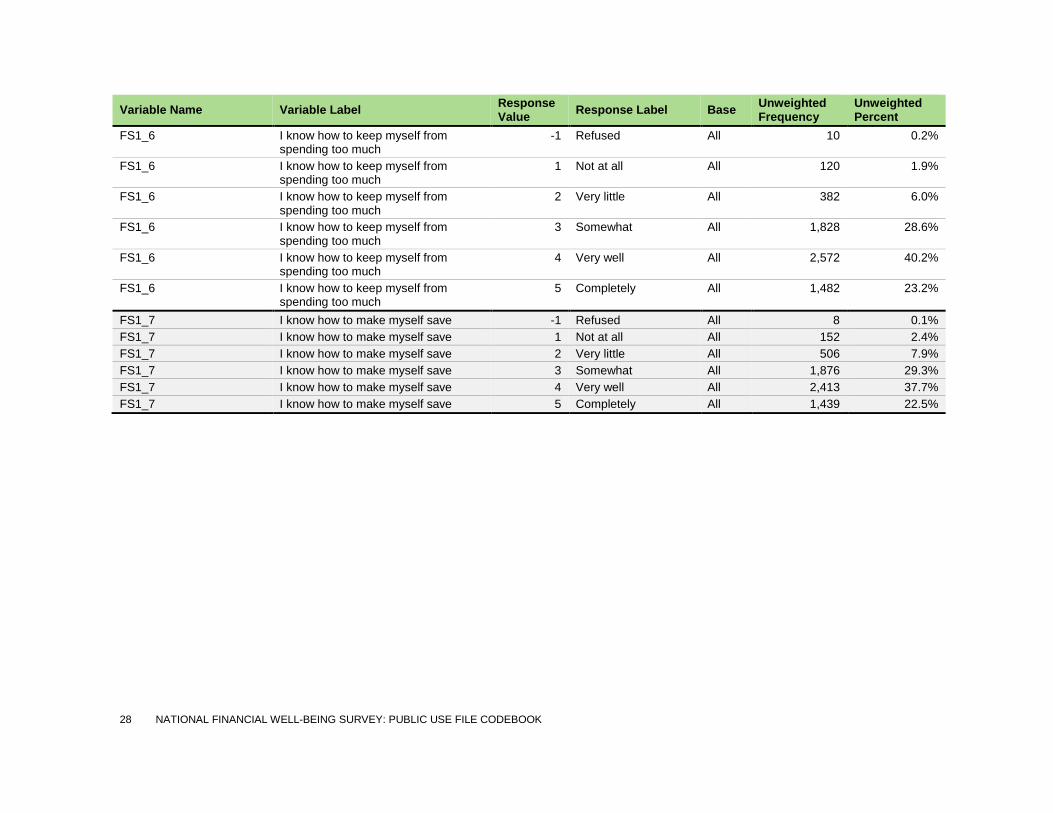
28 NATIONAL FINANCIAL WELL-BEING SURVEY: PUBLIC USE FILE CODEBOOK
Variable Name Variable Label Response Value Response Label Base Unweighted
Frequency Unweighted Percent
FS1_6 I know how to keep myself from spending too much
-1 Refused All 10 0.2%
FS1_6 I know how to keep myself from spending too much
1 Not at all All 120 1.9%
FS1_6 I know how to keep myself from spending too much
2 Very little All 382 6.0%
FS1_6 I know how to keep myself from spending too much
3 Somewhat All 1,828 28.6%
FS1_6 I know how to keep myself from spending too much
4 Very well All 2,572 40.2%
FS1_6 I know how to keep myself from spending too much
5 Completely All 1,482 23.2%
FS1_7 I know how to make myself save -1 Refused All 8 0.1% FS1_7 I know how to make myself save 1 Not at all All 152 2.4% FS1_7 I know how to make myself save 2 Very little All 506 7.9% FS1_7 I know how to make myself save 3 Somewhat All 1,876 29.3% FS1_7 I know how to make myself save 4 Very well All 2,413 37.7% FS1_7 I know how to make myself save 5 Completely All 1,439 22.5%

29 NATIONAL FINANCIAL WELL-BEING SURVEY: PUBLIC USE FILE CODEBOOK
Variable Name Variable Label Response Value Response Label Base Unweighted
Frequency Unweighted Percent
FS2_1 I know when I do not have enough info to make a good decision involving my money
-1 Refused All 14 0.2%
FS2_1 I know when I do not have enough info to make a good decision involving my money
1 Never All 70 1.1%
FS2_1 I know when I do not have enough info to make a good decision involving my money
2 Rarely All 348 5.4%
FS2_1 I know when I do not have enough info to make a good decision involving my money
3 Sometimes All 1,914 29.9%
FS2_1 I know when I do not have enough info to make a good decision involving my money
4 Often All 2,824 44.2%
FS2_1 I know when I do not have enough info to make a good decision involving my money
5 Always All 1,224 19.1%
FS2_2 I know when I need advice about my money
-1 Refused All 14 0.2%
FS2_2 I know when I need advice about my money
1 Never All 120 1.9%
FS2_2 I know when I need advice about my money
2 Rarely All 495 7.7%
FS2_2 I know when I need advice about my money
3 Sometimes All 2,177 34.0%
FS2_2 I know when I need advice about my money
4 Often All 2,382 37.3%
FS2_2 I know when I need advice about my money
5 Always All 1,206 18.9%

30 NATIONAL FINANCIAL WELL-BEING SURVEY: PUBLIC USE FILE CODEBOOK
Variable Name Variable Label Response Value Response Label Base Unweighted
Frequency Unweighted Percent
FS2_3 I struggle to understand financial information
-1 Refused All 14 0.2%
FS2_3 I struggle to understand financial information
1 Never All 515 8.1%
FS2_3 I struggle to understand financial information
2 Rarely All 2,227 34.8%
FS2_3 I struggle to understand financial information
3 Sometimes All 2,681 41.9%
FS2_3 I struggle to understand financial information
4 Often All 711 11.1%
FS2_3 I struggle to understand financial information
5 Always All 246 3.8%
SUBKNOWL1 How would you assess your overall financial knowledge?
-1 Refused All 52 0.8%
SUBKNOWL1 How would you assess your overall financial knowledge?
1 1 - Very low All 124 1.9%
SUBKNOWL1 How would you assess your overall financial knowledge?
2 2 All 153 2.4%
SUBKNOWL1 How would you assess your overall financial knowledge?
3 3 All 528 8.3%
SUBKNOWL1 How would you assess your overall financial knowledge?
4 4 All 1,489 23.3%
SUBKNOWL1 How would you assess your overall financial knowledge?
5 5 All 2,648 41.4%
SUBKNOWL1 How would you assess your overall financial knowledge?
6 6 All 1,072 16.8%
SUBKNOWL1 How would you assess your overall financial knowledge?
7 7 - Very high All 328 5.1%
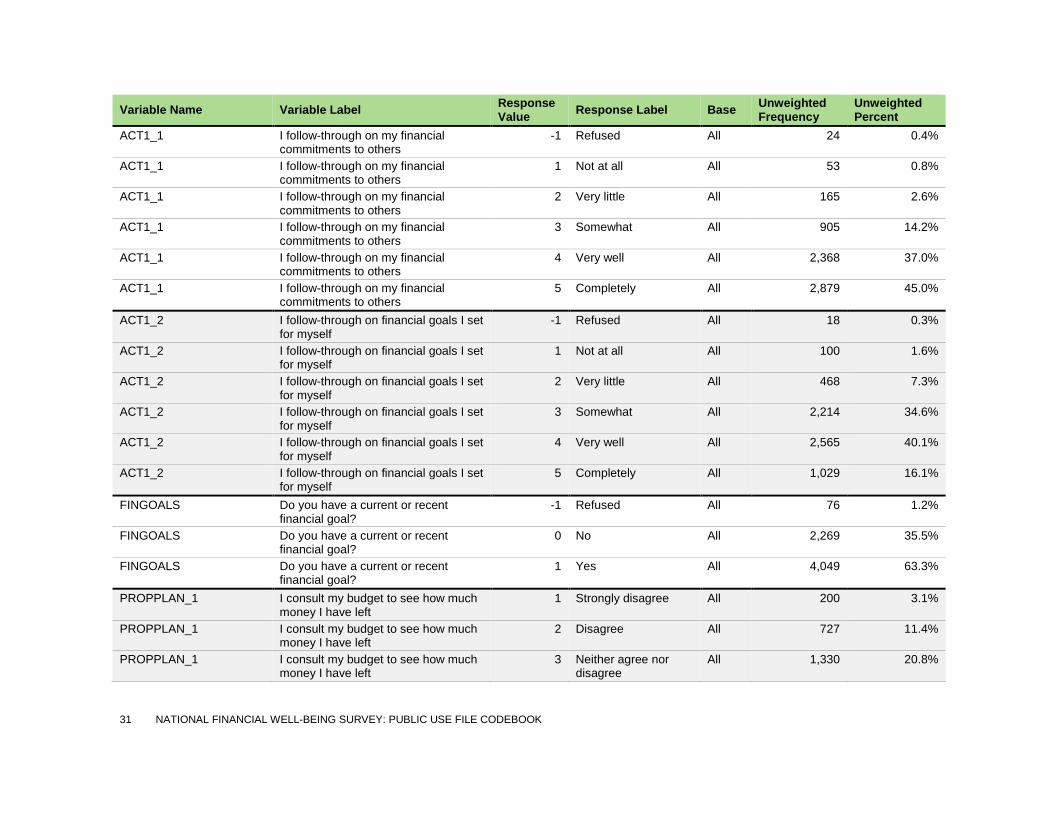
31 NATIONAL FINANCIAL WELL-BEING SURVEY: PUBLIC USE FILE CODEBOOK
Variable Name Variable Label Response Value Response Label Base Unweighted
Frequency Unweighted Percent
ACT1_1 I follow-through on my financial commitments to others
-1 Refused All 24 0.4%
ACT1_1 I follow-through on my financial commitments to others
1 Not at all All 53 0.8%
ACT1_1 I follow-through on my financial commitments to others
2 Very little All 165 2.6%
ACT1_1 I follow-through on my financial commitments to others
3 Somewhat All 905 14.2%
ACT1_1 I follow-through on my financial commitments to others
4 Very well All 2,368 37.0%
ACT1_1 I follow-through on my financial commitments to others
5 Completely All 2,879 45.0%
ACT1_2 I follow-through on financial goals I set for myself
-1 Refused All 18 0.3%
ACT1_2 I follow-through on financial goals I set for myself
1 Not at all All 100 1.6%
ACT1_2 I follow-through on financial goals I set for myself
2 Very little All 468 7.3%
ACT1_2 I follow-through on financial goals I set for myself
3 Somewhat All 2,214 34.6%
ACT1_2 I follow-through on financial goals I set for myself
4 Very well All 2,565 40.1%
ACT1_2 I follow-through on financial goals I set for myself
5 Completely All 1,029 16.1%
FINGOALS Do you have a current or recent financial goal?
-1 Refused All 76 1.2%
FINGOALS Do you have a current or recent financial goal?
0 No All 2,269 35.5%
FINGOALS Do you have a current or recent financial goal?
1 Yes All 4,049 63.3%
PROPPLAN_1 I consult my budget to see how much money I have left
1 Strongly disagree All 200 3.1%
PROPPLAN_1 I consult my budget to see how much money I have left
2 Disagree All 727 11.4%
PROPPLAN_1 I consult my budget to see how much money I have left
3 Neither agree nor disagree
All 1,330 20.8%
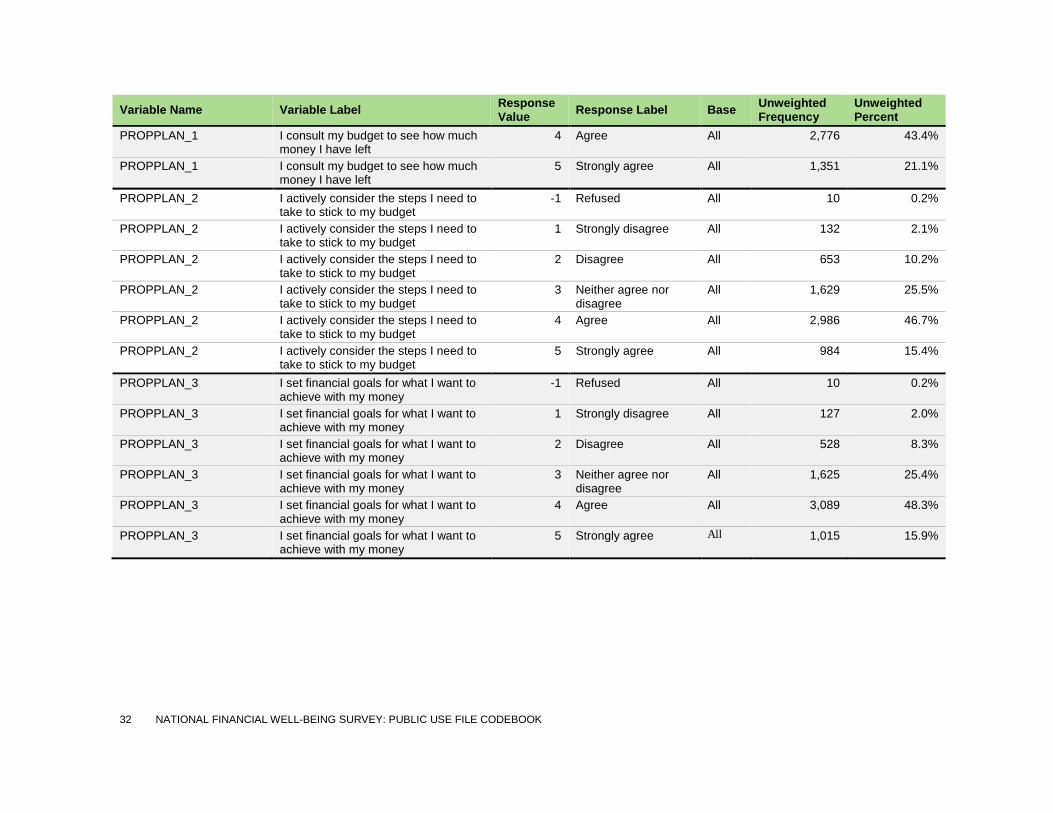
32 NATIONAL FINANCIAL WELL-BEING SURVEY: PUBLIC USE FILE CODEBOOK
Variable Name Variable Label Response Value Response Label Base Unweighted
Frequency Unweighted Percent
PROPPLAN_1 I consult my budget to see how much money I have left
4 Agree All 2,776 43.4%
PROPPLAN_1 I consult my budget to see how much money I have left
5 Strongly agree All 1,351 21.1%
PROPPLAN_2 I actively consider the steps I need to take to stick to my budget
-1 Refused All 10 0.2%
PROPPLAN_2 I actively consider the steps I need to take to stick to my budget
1 Strongly disagree All 132 2.1%
PROPPLAN_2 I actively consider the steps I need to take to stick to my budget
2 Disagree All 653 10.2%
PROPPLAN_2 I actively consider the steps I need to take to stick to my budget
3 Neither agree nor disagree
All 1,629 25.5%
PROPPLAN_2 I actively consider the steps I need to take to stick to my budget
4 Agree All 2,986 46.7%
PROPPLAN_2 I actively consider the steps I need to take to stick to my budget
5 Strongly agree All 984 15.4%
PROPPLAN_3 I set financial goals for what I want to achieve with my money
-1 Refused All 10 0.2%
PROPPLAN_3 I set financial goals for what I want to achieve with my money
1 Strongly disagree All 127 2.0%
PROPPLAN_3 I set financial goals for what I want to achieve with my money
2 Disagree All 528 8.3%
PROPPLAN_3 I set financial goals for what I want to achieve with my money
3 Neither agree nor disagree
All 1,625 25.4%
PROPPLAN_3 I set financial goals for what I want to achieve with my money
4 Agree All 3,089 48.3%
PROPPLAN_3 I set financial goals for what I want to achieve with my money
5 Strongly agree All 1,015 15.9%
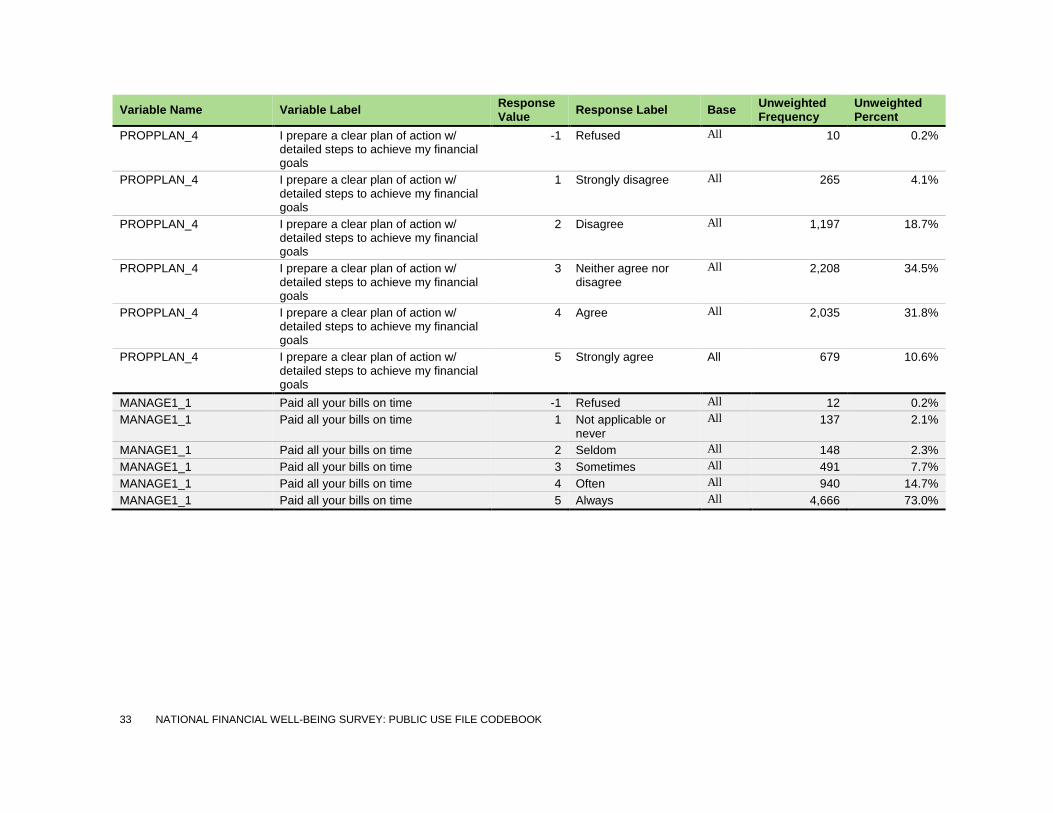
33 NATIONAL FINANCIAL WELL-BEING SURVEY: PUBLIC USE FILE CODEBOOK
Variable Name Variable Label Response Value Response Label Base Unweighted
Frequency Unweighted Percent
PROPPLAN_4 I prepare a clear plan of action w/ detailed steps to achieve my financial goals
-1 Refused All 10 0.2%
PROPPLAN_4 I prepare a clear plan of action w/ detailed steps to achieve my financial goals
1 Strongly disagree All 265 4.1%
PROPPLAN_4 I prepare a clear plan of action w/ detailed steps to achieve my financial goals
2 Disagree All 1,197 18.7%
PROPPLAN_4 I prepare a clear plan of action w/ detailed steps to achieve my financial goals
3 Neither agree nor disagree
All 2,208 34.5%
PROPPLAN_4 I prepare a clear plan of action w/ detailed steps to achieve my financial goals
4 Agree All 2,035 31.8%
PROPPLAN_4 I prepare a clear plan of action w/ detailed steps to achieve my financial goals
5 Strongly agree All 679 10.6%
MANAGE1_1 Paid all your bills on time -1 Refused All 12 0.2% MANAGE1_1 Paid all your bills on time 1 Not applicable or
never All 137 2.1%
MANAGE1_1 Paid all your bills on time 2 Seldom All 148 2.3% MANAGE1_1 Paid all your bills on time 3 Sometimes All 491 7.7% MANAGE1_1 Paid all your bills on time 4 Often All 940 14.7% MANAGE1_1 Paid all your bills on time 5 Always All 4,666 73.0%
34 NATIONAL FINANCIAL WELL-BEING SURVEY: PUBLIC USE FILE CODEBOOK
Variable Name Variable Label Response Value Response Label Base Unweighted
Frequency Unweighted Percent
MANAGE1_2 Stayed within your budget or spending plan
-1 Refused All 12 0.2%
MANAGE1_2 Stayed within your budget or spending plan
1 Not applicable or never
All 296 4.6%
MANAGE1_2 Stayed within your budget or spending plan
2 Seldom All 381 6.0%
MANAGE1_2 Stayed within your budget or spending plan
3 Sometimes All 1,397 21.8%
MANAGE1_2 Stayed within your budget or spending plan
4 Often All 2,434 38.1%
MANAGE1_2 Stayed within your budget or spending plan
5 Always All 1,874 29.3%
MANAGE1_3 Paid off credit card balance in full each month
-1 Refused All 11 0.2%
MANAGE1_3 Paid off credit card balance in full each month
1 Not applicable or never
All 1,208 18.9%
MANAGE1_3 Paid off credit card balance in full each month
2 Seldom All 640 10.0%
MANAGE1_3 Paid off credit card balance in full each month
3 Sometimes All 857 13.4%
MANAGE1_3 Paid off credit card balance in full each month
4 Often All 835 13.1%
MANAGE1_3 Paid off credit card balance in full each month
5 Always All 2,843 44.5%
35 NATIONAL FINANCIAL WELL-BEING SURVEY: PUBLIC USE FILE CODEBOOK
Variable Name Variable Label Response Value Response Label Base Unweighted
Frequency Unweighted Percent
MANAGE1_4 Checked your statements, bills and receipts to make sure there were no errors
-1 Refused All 11 0.2%
MANAGE1_4 Checked your statements, bills and receipts to make sure there were no errors
1 Not applicable or never
All 196 3.1%
MANAGE1_4 Checked your statements, bills and receipts to make sure there were no errors
2 Seldom All 325 5.1%
MANAGE1_4 Checked your statements, bills and receipts to make sure there were no errors
3 Sometimes All 833 13.0%
MANAGE1_4 Checked your statements, bills and receipts to make sure there were no errors
4 Often All 1,596 25.0%
MANAGE1_4 Checked your statements, bills and receipts to make sure there were no errors
5 Always All 3,433 53.7%
SAVEHABIT Putting money into savings is a habit for me
-1 Refused All 20 0.3%
SAVEHABIT Putting money into savings is a habit for me
1 Strongly disagree All 297 4.6%
SAVEHABIT Putting money into savings is a habit for me
2 Disagree All 610 9.5%
SAVEHABIT Putting money into savings is a habit for me
3 Disagree slightly All 659 10.3%
SAVEHABIT Putting money into savings is a habit for me
4 Agree slightly All 1,329 20.8%
SAVEHABIT Putting money into savings is a habit for me
5 Agree All 1,729 27.0%
SAVEHABIT Putting money into savings is a habit for me
6 Strongly agree All 1,750 27.4%
36 NATIONAL FINANCIAL WELL-BEING SURVEY: PUBLIC USE FILE CODEBOOK
Variable Name Variable Label Response Value Response Label Base Unweighted
Frequency Unweighted Percent
FRUGALITY If I can re-use an item I already have, there's no sense in buying something new
-1 Refused All 15 0.2%
FRUGALITY If I can re-use an item I already have, there's no sense in buying something new
1 Strongly disagree All 22 0.3%
FRUGALITY If I can re-use an item I already have, there's no sense in buying something new
2 Disagree All 50 0.8%
FRUGALITY If I can re-use an item I already have, there's no sense in buying something new
3 Disagree slightly All 195 3.0%
FRUGALITY If I can re-use an item I already have, there's no sense in buying something new
4 Agree slightly All 805 12.6%
FRUGALITY If I can re-use an item I already have, there's no sense in buying something new
5 Agree All 2,461 38.5%
FRUGALITY If I can re-use an item I already have, there's no sense in buying something new
6 Strongly agree All 2,846 44.5%
AUTOMATED_1 A Retirement Savings Account -1 Refused All 91 1.4% AUTOMATED_1 A Retirement Savings Account 0 No All 1,973 30.9% AUTOMATED_1 A Retirement Savings Account 1 Yes All 2,587 40.5% AUTOMATED_1 A Retirement Savings Account 7 I do not have this type
of account All 1,743 27.3%
AUTOMATED_2 A Non-Retirement Savings Account -1 Refused All 98 1.5% AUTOMATED_2 A Non-Retirement Savings Account 0 No All 2,328 36.4% AUTOMATED_2 A Non-Retirement Savings Account 1 Yes All 2,536 39.7% AUTOMATED_2 A Non-Retirement Savings Account 7 I do not have this type
of account All 1,432 22.4%
ASK1_1 I do my own research before making decisions involving money
-1 Refused All 27 0.4%
ASK1_1 I do my own research before making decisions involving money
1 Never All 212 3.3%
ASK1_1 I do my own research before making 2 Seldom All 470 7.4%

37 NATIONAL FINANCIAL WELL-BEING SURVEY: PUBLIC USE FILE CODEBOOK
Variable Name Variable Label Response Value Response Label Base Unweighted
Frequency Unweighted Percent
decisions involving money ASK1_1 I do my own research before making
decisions involving money 3 Sometimes All 1,797 28.1%
ASK1_1 I do my own research before making decisions involving money
4 Often All 2,321 36.3%
ASK1_1 I do my own research before making decisions involving money
5 Always All 1,567 24.5%
ASK1_2 I ask other people their opinions before making decisions involving money
-1 Refused All 26 0.4%
ASK1_2 I ask other people their opinions before making decisions involving money
1 Never All 704 11.0%
ASK1_2 I ask other people their opinions before making decisions involving money
2 Seldom All 1,478 23.1%
ASK1_2 I ask other people their opinions before making decisions involving money
3 Sometimes All 2,603 40.7%
ASK1_2 I ask other people their opinions before making decisions involving money
4 Often All 1,261 19.7%
ASK1_2 I ask other people their opinions before making decisions involving money
5 Always All 322 5.0%
SUBNUMERACY2 Prefers words for expressions of probabilities
-1 Refused All 39 0.6%
SUBNUMERACY2 Prefers words for expressions of probabilities
1 1 - Always prefer words
All 975 15.2%
SUBNUMERACY2 Prefers words for expressions of probabilities
2 2 All 535 8.4%
SUBNUMERACY2 Prefers words for expressions of probabilities
3 3 All 1,253 19.6%
SUBNUMERACY2 Prefers words for expressions of probabilities
4 4 All 1,378 21.6%
SUBNUMERACY2 Prefers words for expressions of probabilities
5 5 All 1,114 17.4%
38 NATIONAL FINANCIAL WELL-BEING SURVEY: PUBLIC USE FILE CODEBOOK
Variable Name Variable Label Response Value Response Label Base Unweighted
Frequency Unweighted Percent
SUBNUMERACY2 Prefers words for expressions of probabilities
6 6 - Always prefer numbers
All 1,100 17.2%
SUBNUMERACY1 How good are you at working with percentages?
-1 Refused All 33 0.5%
SUBNUMERACY1 How good are you at working with percentages?
1 1 - Not good at all All 362 5.7%
SUBNUMERACY1 How good are you at working with percentages?
2 2 All 336 5.3%
SUBNUMERACY1 How good are you at working with percentages?
3 3 All 786 12.3%
SUBNUMERACY1 How good are you at working with percentages?
4 4 All 1,600 25.0%
SUBNUMERACY1 How good are you at working with percentages?
5 5 All 1,748 27.3%
SUBNUMERACY1 How good are you at working with percentages?
6 6 - Extremely good All 1,529 23.9%
CHANGEABLE Belief that ability to manage money is NOT changeable
-1 Refused All 38 0.6%
CHANGEABLE Belief that ability to manage money is NOT changeable
1 Strongly disagree All 483 7.6%
CHANGEABLE Belief that ability to manage money is NOT changeable
2 Disagree All 1,148 18.0%
CHANGEABLE Belief that ability to manage money is NOT changeable
3 Somewhat disagree All 1,131 17.7%
CHANGEABLE Belief that ability to manage money is NOT changeable
4 Neither agree nor disagree
All 1,342 21.0%
CHANGEABLE Belief that ability to manage money is NOT changeable
5 Somewhat agree All 1,307 20.4%
CHANGEABLE Belief that ability to manage money is NOT changeable
6 Agree All 722 11.3%
CHANGEABLE Belief that ability to manage money is NOT changeable
7 Strongly agree All 223 3.5%
GOALCONF Confidence in own ability to achieve financial goals
-1 Refused All 28 0.4%
GOALCONF Confidence in own ability to achieve financial goals
1 Not at all confident All 129 2.0%
39 NATIONAL FINANCIAL WELL-BEING SURVEY: PUBLIC USE FILE CODEBOOK
Variable Name Variable Label Response Value Response Label Base Unweighted
Frequency Unweighted Percent
GOALCONF Confidence in own ability to achieve financial goals
2 Not very confident All 735 11.5%
GOALCONF Confidence in own ability to achieve financial goals
3 Somewhat confident All 3,035 47.5%
GOALCONF Confidence in own ability to achieve financial goals
4 Very confident All 2,467 38.6%
LMscore Lusardi and Mitchell financial knowledge scale score
0 All 137 2.1%
LMscore Lusardi and Mitchell financial knowledge scale score
1 All 613 9.6%
LMscore Lusardi and Mitchell financial knowledge scale score
2 All 1,520 23.8%
LMscore Lusardi and Mitchell financial knowledge scale score
3 All 4,124 64.5%
FINKNOWL1 Understanding of compound interest -1 Refused All 30 0.5% FINKNOWL1 Understanding of compound interest 1 More than $102 All 5,518 86.3% FINKNOWL1 Understanding of compound interest 2 Exactly $102 All 472 7.4% FINKNOWL1 Understanding of compound interest 3 Less than $102 All 374 5.8% FINKNOWL2 Understanding of inflation and return
on savings -1 Refused All 38 0.6%
FINKNOWL2 Understanding of inflation and return on savings
1 More than today All 596 9.3%
FINKNOWL2 Understanding of inflation and return on savings
2 Exactly the same All 812 12.7%
FINKNOWL2 Understanding of inflation and return on savings
3 Less than today All 4,948 77.4%
FINKNOWL3 Understanding of stock vs mutual fund volatility
All
FINKNOWL3 Understanding of stock vs mutual fund volatility
-1 Refused All 45 0.7%
FINKNOWL3 Understanding of stock vs mutual fund volatility
1 True All 790 12.4%
FINKNOWL3 Understanding of stock vs mutual fund volatility
2 False All 5,559 86.9%
FK1correct FINKNOWL1 answered correctly 0 No All 876 13.7%
40 NATIONAL FINANCIAL WELL-BEING SURVEY: PUBLIC USE FILE CODEBOOK
Variable Name Variable Label Response Value Response Label Base Unweighted
Frequency Unweighted Percent
FK1correct FINKNOWL1 answered correctly 1 Yes All 5,518 86.3% FK2correct FINKNOWL2 answered correctly 0 No All 1,446 22.6% FK2correct FINKNOWL2 answered correctly 1 Yes All 4,948 77.4% FK3correct FINKNOWL3 answered correctly 0 No All 835 13.1% FK3correct FINKNOWL3 answered correctly 1 Yes All 5,559 86.9% KHscore Knoll and Houts financial knowledge
scale score -2.053 All 23 0.4%
KHscore Knoll and Houts financial knowledge scale score
-1.9 All 42 0.7%
KHscore Knoll and Houts financial knowledge scale score
-1.713 All 127 2.0%
KHscore Knoll and Houts financial knowledge scale score
-1.485 All 242 3.8%
KHscore Knoll and Houts financial knowledge scale score
-1.215 All 376 5.9%
KHscore Knoll and Houts financial knowledge scale score
-0.909 All 595 9.3%
KHscore Knoll and Houts financial knowledge scale score
-0.57 All 833 13.0%
KHscore Knoll and Houts financial knowledge scale score
-0.188 All 1,031 16.1%
KHscore Knoll and Houts financial knowledge scale score
0.242 All 1,259 19.7%
KHscore Knoll and Houts financial knowledge scale score
0.712 All 1,194 18.7%
KHscore Knoll and Houts financial knowledge scale score
1.267 All 672 10.5%
KHKNOWL1 Understanding of long-term returns on investment
-1 Refused All 45 0.7%
KHKNOWL1 Understanding of long-term returns on investment
1 Savings accounts All 560 8.8%
KHKNOWL1 Understanding of long-term returns on investment
2 Bonds All 1,921 30.0%
KHKNOWL1 Understanding of long-term returns on investment
3 Stocks All 3,868 60.5%
41 NATIONAL FINANCIAL WELL-BEING SURVEY: PUBLIC USE FILE CODEBOOK
Variable Name Variable Label Response Value Response Label Base Unweighted
Frequency Unweighted Percent
KHKNOWL2 Understanding of stocks vs bond vs savings volatility
-1 Refused All 41 0.6%
KHKNOWL2 Understanding of stocks vs bond vs savings volatility
1 Savings accounts All 406 6.3%
KHKNOWL2 Understanding of stocks vs bond vs savings volatility
2 Bonds All 553 8.6%
KHKNOWL2 Understanding of stocks vs bond vs savings volatility
3 Stocks All 5,394 84.4%
KHKNOWL3 Understanding of benefits of diversification
-1 Refused All 68 1.1%
KHKNOWL3 Understanding of benefits of diversification
1 Increase All 1,046 16.4%
KHKNOWL3 Understanding of benefits of diversification
2 Decrease All 4,296 67.2%
KHKNOWL3 Understanding of benefits of diversification
3 Stay the same All 984 15.4%
KHKNOWL4 Understanding of possibility of stock market losses
-1 Refused All 39 0.6%
KHKNOWL4 Understanding of possibility of stock market losses
1 True All 5,294 82.8%
KHKNOWL4 Understanding of possibility of stock market losses
2 False All 1,061 16.6%
KHKNOWL5 Understanding of life insurance -1 Refused All 45 0.7% KHKNOWL5 Understanding of life insurance 1 True All 4,781 74.8% KHKNOWL5 Understanding of life insurance 2 False All 1,568 24.5%
KHKNOWL6 Understanding of possibility of housing market losses
-1 Refused All 30 0.5%
KHKNOWL6 Understanding of possibility of housing market losses
1 True All 492 7.7%
KHKNOWL6 Understanding of possibility of housing market losses
2 False All 5,872 91.8%
KHKNOWL7 Understanding of credit card minimum payments
-1 Refused All 40 0.6%
KHKNOWL7 Understanding of credit card minimum payments
1 Less than 5 years All 282 4.4%

42 NATIONAL FINANCIAL WELL-BEING SURVEY: PUBLIC USE FILE CODEBOOK
Variable Name Variable Label Response Value Response Label Base Unweighted
Frequency Unweighted Percent
KHKNOWL7 Understanding of credit card minimum payments
2 Between 5 and 10 years
All 1,329 20.8%
KHKNOWL7 Understanding of credit card minimum payments
3 Between 10 and 15 years
All 1,934 30.2%
KHKNOWL7 Understanding of credit card minimum payments
4 Never, you will continue to be in debt
All 2,809 43.9%
KHKNOWL8 Understanding of relationship of bonds and interest rates
-1 Refused All 51 0.8%
KHKNOWL8 Understanding of relationship of bonds and interest rates
1 They will rise All 1,793 28.0%
KHKNOWL8 Understanding of relationship of bonds and interest rates
2 They will fall All 2,243 35.1%
KHKNOWL8 Understanding of relationship of bonds and interest rates
3 They will stay the same
All 803 12.6%
KHKNOWL8 Understanding of relationship of bonds and interest rates
4 There is no relationship between bond prices and the interest rate
All 1,504 23.5%
KHKNOWL9 Understanding of mortgage term length on total interest paid
-1 Refused All 34 0.5%
KHKNOWL9 Understanding of mortgage term length on total interest paid
1 True All 5,749 89.9%
KHKNOWL9 Understanding of mortgage term length on total interest paid
2 False All 611 9.6%
KH1correct KHKNOWL1 answered correctly 0 No All 2,526 39.5% KH1correct KHKNOWL1 answered correctly 1 Yes All 3,868 60.5% KH2correct KHKNOWL2 answered correctly 0 No All 1,000 15.6% KH2correct KHKNOWL2 answered correctly 1 Yes All 5,394 84.4% KH3correct KHKNOWL3 answered correctly 0 No All 2,098 32.8% KH3correct KHKNOWL3 answered correctly 1 Yes All 4,296 67.2% KH4correct KHKNOWL4 answered correctly 0 No All 1,100 17.2% KH4correct KHKNOWL4 answered correctly 1 Yes All 5,294 82.8% KH5correct KHKNOWL5 answered correctly 0 No All 1,613 25.2% KH5correct KHKNOWL5 answered correctly 1 Yes All 4,781 74.8%
43 NATIONAL FINANCIAL WELL-BEING SURVEY: PUBLIC USE FILE CODEBOOK
Variable Name Variable Label Response Value Response Label Base Unweighted
Frequency Unweighted Percent
KH6correct KHKNOWL6 answered correctly 0 No All 522 8.2% KH6correct KHKNOWL6 answered correctly 1 Yes All 5,872 91.8% KH7correct KHKNOWL7 answered correctly 0 No All 3,585 56.1% KH7correct KHKNOWL7 answered correctly 1 Yes All 2,809 43.9% KH8correct KHKNOWL8 answered correctly 0 No All 4,151 64.9% KH8correct KHKNOWL8 answered correctly 1 Yes All 2,243 35.1% KH9correct KHKNOWL9 answered correctly 0 No All 645 10.1% KH9correct KHKNOWL9 answered correctly 1 Yes All 5,749 89.9% ENDSMEET Difficulty of covering monthly
expenses and bills -1 Refused All 44 0.7%
ENDSMEET Difficulty of covering monthly expenses and bills
1 Not at all difficult All 3,896 60.9%
ENDSMEET Difficulty of covering monthly expenses and bills
2 Somewhat difficult All 1,975 30.9%
ENDSMEET Difficulty of covering monthly expenses and bills
3 Very difficult All 479 7.5%
HOUSING Which one of the following best describes your housing situation?
-1 Refused All 42 0.7%
HOUSING Which one of the following best describes your housing situation?
1 I own my home All 4,164 65.1%
HOUSING Which one of the following best describes your housing situation?
2 I rent All 1,643 25.7%
HOUSING Which one of the following best describes your housing situation?
3 I do not currently own or rent
All 545 8.5%

44 NATIONAL FINANCIAL WELL-BEING SURVEY: PUBLIC USE FILE CODEBOOK
Variable Name Variable Label Response Value Response Label Base Unweighted
Frequency Unweighted Percent
LIVINGARRANGEMENT Current living arrangements -1 Refused All 31 0.5% LIVINGARRANGEMENT Current living arrangements 1 I am the only adult in
the household All 1,129 17.7%
LIVINGARRANGEMENT Current living arrangements 2 I live with my spouse/partner/significant other
All 4,204 65.7%
LIVINGARRANGEMENT Current living arrangements 3 I live in my parents' home
All 450 7.0%
LIVINGARRANGEMENT Current living arrangements 4 I live with other family, friends, or roommates
All 453 7.1%
LIVINGARRANGEMENT Current living arrangements 5 Some other arrangement
All 127 2.0%
HOUSERANGES About how much do you pay for your home each month?
-1 Refused All 53 0.8%
HOUSERANGES About how much do you pay for your home each month?
1 Less than $300 All 1,101 17.2%
HOUSERANGES About how much do you pay for your home each month?
2 $300-499 All 471 7.4%
HOUSERANGES About how much do you pay for your home each month?
3 $500-749 All 889 13.9%
HOUSERANGES About how much do you pay for your home each month?
4 $750-999 All 833 13.0%
HOUSERANGES About how much do you pay for your home each month?
5 $1,000-1,499 All 1,066 16.7%
HOUSERANGES About how much do you pay for your home each month?
6 $1,500-1,999 All 545 8.5%
HOUSERANGES About how much do you pay for your home each month?
7 $2,000 or more All 565 8.8%
HOUSERANGES About how much do you pay for your home each month?
98 I don't know All 247 3.9%
HOUSERANGES About how much do you pay for your home each month? About how much do you pay for your home each month?
99 Prefer not to say All 624 9.8%
IMPUTATION_FLAG Value for HOUSERANGES was imputed
0 Not imputed All 5,987 93.6%

45 NATIONAL FINANCIAL WELL-BEING SURVEY: PUBLIC USE FILE CODEBOOK
Variable Name Variable Label Response Value Response Label Base Unweighted
Frequency Unweighted Percent
IMPUTATION_FLAG Value for HOUSERANGES was imputed
1 Imputed All 407 6.4%
VALUERANGES If you were to sell your home today, what do you think it would be worth?
-2 Question not asked because respondent not in item base
HOUSING=1
2,230 34.9%
VALUERANGES If you were to sell your home today, what do you think it would be worth?
-1 Refused HOUSING=1
7 0.1%
VALUERANGES If you were to sell your home today, what do you think it would be worth?
1 Less than $150,000 HOUSING=1
1,035 16.2%
VALUERANGES If you were to sell your home today, what do you think it would be worth?
2 $150,000-249,999 HOUSING=1
1,053 16.5%
VALUERANGES If you were to sell your home today, what do you think it would be worth?
3 $250,000-399,999 HOUSING=1
991 15.5%
VALUERANGES If you were to sell your home today, what do you think it would be worth?
4 $400,000 or more HOUSING=1
804 12.6%
VALUERANGES If you were to sell your home today, what do you think it would be worth?
98 I don't know HOUSING=1
115 1.8%
VALUERANGES If you were to sell your home today, what do you think it would be worth?
99 Prefer not to say HOUSING=1
159 2.5%
MORTGAGE What do you owe on your home today?
-2 Question not asked because respondent not in item base
HOUSING=1
2,230 34.9%
MORTGAGE What do you owe on your home today?
-1 Refused HOUSING=1
56 0.9%
MORTGAGE What do you owe on your home today?
1 Less than $50,000 HOUSING=1
1,512 23.6%
MORTGAGE What do you owe on your home today?
2 $50,000-199,999 HOUSING=1
1,361 21.3%
MORTGAGE What do you owe on your home today?
3 $200,000 or more HOUSING=1
622 9.7%
MORTGAGE What do you owe on your home today?
98 I don't know HOUSING=1
115 1.8%
MORTGAGE What do you owe on your home today?
99 Prefer not to say HOUSING=1
498 7.8%
SAVINGSRANGES How much money do you have in savings today...?
-1 Refused All 38 0.6%
46 NATIONAL FINANCIAL WELL-BEING SURVEY: PUBLIC USE FILE CODEBOOK
Variable Name Variable Label Response Value Response Label Base Unweighted
Frequency Unweighted Percent
SAVINGSRANGES How much money do you have in savings today...?
1 $0 All 440 6.9%
SAVINGSRANGES How much money do you have in savings today...?
2 $1-99 All 385 6.0%
SAVINGSRANGES How much money do you have in savings today...?
3 $100-999 All 682 10.7%
SAVINGSRANGES How much money do you have in savings today...?
4 $1,000-4,999 All 931 14.6%
SAVINGSRANGES How much money do you have in savings today...?
5 $5,000-19,999 All 1,093 17.1%
SAVINGSRANGES How much money do you have in savings today...?
6 $20,000-74,999 All 845 13.2%
SAVINGSRANGES How much money do you have in savings today...?
7 $75,000 or more All 834 13.0%
SAVINGSRANGES How much money do you have in savings today...?
98 I don't know All 158 2.5%
SAVINGSRANGES How much money do you have in savings today...?
99 Prefer not to say All 988 15.5%
PRODHAVE_1 Checking or Savings Account at a bank or credit union
0 No All 945 14.8%
PRODHAVE_1 Checking or Savings Account at a bank or credit union
1 Yes All 5,449 85.2%
PRODHAVE_2 Life Insurance 0 No All 3,086 48.3% PRODHAVE_2 Life Insurance 1 Yes All 3,308 51.7% PRODHAVE_3 Health Insurance 0 No All 1,836 28.7% PRODHAVE_3 Health Insurance 1 Yes All 4,558 71.3% PRODHAVE_4 Retirement Account (such as a 401k
or IRA) 0 No All 2,708 42.4%
PRODHAVE_4 Retirement Account (such as a 401k or IRA)
1 Yes All 3,686 57.6%
PRODHAVE_5 Pension 0 No All 4,221 66.0% PRODHAVE_5 Pension 1 Yes All 2,173 34.0% PRODHAVE_6 Non-Retirement Investments (such as
stocks, bonds or mutual funds) 0 No All 4,382 68.5%
PRODHAVE_6 Non-Retirement Investments (such as 1 Yes All 2,012 31.5%
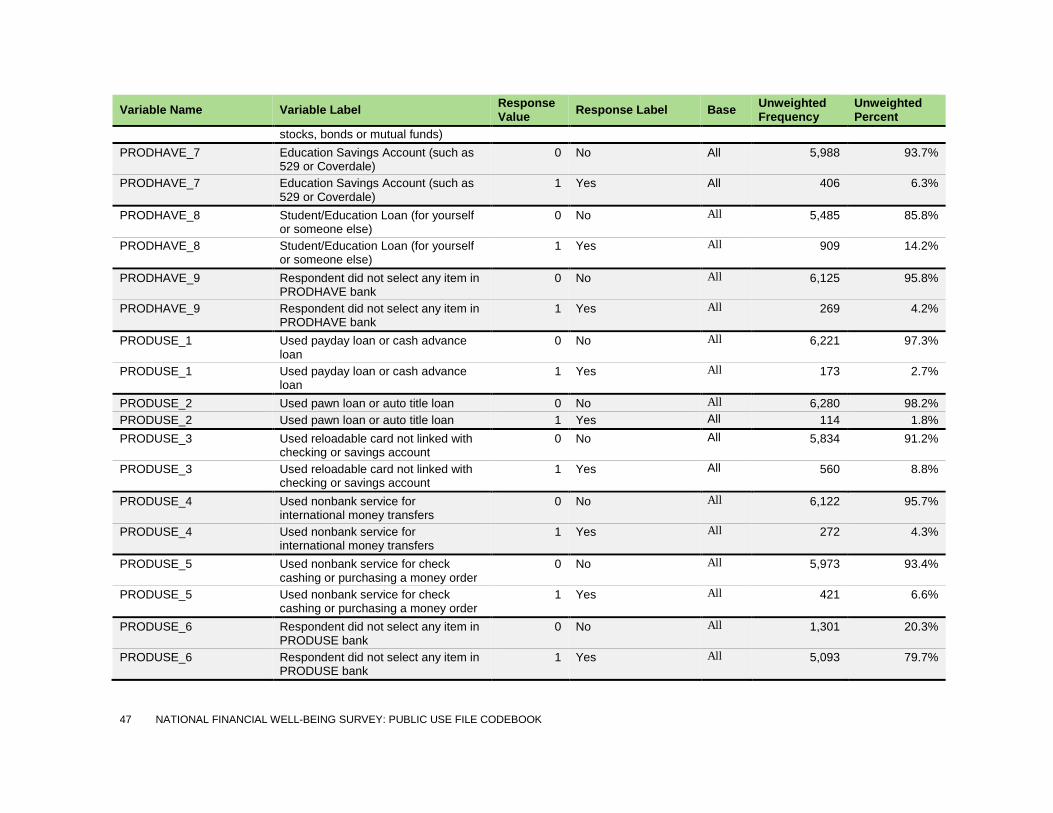
47 NATIONAL FINANCIAL WELL-BEING SURVEY: PUBLIC USE FILE CODEBOOK
Variable Name Variable Label Response Value Response Label Base Unweighted
Frequency Unweighted Percent
stocks, bonds or mutual funds) PRODHAVE_7 Education Savings Account (such as
529 or Coverdale) 0 No All 5,988 93.7%
PRODHAVE_7 Education Savings Account (such as 529 or Coverdale)
1 Yes All 406 6.3%
PRODHAVE_8 Student/Education Loan (for yourself or someone else)
0 No All 5,485 85.8%
PRODHAVE_8 Student/Education Loan (for yourself or someone else)
1 Yes All 909 14.2%
PRODHAVE_9 Respondent did not select any item in PRODHAVE bank
0 No All 6,125 95.8%
PRODHAVE_9 Respondent did not select any item in PRODHAVE bank
1 Yes All 269 4.2%
PRODUSE_1 Used payday loan or cash advance loan
0 No All 6,221 97.3%
PRODUSE_1 Used payday loan or cash advance loan
1 Yes All 173 2.7%
PRODUSE_2 Used pawn loan or auto title loan 0 No All 6,280 98.2% PRODUSE_2 Used pawn loan or auto title loan 1 Yes All 114 1.8% PRODUSE_3 Used reloadable card not linked with
checking or savings account 0 No All 5,834 91.2%
PRODUSE_3 Used reloadable card not linked with checking or savings account
1 Yes All 560 8.8%
PRODUSE_4 Used nonbank service for international money transfers
0 No All 6,122 95.7%
PRODUSE_4 Used nonbank service for international money transfers
1 Yes All 272 4.3%
PRODUSE_5 Used nonbank service for check cashing or purchasing a money order
0 No All 5,973 93.4%
PRODUSE_5 Used nonbank service for check cashing or purchasing a money order
1 Yes All 421 6.6%
PRODUSE_6 Respondent did not select any item in PRODUSE bank
0 No All 1,301 20.3%
PRODUSE_6 Respondent did not select any item in PRODUSE bank
1 Yes All 5,093 79.7%

48 NATIONAL FINANCIAL WELL-BEING SURVEY: PUBLIC USE FILE CODEBOOK
Variable Name Variable Label Response Value Response Label Base Unweighted
Frequency Unweighted Percent
CONSPROTECT1 Frequency felt not respected or mistreated w/ financial services
-1 Refused All 50 0.8%
CONSPROTECT1 Frequency felt not respected or mistreated w/ financial services
1 Never All 2,540 39.7%
CONSPROTECT1 Frequency felt not respected or mistreated w/ financial services
2 Rarely All 2,629 41.1%
CONSPROTECT1 Frequency felt not respected or mistreated w/ financial services
3 Sometimes All 1,001 15.7%
CONSPROTECT1 Frequency felt not respected or mistreated w/ financial services
4 Often All 174 2.7%
CONSPROTECT2 Familiarity w/ agencies and orgs to resolve problems w/ financial services
-1 Refused All 47 0.7%
CONSPROTECT2 Familiarity w/ agencies and orgs to resolve problems w/ financial services
1 Not at all familiar All 3,516 55.0%
CONSPROTECT2 Familiarity w/ agencies and orgs to resolve problems w/ financial services
2 Somewhat familiar All 2,351 36.8%
CONSPROTECT2 Familiarity w/ agencies and orgs to resolve problems w/ financial services
3 Very familiar All 480 7.5%
CONSPROTECT3 Reported problem to one of these agencies or orgs
-1 Refused All 54 0.8%
CONSPROTECT3 Reported problem to one of these agencies or orgs
0 No All 5,894 92.2%
CONSPROTECT3 Reported problem to one of these agencies or orgs
1 Yes All 446 7.0%
EARNERS Household members currently contributing to paying household bills
-1 Refused All 78 1.2%
EARNERS Household members currently contributing to paying household bills
1 One All 2,442 38.2%
EARNERS Household members currently contributing to paying household bills
2 Two All 3,532 55.2%
EARNERS Household members currently contributing to paying household bills
3 More than two All 342 5.3%
VOLATILITY Household income volatility -1 Refused All 64 1.0% VOLATILITY Household income volatility 1 Roughly the same
each month All 4,613 72.1%
VOLATILITY Household income volatility 2 Roughly the same All 1,303 20.4%

49 NATIONAL FINANCIAL WELL-BEING SURVEY: PUBLIC USE FILE CODEBOOK
Variable Name Variable Label Response Value Response Label Base Unweighted
Frequency Unweighted Percent
most months, but some unusually high or low months during the year
VOLATILITY Household income volatility 3 Often varies quite a bit from one month to the next
All 414 6.5%
SNAP Any household member received SNAP benefits
-1 Refused All 48 0.8%
SNAP Any household member received SNAP benefits
0 No All 5,618 87.9%
SNAP Any household member received SNAP benefits
1 Yes All 614 9.6%
SNAP Any household member received SNAP benefits
8 Not sure All 114 1.8%
MATHARDSHIP_1 Worried whether food would run out before got money to buy more
-1 Refused All 27 0.4%
MATHARDSHIP_1 Worried whether food would run out before got money to buy more
1 Never All 5,224 81.7%
MATHARDSHIP_1 Worried whether food would run out before got money to buy more
2 Sometimes All 854 13.4%
MATHARDSHIP_1 Worried whether food would run out before got money to buy more
3 Often All 289 4.5%
MATHARDSHIP_2 Food didn’t last and didn’t have money to get more
-1 Refused All 27 0.4%
MATHARDSHIP_2 Food didn’t last and didn’t have money to get more
1 Never All 5,360 83.8%
MATHARDSHIP_2 Food didn’t last and didn’t have money to get more
2 Sometimes All 767 12.0%
MATHARDSHIP_2 Food didn’t last and didn’t have money to get more
3 Often All 240 3.8%
MATHARDSHIP_3 Couldn't afford a place to live -1 Refused All 26 0.4% MATHARDSHIP_3 Couldn't afford a place to live 1 Never All 5,790 90.6% MATHARDSHIP_3 Couldn't afford a place to live 2 Sometimes All 412 6.4% MATHARDSHIP_3 Couldn't afford a place to live 3 Often All 166 2.6% MATHARDSHIP_4 Any household member couldn't -1 Refused All 27 0.4%

50 NATIONAL FINANCIAL WELL-BEING SURVEY: PUBLIC USE FILE CODEBOOK
Variable Name Variable Label Response Value Response Label Base Unweighted
Frequency Unweighted Percent
afford to see doctor or go to hospital MATHARDSHIP_4 Any household member couldn't
afford to see doctor or go to hospital 1 Never All 5,331 83.4%
MATHARDSHIP_4 Any household member couldn't afford to see doctor or go to hospital
2 Sometimes All 804 12.6%
MATHARDSHIP_4 Any household member couldn't afford to see doctor or go to hospital
3 Often All 232 3.6%
MATHARDSHIP_5 Any household member stopped taking medication or took less due to costs
-1 Refused All 25 0.4%
MATHARDSHIP_5 Any household member stopped taking medication or took less due to costs
1 Never All 5,436 85.0%
MATHARDSHIP_5 Any household member stopped taking medication or took less due to costs
2 Sometimes All 753 11.8%
MATHARDSHIP_5 Any household member stopped taking medication or took less due to costs
3 Often All 180 2.8%
MATHARDSHIP_6 Utilities shut off due to non-payment -1 Refused All 28 0.4% MATHARDSHIP_6 Utilities shut off due to non-payment 1 Never All 5,930 92.7% MATHARDSHIP_6 Utilities shut off due to non-payment 2 Sometimes All 356 5.6% MATHARDSHIP_6 Utilities shut off due to non-payment 3 Often All 80 1.3% COLLECT Contacted by debt collector in past 12
months -1 Refused All 55 0.9%
COLLECT Contacted by debt collector in past 12 months
0 No All 5,263 82.3%
COLLECT Contacted by debt collector in past 12 months
1 Yes All 838 13.1%
COLLECT Contacted by debt collector in past 12 months
8 Not sure All 238 3.7%
REJECTED_1 I applied for credit and was turned down
-1 Refused All 72 1.1%
REJECTED_1 I applied for credit and was turned down
0 No All 5,680 88.8%
REJECTED_1 I applied for credit and was turned 1 Yes All 642 10.0%

51 NATIONAL FINANCIAL WELL-BEING SURVEY: PUBLIC USE FILE CODEBOOK
Variable Name Variable Label Response Value Response Label Base Unweighted
Frequency Unweighted Percent
down REJECTED_2 I did not apply for credit because I
thought would be turned down -1 Refused All 128 2.0%
REJECTED_2 I did not apply for credit because I thought would be turned down
0 No All 5,503 86.1%
REJECTED_2 I did not apply for credit because I thought would be turned down
1 Yes All 763 11.9%
ABSORBSHOCK Confidence in ability to raise $2,000 in 30 days
-1 Refused All 37 0.6%
ABSORBSHOCK Confidence in ability to raise $2,000 in 30 days
1 I am certain I could not come up with $2,000
All 811 12.7%
ABSORBSHOCK Confidence in ability to raise $2,000 in 30 days
2 I could probably not come up with $2,000
All 426 6.7%
ABSORBSHOCK Confidence in ability to raise $2,000 in 30 days
3 I could probably come up with $2,000
All 937 14.7%
ABSORBSHOCK Confidence in ability to raise $2,000 in 30 days
4 I am certain I could come up with the full $2,000
All 3,853 60.3%
ABSORBSHOCK Confidence in ability to raise $2,000 in 30 days
8 I don't know All 330 5.2%
BENEFITS_1 Health Insurance -1 Refused All 35 0.5% BENEFITS_1 Health Insurance 0 No All 1,843 28.8% BENEFITS_1 Health Insurance 1 Yes All 4,516 70.6% BENEFITS_2 401(k) or Other Employer-Sponsored
Retirement Savings Account -1 Refused All 34 0.5%
BENEFITS_2 401(k) or Other Employer-Sponsored Retirement Savings Account
0 No All 2,912 45.5%
BENEFITS_2 401(k) or Other Employer-Sponsored Retirement Savings Account
1 Yes All 3,448 53.9%
BENEFITS_3 Defined-Benefit Pension -1 Refused All 42 0.7% BENEFITS_3 Defined-Benefit Pension 0 No All 4,266 66.7% BENEFITS_3 Defined-Benefit Pension 1 Yes All 2,086 32.6% BENEFITS_4 Tuition Reimbursement and/or
Student Debt Repayment -1 Refused All 43 0.7%
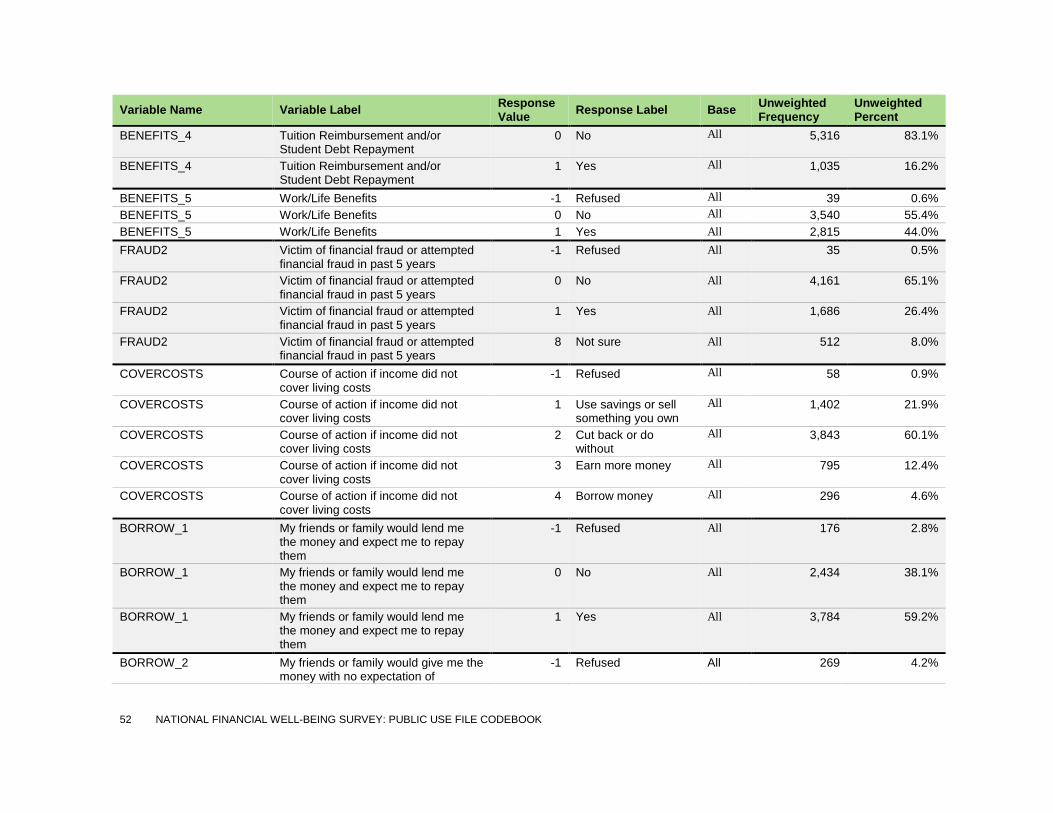
52 NATIONAL FINANCIAL WELL-BEING SURVEY: PUBLIC USE FILE CODEBOOK
Variable Name Variable Label Response Value Response Label Base Unweighted
Frequency Unweighted Percent
BENEFITS_4 Tuition Reimbursement and/or Student Debt Repayment
0 No All 5,316 83.1%
BENEFITS_4 Tuition Reimbursement and/or Student Debt Repayment
1 Yes All 1,035 16.2%
BENEFITS_5 Work/Life Benefits -1 Refused All 39 0.6% BENEFITS_5 Work/Life Benefits 0 No All 3,540 55.4% BENEFITS_5 Work/Life Benefits 1 Yes All 2,815 44.0% FRAUD2 Victim of financial fraud or attempted
financial fraud in past 5 years -1 Refused All 35 0.5%
FRAUD2 Victim of financial fraud or attempted financial fraud in past 5 years
0 No All 4,161 65.1%
FRAUD2 Victim of financial fraud or attempted financial fraud in past 5 years
1 Yes All 1,686 26.4%
FRAUD2 Victim of financial fraud or attempted financial fraud in past 5 years
8 Not sure All 512 8.0%
COVERCOSTS Course of action if income did not cover living costs
-1 Refused All 58 0.9%
COVERCOSTS Course of action if income did not cover living costs
1 Use savings or sell something you own
All 1,402 21.9%
COVERCOSTS Course of action if income did not cover living costs
2 Cut back or do without
All 3,843 60.1%
COVERCOSTS Course of action if income did not cover living costs
3 Earn more money All 795 12.4%
COVERCOSTS Course of action if income did not cover living costs
4 Borrow money All 296 4.6%
BORROW_1 My friends or family would lend me the money and expect me to repay them
-1 Refused All 176 2.8%
BORROW_1 My friends or family would lend me the money and expect me to repay them
0 No All 2,434 38.1%
BORROW_1 My friends or family would lend me the money and expect me to repay them
1 Yes All 3,784 59.2%
BORROW_2 My friends or family would give me the money with no expectation of
-1 Refused All 269 4.2%
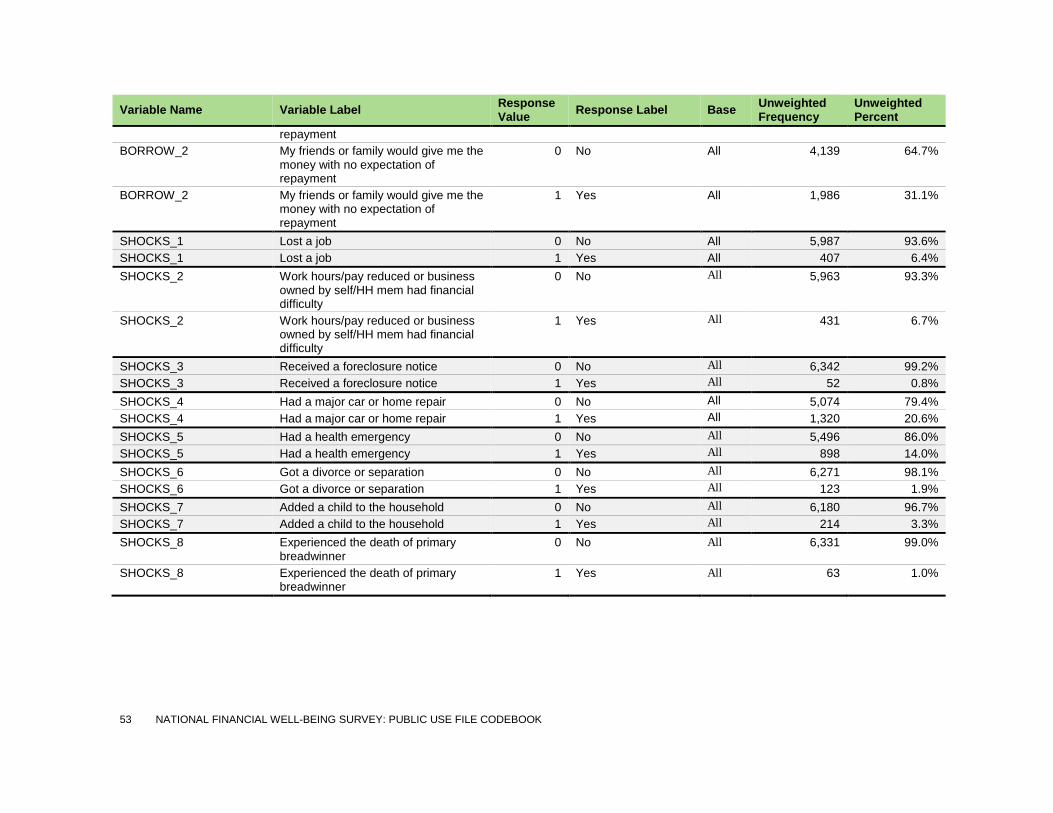
53 NATIONAL FINANCIAL WELL-BEING SURVEY: PUBLIC USE FILE CODEBOOK
Variable Name Variable Label Response Value Response Label Base Unweighted
Frequency Unweighted Percent
repayment BORROW_2 My friends or family would give me the
money with no expectation of repayment
0 No All 4,139 64.7%
BORROW_2 My friends or family would give me the money with no expectation of repayment
1 Yes All 1,986 31.1%
SHOCKS_1 Lost a job 0 No All 5,987 93.6% SHOCKS_1 Lost a job 1 Yes All 407 6.4% SHOCKS_2 Work hours/pay reduced or business
owned by self/HH mem had financial difficulty
0 No All 5,963 93.3%
SHOCKS_2 Work hours/pay reduced or business owned by self/HH mem had financial difficulty
1 Yes All 431 6.7%
SHOCKS_3 Received a foreclosure notice 0 No All 6,342 99.2% SHOCKS_3 Received a foreclosure notice 1 Yes All 52 0.8% SHOCKS_4 Had a major car or home repair 0 No All 5,074 79.4% SHOCKS_4 Had a major car or home repair 1 Yes All 1,320 20.6% SHOCKS_5 Had a health emergency 0 No All 5,496 86.0% SHOCKS_5 Had a health emergency 1 Yes All 898 14.0% SHOCKS_6 Got a divorce or separation 0 No All 6,271 98.1% SHOCKS_6 Got a divorce or separation 1 Yes All 123 1.9% SHOCKS_7 Added a child to the household 0 No All 6,180 96.7% SHOCKS_7 Added a child to the household 1 Yes All 214 3.3% SHOCKS_8 Experienced the death of primary
breadwinner 0 No All 6,331 99.0%
SHOCKS_8 Experienced the death of primary breadwinner
1 Yes All 63 1.0%

54 NATIONAL FINANCIAL WELL-BEING SURVEY: PUBLIC USE FILE CODEBOOK
Variable Name Variable Label Response Value Response Label Base Unweighted
Frequency Unweighted Percent
SHOCKS_9 Received a large sum of money beyond normal income
0 No All 5,981 93.5%
SHOCKS_9 Received a large sum of money beyond normal income
1 Yes All 413 6.5%
SHOCKS_10 Had a child start daycare or college 0 No All 6,143 96.1% SHOCKS_10 Had a child start daycare or college 1 Yes All 251 3.9% SHOCKS_11 Provided unexpected financial support
to a family member or friend 0 No All 5,555 86.9%
SHOCKS_11 Provided unexpected financial support to a family member or friend
1 Yes All 839 13.1%
SHOCKS_12 Respondent did not select any item in SHOCKS bank
0 No All 3,215 50.3%
SHOCKS_12 Respondent did not select any item in SHOCKS bank
1 Yes All 3,179 49.7%
MANAGE2 Who in household makes financial decisions
-1 Refused All 66 1.0%
MANAGE2 Who in household makes financial decisions
1 Someone else takes care of all or most money matters in my household.
All 814 12.7%
MANAGE2 Who in household makes financial decisions
2 Someone else and I take care of money matters in my household about the same.
All 2,270 35.5%
MANAGE2 Who in household makes financial decisions
3 I take care of all or most money matters in my household.
All 3,244 50.7%
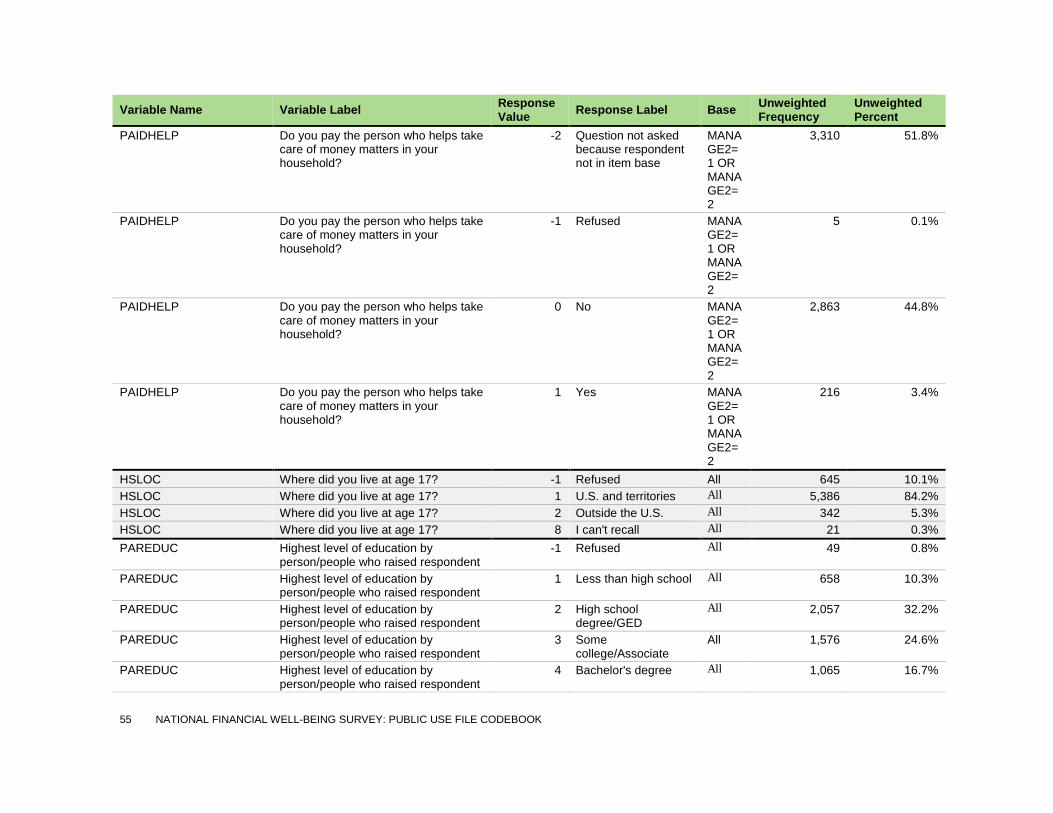
55 NATIONAL FINANCIAL WELL-BEING SURVEY: PUBLIC USE FILE CODEBOOK
Variable Name Variable Label Response Value Response Label Base Unweighted
Frequency Unweighted Percent
PAIDHELP Do you pay the person who helps take care of money matters in your household?
-2 Question not asked because respondent not in item base
MANAGE2=1 OR MANAGE2=2
3,310 51.8%
PAIDHELP Do you pay the person who helps take care of money matters in your household?
-1 Refused MANAGE2=1 OR MANAGE2=2
5 0.1%
PAIDHELP Do you pay the person who helps take care of money matters in your household?
0 No MANAGE2=1 OR MANAGE2=2
2,863 44.8%
PAIDHELP Do you pay the person who helps take care of money matters in your household?
1 Yes MANAGE2=1 OR MANAGE2=2
216 3.4%
HSLOC Where did you live at age 17? -1 Refused All 645 10.1% HSLOC Where did you live at age 17? 1 U.S. and territories All 5,386 84.2% HSLOC Where did you live at age 17? 2 Outside the U.S. All 342 5.3% HSLOC Where did you live at age 17? 8 I can't recall All 21 0.3% PAREDUC Highest level of education by
person/people who raised respondent -1 Refused All 49 0.8%
PAREDUC Highest level of education by person/people who raised respondent
1 Less than high school All 658 10.3%
PAREDUC Highest level of education by person/people who raised respondent
2 High school degree/GED
All 2,057 32.2%
PAREDUC Highest level of education by person/people who raised respondent
3 Some college/Associate
All 1,576 24.6%
PAREDUC Highest level of education by person/people who raised respondent
4 Bachelor's degree All 1,065 16.7%

56 NATIONAL FINANCIAL WELL-BEING SURVEY: PUBLIC USE FILE CODEBOOK
Variable Name Variable Label Response Value Response Label Base Unweighted
Frequency Unweighted Percent
PAREDUC Highest level of education by person/people who raised respondent
5 Graduate/professional degree
All 989 15.5%
FINSOC2_1 Discussed family financial matters with me
-1 Refused All 21 0.3%
FINSOC2_1 Discussed family financial matters with me
0 No All 4,168 65.2%
FINSOC2_1 Discussed family financial matters with me
1 Yes All 2,205 34.5%
FINSOC2_2 Spoke to me about the importance of saving
-1 Refused All 19 0.3%
FINSOC2_2 Spoke to me about the importance of saving
0 No All 2,201 34.4%
FINSOC2_2 Spoke to me about the importance of saving
1 Yes All 4,174 65.3%
FINSOC2_3 Discussed how to establish a good credit rating
-1 Refused All 22 0.3%
FINSOC2_3 Discussed how to establish a good credit rating
0 No All 4,044 63.2%
FINSOC2_3 Discussed how to establish a good credit rating
1 Yes All 2,328 36.4%
FINSOC2_4 Taught me how to be a smart shopper -1 Refused All 19 0.3% FINSOC2_4 Taught me how to be a smart shopper 0 No All 2,493 39.0% FINSOC2_4 Taught me how to be a smart shopper 1 Yes All 3,882 60.7% FINSOC2_5 Taught me that my actions determine
my success in life -1 Refused All 21 0.3%
FINSOC2_5 Taught me that my actions determine my success in life
0 No All 1,609 25.2%
FINSOC2_5 Taught me that my actions determine my success in life
1 Yes All 4,764 74.5%
FINSOC2_6 Provided me with a regular allowance -1 Refused All 22 0.3% FINSOC2_6 Provided me with a regular allowance 0 No All 3,800 59.4% FINSOC2_6 Provided me with a regular allowance 1 Yes All 2,572 40.2% FINSOC2_7 Provided me with a savings account -1 Refused All 22 0.3% FINSOC2_7 Provided me with a savings account 0 No All 3,689 57.7% FINSOC2_7 Provided me with a savings account 1 Yes All 2,683 42.0%
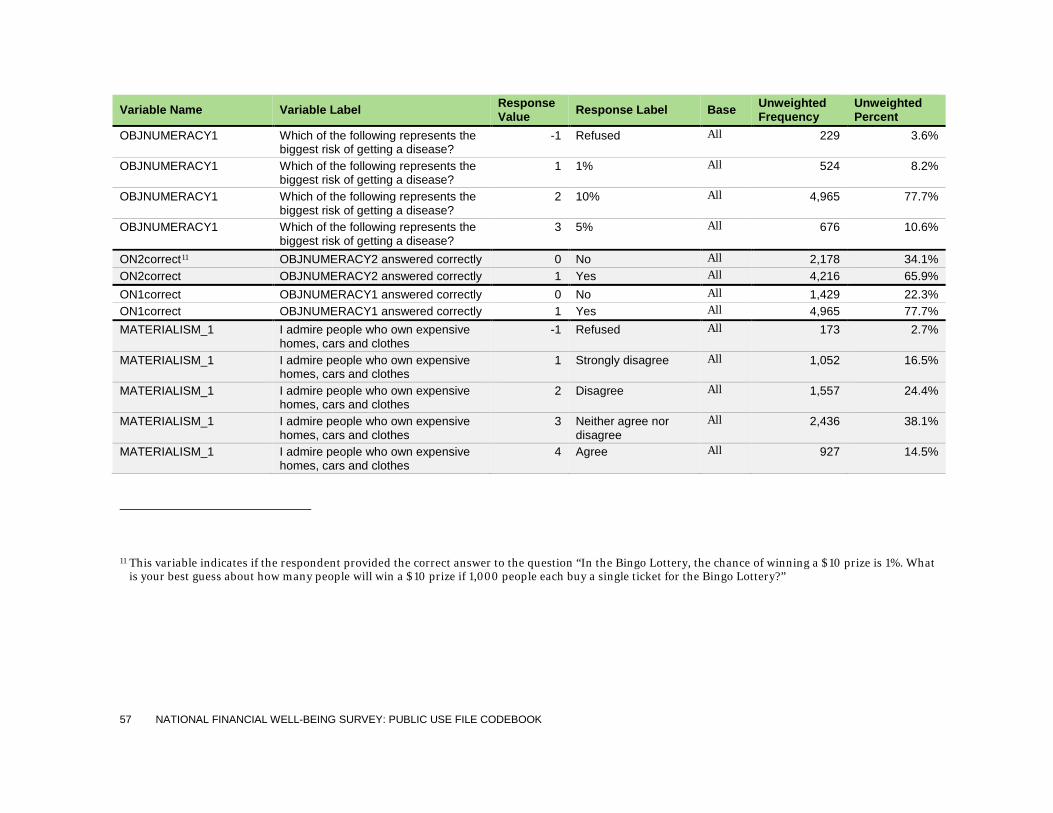
57 NATIONAL FINANCIAL WELL-BEING SURVEY: PUBLIC USE FILE CODEBOOK
Variable Name Variable Label Response Value Response Label Base Unweighted
Frequency Unweighted Percent
OBJNUMERACY1 Which of the following represents the biggest risk of getting a disease?
-1 Refused All 229 3.6%
OBJNUMERACY1 Which of the following represents the biggest risk of getting a disease?
1 1% All 524 8.2%
OBJNUMERACY1 Which of the following represents the biggest risk of getting a disease?
2 10% All 4,965 77.7%
OBJNUMERACY1 Which of the following represents the biggest risk of getting a disease?
3 5% All 676 10.6%
ON2correct11 OBJNUMERACY2 answered correctly 0 No All 2,178 34.1% ON2correct OBJNUMERACY2 answered correctly 1 Yes All 4,216 65.9% ON1correct OBJNUMERACY1 answered correctly 0 No All 1,429 22.3% ON1correct OBJNUMERACY1 answered correctly 1 Yes All 4,965 77.7% MATERIALISM_1 I admire people who own expensive
homes, cars and clothes -1 Refused All 173 2.7%
MATERIALISM_1 I admire people who own expensive homes, cars and clothes
1 Strongly disagree All 1,052 16.5%
MATERIALISM_1 I admire people who own expensive homes, cars and clothes
2 Disagree All 1,557 24.4%
MATERIALISM_1 I admire people who own expensive homes, cars and clothes
3 Neither agree nor disagree
All 2,436 38.1%
MATERIALISM_1 I admire people who own expensive homes, cars and clothes
4 Agree All 927 14.5%
11 This variable indicates if the respondent provided the correct answer to the question “In the Bingo Lottery, the chance of winning a $10 prize is 1%. What is your best guess about how many people will win a $10 prize if 1,000 people each buy a single ticket for the Bingo Lottery?”
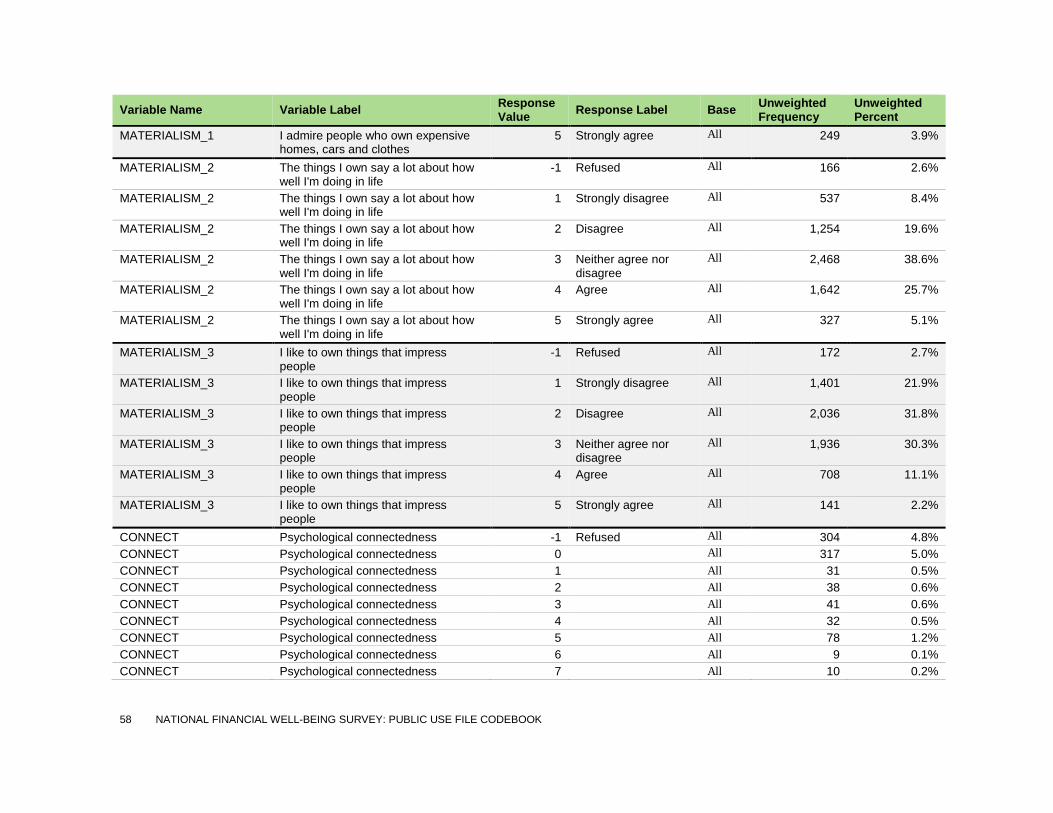
58 NATIONAL FINANCIAL WELL-BEING SURVEY: PUBLIC USE FILE CODEBOOK
Variable Name Variable Label Response Value Response Label Base Unweighted
Frequency Unweighted Percent
MATERIALISM_1 I admire people who own expensive homes, cars and clothes
5 Strongly agree All 249 3.9%
MATERIALISM_2 The things I own say a lot about how well I'm doing in life
-1 Refused All 166 2.6%
MATERIALISM_2 The things I own say a lot about how well I'm doing in life
1 Strongly disagree All 537 8.4%
MATERIALISM_2 The things I own say a lot about how well I'm doing in life
2 Disagree All 1,254 19.6%
MATERIALISM_2 The things I own say a lot about how well I'm doing in life
3 Neither agree nor disagree
All 2,468 38.6%
MATERIALISM_2 The things I own say a lot about how well I'm doing in life
4 Agree All 1,642 25.7%
MATERIALISM_2 The things I own say a lot about how well I'm doing in life
5 Strongly agree All 327 5.1%
MATERIALISM_3 I like to own things that impress people
-1 Refused All 172 2.7%
MATERIALISM_3 I like to own things that impress people
1 Strongly disagree All 1,401 21.9%
MATERIALISM_3 I like to own things that impress people
2 Disagree All 2,036 31.8%
MATERIALISM_3 I like to own things that impress people
3 Neither agree nor disagree
All 1,936 30.3%
MATERIALISM_3 I like to own things that impress people
4 Agree All 708 11.1%
MATERIALISM_3 I like to own things that impress people
5 Strongly agree All 141 2.2%
CONNECT Psychological connectedness -1 Refused All 304 4.8% CONNECT Psychological connectedness 0 All 317 5.0% CONNECT Psychological connectedness 1 All 31 0.5% CONNECT Psychological connectedness 2 All 38 0.6% CONNECT Psychological connectedness 3 All 41 0.6% CONNECT Psychological connectedness 4 All 32 0.5% CONNECT Psychological connectedness 5 All 78 1.2% CONNECT Psychological connectedness 6 All 9 0.1% CONNECT Psychological connectedness 7 All 10 0.2%
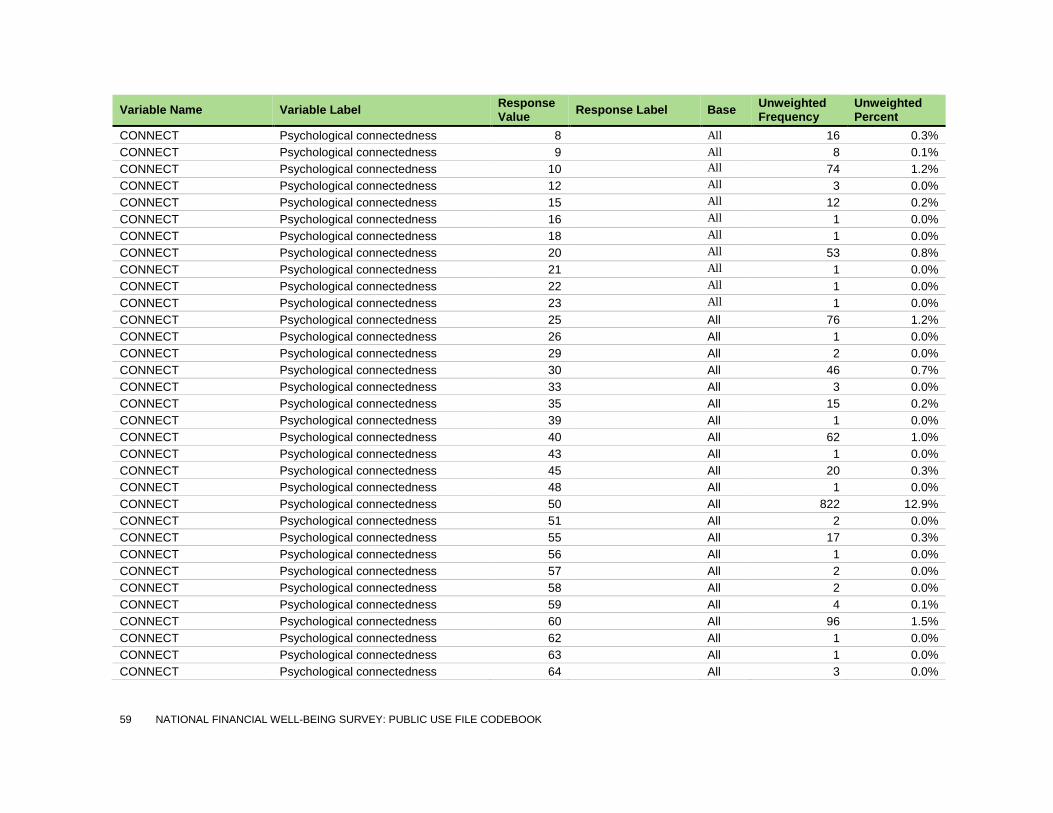
59 NATIONAL FINANCIAL WELL-BEING SURVEY: PUBLIC USE FILE CODEBOOK
Variable Name Variable Label Response Value Response Label Base Unweighted
Frequency Unweighted Percent
CONNECT Psychological connectedness 8 All 16 0.3% CONNECT Psychological connectedness 9 All 8 0.1% CONNECT Psychological connectedness 10 All 74 1.2% CONNECT Psychological connectedness 12 All 3 0.0% CONNECT Psychological connectedness 15 All 12 0.2% CONNECT Psychological connectedness 16 All 1 0.0% CONNECT Psychological connectedness 18 All 1 0.0% CONNECT Psychological connectedness 20 All 53 0.8% CONNECT Psychological connectedness 21 All 1 0.0% CONNECT Psychological connectedness 22 All 1 0.0% CONNECT Psychological connectedness 23 All 1 0.0% CONNECT Psychological connectedness 25 All 76 1.2% CONNECT Psychological connectedness 26 All 1 0.0% CONNECT Psychological connectedness 29 All 2 0.0% CONNECT Psychological connectedness 30 All 46 0.7% CONNECT Psychological connectedness 33 All 3 0.0% CONNECT Psychological connectedness 35 All 15 0.2% CONNECT Psychological connectedness 39 All 1 0.0% CONNECT Psychological connectedness 40 All 62 1.0% CONNECT Psychological connectedness 43 All 1 0.0% CONNECT Psychological connectedness 45 All 20 0.3% CONNECT Psychological connectedness 48 All 1 0.0% CONNECT Psychological connectedness 50 All 822 12.9% CONNECT Psychological connectedness 51 All 2 0.0% CONNECT Psychological connectedness 55 All 17 0.3% CONNECT Psychological connectedness 56 All 1 0.0% CONNECT Psychological connectedness 57 All 2 0.0% CONNECT Psychological connectedness 58 All 2 0.0% CONNECT Psychological connectedness 59 All 4 0.1% CONNECT Psychological connectedness 60 All 96 1.5% CONNECT Psychological connectedness 62 All 1 0.0% CONNECT Psychological connectedness 63 All 1 0.0% CONNECT Psychological connectedness 64 All 3 0.0%
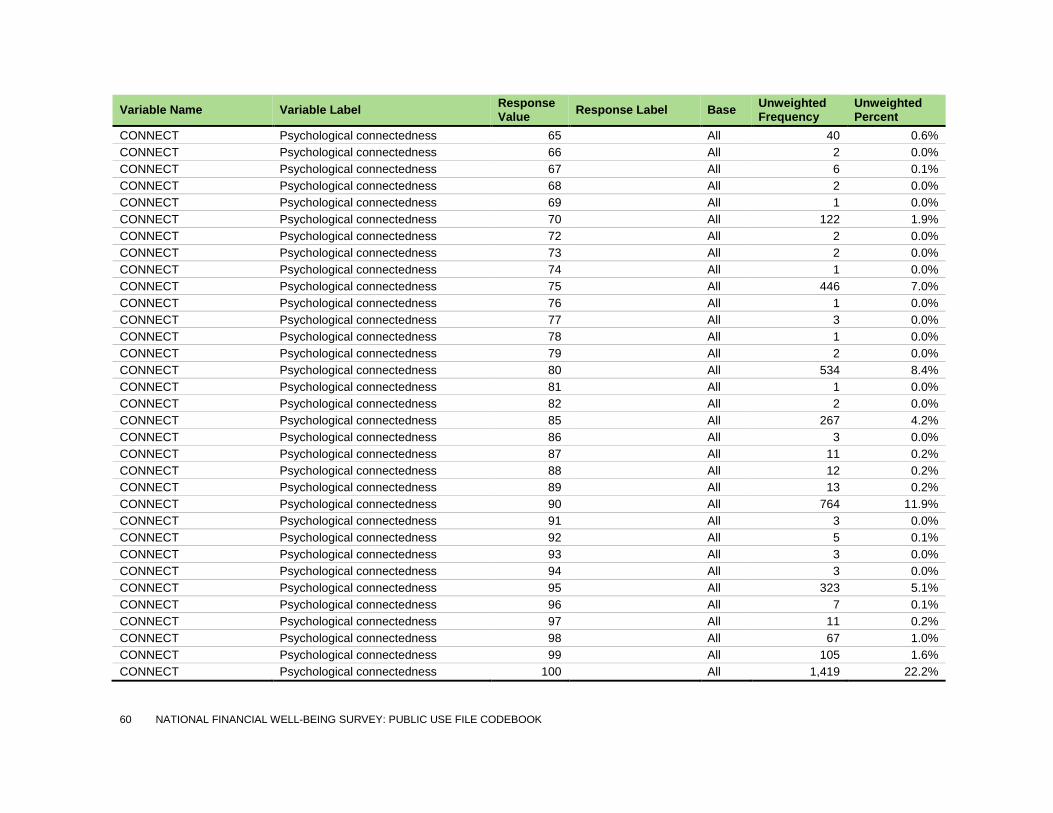
60 NATIONAL FINANCIAL WELL-BEING SURVEY: PUBLIC USE FILE CODEBOOK
Variable Name Variable Label Response Value Response Label Base Unweighted
Frequency Unweighted Percent
CONNECT Psychological connectedness 65 All 40 0.6% CONNECT Psychological connectedness 66 All 2 0.0% CONNECT Psychological connectedness 67 All 6 0.1% CONNECT Psychological connectedness 68 All 2 0.0% CONNECT Psychological connectedness 69 All 1 0.0% CONNECT Psychological connectedness 70 All 122 1.9% CONNECT Psychological connectedness 72 All 2 0.0% CONNECT Psychological connectedness 73 All 2 0.0% CONNECT Psychological connectedness 74 All 1 0.0% CONNECT Psychological connectedness 75 All 446 7.0% CONNECT Psychological connectedness 76 All 1 0.0% CONNECT Psychological connectedness 77 All 3 0.0% CONNECT Psychological connectedness 78 All 1 0.0% CONNECT Psychological connectedness 79 All 2 0.0% CONNECT Psychological connectedness 80 All 534 8.4% CONNECT Psychological connectedness 81 All 1 0.0% CONNECT Psychological connectedness 82 All 2 0.0% CONNECT Psychological connectedness 85 All 267 4.2% CONNECT Psychological connectedness 86 All 3 0.0% CONNECT Psychological connectedness 87 All 11 0.2% CONNECT Psychological connectedness 88 All 12 0.2% CONNECT Psychological connectedness 89 All 13 0.2% CONNECT Psychological connectedness 90 All 764 11.9% CONNECT Psychological connectedness 91 All 3 0.0% CONNECT Psychological connectedness 92 All 5 0.1% CONNECT Psychological connectedness 93 All 3 0.0% CONNECT Psychological connectedness 94 All 3 0.0% CONNECT Psychological connectedness 95 All 323 5.1% CONNECT Psychological connectedness 96 All 7 0.1% CONNECT Psychological connectedness 97 All 11 0.2% CONNECT Psychological connectedness 98 All 67 1.0% CONNECT Psychological connectedness 99 All 105 1.6% CONNECT Psychological connectedness 100 All 1,419 22.2%
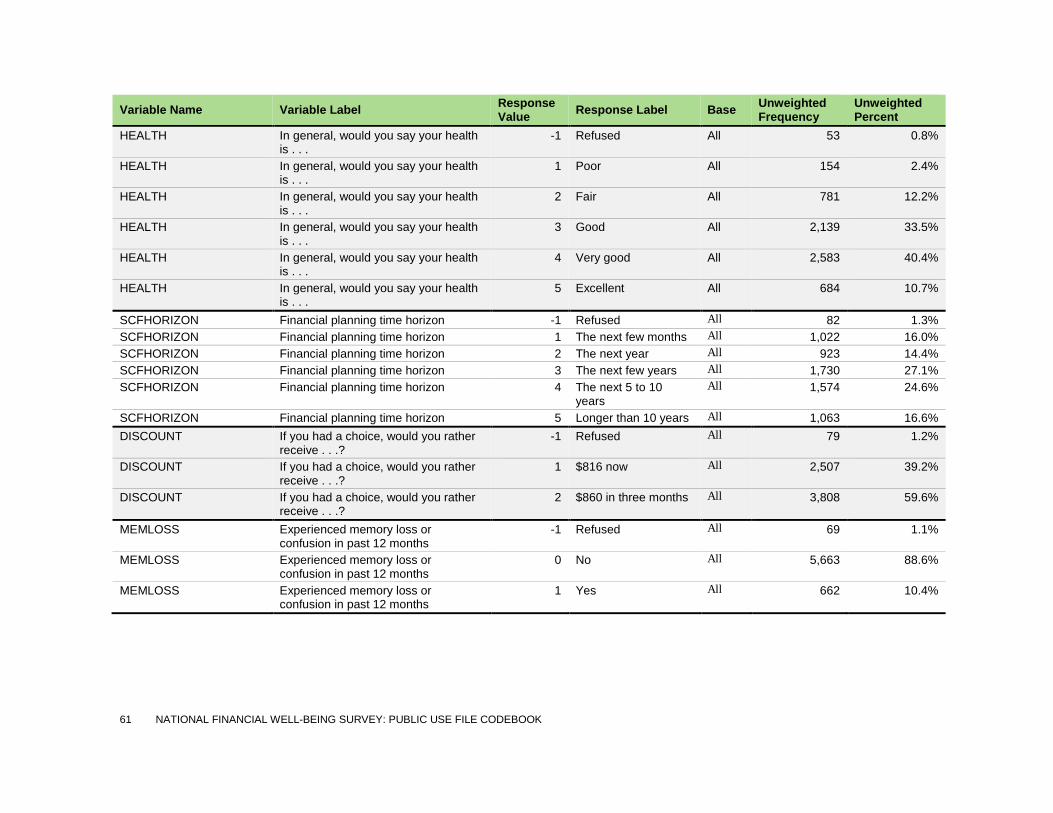
61 NATIONAL FINANCIAL WELL-BEING SURVEY: PUBLIC USE FILE CODEBOOK
Variable Name Variable Label Response Value Response Label Base Unweighted
Frequency Unweighted Percent
HEALTH In general, would you say your health is . . .
-1 Refused All 53 0.8%
HEALTH In general, would you say your health is . . .
1 Poor All 154 2.4%
HEALTH In general, would you say your health is . . .
2 Fair All 781 12.2%
HEALTH In general, would you say your health is . . .
3 Good All 2,139 33.5%
HEALTH In general, would you say your health is . . .
4 Very good All 2,583 40.4%
HEALTH In general, would you say your health is . . .
5 Excellent All 684 10.7%
SCFHORIZON Financial planning time horizon -1 Refused All 82 1.3% SCFHORIZON Financial planning time horizon 1 The next few months All 1,022 16.0% SCFHORIZON Financial planning time horizon 2 The next year All 923 14.4% SCFHORIZON Financial planning time horizon 3 The next few years All 1,730 27.1% SCFHORIZON Financial planning time horizon 4 The next 5 to 10
years All 1,574 24.6%
SCFHORIZON Financial planning time horizon 5 Longer than 10 years All 1,063 16.6% DISCOUNT If you had a choice, would you rather
receive . . .? -1 Refused All 79 1.2%
DISCOUNT If you had a choice, would you rather receive . . .?
1 $816 now All 2,507 39.2%
DISCOUNT If you had a choice, would you rather receive . . .?
2 $860 in three months All 3,808 59.6%
MEMLOSS Experienced memory loss or confusion in past 12 months
-1 Refused All 69 1.1%
MEMLOSS Experienced memory loss or confusion in past 12 months
0 No All 5,663 88.6%
MEMLOSS Experienced memory loss or confusion in past 12 months
1 Yes All 662 10.4%

62 NATIONAL FINANCIAL WELL-BEING SURVEY: PUBLIC USE FILE CODEBOOK
Variable Name Variable Label Response Value Response Label Base Unweighted
Frequency Unweighted Percent
DISTRESS Lot of stress in respondent's life -1 Refused All 49 0.8% DISTRESS Lot of stress in respondent's life 1 Strongly disagree All 393 6.1% DISTRESS Lot of stress in respondent's life 2 Disagree All 1,471 23.0% DISTRESS Lot of stress in respondent's life 3 Neither agree nor
disagree All 1,998 31.2%
DISTRESS Lot of stress in respondent's life 4 Agree All 1,783 27.9% DISTRESS Lot of stress in respondent's life 5 Strongly agree All 700 10.9% SELFCONTROL_1 I often act without thinking through all
the alternatives -1 Refused All 54 0.8%
SELFCONTROL_1 I often act without thinking through all the alternatives
1 Not at all All 2,039 31.9%
SELFCONTROL_1 I often act without thinking through all the alternatives
2 Not very well All 2,888 45.2%
SELFCONTROL_1 I often act without thinking through all the alternatives
3 Very well All 1,185 18.5%
SELFCONTROL_1 I often act without thinking through all the alternatives
4 Completely well All 228 3.6%
SELFCONTROL_2 I am good at resisting temptation -1 Refused All 50 0.8% SELFCONTROL_2 I am good at resisting temptation 1 Not at all All 173 2.7% SELFCONTROL_2 I am good at resisting temptation 2 Not very well All 1,388 21.7% SELFCONTROL_2 I am good at resisting temptation 3 Very well All 3,738 58.5% SELFCONTROL_2 I am good at resisting temptation 4 Completely well All 1,045 16.3% SELFCONTROL_3 I am able to work diligently toward
long-term goals -1 Refused All 48 0.8%
SELFCONTROL_3 I am able to work diligently toward long-term goals
1 Not at all All 135 2.1%
SELFCONTROL_3 I am able to work diligently toward long-term goals
2 Not very well All 932 14.6%
SELFCONTROL_3 I am able to work diligently toward long-term goals
3 Very well All 3,788 59.2%
SELFCONTROL_3 I am able to work diligently toward long-term goals
4 Completely well All 1,491 23.3%

63 NATIONAL FINANCIAL WELL-BEING SURVEY: PUBLIC USE FILE CODEBOOK
Variable Name Variable Label Response Value Response Label Base Unweighted
Frequency Unweighted Percent
OUTLOOK_1 There are services in this area to help me
-1 Refused All 79 1.2%
OUTLOOK_1 There are services in this area to help me
1 Strongly disagree All 345 5.4%
OUTLOOK_1 There are services in this area to help me
2 Somewhat disagree All 547 8.6%
OUTLOOK_1 There are services in this area to help me
3 Neither agree nor disagree
All 1,904 29.8%
OUTLOOK_1 There are services in this area to help me
4 Somewhat agree All 2,254 35.3%
OUTLOOK_1 There are services in this area to help me
5 Strongly agree All 1,265 19.8%
OUTLOOK_2 There are good work opportunities for me, if I choose to take them
-1 Refused All 83 1.3%
OUTLOOK_2 There are good work opportunities for me, if I choose to take them
1 Strongly disagree All 539 8.4%
OUTLOOK_2 There are good work opportunities for me, if I choose to take them
2 Somewhat disagree All 710 11.1%
OUTLOOK_2 There are good work opportunities for me, if I choose to take them
3 Neither agree nor disagree
All 1,816 28.4%
OUTLOOK_2 There are good work opportunities for me, if I choose to take them
4 Somewhat agree All 2,009 31.4%
OUTLOOK_2 There are good work opportunities for me, if I choose to take them
5 Strongly agree All 1,237 19.3%
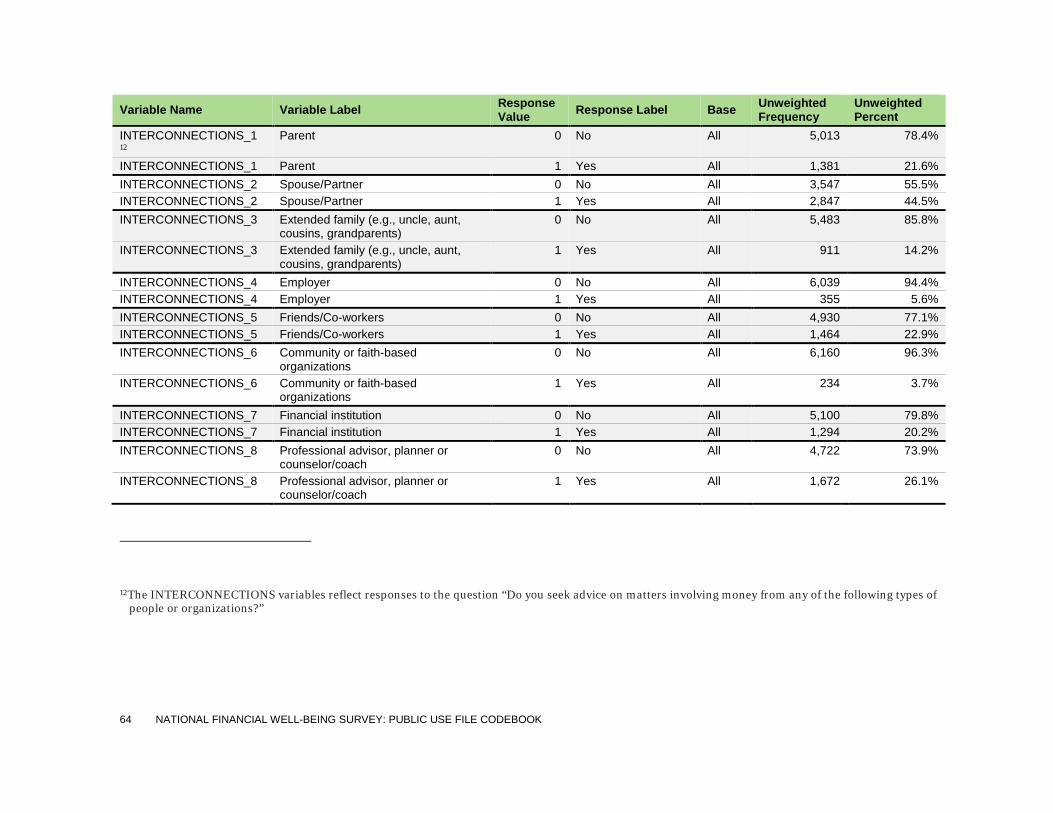
64 NATIONAL FINANCIAL WELL-BEING SURVEY: PUBLIC USE FILE CODEBOOK
Variable Name Variable Label Response Value Response Label Base Unweighted
Frequency Unweighted Percent
INTERCONNECTIONS_112
Parent 0 No All 5,013 78.4%
INTERCONNECTIONS_1 Parent 1 Yes All 1,381 21.6% INTERCONNECTIONS_2 Spouse/Partner 0 No All 3,547 55.5% INTERCONNECTIONS_2 Spouse/Partner 1 Yes All 2,847 44.5% INTERCONNECTIONS_3 Extended family (e.g., uncle, aunt,
cousins, grandparents) 0 No All 5,483 85.8%
INTERCONNECTIONS_3 Extended family (e.g., uncle, aunt, cousins, grandparents)
1 Yes All 911 14.2%
INTERCONNECTIONS_4 Employer 0 No All 6,039 94.4% INTERCONNECTIONS_4 Employer 1 Yes All 355 5.6% INTERCONNECTIONS_5 Friends/Co-workers 0 No All 4,930 77.1% INTERCONNECTIONS_5 Friends/Co-workers 1 Yes All 1,464 22.9% INTERCONNECTIONS_6 Community or faith-based
organizations 0 No All 6,160 96.3%
INTERCONNECTIONS_6 Community or faith-based organizations
1 Yes All 234 3.7%
INTERCONNECTIONS_7 Financial institution 0 No All 5,100 79.8% INTERCONNECTIONS_7 Financial institution 1 Yes All 1,294 20.2% INTERCONNECTIONS_8 Professional advisor, planner or
counselor/coach 0 No All 4,722 73.9%
INTERCONNECTIONS_8 Professional advisor, planner or counselor/coach
1 Yes All 1,672 26.1%
12The INTERCONNECTIONS variables reflect responses to the question “Do you seek advice on matters involving money from any of the following types of people or organizations?”
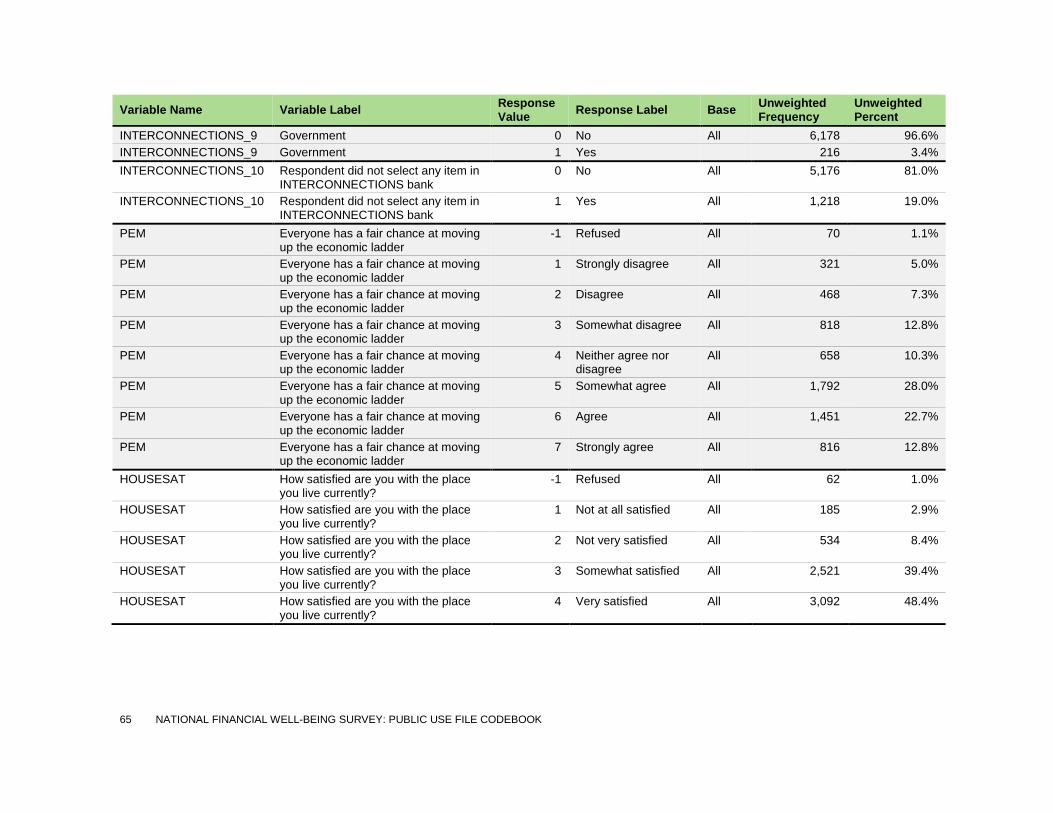
65 NATIONAL FINANCIAL WELL-BEING SURVEY: PUBLIC USE FILE CODEBOOK
Variable Name Variable Label Response Value Response Label Base Unweighted
Frequency Unweighted Percent
INTERCONNECTIONS_9 Government 0 No All 6,178 96.6% INTERCONNECTIONS_9 Government 1 Yes 216 3.4% INTERCONNECTIONS_10 Respondent did not select any item in
INTERCONNECTIONS bank 0 No All 5,176 81.0%
INTERCONNECTIONS_10 Respondent did not select any item in INTERCONNECTIONS bank
1 Yes All 1,218 19.0%
PEM Everyone has a fair chance at moving up the economic ladder
-1 Refused All 70 1.1%
PEM Everyone has a fair chance at moving up the economic ladder
1 Strongly disagree All 321 5.0%
PEM Everyone has a fair chance at moving up the economic ladder
2 Disagree All 468 7.3%
PEM Everyone has a fair chance at moving up the economic ladder
3 Somewhat disagree All 818 12.8%
PEM Everyone has a fair chance at moving up the economic ladder
4 Neither agree nor disagree
All 658 10.3%
PEM Everyone has a fair chance at moving up the economic ladder
5 Somewhat agree All 1,792 28.0%
PEM Everyone has a fair chance at moving up the economic ladder
6 Agree All 1,451 22.7%
PEM Everyone has a fair chance at moving up the economic ladder
7 Strongly agree All 816 12.8%
HOUSESAT How satisfied are you with the place you live currently?
-1 Refused All 62 1.0%
HOUSESAT How satisfied are you with the place you live currently?
1 Not at all satisfied All 185 2.9%
HOUSESAT How satisfied are you with the place you live currently?
2 Not very satisfied All 534 8.4%
HOUSESAT How satisfied are you with the place you live currently?
3 Somewhat satisfied All 2,521 39.4%
HOUSESAT How satisfied are you with the place you live currently?
4 Very satisfied All 3,092 48.4%
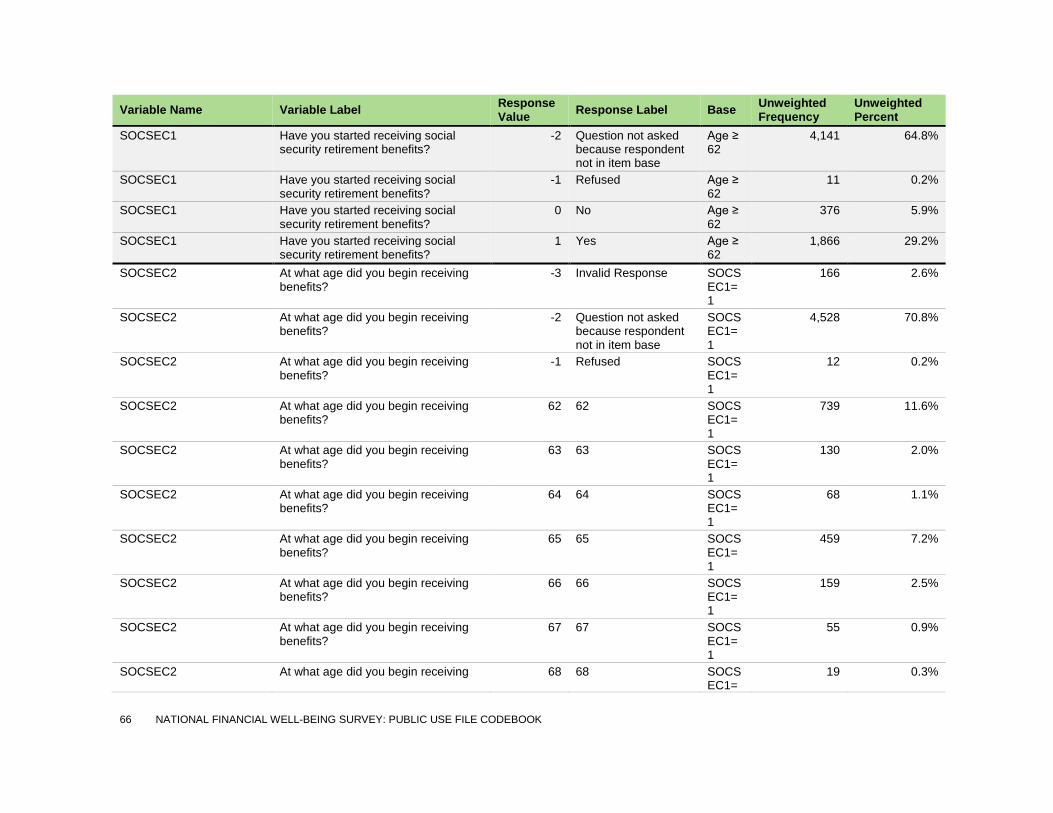
66 NATIONAL FINANCIAL WELL-BEING SURVEY: PUBLIC USE FILE CODEBOOK
Variable Name Variable Label Response Value Response Label Base Unweighted
Frequency Unweighted Percent
SOCSEC1 Have you started receiving social security retirement benefits?
-2 Question not asked because respondent not in item base
Age ≥ 62
4,141 64.8%
SOCSEC1 Have you started receiving social security retirement benefits?
-1 Refused Age ≥ 62
11 0.2%
SOCSEC1 Have you started receiving social security retirement benefits?
0 No Age ≥ 62
376 5.9%
SOCSEC1 Have you started receiving social security retirement benefits?
1 Yes Age ≥ 62
1,866 29.2%
SOCSEC2 At what age did you begin receiving benefits?
-3 Invalid Response SOCSEC1=1
166 2.6%
SOCSEC2 At what age did you begin receiving benefits?
-2 Question not asked because respondent not in item base
SOCSEC1=1
4,528 70.8%
SOCSEC2 At what age did you begin receiving benefits?
-1 Refused SOCSEC1=1
12 0.2%
SOCSEC2 At what age did you begin receiving benefits?
62 62 SOCSEC1=1
739 11.6%
SOCSEC2 At what age did you begin receiving benefits?
63 63 SOCSEC1=1
130 2.0%
SOCSEC2 At what age did you begin receiving benefits?
64 64 SOCSEC1=1
68 1.1%
SOCSEC2 At what age did you begin receiving benefits?
65 65 SOCSEC1=1
459 7.2%
SOCSEC2 At what age did you begin receiving benefits?
66 66 SOCSEC1=1
159 2.5%
SOCSEC2 At what age did you begin receiving benefits?
67 67 SOCSEC1=1
55 0.9%
SOCSEC2 At what age did you begin receiving 68 68 SOCSEC1=
19 0.3%
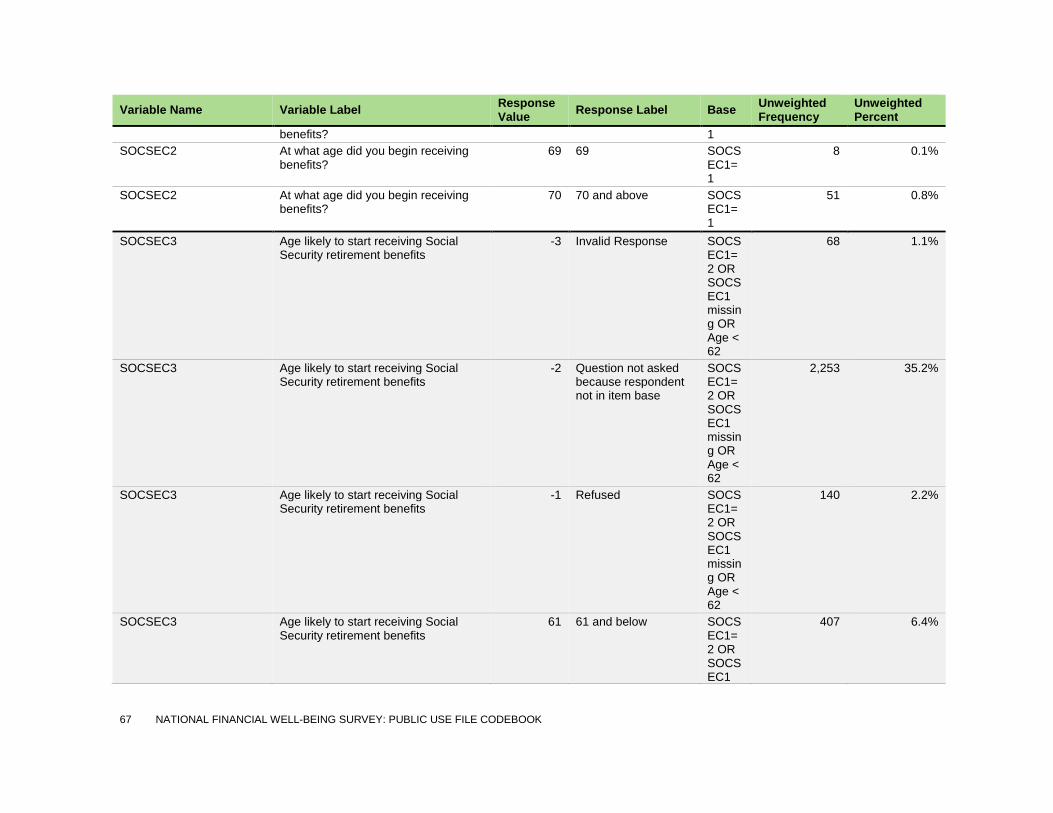
67 NATIONAL FINANCIAL WELL-BEING SURVEY: PUBLIC USE FILE CODEBOOK
Variable Name Variable Label Response Value Response Label Base Unweighted
Frequency Unweighted Percent
benefits? 1 SOCSEC2 At what age did you begin receiving
benefits? 69 69 SOCS
EC1=1
8 0.1%
SOCSEC2 At what age did you begin receiving benefits?
70 70 and above SOCSEC1=1
51 0.8%
SOCSEC3 Age likely to start receiving Social Security retirement benefits
-3 Invalid Response SOCSEC1=2 OR SOCSEC1 missing OR Age < 62
68 1.1%
SOCSEC3 Age likely to start receiving Social Security retirement benefits
-2 Question not asked because respondent not in item base
SOCSEC1=2 OR SOCSEC1 missing OR Age < 62
2,253 35.2%
SOCSEC3 Age likely to start receiving Social Security retirement benefits
-1 Refused SOCSEC1=2 OR SOCSEC1 missing OR Age < 62
140 2.2%
SOCSEC3 Age likely to start receiving Social Security retirement benefits
61 61 and below SOCSEC1=2 OR SOCSEC1
407 6.4%

68 NATIONAL FINANCIAL WELL-BEING SURVEY: PUBLIC USE FILE CODEBOOK
Variable Name Variable Label Response Value Response Label Base Unweighted
Frequency Unweighted Percent
missing OR Age < 62
SOCSEC3 Age likely to start receiving Social Security retirement benefits
62 62 SOCSEC1=2 OR SOCSEC1 missing OR Age < 62
372 5.8%
SOCSEC3 Age likely to start receiving Social Security retirement benefits
63 63 SOCSEC1=2 OR SOCSEC1 missing OR Age < 62
51 0.8%
SOCSEC3 Age likely to start receiving Social Security retirement benefits
64 64 SOCSEC1=2 OR SOCSEC1 missing OR Age < 62
24 0.4%
SOCSEC3 Age likely to start receiving Social Security retirement benefits
65 65 SOCSEC1=2 OR SOCSEC1 missing OR Age < 62
1,221 19.1%
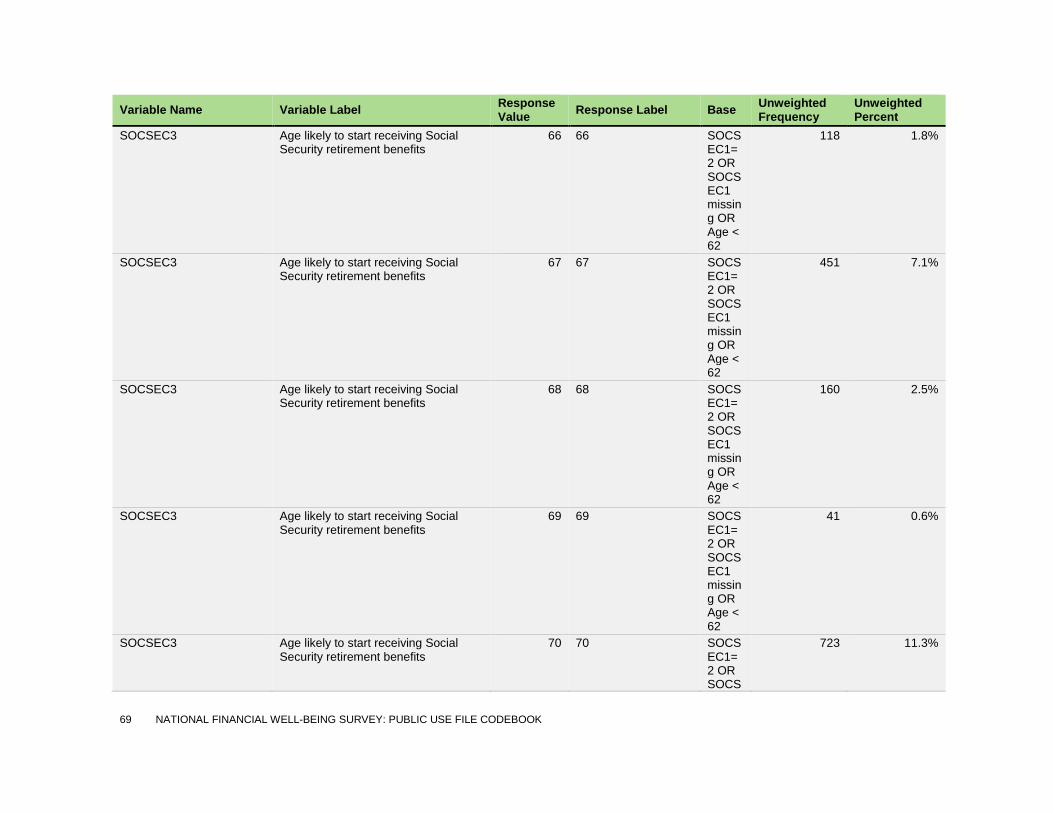
69 NATIONAL FINANCIAL WELL-BEING SURVEY: PUBLIC USE FILE CODEBOOK
Variable Name Variable Label Response Value Response Label Base Unweighted
Frequency Unweighted Percent
SOCSEC3 Age likely to start receiving Social Security retirement benefits
66 66 SOCSEC1=2 OR SOCSEC1 missing OR Age < 62
118 1.8%
SOCSEC3 Age likely to start receiving Social Security retirement benefits
67 67 SOCSEC1=2 OR SOCSEC1 missing OR Age < 62
451 7.1%
SOCSEC3 Age likely to start receiving Social Security retirement benefits
68 68 SOCSEC1=2 OR SOCSEC1 missing OR Age < 62
160 2.5%
SOCSEC3 Age likely to start receiving Social Security retirement benefits
69 69 SOCSEC1=2 OR SOCSEC1 missing OR Age < 62
41 0.6%
SOCSEC3 Age likely to start receiving Social Security retirement benefits
70 70 SOCSEC1=2 OR SOCS
723 11.3%
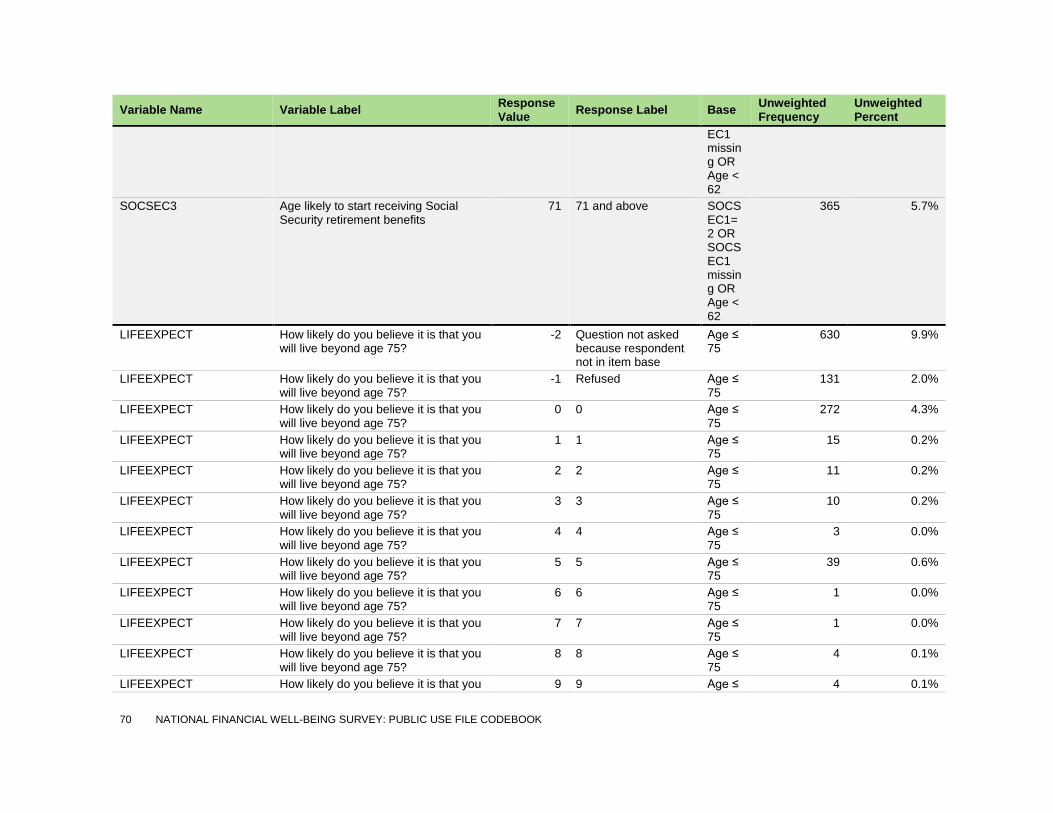
70 NATIONAL FINANCIAL WELL-BEING SURVEY: PUBLIC USE FILE CODEBOOK
Variable Name Variable Label Response Value Response Label Base Unweighted
Frequency Unweighted Percent
EC1 missing OR Age < 62
SOCSEC3 Age likely to start receiving Social Security retirement benefits
71 71 and above SOCSEC1=2 OR SOCSEC1 missing OR Age < 62
365 5.7%
LIFEEXPECT How likely do you believe it is that you will live beyond age 75?
-2 Question not asked because respondent not in item base
Age ≤ 75
630 9.9%
LIFEEXPECT How likely do you believe it is that you will live beyond age 75?
-1 Refused Age ≤ 75
131 2.0%
LIFEEXPECT How likely do you believe it is that you will live beyond age 75?
0 0 Age ≤ 75
272 4.3%
LIFEEXPECT How likely do you believe it is that you will live beyond age 75?
1 1 Age ≤ 75
15 0.2%
LIFEEXPECT How likely do you believe it is that you will live beyond age 75?
2 2 Age ≤ 75
11 0.2%
LIFEEXPECT How likely do you believe it is that you will live beyond age 75?
3 3 Age ≤ 75
10 0.2%
LIFEEXPECT How likely do you believe it is that you will live beyond age 75?
4 4 Age ≤ 75
3 0.0%
LIFEEXPECT How likely do you believe it is that you will live beyond age 75?
5 5 Age ≤ 75
39 0.6%
LIFEEXPECT How likely do you believe it is that you will live beyond age 75?
6 6 Age ≤ 75
1 0.0%
LIFEEXPECT How likely do you believe it is that you will live beyond age 75?
7 7 Age ≤ 75
1 0.0%
LIFEEXPECT How likely do you believe it is that you will live beyond age 75?
8 8 Age ≤ 75
4 0.1%
LIFEEXPECT How likely do you believe it is that you 9 9 Age ≤ 4 0.1%
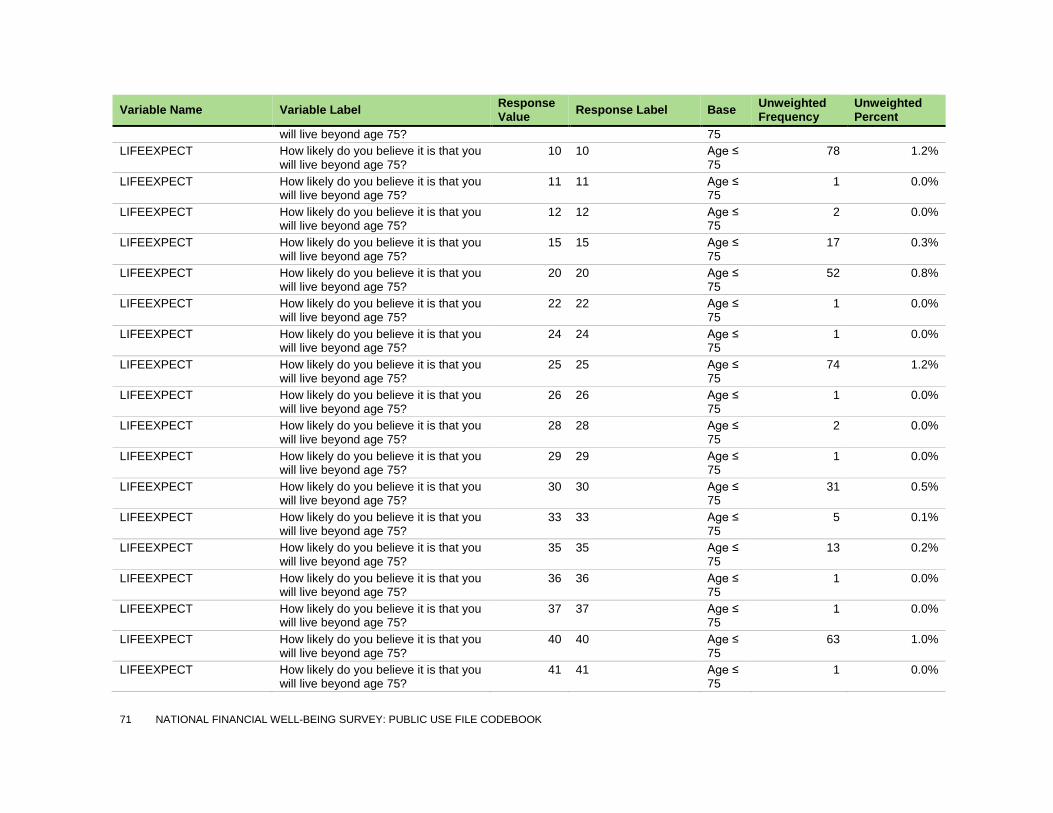
71 NATIONAL FINANCIAL WELL-BEING SURVEY: PUBLIC USE FILE CODEBOOK
Variable Name Variable Label Response Value Response Label Base Unweighted
Frequency Unweighted Percent
will live beyond age 75? 75 LIFEEXPECT How likely do you believe it is that you
will live beyond age 75? 10 10 Age ≤
75 78 1.2%
LIFEEXPECT How likely do you believe it is that you will live beyond age 75?
11 11 Age ≤ 75
1 0.0%
LIFEEXPECT How likely do you believe it is that you will live beyond age 75?
12 12 Age ≤ 75
2 0.0%
LIFEEXPECT How likely do you believe it is that you will live beyond age 75?
15 15 Age ≤ 75
17 0.3%
LIFEEXPECT How likely do you believe it is that you will live beyond age 75?
20 20 Age ≤ 75
52 0.8%
LIFEEXPECT How likely do you believe it is that you will live beyond age 75?
22 22 Age ≤ 75
1 0.0%
LIFEEXPECT How likely do you believe it is that you will live beyond age 75?
24 24 Age ≤ 75
1 0.0%
LIFEEXPECT How likely do you believe it is that you will live beyond age 75?
25 25 Age ≤ 75
74 1.2%
LIFEEXPECT How likely do you believe it is that you will live beyond age 75?
26 26 Age ≤ 75
1 0.0%
LIFEEXPECT How likely do you believe it is that you will live beyond age 75?
28 28 Age ≤ 75
2 0.0%
LIFEEXPECT How likely do you believe it is that you will live beyond age 75?
29 29 Age ≤ 75
1 0.0%
LIFEEXPECT How likely do you believe it is that you will live beyond age 75?
30 30 Age ≤ 75
31 0.5%
LIFEEXPECT How likely do you believe it is that you will live beyond age 75?
33 33 Age ≤ 75
5 0.1%
LIFEEXPECT How likely do you believe it is that you will live beyond age 75?
35 35 Age ≤ 75
13 0.2%
LIFEEXPECT How likely do you believe it is that you will live beyond age 75?
36 36 Age ≤ 75
1 0.0%
LIFEEXPECT How likely do you believe it is that you will live beyond age 75?
37 37 Age ≤ 75
1 0.0%
LIFEEXPECT How likely do you believe it is that you will live beyond age 75?
40 40 Age ≤ 75
63 1.0%
LIFEEXPECT How likely do you believe it is that you will live beyond age 75?
41 41 Age ≤ 75
1 0.0%

72 NATIONAL FINANCIAL WELL-BEING SURVEY: PUBLIC USE FILE CODEBOOK
Variable Name Variable Label Response Value Response Label Base Unweighted
Frequency Unweighted Percent
LIFEEXPECT How likely do you believe it is that you will live beyond age 75?
42 42 Age ≤ 75
2 0.0%
LIFEEXPECT How likely do you believe it is that you will live beyond age 75?
43 43 Age ≤ 75
1 0.0%
LIFEEXPECT How likely do you believe it is that you will live beyond age 75?
44 44 Age ≤ 75
1 0.0%
LIFEEXPECT How likely do you believe it is that you will live beyond age 75?
45 45 Age ≤ 75
17 0.3%
LIFEEXPECT How likely do you believe it is that you will live beyond age 75?
47 47 Age ≤ 75
1 0.0%
LIFEEXPECT How likely do you believe it is that you will live beyond age 75?
50 50 Age ≤ 75
824 12.9%
LIFEEXPECT How likely do you believe it is that you will live beyond age 75?
52 52 Age ≤ 75
1 0.0%
LIFEEXPECT How likely do you believe it is that you will live beyond age 75?
54 54 Age ≤ 75
1 0.0%
LIFEEXPECT How likely do you believe it is that you will live beyond age 75?
55 55 Age ≤ 75
15 0.2%
LIFEEXPECT How likely do you believe it is that you will live beyond age 75?
56 56 Age ≤ 75
1 0.0%
LIFEEXPECT How likely do you believe it is that you will live beyond age 75?
57 57 Age ≤ 75
1 0.0%
LIFEEXPECT How likely do you believe it is that you will live beyond age 75?
59 59 Age ≤ 75
2 0.0%
LIFEEXPECT How likely do you believe it is that you will live beyond age 75?
60 60 Age ≤ 75
124 1.9%
LIFEEXPECT How likely do you believe it is that you will live beyond age 75?
62 62 Age ≤ 75
4 0.1%
LIFEEXPECT How likely do you believe it is that you will live beyond age 75?
63 63 Age ≤ 75
1 0.0%
LIFEEXPECT How likely do you believe it is that you will live beyond age 75?
64 64 Age ≤ 75
1 0.0%
LIFEEXPECT How likely do you believe it is that you will live beyond age 75?
65 65 Age ≤ 75
64 1.0%
LIFEEXPECT How likely do you believe it is that you will live beyond age 75?
66 66 Age ≤ 75
6 0.1%
LIFEEXPECT How likely do you believe it is that you 67 67 Age ≤ 3 0.0%

73 NATIONAL FINANCIAL WELL-BEING SURVEY: PUBLIC USE FILE CODEBOOK
Variable Name Variable Label Response Value Response Label Base Unweighted
Frequency Unweighted Percent
will live beyond age 75? 75 LIFEEXPECT How likely do you believe it is that you
will live beyond age 75? 68 68 Age ≤
75 4 0.1%
LIFEEXPECT How likely do you believe it is that you will live beyond age 75?
69 69 Age ≤ 75
4 0.1%
LIFEEXPECT How likely do you believe it is that you will live beyond age 75?
70 70 Age ≤ 75
172 2.7%
LIFEEXPECT How likely do you believe it is that you will live beyond age 75?
71 71 Age ≤ 75
1 0.0%
LIFEEXPECT How likely do you believe it is that you will live beyond age 75?
72 72 Age ≤ 75
2 0.0%
LIFEEXPECT How likely do you believe it is that you will live beyond age 75?
73 73 Age ≤ 75
1 0.0%
LIFEEXPECT How likely do you believe it is that you will live beyond age 75?
75 75 Age ≤ 75
406 6.3%
LIFEEXPECT How likely do you believe it is that you will live beyond age 75?
76 76 Age ≤ 75
10 0.2%
LIFEEXPECT How likely do you believe it is that you will live beyond age 75?
77 77 Age ≤ 75
3 0.0%
LIFEEXPECT How likely do you believe it is that you will live beyond age 75?
78 78 Age ≤ 75
7 0.1%
LIFEEXPECT How likely do you believe it is that you will live beyond age 75?
79 79 Age ≤ 75
7 0.1%
LIFEEXPECT How likely do you believe it is that you will live beyond age 75?
80 80 Age ≤ 75
507 7.9%
LIFEEXPECT How likely do you believe it is that you will live beyond age 75?
81 81 Age ≤ 75
1 0.0%
LIFEEXPECT How likely do you believe it is that you will live beyond age 75?
82 82 Age ≤ 75
2 0.0%
LIFEEXPECT How likely do you believe it is that you will live beyond age 75?
83 83 Age ≤ 75
1 0.0%
LIFEEXPECT How likely do you believe it is that you will live beyond age 75?
84 84 Age ≤ 75
2 0.0%
LIFEEXPECT How likely do you believe it is that you will live beyond age 75?
85 85 Age ≤ 75
223 3.5%
LIFEEXPECT How likely do you believe it is that you will live beyond age 75?
86 86 Age ≤ 75
2 0.0%

74 NATIONAL FINANCIAL WELL-BEING SURVEY: PUBLIC USE FILE CODEBOOK
Variable Name Variable Label Response Value Response Label Base Unweighted
Frequency Unweighted Percent
LIFEEXPECT How likely do you believe it is that you will live beyond age 75?
87 87 Age ≤ 75
6 0.1%
LIFEEXPECT How likely do you believe it is that you will live beyond age 75?
88 88 Age ≤ 75
8 0.1%
LIFEEXPECT How likely do you believe it is that you will live beyond age 75?
89 89 Age ≤ 75
17 0.3%
LIFEEXPECT How likely do you believe it is that you will live beyond age 75?
90 90 Age ≤ 75
538 8.4%
LIFEEXPECT How likely do you believe it is that you will live beyond age 75?
91 91 Age ≤ 75
1 0.0%
LIFEEXPECT How likely do you believe it is that you will live beyond age 75?
92 92 Age ≤ 75
4 0.1%
LIFEEXPECT How likely do you believe it is that you will live beyond age 75?
93 93 Age ≤ 75
1 0.0%
LIFEEXPECT How likely do you believe it is that you will live beyond age 75?
94 94 Age ≤ 75
2 0.0%
LIFEEXPECT How likely do you believe it is that you will live beyond age 75?
95 95 Age ≤ 75
236 3.7%
LIFEEXPECT How likely do you believe it is that you will live beyond age 75?
96 96 Age ≤ 75
4 0.1%
LIFEEXPECT How likely do you believe it is that you will live beyond age 75?
97 97 Age ≤ 75
8 0.1%
LIFEEXPECT How likely do you believe it is that you will live beyond age 75?
98 98 Age ≤ 75
45 0.7%
LIFEEXPECT How likely do you believe it is that you will live beyond age 75?
99 99 Age ≤ 75
138 2.2%
LIFEEXPECT How likely do you believe it is that you will live beyond age 75?
100 100 Age ≤ 75
1,495 23.4%
HHEDUC Highest level of education of all household members
-1 Refused All 59 0.9%
HHEDUC Highest level of education of all household members
1 Less than high school All 189 3.0%
HHEDUC Highest level of education of all household members
2 High school degree/GED
All 1,129 17.7%
HHEDUC Highest level of education of all household members
3 Some college/Associate
All 1,772 27.7%

75 NATIONAL FINANCIAL WELL-BEING SURVEY: PUBLIC USE FILE CODEBOOK
Variable Name Variable Label Response Value Response Label Base Unweighted
Frequency Unweighted Percent
HHEDUC Highest level of education of all household members
4 Bachelor's degree All 1,566 24.5%
HHEDUC Highest level of education of all household members
5 Graduate/professional degree
All 1,679 26.3%
KIDS_NoChildren I have no children that I support financially
-1 Refused All 592 9.3%
KIDS_NoChildren I have no children that I support financially
0 Respondent financially supports children
All 2,148 33.6%
KIDS_NoChildren I have no children that I support financially
1 I have no children that I financially support
All 3,654 57.1%
KIDS_1 Less than 7 years old -1 Refused All 1 0.0% KIDS_1 Less than 7 years old 0 0 All 5,678 88.8% KIDS_1 Less than 7 years old 1 1 All 437 6.8% KIDS_1 Less than 7 years old 2 2+ All 278 4.3% KIDS_2 7 to 12 years old -3 Invalid Response All 1 0.0% KIDS_2 7 to 12 years old -1 Refused All 2 0.0% KIDS_2 7 to 12 years old 0 0 All 5,683 88.9% KIDS_2 7 to 12 years old 1 1 All 493 7.7% KIDS_2 7 to 12 years old 2 2+ All 215 3.4% KIDS_3 13 to 17 years old -1 Refused All 1 0.0% KIDS_3 13 to 17 years old 0 0 All 5,712 89.3% KIDS_3 13 to 17 years old 1 1 All 496 7.8% KIDS_3 13 to 17 years old 2 2+ All 185 2.9% KIDS_4 More than 18 years old -1 Refused All 7 0.1% KIDS_4 More than 18 years old 0 0 All 5,479 85.7% KIDS_4 More than 18 years old 1 1 All 552 8.6% KIDS_4 More than 18 years old 2 2+ All 356 5.6% EMPLOY Primary or only employment status 1 Self-employed All 418 6.5% EMPLOY Primary or only employment status 2 Work full-time for an
employer or the military
All 2,493 39.0%
EMPLOY Primary or only employment status 3 Work part-time for an employer or the
All 433 6.8%

76 NATIONAL FINANCIAL WELL-BEING SURVEY: PUBLIC USE FILE CODEBOOK
Variable Name Variable Label Response Value Response Label Base Unweighted
Frequency Unweighted Percent
military EMPLOY Primary or only employment status 4 Homemaker All 358 5.6% EMPLOY Primary or only employment status 5 Full-time student All 225 3.5% EMPLOY Primary or only employment status 6 Permanently sick,
disabled or unable to work
All 269 4.2%
EMPLOY Primary or only employment status 7 Unemployed or temporarily laid off
All 245 3.8%
EMPLOY Primary or only employment status 8 Retired All 1,837 28.7% EMPLOY Primary or only employment status 99 Refused 116 1.8% EMPLOY1_1 Self-employed 0 No All 5,858 91.6% EMPLOY1_1 Self-employed 1 Yes All 536 8.4% EMPLOY1_2 Work full-time for an employer or the
military 0 No All 3,879 60.7%
EMPLOY1_2 Work full-time for an employer or the military
1 Yes All 2,515 39.3%
EMPLOY1_3 Work part-time for an employer or the military
0 No All 5,822 91.1%
EMPLOY1_3 Work part-time for an employer or the military
1 Yes All 572 8.9%
EMPLOY1_4 Homemaker 0 No All 5,993 93.7% EMPLOY1_4 Homemaker 1 Yes All 401 6.3% EMPLOY1_5 Full-time student 0 No All 6,126 95.8% EMPLOY1_5 Full-time student 1 Yes All 268 4.2% EMPLOY1_6 Permanently sick, disabled or unable
to work 0 No All 6,097 95.4%
EMPLOY1_6 Permanently sick, disabled or unable to work
1 Yes All 297 4.6%
EMPLOY1_7 Unemployed or temporarily laid off 0 No All 6,124 95.8% EMPLOY1_7 Unemployed or temporarily laid off 1 Yes All 270 4.2% EMPLOY1_8 Retired 0 No All 4,495 70.3% EMPLOY1_8 Retired 1 Yes All 1,899 29.7%

77 NATIONAL FINANCIAL WELL-BEING SURVEY: PUBLIC USE FILE CODEBOOK
Variable Name Variable Label Response Value Response Label Base Unweighted
Frequency Unweighted Percent
EMPLOY1_9 Respondent did not select any item in EMPLOY1 bank
0 No All 6,278 98.2%
EMPLOY1_9 Respondent did not select any item in EMPLOY1 bank
1 Yes All 116 1.8%
RETIRE Actual date of retirement vs date planned
-2 Question not asked because respondent not in item base
EMPLOY1_8=1
4,495 70.3%
RETIRE Actual date of retirement vs date planned
-1 Refused EMPLOY1_8=1
3 0.0%
RETIRE Actual date of retirement vs date planned
1 Earlier than planned EMPLOY1_8=1
739 11.6%
RETIRE Actual date of retirement vs date planned
2 About when planned EMPLOY1_8=1
1,051 16.4%
RETIRE Actual date of retirement vs date planned
3 Later than planned EMPLOY1_8=1
106 1.7%
MILITARY Current/former member of US Armed Forces or spouse/dependent of service member
-1 Refused All 50 0.8%
MILITARY Current/former member of US Armed Forces or spouse/dependent of service member
0 No All 5,085 79.5%
MILITARY Current/former member of US Armed Forces or spouse/dependent of service member
1 Yes All 1,259 19.7%
Military_Status Military status -1 Refused All 69 1.1% Military_Status Military status 1 Active military (active,
reserve, natl guard) All 58 0.9%
Military_Status Military status 2 Veteran (veteran or retired)
All 759 11.9%
Military_Status Military status 3 Spouse/dependent Active
All 36 0.6%
Military_Status Military status 4 Spouse/dependent Veteran
All 387 6.1%

78 NATIONAL FINANCIAL WELL-BEING SURVEY: PUBLIC USE FILE CODEBOOK
Variable Name Variable Label Response Value Response Label Base Unweighted
Frequency Unweighted Percent
Military_Status Military status 5 Neither Active nor Veteran
All 5,085 79.5%
agecat Age 1 18-24 All 414 6.5% agecat Age 2 25-34 All 1,116 17.5% agecat Age 3 35-44 All 828 12.9% agecat Age 4 45-54 All 1,075 16.8% agecat Age 5 55-61 All 708 11.1% agecat Age 6 62-69 All 1,021 16.0% agecat Age 7 70-74 All 496 7.8% agecat Age 8 75+ All 736 11.5% generation Generation 1 Pre-Boomer All 1,112 17.4% generation Generation 2 Boomer All 2,253 35.2% generation Generation 3 Gen X All 1,430 22.4% generation Generation 4 Millennial All 1,599 25.0% PPEDUC Education (Highest Degree Received) 1 Less than high school All 429 6.7% PPEDUC Education (Highest Degree Received) 2 High school
degree/GED All 1,622 25.4%
PPEDUC Education (Highest Degree Received) 3 Some college/Associate
All 1,933 30.2%
PPEDUC Education (Highest Degree Received) 4 Bachelor's degree All 1,312 20.5% PPEDUC Education (Highest Degree Received) 5 Graduate/professiona
l degree All 1,098 17.2%
PPETHM Race / Ethnicity 1 White, Non-Hispanic All 4,498 70.3% PPETHM Race / Ethnicity 2 Black, Non-Hispanic All 685 10.7% PPETHM Race / Ethnicity 3 Other, Non-Hispanic All 336 5.3% PPETHM Race / Ethnicity 4 Hispanic All 875 13.7% PPGENDER Gender 1 Male All 3,352 52.4% PPGENDER Gender 2 Female All 3,042 47.6%

79 NATIONAL FINANCIAL WELL-BEING SURVEY: PUBLIC USE FILE CODEBOOK
Variable Name Variable Label Response Value Response Label Base Unweighted
Frequency Unweighted Percent
PPHHSIZE Household Size 1 1 All 1,229 19.2% PPHHSIZE Household Size 2 2 All 2,704 42.3% PPHHSIZE Household Size 3 3 All 996 15.6% PPHHSIZE Household Size 4 4 All 818 12.8% PPHHSIZE Household Size 5 5+ All 647 10.1% PPINCIMP Household Income 1 Less than $20,000 All 719 11.2% PPINCIMP Household Income 2 $20,000 to $29,999 All 506 7.9% PPINCIMP Household Income 3 $30,000 to $39,999 All 614 9.6% PPINCIMP Household Income 4 $40,000 to $49,999 All 467 7.3% PPINCIMP Household Income 5 $50,000 to $59,999 All 505 7.9% PPINCIMP Household Income 6 $60,000 to $74,999 All 651 10.2% PPINCIMP Household Income 7 $75,000 to $99,999 All 955 14.9% PPINCIMP Household Income 8 $100,000 to $149,999 All 1,115 17.4% PPINCIMP Household Income 9 $150,000 or more All 862 13.5% PPMARIT Marital Status 1 Married All 3,826 59.8% PPMARIT Marital Status 2 Widowed All 360 5.6% PPMARIT Marital Status 3 Divorced/Separated All 689 10.8% PPMARIT Marital Status 4 Never married All 1,151 18.0% PPMARIT Marital Status 5 Living with partner All 368 5.8% PPMSACAT MSA Status 0 Non-Metro All 856 13.4% PPMSACAT MSA Status 1 Metro All 5,538 86.6% PPREG4 Census Region 1 Northeast All 1,162 18.2% PPREG4 Census Region 2 Midwest All 1,461 22.8% PPREG4 Census Region 3 South All 2,257 35.3% PPREG4 Census Region 4 West All 1,514 23.7%

80 NATIONAL FINANCIAL WELL-BEING SURVEY: PUBLIC USE FILE CODEBOOK
Variable Name Variable Label Response Value Response Label Base Unweighted
Frequency Unweighted Percent
PPREG9 Census Division 1 New England All 322 5.0% PPREG9 Census Division 2 Mid-Atlantic All 840 13.1% PPREG9 Census Division 3 East-North Central All 1,001 15.7% PPREG9 Census Division 4 West-North Central All 460 7.2% PPREG9 Census Division 5 South Atlantic All 1,296 20.3% PPREG9 Census Division 6 East-South Central All 308 4.8% PPREG9 Census Division 7 West-South Central All 653 10.2% PPREG9 Census Division 8 Mountain All 469 7.3% PPREG9 Census Division 9 Pacific All 1,045 16.3% PPT01 Presence of Household Members -
Children 0-1 0 0 All 6,165 96.4%
PPT01 Presence of Household Members - Children 0-1
1 1+ All 229 3.6%
PPT25 Presence of Household Members - Children 2-5
0 0 All 5,892 92.1%
PPT25 Presence of Household Members - Children 2-5
1 1+ All 502 7.9%
PPT612 Presence of Household Members - Children 6-12
0 0 All 5,565 87.0%
PPT612 Presence of Household Members - Children 6-12
1 1+ All 829 13.0%
PPT1317 Presence of Household Members - Children 13-17
0 0 All 5,608 87.7%
PPT1317 Presence of Household Members - Children 13-17
1 1+ All 786 12.3%
PPT18OV Presence of Household Members - Adults 18+
1 1 All 1,357 21.2%
PPT18OV Presence of Household Members - Adults 18+
2 2 All 3,657 57.2%
PPT18OV Presence of Household Members - Adults 18+
3 3 All 864 13.5%
PPT18OV Presence of Household Members - Adults 18+
4 4+ All 516 8.1%
PCTLT200FPL County pct less than 200% of poverty level (ACS 2015 5-year SF)
-5 County is not known County is
395 6.2%
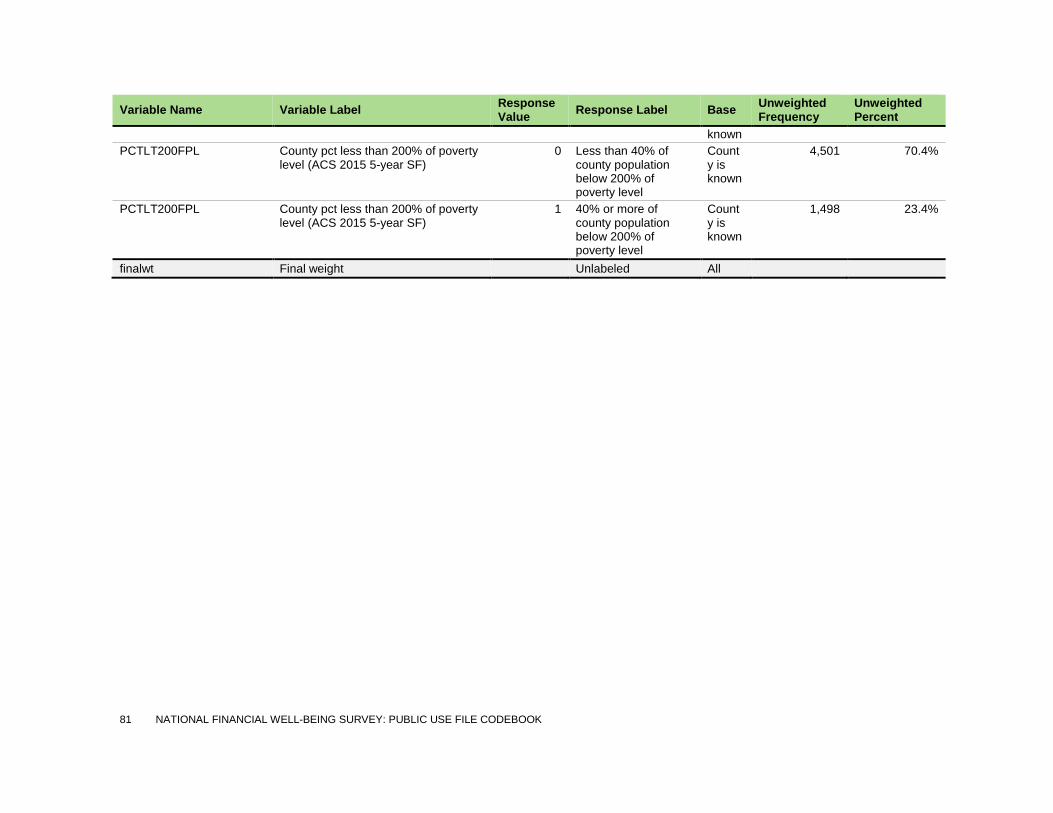
81 NATIONAL FINANCIAL WELL-BEING SURVEY: PUBLIC USE FILE CODEBOOK
Variable Name Variable Label Response Value Response Label Base Unweighted
Frequency Unweighted Percent
known PCTLT200FPL County pct less than 200% of poverty
level (ACS 2015 5-year SF) 0 Less than 40% of
county population below 200% of poverty level
County is known
4,501 70.4%
PCTLT200FPL County pct less than 200% of poverty level (ACS 2015 5-year SF)
1 40% or more of county population below 200% of poverty level
County is known
1,498 23.4%
finalwt Final weight Unlabeled All

82 NATIONAL FINANCIAL WELL-BEING SURVEY: PUBLIC USE FILE CODEBOOK
4. Variable Summaries This section provides the number of responses, the minimum and maximum values, the
weighted mean, and the weighted standard error for each variable in the Public Use File
(excluding PUF_ID).13 Nonsubstantive values such as question not asked, refusal, don’t know,
and similar responses are not included in this table. That is, the number of responses,
minimum, maximum, mean, and standard error all exclude nonsubstantive values. Readers are
cautioned that means and their standard errors are not appropriate for all items and should be
interpreted with caution.
TABLE 3: VARIABLE SUMMARIES
Variable n Min Max Weighted Mean
Standard Error
sample 6,394 1 3 1.234 0.008
fpl 6,394 1 3 2.597 0.010
SWB_1 6,363 1 7 5.302 0.022
SWB_2 6,337 1 7 5.406 0.021
SWB_3 6,329 1 7 5.540 0.022
13 For the weighting variable, finalwt, the unweighted mean is shown and the standard deviation is substituted for standard error.

83 NATIONAL FINANCIAL WELL-BEING SURVEY: PUBLIC USE FILE CODEBOOK
Variable n Min Max Weighted Mean
Standard Error
FWBscore 6,389 14 95 54.250 0.195
FWB1_1 6,383 1 5 2.924 0.018
FWB1_2 6,383 1 5 3.103 0.016
FWB1_3 6,385 1 5 2.642 0.018
FWB1_4 6,383 1 5 3.198 0.015
FWB1_5 6,381 1 5 2.858 0.018
FWB1_6 6,385 1 5 3.180 0.017
FWB2_1 6,384 1 5 2.468 0.018
FWB2_2 6,380 1 5 3.276 0.018
FWB2_3 6,383 1 5 2.149 0.017
FWB2_4 6,382 1 5 2.766 0.017
FSscore 6,386 5 85 49.917 0.190
FS1_1 6,382 1 5 3.547 0.014
FS1_2 6,383 1 5 3.466 0.016
FS1_3 6,382 1 5 3.184 0.015
FS1_4 6,384 1 5 3.267 0.015
FS1_5 6,383 1 5 3.010 0.015
FS1_6 6,384 1 5 3.696 0.014
FS1_7 6,386 1 5 3.631 0.015
FS2_1 6,380 1 5 3.710 0.013
FS2_2 6,380 1 5 3.604 0.014
FS2_3 6,380 1 5 2.737 0.014
SUBKNOWL1 6,342 1 7 4.606 0.018
ACT1_1 6,370 1 5 4.158 0.013
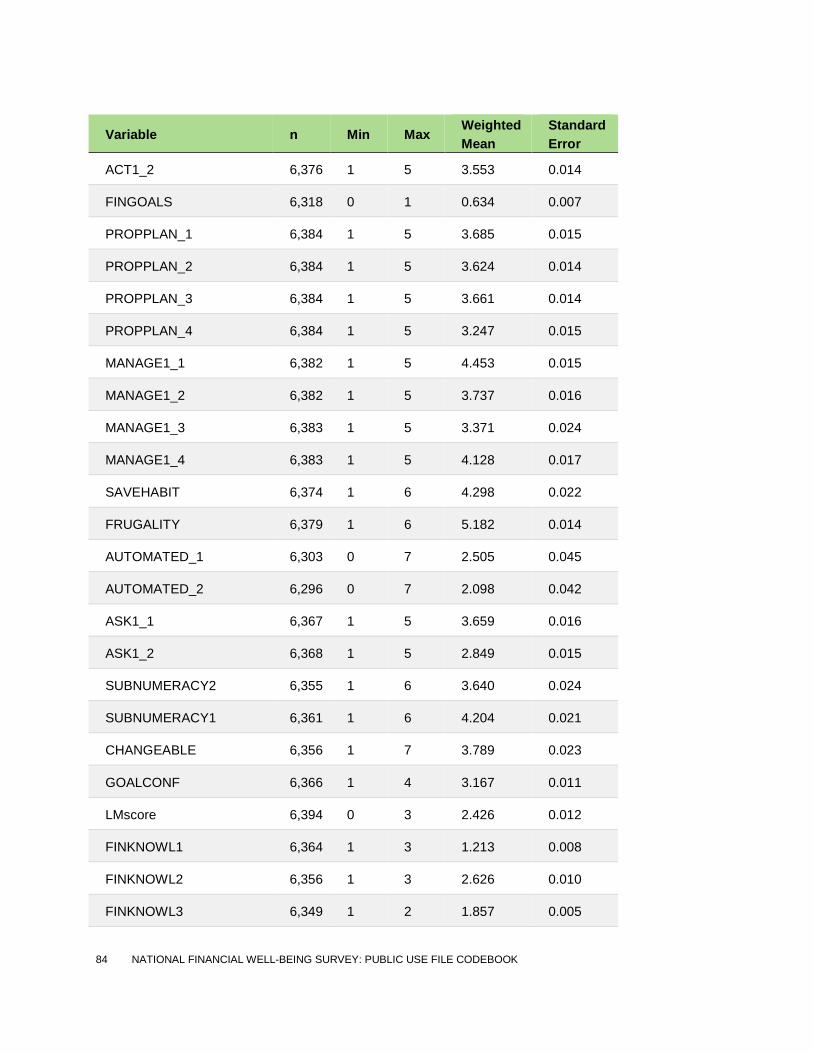
84 NATIONAL FINANCIAL WELL-BEING SURVEY: PUBLIC USE FILE CODEBOOK
Variable n Min Max Weighted Mean
Standard Error
ACT1_2 6,376 1 5 3.553 0.014
FINGOALS 6,318 0 1 0.634 0.007
PROPPLAN_1 6,384 1 5 3.685 0.015
PROPPLAN_2 6,384 1 5 3.624 0.014
PROPPLAN_3 6,384 1 5 3.661 0.014
PROPPLAN_4 6,384 1 5 3.247 0.015
MANAGE1_1 6,382 1 5 4.453 0.015
MANAGE1_2 6,382 1 5 3.737 0.016
MANAGE1_3 6,383 1 5 3.371 0.024
MANAGE1_4 6,383 1 5 4.128 0.017
SAVEHABIT 6,374 1 6 4.298 0.022
FRUGALITY 6,379 1 6 5.182 0.014
AUTOMATED_1 6,303 0 7 2.505 0.045
AUTOMATED_2 6,296 0 7 2.098 0.042
ASK1_1 6,367 1 5 3.659 0.016
ASK1_2 6,368 1 5 2.849 0.015
SUBNUMERACY2 6,355 1 6 3.640 0.024
SUBNUMERACY1 6,361 1 6 4.204 0.021
CHANGEABLE 6,356 1 7 3.789 0.023
GOALCONF 6,366 1 4 3.167 0.011
LMscore 6,394 0 3 2.426 0.012
FINKNOWL1 6,364 1 3 1.213 0.008
FINKNOWL2 6,356 1 3 2.626 0.010
FINKNOWL3 6,349 1 2 1.857 0.005

85 NATIONAL FINANCIAL WELL-BEING SURVEY: PUBLIC USE FILE CODEBOOK
Variable n Min Max Weighted Mean
Standard Error
FK1correct 6,394 0 1 0.844 0.005
FK2correct 6,394 0 1 0.732 0.007
FK3correct 6,394 0 1 0.849 0.005
KHscore 3,125 0.242 1.267 0.613 0.008
KHKNOWL1 6,349 1 3 2.458 0.010
KHKNOWL2 6,353 1 3 2.750 0.009
KHKNOWL3 6,326 1 3 1.983 0.009
KHKNOWL4 6,355 1 2 1.192 0.006
KHKNOWL5 6,349 1 2 1.280 0.007
KHKNOWL6 6,364 1 2 1.907 0.004
KHKNOWL7 6,354 1 4 3.065 0.014
KHKNOWL8 6,343 1 4 2.359 0.017
KHKNOWL9 6,360 1 2 1.112 0.005
KH1correct 6,394 0 1 0.561 0.007
KH2correct 6,394 0 1 0.819 0.006
KH3correct 6,394 0 1 0.629 0.007
KH4correct 6,394 0 1 0.802 0.006
KH5correct 6,394 0 1 0.714 0.007
KH6correct 6,394 0 1 0.903 0.005
KH7correct 6,394 0 1 0.401 0.007
KH8correct 6,394 0 1 0.324 0.007
KH9correct 6,394 0 1 0.882 0.005
ENDSMEET 6,350 1 3 1.521 0.010
HOUSING 6,352 1 3 1.530 0.011
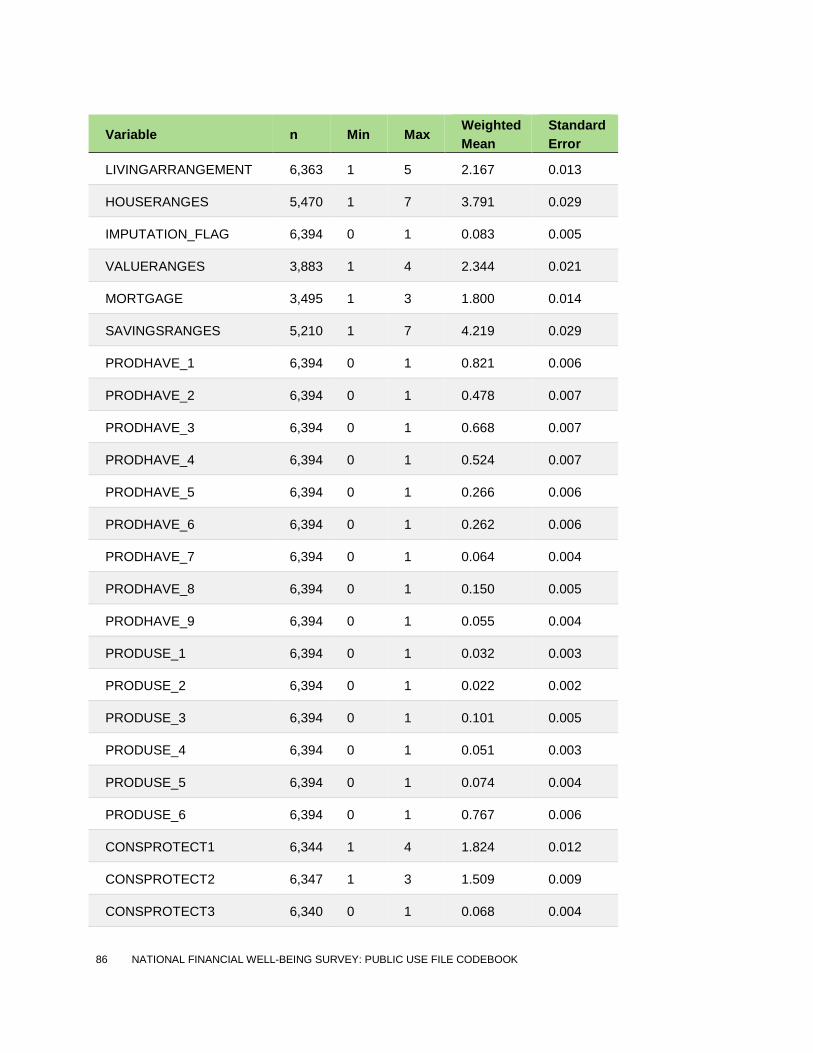
86 NATIONAL FINANCIAL WELL-BEING SURVEY: PUBLIC USE FILE CODEBOOK
Variable n Min Max Weighted Mean
Standard Error
LIVINGARRANGEMENT 6,363 1 5 2.167 0.013
HOUSERANGES 5,470 1 7 3.791 0.029
IMPUTATION_FLAG 6,394 0 1 0.083 0.005
VALUERANGES 3,883 1 4 2.344 0.021
MORTGAGE 3,495 1 3 1.800 0.014
SAVINGSRANGES 5,210 1 7 4.219 0.029
PRODHAVE_1 6,394 0 1 0.821 0.006
PRODHAVE_2 6,394 0 1 0.478 0.007
PRODHAVE_3 6,394 0 1 0.668 0.007
PRODHAVE_4 6,394 0 1 0.524 0.007
PRODHAVE_5 6,394 0 1 0.266 0.006
PRODHAVE_6 6,394 0 1 0.262 0.006
PRODHAVE_7 6,394 0 1 0.064 0.004
PRODHAVE_8 6,394 0 1 0.150 0.005
PRODHAVE_9 6,394 0 1 0.055 0.004
PRODUSE_1 6,394 0 1 0.032 0.003
PRODUSE_2 6,394 0 1 0.022 0.002
PRODUSE_3 6,394 0 1 0.101 0.005
PRODUSE_4 6,394 0 1 0.051 0.003
PRODUSE_5 6,394 0 1 0.074 0.004
PRODUSE_6 6,394 0 1 0.767 0.006
CONSPROTECT1 6,344 1 4 1.824 0.012
CONSPROTECT2 6,347 1 3 1.509 0.009
CONSPROTECT3 6,340 0 1 0.068 0.004
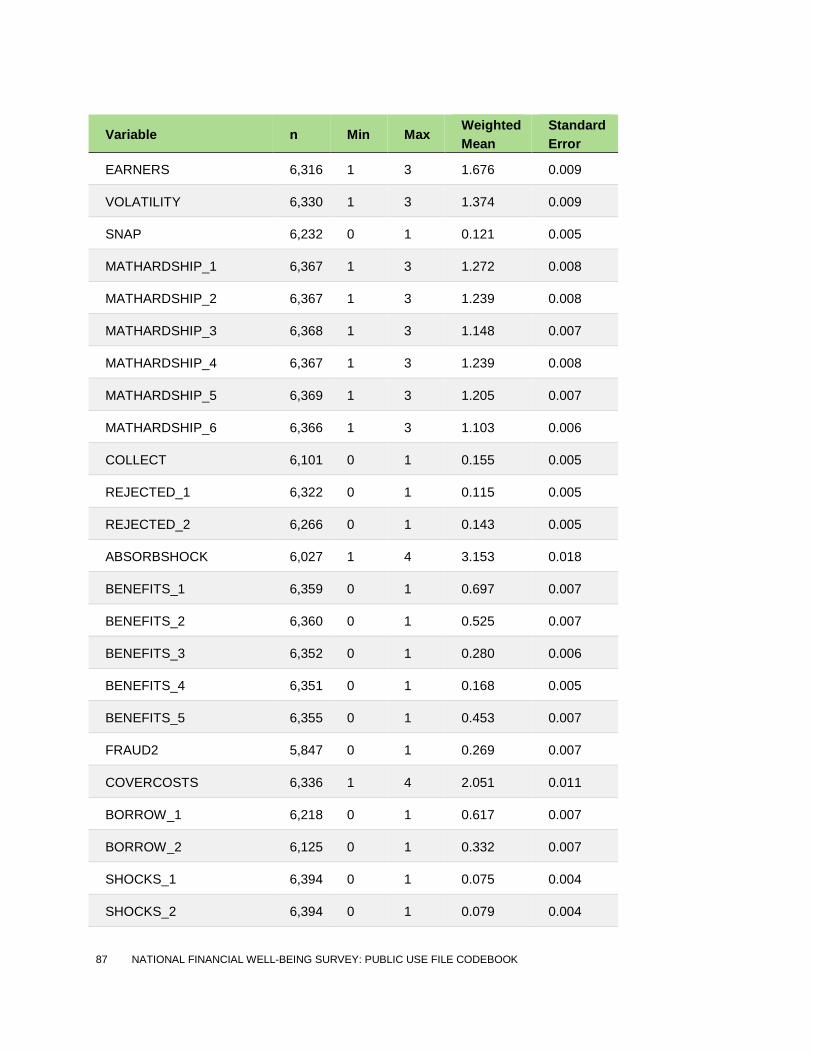
87 NATIONAL FINANCIAL WELL-BEING SURVEY: PUBLIC USE FILE CODEBOOK
Variable n Min Max Weighted Mean
Standard Error
EARNERS 6,316 1 3 1.676 0.009
VOLATILITY 6,330 1 3 1.374 0.009
SNAP 6,232 0 1 0.121 0.005
MATHARDSHIP_1 6,367 1 3 1.272 0.008
MATHARDSHIP_2 6,367 1 3 1.239 0.008
MATHARDSHIP_3 6,368 1 3 1.148 0.007
MATHARDSHIP_4 6,367 1 3 1.239 0.008
MATHARDSHIP_5 6,369 1 3 1.205 0.007
MATHARDSHIP_6 6,366 1 3 1.103 0.006
COLLECT 6,101 0 1 0.155 0.005
REJECTED_1 6,322 0 1 0.115 0.005
REJECTED_2 6,266 0 1 0.143 0.005
ABSORBSHOCK 6,027 1 4 3.153 0.018
BENEFITS_1 6,359 0 1 0.697 0.007
BENEFITS_2 6,360 0 1 0.525 0.007
BENEFITS_3 6,352 0 1 0.280 0.006
BENEFITS_4 6,351 0 1 0.168 0.005
BENEFITS_5 6,355 0 1 0.453 0.007
FRAUD2 5,847 0 1 0.269 0.007
COVERCOSTS 6,336 1 4 2.051 0.011
BORROW_1 6,218 0 1 0.617 0.007
BORROW_2 6,125 0 1 0.332 0.007
SHOCKS_1 6,394 0 1 0.075 0.004
SHOCKS_2 6,394 0 1 0.079 0.004
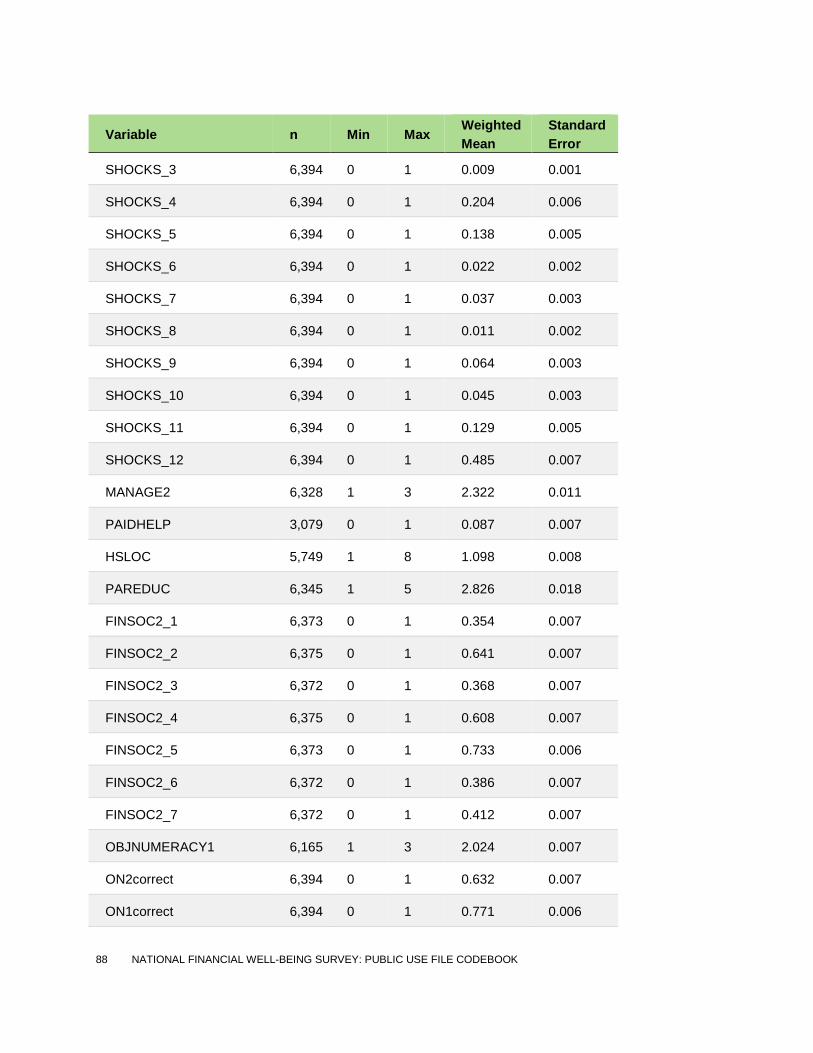
88 NATIONAL FINANCIAL WELL-BEING SURVEY: PUBLIC USE FILE CODEBOOK
Variable n Min Max Weighted Mean
Standard Error
SHOCKS_3 6,394 0 1 0.009 0.001
SHOCKS_4 6,394 0 1 0.204 0.006
SHOCKS_5 6,394 0 1 0.138 0.005
SHOCKS_6 6,394 0 1 0.022 0.002
SHOCKS_7 6,394 0 1 0.037 0.003
SHOCKS_8 6,394 0 1 0.011 0.002
SHOCKS_9 6,394 0 1 0.064 0.003
SHOCKS_10 6,394 0 1 0.045 0.003
SHOCKS_11 6,394 0 1 0.129 0.005
SHOCKS_12 6,394 0 1 0.485 0.007
MANAGE2 6,328 1 3 2.322 0.011
PAIDHELP 3,079 0 1 0.087 0.007
HSLOC 5,749 1 8 1.098 0.008
PAREDUC 6,345 1 5 2.826 0.018
FINSOC2_1 6,373 0 1 0.354 0.007
FINSOC2_2 6,375 0 1 0.641 0.007
FINSOC2_3 6,372 0 1 0.368 0.007
FINSOC2_4 6,375 0 1 0.608 0.007
FINSOC2_5 6,373 0 1 0.733 0.006
FINSOC2_6 6,372 0 1 0.386 0.007
FINSOC2_7 6,372 0 1 0.412 0.007
OBJNUMERACY1 6,165 1 3 2.024 0.007
ON2correct 6,394 0 1 0.632 0.007
ON1correct 6,394 0 1 0.771 0.006
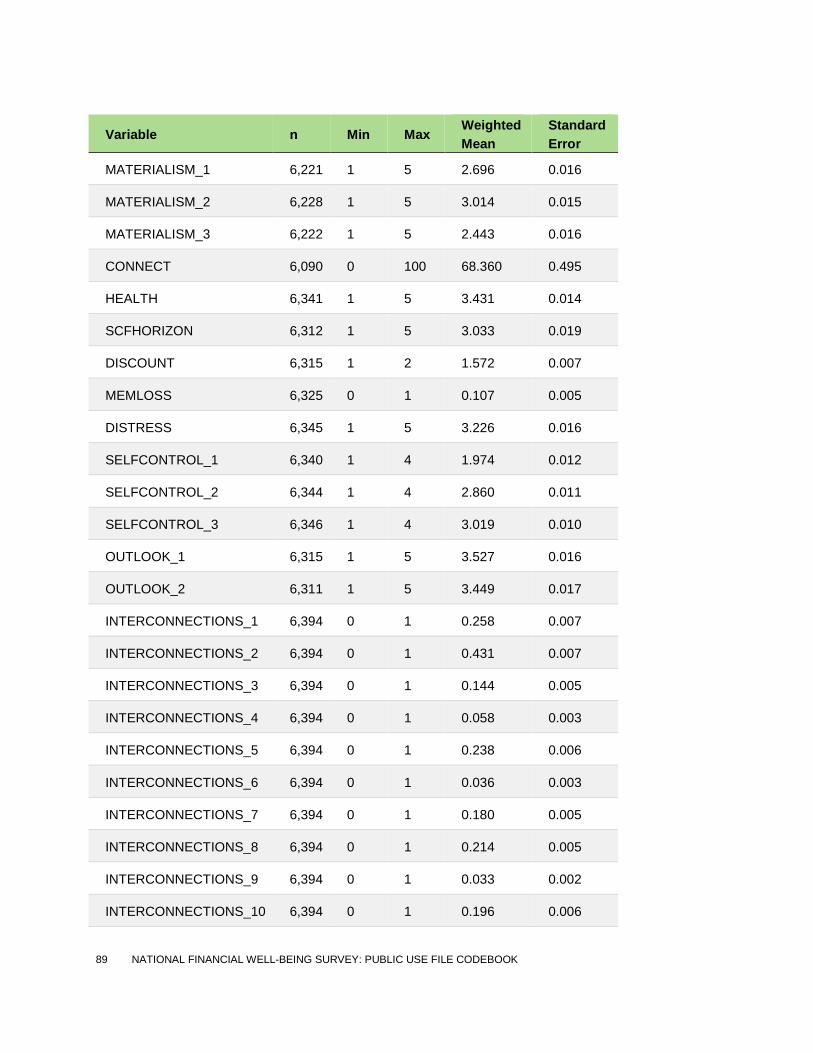
89 NATIONAL FINANCIAL WELL-BEING SURVEY: PUBLIC USE FILE CODEBOOK
Variable n Min Max Weighted Mean
Standard Error
MATERIALISM_1 6,221 1 5 2.696 0.016
MATERIALISM_2 6,228 1 5 3.014 0.015
MATERIALISM_3 6,222 1 5 2.443 0.016
CONNECT 6,090 0 100 68.360 0.495
HEALTH 6,341 1 5 3.431 0.014
SCFHORIZON 6,312 1 5 3.033 0.019
DISCOUNT 6,315 1 2 1.572 0.007
MEMLOSS 6,325 0 1 0.107 0.005
DISTRESS 6,345 1 5 3.226 0.016
SELFCONTROL_1 6,340 1 4 1.974 0.012
SELFCONTROL_2 6,344 1 4 2.860 0.011
SELFCONTROL_3 6,346 1 4 3.019 0.010
OUTLOOK_1 6,315 1 5 3.527 0.016
OUTLOOK_2 6,311 1 5 3.449 0.017
INTERCONNECTIONS_1 6,394 0 1 0.258 0.007
INTERCONNECTIONS_2 6,394 0 1 0.431 0.007
INTERCONNECTIONS_3 6,394 0 1 0.144 0.005
INTERCONNECTIONS_4 6,394 0 1 0.058 0.003
INTERCONNECTIONS_5 6,394 0 1 0.238 0.006
INTERCONNECTIONS_6 6,394 0 1 0.036 0.003
INTERCONNECTIONS_7 6,394 0 1 0.180 0.005
INTERCONNECTIONS_8 6,394 0 1 0.214 0.005
INTERCONNECTIONS_9 6,394 0 1 0.033 0.002
INTERCONNECTIONS_10 6,394 0 1 0.196 0.006
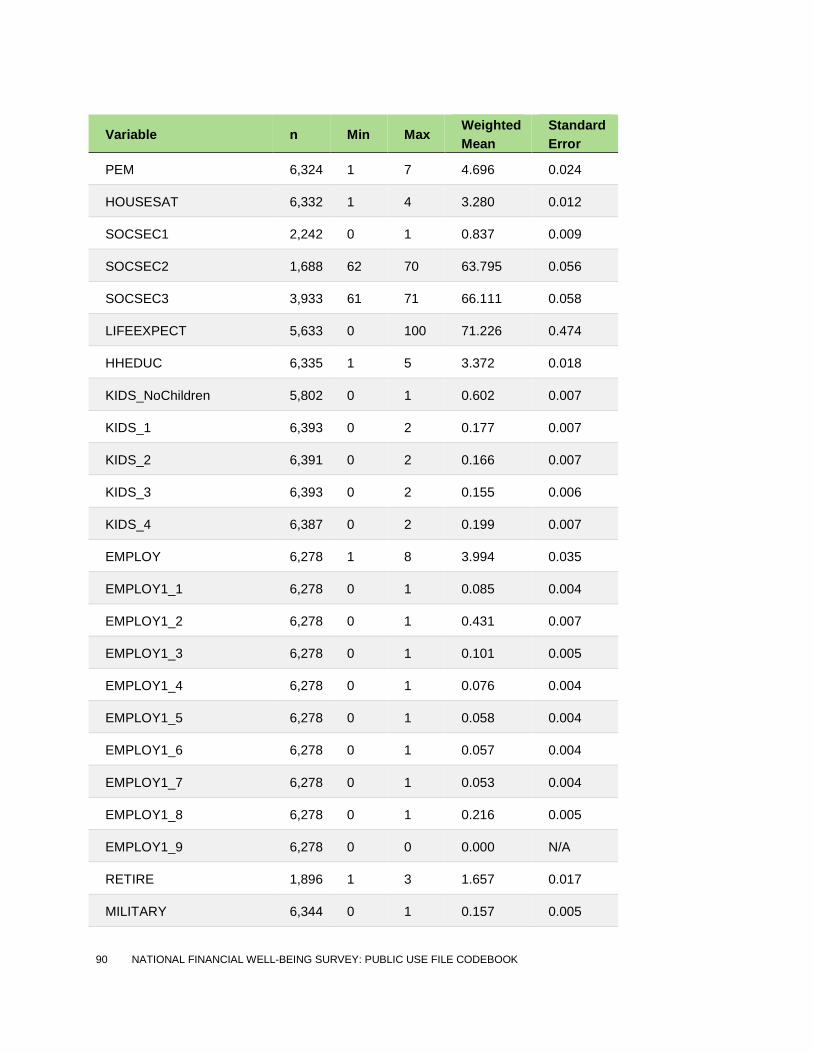
90 NATIONAL FINANCIAL WELL-BEING SURVEY: PUBLIC USE FILE CODEBOOK
Variable n Min Max Weighted Mean
Standard Error
PEM 6,324 1 7 4.696 0.024
HOUSESAT 6,332 1 4 3.280 0.012
SOCSEC1 2,242 0 1 0.837 0.009
SOCSEC2 1,688 62 70 63.795 0.056
SOCSEC3 3,933 61 71 66.111 0.058
LIFEEXPECT 5,633 0 100 71.226 0.474
HHEDUC 6,335 1 5 3.372 0.018
KIDS_NoChildren 5,802 0 1 0.602 0.007
KIDS_1 6,393 0 2 0.177 0.007
KIDS_2 6,391 0 2 0.166 0.007
KIDS_3 6,393 0 2 0.155 0.006
KIDS_4 6,387 0 2 0.199 0.007
EMPLOY 6,278 1 8 3.994 0.035
EMPLOY1_1 6,278 0 1 0.085 0.004
EMPLOY1_2 6,278 0 1 0.431 0.007
EMPLOY1_3 6,278 0 1 0.101 0.005
EMPLOY1_4 6,278 0 1 0.076 0.004
EMPLOY1_5 6,278 0 1 0.058 0.004
EMPLOY1_6 6,278 0 1 0.057 0.004
EMPLOY1_7 6,278 0 1 0.053 0.004
EMPLOY1_8 6,278 0 1 0.216 0.005
EMPLOY1_9 6,278 0 0 0.000 N/A
RETIRE 1,896 1 3 1.657 0.017
MILITARY 6,344 0 1 0.157 0.005
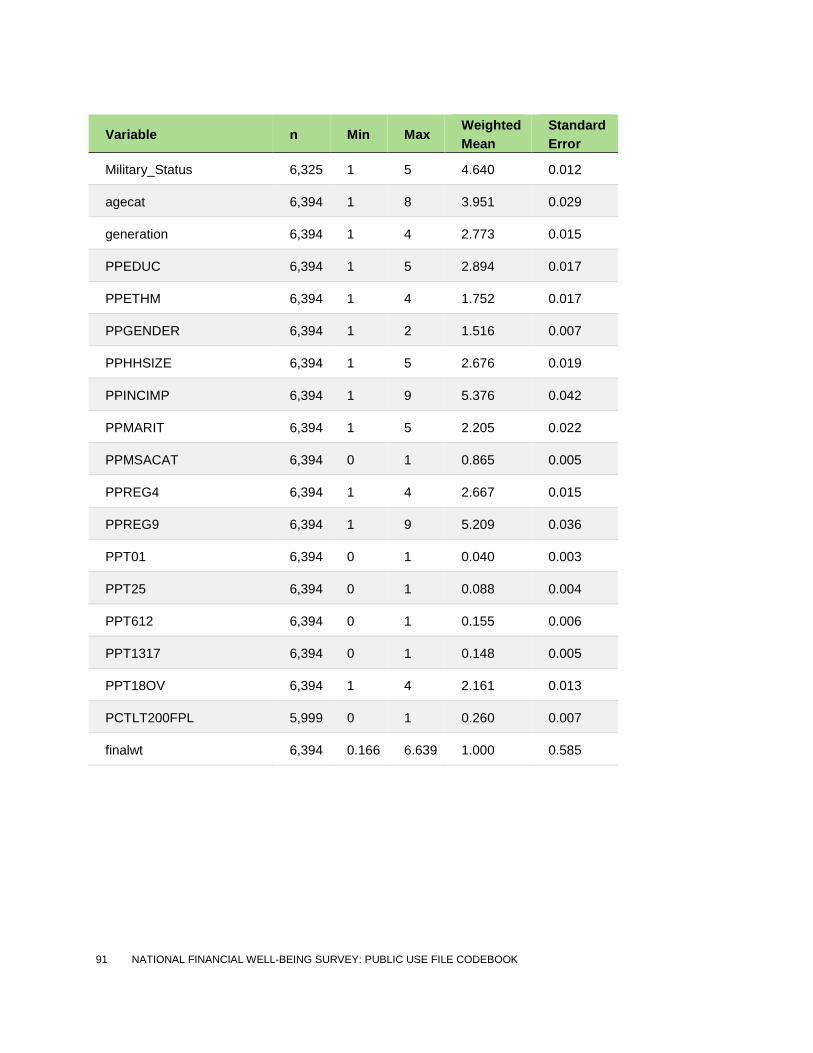
91 NATIONAL FINANCIAL WELL-BEING SURVEY: PUBLIC USE FILE CODEBOOK
Variable n Min Max Weighted Mean
Standard Error
Military_Status 6,325 1 5 4.640 0.012
agecat 6,394 1 8 3.951 0.029
generation 6,394 1 4 2.773 0.015
PPEDUC 6,394 1 5 2.894 0.017
PPETHM 6,394 1 4 1.752 0.017
PPGENDER 6,394 1 2 1.516 0.007
PPHHSIZE 6,394 1 5 2.676 0.019
PPINCIMP 6,394 1 9 5.376 0.042
PPMARIT 6,394 1 5 2.205 0.022
PPMSACAT 6,394 0 1 0.865 0.005
PPREG4 6,394 1 4 2.667 0.015
PPREG9 6,394 1 9 5.209 0.036
PPT01 6,394 0 1 0.040 0.003
PPT25 6,394 0 1 0.088 0.004
PPT612 6,394 0 1 0.155 0.006
PPT1317 6,394 0 1 0.148 0.005
PPT18OV 6,394 1 4 2.161 0.013
PCTLT200FPL 5,999 0 1 0.260 0.007
finalwt 6,394 0.166 6.639 1.000 0.585