National Dental Epidemiology Programme for England:...
41
National Dental Epidemiology Programme for England: oral health survey of five-year-old children 2015 A report on the prevalence and severity of dental decay
Transcript of National Dental Epidemiology Programme for England:...

National Dental Epidemiology Programme for England: oral health survey of five-year-old children 2015 A report on the prevalence and severity of dental decay

Oral health survey of five-year-old children 2015. A report on the prevalence and severity of dental decay.
2
About Public Health England
Public Health England exists to protect and improve the nation's health and wellbeing, and reduce health inequalities. It does this through world-class science, knowledge and intelligence, advocacy, partnerships and the delivery of specialist public health services. PHE is an operationally autonomous executive agency of the Department of Health. Public Health England Wellington House 133-155 Waterloo Road London SE1 8UG Tel: 020 7654 8000 www.gov.uk/phe Twitter: @PHE_uk Facebook: www.facebook.com/PublicHealthEngland Prepared by: Dental Public Health Intelligence Team For queries relating to this document, contact: [email protected] © Crown copyright 2016 You may re-use this information (excluding logos) free of charge in any format or medium, under the terms of the Open Government Licence v3.0. To view this licence, visit OGL or email [email protected]. Where we have identified any third party copyright information you will need to obtain permission from the copyright holders concerned. Any enquiries regarding this publication should be sent to [email protected] Published: May 2016 PHE publications gateway number: 2016050

Oral health survey of five-year-old children 2015. A report on the prevalence and severity of dental decay.
3
Contents
About Public Health England 2
Executive summary 4
Introduction 5
Section 1. Method 6
Section 2. Results 7
Participation in the survey 7
Prevalence of dental decay at age five 8
Severity of dental decay at age five 9
The number of currently decayed teeth at age five 11
The care index 12
Prevalence of children with extracted teeth (due to dental decay) at age five 13
Children with sepsis at the time of the examination 14
Children with substantial amounts of plaque at the time of the examination 14
Dental decay affecting incisors 15
Comparisons by ethnic background 16
Comparisons with other surveys over time 19
Comparison of inequalities over time 21
Section 3. Implications of results 22
Variations in health 22
Changes in levels of dental decay over time 23
Putting this information to use 24
Section 4. References 25
Section 5. Summarised tables 28

Oral health survey of five-year-old children 2015. A report on the prevalence and severity of dental decay.
4
Executive summary
The summarised results in this report are from the third National Dental Epidemiology Programme for England, oral health survey of five-year-old children, 2015.i Estimates at national, regional, Public Health England (PHE) centre and upper and lower-tier local authority level are given for decay prevalence and severity. This data is the source for the dental indicator (proportion of children aged five who are free from obvious tooth decay) included in the Public Health Outcomes Framework.1
Overall, 75.2% of five-year-old children in England whose parents gave consent for participation in this survey had no experience of obvious dental decay. This is the third consecutive survey which has shown improvement in the proportion of children who are free of obvious decay. Among the 24.7% of children with some experience of obvious decay, the average number of teeth that were decayed, missing or filled was 3.4 (at age five, children normally have 20 primary teeth). The average number of decayed, missing or filled teeth in the whole sample (including the 75.2% who were decay free) was 0.8. The results reveal wide variation at regional and local authority level for both prevalence and severity of dental decay. The areas with poorer oral health tend to be in the north and in the more deprived local authority areas. Summary results can be found in Appendix 1 and Appendix 2 of this report. Full tables of results are available at www.nwph.net/dentalhealth. The methods used in this survey were the same as those used in previous surveys during 2008ii and 2012iii, therefore it is possible to make comparisons between these surveys. The results show a continued increase in the proportion of children with no obvious dental decay from 69.1% in 2008 and 72.1% in 2012 to 75.2% in 2015, equating to a change of six percentage points and an improvement of 8.8% since 2008. The average number of decayed, missing or filled teeth has fallen from 1.1 in 2008 and 0.9 in 2012 to 0.8 in 2015, a reduction in severity of 27.3% since 2008. The requirement for positive consent for children to take part prevents comparison with the 1992 to 2006 series of surveysiv. During the 1992 to 2006 series there was little change in the prevalence or severity of decay, however, data from the 2008 to 2015 series show a reduction that requires further investigation to determine the possible
i These survey data were collected during the 2014-15 school year but are referred to here as 2015. ii These survey data were collected during the 2007-08 school year but are referred to here as 2008. iii These survey data were collected during the 2011-12 school year but are referred to here as 2012. iv Department of Health guidance in 2007 required written parental consent be gained for children to be examined in the surveys. This replaced passive consent which had been used for the previous 20 years.

Oral health survey of five-year-old children 2015. A report on the prevalence and severity of dental decay.
5
causes. Surveys in Wales and Scotland have shown similar trends over a similar period.2,3
Local authorities have had responsibility for improving health and reducing inequalities, including oral health, since April 2013.4,5 This report provides benchmarking data that may be used in joint strategic needs assessments and oral health needs assessments to plan and commission oral health improvement interventions. Two national documents were published in June 2014 which aimed to support local authorities in these activities.6,7
Introduction
As part of Public Health England’s Dental Public Health Epidemiology Programme (DPHEP), standard examinations of a random sample of five-year-old children were undertaken in the academic year 2014 to 2015. This was the third national dental survey of this age group to take place under positive consent for participation.iv Since 1985, standardised and coordinated surveys of child dental health have been conducted across the United Kingdom (UK). These have produced robust, comparable information for use at regional and local government level and for varying health geographies. The first national survey of five-year-olds took place in 1992. PHE now has responsibility for coordinating these surveys in England as part of an annual programme. The PHE dental public health epidemiology team facilitated the survey and worked with the British Association for the Study of Community Dentistry (BASCD) who ensured standardisation of examiners. Each local authority commissioned local dental providers to undertake the fieldwork according to a national protocol.8 NHS and local authority commissioners and other health planners use the information produced from the surveys when conducting oral health needs assessments at a local level. These form an important component of the commissioning cycle when planning and evaluating local services and health improvement interventions. The data is also required to provide the dental indicator (proportion of children aged five who are free from obvious tooth decay)1 for the Public Health Outcomes Framework, which is used to monitor health improvement and the reduction of health inequalities at national and local levels. The survey reported here involved children from mainstream, state-funded schools. Information concerning the oral health of five- and twelve- year-old children attending special support schools was the focus of a previous PHE DPHEP survey and was reported in September 2015.9
Oral health survey of five-year-old children 2015. A report on the prevalence and severity of dental decay.
6
Section 1. Method
The sampling frame for this survey was children attending mainstream schools who were aged five years at the time of the survey. It was undertaken during the 2014/15 school year. Data was collected by trained and calibrated examiners who were generally employed by NHS trusts providing community dental services. Pine et al.10 described the methods whereby examiners should be trained and calibrated and these standards were applied, along with BASCD standards for sampling and clinical examination11,12 as in previous surveys. A visual-only examination method was used and informed the standard severity index for teeth with experience of dental decay; missing teeth due to decay (mt), filled teeth due to decay (ft) and teeth with visually obvious decay into dentine, which was the threshold for recording the presence of decay and is indicated by the subscript ‘3’ (d3t). This threshold is widely accepted in the literature as a standard but that it provides an underestimate of the true prevalence and severity of disease. The presence and absence of plaque and oral sepsis were also recorded. The primary sampling unit was lower-tier local authorities. Samples were drawn for each local authority in England using the same methods and similar sampling intensities used in previous surveys and according to the survey protocol. 8 In some local authority areas larger samples were drawn at the request of commissioners to facilitate analysis at smaller geographical levels. Sampled schools were contacted to seek co-operation and age-eligible children were identified. In larger schools random samples of children were taken. Requests for consent for sampled children were sent to parents and followed by a second request where no response was made to the first. Data was collected using the Dental Survey Plus 2 computer program or using a tailor made data collection format in Microsoft Access. Electronic files of the raw, anonymised data were uploaded to a secure folder on a shared network drive by regional dental epidemiology coordinators (DECs). The DPH intelligence team collated, checked and cleaned the data then linked it using home postcodes so that lower super output areas and IMD scores could be assigned. Population weightingv was used to calculate estimates of a range of measures of oral health for each local authority. The postcode of residence for each record was used to
v The sampling methodology used for this survey was school based and therefore not truly representative of the population of five-year-old children by Index of Multiple Deprivation (IMD) quintile. Thus, the sample was treated as a stratified random sample, that is, children were selected randomly from each IMD quintile but the sampling probability varied between IMD quintiles. For this reason, IMD-weighted estimates were produced to provide more robust estimates of overall prevalence.
Oral health survey of five-year-old children 2015. A report on the prevalence and severity of dental decay.
7
assign a deprivation score which had been adjusted for 2015.13 Deprivation scores were then used to allow weighting of the sample data to more closely match the actual distribution of deprivation quintilesvi in the source population. Error bars indicate 95% confidence limits on charts in this report and in the tables available from www.nwph.net/dentalhealth Data suppression was applied when there were insufficient children examined in a group to allow production of a reliable estimate.
Section 2. Results
Headline results are presented here along with an indication of the range of measures and some high-level illustrations. Full tables and charts of results at national, government region, lower- and upper-tier local authorities and for PHE centres are available from www.nwph.net/dentalhealth Participation in the survey
In total, all 152 upper-tier local authorities took part in the survey covering 324 out of 326 lower-tier local authorities. A small proportion of parents (4.5%) actively stated they did not want their children included in the survey, while 0.5% of children with consent declined to take part on the day. Absenteeism on the day of examination accounted for a loss of 3.8% of consented children. Simple non-response to the request was the most common reason for non-consent (28.9%), despite two requests and schools actively seeking returned forms. From the drawn sample 63.1% of children were examined, this response varied from 57.4% in Yorkshire and The Humber to 72.5% in the South West. At lower-tier local authority level the response rate varied from 24.9% in Waveney to 94.5% in Purbeck. Of the children with parental consent 111,500 clinical examinations were included in the final analysis, representing 95.7% of the main consented sample. This represented 16.5% of the population of this age cohort attending mainstream state schools. The proportion of consented children who were examined varied at regional and lower-tier local authority level. Across the regions, response varied from 94.3% in the North
vi Deprivation quintiles divide populations into fifths according to distribution of IMD scores

Oral health survey of five-year-old children 2015. A report on the prevalence and severity of dental decay.
8
East to 96.4% in the South East. At lower-tier local authority level response varied from 84.9% in Daventry to 99.5% in Plymouth. Prevalence of dental decay at age five
The proportion of five-year-old children in England who were free from visually obvious dental decay was 75.2%. The remaining 24.7% had experience of dental decay with one or more teeth that were decayed to dentinal level, extracted or filled because of caries. When comparing the regions, the estimates of those with no obvious decay ranged from 66.6% in the North West to 79.9% in the South East (Figure 1). Figure 1. Percentage of five-year-old children with no obvious decay experience
(d3mft = 0) in England by region, 2015.
Error bars represent 95% confidence limits
At the upper-tier local authority level there were wider variations, ranging from Blackburn with Darwen where 43.9% had no obvious decay to South Gloucestershire where 85.9% were free of decay.
0 5 10 15 20 25 30 35 40 45 50 55 60 65 70 75 80 85
South East
East of England
South West
West Midlands
England
London
East Midlands
North East
Yorkshire and The Humber
North West
percentage
Reg
ion

Oral health survey of five-year-old children 2015. A report on the prevalence and severity of dental decay.
9
Severity of dental decay at age five
The average number of teeth affected by decay (decayed, missing or filled teeth – d3mft) per child was 0.8. At the regional level this ranged from 0.6 in the South East to 1.3 in the North West (Figure 2). Figure 2. Average number of dentinally decayed, missing and filled teeth (d3mft)
among five-year-old children in England by region, 2015.
Error bars represent 95% confidence limits
There was also wide variation in the d3mft across upper-tier local authorities, ranging from 0.4 in nine local authorities to 2.5 in Oldham (Figure 3). Variation was also evident at the lower-tier local authority level and the severity of decay was related to level of deprivation (Figure 4).
0.0 0.2 0.4 0.6 0.8 1.0 1.2 1.4
North West
Yorkshire and The Humber
London
North East
East Midlands
England
West Midlands
South West
East of England
South East
Average d3mft
Reg
ion

Oral health survey of five-year-old children 2015. A report on the prevalence and severity of dental decay.
10
Figure 3. Average number of dentinally decayed, missing (due to decay) and filled teeth (d3mft) among five-year-old children in England by upper-tier local authorities, 2015.
Figure 4. Correlation between number of dentinally decayed, missing (due to
decay) and filled teeth (d3mft) among five-year-old children and Index of Multiple Deprivation (IMD 2015) score. Lower-tier local authorities in England, 2015.
0.0 0.2 0.4 0.6 0.8 1.0 1.2 1.4 1.6 1.8 2.0 2.2 2.4Average d3mft
England = 0.8
Lowest = 0.4
Highest = 2.5
R² = 0.4094
0.00.20.40.60.81.01.21.41.61.82.02.22.42.6
0 5 10 15 20 25 30 35 40 45 50
Aver
age
d 3m
ft
Index of multiple deprivation 2015

Oral health survey of five-year-old children 2015. A report on the prevalence and severity of dental decay.
11
Looking at the severity of decay among only those children with decay experience, separately from children with no obvious decay, allows us to understand more about the extent of disease in these children. In 2015, 24.7% of the examined children had experienced decay. Among these children, the average number of decayed, missing (due to decay) or filled teeth was 3.4 (a child at this age normally has 20 primary teeth). Figure 5 shows the England average and variation across the regions. Figure 5. Average number of dentinally decayed, missing (due to decay) and filled
teeth (d3mft) among five-year-old children with any decay experience (d3mft>0). England by region, 2015.
Error bars represent 95% confidence limits
At upper-tier local authority level there is clear variation of this measure with affected children in Wiltshire having 2.0 teeth affected on average, while those in Rochdale had 4.9 teeth affected. The number of currently decayed teeth at age five
The major component of the d3mft index in this age group is obvious, untreated dentinal decay (d3t) (Figure 6). On average, five-year-old children in England had 0.7 teeth decayed into dentine. At the regional level the average number of currently decayed teeth ranged from 0.5 in the South East, South West and East of England to 1.0 in the North West with wide variation between upper tier local authorities, ranging from 0.2 in Brighton and Hove to 2.2 in Oldham.
0.0 0.5 1.0 1.5 2.0 2.5 3.0 3.5 4.0
North West
London
Yorkshire and The Humber
North East
England
East Midlands
East of England
South East
West Midlands
South West
Average d3mft (d3mft > 0 )
Reg
ion

Oral health survey of five-year-old children 2015. A report on the prevalence and severity of dental decay.
12
Figure 6. Components of d3mft among five-year-old children in England by region, 2015.
Error bars represent 95% confidence limits
The care index
The care index gives an indication of the restorative activity of dentists in each area. It is the percentage of teeth with decay experience that have been treated by filling (ft/d3mft). Opinions differ regarding the appropriateness and benefit of filling decayed primary teeth and there is a lack of definitive evidence-based guidance on this. Care should be taken in making assumptions about the extent or the quality of clinical care available when using this index. Other intelligence such as levels of deprivation, disease prevalence and the provision of dental services should be taken into account when trying to interpret the implications of high or low scores. The proportion of decayed teeth that were filled was 12.0% across England as a whole. This varied between regions from 7.8% in the North West to 14.4% in London (Figure 7), and between upper tier local authorities from 0.3% in Stoke-on-Trent to 24.7% in York. Within regions there was also considerable variation, for example, in Yorkshire and The Humber the index varied from 4.8% in Wakefield to 24.7% in York.
0.0 0.2 0.4 0.6 0.8 1.0 1.2 1.4
North West
Yorkshire and The Humber
London
North East
East Midlands
England
West Midlands
South West
East of England
South East
Average d3mft
Reg
ion England
Mean d3t Mean mt Mean ft

Oral health survey of five-year-old children 2015. A report on the prevalence and severity of dental decay.
13
Figure 7. Care index among five-year-old children in England by region, 2015.
Error bars represent 95% confidence limits
Prevalence of children with extracted teeth (due to dental decay) at age five
Extraction of teeth in young children often involves admission to hospital and a general anaesthetic. This might have occurred at any age prior to the survey, from 18 months onwards. The proportion of five-year-old children with experience of extraction (those with an mt score of one or more) across England was 2.5%. At regional level this ranged from 1.9% to 3.7% (Figure 8). For local authorities this also varied from 0.3% in Solihull in the West Midlands to 7.9% in Middlesbrough in the North East. Figure 8. Percentage of five-year-old children with one or more teeth extracted
due to dental decay (mt > 0) in England by region, 2015.
Error bars represent 95% confidence limits
0 2 4 6 8 10 12 14 16
London
South East
South West
East of England
England
East Midlands
North East
Yorkshire and The Humber
West Midlands
North West
Percentage
Reg
ion
0.0 0.5 1.0 1.5 2.0 2.5 3.0 3.5 4.0 4.5 5.0
Yorkshire and The Humber
North East
North West
London
England
South West
East of England
West Midlands
South East
East Midlands
Percentage
Reg
ion

Oral health survey of five-year-old children 2015. A report on the prevalence and severity of dental decay.
14
Children with sepsis at the time of the examination
At the age of five-years, nearly all sepsis will be the result of the dental decay process rather than originating from gum problems. A small number of cases will be linked to traumatic injury of teeth, but no diagnosis is recorded during this survey. Sepsis was simply defined in the protocol as the presence of a dental abscess or sinus recorded by visual examination of the soft tissues. Sepsis was recorded for 1.4% of volunteers. As expected, the level was generally higher in those areas where there were higher levels of decay. For example, the highest levels occurred in the North West (2.3%) and the lowest in the South East (0.8%) (Figure 9). Figure 9. Percentage of five-year-old children with evidence of sepsis in England
by region, 2015.
Error bars represent 95% confidence limits
Children with substantial amounts of plaque at the time of the examination
The presence of substantial amounts of plaque compared with ‘visible’ or no plaque provides a proxy measure of children who do not brush their teeth or brush them rarely. Such children cannot benefit from the protective effects of fluoride in toothpaste on dental decay. ‘Substantial amount of plaque’ was recorded for 1.7% of volunteers, ranging from 0.5% in the West Midlands to 4.2% in the East of England (Figure 10).
0.0 0.5 1.0 1.5 2.0 2.5 3.0
North West
North East
Yorkshire and The Humber
East Midlands
England
London
West Midlands
East of England
South West
South East
% with sepsis
Reg
ion

Oral health survey of five-year-old children 2015. A report on the prevalence and severity of dental decay.
15
Figure 10: Percentage of five-year-old children with substantial amounts of plaque in England by region, 2015.
Error bars represent 95% confidence limits
Dental decay affecting incisors
For the first time the data from this survey of five-year-olds was used to assess which children had dental decay affecting one or more of their incisor (front) teeth. This measure is useful as it indicates where children have been affected by a particular type of caries. This is an aggressive form of decay that affects upper incisors and can be rapid and extensive in attack. It is associated with long term bottle use with sugar-sweetened drinks, especially when these are given overnight or for long periods of the day. Overall the prevalence of incisor decay was 5.6% (Figure 11) and varied by region, ranging from 3.6% in the South East to 8.5% in the North West. Comparison at lower-tier local authority level shows far wider variation with a prevalence of 0.3% for Maldon and 20.8% in Oldham. Within some local authorities there is likely to be marked geographic variation as this type of decay is closely linked with specific health behaviours which are influenced by local cultural norms. Children with incisor decay are likely to have more teeth affected than is the case for general decay, so tackling this problem may lead to relatively higher benefits.
0.0 0.5 1.0 1.5 2.0 2.5 3.0 3.5 4.0 4.5 5.0
East of England
North East
East Midlands
London
England
South West
Yorkshire and The Humber
South East
North West
West Midlands
% with substantial amount of plaque
Reg
ion

Oral health survey of five-year-old children 2015. A report on the prevalence and severity of dental decay.
16
Figure 11. Percentage of five-year-old children with incisor caries in England by region, 2015.
Error bars represent 95% confidence limits
Comparisons by ethnic background
In previous surveys the recording of ethnic group has been optional for fieldwork teams and tended to be done in areas where there were smaller proportions of white British children. The collection of ethnicity data was made compulsory in the 2015 survey and has resulted in 97.0% of the volunteers being allocated an ethnicity code. The information source for this was from school records which used parents’ reporting of family ethnic group when their child started at school. The ethnicity code set used for school census returns reflects categories used in the 2001 national population census, with additional categories for Travellers of Irish heritage, Sri Lankan other and pupils of Gypsy/Roma heritage. Table 1 summarises four measures calculated for six specific ethnic codes and a group ‘other’ which drew together all those whose ethnic classification did not fit with the other six. Five-year-old children from Chinese and from Eastern European backgrounds had higher prevalence, severity and extent of dental decay than other ethnic groups. The proportion of children with no obvious decay was significantly lower in the Chinese (48.7%) and Eastern European (52.4%) ethnic groups than for the remaining groups, which ranged from 55.4% to 78.6%. The mean d3mft scores among the Chinese (2.5) and Eastern European (2.2) groups were more than three times higher than the white children and for black/black British children (both 0.7). Among those with any obvious decay experience the number of teeth affected in the Chinese and Eastern European groups was 5.0 and 4.7 respectively, significantly higher than for all other groups.
0 2 4 6 8 10
North West
London
Yorkshire and The Humber
North East
East Midlands
England
West Midlands
East of England
South West
South East
% with incisor caries
Reg
ion

Oral health survey of five-year-old children 2015. A report on the prevalence and severity of dental decay.
17
The proportion of children with dental decay affecting one or more incisor teeth was highest among Chinese (24.8%), Eastern European (15.1%) and ‘other’ (16.7%) ethnic groups. These proportions compare with 3.9% of the white children, 6.1% of black/black British and 12.5% of those from an Asian background. Further analysis of the data is required, including controlling for deprivation. Figures 12 and 13 show prevalence and severity scores for each ethnic group. Table 1. Several measures of dental caries found in five-year-old children from
different ethnic backgrounds. Ethnic group Sample
size (n) Proportion of children with no obvious
caries experience
Mean d3mft
Mean d3mft of those with
caries experience
Proportion with incisor decay of whole sample
White 82,162 78.1 (77.77 - 78.34)
0.7 (0.68 - 0.70)
3.1 (3.11 - 3.19)
3.9 (3.75 - 4.01)
Mixed 5,164 75.2 (74.04 - 76.39)
0.8 (0.75 - 0.86)
3.3 (3.14 - 3.42)
5.8 (5.17 - 6.45)
Asian/Asian British
12,011 63.3 (62.45 - 64.17)
1.5 (1.41 - 1.50)
4.0 (3.91 - 4.09)
12.5 (11.95 - 13.13)
Black/black British
5,380 78.6 (77.51 - 79.70)
0.7 (0.65 - 0.74)
3.3 (3.14 - 3.43)
6.1 (5.42 - 6.70)
Chinese 544 48.7 (44.51 – 52.91)
2.5 (2.24 – 2.86)
5.0 (4.56 – 5.43)
24.8 (21.19 – 28.45)
Eastern European
895 52.4 (49.13 - 55.67)
2.2 (1.99 - 2.42)
4.7 (4.35 – 4.98)
15.1 (12.74 - 17.43)
Other ethnic background
2,015 55.4 (53.21 – 57.56)
1.9 (1.74 – 1.99)
4.2 (4.01 - 4.41)
16.7 (15.05 – 18.30)
Not provided 3,329 72.1 (70.54 - 73.59)
1.0 (0.89 - 1.03)
3.4 (3.27 - 3.63)
6.5 (5.71 - 7.39)
Total 111,500 75.2 (74.95 - 75.45)
0.8 (0.83 - 0.85)
3.4 (3.37 - 3.43)
5.6 (5.46 – 5.73)
95% lower and upper confidence limits are shown in brackets

Oral health survey of five-year-old children 2015. A report on the prevalence and severity of dental decay.
18
Figure 12. Percentage of five-year-old children with no obvious decay experience (d3mft = 0) in England by ethnic group, 2015.
Error bars represent 95% confidence limits
Figure 13. Average number of dentinally decayed, missing (due to decay) and filled teeth (d3mft) among five-year-old children in England by ethnic group, 2015.
Error bars represent 95% confidence limits
0.0
10.0
20.0
30.0
40.0
50.0
60.0
70.0
80.0
90.0
Black / BlackBritish
White Mixed Ethnic groupnot provided
Asian / AsianBritish
Other ethnicbackground
EasternEuropean
Chinese
% d
3mft
= 0
Ethnic group
0.00.20.40.60.81.01.21.41.61.82.02.22.42.62.83.0
White Black / BlackBritish
Mixed Ethnic groupnot provided
Asian / AsianBritish
Other ethnicbackground
EasternEuropean
Chinese
Aver
age
d 3m
ft
Ethnic group

Oral health survey of five-year-old children 2015. A report on the prevalence and severity of dental decay.
19
Comparisons with other surveys over time
In the first period of these national surveys, from 1992 to 2006, parents were given the choice to opt out of the surveys and if they did not do so, children were automatically included (known as negative consent). This method changed in 2008 when parents were required to give written, positive consent for their child to be included in the surveys, that is they must ‘opt in’. This change introduced a response bias which is unquantifiable and means that direct comparison cannot be made between surveys in 2008, 2012 and 2015 with those conducted between 1992 and 2006.19
The same methods regarding consent and application of weighting were used in the 2008 and 2012 surveys and the one reported here. Direct comparison of the results of these surveys is therefore valid. Similar response rates were found in all three: 66.8% in 2008, 65.2% in 2012 and 66.5% in 2015. It is likely that non-response bias applies in all three surveys and reference should be made to the response levels when making comparisons, particularly when the sample sizes are small and response levels are low. Comparing results across the three surveys from 2008 to 201514,15 reveals a clear trend of significant improvement in decay levels, with reductions in the estimates of both the severity and prevalence of dental decay across the years. The proportion of children in England with no experience of obvious decay increased from 69.1% in 2008 to 72.1% in 2012 and 75.2% in 2015 (Figure 14). This represents an increase of six percentage points and a percentage change of 8.8% since 2008. An improvement was reported for all regions and this was significant for most. Figure 15 shows a reduction in mean d3mft from 1.1 in 2008 to 0.9 in 2012 to 0.8 in 2015, an overall reduction of 27.3% since 2008. The reduction in severity was recorded for all regions, some significantly so, but not in all local authorities. Figure 14. Percentage of five-year-old children with no decay experience in
England by region, 2008, 2012 and 2015.
Error bars represent 95% confidence limits
EastMidlands
East ofEngland London North East North West South East South West West
Midlands
Yorkshireand theHumber
England
2008 69.2 75.2 67.3 60.2 61.9 73.8 69.4 71.1 61.3 69.12012 70.2 77.0 67.1 70.3 65.2 78.8 73.9 74.0 66.4 72.12015 72.5 79.7 72.6 72.0 66.6 79.9 78.5 76.6 71.5 75.2
0102030405060708090
% d
3mft
= 0
England

Oral health survey of five-year-old children 2015. A report on the prevalence and severity of dental decay.
20
Figure 15. Average number of dentinally decayed, missing (due to decay) and filled teeth (d3mft) among five-year-old children in England by region, 2008, 2012 and 2015.
Error bars represent 95% confidence limits
A change of this magnitude is statistically significant and warrants close inspection to determine the most likely causes. While the absolute levels of decay are not comparable across the full timeline of these surveys (for the reasons highlighted above), the general trends still give an indication of what has been happening over time. Figure 16 shows there was little change in either the prevalence or severity of dental decay in this population between 1998 and 2006. Because of the methodology change introduced for the 2008 survey, it is not possible to determine if any of the change between 2006 and 2008 was due to an actual change in disease levels. However, the surveys carried out using positive consent show a significant reduction in prevalence and severity between 2008 and 2015, as described above. The chart shows the series of child dental health surveys commissioned by the Health and Social Care Information Centre, which used a slightly different method but also introduced positive consent for the 2013 survey. The same pattern of stability between 1980 and 2003 is seen, followed by a marked reduction in the 2013 survey.20
EastMidlands
East ofEngland London North East North
West South East SouthWest
WestMidlands
Yorkshireand theHumber
England
2008 1.0 0.8 1.3 1.5 1.5 0.9 1.0 1.0 1.5 1.12012 0.9 0.8 1.2 1.0 1.3 0.7 0.8 0.8 1.2 0.92015 0.9 0.7 1.0 1.0 1.3 0.6 0.7 0.7 1.0 0.8
0.00
0.20
0.40
0.60
0.80
1.00
1.20
1.40
1.60
Aver
age
d 3m
ft
England

Oral health survey of five-year-old children 2015. A report on the prevalence and severity of dental decay.
21
Figure 16. Results of dental surveys of five-year-olds in England from National Child Dental Health surveys and PHE Dental Public Health Epidemiology Programme surveys, 1973 to 2015.
Comparison of inequalities over time
Over many years and in most dental epidemiological surveys in the UK the relationship between deprivation and dental decay levels has been illustrated. Decay levels are higher in local authorities where deprivation scores are higher. Figure 4 shows the strength of the correlation between the estimates of mean decay severity (d3mft) and Index of Multiple Deprivation (IMD 2015) scores for lower-tier local authorities in England. The same correlations have been carried out for the results from the 2008, 2012 and current survey and are shown in Figure 17. The slope of the lines for each survey and the correlation coefficients appear to remain similar over time. This suggests that while dental decay levels are reducing, the inequalities gap remains the same.
0
10
20
30
40
50
60
70
80
0.0
0.5
1.0
1.5
2.0
2.5
3.0
3.5
1973 1983 1993 2003 2013 1992 1994 1996 1998 2000 2002 2004 2006 2008 2012 2015
% d
3mft
> 0
Aver
age
d 3m
ft
Average d3mft
Percentage with decay experience
Levels measured using positive Consent
DPHEP Surveys CDH Surveys

Oral health survey of five-year-old children 2015. A report on the prevalence and severity of dental decay.
22
R² = 0.4685
R² = 0.4483
R² = 0.4094
0.0
0.2
0.4
0.6
0.8
1.0
1.2
1.4
1.6
1.8
2.0
2.2
2.4
2.6
2.8
0 5 10 15 20 25 30 35 40 45 50 55
Aver
age
d 3m
ft
Index of multiple deprivation score
Avg dmft 2008
Avg dmft 2012
Avg dmft 2015
Linear (Avg dmft 2008)
Linear (Avg dmft 2012)
Linear (Avg dmft 2015)
Figure 17. Correlation between numbers of dentinally decayed, missing (due to decay) and filled teeth (d3mft) among five-year-old children and Index of Multiple Deprivation score. Lower-tier local authorities in England, 2008 (IMD 2007), 2012 (IMD 2010) and 2015 (IMD 2015).
Section 3. Implications of results
Variations in health
It is clear that wide variations in the levels of dental decay experienced by five-year-old children living in different parts of the country and in different life circumstances still exist. Frequent exposure of teeth to free sugars, most commonly through eating and drinking sugary snacks and drinks, is the cause of decay.16 Free sugars are also contributory factors to other issues of public health concern in children, for example, childhood obesity and development of Type II diabetes later in life. There is a clear correlation at lower-tier local authority level between the index of multiple deprivation and decay levels. A similar pattern is also seen in the National Child Measurement Programme,17 with the highest levels of unhealthy weight tending to be found in the most deprived areas. It is not surprising that both surveys show a common association as the factors that lead to dental decay and obesity are similar, however, the nature of the relationship between dental decay levels and childhood obesity has not yet been clearly established.18 It should also be noted that deprivation alone cannot explain the variations in the dental survey data and factors such as location and ethnicity also have considerable effect over and above that for deprivation.
Avg d3mft 2012 Avg d3mft 2015
Linear (Avg d3mft 2008) Linear (Avg d3mft 2012) Linear (Avg d3mft 2015)
Avg d3mft 2008

Oral health survey of five-year-old children 2015. A report on the prevalence and severity of dental decay.
23
Changes in levels of dental decay over time
The use of standardised BASCD criteria and a prescribed training and calibration process ensures the ability to look at trend data over time. This is the third survey to be carried out following some methodological changes, including the requirement to seek positive, written consent, introduced from 2007 and it provides a third data point which confirms a trend for lower levels of decay in this age group. An increase of 9% in the proportion of children with no obvious decay between 2008 and 2015 is matched by a 20% decrease in the proportion that had any experience of obvious decay. During the same time period the mean severity has reduced by 28% from 1.11 d3mft to 0.8 d3mft. This notable improvement in decay levels has followed several decades of stability following the marked improvements related to the introduction of fluoridated toothpaste in the 1970s.21 Similar trends have been noted from the 1980s to 2015 in Scotland 2 and Wales.3 Now that a clear trend has been observed, further detailed analysis is required to determine the impact of a range of possible factors, such as:
• the magnitude of the change in dental decay levels is similar to that found in trials that distributed toothpaste at 1,450ppm fluoride to children up to five-years-old, displacing the use of traditionally low-fluoride children’s toothpaste.22 Following recommendations in the 2007 report Delivering better oral health; an evidence based toolkit for prevention23 several toothpaste manufacturers re-formulated their children’s brands. Fluoride levels were increased from very low levels, such as 250ppm or 440ppm, up to at least 1,000ppm. Only a few small brands stayed at levels less likely to prevent decay. It is possible that this increased use of higher concentration fluoride toothpaste has had the effect of controlling the development of decay and causing a real reduction in measured disease levels. More recent editions of the toolkit have supported this recommendation and tracked the reduction in the number of brands with low fluoride levels23
• the increasing focus on prevention in general dental practice may also have had
an influence. Evidence from the Health and Social Care Information Centre (HSCIC) shows an almost seven-fold increase in dentists’ prescriptions for fluoride-based products between 2007 and 2014,24 and a continuing increase in the application of fluoride varnish for children25
• wide dissemination of the messages about twice daily brushing and spitting out
after brushing instead of rinsing may well have reached sufficiently large proportions of the population to have had an effect. Simply adopting these behaviours, along with higher concentration fluoride toothpaste could have been sufficient to reduce caries levels in five-year-olds
Oral health survey of five-year-old children 2015. A report on the prevalence and severity of dental decay.
24
• in limited parts of the country, oral health improvement programmes have been
established during the lifetime of these five-year-old children. If these have had sufficient intensity, coverage, penetration and length of time to run it is possible that these interventions may have had an impact on the dental health of the recipient populations. The National Institute for Health and Clinical Excellence (NICE) is currently evaluating the evidence
Other possible factors may also explain this apparent reduction and no clear conclusion should be drawn until these have been investigated. Putting this information to use
Data from this survey will be used to produce the dental indicator (4.2 tooth decay in children aged five) in the Public Health Outcomes Framework (PHOF).1 In previous reports the prevalence of children with experience of decay has been shown but for this survey a change has been made to report the proportion of children who are free of obvious decay and this aligns with the PHOF indicator. Locally these data are used as important contributions to Joint Strategic Needs Assessments. This is because improvements in dental decay levels can give early indication of the success, or otherwise, of interventions aimed at very young children such as those designed to improve parenting, children’s weight or overall health or diet. Such interventions may need many years to pass before the impact can be measured. Dental decay levels can be used as early proxy measures of the impact of programmes focussed on weaning and feeding practices or improving parenting skills. Reliable data on dental decay levels can assist with planning and commissioning dental health improvement programmes, which are the responsibility of local authorities. These should be commissioned following strategic planning, taking into account the measured health needs of the population. Guidance is available from PHE6 and NICE7 about commissioning oral health improvement programmes and there is good evidence that, in addition to place-based generic health improvement activities, which will address some of the common risk factors for dental decay, strategies to increase the exposure to fluoride are effective. Use of the data at a lower level than local authority boundaries can help to show where inequalities lie within a local authority and therefore where targeted interventions are required. The introduction of a measure showing children with incisor caries will indicate where interventions are required to tackle this specific problem which is related to long term use of a baby bottle and sugared drinks. For the first time, data is available to indicate which ethnic groups are at higher risk of decay. The country level estimates can be used locally to inform planners about

Oral health survey of five-year-old children 2015. A report on the prevalence and severity of dental decay.
25
tailoring interventions for specific groups in the population according to their cultural needs. Local authorities may seek dental public health advice from PHE with regard to commissioning additional surveys using this method. This would allow them to evaluate their interventions and to investigate specific population groups.
Section 4. References
1. Department of Health. Public Health Outcomes Framework 2013 to 2016 [Internet]. Last updated December 2015 [cited 2016 Feb 9]. Available from: www.gov.uk/government/publications/healthy-lives-healthy-people-improving-outcomes-and-supporting-transparency
2. National Dental Inspection Programme (NDIP) 2014. Report of the 2014 Detailed
National Dental Inspection Programme of Primary 1 children and the Basic Inspection of Primary 1 and Primary 7 children. Available from: http://ndip.scottishdental.org/wp-content/uploads/2014/10/2014-10-28-NDIP-Report.pdf
3. Picture of oral health 2016. Dental epidemiological survey of 5 year olds 2014/15.
Welsh oral health information unit, Cardiff University. Available from: www.cardiff.ac.uk/__data/assets/pdf_file/0006/218589/Picture-of-Oral-Health-2016.pdf
4. The Stationery Office. Health & Social Care Act 2012 [Internet]. 2006 [cited 2016 Feb
9]. Available from: www.legislation.gov.uk/ukpga/2012/7/enacted 5. Secretary of State. Statutory Instrument No 3094. National Health Service, England
Social Care Fund, England Public Health, England. The NHS Bodies and Local Authorities (Partnership Arrangements, Care Trusts, Public Health and Local Healthwatch) Regulations 2012 [Internet]. 2012 [cited 2016 Feb 9]. Available from: www.legislation.gov.uk/uksi/2012/3094/part/4/made
6. Public Health England. Local authorities improving oral health: commissioning better
oral health for children and young people. An evidence-informed toolkit for local authorities [Internet]. 2014 [cited 2016 Feb 9]. Available from: www.gov.uk/government/publications/improving-oral-health-an-evidence-informed-toolkit-for-local-authorities

Oral health survey of five-year-old children 2015. A report on the prevalence and severity of dental decay.
26
7. National Institute for Health and Care Excellence. Oral health: approaches for local authorities and their partners to improve the oral health of their communities [Internet]. NICE guidelines [PH55] 2014 [cited 2016 Feb 9]. Available from: www.nice.org.uk/guidance/ph55
8. Dental public health epidemiology programme. Oral health survey of five-year-old
children 2014-15 National protocol Version 2 Public Health England 2014. Gateway ref: 201416. Available from: www.nwph.net/dentalhealth/survey-results%205(14_15).aspx
9. Public Health England. Oral health survey of five-year-old and 12-year-old children
attending special support schools 2014. A report on the prevalence and severity of dental decay [Internet]. Dental public health epidemiology programme 2015 [cited 2016 Feb 9]. Available from: www.nwph.net/dentalhealth
10. Pine CM, Pitts NB, Nugent ZJ. British Association for the Study of Community
Dentistry (BASCD) guidance on the statistical aspects of training and calibration of examiners for surveys of child dental health. A BASCD co-ordinated dental epidemiology programme quality standard. Community Dental Health. 1997a 14 (Supplement 1):18-29.
11. Pitts NB, Evans DJ, Pine CM. British Association for the Study of Community
Dentistry (BASCD) diagnostic criteria for caries prevalence surveys – 1996/97. Community Dental Health. 1997 14 (Supplement 1): 6-9.
12. Pine CM, Pitts NB, Nugent ZJ. British Association for the Study of Community
Dentistry (BASCD) guidance on sampling for surveys of child dental health. A BASCD coordinated dental epidemiology programme quality standard. Community Dental Health.1997b 14 (Supplement 1):10-17.
13. Office for National Statistics. Ward population estimates, mid – 2011(Census based)
[Internet]. Statistical bulletin, 2013 [cited 2016 Feb 9]. Available from: www.ons.gov.uk/ons/dcp171778_311891.pdf
14. Davies G.M., Jones C.M., Monaghan N., Morgan M.Z., Pine C.M., Pitts N.B., Neville
J.S. and Rooney E. (2011): The caries experience of 5 year-old children in Scotland, Wales and England in 2007-2008 and the impact of consent arrangements. Reports of Co-ordinated surveys using BASCD criteria. Community Dental Health 28, 5-11.
15. Public Health England. Oral health survey of five-year-old children 2012. A report on
the prevalence and severity of dental decay [Internet]. National dental epidemiology programme, 2013 [cited 2016 Feb 9]. Available from: www.nwph.net/dentalhealth

Oral health survey of five-year-old children 2015. A report on the prevalence and severity of dental decay.
27
16. Carbohydrates and Health Scientific Advisory Committee on Nutrition 2015. The stationery office, London. Available from: www.gov.uk/government/publications/sacn-carbohydrates-and-health-report
17. National Child Measurement Programme: England, 2014/15 school year. 2015.
Health and Social Care Information Centre. Available from: www.hscic.gov.uk/catalogue/PUB19109/nati-chil-meas-prog-eng-2014-2015-rep.pdf
18. The relationship between dental caries and obesity in children: an evidence
summary 2015. Public Health England. Available from: www.gov.uk/government/uploads/system/uploads/attachment_data/file/466334/Caries_obesity_Evidence_SummaryOCT2015FINAL.pdf
19. Davies G.M., Robinson R., Neville J. and Burnside G. (2014): Investigation of bias
related to non-return of consent for a dental epidemiological survey of caries among five year olds. Community Dental Health 31, 21-26
20. Health and Social Care Information Centre. Child Dental Health Survey 2013,
England, Wales and Northern Ireland [Internet]. 2015 [cited 2016 Feb 9]. Available from: www.hscic.gov.uk/catalogue/PUB17137
21. Anderson RJ, Bradnock G, Beal JF, James PMC. (1982) Reduction of dental caries
prevalence in English Schoolchildren. J Dent Res 6:1311-6. 22. Davies, G.M., Worthington, H.V., Ellwood, R.P., Blinkhorn, A.S., Taylor, G.O. and
Davies, R.M. (2002). A randomised controlled trial of the effectiveness of providing free fluoride toothpaste during pre-school years on reducing caries in 5-6 year old children. Community Dental Health 19: 131-136.
23. Public Health England. Delivering better oral health: an evidence based toolkit for
prevention [Internet]. Third edition, 2014 [cited 2016 Feb 9]. Available from: www.gov.uk/government/publications/delivering-better-oral-health-an-evidence-based-toolkit-for-prevention
24. Prescribing by Dentists England, 2014. Health and Social Care Information Centre.
Available from: www.hscic.gov.uk/catalogue/PUB17425/pres_dent_eng_2014_rep.pdf
25. NHS Dental Statistics England 2014/15. Available from :
www.hscic.gov.uk/catalogue/PUB18129/nhs-dent-stat-eng-14-15-repV1.1.pdf

Oral health survey of five-year-old children 2015. A report on the prevalence and severity of dental decay.
28
Section 5. Summarised tables
The complete sets of tables with detailed results are available from: www.nwph.net/dentalhealth

29
Appendix 1. Dental Public Health Epidemiology Programme for England, Oral Health Survey of five-year-old children 2015, upper tier local authority (LA)
Part LA did not partake in survey
Region Upper Tier LA Code Upper Tier LA Name
% of sample
examined
Meand3mft
Meand3t
% d3mft = 0 % d3mft > 0 Mean d3mft
(% d3mft > 0)
% with incisor caries
Meand3mft
Meand3t
% d3mft = 0 % d3mft > 0 Mean d3mft (% d3mft >
0)
% with incisor caries
Country E92000001 England 63.1 0.8 0.7 75.2 24.7 3.4 5.6 0.01 0.01 0.25 0.25 0.03 0.14
E06000015 Derby 60.1 1.3 1.0 72.4 27.6 4.7 4.6 0.33 0.29 5.21 5.21 0.82 2.42E10000007 Derbyshire 59.7 0.7 0.5 77.8 22.2 3.1 3.4 0.09 0.07 2.13 2.13 0.27 0.95E06000016 Leicester 51.6 1.9 1.5 55.0 45.0 4.2 14.2 0.22 0.19 3.41 3.41 0.37 2.43E10000018 Leicestershire 69.4 0.8 0.7 71.6 28.4 2.8 5.3 0.09 0.08 2.26 2.26 0.22 1.13E10000019 Lincolnshire 74.7 0.7 0.6 76.5 23.5 3.0 3.9 0.09 0.08 2.05 2.05 0.27 0.95E10000021 Northamptonshire 57.0 0.8 0.7 72.9 27.1 3.1 3.9 0.11 0.10 2.50 2.50 0.28 1.13E06000018 Nottingham 64.0 1.2 1.0 64.4 35.6 3.4 9.5 0.23 0.21 4.66 4.66 0.47 2.87E10000024 Nottinghamshire 66.9 0.6 0.5 79.0 21.0 2.9 4.4 0.08 0.07 2.11 2.11 0.28 1.06E06000017 Rutland 81.9 0.7 0.7 71.2 28.8 2.6 6.3 0.23 0.21 6.08 6.08 0.58 3.28
E06000055 Bedford 80.6 0.9 0.7 73.1 26.9 3.5 6.1 0.14 0.12 2.89 2.89 0.35 1.58E10000003 Cambridgeshire 67.0 0.5 0.4 83.1 16.9 3.3 4.3 0.08 0.07 1.96 1.96 0.33 1.07E06000056 Central Bedfordshire 78.6 0.5 0.4 81.9 18.1 2.8 3.1 0.08 0.07 2.09 2.09 0.30 0.96E10000012 Essex 61.4 0.5 0.4 83.9 16.0 3.1 2.9 0.05 0.04 1.18 1.18 0.21 0.55E10000015 Hertfordshire 75.9 0.6 0.5 79.8 20.2 2.9 3.5 0.05 0.04 1.19 1.19 0.16 0.55E06000032 Luton 77.7 1.7 1.2 57.4 42.6 4.0 14.7 0.29 0.24 5.10 5.10 0.49 3.64E10000020 Norfolk 51.2 0.7 0.6 81.7 18.3 3.8 2.7 0.09 0.08 1.94 1.94 0.31 0.83E06000031 Peterborough 72.9 1.1 0.9 70.0 30.0 3.8 8.1 0.27 0.24 5.40 5.40 0.57 3.38E06000033 Southend-on-Sea 56.1 0.6 0.5 82.3 17.4 3.3 3.3 0.18 0.16 4.21 4.19 0.66 1.99E10000029 Suffolk 53.1 0.7 0.5 79.1 20.8 3.2 4.8 0.08 0.07 1.91 1.91 0.26 1.01E06000034 Thurrock 73.0 0.6 0.5 80.5 19.5 3.1 2.8 0.19 0.18 4.81 4.81 0.64 1.97
E09000002 Barking and Dagenham 42.1 1.3 1.0 68.6 31.4 4.1 9.9 0.28 0.24 5.30 5.30 0.56 3.38E09000003 Barnet 70.0 1.2 1.0 68.0 31.6 3.8 7.9 0.26 0.21 5.04 5.03 0.57 2.97E09000004 Bexley 72.9 0.4 0.4 82.8 17.0 2.7 1.6 0.13 0.12 3.71 3.70 0.47 1.24E09000005 Brent 66.6 1.3 1.0 69.2 30.8 4.2 12.1 0.22 0.19 4.18 4.18 0.47 2.99E09000006 Bromley 86.5 0.4 0.4 84.0 16.0 2.7 5.1 0.15 0.14 4.19 4.19 0.64 2.54E09000007 Camden 59.7 0.9 0.5 76.5 23.5 3.6 6.0 0.20 0.15 4.10 4.10 0.55 2.22E09000008 Croydon 65.4 0.9 0.5 73.7 26.3 3.2 7.5 0.18 0.13 4.33 4.33 0.42 2.57E09000009 Ealing 51.6 1.8 1.5 60.3 39.0 4.6 13.4 0.23 0.20 3.70 3.69 0.37 2.56E09000010 Enfield 67.0 1.2 1.0 66.1 33.9 3.4 11.6 0.18 0.17 3.94 3.94 0.37 2.69E09000011 Greenwich 60.6 0.8 0.6 76.1 23.9 3.2 4.3 0.20 0.17 4.71 4.71 0.57 2.14E09000012 Hackney (including City of London) 50.5 1.0 0.7 73.4 27.0 3.6 9.3 0.12 0.10 2.41 2.41 0.31 1.57E09000013 Hammersmith and Fulham 64.2 0.7 0.5 73.7 26.3 2.7 8.5 0.20 0.17 6.32 6.32 0.44 4.07E09000014 Haringey 68.8 1.2 0.9 69.7 30.3 3.9 10.2 0.21 0.18 3.74 3.74 0.48 2.57E09000015 Harrow 64.3 1.4 1.0 65.5 34.2 4.1 14.3 0.25 0.21 4.71 4.70 0.49 3.51E09000016 Havering 49.4 0.7 0.6 80.0 20.0 3.3 3.7 0.24 0.22 5.06 5.06 0.90 2.34E09000017 Hillingdon 69.9 1.5 1.2 62.2 37.8 3.9 16.7 0.26 0.24 4.75 4.75 0.50 3.72E09000018 Hounslow 68.6 1.1 0.8 69.4 30.5 3.6 5.2 0.14 0.12 3.02 3.02 0.31 1.46
Weighted Measures 95% Confidence Intervals
East
Mid
land
sEa
st o
f Eng
land
Lond
on

30
Appendix 1. Dental Public Health Epidemiology Programme for England, Oral Health Survey of five-year-old children 2015, upper tier local authority (LA)
Part LA did not partake in survey
Region Upper Tier LA Code Upper Tier LA Name
% of sample
examined
Meand3mft
Meand3t
% d3mft = 0 % d3mft > 0 Mean d3mft
(% d3mft > 0)
% with incisor caries
Meand3mft
Meand3t
% d3mft = 0 % d3mft > 0 Mean d3mft (% d3mft >
0)
% with incisor caries
E09000019 Islington 57.5 0.9 0.5 75.6 24.4 3.5 6.7 0.16 0.11 3.45 3.45 0.45 2.01E09000020 Kensington and Chelsea 53.1 1.1 0.8 66.6 33.4 3.3 12.2 0.28 0.25 6.11 6.11 0.60 4.34E09000021 Kingston upon Thames 76.0 0.8 0.6 77.1 22.9 3.4 3.2 0.20 0.17 4.41 4.41 0.61 1.85E09000022 Lambeth 47.5 0.8 0.6 77.9 22.1 3.7 5.7 0.16 0.13 3.15 3.15 0.47 1.77E09000023 Lewisham 63.2 0.6 0.4 76.7 23.3 2.4 4.6 0.16 0.10 4.33 4.33 0.31 2.30E09000024 Merton 70.3 0.9 0.6 73.9 26.1 3.5 6.7 0.22 0.17 4.26 4.26 0.63 2.40E09000025 Newham 63.7 1.2 1.0 70.7 28.3 4.5 8.7 0.09 0.08 1.59 1.57 0.20 0.98E09000026 Redbridge 53.3 1.0 0.7 76.3 23.7 4.1 9.1 0.21 0.18 4.19 4.19 0.58 2.77E09000027 Richmond upon Thames 69.3 0.5 0.3 81.0 19.0 2.5 1.9 0.13 0.10 3.91 3.91 0.47 1.34E09000028 Southwark 45.8 0.6 0.4 81.2 18.8 3.3 4.5 0.15 0.10 3.43 3.43 0.50 1.84E09000029 Sutton 69.0 0.6 0.4 81.0 19.0 3.0 5.1 0.12 0.11 2.94 2.94 0.45 1.72E09000030 Tower Hamlets 59.9 1.3 1.0 64.5 35.5 3.6 12.3 0.11 0.09 2.29 2.29 0.21 1.56E09000031 Waltham Forest 61.3 1.1 0.8 70.2 29.8 3.5 8.5 0.22 0.19 4.51 4.51 0.50 2.76E09000032 Wandsworth 64.3 0.8 0.6 76.8 23.2 3.6 7.9 0.19 0.16 4.04 4.04 0.55 2.55E09000033 Westminster 65.4 1.2 0.8 64.9 35.1 3.3 13.5 0.15 0.13 3.25 3.25 0.31 2.34
E06000047 County Durham 67.3 1.1 0.9 64.9 35.1 3.0 8.4 0.25 0.22 6.13 6.13 0.46 3.65E06000005 Darlington 59.6 1.2 0.9 64.6 35.4 3.4 9.5 0.30 0.26 5.99 5.99 0.64 3.66E08000037 Gateshead 61.3 0.7 0.5 76.2 23.8 2.7 3.3 0.21 0.17 6.02 6.02 0.59 2.38E06000001 Hartlepool 51.8 0.4 0.3 84.6 15.4 2.6 3.1 0.16 0.11 4.76 4.76 0.68 2.32E06000002 Middlesbrough 50.9 1.7 1.1 61.2 38.8 4.3 10.0 0.34 0.28 5.55 5.55 0.61 3.54E08000021 Newcastle upon Tyne 44.4 0.7 0.5 77.5 22.5 3.2 4.8 0.26 0.21 5.84 5.84 0.87 3.06E08000022 North Tyneside 68.0 0.5 0.4 81.7 18.3 2.9 3.2 0.17 0.15 5.02 5.02 0.51 2.36E06000057 Northumberland 65.9 0.7 0.5 74.3 25.7 2.9 3.9 0.18 0.14 4.90 4.90 0.45 2.24E06000003 Redcar and Cleveland 54.4 1.1 0.7 72.9 27.1 4.1 8.0 0.33 0.24 5.75 5.75 0.84 3.64E08000023 South Tyneside 58.7 0.7 0.5 74.0 26.0 2.7 1.5 0.22 0.18 6.02 6.02 0.55 1.65E06000004 Stockton-on-Tees 55.6 0.9 0.6 74.7 25.3 3.7 6.2 0.26 0.19 5.08 5.08 0.73 2.68E08000024 Sunderland 67.6 1.5 1.2 59.9 40.1 3.8 11.5 0.35 0.32 6.14 6.14 0.59 4.16
E06000008 Blackburn with Darwen 70.0 2.4 2.1 43.9 55.7 4.4 13.5 0.42 0.38 6.08 6.09 0.56 4.32E06000009 Blackpool 60.3 1.8 1.4 57.5 42.5 4.3 11.8 0.43 0.36 7.28 7.28 0.68 4.87E08000001 Bolton 68.7 1.7 1.2 59.5 40.5 4.1 13.7 0.34 0.26 6.03 6.03 0.56 4.36E08000002 Bury 59.7 0.9 0.7 73.3 26.7 3.4 3.6 0.25 0.22 5.70 5.70 0.60 2.34E06000049 Cheshire East 72.9 0.8 0.6 79.1 20.9 3.7 4.1 0.27 0.23 4.87 4.87 0.97 2.56E06000050 Cheshire West and Chester 66.3 0.7 0.6 79.7 20.3 3.3 2.1 0.26 0.24 5.78 5.78 0.87 2.28E10000006 Cumbria 72.1 1.2 1.0 67.8 32.2 3.6 7.7 0.10 0.09 2.13 2.13 0.22 1.22E06000006 Halton 59.4 0.9 0.8 73.3 26.2 3.6 5.7 0.31 0.27 6.25 6.22 0.78 3.41E08000011 Knowsley 45.4 1.2 0.8 67.5 32.5 3.8 6.8 0.27 0.20 5.04 5.04 0.59 2.79E10000017 Lancashire 77.9 1.2 1.0 68.0 31.9 3.7 7.2 0.09 0.08 1.76 1.76 0.19 1.01E08000012 Liverpool 41.3 1.4 0.9 68.2 31.8 4.3 8.3 0.27 0.23 4.90 4.90 0.56 2.68E08000003 Manchester 62.1 1.3 1.1 67.3 32.7 4.0 12.8 0.28 0.24 5.24 5.24 0.56 3.72
Nor
th W
est
Weighted Measures 95% Confidence Intervals
Nor
th E
ast
Lond
on

31
Appendix 1. Dental Public Health Epidemiology Programme for England, Oral Health Survey of five-year-old children 2015, upper tier local authority (LA)
Part LA did not partake in survey
Region Upper Tier LA Code Upper Tier LA Name
% of sample
examined
Meand3mft
Meand3t
% d3mft = 0 % d3mft > 0 Mean d3mft
(% d3mft > 0)
% with incisor caries
Meand3mft
Meand3t
% d3mft = 0 % d3mft > 0 Mean d3mft (% d3mft >
0)
% with incisor caries
E08000004 Oldham 63.1 2.5 2.2 49.1 50.9 4.8 20.8 0.44 0.42 6.29 6.29 0.63 5.23E08000005 Rochdale 86.5 2.1 1.8 56.5 43.5 4.9 16.6 0.34 0.32 5.19 5.19 0.54 3.95E08000006 Salford 57.8 1.8 1.7 49.0 51.0 3.6 10.9 0.30 0.28 5.25 5.25 0.46 3.37E08000014 Sefton 53.0 0.6 0.5 77.3 22.7 2.8 4.7 0.16 0.13 4.47 4.47 0.44 2.31E08000013 St. Helens 46.7 1.1 0.8 70.3 29.7 3.7 7.5 0.36 0.30 7.08 7.08 0.85 4.37E08000007 Stockport 64.1 0.8 0.6 78.3 21.7 3.5 5.4 0.25 0.22 5.15 5.15 0.80 2.92E08000008 Tameside 64.2 1.2 1.0 68.6 31.4 3.7 8.8 0.24 0.22 4.94 4.94 0.52 2.61E08000009 Trafford 82.5 0.9 0.8 73.6 26.4 3.3 6.9 0.20 0.19 4.41 4.41 0.55 2.58E06000007 Warrington 47.0 0.9 0.8 75.5 24.5 3.5 2.8 0.51 0.47 8.01 8.01 1.57 3.47E08000010 Wigan 57.9 1.1 0.9 67.5 32.5 3.5 5.5 0.27 0.22 5.64 5.64 0.56 2.81E08000015 Wirral 57.1 1.2 0.8 67.1 32.9 3.5 7.2 0.30 0.25 6.55 6.55 0.61 3.51
E06000036 Bracknell Forest 63.5 0.8 0.6 77.9 22.1 3.5 5.6 0.24 0.23 4.91 4.91 0.80 2.76E06000043 Brighton and Hove 54.1 0.4 0.2 82.4 16.2 2.3 1.3 0.17 0.10 5.83 5.22 0.67 1.51E10000002 Buckinghamshire 73.8 0.7 0.6 76.5 23.4 3.0 3.3 0.11 0.10 2.47 2.47 0.34 1.09E10000011 East Sussex 57.7 0.5 0.4 79.7 20.3 2.5 3.4 0.13 0.10 3.75 3.75 0.41 1.68E10000014 Hampshire 51.2 0.5 0.3 85.0 15.0 3.0 2.5 0.06 0.05 1.46 1.46 0.26 0.64E06000046 Isle of Wight 75.4 0.8 0.6 73.6 26.4 3.1 3.1 0.17 0.14 3.88 3.88 0.45 1.52E10000016 Kent 69.4 0.5 0.4 83.4 16.2 3.3 1.9 0.06 0.05 1.31 1.30 0.22 0.49E06000035 Medway 68.5 0.7 0.6 81.3 18.4 3.7 3.1 0.22 0.19 4.43 4.38 0.66 1.97E06000042 Milton Keynes 61.1 0.6 0.5 78.3 21.5 3.0 4.7 0.07 0.06 1.69 1.68 0.22 0.88E10000025 Oxfordshire 69.6 0.8 0.6 77.3 22.7 3.3 4.8 0.10 0.08 2.19 2.19 0.27 1.15E06000044 Portsmouth 78.3 0.6 0.3 81.9 18.1 3.2 2.3 0.10 0.08 2.54 2.54 0.37 1.02E06000038 Reading 67.1 0.9 0.7 71.9 28.1 3.4 7.5 0.23 0.18 5.03 5.03 0.55 3.01E06000039 Slough 65.5 1.8 1.5 58.7 41.3 4.3 11.2 0.32 0.29 5.57 5.57 0.51 3.55E06000045 Southampton 81.5 1.3 0.9 66.3 33.7 3.7 7.2 0.13 0.11 2.69 2.69 0.27 1.49E10000030 Surrey (No data for Tandridge LA) 51.4 0.5 0.4 81.3 18.7 2.9 3.1 0.08 0.07 2.11 2.11 0.32 0.94E06000037 West Berkshire 63.2 0.7 0.6 76.9 23.1 3.2 3.3 0.29 0.24 6.03 6.03 0.86 3.10E10000032 West Sussex (No data for Adur LA) 61.0 0.4 0.4 82.0 17.5 2.6 3.7 0.15 0.13 3.27 3.24 0.63 1.67E06000040 Windsor and Maidenhead 67.5 0.6 0.5 81.5 18.5 3.4 5.5 0.21 0.20 4.66 4.66 0.75 2.80E06000041 Wokingham 65.3 0.6 0.4 85.2 14.8 3.8 4.6 0.25 0.20 4.45 4.45 1.21 2.64
E06000022 Bath and North East Somerset 65.7 0.4 0.3 85.0 15.0 2.5 3.5 0.16 0.12 4.47 4.47 0.71 2.25E06000028 Bournemouth 81.0 0.9 0.6 71.8 28.2 3.3 4.7 0.23 0.18 5.33 5.33 0.56 2.45E06000023 Bristol, City of 59.9 1.1 0.7 71.1 28.9 3.9 6.1 0.28 0.23 5.39 5.39 0.67 2.97E06000052 Cornwall (including Isles of Scilly) 70.7 0.7 0.5 78.3 21.7 3.2 5.1 0.13 0.11 2.95 2.95 0.38 1.61E10000008 Devon 80.0 0.6 0.4 80.4 19.6 2.9 4.0 0.06 0.05 1.62 1.62 0.20 0.80E10000009 Dorset 76.3 0.6 0.5 75.2 24.8 2.5 3.6 0.11 0.09 3.36 3.36 0.28 1.48E10000013 Gloucestershire 71.7 0.7 0.5 79.9 20.1 3.4 4.3 0.10 0.08 2.11 2.11 0.31 1.10E06000024 North Somerset 62.7 0.6 0.4 81.9 18.1 3.1 2.0 0.19 0.17 4.74 4.74 0.66 1.55E06000026 Plymouth 48.3 0.4 0.4 84.7 15.3 2.8 1.8 0.14 0.13 3.74 3.74 0.57 1.36
Sout
h Ea
stSo
uth
Wes
tN
orth
Wes
t
Weighted Measures 95% Confidence Intervals

32
Appendix 1. Dental Public Health Epidemiology Programme for England, Oral Health Survey of five-year-old children 2015, upper tier local authority (LA)
Part LA did not partake in survey
Region Upper Tier LA Code Upper Tier LA Name
% of sample
examined
Meand3mft
Meand3t
% d3mft = 0 % d3mft > 0 Mean d3mft
(% d3mft > 0)
% with incisor caries
Meand3mft
Meand3t
% d3mft = 0 % d3mft > 0 Mean d3mft (% d3mft >
0)
% with incisor caries
E06000029 Poole 89.4 0.7 0.5 78.7 21.3 3.5 4.9 0.18 0.15 3.82 3.82 0.58 2.11E10000027 Somerset 67.1 0.7 0.6 76.9 23.1 3.1 4.0 0.10 0.08 2.47 2.47 0.31 1.17E06000025 South Gloucestershire 73.5 0.4 0.3 85.9 14.1 2.9 0.7 0.15 0.11 4.18 4.18 0.69 0.95E06000030 Swindon 67.8 0.8 0.7 72.1 27.9 2.8 5.7 0.22 0.20 5.64 5.64 0.55 2.87E06000027 Torbay 74.5 0.8 0.6 73.2 26.8 3.1 4.3 0.22 0.17 5.22 5.22 0.57 2.24E06000054 Wiltshire 66.9 0.4 0.3 78.2 21.8 2.0 3.3 0.17 0.13 6.08 6.08 0.58 2.70
E08000025 Birmingham 53.9 0.8 0.5 71.3 28.7 2.9 3.7 0.21 0.14 4.90 4.90 0.52 2.13E08000026 Coventry 79.7 1.0 0.9 71.6 28.4 3.7 11.1 0.28 0.26 5.31 5.31 0.71 3.77E08000027 Dudley 59.1 0.5 0.4 81.5 18.5 2.5 2.3 0.06 0.06 1.88 1.88 0.24 0.74E06000019 Herefordshire, County of 79.1 1.4 1.2 58.7 41.3 3.5 6.5 0.27 0.24 5.66 5.66 0.44 2.74E08000028 Sandwell 62.4 0.7 0.5 76.6 23.4 2.9 4.1 0.06 0.05 1.64 1.64 0.18 0.77E06000051 Shropshire 54.4 0.8 0.7 78.5 21.5 3.7 5.7 0.34 0.30 6.42 6.42 1.07 4.03E08000029 Solihull 71.6 0.6 0.5 82.9 17.1 3.3 2.5 0.22 0.21 4.70 4.70 0.88 1.86E10000028 Staffordshire 63.6 0.5 0.4 82.2 17.8 2.8 1.1 0.07 0.06 1.87 1.87 0.25 0.52E06000021 Stoke-on-Trent 69.9 1.2 1.0 70.7 29.3 4.1 5.2 0.29 0.25 5.37 5.37 0.63 2.66E06000020 Telford and Wrekin 47.8 0.9 0.7 77.0 23.0 3.8 8.3 0.37 0.31 6.55 6.55 1.07 4.57E08000030 Walsall 64.3 0.7 0.5 74.8 25.2 2.7 4.1 0.07 0.06 2.06 2.06 0.20 0.94E10000031 Warwickshire 72.7 0.8 0.7 73.7 26.3 3.1 4.2 0.11 0.10 2.48 2.48 0.31 1.13E08000031 Wolverhampton 64.4 1.0 0.9 72.2 27.8 3.6 7.0 0.09 0.09 1.90 1.90 0.23 1.09E10000034 Worcestershire 59.5 0.6 0.5 79.0 21.0 3.1 3.9 0.06 0.05 1.36 1.36 0.19 0.66
E08000016 Barnsley 60.4 1.1 0.8 69.8 30.2 3.5 7.3 0.11 0.08 2.19 2.19 0.24 1.26E08000032 Bradford 48.4 1.5 1.0 62.5 37.3 4.0 9.3 0.16 0.12 2.85 2.85 0.30 1.76E08000033 Calderdale 73.2 1.1 0.8 70.7 29.3 3.7 5.6 0.26 0.20 5.10 5.10 0.60 2.70E08000017 Doncaster 59.5 1.1 0.7 69.0 31.0 3.6 7.8 0.29 0.22 5.84 5.84 0.67 3.41E06000011 East Riding of Yorkshire 72.4 0.6 0.5 76.9 23.1 2.6 4.2 0.18 0.15 5.85 5.85 0.45 2.74E06000010 Kingston upon Hull, City of 65.5 1.6 1.2 62.2 37.8 4.1 12.7 0.31 0.28 5.93 5.93 0.54 4.02E08000034 Kirklees 62.7 1.1 0.9 71.1 28.9 3.7 7.0 0.26 0.23 5.17 5.17 0.60 3.03E08000035 Leeds 51.6 1.1 0.9 68.6 31.4 3.5 10.3 0.13 0.11 2.59 2.59 0.28 1.75E06000012 North East Lincolnshire 56.8 1.1 0.9 70.1 29.9 3.6 7.1 0.14 0.12 2.85 2.85 0.32 1.64E06000013 North Lincolnshire 49.5 0.5 0.4 81.9 18.1 2.9 2.2 0.10 0.08 2.54 2.54 0.38 1.00E10000023 North Yorkshire 65.9 0.6 0.5 79.3 20.7 3.0 3.1 0.08 0.07 1.90 1.90 0.26 0.84E08000018 Rotherham 58.9 1.0 0.7 71.1 28.9 3.5 8.1 0.10 0.08 2.07 2.07 0.22 1.27E08000019 Sheffield 68.0 1.1 0.8 68.6 31.4 3.5 6.3 0.23 0.20 4.35 4.35 0.54 2.39E08000036 Wakefield 29.1 1.6 1.3 63.5 36.5 4.5 12.6 0.44 0.36 6.87 6.87 0.85 4.87E06000014 York 57.5 0.5 0.4 83.6 16.4 3.3 4.7 0.23 0.19 4.92 4.92 0.93 2.92
York
shire
and
the
Hum
ber
Sout
h W
est
Weighted Measures 95% Confidence Intervals
Wes
t Mid
land
s

33
Appendix 1. Dental Public Health Epidemiology Programme for England, Oral Health Survey of five-year-old children 2015, upper tier local authority (LA)
Part LA did not partake in survey
Region Upper Tier LA Code Upper Tier LA Name
% of sample
examined
Meand3mft
Meand3t
% d3mft = 0 % d3mft > 0 Mean d3mft
(% d3mft > 0)
% with incisor caries
Meand3mft
Meand3t
% d3mft = 0 % d3mft > 0 Mean d3mft (% d3mft >
0)
% with incisor caries
E12000004 East Midlands 64.1 0.9 0.7 72.5 27.5 3.3 5.6 0.04 0.04 0.93 0.93 0.11 0.49E12000006 East of England 65.5 0.7 0.5 79.7 20.2 3.2 4.1 0.03 0.02 0.63 0.63 0.09 0.31E12000007 London 61.1 1.0 0.8 72.6 27.2 3.7 8.2 0.03 0.03 0.63 0.63 0.08 0.38E12000001 North East 58.0 1.0 0.7 72.0 28.0 3.4 6.2 0.08 0.06 1.63 1.63 0.19 0.89E12000002 North West 65.1 1.3 1.0 66.6 33.4 3.8 8.5 0.05 0.04 0.92 0.92 0.10 0.56E12000008 South East 63.0 0.6 0.5 79.9 20.0 3.2 3.6 0.03 0.02 0.59 0.59 0.08 0.27E12000009 South West 72.5 0.7 0.5 78.5 21.5 3.1 4.0 0.04 0.03 0.84 0.84 0.11 0.41E12000005 West Midlands 62.5 0.7 0.6 76.6 23.4 3.1 4.2 0.03 0.02 0.65 0.65 0.08 0.32E12000003 Yorkshire and The Humber 57.4 1.0 0.8 71.5 28.5 3.6 7.0 0.04 0.03 0.81 0.81 0.10 0.48
Country E92000001 England 63.1 0.8 0.7 75.2 24.7 3.4 5.6 0.01 0.01 0.25 0.25 0.03 0.14
Weighted Measures 95% Confidence Intervals
Reg
ion

34
Appendix 2. Dental Public Health Epidemiology Programme for England, Oral Health Survey of five-year-old children 2015, lower tier local authority (LA)
LA did not partake in survey
Based on fewer than 30 volunteers
Region Lower Tier LA Code Lower Tier LA Name
% of sample examined
(* unavailable)
Meand3mft
Meand3t
% d3mft = 0 % d3mft > 0 Mean d3mft (% d3mft >
0)
% with incisor caries
Meand3mft
Meand3t
% d3mft = 0
% d3mft > 0
Mean d3mft
(% d3mft > 0)
% with incisor caries
Country E92000001 England 63.1 0.8 0.7 75.2 24.7 3.4 5.6 0.01 0.01 0.25 0.25 0.03 0.14
E07000032 Amber Valley 52.4 0.8 0.7 74.2 25.8 3.2 5.4 0.28 0.27 6.52 6.52 0.77 3.21E07000170 Ashfield 53.9 0.6 0.5 76.8 23.2 2.8 5.2 0.23 0.18 6.34 6.34 0.62 3.34E07000171 Bassetlaw 68.6 0.5 0.4 80.4 19.6 2.6 4.6 0.21 0.17 5.51 5.51 0.67 2.96E07000129 Blaby 74.0 1.1 0.9 67.1 32.9 3.2 6.6 0.27 0.24 5.36 5.36 0.63 2.87E07000033 Bolsover 63.3 1.0 0.6 66.4 33.6 3.0 6.6 0.33 0.23 7.35 7.35 0.67 3.90E07000136 Boston 73.8 1.3 1.0 67.7 32.3 3.9 6.9 0.30 0.26 5.84 5.84 0.61 3.25E07000172 Broxtowe 69.3 0.5 0.5 77.3 22.7 2.2 1.7 0.21 0.21 6.23 6.23 0.70 1.97E07000130 Charnwood 55.1 0.9 0.8 67.2 32.8 2.9 5.4 0.24 0.20 6.54 6.54 0.48 3.04E07000034 Chesterfield 57.1 1.0 0.7 76.2 23.8 4.0 5.3 0.31 0.27 6.01 6.01 0.87 3.19E07000150 Corby 46.0 1.0 0.9 67.0 33.0 3.1 4.7 0.29 0.27 7.85 7.85 0.48 3.62E07000151 Daventry 49.8 0.8 0.7 70.0 30.0 2.5 1.7 0.25 0.21 7.19 7.19 0.57 1.83E06000015 Derby 60.1 1.3 1.0 72.4 27.6 4.7 4.6 0.33 0.29 5.21 5.21 0.82 2.42E07000035 Derbyshire Dales 79.7 0.3 0.2 90.5 9.5 2.8 0.5 0.15 0.11 4.68 4.68 0.66 0.94E07000137 East Lindsey 77.1 0.6 0.5 79.8 20.2 3.0 3.7 0.23 0.21 5.46 5.46 0.75 2.59E07000152 East Northamptonshire 64.0 0.8 0.6 75.8 24.2 3.1 3.6 0.26 0.21 5.73 5.73 0.71 2.55E07000036 Erewash 56.7 0.6 0.5 81.1 18.9 3.4 4.1 0.28 0.24 5.73 5.73 1.04 2.98E07000173 Gedling 69.8 0.7 0.5 77.1 22.9 3.1 5.1 0.25 0.20 5.76 5.76 0.74 3.16E07000131 Harborough 79.6 0.5 0.4 77.3 22.7 2.2 3.7 0.15 0.13 5.34 5.34 0.42 2.25E07000037 High Peak 61.4 0.9 0.4 66.2 33.8 2.6 2.4 0.23 0.16 6.46 6.46 0.46 2.05E07000132 Hinckley and Bosworth 63.0 0.6 0.5 75.0 25.0 2.5 4.3 0.20 0.19 5.83 5.83 0.53 2.71E07000153 Kettering 69.4 0.9 0.8 78.0 22.0 4.0 4.6 0.34 0.32 5.33 5.33 1.14 3.02E06000016 Leicester 51.6 1.9 1.5 55.0 45.0 4.2 14.2 0.22 0.19 3.41 3.41 0.37 2.43E07000138 Lincoln 73.3 0.8 0.6 76.4 23.6 3.3 4.5 0.27 0.21 5.18 5.18 0.87 2.57E07000174 Mansfield 68.0 0.8 0.7 74.7 25.3 3.3 8.6 0.25 0.23 5.57 5.57 0.68 3.64E07000133 Melton 69.5 0.8 0.7 69.2 30.8 2.6 5.0 0.23 0.21 6.56 6.56 0.50 3.10E07000175 Newark and Sherwood 59.8 0.7 0.5 77.4 22.6 3.3 3.6 0.26 0.21 6.81 6.81 0.67 2.42E07000038 North East Derbyshire 58.8 0.4 0.3 87.6 12.4 3.3 0.4 0.20 0.19 4.89 4.89 1.01 0.87E07000139 North Kesteven 74.1 0.4 0.3 83.6 16.4 2.5 1.1 0.16 0.15 4.50 4.50 0.73 1.24E07000134 North West Leicestershire 69.9 0.6 0.5 78.7 21.3 2.6 4.0 0.20 0.17 5.48 5.48 0.68 2.54E07000154 Northampton 49.0 1.0 0.8 72.7 27.3 3.5 5.8 0.32 0.30 6.48 6.48 0.83 3.53E06000018 Nottingham 64.0 1.2 1.0 64.4 35.6 3.4 9.5 0.23 0.21 4.66 4.66 0.47 2.87E07000135 Oadby and Wigston 74.6 0.9 0.7 68.0 32.0 2.8 6.3 0.26 0.24 6.76 6.76 0.53 3.56E07000176 Rushcliffe 76.7 0.3 0.3 86.8 13.2 2.6 1.5 0.13 0.12 4.20 4.20 0.61 1.48E06000017 Rutland 81.9 0.7 0.7 71.2 28.8 2.6 6.3 0.23 0.21 6.08 6.08 0.58 3.28E07000039 South Derbyshire 55.9 0.4 0.2 84.8 15.2 2.5 1.5 0.16 0.12 4.89 4.89 0.70 1.63E07000140 South Holland 64.7 1.1 0.9 64.3 35.7 3.1 5.4 0.34 0.29 7.04 7.04 0.69 3.41E07000141 South Kesteven 70.6 0.5 0.4 78.5 21.5 2.3 4.0 0.16 0.13 5.53 5.53 0.44 2.57E07000155 South Northamptonshire 57.9 0.7 0.6 71.3 28.7 2.4 2.7 0.23 0.21 7.50 7.50 0.48 2.57E07000156 Wellingborough 61.8 0.6 0.4 76.1 23.9 2.6 3.5 0.22 0.17 6.37 6.37 0.62 2.88E07000142 West Lindsey 89.5 0.5 0.4 80.3 19.7 2.4 2.8 0.20 0.19 5.08 5.08 0.80 2.20
Number examined too small (<30) for robust estimate
Weighted Measures 95% Confidence Intervals
East
Mid
land
s

35
Appendix 2. Dental Public Health Epidemiology Programme for England, Oral Health Survey of five-year-old children 2015, lower tier local authority (LA)
LA did not partake in survey
Based on fewer than 30 volunteers
Region Lower Tier LA Code Lower Tier LA Name
% of sample examined
(* unavailable)
Meand3mft
Meand3t
% d3mft = 0 % d3mft > 0 Mean d3mft (% d3mft >
0)
% with incisor caries
Meand3mft
Meand3t
% d3mft = 0
% d3mft > 0
Mean d3mft
(% d3mft > 0)
% with incisor caries
E07000200 Babergh 67.4 0.4 0.3 83.8 16.2 2.3 3.0 0.17 0.15 4.99 4.99 0.61 2.47E07000066 Basildon 57.2 0.5 0.4 83.9 16.1 2.9 1.4 0.15 0.14 4.15 4.15 0.62 1.26E06000055 Bedford 80.6 0.9 0.7 73.1 26.9 3.5 6.1 0.14 0.12 2.89 2.89 0.35 1.58E07000067 Braintree 67.4 0.4 0.4 83.5 16.5 2.7 2.6 0.17 0.12 3.88 3.88 0.53 1.59E07000143 Breckland 75.8 0.8 0.6 82.4 17.6 4.4 2.6 0.27 0.22 4.78 4.78 0.91 2.05E07000068 Brentwood 62.2 0.5 0.4 84.4 15.6 3.4 3.0 0.22 0.20 4.74 4.74 1.06 2.21E07000144 Broadland 66.5 0.6 0.5 83.6 16.4 3.5 2.0 0.22 0.20 5.36 5.36 0.78 2.07E07000095 Broxbourne * 1.0 0.8 72.5 27.5 3.5 4.2 0.25 0.23 4.80 4.80 0.66 2.18E07000008 Cambridge 67.6 0.6 0.6 81.7 18.3 3.3 6.3 0.22 0.21 4.77 4.77 0.81 2.96E07000069 Castle Point 66.0 0.6 0.5 80.2 19.8 2.9 1.3 0.21 0.19 5.82 5.82 0.60 1.71E06000056 Central Bedfordshire 78.6 0.5 0.4 81.9 18.1 2.8 3.1 0.08 0.07 2.09 2.09 0.30 0.96E07000070 Chelmsford 58.1 0.5 0.4 85.5 14.5 3.4 4.7 0.15 0.13 3.42 3.42 0.68 2.08E07000071 Colchester 55.9 0.6 0.5 81.5 18.5 3.2 3.2 0.20 0.20 4.08 4.08 0.85 1.83E07000096 Dacorum * 0.5 0.4 82.4 17.6 2.8 2.7 0.13 0.11 3.40 3.40 0.46 1.44E07000009 East Cambridgeshire 67.7 0.3 0.2 89.9 10.1 2.5 1.9 0.13 0.11 3.54 3.54 0.94 1.64E07000242 East Hertfordshire * 0.4 0.4 83.9 16.1 2.8 1.3 0.12 0.11 3.20 3.20 0.49 1.00E07000072 Epping Forest 67.2 0.5 0.4 82.6 17.4 3.0 1.9 0.15 0.12 3.68 3.68 0.62 1.30E07000010 Fenland 61.2 0.9 0.7 76.6 23.4 4.0 6.1 0.27 0.23 5.02 5.02 0.81 2.96E07000201 Forest Heath 54.4 0.9 0.6 76.5 23.1 3.8 6.9 0.27 0.21 5.44 5.41 0.71 3.27E07000145 Great Yarmouth 26.0 0.6 0.5 77.8 21.7 2.9 1.7 0.20 0.18 5.27 5.22 0.50 1.66E07000073 Harlow 56.7 0.6 0.4 84.6 15.4 3.7 3.7 0.18 0.15 3.73 3.73 0.70 1.98E07000098 Hertsmere * 0.7 0.5 79.6 20.4 3.2 4.3 0.16 0.14 3.73 3.73 0.49 1.88E07000011 Huntingdonshire 71.3 0.6 0.4 81.5 18.5 3.3 4.3 0.21 0.15 4.54 4.54 0.80 2.41E07000202 Ipswich 59.0 0.8 0.7 74.9 25.1 3.2 7.2 0.23 0.20 5.25 5.25 0.55 3.35E07000146 King's Lynn and West Norfolk 57.4 0.8 0.6 81.0 19.0 4.2 3.2 0.25 0.21 4.87 4.87 0.74 2.33E06000032 Luton 77.7 1.7 1.2 57.4 42.6 4.0 14.7 0.29 0.24 5.10 5.10 0.49 3.64E07000074 Maldon 66.3 0.2 0.2 88.9 10.6 2.4 0.3 0.13 0.09 4.05 3.96 0.54 0.65E07000203 Mid Suffolk 70.0 0.4 0.3 88.4 11.6 3.0 0.9 0.16 0.15 4.20 4.20 0.83 1.25E07000099 North Hertfordshire * 0.6 0.4 79.0 21.0 2.6 2.0 0.14 0.12 3.95 3.95 0.45 1.32E07000147 North Norfolk 58.8 0.7 0.5 84.0 16.0 4.2 3.0 0.27 0.21 5.41 5.41 0.93 2.35E07000148 Norwich 56.2 0.9 0.9 73.3 26.7 3.5 6.2 0.26 0.25 6.04 6.04 0.63 3.68E06000031 Peterborough 72.9 1.1 0.9 70.0 30.0 3.8 8.1 0.27 0.24 5.40 5.40 0.57 3.38E07000075 Rochford 64.9 0.2 0.2 87.1 12.9 1.9 0.9 0.10 0.10 4.48 4.48 0.48 1.27E07000012 South Cambridgeshire 67.7 0.5 0.3 84.0 16.0 2.9 3.4 0.15 0.11 4.08 4.08 0.53 2.00E07000149 South Norfolk 66.1 0.3 0.2 91.4 8.6 3.6 0.4 0.17 0.15 3.96 3.96 1.17 0.81E06000033 Southend-on-Sea 56.1 0.6 0.5 82.3 17.4 3.3 3.3 0.18 0.16 4.21 4.19 0.66 1.99E07000240 St Albans * 0.3 0.3 85.5 14.5 2.4 2.1 0.10 0.08 3.23 3.23 0.45 1.32E07000204 St Edmundsbury 68.3 0.7 0.5 78.0 22.0 3.1 4.9 0.20 0.18 4.55 4.55 0.67 2.44E07000243 Stevenage * 0.8 0.6 73.3 26.7 2.9 4.2 0.17 0.14 4.26 4.26 0.41 1.96E07000205 Suffolk Coastal 73.4 0.6 0.5 80.2 19.8 3.0 5.2 0.22 0.20 5.24 5.24 0.83 3.00E07000076 Tendring 58.6 0.7 0.6 79.0 21.0 3.3 5.5 0.20 0.18 4.37 4.37 0.67 2.45E07000102 Three Rivers * 0.4 0.3 83.3 16.7 2.6 4.6 0.12 0.09 3.72 3.72 0.45 2.16E06000034 Thurrock 73.0 0.6 0.5 80.5 19.5 3.1 2.8 0.19 0.18 4.81 4.81 0.64 1.97
Number examined too small (<30) for robust estimate
Weighted Measures 95% Confidence Intervals
East
of E
ngla
nd

36
Appendix 2. Dental Public Health Epidemiology Programme for England, Oral Health Survey of five-year-old children 2015, lower tier local authority (LA)
LA did not partake in survey
Based on fewer than 30 volunteers
Region Lower Tier LA Code Lower Tier LA Name
% of sample examined
(* unavailable)
Meand3mft
Meand3t
% d3mft = 0 % d3mft > 0 Mean d3mft (% d3mft >
0)
% with incisor caries
Meand3mft
Meand3t
% d3mft = 0
% d3mft > 0
Mean d3mft
(% d3mft > 0)
% with incisor caries
E07000077 Uttlesford 57.8 0.3 0.2 89.5 10.5 2.6 2.4 0.12 0.10 3.20 3.20 0.77 1.65E07000103 Watford * 0.8 0.7 75.1 24.9 3.3 6.4 0.17 0.15 3.89 3.89 0.40 2.21E07000206 Waveney 24.9 0.8 0.7 75.6 24.4 3.3 4.9 0.22 0.21 5.60 5.60 0.59 2.49E07000241 Welwyn Hatfield * 0.6 0.5 79.1 20.9 2.9 4.5 0.16 0.14 3.99 3.99 0.53 2.05
E09000002 Barking and Dagenham 42.1 1.3 1.0 68.6 31.4 4.1 9.9 0.28 0.24 5.30 5.30 0.56 3.38E09000003 Barnet 70.0 1.2 1.0 68.0 31.6 3.8 7.9 0.26 0.21 5.04 5.03 0.57 2.97E09000004 Bexley 72.9 0.4 0.4 82.8 17.0 2.7 1.6 0.13 0.12 3.71 3.70 0.47 1.24E09000005 Brent 66.6 1.3 1.0 69.2 30.8 4.2 12.1 0.22 0.19 4.18 4.18 0.47 2.99E09000006 Bromley 86.5 0.4 0.4 84.0 16.0 2.7 5.1 0.15 0.14 4.19 4.19 0.64 2.54E09000007 Camden 59.7 0.9 0.5 76.5 23.5 3.6 6.0 0.20 0.15 4.10 4.10 0.55 2.22E09000008 Croydon 65.4 0.9 0.5 73.7 26.3 3.2 7.5 0.18 0.13 4.33 4.33 0.42 2.57E09000009 Ealing 51.6 1.8 1.5 60.3 39.0 4.6 13.4 0.23 0.20 3.70 3.69 0.37 2.56E09000010 Enfield 67.0 1.2 1.0 66.1 33.9 3.4 11.6 0.18 0.17 3.94 3.94 0.37 2.69E09000011 Greenwich 60.6 0.8 0.6 76.1 23.9 3.2 4.3 0.20 0.17 4.71 4.71 0.57 2.14E09000012 Hackney (including City of London) 50.5 1.0 0.7 73.4 27.0 3.6 9.3 0.12 0.10 2.41 2.41 0.31 1.57E09000013 Hammersmith and Fulham 64.2 0.7 0.5 73.7 26.3 2.7 8.5 0.20 0.17 6.32 6.32 0.44 4.07E09000014 Haringey 68.8 1.2 0.9 69.7 30.3 3.9 10.2 0.21 0.18 3.74 3.74 0.48 2.57E09000015 Harrow 64.3 1.4 1.0 65.5 34.2 4.1 14.3 0.25 0.21 4.71 4.70 0.49 3.51E09000016 Havering 49.4 0.7 0.6 80.0 20.0 3.3 3.7 0.24 0.22 5.06 5.06 0.90 2.34E09000017 Hillingdon 69.9 1.5 1.2 62.2 37.8 3.9 16.7 0.26 0.24 4.75 4.75 0.50 3.72E09000018 Hounslow 68.6 1.1 0.8 69.4 30.5 3.6 5.2 0.14 0.12 3.02 3.02 0.31 1.46E09000019 Islington 57.5 0.9 0.5 75.6 24.4 3.5 6.7 0.16 0.11 3.45 3.45 0.45 2.01E09000020 Kensington and Chelsea 53.1 1.1 0.8 66.6 33.4 3.3 12.2 0.28 0.25 6.11 6.11 0.60 4.34E09000021 Kingston upon Thames 76.0 0.8 0.6 77.1 22.9 3.4 3.2 0.20 0.17 4.41 4.41 0.61 1.85E09000022 Lambeth 47.5 0.8 0.6 77.9 22.1 3.7 5.7 0.16 0.13 3.15 3.15 0.47 1.77E09000023 Lewisham 63.2 0.6 0.4 76.7 23.3 2.4 4.6 0.16 0.10 4.33 4.33 0.31 2.30E09000024 Merton 70.3 0.9 0.6 73.9 26.1 3.5 6.7 0.22 0.17 4.26 4.26 0.63 2.40E09000025 Newham 63.7 1.2 1.0 70.7 28.3 4.5 8.7 0.09 0.08 1.59 1.57 0.20 0.98E09000026 Redbridge 53.3 1.0 0.7 76.3 23.7 4.1 9.1 0.21 0.18 4.19 4.19 0.58 2.77E09000027 Richmond upon Thames 69.3 0.5 0.3 81.0 19.0 2.5 1.9 0.13 0.10 3.91 3.91 0.47 1.34E09000028 Southwark 45.8 0.6 0.4 81.2 18.8 3.3 4.5 0.15 0.10 3.43 3.43 0.50 1.84E09000029 Sutton 69.0 0.6 0.4 81.0 19.0 3.0 5.1 0.12 0.11 2.94 2.94 0.45 1.72E09000030 Tower Hamlets 59.9 1.3 1.0 64.5 35.5 3.6 12.3 0.11 0.09 2.29 2.29 0.21 1.56E09000031 Waltham Forest 61.3 1.1 0.8 70.2 29.8 3.5 8.5 0.22 0.19 4.51 4.51 0.50 2.76E09000032 Wandsworth 64.3 0.8 0.6 76.8 23.2 3.6 7.9 0.19 0.16 4.04 4.04 0.55 2.55E09000033 Westminster 65.4 1.2 0.8 64.9 35.1 3.3 13.5 0.15 0.13 3.25 3.25 0.31 2.34
E06000047 County Durham 67.3 1.1 0.9 64.9 35.1 3.0 8.4 0.25 0.22 6.13 6.13 0.46 3.65E06000005 Darlington 59.6 1.2 0.9 64.6 35.4 3.4 9.5 0.30 0.26 5.99 5.99 0.64 3.66E08000037 Gateshead 61.3 0.7 0.5 76.2 23.8 2.7 3.3 0.21 0.17 6.02 6.02 0.59 2.38E06000001 Hartlepool 51.8 0.4 0.3 84.6 15.4 2.6 3.1 0.16 0.11 4.76 4.76 0.68 2.32E06000002 Middlesbrough 50.9 1.7 1.1 61.2 38.8 4.3 10.0 0.34 0.28 5.55 5.55 0.61 3.54
Number examined too small (<30) for robust estimate
Weighted Measures 95% Confidence Intervals
Lond
onN
orth
Eas
tEa
st o
f En
glan
d
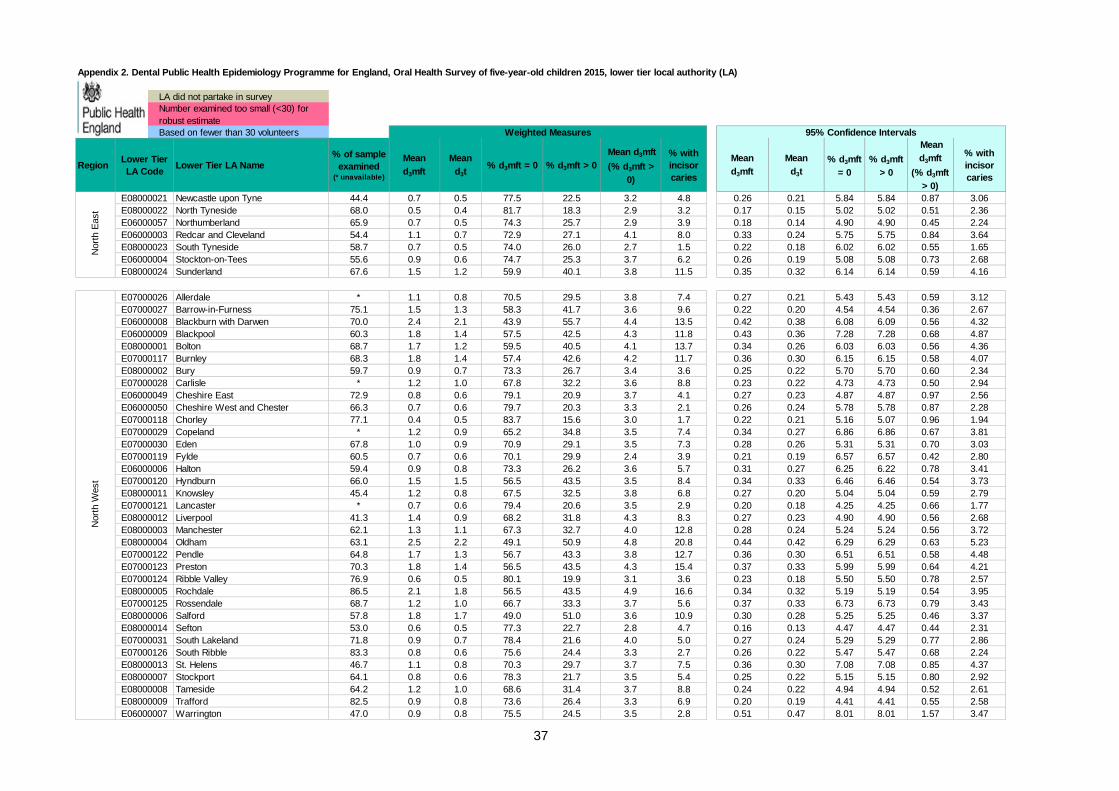
37
Appendix 2. Dental Public Health Epidemiology Programme for England, Oral Health Survey of five-year-old children 2015, lower tier local authority (LA)
LA did not partake in survey
Based on fewer than 30 volunteers
Region Lower Tier LA Code Lower Tier LA Name
% of sample examined
(* unavailable)
Meand3mft
Meand3t
% d3mft = 0 % d3mft > 0 Mean d3mft (% d3mft >
0)
% with incisor caries
Meand3mft
Meand3t
% d3mft = 0
% d3mft > 0
Mean d3mft
(% d3mft > 0)
% with incisor caries
E08000021 Newcastle upon Tyne 44.4 0.7 0.5 77.5 22.5 3.2 4.8 0.26 0.21 5.84 5.84 0.87 3.06E08000022 North Tyneside 68.0 0.5 0.4 81.7 18.3 2.9 3.2 0.17 0.15 5.02 5.02 0.51 2.36E06000057 Northumberland 65.9 0.7 0.5 74.3 25.7 2.9 3.9 0.18 0.14 4.90 4.90 0.45 2.24E06000003 Redcar and Cleveland 54.4 1.1 0.7 72.9 27.1 4.1 8.0 0.33 0.24 5.75 5.75 0.84 3.64E08000023 South Tyneside 58.7 0.7 0.5 74.0 26.0 2.7 1.5 0.22 0.18 6.02 6.02 0.55 1.65E06000004 Stockton-on-Tees 55.6 0.9 0.6 74.7 25.3 3.7 6.2 0.26 0.19 5.08 5.08 0.73 2.68E08000024 Sunderland 67.6 1.5 1.2 59.9 40.1 3.8 11.5 0.35 0.32 6.14 6.14 0.59 4.16
E07000026 Allerdale * 1.1 0.8 70.5 29.5 3.8 7.4 0.27 0.21 5.43 5.43 0.59 3.12E07000027 Barrow-in-Furness 75.1 1.5 1.3 58.3 41.7 3.6 9.6 0.22 0.20 4.54 4.54 0.36 2.67E06000008 Blackburn with Darwen 70.0 2.4 2.1 43.9 55.7 4.4 13.5 0.42 0.38 6.08 6.09 0.56 4.32E06000009 Blackpool 60.3 1.8 1.4 57.5 42.5 4.3 11.8 0.43 0.36 7.28 7.28 0.68 4.87E08000001 Bolton 68.7 1.7 1.2 59.5 40.5 4.1 13.7 0.34 0.26 6.03 6.03 0.56 4.36E07000117 Burnley 68.3 1.8 1.4 57.4 42.6 4.2 11.7 0.36 0.30 6.15 6.15 0.58 4.07E08000002 Bury 59.7 0.9 0.7 73.3 26.7 3.4 3.6 0.25 0.22 5.70 5.70 0.60 2.34E07000028 Carlisle * 1.2 1.0 67.8 32.2 3.6 8.8 0.23 0.22 4.73 4.73 0.50 2.94E06000049 Cheshire East 72.9 0.8 0.6 79.1 20.9 3.7 4.1 0.27 0.23 4.87 4.87 0.97 2.56E06000050 Cheshire West and Chester 66.3 0.7 0.6 79.7 20.3 3.3 2.1 0.26 0.24 5.78 5.78 0.87 2.28E07000118 Chorley 77.1 0.4 0.5 83.7 15.6 3.0 1.7 0.22 0.21 5.16 5.07 0.96 1.94E07000029 Copeland * 1.2 0.9 65.2 34.8 3.5 7.4 0.34 0.27 6.86 6.86 0.67 3.81E07000030 Eden 67.8 1.0 0.9 70.9 29.1 3.5 7.3 0.28 0.26 5.31 5.31 0.70 3.03E07000119 Fylde 60.5 0.7 0.6 70.1 29.9 2.4 3.9 0.21 0.19 6.57 6.57 0.42 2.80E06000006 Halton 59.4 0.9 0.8 73.3 26.2 3.6 5.7 0.31 0.27 6.25 6.22 0.78 3.41E07000120 Hyndburn 66.0 1.5 1.5 56.5 43.5 3.5 8.4 0.34 0.33 6.46 6.46 0.54 3.73E08000011 Knowsley 45.4 1.2 0.8 67.5 32.5 3.8 6.8 0.27 0.20 5.04 5.04 0.59 2.79E07000121 Lancaster * 0.7 0.6 79.4 20.6 3.5 2.9 0.20 0.18 4.25 4.25 0.66 1.77E08000012 Liverpool 41.3 1.4 0.9 68.2 31.8 4.3 8.3 0.27 0.23 4.90 4.90 0.56 2.68E08000003 Manchester 62.1 1.3 1.1 67.3 32.7 4.0 12.8 0.28 0.24 5.24 5.24 0.56 3.72E08000004 Oldham 63.1 2.5 2.2 49.1 50.9 4.8 20.8 0.44 0.42 6.29 6.29 0.63 5.23E07000122 Pendle 64.8 1.7 1.3 56.7 43.3 3.8 12.7 0.36 0.30 6.51 6.51 0.58 4.48E07000123 Preston 70.3 1.8 1.4 56.5 43.5 4.3 15.4 0.37 0.33 5.99 5.99 0.64 4.21E07000124 Ribble Valley 76.9 0.6 0.5 80.1 19.9 3.1 3.6 0.23 0.18 5.50 5.50 0.78 2.57E08000005 Rochdale 86.5 2.1 1.8 56.5 43.5 4.9 16.6 0.34 0.32 5.19 5.19 0.54 3.95E07000125 Rossendale 68.7 1.2 1.0 66.7 33.3 3.7 5.6 0.37 0.33 6.73 6.73 0.79 3.43E08000006 Salford 57.8 1.8 1.7 49.0 51.0 3.6 10.9 0.30 0.28 5.25 5.25 0.46 3.37E08000014 Sefton 53.0 0.6 0.5 77.3 22.7 2.8 4.7 0.16 0.13 4.47 4.47 0.44 2.31E07000031 South Lakeland 71.8 0.9 0.7 78.4 21.6 4.0 5.0 0.27 0.24 5.29 5.29 0.77 2.86E07000126 South Ribble 83.3 0.8 0.6 75.6 24.4 3.3 2.7 0.26 0.22 5.47 5.47 0.68 2.24E08000013 St. Helens 46.7 1.1 0.8 70.3 29.7 3.7 7.5 0.36 0.30 7.08 7.08 0.85 4.37E08000007 Stockport 64.1 0.8 0.6 78.3 21.7 3.5 5.4 0.25 0.22 5.15 5.15 0.80 2.92E08000008 Tameside 64.2 1.2 1.0 68.6 31.4 3.7 8.8 0.24 0.22 4.94 4.94 0.52 2.61E08000009 Trafford 82.5 0.9 0.8 73.6 26.4 3.3 6.9 0.20 0.19 4.41 4.41 0.55 2.58E06000007 Warrington 47.0 0.9 0.8 75.5 24.5 3.5 2.8 0.51 0.47 8.01 8.01 1.57 3.47
Nor
th E
ast
Nor
th W
est
Number examined too small (<30) for robust estimate
Weighted Measures 95% Confidence Intervals

38
Appendix 2. Dental Public Health Epidemiology Programme for England, Oral Health Survey of five-year-old children 2015, lower tier local authority (LA)
LA did not partake in survey
Based on fewer than 30 volunteers
Region Lower Tier LA Code Lower Tier LA Name
% of sample examined
(* unavailable)
Meand3mft
Meand3t
% d3mft = 0 % d3mft > 0 Mean d3mft (% d3mft >
0)
% with incisor caries
Meand3mft
Meand3t
% d3mft = 0
% d3mft > 0
Mean d3mft
(% d3mft > 0)
% with incisor caries
E07000127 West Lancashire 55.0 1.0 0.8 70.5 28.8 3.5 5.3 0.31 0.25 6.77 6.77 0.58 3.45E08000010 Wigan 57.9 1.1 0.9 67.5 32.5 3.5 5.5 0.27 0.22 5.64 5.64 0.56 2.81E08000015 Wirral 57.1 1.2 0.8 67.1 32.9 3.5 7.2 0.30 0.25 6.55 6.55 0.61 3.51E07000128 Wyre 53.2 1.5 1.2 65.6 34.4 4.3 8.6 0.42 0.36 7.06 7.06 0.88 4.43
E07000223 AdurE07000224 Arun *E07000105 Ashford 64.9 0.4 0.3 84.5 15.1 2.5 1.4 0.15 0.14 4.84 4.81 0.62 1.61E07000004 Aylesbury Vale 74.6 0.7 0.6 74.6 25.1 3.0 2.9 0.25 0.23 5.20 5.19 0.74 2.32E07000084 Basingstoke and Deane 47.2 0.5 0.4 83.1 16.9 2.8 2.5 0.22 0.20 5.76 5.76 0.71 2.39E06000036 Bracknell Forest 63.5 0.8 0.6 77.9 22.1 3.5 5.6 0.24 0.23 4.91 4.91 0.80 2.76E06000043 Brighton and Hove 54.1 0.4 0.2 82.4 16.2 2.3 1.3 0.17 0.10 5.83 5.22 0.67 1.51E07000106 Canterbury 69.1 0.6 0.4 84.9 15.1 4.2 0.7 0.26 0.21 4.73 4.73 0.88 1.02E07000177 Cherwell 67.8 0.7 0.6 78.2 21.8 3.1 5.5 0.21 0.19 5.00 5.00 0.64 2.86E07000225 Chichester * 0.5 0.4 76.7 23.3 2.1 8.5 0.43 0.37 14.35 14.35 0.45 10.14E07000005 Chiltern 76.1 0.4 0.4 86.9 13.1 3.4 3.1 0.19 0.15 4.08 4.08 1.02 2.07E07000226 Crawley * 0.7 0.9 72.0 25.3 3.6 7.8 0.78 0.61 11.37 10.67 1.84 7.72E07000107 Dartford 65.3 0.5 0.4 81.5 18.5 2.6 1.8 0.15 0.14 4.80 4.80 0.49 1.58E07000108 Dover 62.3 0.4 0.3 87.5 12.5 3.6 0.9 0.19 0.16 4.71 4.71 0.76 1.09E07000085 East Hampshire 49.2 0.3 0.2 89.0 11.0 2.7 0.7 0.18 0.13 5.01 5.01 1.08 1.27E07000061 Eastbourne 47.6 0.5 0.5 77.2 22.8 2.3 2.3 0.28 0.24 9.50 9.50 0.72 3.03E07000086 Eastleigh 49.5 0.3 0.2 87.3 12.7 2.0 0.7 0.10 0.08 4.01 4.01 0.45 0.91E07000207 Elmbridge 55.7 0.5 0.4 83.7 16.3 3.1 2.1 0.25 0.22 5.84 5.84 1.04 2.30E07000208 Epsom and Ewell 41.5 0.6 0.4 79.6 20.4 2.9 1.4 0.29 0.22 6.70 6.70 1.07 1.89E07000087 Fareham 60.3 0.3 0.3 88.3 11.7 2.7 1.1 0.16 0.15 4.54 4.54 0.87 1.49E07000088 Gosport 46.8 0.6 0.5 82.4 17.6 3.2 5.0 0.21 0.17 4.79 4.79 0.81 2.72E07000109 Gravesham 67.8 0.6 0.5 78.5 20.3 3.1 3.4 0.21 0.19 4.85 4.74 0.67 2.20E07000209 Guildford 54.4 0.7 0.4 80.3 19.7 3.3 5.2 0.31 0.27 6.08 6.08 1.19 3.50E07000089 Hart 56.2 0.5 0.4 86.2 13.8 3.5 2.2 0.21 0.19 4.32 4.32 0.92 1.95E07000062 Hastings 59.9 0.8 0.6 77.9 22.1 3.5 7.8 0.37 0.30 8.17 8.17 1.07 5.29E07000090 Havant 51.2 0.6 0.3 82.6 17.4 3.3 2.5 0.20 0.14 4.70 4.70 0.78 1.99E07000227 Horsham * 0.4 0.4 86.7 13.3 3.1 2.1 0.36 0.36 6.84 6.84 2.29 2.81E06000046 Isle of Wight 75.4 0.8 0.6 73.6 26.4 3.1 3.1 0.17 0.14 3.88 3.88 0.45 1.52E07000063 Lewes 70.0 0.3 0.3 84.9 15.1 1.9 0.0 0.22 0.22 9.47 9.47 0.72 0.00E07000110 Maidstone 72.3 0.7 0.6 78.9 20.5 3.5 3.0 0.22 0.20 4.65 4.61 0.75 1.96E06000035 Medway 68.5 0.7 0.6 81.3 18.4 3.7 3.1 0.22 0.19 4.43 4.38 0.66 1.97E07000228 Mid Sussex * 0.3 0.2 86.9 12.8 2.4 2.2 0.13 0.12 4.31 4.31 0.61 1.86E06000042 Milton Keynes 61.1 0.6 0.5 78.3 21.5 3.0 4.7 0.07 0.06 1.69 1.68 0.22 0.88E07000210 Mole Valley 56.0 0.5 0.4 80.5 19.5 2.4 1.6 0.16 0.15 5.68 5.68 0.58 1.74E07000091 New Forest 48.3 0.6 0.5 81.3 18.7 3.3 2.8 0.24 0.20 5.07 5.07 0.84 2.12E07000178 Oxford 65.6 1.2 1.0 67.2 32.8 3.6 9.3 0.27 0.24 5.64 5.64 0.52 3.54E06000044 Portsmouth 78.3 0.6 0.3 81.9 18.1 3.2 2.3 0.10 0.08 2.54 2.54 0.37 1.02E06000038 Reading 67.1 0.9 0.7 71.9 28.1 3.4 7.5 0.23 0.18 5.03 5.03 0.55 3.01
Nor
th
Wes
t Number examined too small (<30) for robust estimate
Weighted Measures 95% Confidence Intervals
Sout
h Ea
st

39
Appendix 2. Dental Public Health Epidemiology Programme for England, Oral Health Survey of five-year-old children 2015, lower tier local authority (LA)
LA did not partake in survey
Based on fewer than 30 volunteers
Region Lower Tier LA Code Lower Tier LA Name
% of sample examined
(* unavailable)
Meand3mft
Meand3t
% d3mft = 0 % d3mft > 0 Mean d3mft (% d3mft >
0)
% with incisor caries
Meand3mft
Meand3t
% d3mft = 0
% d3mft > 0
Mean d3mft
(% d3mft > 0)
% with incisor caries
E07000211 Reigate and Banstead 50.6 0.3 0.2 87.7 12.3 2.3 0.8 0.16 0.14 6.50 6.50 0.77 1.51E07000064 Rother 59.6 0.7 0.4 69.7 30.3 2.2 3.1 0.27 0.16 9.07 9.07 0.60 3.43E07000212 Runnymede 55.9 0.6 0.4 77.6 22.4 2.6 1.5 0.26 0.20 7.56 7.56 0.79 1.98E07000092 Rushmoor 50.0 1.0 0.8 75.8 24.2 4.2 7.6 0.34 0.30 6.35 6.35 0.89 3.82E07000111 Sevenoaks 78.9 0.2 0.2 86.6 13.4 1.8 0.7 0.10 0.09 4.10 4.10 0.49 0.93E07000112 Shepway 73.6 0.6 0.4 83.8 15.9 4.0 2.6 0.26 0.23 5.17 5.14 1.03 1.99E06000039 Slough 65.5 1.8 1.5 58.7 41.3 4.3 11.2 0.32 0.29 5.57 5.57 0.51 3.55E07000006 South Bucks 71.1 0.6 0.4 76.4 23.6 2.4 2.4 0.16 0.12 5.19 5.19 0.41 1.92E07000179 South Oxfordshire 77.4 0.6 0.3 82.8 17.2 3.4 1.8 0.20 0.13 4.29 4.29 0.73 1.59E06000045 Southampton 81.5 1.3 0.9 66.3 33.7 3.7 7.2 0.13 0.11 2.69 2.69 0.27 1.49E07000213 Spelthorne 46.4 0.4 0.4 82.7 17.3 2.4 0.6 0.21 0.19 6.04 6.04 0.83 1.25E07000214 Surrey Heath 61.9 0.4 0.3 86.5 13.5 2.9 4.6 0.20 0.20 5.82 5.82 0.87 3.32E07000113 Swale 69.0 1.0 0.7 81.6 18.4 5.3 2.6 0.39 0.36 5.64 5.64 0.99 2.46E07000215 TandridgeE07000093 Test Valley 49.5 0.2 0.1 90.6 9.4 1.9 0.5 0.11 0.05 4.15 4.15 0.88 1.03E07000114 Thanet 69.3 0.6 0.5 82.7 16.7 3.6 1.6 0.23 0.21 4.74 4.65 0.87 1.74E07000115 Tonbridge and Malling 68.5 0.4 0.4 86.9 12.7 3.3 1.5 0.18 0.17 3.97 3.94 0.90 1.48E07000116 Tunbridge Wells 70.5 0.4 0.3 82.1 17.9 2.2 1.9 0.12 0.12 4.49 4.49 0.43 1.64E07000180 Vale of White Horse 67.8 0.8 0.6 79.4 20.6 3.7 5.3 0.21 0.19 4.72 4.72 0.58 2.61E07000216 Waverley 40.9 0.1 0.1 91.8 8.2 1.2 0.8 0.06 0.05 5.11 5.11 0.25 1.60E07000065 Wealden 59.2 0.3 0.2 87.5 12.5 2.1 1.8 0.18 0.17 5.75 5.75 1.11 2.49E06000037 West Berkshire 63.2 0.7 0.6 76.9 23.1 3.2 3.3 0.29 0.24 6.03 6.03 0.86 3.10E07000181 West Oxfordshire 70.9 0.5 0.4 81.2 18.8 2.8 1.8 0.16 0.13 4.49 4.49 0.44 1.54E07000094 Winchester 52.8 0.2 0.1 89.3 10.7 2.2 2.0 0.15 0.12 4.75 4.75 1.05 2.29E06000040 Windsor and Maidenhead 67.5 0.6 0.5 81.5 18.5 3.4 5.5 0.21 0.20 4.66 4.66 0.75 2.80E07000217 Woking 53.4 0.9 0.7 75.3 24.7 3.6 7.0 0.33 0.30 6.71 6.71 0.95 3.86E06000041 Wokingham 65.3 0.6 0.4 85.2 14.8 3.8 4.6 0.25 0.20 4.45 4.45 1.21 2.64E07000229 Worthing * 0.3 0.2 84.1 15.9 1.9 3.8 0.16 0.15 6.52 6.52 0.61 3.62E07000007 Wycombe 73.7 0.9 0.7 71.1 28.9 3.0 4.4 0.22 0.18 5.04 5.04 0.55 2.32
E06000022 Bath and North East Somerset 65.7 0.4 0.3 85.0 15.0 2.5 3.5 0.16 0.12 4.47 4.47 0.71 2.25E06000028 Bournemouth 81.0 0.9 0.6 71.8 28.2 3.3 4.7 0.23 0.18 5.33 5.33 0.56 2.45E06000023 Bristol, City of 59.9 1.1 0.7 71.1 28.9 3.9 6.1 0.28 0.23 5.39 5.39 0.67 2.97E07000078 Cheltenham 76.4 0.5 0.4 81.9 18.1 2.8 3.7 0.18 0.14 4.98 4.98 0.64 2.55E07000048 Christchurch 74.4 0.9 0.5 73.5 26.5 3.3 7.5 0.48 0.32 10.39 10.39 0.87 6.25E06000052 Cornwall (including Isles of Scilly) 70.7 0.7 0.5 78.3 21.7 3.2 5.1 0.13 0.11 2.95 2.95 0.38 1.61E07000079 Cotswold 79.7 0.4 0.3 86.3 13.7 3.2 3.2 0.24 0.19 4.54 4.54 1.31 2.34E07000040 East Devon 83.0 0.3 0.3 84.8 15.2 2.3 3.5 0.12 0.11 4.31 4.31 0.40 2.23E07000049 East Dorset 69.1 0.4 0.3 79.5 20.5 2.2 0.4 0.14 0.12 5.82 5.82 0.32 0.80E07000041 Exeter 77.5 0.7 0.5 74.7 25.3 2.9 6.2 0.19 0.16 4.56 4.56 0.51 2.57E07000080 Forest of Dean 67.6 1.0 0.8 71.6 28.4 3.5 5.4 0.25 0.22 5.29 5.29 0.57 2.66E07000081 Gloucester 59.2 0.8 0.6 80.3 19.7 4.0 5.2 0.27 0.25 5.26 5.26 0.91 3.13E07000187 Mendip 65.5 0.5 0.4 80.3 19.7 2.7 1.9 0.17 0.14 4.72 4.72 0.58 1.63
Sout
h Ea
st Number examined too small (<30) for robust estimate
Weighted Measures 95% Confidence Intervals
Sout
h W
est

40
Appendix 2. Dental Public Health Epidemiology Programme for England, Oral Health Survey of five-year-old children 2015, lower tier local authority (LA)
LA did not partake in survey
Based on fewer than 30 volunteers
Region Lower Tier LA Code Lower Tier LA Name
% of sample examined
(* unavailable)
Meand3mft
Meand3t
% d3mft = 0 % d3mft > 0 Mean d3mft (% d3mft >
0)
% with incisor caries
Meand3mft
Meand3t
% d3mft = 0
% d3mft > 0
Mean d3mft
(% d3mft > 0)
% with incisor caries
E07000042 Mid Devon 85.8 0.6 0.3 80.6 19.4 3.0 2.5 0.17 0.13 4.52 4.52 0.57 1.81E07000043 North Devon 81.3 0.7 0.5 77.4 22.6 3.1 3.0 0.20 0.16 4.92 4.92 0.57 2.00E07000050 North Dorset 76.5 0.6 0.5 76.4 23.6 2.6 2.3 0.27 0.24 8.24 8.24 0.69 2.54E06000024 North Somerset 62.7 0.6 0.4 81.9 18.1 3.1 2.0 0.19 0.17 4.74 4.74 0.66 1.55E06000026 Plymouth 48.3 0.4 0.4 84.7 15.3 2.8 1.8 0.14 0.13 3.74 3.74 0.57 1.36E06000029 Poole 89.4 0.7 0.5 78.7 21.3 3.5 4.9 0.18 0.15 3.82 3.82 0.58 2.11E07000051 Purbeck 94.5 0.8 0.7 74.5 25.5 3.3 6.9 0.38 0.32 8.14 8.14 0.94 4.83E07000188 Sedgemoor 73.1 0.9 0.7 72.9 27.1 3.3 4.2 0.27 0.20 5.61 5.61 0.73 2.62E06000025 South Gloucestershire 73.5 0.4 0.3 85.9 14.1 2.9 0.7 0.15 0.11 4.18 4.18 0.69 0.95E07000044 South Hams 74.6 0.5 0.3 81.6 18.4 2.6 3.9 0.15 0.11 4.78 4.78 0.44 2.39E07000189 South Somerset 64.1 0.9 0.7 75.0 25.0 3.7 7.7 0.30 0.24 5.72 5.72 0.85 3.58E07000082 Stroud 80.5 0.3 0.2 86.6 13.4 2.4 2.5 0.14 0.10 4.42 4.42 0.70 2.00E06000030 Swindon 67.8 0.8 0.7 72.1 27.9 2.8 5.7 0.22 0.20 5.64 5.64 0.55 2.87E07000190 Taunton Deane 67.6 0.6 0.5 80.2 19.8 2.8 4.0 0.21 0.19 5.07 5.07 0.79 2.59E07000045 Teignbridge 75.0 0.6 0.4 80.6 19.4 2.9 4.1 0.18 0.15 4.70 4.70 0.63 2.30E07000083 Tewkesbury 71.8 0.9 0.7 77.0 23.0 3.9 5.1 0.25 0.23 5.12 5.12 0.67 2.62E06000027 Torbay 74.5 0.8 0.6 73.2 26.8 3.1 4.3 0.22 0.17 5.22 5.22 0.57 2.24E07000046 Torridge 83.5 0.6 0.5 79.2 20.8 3.0 4.3 0.18 0.16 4.73 4.73 0.54 2.36E07000047 West Devon 81.4 0.5 0.4 84.6 15.4 3.0 4.2 0.19 0.16 4.37 4.37 0.90 2.42E07000052 West Dorset 74.8 0.4 0.3 79.2 20.8 1.8 1.9 0.16 0.14 7.53 7.53 0.38 2.63E07000191 West Somerset 64.2 0.7 0.5 75.7 24.3 2.9 2.5 0.24 0.18 6.50 6.50 0.63 2.41E07000053 Weymouth and Portland 73.6 0.7 0.6 70.7 29.3 2.5 5.3 0.27 0.23 9.32 9.32 0.47 5.11E06000054 Wiltshire 66.9 0.4 0.3 78.2 21.8 2.0 3.3 0.17 0.13 6.08 6.08 0.58 2.70
E08000025 Birmingham 53.9 0.8 0.5 71.3 28.7 2.9 3.7 0.21 0.14 4.90 4.90 0.52 2.13E07000234 Bromsgrove 64.3 0.3 0.2 87.1 12.9 2.3 1.3 0.08 0.06 2.72 2.72 0.41 0.88E07000192 Cannock Chase 60.9 0.2 0.2 90.2 9.8 2.5 0.0 0.15 0.11 4.36 4.36 1.08 0.00E08000026 Coventry 79.7 1.0 0.9 71.6 28.4 3.7 11.1 0.28 0.26 5.31 5.31 0.71 3.77E08000027 Dudley 59.1 0.5 0.4 81.5 18.5 2.5 2.3 0.06 0.06 1.88 1.88 0.24 0.74E07000193 East Staffordshire 61.0 0.5 0.4 87.0 13.0 3.6 1.1 0.21 0.18 4.47 4.47 0.91 1.45E06000019 Herefordshire, County of 79.1 1.4 1.2 58.7 41.3 3.5 6.5 0.27 0.24 5.66 5.66 0.44 2.74E07000194 Lichfield 55.0 0.3 0.3 83.3 16.7 2.1 1.2 0.13 0.11 5.27 5.27 0.41 1.70E07000235 Malvern Hills 60.0 0.5 0.4 82.3 17.7 3.0 2.5 0.17 0.16 3.80 3.80 0.70 1.55E07000195 Newcastle-under-Lyme 78.9 0.8 0.7 74.5 25.5 3.0 1.3 0.24 0.21 5.55 5.55 0.66 1.41E07000218 North Warwickshire 67.0 0.6 0.5 78.5 21.5 2.8 2.5 0.23 0.19 5.76 5.76 0.73 2.19E07000219 Nuneaton and Bedworth 70.4 0.8 0.6 74.5 25.5 3.2 6.7 0.23 0.19 5.16 5.16 0.64 2.80E07000236 Redditch 55.0 0.6 0.4 81.1 18.9 3.1 3.4 0.13 0.11 3.26 3.26 0.45 1.52E07000220 Rugby 73.7 1.4 1.2 59.9 40.1 3.4 5.5 0.34 0.29 6.33 6.33 0.64 2.99E08000028 Sandwell 62.4 0.7 0.5 76.6 23.4 2.9 4.1 0.06 0.05 1.64 1.64 0.18 0.77E06000051 Shropshire 54.4 0.8 0.7 78.5 21.5 3.7 5.7 0.34 0.30 6.42 6.42 1.07 4.03E08000029 Solihull 71.6 0.6 0.5 82.9 17.1 3.3 2.5 0.22 0.21 4.70 4.70 0.88 1.86E07000196 South Staffordshire 73.1 0.5 0.4 83.4 16.6 2.7 1.3 0.17 0.16 4.65 4.65 0.64 1.40E07000197 Stafford 66.2 0.5 0.4 77.8 22.2 2.3 1.4 0.18 0.17 6.49 6.49 0.46 1.60
Sout
h W
est
Number examined too small (<30) for robust estimate
Weighted Measures 95% Confidence Intervals
Wes
t Mid
land
s

41
Appendix 2. Dental Public Health Epidemiology Programme for England, Oral Health Survey of five-year-old children 2015, lower tier local authority (LA)
LA did not partake in survey
Based on fewer than 30 volunteers
Region Lower Tier LA Code Lower Tier LA Name
% of sample examined
(* unavailable)
Meand3mft
Meand3t
% d3mft = 0 % d3mft > 0 Mean d3mft (% d3mft >
0)
% with incisor caries
Meand3mft
Meand3t
% d3mft = 0
% d3mft > 0
Mean d3mft
(% d3mft > 0)
% with incisor caries
E07000198 Staffordshire Moorlands 51.9 0.6 0.6 79.0 21.0 3.1 1.2 0.19 0.18 5.10 5.10 0.55 1.33E06000021 Stoke-on-Trent 69.9 1.2 1.0 70.7 29.3 4.1 5.2 0.29 0.25 5.37 5.37 0.63 2.66E07000221 Stratford-on-Avon 74.7 0.6 0.5 80.4 19.6 3.2 2.6 0.23 0.20 5.09 5.09 0.81 2.05E07000199 Tamworth 59.1 0.4 0.3 85.9 14.1 2.6 0.0 0.21 0.15 5.34 5.34 1.09 0.00E06000020 Telford and Wrekin 47.8 0.9 0.7 77.0 23.0 3.8 8.3 0.37 0.31 6.55 6.55 1.07 4.57E08000030 Walsall 64.3 0.7 0.5 74.8 25.2 2.7 4.1 0.07 0.06 2.06 2.06 0.20 0.94E07000222 Warwick 78.5 0.8 0.7 72.8 27.2 3.0 3.0 0.25 0.21 5.41 5.41 0.69 2.22E08000031 Wolverhampton 64.4 1.0 0.9 72.2 27.8 3.6 7.0 0.09 0.09 1.90 1.90 0.23 1.09E07000237 Worcester 59.1 0.9 0.7 72.7 27.3 3.3 6.5 0.15 0.13 3.21 3.21 0.39 1.82E07000238 Wychavon 65.6 0.7 0.5 78.1 21.9 3.1 3.8 0.12 0.10 2.96 2.96 0.37 1.38E07000239 Wyre Forest 51.4 0.7 0.6 76.4 23.6 3.0 4.5 0.17 0.14 3.86 3.86 0.48 1.94
E08000016 Barnsley 60.4 1.1 0.8 69.8 30.2 3.5 7.3 0.11 0.08 2.19 2.19 0.24 1.26E08000032 Bradford 48.4 1.5 1.0 62.5 37.3 4.0 9.3 0.16 0.12 2.85 2.85 0.30 1.76E08000033 Calderdale 73.2 1.1 0.8 70.7 29.3 3.7 5.6 0.26 0.20 5.10 5.10 0.60 2.70E07000163 Craven 73.3 0.6 0.5 78.2 21.8 2.8 4.8 0.22 0.20 5.12 5.12 0.65 2.67E08000017 Doncaster 59.5 1.1 0.7 69.0 31.0 3.6 7.8 0.29 0.22 5.84 5.84 0.67 3.41E06000011 East Riding of Yorkshire 72.4 0.6 0.5 76.9 23.1 2.6 4.2 0.18 0.15 5.85 5.85 0.45 2.74E07000164 Hambleton 68.0 0.7 0.5 78.8 20.8 3.4 2.7 0.22 0.19 5.03 4.99 0.69 1.92E07000165 Harrogate 73.0 0.5 0.4 80.4 19.6 2.8 3.4 0.17 0.14 4.43 4.43 0.61 2.04E06000010 Kingston upon Hull, City of 65.5 1.6 1.2 62.2 37.8 4.1 12.7 0.31 0.28 5.93 5.93 0.54 4.02E08000034 Kirklees 62.7 1.1 0.9 71.1 28.9 3.7 7.0 0.26 0.23 5.17 5.17 0.60 3.03E08000035 Leeds 51.6 1.1 0.9 68.6 31.4 3.5 10.3 0.13 0.11 2.59 2.59 0.28 1.75E06000012 North East Lincolnshire 56.8 1.1 0.9 70.1 29.9 3.6 7.1 0.14 0.12 2.85 2.85 0.32 1.64E06000013 North Lincolnshire 49.5 0.5 0.4 81.9 18.1 2.9 2.2 0.10 0.08 2.54 2.54 0.38 1.00E07000166 Richmondshire 58.8 0.7 0.5 79.2 20.8 3.2 4.8 0.23 0.19 5.37 5.37 0.64 2.92E08000018 Rotherham 58.9 1.0 0.7 71.1 28.9 3.5 8.1 0.10 0.08 2.07 2.07 0.22 1.27E07000167 Ryedale 62.5 0.5 0.4 83.0 17.0 3.2 1.7 0.20 0.17 5.47 5.47 0.71 1.47E07000168 Scarborough 63.5 0.7 0.7 77.6 22.4 3.3 3.8 0.25 0.24 5.49 5.49 0.75 2.72E07000169 Selby 62.5 0.6 0.4 77.3 22.7 2.5 1.6 0.18 0.14 5.32 5.32 0.54 1.73E08000019 Sheffield 68.0 1.1 0.8 68.6 31.4 3.5 6.3 0.23 0.20 4.35 4.35 0.54 2.39E08000036 Wakefield 29.1 1.6 1.3 63.5 36.5 4.5 12.6 0.44 0.36 6.87 6.87 0.85 4.87E06000014 York 57.5 0.5 0.4 83.6 16.4 3.3 4.7 0.23 0.19 4.92 4.92 0.93 2.92
E12000004 East Midlands 64.1 0.9 0.7 72.5 27.5 3.3 5.6 0.04 0.04 0.93 0.93 0.11 0.49E12000006 East of England 65.5 0.7 0.5 79.7 20.2 3.2 4.1 0.03 0.02 0.63 0.63 0.09 0.31E12000007 London 61.1 1.0 0.8 72.6 27.2 3.7 8.2 0.03 0.03 0.63 0.63 0.08 0.38E12000001 North East 58.0 1.0 0.7 72.0 28.0 3.4 6.2 0.08 0.06 1.63 1.63 0.19 0.89E12000002 North West 65.1 1.3 1.0 66.6 33.4 3.8 8.5 0.05 0.04 0.92 0.92 0.10 0.56E12000008 South East 63.0 0.6 0.5 79.9 20.0 3.2 3.6 0.03 0.02 0.59 0.59 0.08 0.27E12000009 South West 72.5 0.7 0.5 78.5 21.5 3.1 4.0 0.04 0.03 0.84 0.84 0.11 0.41E12000005 West Midlands 62.5 0.7 0.6 76.6 23.4 3.1 4.2 0.03 0.02 0.65 0.65 0.08 0.32E12000003 Yorkshire and The Humber 57.4 1.0 0.8 71.5 28.5 3.6 7.0 0.04 0.03 0.81 0.81 0.10 0.48
Reg
ion
Wes
t Mid
land
s Number examined too small (<30) for robust estimate
Weighted Measures 95% Confidence Intervals
York
shire
and
the
Hum
ber