National Data Collection MetricValue Denominator Denominator Value Metric Metric Value 1 NA NA Total...
31
Introduction The Health Care Payment Learning and Action Network's (LAN) goal is to bring together private payers, providers, employers, state partners, consumer groups, individual consumers, and other stakeholders to accelerate the transition to alternative payment models. To measure the nation's progress, the LAN launched the National APM Data Collection Effort. This workbook will be used to collect health plan data according to the original APM Framework and line of business to be aggregated with other plan responses. Contents Introduction Introducing the workbook and providing important instructions General Information Background description about health plan data submission Commercial Metrics Metrics to report commercial dollars flowing through APMs Medicare Advantage Metrics Metrics to report Medicare Advantage dollars flowing through APMs Medicaid Metrics Metrics to report Medicaid dollars flowing through APMs Cross Checking Questions to identify whether there are outliers and data needs correction Definitions Defines key terms If you have any questions, please view the Frequently Asked Questions or email Andrea Caballero at [email protected]
Transcript of National Data Collection MetricValue Denominator Denominator Value Metric Metric Value 1 NA NA Total...

Introduction
The Health Care Payment Learning and Action Network's (LAN) goal is to bring together private payers, providers, employers, state partners, consumer groups, individual consumers, and other stakeholders to accelerate the transition to alternative payment models.
To measure the nation's progress, the LAN launched the National APM Data Collection Effort. This workbook will be used to collect health plan data according to the original APM Framework and line of business to be aggregated with other plan responses.
Contents
Introduction Introducing the workbook and providing important instructions
General Information Background description about health plan data submission
Commercial Metrics Metrics to report commercial dollars flowing through APMs
Medicare Advantage Metrics Metrics to report Medicare Advantage dollars flowing through APMs
Medicaid Metrics Metrics to report Medicaid dollars flowing through APMs
Cross Checking Questions to identify whether there are outliers and data needs correction
Definitions Defines key terms
If you have any questions, please view the Frequently Asked Questions or email Andrea Caballero at [email protected]
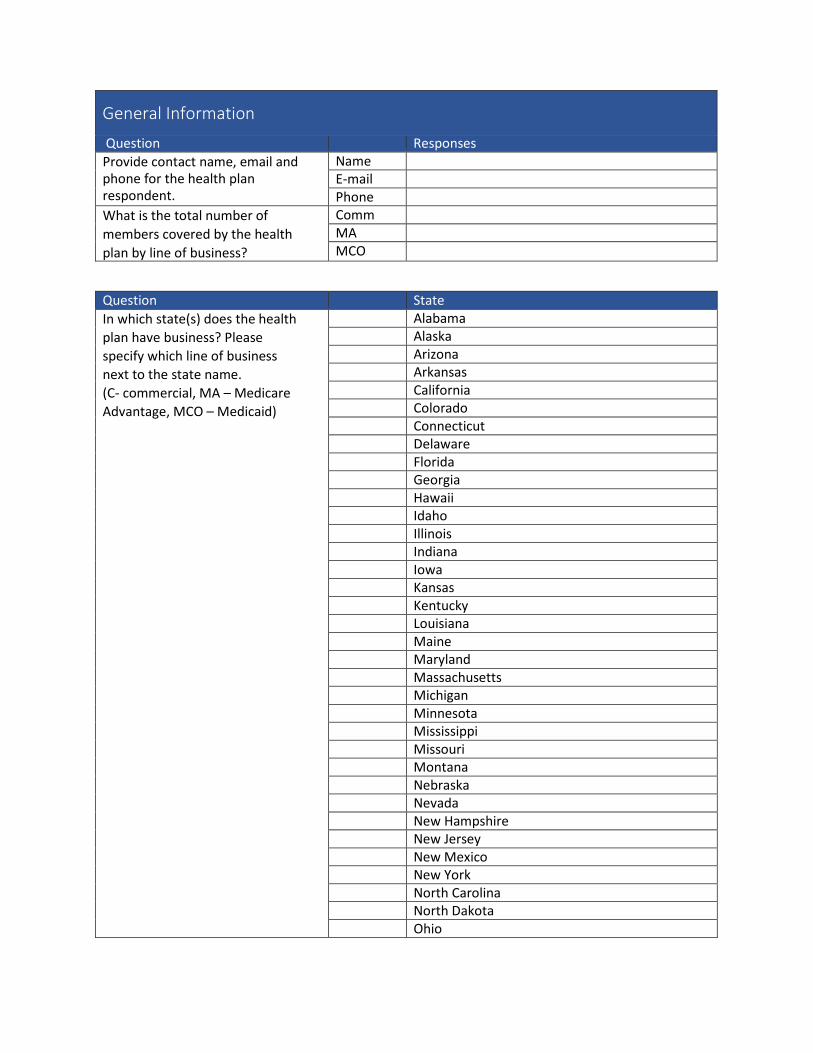
General Information
Question Responses Provide contact name, email and phone for the health plan respondent.
Name E-mail Phone
What is the total number of members covered by the health plan by line of business?
Comm MA MCO
Question State In which state(s) does the health plan have business? Please specify which line of business next to the state name. (C- commercial, MA – Medicare Advantage, MCO – Medicaid)
Alabama Alaska Arizona Arkansas California Colorado Connecticut Delaware Florida Georgia Hawaii Idaho Illinois Indiana Iowa Kansas Kentucky Louisiana Maine Maryland Massachusetts Michigan Minnesota Mississippi Missouri Montana Nebraska Nevada New Hampshire New Jersey New Mexico New York North Carolina North Dakota Ohio
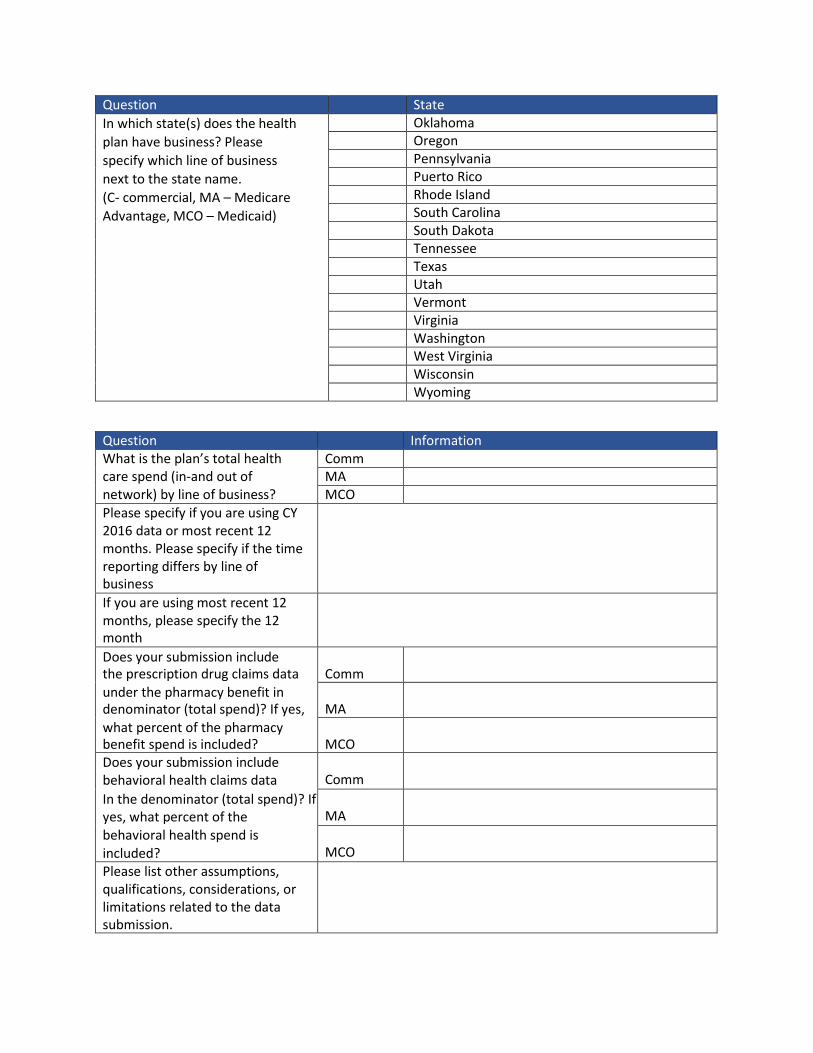
Question State In which state(s) does the health plan have business? Please specify which line of business next to the state name. (C- commercial, MA – Medicare Advantage, MCO – Medicaid)
Oklahoma Oregon Pennsylvania Puerto Rico Rhode Island South Carolina South Dakota Tennessee Texas Utah Vermont Virginia Washington West Virginia Wisconsin Wyoming
Question Information What is the plan’s total health Comm care spend (in-and out of MA network) by line of business? MCO Please specify if you are using CY 2016 data or most recent 12 months. Please specify if the time reporting differs by line of business If you are using most recent 12 months, please specify the 12 month Does your submission include the prescription drug claims data Comm under the pharmacy benefit in denominator (total spend)? If yes, MA what percent of the pharmacy benefit spend is included? MCO Does your submission include behavioral health claims data Comm In the denominator (total spend)? If yes, what percent of the MA behavioral health spend is included? MCO Please list other assumptions, qualifications, considerations, or limitations related to the data submission.
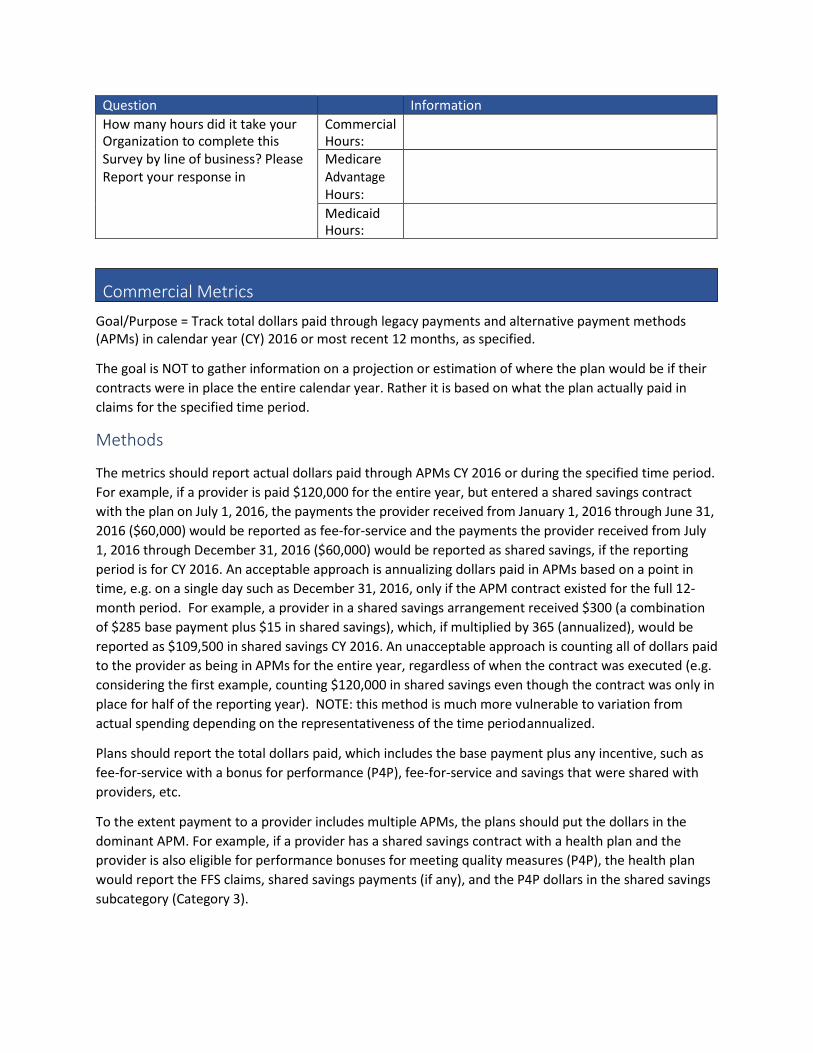
Question Information How many hours did it take your Organization to complete this
Commercial Hours:
Survey by line of business? Please Report your response in
Medicare Advantage Hours: Medicaid Hours:
Commercial Metrics Goal/Purpose = Track total dollars paid through legacy payments and alternative payment methods (APMs) in calendar year (CY) 2016 or most recent 12 months, as specified.
The goal is NOT to gather information on a projection or estimation of where the plan would be if their contracts were in place the entire calendar year. Rather it is based on what the plan actually paid in claims for the specified time period.
Methods
The metrics should report actual dollars paid through APMs CY 2016 or during the specified time period. For example, if a provider is paid $120,000 for the entire year, but entered a shared savings contract with the plan on July 1, 2016, the payments the provider received from January 1, 2016 through June 31, 2016 ($60,000) would be reported as fee-for-service and the payments the provider received from July 1, 2016 through December 31, 2016 ($60,000) would be reported as shared savings, if the reporting period is for CY 2016. An acceptable approach is annualizing dollars paid in APMs based on a point in time, e.g. on a single day such as December 31, 2016, only if the APM contract existed for the full 12-month period. For example, a provider in a shared savings arrangement received $300 (a combination of $285 base payment plus $15 in shared savings), which, if multiplied by 365 (annualized), would be reported as $109,500 in shared savings CY 2016. An unacceptable approach is counting all of dollars paid to the provider as being in APMs for the entire year, regardless of when the contract was executed (e.g. considering the first example, counting $120,000 in shared savings even though the contract was only in place for half of the reporting year). NOTE: this method is much more vulnerable to variation from actual spending depending on the representativeness of the time periodannualized.
Plans should report the total dollars paid, which includes the base payment plus any incentive, such as fee-for-service with a bonus for performance (P4P), fee-for-service and savings that were shared with providers, etc.
To the extent payment to a provider includes multiple APMs, the plans should put the dollars in the dominant APM. For example, if a provider has a shared savings contract with a health plan and the provider is also eligible for performance bonuses for meeting quality measures (P4P), the health plan would report the FFS claims, shared savings payments (if any), and the P4P dollars in the shared savings subcategory (Category 3).

Metrics
Please note that the dollars paid through the various APMs (numerator) are actual dollars paid to providers’ CY 2016 or most recent 12 months unless another method, such as annualizing, is used. Numerators should not be calculated based on members attributed to APMs unless the provider is held responsible for all care (in network, out of network, inpatient, outpatient, behavioral health, pharmacy) the patient receives.
Alternative Payment Model Framework – Category 1 (Metrics below apply to total dollars paid for commercial members. Metrics are NOT linked to quality)
# Numerator Numerator Value
Denominator Denominator Value
Metric Metric Value
1 NA NA Total dollars paid to providers (in and out of network) for commercial members in CY 2016 or most recent 12 months.
0 Denominator to inform the metrics below
NA
2 Total dollars paid to providers through legacy payments (including FFS without a quality component and DRGs) payments in CY 2016 or most recent 12 months.
0 Total dollars paid to providers (in and out of network) for commercial members in CY 2016 or most recent 12 months.
0 Dollars under legacy payments (including FFS without a quality component, DRGs, and capitation without quality): Percent of total dollars paid through legacy payments (including FFS without a quality component and DRGs) in CY 2016 or most recent 12 months.
0
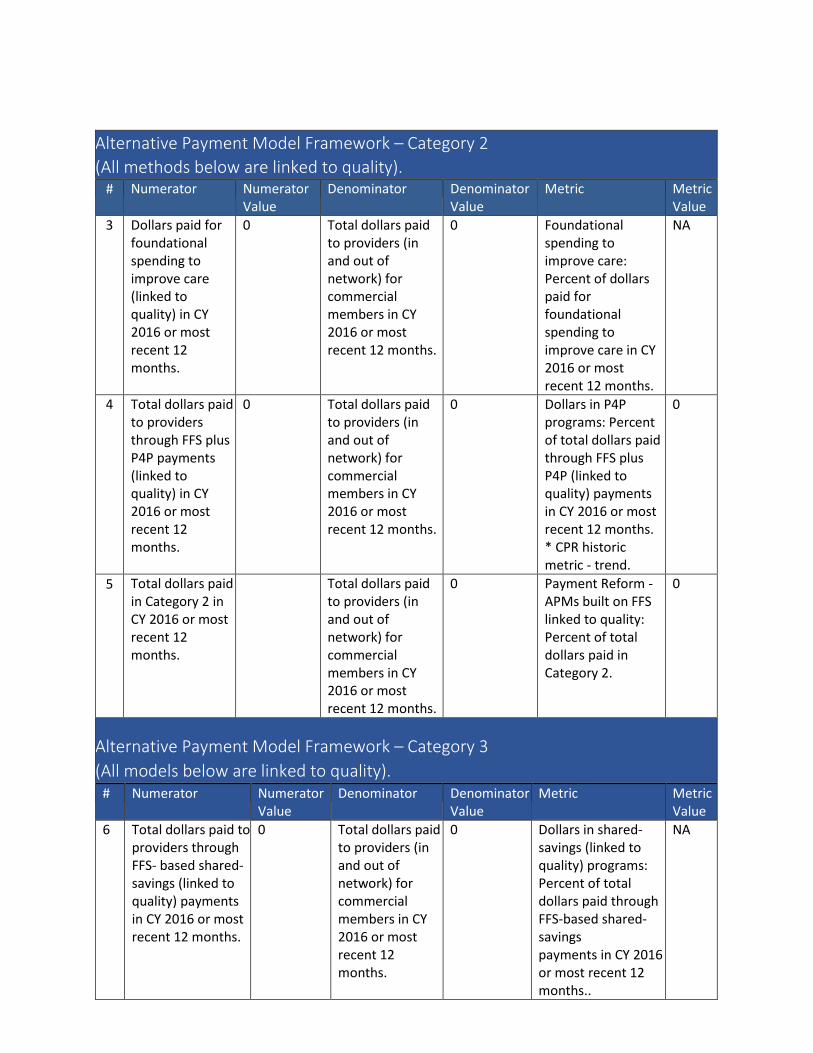
Alternative Payment Model Framework – Category 2 (All methods below are linked to quality).
# Numerator Numerator Value
Denominator Denominator Value
Metric Metric Value
3 Dollars paid for foundational spending to improve care (linked to quality) in CY 2016 or most recent 12 months.
0 Total dollars paid to providers (in and out of network) for commercial members in CY 2016 or most recent 12 months.
0 Foundational spending to improve care: Percent of dollars paid for foundational spending to improve care in CY 2016 or most recent 12 months.
NA
4 Total dollars paid to providers through FFS plus P4P payments (linked to quality) in CY 2016 or most recent 12 months.
0 Total dollars paid to providers (in and out of network) for commercial members in CY 2016 or most recent 12 months.
0 Dollars in P4P programs: Percent of total dollars paid through FFS plus P4P (linked to quality) payments in CY 2016 or most recent 12 months. * CPR historic metric - trend.
0
5 Total dollars paid in Category 2 in CY 2016 or most recent 12 months.
Total dollars paid to providers (in and out of network) for commercial members in CY 2016 or most recent 12 months.
0 Payment Reform -APMs built on FFS linked to quality: Percent of total dollars paid in Category 2.
0
Alternative Payment Model Framework – Category 3 (All models below are linked to quality).
# Numerator Numerator Value
Denominator Denominator Value
Metric Metric Value
6 Total dollars paid to providers through FFS- based shared-savings (linked to quality) payments in CY 2016 or most recent 12 months.
0 Total dollars paid to providers (in and out of network) for commercial members in CY 2016 or most recent 12 months.
0 Dollars in shared-savings (linked to quality) programs: Percent of total dollars paid through FFS-based shared-savings payments in CY 2016 or most recent 12 months..
NA
# Numerator Numerator Value
Denominator Denominator Value
Metric Metric Value
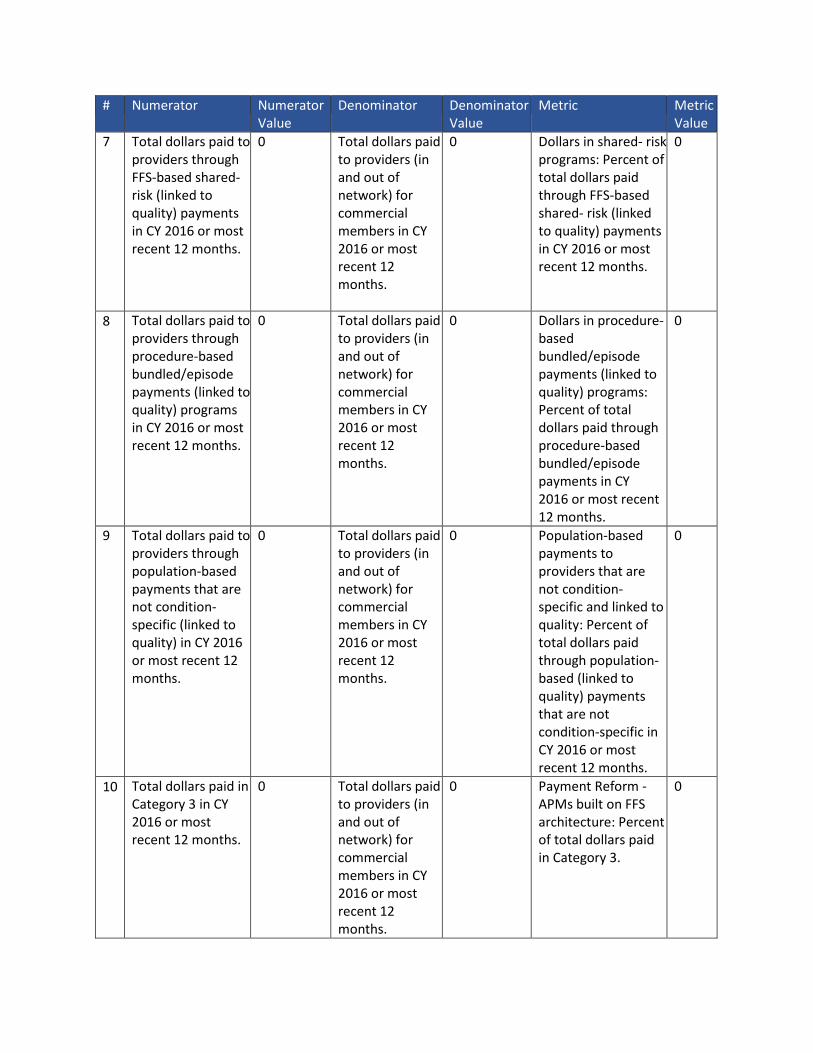
7 Total dollars paid to providers through FFS-based shared-risk (linked to quality) payments in CY 2016 or most recent 12 months.
0 Total dollars paid to providers (in and out of network) for commercial members in CY 2016 or most recent 12 months.
0 Dollars in shared- risk programs: Percent of total dollars paid through FFS-based shared- risk (linked to quality) payments in CY 2016 or most recent 12 months.
0
8 Total dollars paid to providers through procedure-based bundled/episode payments (linked to quality) programs in CY 2016 or most recent 12 months.
0 Total dollars paid to providers (in and out of network) for commercial members in CY 2016 or most recent 12 months.
0 Dollars in procedure-based bundled/episode payments (linked to quality) programs: Percent of total dollars paid through procedure-based bundled/episode payments in CY 2016 or most recent 12 months.
0
9 Total dollars paid to providers through population-based payments that are not condition-specific (linked to quality) in CY 2016 or most recent 12 months.
0 Total dollars paid to providers (in and out of network) for commercial members in CY 2016 or most recent 12 months.
0 Population-based payments to providers that are not condition-specific and linked to quality: Percent of total dollars paid through population-based (linked to quality) payments that are not condition-specific in CY 2016 or most recent 12 months.
0
10 Total dollars paid in Category 3 in CY 2016 or most recent 12 months.
0 Total dollars paid to providers (in and out of network) for commercial members in CY 2016 or most recent 12 months.
0 Payment Reform -APMs built on FFS architecture: Percent of total dollars paid in Category 3.
0
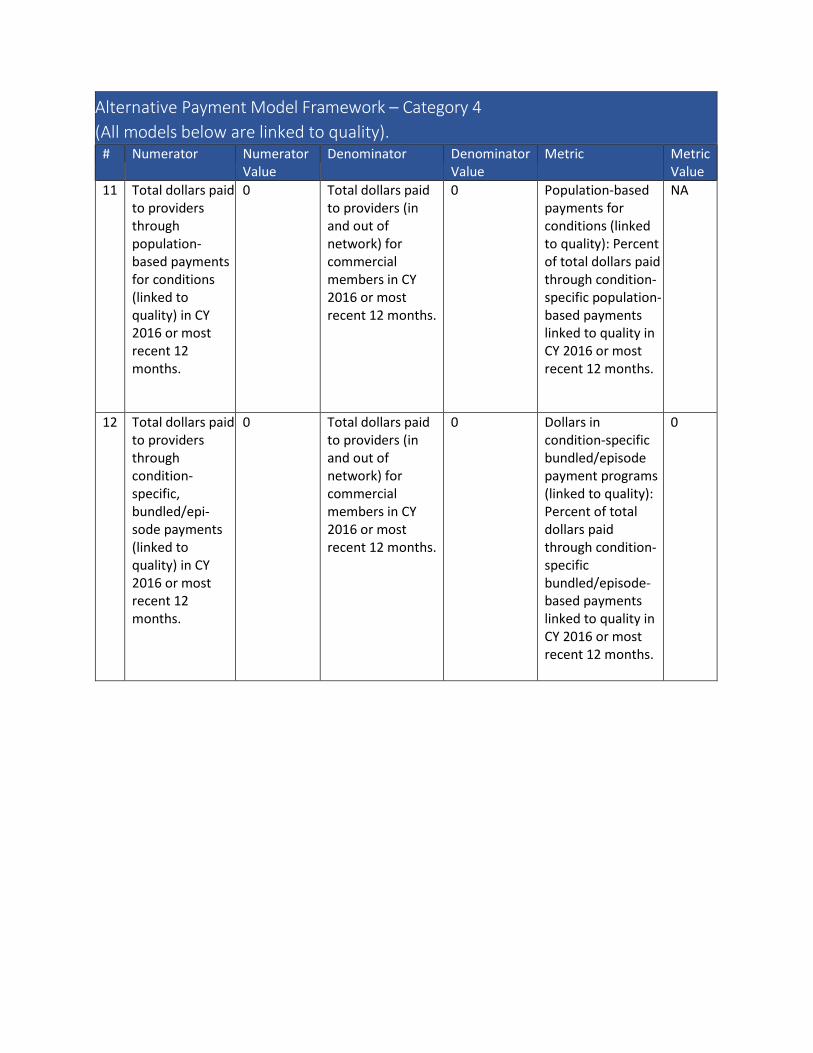
Alternative Payment Model Framework – Category 4 (All models below are linked to quality).
# Numerator Numerator Value
Denominator Denominator Value
Metric Metric Value
11 Total dollars paid to providers through population-based payments for conditions (linked to quality) in CY 2016 or most recent 12 months.
0 Total dollars paid to providers (in and out of network) for commercial members in CY 2016 or most recent 12 months.
0 Population-based payments for conditions (linked to quality): Percent of total dollars paid through condition-specific population-based payments linked to quality in CY 2016 or most recent 12 months.
NA
12 Total dollars paid to providers through condition-specific, bundled/epi-sode payments (linked to quality) in CY 2016 or most recent 12 months.
0 Total dollars paid to providers (in and out of network) for commercial members in CY 2016 or most recent 12 months.
0 Dollars in condition-specific bundled/episode payment programs (linked to quality): Percent of total dollars paid through condition-specific bundled/episode-based payments linked to quality in CY 2016 or most recent 12 months.
0

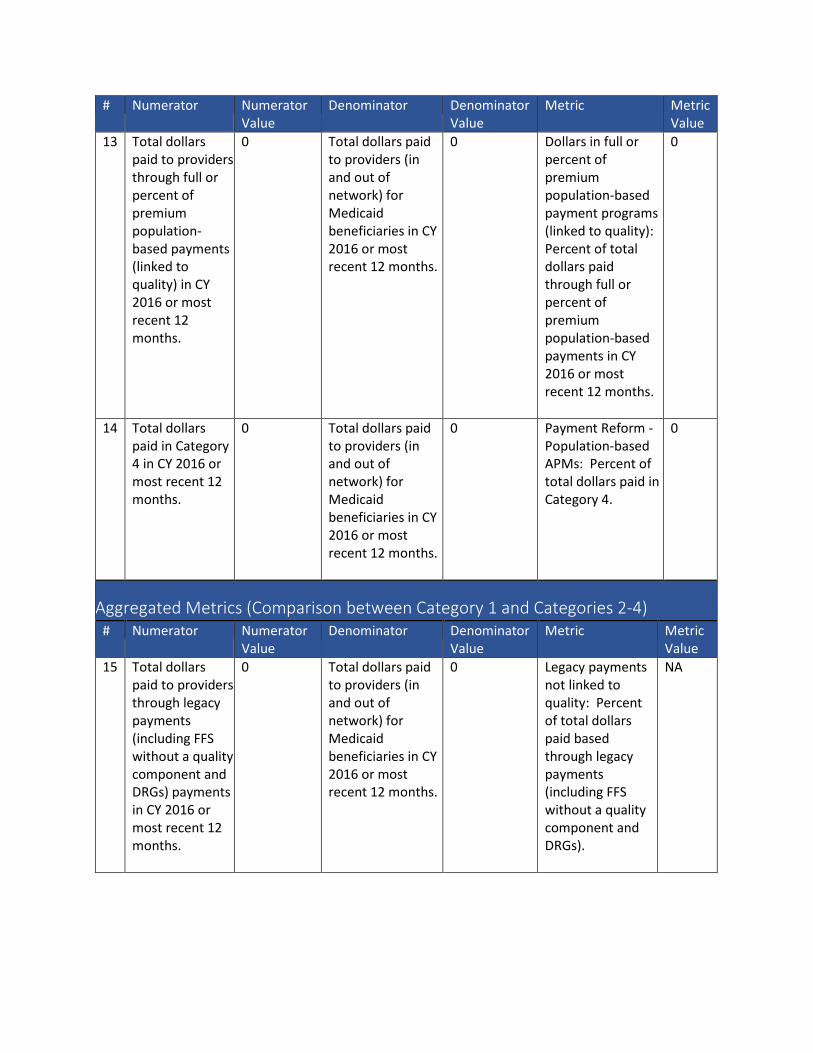
# Numerator Numerator Value
Denominator Denominator Value
Metric Metric Value
13 Total dollars paid to providers through full or percent of premium population-based payments (linked to quality) in CY 2016 or most recent 12 months.
0 Total dollars paid to providers (in and out of network) for commercial members in CY 2016 or most recent 12 months.
0 Dollars in full or percent of premium population-based payment programs (linked to quality): Percent of total dollars paid through full or percent of premium population-based payments in CY 2016 or most recent 12 months.
0
14 Total dollars paid in Category 4 in CY 2016 or most recent 12 months.
0 Total dollars paid to providers (in and out of network) for commercial members in CY 2016 or most recent 12 months.
0 Payment Reform -Population-based APMs: Percent of total dollars paid in Category 4.
0
Aggregated Metrics (Comparison between Category 1 and Categories 2-4) # Numerator Numerator
Value Denominator Denominator
Value Metric Metric
Value 15 Total dollars
paid to providers through legacy payments (including FFS without a quality component and DRGs) payments in CY 2016 or most recent 12 months.
0 Total dollars paid to providers (in and out of network) for commercial members in CY 2016 or most recent 12 months.
0 Legacy payments not linked to quality: Percent of total dollars paid based through legacy payments (including FFS without a quality component and DRGs).
NA
# Numerator Numerator Value
Denominator Denominator Value
Metric Metric Value
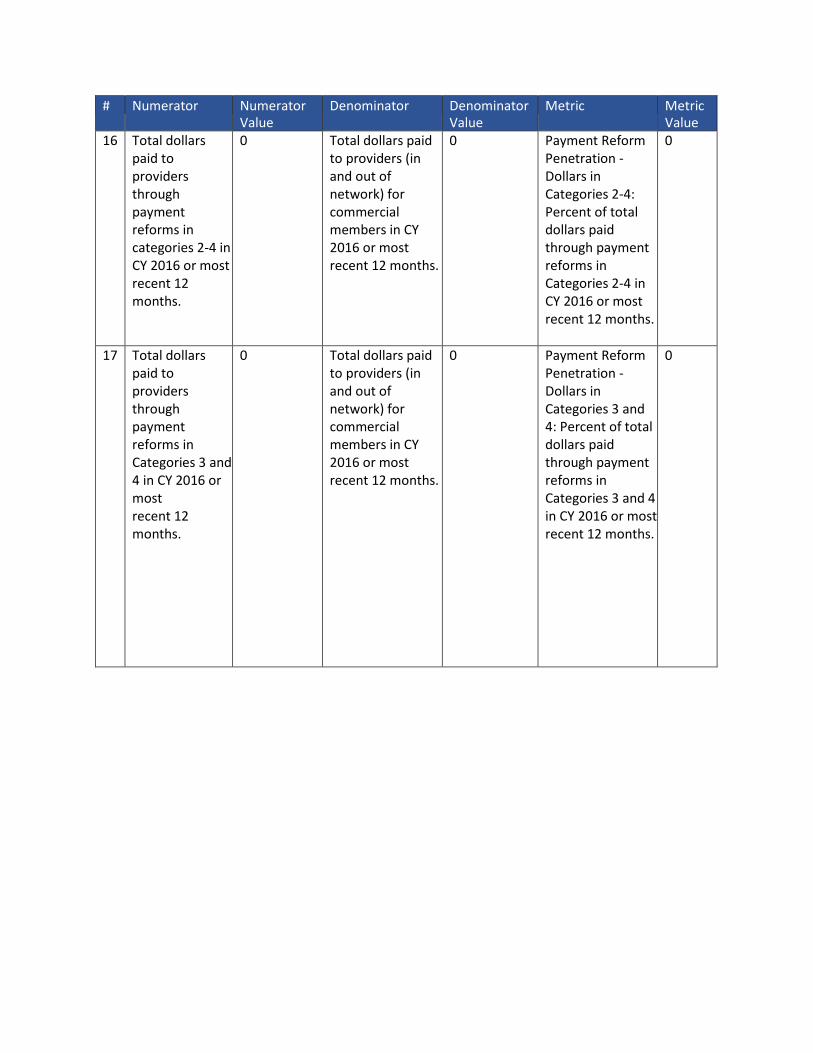
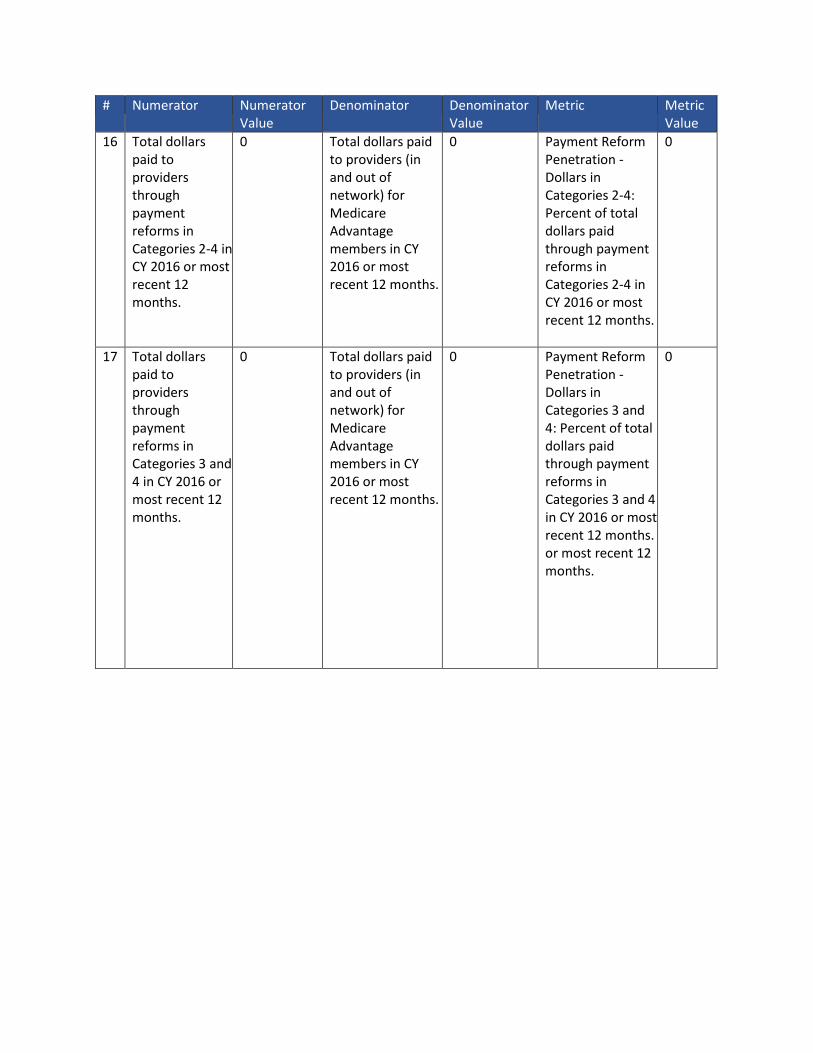
16 Total dollars paid to providers through payment reforms in categories 2-4 in CY 2016 or most recent 12 months.
0 Total dollars paid to providers (in and out of network) for commercial members in CY 2016 or most recent 12 months.
0 Payment Reform Penetration -Dollars in Categories 2-4: Percent of total dollars paid through payment reforms in Categories 2-4 in CY 2016 or most recent 12 months.
0
17 Total dollars paid to providers through payment reforms in Categories 3 and 4 in CY 2016 or most recent 12 months.
0 Total dollars paid to providers (in and out of network) for commercial members in CY 2016 or most recent 12 months.
0 Payment Reform Penetration -Dollars in Categories 3 and 4: Percent of total dollars paid through payment reforms in Categories 3 and 4 in CY 2016 or most recent 12 months.
0
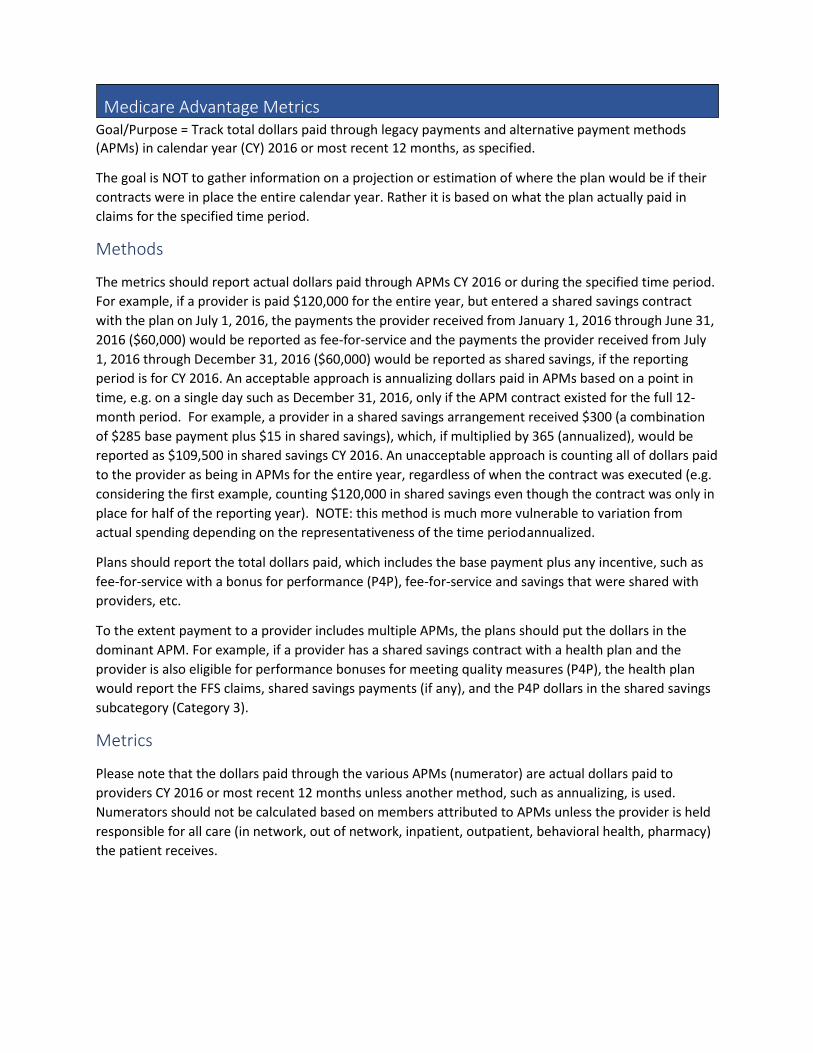
Medicare Advantage Metrics Goal/Purpose = Track total dollars paid through legacy payments and alternative payment methods (APMs) in calendar year (CY) 2016 or most recent 12 months, as specified.
The goal is NOT to gather information on a projection or estimation of where the plan would be if their contracts were in place the entire calendar year. Rather it is based on what the plan actually paid in claims for the specified time period.
Methods
The metrics should report actual dollars paid through APMs CY 2016 or during the specified time period. For example, if a provider is paid $120,000 for the entire year, but entered a shared savings contract with the plan on July 1, 2016, the payments the provider received from January 1, 2016 through June 31, 2016 ($60,000) would be reported as fee-for-service and the payments the provider received from July 1, 2016 through December 31, 2016 ($60,000) would be reported as shared savings, if the reporting period is for CY 2016. An acceptable approach is annualizing dollars paid in APMs based on a point in time, e.g. on a single day such as December 31, 2016, only if the APM contract existed for the full 12-month period. For example, a provider in a shared savings arrangement received $300 (a combination of $285 base payment plus $15 in shared savings), which, if multiplied by 365 (annualized), would be reported as $109,500 in shared savings CY 2016. An unacceptable approach is counting all of dollars paid to the provider as being in APMs for the entire year, regardless of when the contract was executed (e.g. considering the first example, counting $120,000 in shared savings even though the contract was only in place for half of the reporting year). NOTE: this method is much more vulnerable to variation from actual spending depending on the representativeness of the time periodannualized.
Plans should report the total dollars paid, which includes the base payment plus any incentive, such as fee-for-service with a bonus for performance (P4P), fee-for-service and savings that were shared with providers, etc.
To the extent payment to a provider includes multiple APMs, the plans should put the dollars in the dominant APM. For example, if a provider has a shared savings contract with a health plan and the provider is also eligible for performance bonuses for meeting quality measures (P4P), the health plan would report the FFS claims, shared savings payments (if any), and the P4P dollars in the shared savings subcategory (Category 3).
Metrics
Please note that the dollars paid through the various APMs (numerator) are actual dollars paid to providers CY 2016 or most recent 12 months unless another method, such as annualizing, is used. Numerators should not be calculated based on members attributed to APMs unless the provider is held responsible for all care (in network, out of network, inpatient, outpatient, behavioral health, pharmacy) the patient receives.
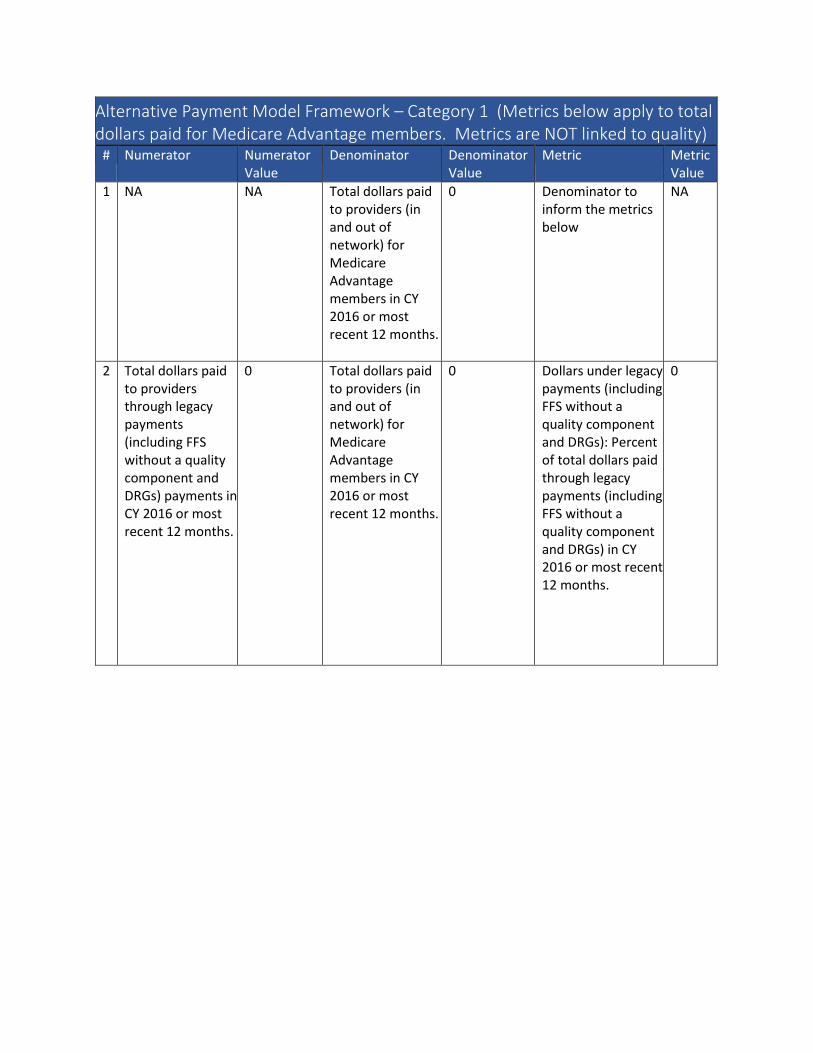
Alternative Payment Model Framework – Category 1 (Metrics below apply to total dollars paid for Medicare Advantage members. Metrics are NOT linked to quality)
# Numerator Numerator Value
Denominator Denominator Value
Metric Metric Value
1 NA NA Total dollars paid to providers (in and out of network) for Medicare Advantage members in CY 2016 or most recent 12 months.
0 Denominator to inform the metrics below
NA
2 Total dollars paid to providers through legacy payments (including FFS without a quality component and DRGs) payments in CY 2016 or most recent 12 months.
0 Total dollars paid to providers (in and out of network) for Medicare Advantage members in CY 2016 or most recent 12 months.
0 Dollars under legacy payments (including FFS without a quality component and DRGs): Percent of total dollars paid through legacy payments (including FFS without a quality component and DRGs) in CY 2016 or most recent 12 months.
0
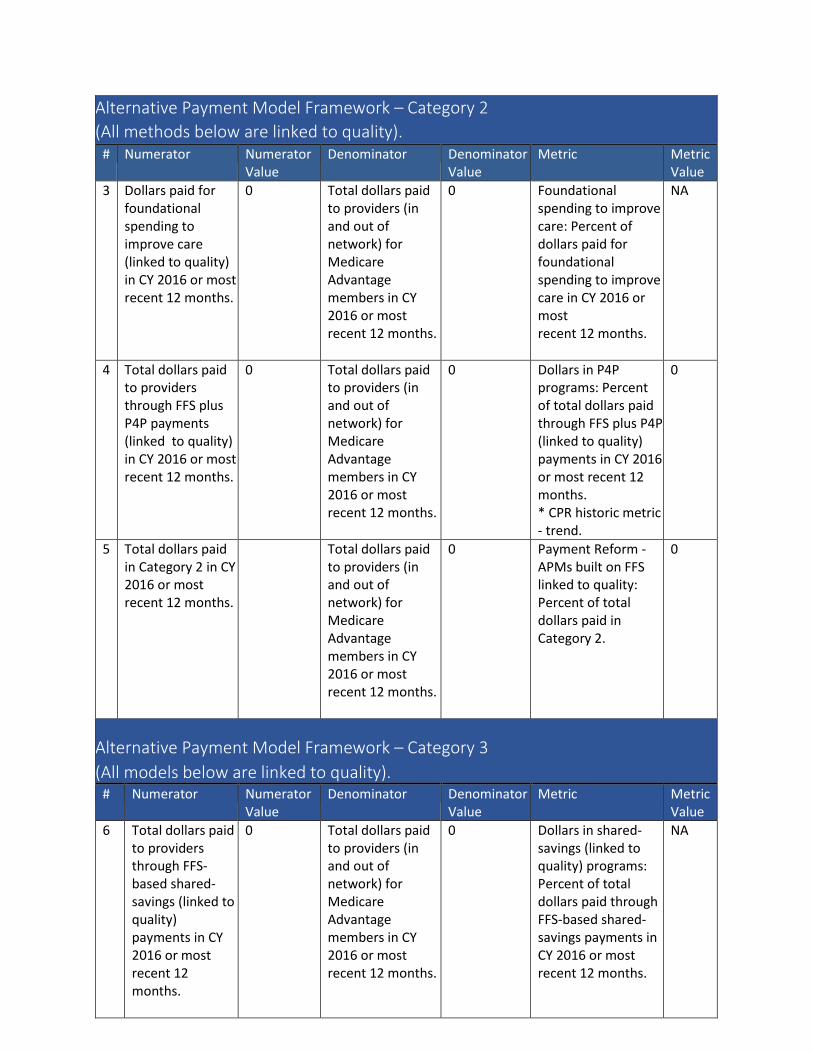
Alternative Payment Model Framework – Category 2 (All methods below are linked to quality).
# Numerator Numerator Value
Denominator Denominator Value
Metric Metric Value
3 Dollars paid for foundational spending to improve care (linked to quality) in CY 2016 or most recent 12 months.
0 Total dollars paid to providers (in and out of network) for Medicare Advantage members in CY 2016 or most recent 12 months.
0 Foundational spending to improve care: Percent of dollars paid for foundational spending to improve care in CY 2016 or most recent 12 months.
NA
4 Total dollars paid to providers through FFS plus P4P payments (linked to quality) in CY 2016 or most recent 12 months.
0 Total dollars paid to providers (in and out of network) for Medicare Advantage members in CY 2016 or most recent 12 months.
0 Dollars in P4P programs: Percent of total dollars paid through FFS plus P4P (linked to quality) payments in CY 2016 or most recent 12 months. * CPR historic metric - trend.
0
5 Total dollars paid in Category 2 in CY 2016 or most recent 12 months.
Total dollars paid to providers (in and out of network) for Medicare Advantage members in CY 2016 or most recent 12 months.
0 Payment Reform -APMs built on FFS linked to quality: Percent of total dollars paid in Category 2.
0
Alternative Payment Model Framework – Category 3 (All models below are linked to quality).
# Numerator Numerator Value
Denominator Denominator Value
Metric Metric Value
6 Total dollars paid to providers through FFS-based shared-savings (linked to quality) payments in CY 2016 or most recent 12 months.
0 Total dollars paid to providers (in and out of network) for Medicare Advantage members in CY 2016 or most recent 12 months.
0 Dollars in shared-savings (linked to quality) programs: Percent of total dollars paid through FFS-based shared-savings payments in CY 2016 or most recent 12 months.
NA
# Numerator Numerator Value
Denominator Denominator Value
Metric Metric Value
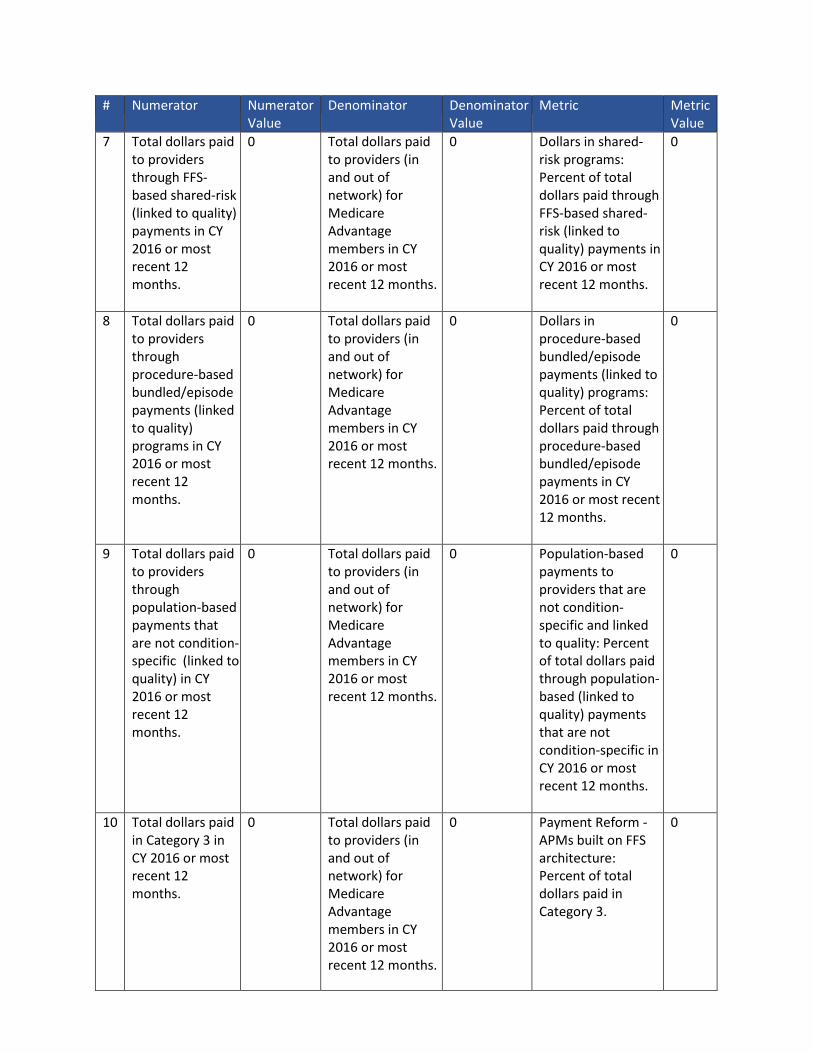
7 Total dollars paid to providers through FFS-based shared-risk (linked to quality) payments in CY 2016 or most recent 12 months.
0 Total dollars paid to providers (in and out of network) for Medicare Advantage members in CY 2016 or most recent 12 months.
0 Dollars in shared-risk programs: Percent of total dollars paid through FFS-based shared-risk (linked to quality) payments in CY 2016 or most recent 12 months.
0
8 Total dollars paid to providers through procedure-based bundled/episode payments (linked to quality) programs in CY 2016 or most recent 12 months.
0 Total dollars paid to providers (in and out of network) for Medicare Advantage members in CY 2016 or most recent 12 months.
0 Dollars in procedure-based bundled/episode payments (linked to quality) programs: Percent of total dollars paid through procedure-based bundled/episode payments in CY 2016 or most recent 12 months.
0
9 Total dollars paid to providers through population-based payments that are not condition-specific (linked to quality) in CY 2016 or most recent 12 months.
0 Total dollars paid to providers (in and out of network) for Medicare Advantage members in CY 2016 or most recent 12 months.
0 Population-based payments to providers that are not condition-specific and linked to quality: Percent of total dollars paid through population-based (linked to quality) payments that are not condition-specific in CY 2016 or most recent 12 months.
0
10 Total dollars paid in Category 3 in CY 2016 or most recent 12 months.
0 Total dollars paid to providers (in and out of network) for Medicare Advantage members in CY 2016 or most recent 12 months.
0 Payment Reform -APMs built on FFS architecture: Percent of total dollars paid in Category 3.
0

Alternative Payment Model Framework – Category 4 (All models below are linked to quality).
# Numerator Numerator Value
Denominator Denominator Value
Metric Metric Value
11 Total dollars paid to providers through population-based payments for conditions (linked to quality) in CY 2016 or most recent 12 months.
0 Total dollars paid to providers (in and out of network) for Medicare Advantage members in CY 2016 or most recent 12 months.
0 Population-based payments for conditions (linked to quality): Percent of total dollars paid through condition-specific population-based payments linked to quality in CY 2016 or most recent 12 months.
NA
12 Total dollars paid to providers through condition-specific, bundled/episode payments (linked to quality) in CY 2016 or most recent 12 months.
0 Total dollars paid to providers (in and out of network) for Medicare Advantage members in CY 2016 or most recent 12 months.
0 Dollars in condition-specific bundled/episode payment programs (linked to quality): Percent of total dollars paid through condition-specific bundled/episode-based payments linked to quality in CY 2016 or most recent 12 months.
0
# Numerator Numerator Value
Denominator Denominator Value
Metric Metric Value
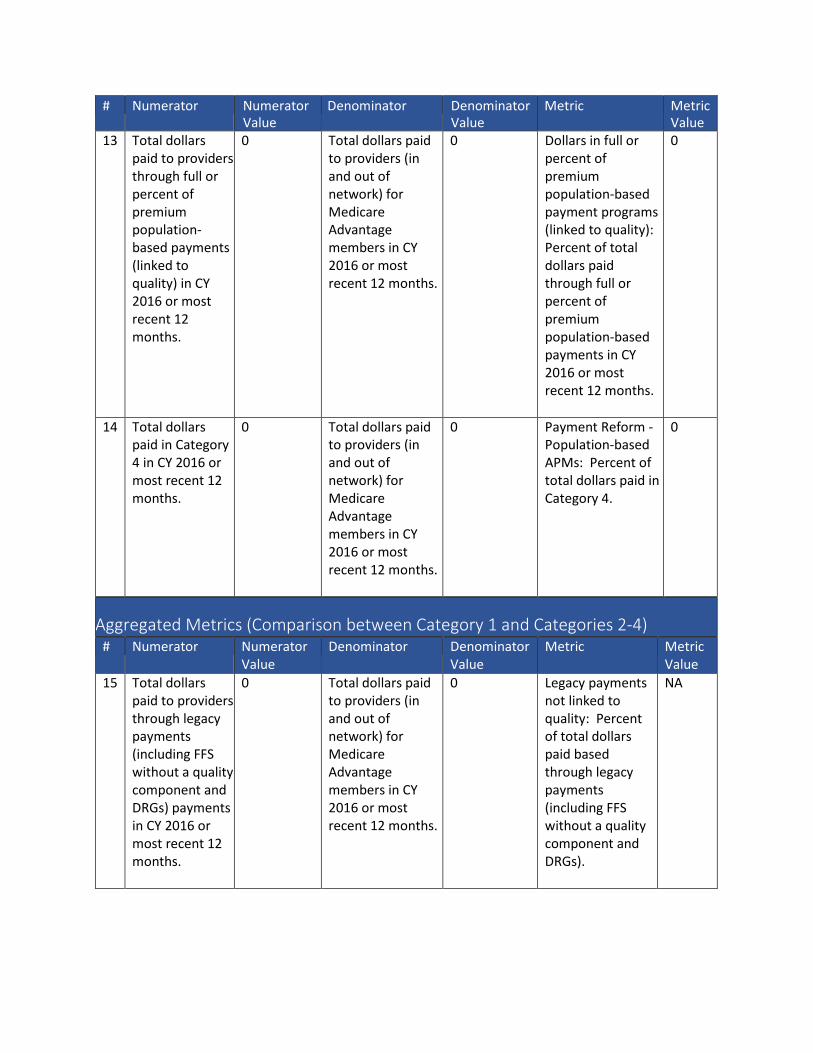
13 Total dollars paid to providers through full or percent of premium population-based payments (linked to quality) in CY 2016 or most recent 12 months.
0 Total dollars paid to providers (in and out of network) for Medicare Advantage members in CY 2016 or most recent 12 months.
0 Dollars in full or percent of premium population-based payment programs (linked to quality): Percent of total dollars paid through full or percent of premium population-based payments in CY 2016 or most recent 12 months.
0
14 Total dollars paid in Category 4 in CY 2016 or most recent 12 months.
0 Total dollars paid to providers (in and out of network) for Medicare Advantage members in CY 2016 or most recent 12 months.
0 Payment Reform -Population-based APMs: Percent of total dollars paid in Category 4.
0
Aggregated Metrics (Comparison between Category 1 and Categories 2-4) # Numerator Numerator
Value Denominator Denominator
Value Metric Metric
Value 15 Total dollars
paid to providers through legacy payments (including FFS without a quality component and DRGs) payments in CY 2016 or most recent 12 months.
0 Total dollars paid to providers (in and out of network) for Medicare Advantage members in CY 2016 or most recent 12 months.
0 Legacy payments not linked to quality: Percent of total dollars paid based through legacy payments (including FFS without a quality component and DRGs).
NA
# Numerator Numerator Value
Denominator Denominator Value
Metric Metric Value
16 Total dollars paid to providers through payment reforms in Categories 2-4 in CY 2016 or most recent 12 months.
0 Total dollars paid to providers (in and out of network) for Medicare Advantage members in CY 2016 or most recent 12 months.
0 Payment Reform Penetration -Dollars in Categories 2-4: Percent of total dollars paid through payment reforms in Categories 2-4 in CY 2016 or most recent 12 months.
0
17 Total dollars paid to providers through payment reforms in Categories 3 and 4 in CY 2016 or most recent 12 months.
0 Total dollars paid to providers (in and out of network) for Medicare Advantage members in CY 2016 or most recent 12 months.
0 Payment Reform Penetration -Dollars in Categories 3 and 4: Percent of total dollars paid through payment reforms in Categories 3 and 4 in CY 2016 or most recent 12 months. or most recent 12 months.
0
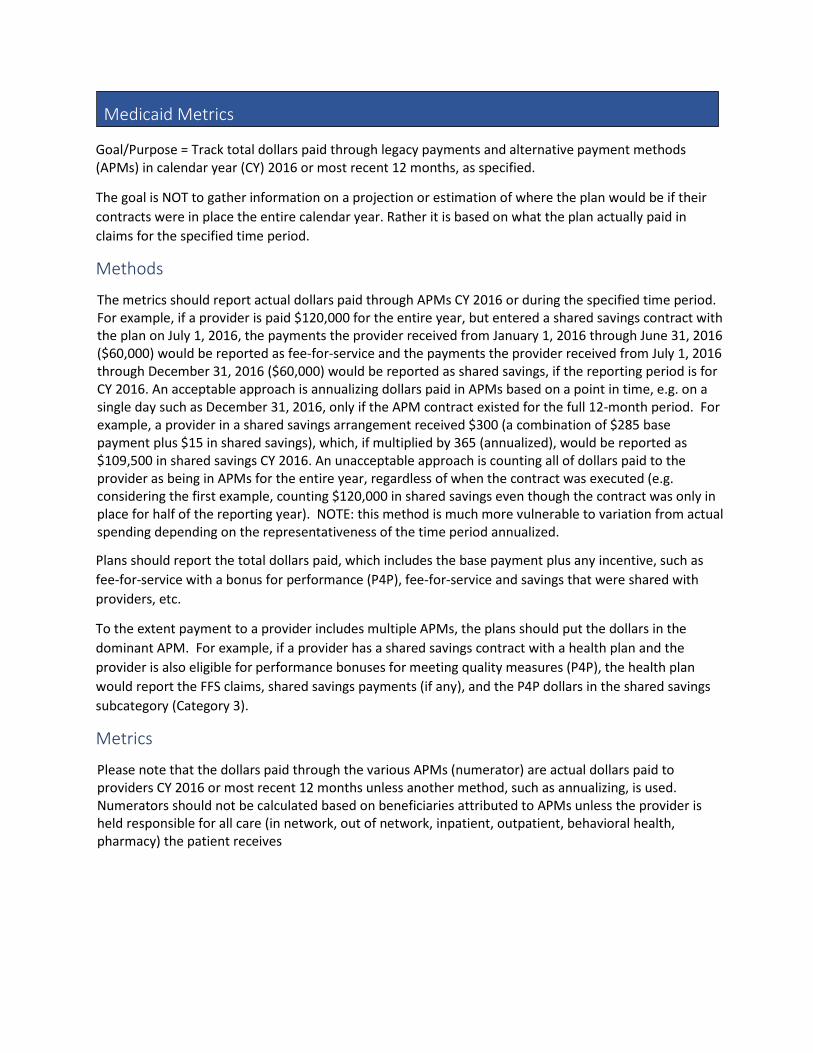
Medicaid Metrics
Goal/Purpose = Track total dollars paid through legacy payments and alternative payment methods (APMs) in calendar year (CY) 2016 or most recent 12 months, as specified.
The goal is NOT to gather information on a projection or estimation of where the plan would be if their contracts were in place the entire calendar year. Rather it is based on what the plan actually paid in claims for the specified time period.
Methods
The metrics should report actual dollars paid through APMs CY 2016 or during the specified time period. For example, if a provider is paid $120,000 for the entire year, but entered a shared savings contract with the plan on July 1, 2016, the payments the provider received from January 1, 2016 through June 31, 2016 ($60,000) would be reported as fee-for-service and the payments the provider received from July 1, 2016 through December 31, 2016 ($60,000) would be reported as shared savings, if the reporting period is for CY 2016. An acceptable approach is annualizing dollars paid in APMs based on a point in time, e.g. on a single day such as December 31, 2016, only if the APM contract existed for the full 12-month period. For example, a provider in a shared savings arrangement received $300 (a combination of $285 base payment plus $15 in shared savings), which, if multiplied by 365 (annualized), would be reported as $109,500 in shared savings CY 2016. An unacceptable approach is counting all of dollars paid to the provider as being in APMs for the entire year, regardless of when the contract was executed (e.g. considering the first example, counting $120,000 in shared savings even though the contract was only in place for half of the reporting year). NOTE: this method is much more vulnerable to variation from actual spending depending on the representativeness of the time period annualized.
Plans should report the total dollars paid, which includes the base payment plus any incentive, such as fee-for-service with a bonus for performance (P4P), fee-for-service and savings that were shared with providers, etc.
To the extent payment to a provider includes multiple APMs, the plans should put the dollars in the dominant APM. For example, if a provider has a shared savings contract with a health plan and the provider is also eligible for performance bonuses for meeting quality measures (P4P), the health plan would report the FFS claims, shared savings payments (if any), and the P4P dollars in the shared savings subcategory (Category 3).
Metrics
Please note that the dollars paid through the various APMs (numerator) are actual dollars paid to providers CY 2016 or most recent 12 months unless another method, such as annualizing, is used. Numerators should not be calculated based on beneficiaries attributed to APMs unless the provider is held responsible for all care (in network, out of network, inpatient, outpatient, behavioral health, pharmacy) the patient receives
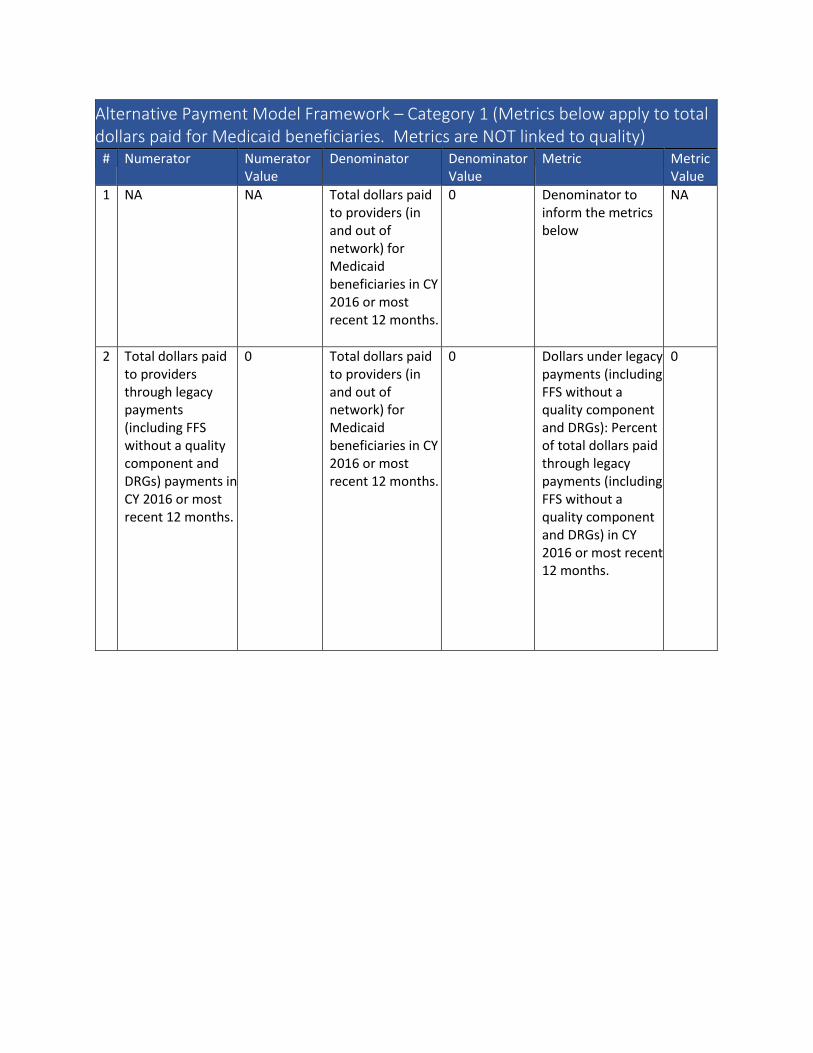
Alternative Payment Model Framework – Category 1 (Metrics below apply to total dollars paid for Medicaid beneficiaries. Metrics are NOT linked to quality)
# Numerator Numerator Value
Denominator Denominator Value
Metric Metric Value
1 NA NA Total dollars paid to providers (in and out of network) for Medicaid beneficiaries in CY 2016 or most recent 12 months.
0 Denominator to inform the metrics below
NA
2 Total dollars paid to providers through legacy payments (including FFS without a quality component and DRGs) payments in CY 2016 or most recent 12 months.
0 Total dollars paid to providers (in and out of network) for Medicaid beneficiaries in CY 2016 or most recent 12 months.
0 Dollars under legacy payments (including FFS without a quality component and DRGs): Percent of total dollars paid through legacy payments (including FFS without a quality component and DRGs) in CY 2016 or most recent 12 months.
0

Alternative Payment Model Framework – Category 2 (All methods below are linked to quality).
# Numerator Numerator Value
Denominator Denominator Value
Metric Metric Value
3 Dollars paid for foundational spending to improve care (linked to quality) in CY 2016 or most recent 12 months.
0 Total dollars paid to providers (in and out of network) for Medicaid beneficiaries in CY 2016 or most recent 12 months.
0 Foundational spending to improve care: Percent of dollars paid for foundational spending to improve care in CY 2016 or most recent 12 months.
NA
4 Total dollars paid to providers through FFS plus P4P payments (linked to quality) in CY 2016 or most recent 12 months.
0 Total dollars paid to providers (in and out of network) for Medicaid beneficiaries in CY 2016 or most recent 12 months.
0 Dollars in P4P programs: Percent of total dollars paid through FFS plus P4P (linked to quality) payments in CY 2016 or most recent 12 months. * CPR historic metric - trend.
0
5 Total dollars paid in Category 2 in CY 2016 or most recent 12 months.
Total dollars paid to providers (in and out of network) for Medicaid beneficiaries in CY 2016 or most recent 12 months.
0 Payment Reform -APMs built on FFS linked to quality: Percent of total dollars paid in Category 2.
0
Alternative Payment Model Framework – Category 3 (All models below are linked to quality).
# Numerator Numerator Value
Denominator Denominator Value
Metric Metric Value
6 Total dollars paid to providers through FFS-based shared-savings (linked to quality) payments in CY 2016 or most recent 12 months.
0 Total dollars paid to providers (in and out of network) for Medicaid beneficiaries in CY 2016 or most recent 12 months.
0 Dollars in shared-savings (linked to quality) programs: Percent of total dollars paid through FFS-based shared-savings payments in CY 2016 or most recent 12 months.
NA

# Numerator Numerator Value
Denominator Denominator Value
Metric Metric Value
7 Total dollars paid to providers through FFS-based shared-risk (linked to quality) payments in CY 2016 or most recent 12 months.
0 Total dollars paid to providers (in and out of network) for Medicaid beneficiaries in CY 2016 or most recent 12 months.
0 Dollars in shared-risk programs: Percent of total dollars paid through FFS-based shared-risk (linked to quality) payments in CY 2016 or most recent 12 months.
0
8 Total dollars paid to providers through procedure-based bundled/episode payments (linked to quality) programs in CY 2016 or most recent 12 months.
0 Total dollars paid to providers (in and out of network) for Medicaid beneficiaries in CY 2016 or most recent 12 months.
0 Dollars in procedure-based bundled/episode payments (linked to quality) programs: Percent of total dollars paid through procedure-based bundled/episode payments in CY 2016 or most recent 12 months.
0
9 Total dollars paid to providers through population-based payments that are not condition-specific (linked to quality) in CY 2016 or most recent 12 months.
0 Total dollars paid to providers (in and out of network) for Medicaid beneficiaries in CY 2016 or most recent 12 months.
0 Population-based payments to providers that are not condition-specific and linked to quality: Percent of total dollars paid through population-based (linked to quality) payments that are not condition-specific in CY 2016 or most recent 12 months.
0
10 Total dollars paid in Category 3 in CY 2016 or most recent 12 months.
0 Total dollars paid to providers (in and out of network) for Medicaid beneficiaries in CY 2016 or most recent 12 months.
0 Payment Reform -APMs built on FFS architecture: Percent of total dollars paid in Category 3.
0
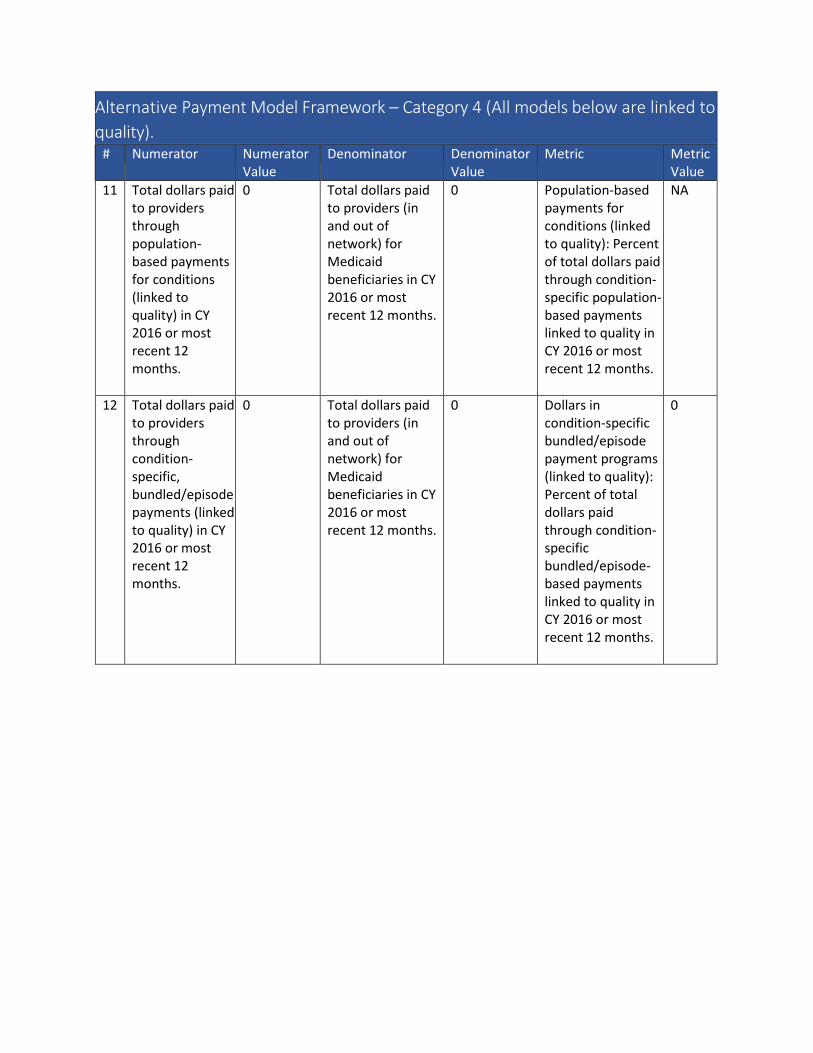
Alternative Payment Model Framework – Category 4 (All models below are linked to quality).
# Numerator Numerator Value
Denominator Denominator Value
Metric Metric Value
11 Total dollars paid to providers through population-based payments for conditions (linked to quality) in CY 2016 or most recent 12 months.
0 Total dollars paid to providers (in and out of network) for Medicaid beneficiaries in CY 2016 or most recent 12 months.
0 Population-based payments for conditions (linked to quality): Percent of total dollars paid through condition-specific population-based payments linked to quality in CY 2016 or most recent 12 months.
NA
12 Total dollars paid to providers through condition-specific, bundled/episode payments (linked to quality) in CY 2016 or most recent 12 months.
0 Total dollars paid to providers (in and out of network) for Medicaid beneficiaries in CY 2016 or most recent 12 months.
0 Dollars in condition-specific bundled/episode payment programs (linked to quality): Percent of total dollars paid through condition-specific bundled/episode-based payments linked to quality in CY 2016 or most recent 12 months.
0
# Numerator Numerator Value
Denominator Denominator Value
Metric Metric Value
13 Total dollars paid to providers through full or percent of premium population-based payments (linked to quality) in CY 2016 or most recent 12 months.
0 Total dollars paid to providers (in and out of network) for Medicaid beneficiaries in CY 2016 or most recent 12 months.
0 Dollars in full or percent of premium population-based payment programs (linked to quality): Percent of total dollars paid through full or percent of premium population-based payments in CY 2016 or most recent 12 months.
0
14 Total dollars paid in Category 4 in CY 2016 or most recent 12 months.
0 Total dollars paid to providers (in and out of network) for Medicaid beneficiaries in CY 2016 or most recent 12 months.
0 Payment Reform -Population-based APMs: Percent of total dollars paid in Category 4.
0
Aggregated Metrics (Comparison between Category 1 and Categories 2-4) # Numerator Numerator
Value Denominator Denominator
Value Metric Metric
Value 15 Total dollars
paid to providers through legacy payments (including FFS without a quality component and DRGs) payments in CY 2016 or most recent 12 months.
0 Total dollars paid to providers (in and out of network) for Medicaid beneficiaries in CY 2016 or most recent 12 months.
0 Legacy payments not linked to quality: Percent of total dollars paid based through legacy payments (including FFS without a quality component and DRGs).
NA

# Numerator Numerator Value
Denominator Denominator Value
Metric Metric Value
16 Total dollars paid to providers through payment reforms in Categories 2-4 in CY 2016 or most recent 12 months.
0 Total dollars paid to providers (in and out of network) for Medicaid beneficiaries in CY 2016 or most recent 12 months.
0 Payment Reform Penetration -Dollars in Categories 2-4: Percent of total dollars paid through payment reforms in Categories 2-4 in CY 2016 or most recent 12 months.
0
17 Total dollars paid to providers through payment reforms in Categories 3 and 4 in CY 2016 or most recent 12 months.
0 Total dollars paid to providers (in and out of network) for Medicaid beneficiaries in CY 2016 or most recent 12 months.
0 Payment Reform Penetration -Dollars in Categories 3 and 4: Percent of total dollars paid through payment reforms in Categories 3 and 4 in CY 2016 or most recent 12 months.
0
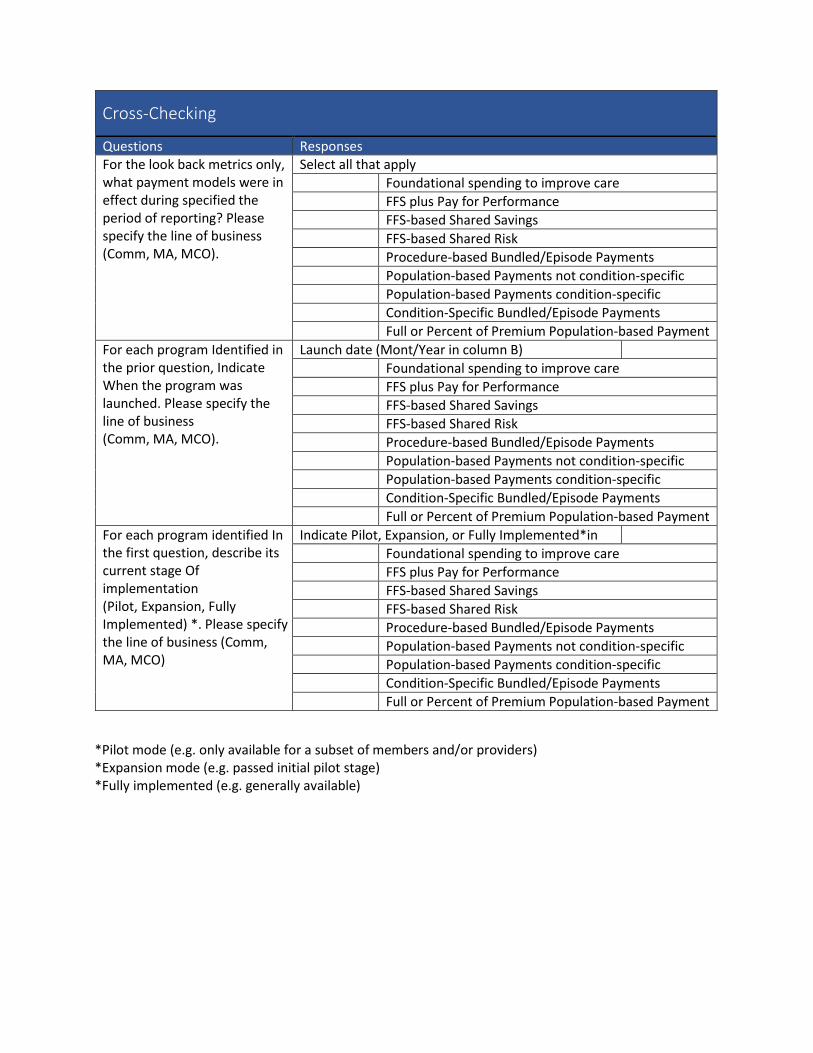
Cross-Checking
Questions Responses For the look back metrics only, what payment models were in effect during specified the period of reporting? Please specify the line of business (Comm, MA, MCO).
Select all that apply Foundational spending to improve care FFS plus Pay for Performance FFS-based Shared Savings FFS-based Shared Risk Procedure-based Bundled/Episode Payments Population-based Payments not condition-specific Population-based Payments condition-specific Condition-Specific Bundled/Episode Payments Full or Percent of Premium Population-based Payment
For each program Identified in the prior question, Indicate When the program was launched. Please specify the line of business (Comm, MA, MCO).
Launch date (Mont/Year in column B) Foundational spending to improve care FFS plus Pay for Performance FFS-based Shared Savings FFS-based Shared Risk Procedure-based Bundled/Episode Payments Population-based Payments not condition-specific Population-based Payments condition-specific Condition-Specific Bundled/Episode Payments Full or Percent of Premium Population-based Payment
For each program identified In the first question, describe its current stage Of implementation (Pilot, Expansion, Fully Implemented) *. Please specify the line of business (Comm, MA, MCO)
Indicate Pilot, Expansion, or Fully Implemented*in Foundational spending to improve care FFS plus Pay for Performance FFS-based Shared Savings FFS-based Shared Risk Procedure-based Bundled/Episode Payments Population-based Payments not condition-specific Population-based Payments condition-specific Condition-Specific Bundled/Episode Payments Full or Percent of Premium Population-based Payment
*Pilot mode (e.g. only available for a subset of members and/or providers) *Expansion mode (e.g. passed initial pilot stage) *Fully implemented (e.g. generally available)

Definitions per the original APM Framework
Note: The revised APM Framework will be published in Summer 2017. For purposes of 2017 measurement, please refer to the original category definitions below. Terms Definitions Alternative Payment Model (APM) Health care payment methods that use financial
incentives to promote or leverage greater value -including higher quality care at lower costs - for patients, purchasers, payers and providers. This definition is specific to this exercise. If you are interested in MACRA's definition, please reference MACRA for more details. APM Framework White Paper MACRA Website
Category 1 Fee-for-service with no link to quality. These payments utilize traditional FFS payments that are not adjusted to account for infrastructure investments, provider reporting of quality data, for provider performance on cost and quality metrics. Diagnosis-related groups (DRGs) that are not linked to quality are in Category 1.
Category 2 Fee-for-service linked to quality. These payments utilize traditional FFS payments, but are subsequently adjusted based on infrastructure investments to improve care or clinical services, whether providers report quality data, or how well they perform on cost and quality metrics.
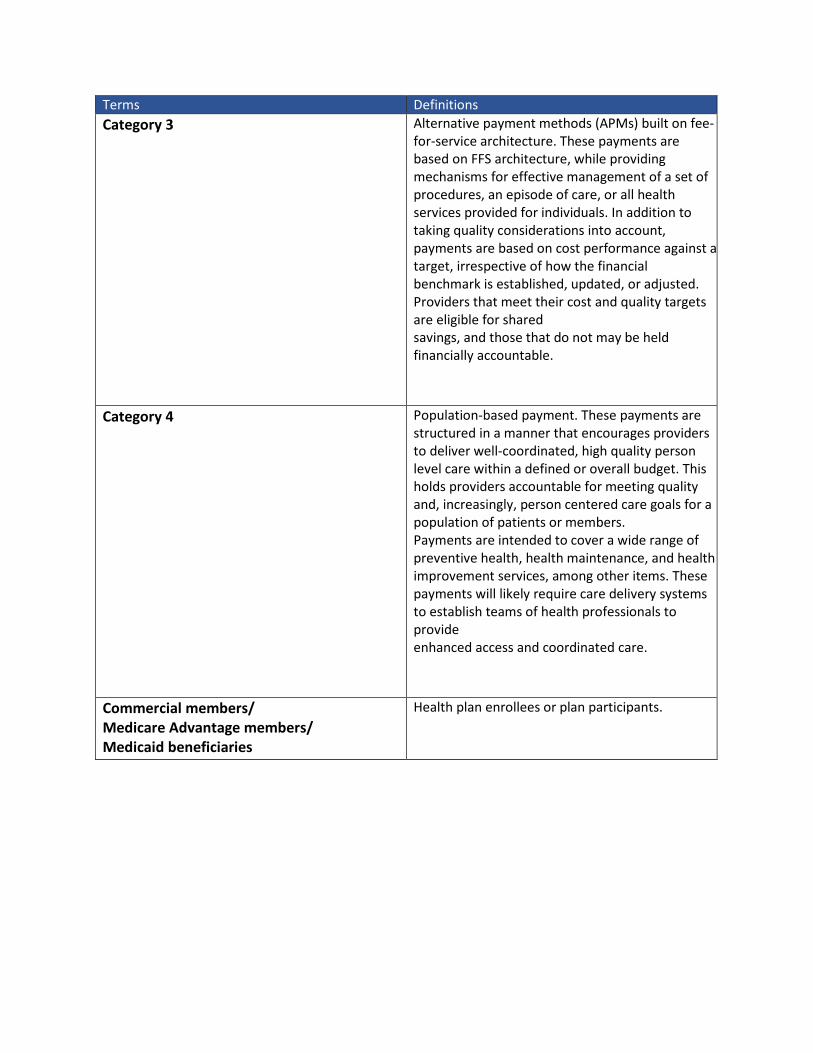
Terms Definitions Category 3 Alternative payment methods (APMs) built on fee-
for-service architecture. These payments are based on FFS architecture, while providing mechanisms for effective management of a set of procedures, an episode of care, or all health services provided for individuals. In addition to taking quality considerations into account, payments are based on cost performance against a target, irrespective of how the financial benchmark is established, updated, or adjusted. Providers that meet their cost and quality targets are eligible for shared savings, and those that do not may be held financially accountable.
Category 4 Population-based payment. These payments are structured in a manner that encourages providers to deliver well-coordinated, high quality person level care within a defined or overall budget. This holds providers accountable for meeting quality and, increasingly, person centered care goals for a population of patients or members. Payments are intended to cover a wide range of preventive health, health maintenance, and health improvement services, among other items. These payments will likely require care delivery systems to establish teams of health professionals to provide enhanced access and coordinated care.
Commercial members/ Medicare Advantage members/ Medicaid beneficiaries
Health plan enrollees or plan participants.

Terms Definitions Condition-specific bundled/episode payments
A single payment to providers and/or health care facilities for all services related to a specific condition (e.g. diabetes). The payment considers the quality, costs, and outcomes for a patient-centered course of care over a longer time period and across care settings. Providers assume financial risk for the cost of services for a particular condition, as well as costs associated with preventable complications. [APM Framework Category 4A]
CY 2016 or most recent 12 months Calendar year 2016 or the most current 12- month period for which the health plan can report payment information. This is the reporting period for which the health plan should report all of its "actual" spend data - a retrospective "look back."
Diagnosis-related groups (DRGs) A clinical category risk adjustment system that uses information about patient diagnoses and selected procedures to identify patients that are expected to have similar costs during a hospital stay - a form of case rate for a hospitalization. Each DRG is assigned a weight that reflects the relative cost of caring for patients in that category relative to other categories and is then multiplied by a conversion factor to establish payment rates.
Fee-for-service Providers receive a negotiated or payer- specified payment rate for every unit of service they deliver without regard to quality, outcomes or efficiency. [APM Framework Category 1]
Foundational spending Includes but is not limited to payments to improve care delivery such as outreach and care coordination/management; after-hour availability; patient communication enhancements; health IT infrastructure use. May come in the form of care/case management fees, medical home payments, infrastructure payments, meaningful use payments and/or per-episode fees for specialists. [APM Framework Category 2A]

Terms Definitions Full or percent of premium population-based payments
A fixed dollar payment to providers for all the care that a patient population may receive in a given time period, such as a month or year, (e.g. inpatient, outpatient, specialists, out-of- network, etc.) with payment adjustments based on measured performance and patient risk. [APM Framework Category 4B]
Legacy payments Payments that utilize traditional payments and are not adjusted to account for infrastructure investments, provider reporting of quality data, or for provider performance on cost and quality metrics. This can include fee-for-service, diagnosis-related groups (DRGs) and per diems. [APM Framework Category 1].
Linked to quality Payments that are set or adjusted based on evidence that providers meet a quality standards or improve care or clinical services, including for providers who report quality data, or providers who meet threshold on cost and quality metrics. The APM Framework does not specify which quality measures qualify for a payment method to be "linked to quality."
Pay for performance The use of incentives (usually financial) to providers to achieve improved performance by increasing the quality of care and/or reducing costs. Incentives are typically paid on top of a base payment, such as fee-for- service or population-based payment. In some cases, if providers do not meet quality of care targets, their base payment is adjusted downward the subsequent year. [APM Framework Categories 2C & 2D].
Population-based payment for conditions A per member per month (PMPM) payment to providers for inpatient and outpatient care that a patient population may receive for a particular condition in a given time period, such as a month or year, including inpatient care and facility fees. [APM Framework Category 4A].
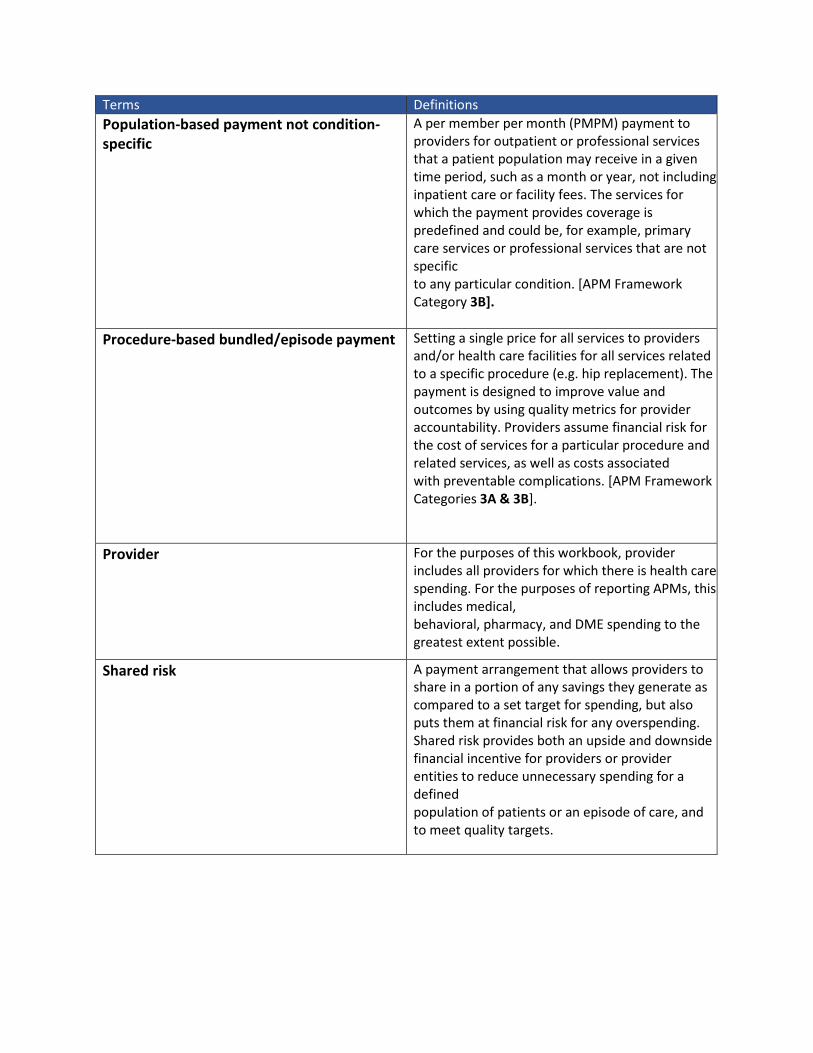
Terms Definitions Population-based payment not condition-specific
A per member per month (PMPM) payment to providers for outpatient or professional services that a patient population may receive in a given time period, such as a month or year, not including inpatient care or facility fees. The services for which the payment provides coverage is predefined and could be, for example, primary care services or professional services that are not specific to any particular condition. [APM Framework Category 3B].
Procedure-based bundled/episode payment Setting a single price for all services to providers and/or health care facilities for all services related to a specific procedure (e.g. hip replacement). The payment is designed to improve value and outcomes by using quality metrics for provider accountability. Providers assume financial risk for the cost of services for a particular procedure and related services, as well as costs associated with preventable complications. [APM Framework Categories 3A & 3B].
Provider For the purposes of this workbook, provider includes all providers for which there is health care spending. For the purposes of reporting APMs, this includes medical, behavioral, pharmacy, and DME spending to the greatest extent possible.
Shared risk A payment arrangement that allows providers to share in a portion of any savings they generate as compared to a set target for spending, but also puts them at financial risk for any overspending. Shared risk provides both an upside and downside financial incentive for providers or provider entities to reduce unnecessary spending for a defined population of patients or an episode of care, and to meet quality targets.
Terms Definitions Shared savings A payment arrangement that allows providers to
share in a portion of any savings they generate as compared to a set target for spending. Shared savings provides an upside only financial incentive for providers or provider entities to reduce unnecessary spending for a defined population of patients or an episode of care, and to meet quality targets.
Total Dollars The total estimated in- and out-of-network health care spend (e.g. annual payment amount) made to providers in calendar year (CY) 2016 or most recent 12 months.