National Dairy Development Dairying In Tamil Nadu Dairy Development Board Dairying in Tamil naDu A...
138
Dairying In Tamil Nadu A Statistical Profile 2014 National Dairy Development Board
Transcript of National Dairy Development Dairying In Tamil Nadu Dairy Development Board Dairying in Tamil naDu A...

Dairying In Tamil Nadu
A Statistical Profile 2014
National Dairy Development
Board

Tamil Nadu
Formation of districts: Census 1991 to 2011

National Dairy Development Board
Dairying in Tamil naDu A Statistical Profile 2014
In this compilation of the statistical profile of the dairy sector in various States, the main landmarks or
highlights are: Trends in human demographics, animal population and production; Inputs for enhancement
of productivity such as breeding, health and nutrition; and Government expenditure, along with supporting
resources.
This review includes statistical tables on selected parameters for each State taken as a whole, along with time-
series data for districts wherever available. Since spatial presentation of data can yield insights not immediately
comprehensible from tables, thematic maps for selected parameters (with data both at a point of time as well
as changes over a period of time) have also been included.
The objective of this publication is to provide a detailed presentation of various parameters, underlying factors,
and their inter-linkages so as to enable effective planning and implementation of development interventions. We
also hope that a wide range of readers, students, researchers, veterinarians, planners, scientists, administrators,
policy makers and academics, as well as other development practitioners and professionals in government
and non-governmental organisations, will find this publication useful for their studies and projects.
Although a wealth of information is available on many aspects of dairying from different sources, it is not only
scattered but also there are inconsistencies on the same aspect in data maintained by different agencies. While
limited data could mean being less informed, extensive information could mean an overload and defeat the
very purpose of organising it. This review, therefore aims at balancing the most comprehensive information with
the most relevant. We sincerely thank government and non-government agencies for providing information.
While extreme care has been taken in juxtaposing data, some errors cannot be ruled out.
This publication “Dairying in Tamil Nadu – A Statistical Profile 2014” is amongst a series of similar publications
for different states being brought out by National Dairy Development Board (NDDB).
Dilip rathManaging Director, NDDB
December 2014Anand, Gujarat
Foreword

National Dairy Development Board
Dairying in Tamil naDu A Statistical Profile 2014
Indexi. gEnEral STaTiSTiCSi.1. Tamil nadu at a glance I.1.1: General Statistics: Tamil Nadu vs. India . . . . . . . . . . . . . . . . . . . . . . . . . . . . . . . . . . . . . . . . . . . . . . . . . . . . . . . . . . . . . . . . .2 I.1.2: Formation of Districts in Tamil Nadu . . . . . . . . . . . . . . . . . . . . . . . . . . . . . . . . . . . . . . . . . . . . . . . . . . . . . . . . . . . . . . . . . . .4 I.1.3: Change in Name of Districts . . . . . . . . . . . . . . . . . . . . . . . . . . . . . . . . . . . . . . . . . . . . . . . . . . . . . . . . . . . . . . . . . . . . . . . . . . .4i.2. Social Statistics: Human Population I.2.1: Human Population by Residence and Sex – 2001 . . . . . . . . . . . . . . . . . . . . . . . . . . . . . . . . . . . . . . . . . . . . . . . . . . . . . . .5 I.2.2: Human Population by Residence and Sex – 2011 . . . . . . . . . . . . . . . . . . . . . . . . . . . . . . . . . . . . . . . . . . . . . . . . . . . . . . .7 I.2.3: Rural Households, Electricity and Tap Water Supply – 2001 and 2011 . . . . . . . . . . . . . . . . . . . . . . . . . . . . . . . . . . .9 I.2.4: District-wise SC and ST Population – 2001 and 2011 . . . . . . . . . . . . . . . . . . . . . . . . . . . . . . . . . . . . . . . . . . . . . . . . . . 11i.3. State Economy I.3.1: Net State Domestic Product (NSDP) and Per Capita Income . . . . . . . . . . . . . . . . . . . . . . . . . . . . . . . . . . . . . . . . . . . 13 I.3.2: Value of Output: Agriculture and Livestock . . . . . . . . . . . . . . . . . . . . . . . . . . . . . . . . . . . . . . . . . . . . . . . . . . . . . . . . . . 15 I.3.3: Revised Budget Estimate for Animal Husbandry Department, Tamil Nadu . . . . . . . . . . . . . . . . . . . . . . . . . . . . . 16 I.3.4: Fund Utilisation Under Rashtriya Krishi Vikas Yojna (RKVY) for Animal Husbandry in Tamil Nadu . . . . . . . . 17 I.3.5: Fund Utilisation Under Rashtriya Krishi Vikas Yojna (RKVY) for Dairying in Tamil Nadu . . . . . . . . . . . . . . . . . . 18
ii. liVESTOCK CEnSuSii.1. animal Population II.1.1: Summary of Livestock Census (1992-2012) - Tamil Nadu . . . . . . . . . . . . . . . . . . . . . . . . . . . . . . . . . . . . . . . . . . . . . . 20 II.1.2: District-wise Total Bovine Population . . . . . . . . . . . . . . . . . . . . . . . . . . . . . . . . . . . . . . . . . . . . . . . . . . . . . . . . . . . . . . . . 21 II.1.3: District-wise Female Population . . . . . . . . . . . . . . . . . . . . . . . . . . . . . . . . . . . . . . . . . . . . . . . . . . . . . . . . . . . . . . . . . . . . . 22 II.1.4: District-wise Breedable Population . . . . . . . . . . . . . . . . . . . . . . . . . . . . . . . . . . . . . . . . . . . . . . . . . . . . . . . . . . . . . . . . . . 23 II.1.5: District-wise In-milk Population . . . . . . . . . . . . . . . . . . . . . . . . . . . . . . . . . . . . . . . . . . . . . . . . . . . . . . . . . . . . . . . . . . . . . 25 II.1.6: District-wise Milch Population . . . . . . . . . . . . . . . . . . . . . . . . . . . . . . . . . . . . . . . . . . . . . . . . . . . . . . . . . . . . . . . . . . . . . . . 26 II.1.7: District-wise Male Population . . . . . . . . . . . . . . . . . . . . . . . . . . . . . . . . . . . . . . . . . . . . . . . . . . . . . . . . . . . . . . . . . . . . . . . 27ii.2. Sex ratio in Dairy animals II.2.1: District-wise Male - Female Ratio. . . . . . . . . . . . . . . . . . . . . . . . . . . . . . . . . . . . . . . . . . . . . . . . . . . . . . . . . . . . . . . . . . . . . 28ii.3. Wet-Dry ratio of Dairy animals II.3.1: District-wise Wet-Dry Ratio . . . . . . . . . . . . . . . . . . . . . . . . . . . . . . . . . . . . . . . . . . . . . . . . . . . . . . . . . . . . . . . . . . . . . . . . . . 29ii.4. livestock Density II.4.1: District-wise Density of Total Livestock and Bovine . . . . . . . . . . . . . . . . . . . . . . . . . . . . . . . . . . . . . . . . . . . . . . . . . . . 30 II.4.2: District-wise Density of Poultry and Small Ruminants . . . . . . . . . . . . . . . . . . . . . . . . . . . . . . . . . . . . . . . . . . . . . . . . 31ii.5. Breed-wise Population II.5.1: District and Breed-wise Population of Indigenous Cattle in Tamil Nadu - 2007 . . . . . . . . . . . . . . . . . . . . . . . . . 33 II.5.2: District-wise Male, Female and Milch Animals of Alambadi and Bargur Breeds - 2007 . . . . . . . . . . . . . . . . . . 34 II.5.3: District-wise Male, Female and Milch Animals of Jellicut and Kangayam Breeds - 2007 . . . . . . . . . . . . . . . . . 35 II.5.4: District-wise Male, Female and Milch Animals of Manapari and Umblacherry Breeds - 2007 . . . . . . . . . . . . 36 II.5.5: District-wise Male, Female and Milch Animals of Other Graded and Non-Descript Indigenous Breeds - 2007 .37 II.5.6: District and Breed-wise Population of Exotic and Crossbred Animals in Tamil Nadu - 2007. . . . . . . . . . . . . . 38 II.5.7: District-wise Male, Female and Milch Animals of Jersey and
Holstein Friesian Exotic and Crossbreds - 2007. . . . . . . . . . . . . . . . . . . . . . . . . . . . . . . . . . . . . . . . . . . . . . . . . . . . . . . . 39 II.5.8: District-wise Male, Female and Milch Animals of Other Exotic and
Crossbreds and Total Exotic and Crossbreds - 2007 . . . . . . . . . . . . . . . . . . . . . . . . . . . . . . . . . . . . . . . . . . . . . . . . . . . 40 II.5.9: District and Breed-wise Population of Buffalo in Tamil Nadu - 2007 . . . . . . . . . . . . . . . . . . . . . . . . . . . . . . . . . . . . 41 II.5.10: District-wise Male, Female and Milch Animals of Murrah and Toda Buffalo Breeds - 2007 . . . . . . . . . . . . . . . 42 II.5.11: District-wise Male, Female and Milch Animals of Other Graded and Non-Descript Buffalo Breeds - 2007 . . 43
iii. CaTTlE anD BuFFalO BrEEDSiii.1. Distribution of native Breeds of Tamil nadu III.1.1: Distribution of Cattle Breeds of Tamil Nadu. . . . . . . . . . . . . . . . . . . . . . . . . . . . . . . . . . . . . . . . . . . . . . . . . . . . . . . . . . . 46 III.1.2: Distribution of Buffalo Breeds of Tamil Nadu . . . . . . . . . . . . . . . . . . . . . . . . . . . . . . . . . . . . . . . . . . . . . . . . . . . . . . . . . 50iii.2. Performance of Breeds III.2.1: Performance of Cattle and Buffalo Breeds . . . . . . . . . . . . . . . . . . . . . . . . . . . . . . . . . . . . . . . . . . . . . . . . . . . . . . . . . . . . 51
iV. milK PrODuCTiOniV.1. Production Performance IV.1.1: Year-wise In-milk Bovine Population, Milk Yield and Milk Production . . . . . . . . . . . . . . . . . . . . . . . . . . . . . . . . . . 54 IV.1.2: Year and District-wise In-milk Bovine Population . . . . . . . . . . . . . . . . . . . . . . . . . . . . . . . . . . . . . . . . . . . . . . . . . . . . . 55 IV.1.3: Year and District-wise In-milk Indigenous Cattle Population . . . . . . . . . . . . . . . . . . . . . . . . . . . . . . . . . . . . . . . . . . 57 IV.1.4: Year and District-wise In-milk Crossbred Cattle Population . . . . . . . . . . . . . . . . . . . . . . . . . . . . . . . . . . . . . . . . . . . 59 IV.1.5: Year and District-wise In-milk Buffalo Population . . . . . . . . . . . . . . . . . . . . . . . . . . . . . . . . . . . . . . . . . . . . . . . . . . . . . 61

National Dairy Development Board
Dairying in Tamil naDu A Statistical Profile 2014
iV.2. Production Performance: milk yield IV.2.1: Year and District-wise Bovine Milk Yield . . . . . . . . . . . . . . . . . . . . . . . . . . . . . . . . . . . . . . . . . . . . . . . . . . . . . . . . . . . . . . 63 IV.2.2: Year and District-wise Indigenous Cattle Milk Yield . . . . . . . . . . . . . . . . . . . . . . . . . . . . . . . . . . . . . . . . . . . . . . . . . . . 65 IV.2.3: Year and District-wise Crossbred Cattle Milk Yield . . . . . . . . . . . . . . . . . . . . . . . . . . . . . . . . . . . . . . . . . . . . . . . . . . . . 67 IV.2.4: Year and District-wise Buffalo Milk Yield . . . . . . . . . . . . . . . . . . . . . . . . . . . . . . . . . . . . . . . . . . . . . . . . . . . . . . . . . . . . . . 69iV.3. Production Performance: milk Production IV.3.1: Year and District-wise Bovine Milk Production . . . . . . . . . . . . . . . . . . . . . . . . . . . . . . . . . . . . . . . . . . . . . . . . . . . . . . . . 71 IV.3.2: Year and District-wise Indigenous Cattle Milk Production . . . . . . . . . . . . . . . . . . . . . . . . . . . . . . . . . . . . . . . . . . . . . 73 IV.3.3: Year and District-wise Crossbred Cattle Milk Production . . . . . . . . . . . . . . . . . . . . . . . . . . . . . . . . . . . . . . . . . . . . . . 75 IV.3.4: Year and District-wise Buffalo Milk Production . . . . . . . . . . . . . . . . . . . . . . . . . . . . . . . . . . . . . . . . . . . . . . . . . . . . . . . 77 IV.3.5: Year and District-wise Milk Production Density . . . . . . . . . . . . . . . . . . . . . . . . . . . . . . . . . . . . . . . . . . . . . . . . . . . . . . . 83iV.4. Production Performance: milk availability IV.4.1: Year and District-wise Per Capita Milk Availability. . . . . . . . . . . . . . . . . . . . . . . . . . . . . . . . . . . . . . . . . . . . . . . . . . . . . 85iV.5. Production Performance: milk utilisation IV.5.1: Milk Utilisation Pattern in Households (1993-94 to 2012-13) . . . . . . . . . . . . . . . . . . . . . . . . . . . . . . . . . . . . . . . . . . 87 V. VETErinary inFraSTruCTurE anD SErViCE DEliVEry SySTEmV.1. Veterinary infrastructure V.1.1: Year and District-wise Veterinary Institutes . . . . . . . . . . . . . . . . . . . . . . . . . . . . . . . . . . . . . . . . . . . . . . . . . . . . . . . . . . . 90 V.1.2: District-wise AI Centres – Government Agencies . . . . . . . . . . . . . . . . . . . . . . . . . . . . . . . . . . . . . . . . . . . . . . . . . . . . . 91 V.1.3: District-wise AI Centres – Cooperatives. . . . . . . . . . . . . . . . . . . . . . . . . . . . . . . . . . . . . . . . . . . . . . . . . . . . . . . . . . . . . . . 92 V.1.4: District-wise AI Centres Established by Private AI Workers of TNLDA . . . . . . . . . . . . . . . . . . . . . . . . . . . . . . . . . . . 93V.2. Service Delivery System - artificial insemination V.2.1: District-wise AI Performed by Government Agencies – Cattle . . . . . . . . . . . . . . . . . . . . . . . . . . . . . . . . . . . . . . . . . 95 V.2.2: District-wise AI Performed by Government Agencies – Buffaloes . . . . . . . . . . . . . . . . . . . . . . . . . . . . . . . . . . . . . . 96 V.2.3: District-wise AI Performed by Government Agencies – Bovine . . . . . . . . . . . . . . . . . . . . . . . . . . . . . . . . . . . . . . . . 97 V.2.4: District-wise AI Performed by Cooperatives - Cattle . . . . . . . . . . . . . . . . . . . . . . . . . . . . . . . . . . . . . . . . . . . . . . . . . . 98 V.2.5: District-wise AI Performed by Cooperatives - Buffaloes . . . . . . . . . . . . . . . . . . . . . . . . . . . . . . . . . . . . . . . . . . . . . . . 99 V.2.6: District-wise AI Performed by Cooperatives - Bovine . . . . . . . . . . . . . . . . . . . . . . . . . . . . . . . . . . . . . . . . . . . . . . . . 101V.3. Service Delivery System - animal Health V.3.1: District-wise Vaccination Performed for Foot-and-Mouth Disease by Government of Tamil Nadu . . . . . . 102 V.3.2: District-wise Vaccination Performed for Haemorrhagic Septicaemia by Government of Tamil Nadu . . . 103 V.3.3: District-wise Vaccination Performed for Black Quarter by Government of Tamil Nadu . . . . . . . . . . . . . . . . . 104 V.3.4: District-wise Bovine Vaccination . . . . . . . . . . . . . . . . . . . . . . . . . . . . . . . . . . . . . . . . . . . . . . . . . . . . . . . . . . . . . . . . . . . . 105 V.3.5: District-wise Bovine Treated . . . . . . . . . . . . . . . . . . . . . . . . . . . . . . . . . . . . . . . . . . . . . . . . . . . . . . . . . . . . . . . . . . . . . . . . 106 V.3.6: District-wise Bovine Castration . . . . . . . . . . . . . . . . . . . . . . . . . . . . . . . . . . . . . . . . . . . . . . . . . . . . . . . . . . . . . . . . . . . . . 107
Vi. FEED rESOurCESVi.1. Feed resources - Fodder VI.1.1: Area under Fodder Crops and Gross Sown Area . . . . . . . . . . . . . . . . . . . . . . . . . . . . . . . . . . . . . . . . . . . . . . . . . . . . . 110 VI.1.2: District-wise Irrigated and Unirrigated Area under Jowar Fodder Crop . . . . . . . . . . . . . . . . . . . . . . . . . . . . . . . 111Vi.2. Feed resources - availability vs. requirement VI.2.1: District-wise Dry Matter (DM) Availability, Requirement and Balance . . . . . . . . . . . . . . . . . . . . . . . . . . . . . . . . . 113 VI.2.2: Availability, Requirement and Surplus/Deficit of Feed Nutrient . . . . . . . . . . . . . . . . . . . . . . . . . . . . . . . . . . . . . . . 115Vi.3. Feed resources - Consumption VI.3.1: Feed and Fodder Consumption – By Animal . . . . . . . . . . . . . . . . . . . . . . . . . . . . . . . . . . . . . . . . . . . . . . . . . . . . . . . . . 115
Vii. agriCulTurEVii.1. agro-Climatic Zones VII.1.1: Details of Agro-Climatic Zones. . . . . . . . . . . . . . . . . . . . . . . . . . . . . . . . . . . . . . . . . . . . . . . . . . . . . . . . . . . . . . . . . . . . . . 118Vii.2. land use Pattern VII.2.1: District-wise Land Use Pattern . . . . . . . . . . . . . . . . . . . . . . . . . . . . . . . . . . . . . . . . . . . . . . . . . . . . . . . . . . . . . . . . . . . . . . 121Vii.3. area and Production VII.3.1: District-wise Area under Crops and Production of Cereals and Pulses. . . . . . . . . . . . . . . . . . . . . . . . . . . . . . . . . 122 VII.3.2: District-wise Area under Crops and Production of Food Grains and Oilseeds. . . . . . . . . . . . . . . . . . . . . . . . . . 123 VII.3.3: District-wise Area under Crops and Production of Sugarcane and Cotton. . . . . . . . . . . . . . . . . . . . . . . . . . . . . 124Vii.4. land Holding and Water resources VII.4.1: Operational Holdings in Tamil Nadu . . . . . . . . . . . . . . . . . . . . . . . . . . . . . . . . . . . . . . . . . . . . . . . . . . . . . . . . . . . . . . . . 125 VII.4.2: Net Irrigated Area under Different Sources of Irrigation . . . . . . . . . . . . . . . . . . . . . . . . . . . . . . . . . . . . . . . . . . . . . 125 VII.4.3: Major River Basins of Tamil Nadu . . . . . . . . . . . . . . . . . . . . . . . . . . . . . . . . . . . . . . . . . . . . . . . . . . . . . . . . . . . . . . . . . . . 125 VII.4.4: Medium River Basins of Tamil Nadu – West-Flowing Rivers with Catchment Area . . . . . . . . . . . . . . . . . . . . . 127Vii.5. rainfall VII.5.1: District- wise Average Annual Rainfall . . . . . . . . . . . . . . . . . . . . . . . . . . . . . . . . . . . . . . . . . . . . . . . . . . . . . . . . . . . . . . 128Vii.6. ground Water Status VII.6.1: Distribution of Blocks According to Ground Water Status . . . . . . . . . . . . . . . . . . . . . . . . . . . . . . . . . . . . . . . . . . . . 130
glOSSary . . . . . . . . . . . . . . . . . . . . . . . . . . . . . . . . . . . . . . . . . . . . . . . . . . . . . . . . . . . . . . . . . . . . . . . . . . . . . . . . . . . . . . . . . . . . . . . . . . . . . . 131

Part I : General Statistics
The state of Tamil Nadu has been one of the largest economy in the country. Of late, a range of local factors like water for irrigation, electricity for industry, agitations etc. have restrained growth rate in the GDP. With phenomenal growth in the tertiary sector, the reliance on agriculture and allied sector has reduced considerably, with the percentage share of NSDP from agriculture and allied sector declined to as low as 7.5 per cent in 2013-14. The Livestock sub-sector is emerging as the mainstay for rural population of Tamil Nadu with its share to the agriculture & allied sector GDP has increased to 34 per cent in 2013-14.
According to the Census of India 2011, the population of the state grew by 15 per cent during the decade ending 2011 and touched at 7.2 crore. Tamil Nadu is one of the most urbanised states and the seventh most populous state in the country. The Chennai Metropolitan Region and other northern districts have about one-third of the state’s population. The Scheduled Caste population accounts for one-fifth of the total population. The literacy rate has been much above national average and the male-female literacy gap has narrowed down. The sex ratio improved from 986 female per 1,000 males in 2001 census to 996 in 2011 census and was higher than national average of 943.

2
Dairying in Tamil naDu A Statistical Profile 2014 Part I : General Statistics
National Dairy Development Board
I.1. Tamil Nadu at a Glance
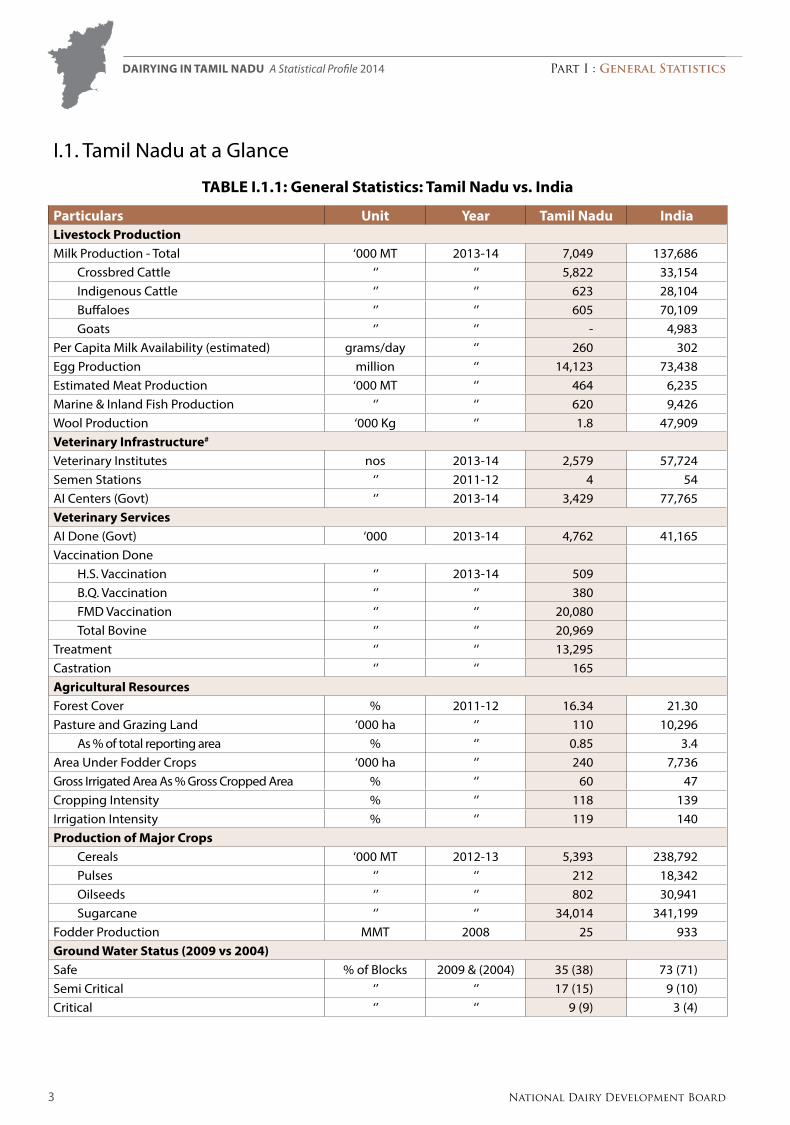
TaBlE i.1.1: general Statistics: Tamil nadu vs. india
Particulars unit year Tamil nadu indiaState geography & rural infrastructureGeographical Area ‘000 sq. km 2011 130.1 3,287.3Districts nos 2011 32 640Sub-Districts ‘’ ‘’ 215 5,924Villages ‘000 ‘’ 15.9 640.9Households million ‘’ 18.5 249.4rural Households
2001 ‘000 2001 8,284 137,4142011 ‘’ 2011 9,528 168,565
rural Households with Electricity 2001 % 2001 71 442011 ‘’ 2011 91 55
rural Households with Tap water supply2001 % 2001 60 242011 ‘’ 2011 80 31
Human PopulationPopulation million 2011 72.1 1,210.1
Urban (As % of total) % ‘’ 48.4 31.2Rural (As % of total) ‘’ ‘’ 51.6 68.8
Density of Population per sq. km ‘’ 555 382Scheduled Castes (As % of total) % ‘’ 20.0 16.6Scheduled Tribes (As % of total) ‘’ ‘’ 1.1 8.6Sex Ratio Ratio ‘’ 996 943literacy rate (excluding population of 0 to 6 age group)
Male % 2011 86.8 80.9Female ‘’ ‘’ 73.4 64.6Urban ‘’ ‘’ 87.0 84.1Rural ‘’ ‘’ 73.5 67.8
Per Capita Income (at current prices) ` 2012-13 98,550 69,585livestock Population million 2012 22.7 512.0Bovine ‘’ ‘’ 9.6 299.9
Indigenous Cattle ‘’ ‘’ 2.5 151.2Crossbred Cattle ‘’ ‘’ 6.4 39.7Buffaloes ‘’ ‘’ 0.8 108.7
Small Ruminants ‘’ ‘’ 12.9 200.2Poultry ‘’ ‘’ 117.3 729.2livestock Population million 2007 30.8 529.7Bovine ‘’ ‘’ 13.2 304.8
Indigenous Cattle ‘’ ‘’ 3.8 166.0Crossbred Cattle ‘’ ‘’ 7.3 33.1Buffaloes ‘’ ‘’ 2.0 105.3
Small Ruminants ‘’ ‘’ 17.2 212.1Poultry ‘’ ‘’ 128.1 648.9Number of Major Cattle Breeds nos ‘’ 3 30Number of Major Buffalo Breeds “ ‘’ 1 12
3
Dairying in Tamil naDu A Statistical Profile 2014 Part I : General Statistics
National Dairy Development Board
I.1. Tamil Nadu at a Glance
TaBlE i.1.1: general Statistics: Tamil nadu vs. india
Particulars unit year Tamil nadu indialivestock ProductionMilk Production - Total ‘000 MT 2013-14 7,049 137,686
Crossbred Cattle ‘’ ‘’ 5,822 33,154Indigenous Cattle ‘’ ‘’ 623 28,104Buffaloes ‘’ ‘’ 605 70,109Goats ‘’ ‘’ - 4,983
Per Capita Milk Availability (estimated) grams/day ‘’ 260 302Egg Production million ‘’ 14,123 73,438Estimated Meat Production ‘000 MT ‘’ 464 6,235Marine & Inland Fish Production ‘’ ‘’ 620 9,426Wool Production ‘000 Kg ‘’ 1.8 47,909Veterinary infrastructure#
Veterinary Institutes nos 2013-14 2,579 57,724Semen Stations ‘’ 2011-12 4 54AI Centers (Govt) ‘’ 2013-14 3,429 77,765Veterinary Services AI Done (Govt) ‘000 2013-14 4,762 41,165Vaccination Done
H.S. Vaccination ‘’ 2013-14 509B.Q. Vaccination ‘’ ‘’ 380FMD Vaccination ‘’ ‘’ 20,080Total Bovine ‘’ ‘’ 20,969
Treatment ‘’ ‘’ 13,295Castration ‘’ ‘’ 165agricultural resourcesForest Cover % 2011-12 16.34 21.30Pasture and Grazing Land ‘000 ha ‘’ 110 10,296
As % of total reporting area % ‘’ 0.85 3.4Area Under Fodder Crops ‘000 ha ‘’ 240 7,736Gross Irrigated Area As % Gross Cropped Area % ‘’ 60 47Cropping Intensity % ‘’ 118 139Irrigation Intensity % ‘’ 119 140Production of major Crops
Cereals ‘000 MT 2012-13 5,393 238,792Pulses ‘’ ‘’ 212 18,342Oilseeds ‘’ ‘’ 802 30,941Sugarcane ‘’ ‘’ 34,014 341,199
Fodder Production MMT 2008 25 933ground Water Status (2009 vs 2004)Safe % of Blocks 2009 & (2004) 35 (38) 73 (71)Semi Critical ‘’ ‘’ 17 (15) 9 (10)Critical ‘’ ‘’ 9 (9) 3 (4)

4
Dairying in Tamil naDu A Statistical Profile 2014 Part I : General Statistics
National Dairy Development Board
I.1. Tamil Nadu at a Glance
TaBlE i.1.1: general Statistics: Tamil nadu vs. india
Particulars unit year Tamil nadu indiaOver Exploited % of Blocks 2009 & (2004) 36 (37) 14 (15)Salinity Affected ‘’ ‘’ 3 (2) 1(1)
# Figures for India are for 2011-12.SourceS: census 2001 & 2011, office of the registrar General and census commissioner, Govt. of India, New Delhi.
18th and 19th Livestock census, Department of Animal Husbandry, Dairying and Fisheries, Ministry of Agriculture, Govt. of India. Minutes of the Meeting of Technical committee on Direction for improvement of Animal Husbandry Statistics held during 24th to 25th July, 2014, Department of Animal Husbandry, Dairying and Fisheries, Ministry of Agriculture, Govt. of India. Dynamic Ground Water resources of India as on 31st March, 2009, central Ground Water Board, Ministry of Water resources, Govt. of India.Directorate of economics and Statistics, Ministry of Agriculture, Govt. of India.Ministry of Statistics and Programme Implementation, Govt. of India.
TaBlE i.1.2: Formation of Districts in Tamil nadu
new Districts year of Formation Carved out ofDharmapuri 1965 SalemPudukkottai 1974 Tiruchirappalli and ThanjavurErode 1979 CoimbatoreSivaganga 1985 RamanathapuramDindigul 1985 MaduraiThoothukkudi 1986 TirunelveliVirudhunagar 1987 RamanathapuramTiruvannamalai 1989 VelloreNagapattinam 1991 ThanjavurCuddalore 1993 South ArcotViluppuram 1993 South ArcotKarur 1995 TiruchirappalliPerambalur 1995 TiruchirappalliTheni 1996 MaduraiKancheepuram 1997 Chengalpattu MGRThiruvallur 1997 Chengalpattu MGRThiruvarur 1997 ThanjavurNamakkal 1997 SalemAriyalur 2001, 2007 PerambalurKrishnagiri 2004 DharmapuriTiruppur 2009 Coimbatore and Erode
Source: District Administration websites of Govt. of Tamil Nadu.
TaBlE i.1.3: Change in name of Districts
Old name new nameKamarajar VirudhunagarMadras ChennaiPasumpon Muthuramalinga Thevar SivagangaPeriyar ErodeTirunelveli-Kattabomman TirunelveliTiruvannamalai-Sambuvarayar TiruvannamalaiChidambaranar ThoothukkudiNorth Arcot Ambedkar VelloreAnna Dindigul
Source: District Administration websites of Govt. of Tamil Nadu.

5
Dairying in Tamil naDu A Statistical Profile 2014 Part I : General Statistics
National Dairy Development Board
I.2. Social Statistics: Human Population
TaBlE i.2.1: Human Population by residence and Sex –2001
Districtsrural (‘000) urban (‘000) Total (‘000)
male Female Total male Female Total male Female Total
Tamil naDu 17,531 17,390 34,922 13,869 13,615 27,484 31,401 31,005 62,406
Ariyalur 308 309 617 39 40 79 347 349 696
Chennai 0 0 0 2,220 2,124 4,344 2,220 2,124 4,344
Coimbatore 735 717 1,452 1,441 1,379 2,820 2,176 2,096 4,272
Cuddalore 772 759 1,531 379 375 754 1,151 1,134 2,285
Dharmapuri 1240 1,160 2,400 233 222 456 1,474 1,383 2,856
Dindigul 629 621 1,250 339 334 673 968 955 1,923
Erode 705 682 1,388 604 590 1,194 1,309 1,272 2,582
Kancheepuram 676 666 1,343 781 754 1,535 1,457 1,420 2,877
Kanniyakumari 290 293 582 543 551 1,094 832 844 1,676
Karur 311 314 624 155 157 311 466 470 936
Madurai 573 561 1,134 730 714 1,444 1,303 1,275 2,578
Nagapattinam 576 583 1,159 163 167 330 739 750 1,489
Namakkal 482 466 948 277 268 545 760 734 1,493
Perambalur 207 208 414 39 40 79 246 248 494
Pudukkottai 601 611 1,211 124 125 248 724 735 1,460
Ramanathapuram 433 452 885 150 152 302 583 604 1,188
Salem 852 774 1,626 711 679 1,390 1,564 1,453 3,016
Sivaganga 405 424 829 162 164 326 567 588 1,155
Thanjavur 726 741 1,468 370 378 749 1,097 1,120 2,216
The Nilgiris 152 156 308 226 228 455 378 384 762
Theni 255 247 502 298 294 592 553 541 1,094
Thiruvallur 629 626 1,255 768 732 1,500 1,397 1,357 2,755
Thiruvarur 464 469 932 117 120 237 581 589 1,169
Thoothukkudi 439 468 908 328 337 665 767 805 1,572
Tiruchirappalli 639 641 1,279 570 569 1,139 1,209 1,210 2,418
Tirunelveli 689 727 1,416 645 663 1,308 1,334 1,390 2,724
Tiruvannamalai 896 890 1,785 200 201 401 1,096 1,090 2,186
Vellore 1,088 1,081 2,169 653 655 1,308 1,741 1,736 3,477
Viluppuram 1,277 1,256 2,533 215 212 427 1,492 1,468 2,960
Virudhunagar 483 491 974 388 390 777 870 881 1,751
Source: census 2001, office of the registrar General and census commissioner, Govt. of India, New Delhi.

6
Dairying in Tamil naDu A Statistical Profile 2014 Part I : General Statistics
National Dairy Development Board

7
Dairying in Tamil naDu A Statistical Profile 2014 Part I : General Statistics
National Dairy Development Board
I.2. Social Statistics: Human Population
TaBlE i.2.2: Human Population by residence and Sex –2011
Districtsrural (‘000) urban (‘000) Total (‘000)
male Female Total male Female Total male Female TotalTamil naDu 18,679 18,551 37,230 17,459 17,459 34,917 36,138 36,009 72,147
Ariyalur 333 338 671 41 42 84 375 380 755
Chennai 0 0 0 2,336 2,311 4,647 2,336 2,311 4,647
Coimbatore 419 420 839 1,310 1,309 2,619 1,729 1,729 3,458
Cuddalore 869 852 1,721 443 442 885 1,312 1,294 2,606
Dharmapuri 643 603 1,246 131 130 261 774 733 1,507
Dindigul 679 673 1,352 402 406 808 1,081 1,079 2,160
Erode 552 541 1,094 577 581 1,158 1,130 1,122 2,252
Kancheepuram 735 725 1,460 1,278 1,260 2,538 2,013 1,985 3,998
Kanniyakumari 165 166 331 761 778 1,540 926 944 1,870
Karur 313 317 630 216 219 435 528 536 1,064
Krishnagiri 742 709 1,451 218 211 428 960 920 1,880
Madurai 601 590 1,191 925 922 1,847 1,526 1,512 3,038
Nagapattinam 619 632 1,252 179 186 365 798 818 1,616
Namakkal 521 510 1,030 349 348 696 869 857 1,727
Perambalur 234 234 468 48 49 97 282 283 565
Pudukkottai 646 656 1,302 158 159 316 803 815 1,618
Ramanathapuram 475 468 943 208 203 411 683 671 1,353
Salem 883 825 1,708 898 876 1,774 1,782 1,700 3,482
Sivaganga 462 464 926 206 206 413 669 670 1,339
Thanjavur 765 789 1,555 417 434 851 1,182 1,223 2,406
The Nilgiris 146 154 300 214 221 436 360 375 735
Theni 291 285 575 335 336 670 626 620 1,246
Thiruvallur 650 649 1,300 1,226 1,203 2,428 1,876 1,852 3,728
Thiruvarur 500 507 1,006 127 131 258 627 638 1,264
Thoothukkudi 430 443 873 435 442 877 865 885 1,750
Tiruchirappalli 689 696 1,384 664 674 1,338 1,352 1,370 2,722
Tirunelveli 769 788 1,557 752 768 1,520 1,521 1,556 3,077
Tiruppur 479 479 958 767 754 1,521 1,246 1,233 2,479
Tiruvannamalai 990 980 1,970 246 249 495 1,236 1,229 2,465
Vellore 1,117 1,117 2,234 845 857 1,702 1,962 1,975 3,936
Viluppuram 1,481 1,458 2,940 259 260 519 1,741 1,718 3,459
Virudhunagar 480 482 962 487 493 980 968 975 1,942
Source: census 2011, office of the registrar General and census commissioner, Govt. of India, New Delhi.

8
Dairying in Tamil naDu A Statistical Profile 2014 Part I : General Statistics
National Dairy Development Board
% Decadal growth rate of Population 1991-2001 2001-2011
Sex ratio (all age groups) 2001 2011
Population Density 2001 2011

9
Dairying in Tamil naDu A Statistical Profile 2014 Part I : General Statistics
National Dairy Development Board
I.2. Social Statistics: Human Population
TaBlE i.2.3: rural Households, Electricity and Tap Water Supply - 2001 and 2011
Districtsrural Households (‘000) rural Households with
Electricity (‘000)
rural Households with Tap Water (inclusive –
treated & untreated)( ‘000)
2001 2011 2001 2011 2001 2011Tamil naDu 8,284 9,528 5,890 8,683 5,005 7,581
Ariyalur 148 176 96 158 107 153
Chennai 0 0 0 0 0 0
Coimbatore 388 242 272 214 273 201
Cuddalore 348 423 259 400 223 345
Dharmapuri 537 310 368 276 244 171
Dindigul 306 351 192 305 196 281
Erode 383 324 280 283 210 238
Kancheepuram 302 361 229 335 214 307
Kanniyakumari 131 85 96 82 55 65
Karur 159 168 111 153 99 142
Krishnagiri 343 307 258
Madurai 277 315 195 288 192 281
Nagapattinam 272 323 166 298 87 201
Namakkal 256 283 191 257 142 206
Perambalur 103 124 78 112 72 103
Pudukkottai 258 310 160 281 131 233
Ramanathapuram 202 229 128 200 73 134
Salem 405 452 298 400 206 322
Sivaganga 193 235 137 214 101 159
Thanjavur 334 391 214 353 206 319
The Nilgiris 77 83 54 77 52 67
Theni 127 157 89 145 107 147
Thiruvallur 290 332 222 307 227 296
Thiruvarur 223 262 137 242 100 197
Thoothukkudi 225 235 177 220 144 202
Tiruchirappalli 308 357 210 322 214 310
Tirunelveli 352 419 284 397 229 382
Tiruppur 283 254 219
Tiruvannamalai 404 473 296 438 276 403
Vellore 483 537 351 491 295 453
Viluppuram 545 679 413 632 354 567
Virudhunagar 250 265 185 245 177 221
Source: census 2001 and 2011, office of the registrar General and census commissioner, Govt. of India, New Delhi.

10
Dairying in Tamil naDu A Statistical Profile 2014 Part I : General Statistics
National Dairy Development Board
rural Households 2001 2011
rural Households with Electricity 2001 2011
rural Households with Tap Water 2001 2011

11
Dairying in Tamil naDu A Statistical Profile 2014 Part I : General Statistics
National Dairy Development Board
I.2. Social Statistics: Human Population
TaBlE i.2.4: District-wise SC and ST Population – 2001 and 2011
DistrictsSC Population (‘000) ST Population (‘000)
2001 2011 2001 2011Tamil naDu 11,858 14,438 651 795
Ariyalur 151 176 9 11
Chennai 598 780 7 10
Coimbatore 631 536 29 28
Cuddalore 634 764 12 16
Dharmapuri 417 245 60 63
Dindigul 376 452 6 8
Erode 422 369 18 22
Kancheepuram 722 948 27 41
Kanniyakumari 68 74 5 7
Karur 190 221 1 1
Krishnagiri 267 22
Madurai 323 409 6 11
Nagapattinam 441 510 3 4
Namakkal 281 345 51 57
Perambalur 149 175 3 3
Pudukkottai 249 285 1 1
Ramanathapuram 216 249 1 1
Salem 476 581 104 119
Sivaganga 189 228 1 1
Thanjavur 400 455 4 4
The Nilgiris 238 236 28 33
Theni 212 258 2 2
Thiruvallur 601 822 38 47
Thiruvarur 378 431 3 3
Thoothukkudi 289 348 3 5
Tiruchirappalli 399 467 19 18
Tirunelveli 481 570 8 10
Tiruppur 396 5
Tiruvannamalai 468 565 73 91
Vellore 714 860 63 73
Viluppuram 811 1,016 64 75
Virudhunagar 332 400 2 2
SC: Scheduled caste, ST: Scheduled Tribe Source: census 2001 and 2011, office of the registrar General and census commissioner, Govt. of India, New Delhi.

12
Dairying in Tamil naDu A Statistical Profile 2014 Part I : General Statistics
National Dairy Development Board
urbanisation (%) 2001 2011
literacy rate 2001 2011
Scheduled Caste and Scheduled Tribe Population (%) 2001 2011

13
Dairying in Tamil naDu A Statistical Profile 2014 Part I : General Statistics
National Dairy Development Board
I.3. State Economy
TaBlE i.3.1: net State Domestic Product (nSDP) and Per Capita income
Sectorat Current Prices (` crores)
2004-05 2005-06 2006-07 2007-08 2008-09 2009-10 2010-11 2011-12 2012-13 2013-14
State Domestic Product 193,645 228,846 276,711 313,812 359,391 430,013 527,912 600,461 671,192 769,476
1. Agriculture 19,461 23,494 29,425 33,562 37,394 51,288 64,909 72,350 67,450 83,470
2. Forestry & Logging 1,643 2,093 2,963 3,129 4,153 4,568 6,168 6,430 6,821 7,238
3. Fishing 1,461 2,361 2,451 2,469 2,849 3,457 3,611 3,631 3,656 3,734
4. Agriculture & Allied (1+2+3)
22,564 27,948 34,839 39,159 44,396 59,310 74,688 82,411 77,929 94,443
As % of NSDP 11.65 12.21 12.59 12.48 12.35 13.79 14.15 13.72 11.61 12.27
Sub-total of Primary 23,908 29,299 36,448 40,870 46,494 61,510 77,290 85,473 81,421 98,343
As % of NSDP 12.35 12.80 13.17 13.02 12.94 14.30 14.64 14.23 12.13 12.78
Sub-total of Secondary 54,189 64,484 78,262 87,639 92,260 116,361 146,944 169,304 191,866 205,670
As % of NSDP 27.98 28.18 28.28 27.93 25.67 27.06 27.84 28.20 28.59 26.73
Services 115,549 135,063 162,001 185,304 220,637 252,141 303,677 345,684 397,905 465,462
As % of NSDP 59.67 59.02 58.55 59.05 61.39 58.64 57.52 57.57 59.28 60.49
Per Capita income (`) 30,062 35,243 42,288 47,606 54,137 64,338 78,473 88,697 98,550 112,331
Sectorat 2004-05 Prices (` crores)
2004-05 2005-06 2006-07 2007-08 2008-09 2009-10 2010-11 2011-12 2012-13 2013-14
State Domestic Product 193,645 221,588 256,286 272,340 286,744 316,760 359,961 386,768 402,603 428,739
1. Agriculture 194,61 21,787 25,299 23,925 23,085 24,577 26,342 29,138 25,629 27,917
2. Forestry & Logging 1,643 1,734 1,717 1,765 1,743 1,799 1,854 1,877 1,953 2,030
3. Fishing 1,461 2,073 2,106 1,938 1,918 1,968 2,181 2,256 2,277 2,295
4. Agriculture & Allied (1+2+3)
22,564 25,593 29,122 27,627 26,745 28,344 30,377 33,270 29,859 32,241
As % of NSDP 11.65 11.55 11.36 10.14 9.33 8.95 8.44 8.60 7.42 7.52
Sub-total of Primary 23,908 26,839 30,388 28,904 27,897 29,568 31,705 34,767 31,431 33,862
As % of NSDP 12.35 12.11 11.86 10.61 9.73 9.33 8.81 8.99 7.81 7.90
Sub-total of Secondary 54,189 624,83 70,868 73,945 71,655 87,395 102,551 109,155 114,883 117,220
As % of NSDP 27.98 28.20 27.65 27.15 24.99 27.59 28.49 28.22 28.54 27.34
Services 115,549 132,266 155,031 169,491 187,192 199,797 225,706 242,846 256,289 277,657
As % of NSDP 59.67 59.69 60.49 62.24 65.28 63.08 62.70 62.79 63.66 64.76
Per Capita income (`) 30,062 34,126 39,166 41,314 43,193 47,394 53,507 57,131 59,113 62,589
Source: Ministry of Statistics and Programme Implementation, Govt. of India.NoTe: This estimates are as on 01-03-2014.

14
Dairying in Tamil naDu A Statistical Profile 2014 Part I : General Statistics
National Dairy Development Board

15
Dairying in Tamil naDu A Statistical Profile 2014 Part I : General Statistics
National Dairy Development Board
I.3. State Economy
TaBlE i.3.2: Value of Output: agriculture and livestock
item at Current Prices
2004-05 2005-06 2006-07 2007-08 2008-09 2009-10 2010-11 Value of Output (` billion)Agriculture & Allied 323.22 390.12 518.69 529.03 622.38 785.63 971.04
Agriculture 192.83 235.24 289.65 314.23 358.95 457.01 555.91Livestock 89.79 96.35 115.35 141.54 173.28 223.28 300.10
Milk 54.21 60.00 68.97 81.60 93.59 110.89 128.97Meat 18.34 18.76 24.06 33.25 45.11 63.59 116.54Egg 7.48 6.40 9.44 11.86 14.34 22.04 20.94Dung 5.16 5.68 6.71 7.29 8.88 11.99 13.69Others^ 4.61 5.51 6.17 7.54 11.36 14.78 19.96
Share of Value of Output to agriculture and allied (%)Agriculture 59.66 60.30 55.84 59.40 57.67 58.17 57.25Livestock 27.78 24.70 22.24 26.75 27.84 28.42 30.91
Share of Value of Output to livestock Output (%)Milk 60.37 62.27 59.79 57.65 54.01 49.66 42.98Meat 20.42 19.47 20.86 23.49 26.03 28.48 38.83Egg 8.33 6.64 8.18 8.38 8.27 9.87 6.98Dung 5.74 5.89 5.82 5.15 5.12 5.37 4.56Others^ 5.13 5.72 5.35 5.33 6.56 6.62 6.65
item at Constant Prices (2004-05)
2004-05 2005-06 2006-07 2007-08 2008-09 2009-10 2010-11 Value of Output (` billion)Agriculture & Allied 323.22 359.89 402.72 387.17 408.00 409.65 442.42
Agriculture 192.83 214.78 249.46 233.1 228.26 226.08 238.49Livestock 89.79 94.89 102.76 105.55 121.98 131.06 149.42
Milk 54.21 60.00 60.87 61.12 72.05 73.44 73.92Meat 18.34 16.76 20.66 21.6 24.23 27.77 45.47Egg 7.48 7.24 9.36 9.76 10.25 12.62 11.40Dung 5.16 5.54 5.81 6.30 6.34 7.34 7.77Others^ 4.61 5.36 6.06 6.75 9.11 9.88 10.86
Share of Value of Output to agriculture and allied (%)Agriculture 59.66 59.68 61.94 60.21 55.95 55.19 53.91Livestock 27.78 26.37 25.52 27.26 29.9 31.99 33.77
Share of Value of Output to livestock Output (%)Milk 60.37 63.23 59.23 57.91 59.07 56.04 49.47Meat 20.42 17.66 20.11 20.47 19.86 21.19 30.43Egg 8.33 7.63 9.11 9.25 8.40 9.63 7.63Dung 5.74 5.84 5.65 5.97 5.20 5.60 5.20Others^ 5.13 5.65 5.90 6.40 7.47 7.54 7.27
^ Wool and Hair, Silkworm cocoons & Honey, Increment in Stock.Source: Ministry of Statistics and Programme Implementation, Govt. of India.

16
Dairying in Tamil naDu A Statistical Profile 2014 Part I : General Statistics
National Dairy Development Board
I.3. State Economy
TaBlE i.3.3: revised Budget Estimate for animal Husbandry Department, Tamil nadu
activitiesrevised Estimate (` crore)
2007-08 2008-09 2009-10 2010-11 2011-12 2012-13
Veterinary Services and Animal Health 100.48 133.05 144.8 182.16 210.45 224.19
Veterinary Hospitals and Dispensaries 82.84 111.10 133.34 162.67 172.89 200.83
Institute of Veterinary Preventive Medicine 3.55 4.99 5.16 6.22 6.65 5.63
rinderpest eradication Programme 1.01 1.02 1.01 1.25 1.19 1.15
establishment of ADIu 2.46 3.38 3.83 4.51 4.60 5.23
other Items 10.62 12.56 1.46 7.51 25.12 11.35
Direction, Supervision and Policy Formation 21.80 37.21 27.38 33.93 34.80 43.00
Cattle Development 21.73 30.22 25.83 42.33 117.41 107.28
Poultry Development 2.27 2.89 1.69 2.03 2.43 3.01
Sheep Development 2.15 3.33 2.63 3.30 97.75 142.28
Piggery Development 0.83 0.71 0.80 0.68 0.42 0.43
Fodder Development 0.49 0.80 0.62 1.46 16.72 25.78
Tribal Development 0.00 0.00 0.00 0.00 0.00 2.42
Extension and Training 0.06 0.07 0.06 0.02 0.07 0.06
Special Central Assistance Scheme 0.52 0.70 0.65 0.85 56.43 71.30
Externally Aided Project 3.57 3.84 3.45 5.17 11.26 10.10
General Education 0.32 0.32 0.00 0.33 0.36 0.09
Hill Area Development 0.48 0.62 0.80 0.22 0.25 1.32
Agriculture Research Education Training 54.73 60.69 80.04 104.31 139.49 166.70
Loan and Advance 0.00 0.00 0.00 0.00 0.30 0.22
Capital Outlay on Animal Husbandry 11.29 4.01 2.76 1.87 34.31 81.24
Capital on Agriculture 0.00 0.00 0.00 0.00 0.00 0.03
Secretariat 4.02 4.64 4.20 4.65 4.60 4.21
Public Works 1.75 1.83 1.81 1.90 22.00 25.00
Source: Directorate of Animal Husbandry and Veterinary Services, Govt. of Tamil Nadu.

17
Dairying in Tamil naDu A Statistical Profile 2014 Part I : General Statistics
National Dairy Development Board
I.3. State Economy
TaBlE i.3.4: Fund utilisation under rashtriya Krishi Vikas yojna (rKVy) for animal Husbandry in Tamil nadu
ParametersFund utilisation (` Crore)
2008-09 2009-10 2010-11 2011-12 2012-13 2013-14 grand Total
Fodder Development/Azolla Cultivation 5.77 0.50 0.17 15.89 13.17 35.50
Creation of Mobile Diagnostic Lab/ Mobile Input Units for Animal Health/Novel Diagnostic and Vaccine Delivery/Up gradation of Vaccine Production Lab/Coolers of Vaccine Storage
4.11 4.45 1.99 7.82 15.99 34.35
Genetic Upgradation and Development of Livestock/ Small Ruminants/Supply of Goat to SHG
0.85 6.33 3.11 3.36 4.50 10.46 28.62
Improving Animal Husbandry Practices/Delivery of Vet Services in Villages 14.78 14.78
Buffalo Calves Development/Genetic up gradation of cattle and Buffalo/Enhancement of Fertility of cow/Establishment of Jersey CB Bull farm
3.20 1.56 0.96 3.79 4.30 13.81
Establishment of Ultra Sound Scanning Facilities 8.82 8.82
Others 0.50 1.56 6.10 8.16
Establishment of Liquid Nitrogen Plant 5.5 5.50
Establishment of mother unit cum hatchery unit in TAPCO lands 4.76 4.76
Identification and Traceability of Breedable Bovine 2.18 2.18
Empowering women through Animal Husbandry 3.55 3.55
Piggery Development 3.26 3.26
Establishment of Mineral Mixture Manufacturing /By-pass Protein Supplement Manufacturing Unit/Supply of Mineral Mix-ture/Manufacturing of Feed Blocks
1.44 0.50 1.94
Controlling Diseases of Poultry 3.04 3.04
Strengthening of Frozen Semen Bank 0.38 2.29 2.67
PC Based Collection Stations/Skill Development for technical staff/Study tour to farmers
1.83 0.23 2.06
Chaff Cutter and Silos 0.66 0.70 1.36
Total Outlay 20.04 13.54 7.46 49.87 64.16 19.28 177.44*
Source: rashtriya Krishi Vikas Yojana, Department of Agriculture and cooperation, Ministry of Agriculture, Govt. of India.Accessed on 20th November 2014 from http://rkvymis.dacnet.nic.in/(S(b45m3vuag0dywcmrhs12x2g5))/reports/SectorWiseApprovedcost.aspx.
* Includes ` 3.08 crore utilised during 2007-08.

18
Dairying in Tamil naDu A Statistical Profile 2014 Part I : General Statistics
National Dairy Development Board
I.3. State Economy
TaBlE i.3.5: Fund utilisation under rashtriya Krishi Vikas yojna (rKVy) for Dairying in Tamil nadu
ParametersFund utilisation (` Crore)
2007-08 2008-09 2009-10 2010-11 2011-12 2012-13 2013-14 grand Total
Setting-up/ strengthening of milk products plant 14.99 6.50 16.47 37.96
Others 1.05 8.54 13.92 23.51
Setting-up/ strengthening of BMC 1.00 4.00 2.90 7.90
Induction of animals/breed improvement/animal rearing 1.62 4.59 6.21
Setting-up/strengthening of dairy plant 4.78 0.50 5.28
Capacity building 0.81 1.21 3.10 5.12
Support for dairy development/ milk production/ procurement 3.98 3.98
Setting-up/ strengthening of dairy farms/ units 0.70 3.10 3.81
Providing AMCU/ milking machine 2.02 0.70 0.60 3.32
Setting-up/ strengthening of clean milk infrastructure 2.22 0.10 0.40 2.72
Support for milk marketing 0.70 1.21 1.91
Total Outlay 6.67 1.50 3.26 1.00 36.11 27.63 25.54 101.72
Source: rashtriya Krishi Vikas Yojana, Department of Agriculture and cooperation, Ministry of Agriculture, Govt. of India.Accessed on 20th November 2014 from http://rkvymis.dacnet.nic.in/(S(b45m3vuag0dywcmrhs12x2g5))/reports/SectorWiseApprovedcost.aspx.

Part II : Livestock Census
The ‘19th Livestock Census -2012’ shows an overall 27 per cent decline in the total bovine population in Tamil Nadu at 9.6 million as compared to the previous census of 2007. The decline in population has been registered across all categories like indigenous cattle, crossbred cattle and buffalo. The sharpest fall of 61 per cent was seen in total buffalo population followed by a fall in indigenous cattle by 35 per cent and crossbred cattle by 14 per cent. Crossbred cattle constituted more than 65 per cent of the total bovine population of the state.
The sex ratio figures of 2012 census reveal increase in the number of females across all categories as compared to the males. The number of females increased from 81 per cent in 2007 to 86 per cent in 2012 for crossbred cattle, 65 per cent to 70 per cent for indigenous cattle and 75 per cent to 87 per cent for buffaloes.
The drop in the number of milch animals (in-milk and dry, cows and buffaloes combined), was 15 per cent from 5.1 million in 2007 to 4.4 million in 2012. The number of animals in-milk has decreased from 3.6 million to 3.1 million showing a drop of 12 per cent. The proportion of in-milk animals to milch population continued to remain above 65 per cent.
At the time of publication of this document, district-wise figures of ‘19th Livestock Census-2012’ were not available for the state of Tamil Nadu. The contents would be revised and uploaded on NDDB’s Knowledge Portal in due course of time.

20
Dairying in Tamil naDu A Statistical Profile 2014 Part II : Livestock Census
National Dairy Development Board
II.1. Animal Population
TaBlE ii.1.1: Summary of livestock Census (1992-2012) - Tamil nadu
Populationlivestock Census
1992 1997 2003 2007 2012
Total Bovine 12,477,704 11,787,719 10,799,458 13,197,711 9,594,473
Total Cattle 9,275,264 9,046,456 9,141,043 11,188,709 8,814,042
Total Exotic/Crossbred Cattle 1,834,733 3,505,567 5,139,944 7,382,678 6,354,494
Female 1,361,615 2,445,311 4,147,354 5,982,589 5,467,646
under 1 year 315,469 547,761 865,528 1,425,879 1,140,730
1 to 2.5 years 201,128 385,262 692,883 1,052,210 915,908
In-milk 505,640 987,963 1,664,934 2,233,705 2,302,985
Dry 218,317 387,633 687,559 837,767 779,993
Milch 723,957 1,375,596 2,352,493 3,071,467 3,082,978
Not Calved Even Once 76,360 91,848 167,129 305,635 254,052
Others 44,701 44,844 69,321 127,393 73,978
Males 473,118 1,060,256 992,590 1,400,089 886,848
Total Indigenous Cattle 7,440,531 5,540,889 4,001,099 3,806,031 2,459,548
Female 4,089,732 3,224,270 2,402,310 2,457,681 1,723,004
under 1 year 814,321 659,386 430,932 527,866 326,481
1 to 3 years 658,884 547,867 443,533 458,305 322,688
In-milk 1,420,151 1,235,744 831,827 842,894 615,592
Dry 808,226 559,983 509,445 397,538 298,386
Milch 2,228,377 1,795,727 1,341,272 1,240,432 913,978
Not Calved Even Once 264,370 129,675 124,096 157,741 116,686
Others 123,780 91,615 62,477 73,337 43,171
Males 3,350,799 2,316,619 1,598,789 1,348,350 736,544
Total Buffaloes 3,202,440 2,741,263 1,658,415 2,009,002 780,431
Female 2,733,982 2,234,949 1,390,199 1,513,863 680,151
under 1 year 558,197 496,930 263,127 319,705 129,722
1 to 3 years 369,872 349,401 225,671 258,971 127,588
In-milk 978,562 908,106 518,392 551,583 264,565
Dry 441,800 373,503 274,455 254,494 112,985
Milch 1,420,362 1,281,609 792,847 806,077 377,550
Not Calved Even Once 131,479 78,775 69,712 93,788 34,805
Others 254,072 28,234 38,842 35,322 10,486
Males 468,458 506,314 268,216 495,139 100,280
Source: 15th, 16th, 17th, 18th and 19th Livestock census, Department of Animal Husbandry, Dairying and Fisheries, Ministry of Agriculture, Govt. of India.
21
Dairying in Tamil naDu A Statistical Profile 2014 Part II : Livestock Census
National Dairy Development Board
II.1. Animal Population
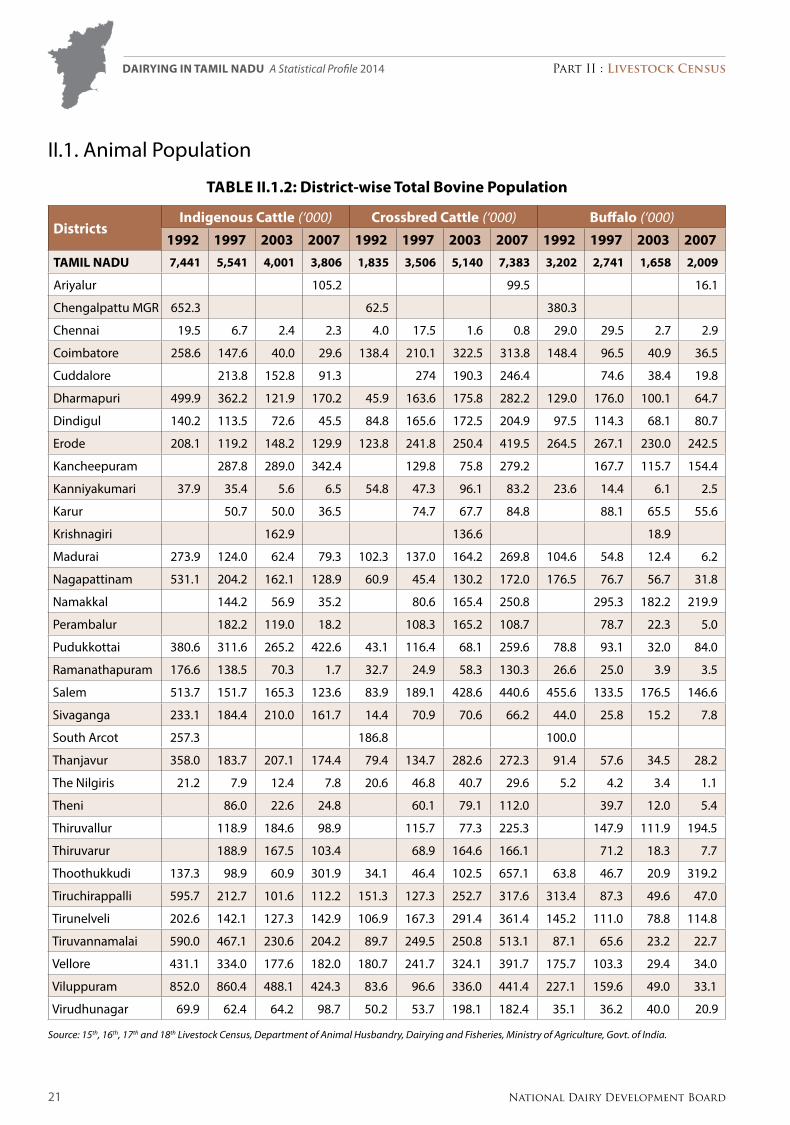
TaBlE ii.1.2: District-wise Total Bovine Population
Districtsindigenous Cattle (‘000) Crossbred Cattle (‘000) Buffalo (‘000)
1992 1997 2003 2007 1992 1997 2003 2007 1992 1997 2003 2007Tamil naDu 7,441 5,541 4,001 3,806 1,835 3,506 5,140 7,383 3,202 2,741 1,658 2,009
Ariyalur 105.2 99.5 16.1
Chengalpattu MGR 652.3 62.5 380.3
Chennai 19.5 6.7 2.4 2.3 4.0 17.5 1.6 0.8 29.0 29.5 2.7 2.9
Coimbatore 258.6 147.6 40.0 29.6 138.4 210.1 322.5 313.8 148.4 96.5 40.9 36.5
Cuddalore 213.8 152.8 91.3 274 190.3 246.4 74.6 38.4 19.8
Dharmapuri 499.9 362.2 121.9 170.2 45.9 163.6 175.8 282.2 129.0 176.0 100.1 64.7
Dindigul 140.2 113.5 72.6 45.5 84.8 165.6 172.5 204.9 97.5 114.3 68.1 80.7
Erode 208.1 119.2 148.2 129.9 123.8 241.8 250.4 419.5 264.5 267.1 230.0 242.5
Kancheepuram 287.8 289.0 342.4 129.8 75.8 279.2 167.7 115.7 154.4
Kanniyakumari 37.9 35.4 5.6 6.5 54.8 47.3 96.1 83.2 23.6 14.4 6.1 2.5
Karur 50.7 50.0 36.5 74.7 67.7 84.8 88.1 65.5 55.6
Krishnagiri 162.9 136.6 18.9
Madurai 273.9 124.0 62.4 79.3 102.3 137.0 164.2 269.8 104.6 54.8 12.4 6.2
Nagapattinam 531.1 204.2 162.1 128.9 60.9 45.4 130.2 172.0 176.5 76.7 56.7 31.8
Namakkal 144.2 56.9 35.2 80.6 165.4 250.8 295.3 182.2 219.9
Perambalur 182.2 119.0 18.2 108.3 165.2 108.7 78.7 22.3 5.0
Pudukkottai 380.6 311.6 265.2 422.6 43.1 116.4 68.1 259.6 78.8 93.1 32.0 84.0
Ramanathapuram 176.6 138.5 70.3 1.7 32.7 24.9 58.3 130.3 26.6 25.0 3.9 3.5
Salem 513.7 151.7 165.3 123.6 83.9 189.1 428.6 440.6 455.6 133.5 176.5 146.6
Sivaganga 233.1 184.4 210.0 161.7 14.4 70.9 70.6 66.2 44.0 25.8 15.2 7.8
South Arcot 257.3 186.8 100.0
Thanjavur 358.0 183.7 207.1 174.4 79.4 134.7 282.6 272.3 91.4 57.6 34.5 28.2
The Nilgiris 21.2 7.9 12.4 7.8 20.6 46.8 40.7 29.6 5.2 4.2 3.4 1.1
Theni 86.0 22.6 24.8 60.1 79.1 112.0 39.7 12.0 5.4
Thiruvallur 118.9 184.6 98.9 115.7 77.3 225.3 147.9 111.9 194.5
Thiruvarur 188.9 167.5 103.4 68.9 164.6 166.1 71.2 18.3 7.7
Thoothukkudi 137.3 98.9 60.9 301.9 34.1 46.4 102.5 657.1 63.8 46.7 20.9 319.2
Tiruchirappalli 595.7 212.7 101.6 112.2 151.3 127.3 252.7 317.6 313.4 87.3 49.6 47.0
Tirunelveli 202.6 142.1 127.3 142.9 106.9 167.3 291.4 361.4 145.2 111.0 78.8 114.8
Tiruvannamalai 590.0 467.1 230.6 204.2 89.7 249.5 250.8 513.1 87.1 65.6 23.2 22.7
Vellore 431.1 334.0 177.6 182.0 180.7 241.7 324.1 391.7 175.7 103.3 29.4 34.0
Viluppuram 852.0 860.4 488.1 424.3 83.6 96.6 336.0 441.4 227.1 159.6 49.0 33.1
Virudhunagar 69.9 62.4 64.2 98.7 50.2 53.7 198.1 182.4 35.1 36.2 40.0 20.9
Source: 15th, 16th, 17th and 18th Livestock census, Department of Animal Husbandry, Dairying and Fisheries, Ministry of Agriculture, Govt. of India.

22
Dairying in Tamil naDu A Statistical Profile 2014 Part II : Livestock Census
National Dairy Development Board
II.1. Animal Population
TaBlE ii.1.3: District-wise Female Population
Districtsindigenous Cattle (‘000) Crossbred Cattle (‘000) Buffalo (‘000)
1992 1997 2003 2007 1992 1997 2003 2007 1992 1997 2003 2007Tamil naDu 4,090 3,224 2,402 2,458 1,362 2,445 4,147 5,983 2,734 2,235 1,390 1,514
Ariyalur 68.1 84.0 12.9
Chengalpattu MGR 370.2 36.3 320.4
Chennai 17.2 5.9 1.6 1.9 3.8 15.8 1.0 0.5 26.8 27.8 1.7 1.9
Coimbatore 144.2 88.3 18.1 13.8 95.4 158.0 278.7 254.4 130.7 85.9 36.3 29.9
Cuddalore 126.2 94.7 72.0 193.3 152.9 190.5 58.8 30.8 15.4
Dharmapuri 319.2 224.6 75.5 120.1 38.8 113.2 149.8 249.6 117.4 138.4 88.6 56.2
Dindigul 66.2 65.3 40.3 30.1 56.6 111.8 145.1 188.3 76.9 92.1 59.9 70.3
Erode 126.5 67.8 99.5 80.9 79.6 152.5 191.4 341.1 238.2 213.9 202.7 181.9
Kancheepuram 165.4 172.5 231.3 73.7 56.6 220.0 123.4 91.8 119.6
Kanniyakumari 28.1 29.5 3.9 4.7 48.0 37.5 78.9 74.1 16.8 10.5 4.1 1.8
Karur 32.3 34.7 26.2 54.2 57.0 77.6 72.9 57.9 49.4
Krishnagiri 103.8 123.0 16.5
Madurai 155.7 72.4 37.6 51.9 86.0 103.7 135.8 250.1 88.7 47.5 10.1 5.2
Nagapattinam 321.5 136.4 118.7 90.4 47.8 33.8 103.7 141.2 145.4 63.9 45.1 25.2
Namakkal 76.9 32.7 23.6 66.6 141.7 206.4 268.7 160.7 177.1
Perambalur 99.2 72.8 8.7 74.4 138.6 72.6 63.7 19.3 2.8
Pudukkottai 187.8 164.6 149.7 256.1 31.7 73.7 44.8 192.7 64.4 78.0 22.3 57.1
Ramanathapuram 88.3 76.8 46.0 0.5 25.6 18.8 44.5 103.5 21.7 20.1 2.9 2.5
Salem 248.8 90.4 104.2 74.3 67.0 133.7 369.9 375.6 435.6 114.3 156.6 113.6
Sivaganga 108.3 102.7 125.7 109.1 10.2 43.4 51.5 54.6 32.9 18.3 11.2 6.0
South Arcot 139.4 131.1 86.9
Thanjavur 195.3 109.4 124.6 103.9 62.4 78.3 191.9 222.7 75.3 48.0 28.6 22.3
The Nilgiris 18.4 6.5 10.1 6.3 18.9 39.4 34.5 24.8 4.2 3.1 2.7 0.9
Theni 46.0 12.9 14.3 47.0 67.7 106.5 33.9 8.9 4.1
Thiruvallur 69.9 121.7 54.9 74.7 58.1 127.4 126.1 90.2 108.6
Thiruvarur 127.1 112.6 67.9 54.7 133.5 137.6 57.1 14.4 6.2
Thoothukkudi 81.8 65.3 37.9 242.5 27.8 33.6 80.4 525.7 46.4 33.3 16.2 241.3
Tiruchirappalli 338.7 127.9 68.3 67.6 115.7 90.8 202.6 264.7 262.9 73.0 42.8 38.4
Tirunelveli 118.2 92.4 87.6 101.8 81 125.8 236.6 271.6 120.2 89.0 62.8 83.0
Tiruvannamalai 287.4 241.1 107.6 110.1 62.7 158.9 189.3 430.1 75.4 53.8 16.6 16.8
Vellore 249.2 191.0 90.8 105.3 136.8 177.0 275.1 339.9 146.9 77.4 24.9 25.7
Viluppuram 445.5 480.2 255.8 255.5 57.9 61.3 256.1 303.4 168.5 111.4 33.9 23.7
Virudhunagar 34.0 42.9 40.5 63.6 40.5 45.8 156.7 151.3 31.6 30.7 29.8 14.0
Source: 15th, 16th, 17th and 18th Livestock census, Department of Animal Husbandry, Dairying and Fisheries, Ministry of Agriculture, Govt. of India.

23
Dairying in Tamil naDu A Statistical Profile 2014 Part II : Livestock Census
National Dairy Development Board
II.1. Animal Population
TaBlE ii.1.4: District-wise Breedable Population
Districtsindigenous Cattle (‘000) Crossbred Cattle (‘000) Buffalo (‘000)
1992 1997 2003 2007 1992 1997 2003 2007 1992 1997 2003 2007Tamil naDu 2,946 2,291 1,750 1,701 946 1,705 2,935 4,031 1,991 1,563 1,014 1,065
Ariyalur 48.4 54.8 9.0
Chengalpattu MGR 282.3 26.1 251.3
Chennai 13.1 3.5 1.3 1.6 3.0 9.7 0.9 0.4 21.9 17.1 1.6 1.5
Coimbatore 98.0 59.4 13.4 9.6 59.8 106.1 203.0 175.4 87.5 56.8 26.7 21.2
Cuddalore 89.2 68.5 45.4 135.9 108.9 121.5 40.4 22.5 10.3
Dharmapuri 242.2 159.4 56.5 85.4 27.7 79.0 105.7 166.3 82.0 94.9 63.8 37.2
Dindigul 44.5 48.5 30.3 21.3 40.2 78.0 97.4 123.9 53.7 64.8 42.3 47.5
Erode 84.9 46.0 70.7 54.0 54.6 102.9 134.6 225.8 156.0 144.6 145.4 122.6
Kancheepuram 117.6 125.7 164.6 53.6 41.7 150.0 94.7 69.1 86.2
Kanniyakumari 19.3 21.3 2.6 3.4 32.4 27.1 55.8 49.7 12.3 8.1 3.0 1.3
Karur 22.8 24.7 17.4 37.4 39.0 49.6 48.8 40.0 33.1
Krishnagiri 81.5 89.0 12.4
Madurai 107.2 51.7 28.5 36.1 59.7 71.3 97.4 163.9 61.7 32.9 7.8 3.8
Nagapattinam 224.8 89.2 83.3 61.8 33.0 23.2 69.0 94.6 100.2 42.3 33.5 17.0
Namakkal 53.9 23.7 16.7 47.0 98.5 138.1 171.1 115.4 118.6
Perambalur 73.3 52.1 5.8 52.7 93.7 47.8 47.5 13.8 1.8
Pudukkottai 130.0 119.2 109.2 174.3 21.8 52.3 33.0 125.9 45.4 57.6 16.6 39.6
Ramanathapuram 64.4 55.6 33.1 0.4 16.6 13.8 31.1 70.6 15.3 15.2 2.2 1.8
Salem 180.4 63.7 76.0 50.6 46.1 91.9 262.2 251.8 310.1 81.6 112.6 77.1
Sivaganga 73.8 70.3 88.7 72.7 6.4 28.9 35.1 35.4 21.7 12.7 9.1 4.2
South Arcot 102.3 94.3 72.8
Thanjavur 134.7 75.8 92.2 70.6 43.1 53.9 132.7 150.4 54.2 34.5 21.6 15.6
The Nilgiris 11.4 5.5 7.9 4.8 12.2 31.7 26.9 16.4 2.9 2.4 2.0 0.7
Theni 35.5 9.1 10.7 32.2 47.3 71.2 24.4 6.5 2.9
Thiruvallur 54.5 90.3 45.9 55.9 43.4 109.3 98.5 69.9 94.5
Thiruvarur 92.8 77.5 46.8 39.0 92.3 91.2 41.2 10.4 4.4
Thoothukkudi 57.5 46.9 27.3 151.8 18.9 24.9 57.1 327.0 33.0 25.4 12.1 163.4
Tiruchirappalli 239.1 87.7 47.2 47.4 79.6 60.8 145.6 179.4 191.4 50.4 29.7 26.3
Tirunelveli 79.7 63.7 64.2 79.3 56.0 85.6 167.5 206.1 83.7 62.0 45.8 68.4
Tiruvannamalai 197.9 173.8 77.8 78.1 42.6 114.6 132.9 295.3 55.1 38.6 12.3 10.4
Vellore 186.2 133.9 65.6 73.6 100.6 123.1 201.4 227.0 113.4 55.4 18.8 17.9
Viluppuram 349.2 346.7 189.9 180.2 44.7 41.8 179 211.2 144.0 78.0 25.0 16.6
Virudhunagar 23.4 29.6 30.6 42.6 26.2 30.7 113.4 100.6 21.2 21.3 22.2 9.7
Source: 15th, 16th, 17th and 18th Livestock census, Department of Animal Husbandry, Dairying and Fisheries, Ministry of Agriculture, Govt. of India.

24
Dairying in Tamil naDu A Statistical Profile 2014 Part II : Livestock Census
National Dairy Development Board

25
Dairying in Tamil naDu A Statistical Profile 2014 Part II : Livestock Census
National Dairy Development Board
II.1. Animal Population
TaBlE ii.1.5: District-wise in-milk Population
Districtsindigenous Cattle (‘000) Crossbred Cattle (‘000) Buffalo (‘000)
1992 1997 2003 2007 1992 1997 2003 2007 1992 1997 2003 2007Tamil naDu 1,420 1,236 832 843 506 988 1,665 2,234 979 908 518 552
Ariyalur 22.6 29.4 4.7
Chengalpattu MGR 142.0 12.2 132.6
Chennai 9.5 2.9 1.1 1.0 2.1 7.4 0.7 0.3 16.7 14.0 1.3 1.0
Coimbatore 55.4 35.1 6.8 5.4 34.3 62.2 115.1 101.6 53.5 33.8 13.7 12.2
Cuddalore 51.0 32.0 22.2 69.3 56.2 62.1 24.8 11.3 4.7
Dharmapuri 90.8 62.5 19.4 35.7 12.7 39.2 58.8 92.3 45.7 48.1 31.0 20.4
Dindigul 16.4 25.0 12.9 10.1 22.6 45.8 58.8 72.2 23.6 38.0 22.6 25.4
Erode 41.4 26.3 35.2 25.9 28.7 59.5 76.6 119.3 87.6 85.8 73.8 61.4
Kancheepuram 69.3 54.3 80.9 32.1 21.6 81.6 60.2 32.8 46.3
Kanniyakumari 9.8 14.7 1.2 1.5 19.5 20.5 38.0 30.4 7.8 5.9 2.0 0.7
Karur 11.0 13.9 10.7 17.9 22.2 30.6 27.2 22.7 20.0
Krishnagiri 35.1 54.0 6.3
Madurai 63.3 27.5 14.0 18.2 36.1 43.2 58.5 110.0 34.9 18.6 4.6 2.3
Nagapattinam 107.5 58.6 38.1 31.7 17.3 13.1 33.2 49.7 53.9 27.3 15.1 9.5
Namakkal 30.5 11.7 9.8 26.3 55.5 75.1 87.8 59.3 62.8
Perambalur 36.4 24.9 3.0 26.0 56.4 25.8 21.0 7.0 0.8
Pudukkottai 64.2 52.1 54.4 86.0 12.0 25.1 18.5 67.4 23.4 26.7 8.3 20.0
Ramanathapuram 35.5 33.2 18.7 0.2 8.2 10.7 18.9 36.4 7.3 8.7 1.3 0.9
Salem 92.5 40.0 33.1 23.5 25.1 57.8 142.2 136.5 151.5 52.3 57.0 38.7
Sivaganga 38.8 39.1 42.2 38.9 3.4 16.2 20.0 21.8 12.1 6.9 3.0 2.0
South Arcot 48.7 43.1 22.1
Thanjavur 69.4 40.3 52.4 35.9 24.0 29.1 68.7 85.1 27.0 18.4 12.4 8.8
The Nilgiris 6.3 4.6 4.8 1.9 7.3 22.2 18.2 10.7 1.3 1.7 1.1 0.3
Theni 23.2 5.0 5.3 21.0 28.7 47.3 15.0 3.3 1.8
Thiruvallur 40.4 43.4 18.2 38.0 24.2 46.5 72.2 36.3 38.3
Thiruvarur 49.3 41.6 24.5 21.3 52.3 50.7 23.3 5.5 2.5
Thoothukkudi 27.6 26.5 14.2 90.7 9.1 15.2 35.7 195.4 18.1 14.7 6.6 89.6
Tiruchirappalli 111.6 49.5 21.5 23.1 41.1 34.6 76.6 99.1 85.3 26.6 15.4 13.3
Tirunelveli 44.4 39.3 37.9 39.5 32.8 48.6 101.2 107.6 51.0 38.5 25.9 33.1
Tiruvannamalai 109.4 87.6 36.5 35.7 25.5 62.5 79.7 145.9 23.5 18.5 6.1 5.8
Vellore 89.6 79.6 31.1 34.2 52.9 78.7 114.5 136.6 49.8 35.2 9.3 10.2
Viluppuram 133.1 162.6 78.8 84.1 19.9 25.8 92.9 107.2 37.7 43.4 11.8 8.4
Virudhunagar 12.7 17.5 15.9 22.2 15.7 18.6 67.1 59.3 12.2 13.1 11.1 5.4
Source: 15th, 16th, 17th and 18th Livestock census, Department of Animal Husbandry, Dairying and Fisheries, Ministry of Agriculture, Govt. of India.

26
Dairying in Tamil naDu A Statistical Profile 2014 Part II : Livestock Census
National Dairy Development Board
II.1. Animal Population
TaBlE ii.1.6: District-wise milch Population
Districtsindigenous Cattle (‘000) Crossbred Cattle (‘000) Buffalo (‘000)
1992 1997 2003 2007 1992 1997 2003 2007 1992 1997 2003 2007Tamil naDu 2,228 1,796 1,341 1,240 724 1,376 2,353 3,072 1,420 1,282 793 806
Ariyalur 37.6 41.6 7.0
Chengalpattu MGR 207.9 16.4 194.7
Chennai 10.7 3.1 1.2 1.2 2.5 8.1 0.8 0.3 19.2 14.8 1.5 1.2
Coimbatore 79.4 49.9 10.3 7.1 48.6 87.5 159.5 135.1 72.5 46.5 19.8 16.9
Cuddalore 71.8 52.0 31.5 106.2 85.3 87.6 33.6 17.7 7.4
Dharmapuri 169.2 114.8 44.3 59.3 19.1 57.7 88.8 128.7 67.9 72.9 53.3 29.5
Dindigul 30.7 37.4 23.8 16.2 33.8 66.1 79.4 98.0 37.0 55.9 33.6 36.3
Erode 67.6 37.5 52.0 37.5 45.0 87.0 104.6 169.7 130.7 123.3 105.9 91.0
Kancheepuram 92.9 93.4 118.9 42.9 31.3 112.7 78.2 52.6 64.8
Kanniyakumari 15.2 17.3 1.8 2.5 24.7 23.3 48.3 38.6 9.8 6.7 2.6 1.0
Karur 17.1 20.5 14.8 28.8 31.7 41.2 39.5 33.4 27.8
Krishnagiri 62.3 72.8 9.8
Madurai 88.1 40.4 21.8 25.7 49.5 59.6 78.2 133.3 49.0 25.8 6.4 2.8
Nagapattinam 180.4 75.0 64.5 47.2 25.7 18.6 54.1 71.1 80.7 35.9 26.9 13.0
Namakkal 46.4 18.6 12.9 39.6 80.4 107.6 145.1 93.9 90.8
Perambalur 60.7 43.0 4.2 43.0 78.4 36.0 38.3 11.2 1.2
Pudukkottai 101.4 89.9 81.6 125.2 15.8 38.2 25.7 91.0 34.8 40.4 12.4 28.9
Ramanathapuram 51.0 46.9 27.0 0.3 11.6 11.7 25.5 51.3 9.9 12.8 1.8 1.4
Salem 142.0 51.5 57.7 34.9 35.5 76.7 208.3 190.4 220.3 68.5 88.5 56.5
Sivaganga 57.2 58.5 65.0 54.3 4.6 23.5 27.7 28.4 16.6 9.8 4.7 3.1
South Arcot 78.3 72.0 31.1
Thanjavur 108.8 64.0 74.2 52.5 35.0 45.7 104.5 116.0 44.0 29.0 17.1 12.3
The Nilgiris 8.2 4.9 7.0 2.8 9.7 26.2 23.3 13.2 2.1 2.1 1.6 0.5
Theni 30.2 7.1 8.1 27.8 37.4 58.0 19.8 4.4 2.3
Thiruvallur 46.9 68.0 30.8 46.1 34.6 76.8 85.6 56.4 66.3
Thiruvarur 78.8 60.4 35.6 32.6 72.7 70.2 35.3 8.5 3.7
Thoothukkudi 44.8 38.5 21.0 115.0 14.8 20.9 47.5 247.9 26.4 20.8 9.8 125.6
Tiruchirappalli 186.2 71.6 33.2 34.4 59.9 49.3 114.4 137.4 128.6 41.2 22.2 19.8
Tirunelveli 64.3 53.7 52.1 61.9 45.3 70.8 136.9 162.3 69.6 53.8 37.3 54.3
Tiruvannamalai 145.1 114.0 60.9 55.3 31.2 79.2 108.1 210.2 31.6 22.7 9.5 7.1
Vellore 126.2 106.5 50.8 53.5 68.5 99.7 163.6 182.2 67.7 45.1 14.9 14.2
Viluppuram 247.8 250.9 142.1 127.1 32.3 33.1 136.5 155.2 58.4 59.9 18.9 12.2
Virudhunagar 17.9 24.7 23.6 32.2 22.4 25.8 92.1 79.5 17.6 18.3 16.0 7.3
Source: 15th, 16th, 17th and 18th Livestock census, Department of Animal Husbandry, Dairying and Fisheries, Ministry of Agriculture, Govt. of India.

27
Dairying in Tamil naDu A Statistical Profile 2014 Part II : Livestock Census
National Dairy Development Board
II.1. Animal Population
TaBlE ii.1.7: District-wise male Population
Districtsindigenous Cattle (‘000) Crossbred Cattle (‘000) Buffalo (‘000)
1992 1997 2003 2007 1992 1997 2003 2007 1992 1997 2003 2007Tamil naDu 3,351 2,317 1,599 1,348 473 1,060 993 1,400 469 506 268 495
Ariyalur 37.1 15.5 3.2
Chengalpattu MGR 282.1 26.3 59.9
Chennai 2.3 0.9 0.7 0.4 0.2 1.7 0.7 0.3 2.2 1.8 1.1 1.0
Coimbatore 114.4 59.3 22.0 15.9 42.9 52.1 43.8 59.3 17.7 10.6 4.6 6.6
Cuddalore 87.6 58.1 19.2 80.7 37.4 55.9 15.9 7.6 4.4
Dharmapuri 180.7 137.6 46.5 50.1 7.1 50.3 26.0 32.6 11.6 37.6 11.4 8.5
Dindigul 74.0 48.1 32.3 15.4 28.2 53.8 27.3 16.6 20.5 22.1 8.3 10.4
Erode 81.6 51.4 48.7 49.0 44.2 89.3 59.0 78.4 26.3 53.2 27.3 60.6
Kancheepuram 122.4 116.5 111.1 56.1 19.2 59.2 44.3 23.9 34.8
Kanniyakumari 9.8 5.8 1.8 1.8 6.8 9.8 17.2 9.1 6.8 4.0 2.0 0.7
Karur 18.4 15.4 10.3 20.5 10.8 7.2 15.1 7.6 6.2
Krishnagiri 59.1 13.6 2.4
Madurai 118.2 51.6 24.7 27.4 16.3 33.4 28.4 19.7 15.9 7.2 2.3 1.0
Nagapattinam 209.6 67.8 43.4 38.5 13.1 11.6 26.5 30.8 31.2 12.7 11.6 6.6
Namakkal 67.3 24.3 11.6 14.0 23.7 44.4 26.5 21.5 42.8
Perambalur 83.0 46.2 9.5 33.9 26.6 36.1 15.0 3.0 2.3
Pudukkottai 192.7 147 115.6 166.5 11.4 42.7 23.3 66.9 14.4 15.1 9.7 26.9
Ramanathapuram 88.3 61.7 24.3 1.2 7.1 6.2 13.8 26.9 5.0 4.8 1.0 1.0
Salem 264.9 61.3 61.0 49.4 16.9 55.4 58.7 65.0 20.0 19.3 19.9 33.0
Sivaganga 124.8 81.8 84.3 52.6 4.2 27.5 19.0 11.6 11.1 7.5 4.0 1.8
South Arcot 118.0 55.6 13.1
Thanjavur 162.8 74.3 82.4 70.5 17.1 56.4 90.8 49.6 16.1 9.7 5.9 5.9
The Nilgiris 2.8 1.4 2.3 1.5 1.6 7.3 6.2 4.8 1.0 1.2 0.7 0.2
Theni 40.0 9.6 10.5 13.1 11.4 5.5 5.7 3.0 1.3
Thiruvallur 49.1 63.0 43.9 41.0 19.2 97.9 21.8 21.7 85.9
Thiruvarur 61.8 54.9 35.5 14.2 31.1 28.5 14.1 3.9 1.4
Thoothukkudi 55.5 33.7 23.0 59.4 6.3 12.8 22.0 131.5 17.5 13.4 4.7 77.8
Tiruchirappalli 257.0 84.7 33.2 44.5 35.6 36.5 50.2 53.0 50.5 14.3 6.8 8.6
Tirunelveli 84.4 49.7 39.7 41.2 25.9 41.5 54.8 89.8 25.0 22.1 15.9 31.7
Tiruvannamalai 302.6 226.0 123.0 94.1 27.0 90.7 61.5 83.1 11.7 11.8 6.6 5.9
Vellore 181.9 143.0 86.8 76.7 43.9 64.7 49.0 51.8 28.9 25.9 4.5 8.4
Viluppuram 406.5 380.3 232.3 168.7 25.7 35.3 79.9 138.0 58.6 48.2 15.1 9.3
Virudhunagar 35.9 19.5 23.7 35.1 9.7 7.9 41.3 31.2 3.6 5.6 10.2 6.8
Source: 15th, 16th, 17th and 18th Livestock census, Department of Animal Husbandry, Dairying and Fisheries, Ministry of Agriculture, Govt. of India.
28
Dairying in Tamil naDu A Statistical Profile 2014 Part II : Livestock Census
National Dairy Development Board
II.2. Sex Ratio in Dairy Animals
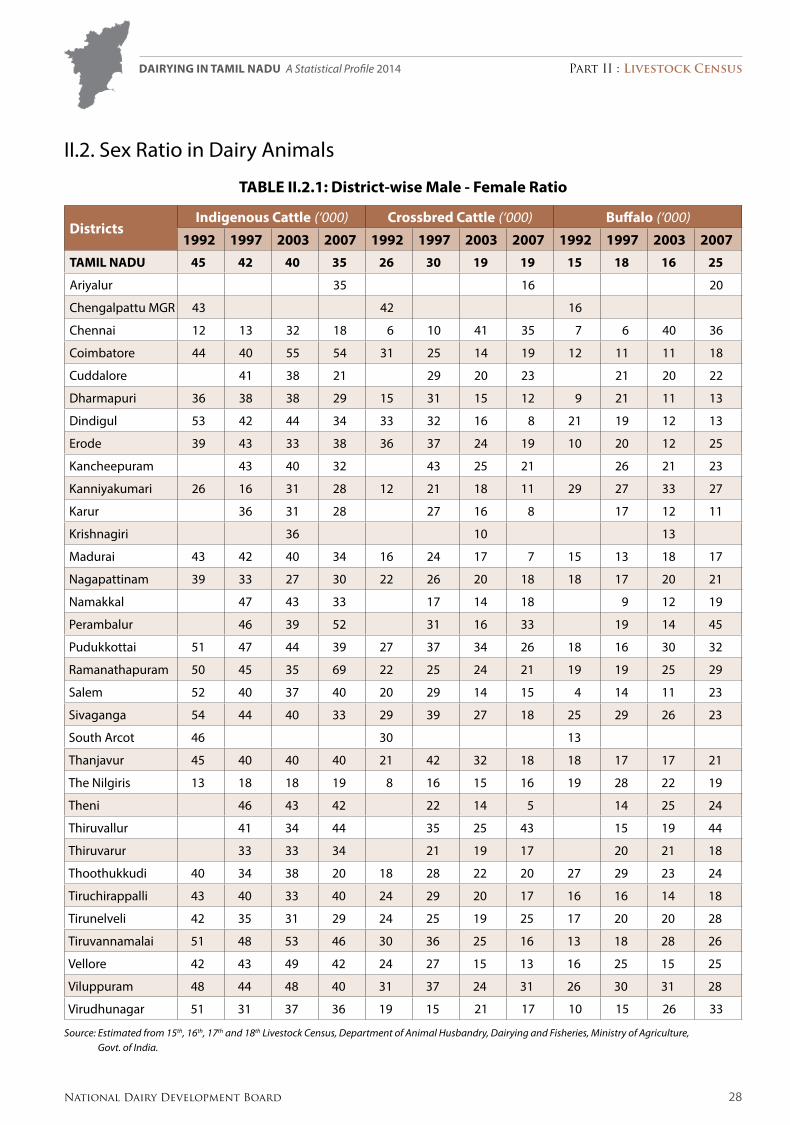
TaBlE ii.2.1: District-wise male - Female ratio
Districtsindigenous Cattle (‘000) Crossbred Cattle (‘000) Buffalo (‘000)
1992 1997 2003 2007 1992 1997 2003 2007 1992 1997 2003 2007Tamil naDu 45 42 40 35 26 30 19 19 15 18 16 25
Ariyalur 35 16 20
Chengalpattu MGR 43 42 16
Chennai 12 13 32 18 6 10 41 35 7 6 40 36
Coimbatore 44 40 55 54 31 25 14 19 12 11 11 18
Cuddalore 41 38 21 29 20 23 21 20 22
Dharmapuri 36 38 38 29 15 31 15 12 9 21 11 13
Dindigul 53 42 44 34 33 32 16 8 21 19 12 13
Erode 39 43 33 38 36 37 24 19 10 20 12 25
Kancheepuram 43 40 32 43 25 21 26 21 23
Kanniyakumari 26 16 31 28 12 21 18 11 29 27 33 27
Karur 36 31 28 27 16 8 17 12 11
Krishnagiri 36 10 13
Madurai 43 42 40 34 16 24 17 7 15 13 18 17
Nagapattinam 39 33 27 30 22 26 20 18 18 17 20 21
Namakkal 47 43 33 17 14 18 9 12 19
Perambalur 46 39 52 31 16 33 19 14 45
Pudukkottai 51 47 44 39 27 37 34 26 18 16 30 32
Ramanathapuram 50 45 35 69 22 25 24 21 19 19 25 29
Salem 52 40 37 40 20 29 14 15 4 14 11 23
Sivaganga 54 44 40 33 29 39 27 18 25 29 26 23
South Arcot 46 30 13
Thanjavur 45 40 40 40 21 42 32 18 18 17 17 21
The Nilgiris 13 18 18 19 8 16 15 16 19 28 22 19
Theni 46 43 42 22 14 5 14 25 24
Thiruvallur 41 34 44 35 25 43 15 19 44
Thiruvarur 33 33 34 21 19 17 20 21 18
Thoothukkudi 40 34 38 20 18 28 22 20 27 29 23 24
Tiruchirappalli 43 40 33 40 24 29 20 17 16 16 14 18
Tirunelveli 42 35 31 29 24 25 19 25 17 20 20 28
Tiruvannamalai 51 48 53 46 30 36 25 16 13 18 28 26
Vellore 42 43 49 42 24 27 15 13 16 25 15 25
Viluppuram 48 44 48 40 31 37 24 31 26 30 31 28
Virudhunagar 51 31 37 36 19 15 21 17 10 15 26 33
Source: estimated from 15th, 16th, 17th and 18th Livestock census, Department of Animal Husbandry, Dairying and Fisheries, Ministry of Agriculture, Govt. of India.

29
Dairying in Tamil naDu A Statistical Profile 2014 Part II : Livestock Census
National Dairy Development Board
II.3. Wet-Dry Ratio of Dairy Animals
TaBlE ii.3.1: District-wise Wet-Dry ratio
Districtsindigenous Cattle (%) Crossbred Cattle (%) Buffalo (%)
1992 1997 2003 2007 1992 1997 2003 2007 1992 1997 2003 2007Tamil naDu 64 69 62 68 70 72 71 73 69 71 65 68
Ariyalur 60 71 66
Chengalpattu MGR 68 74 68
Chennai 89 95 94 88 83 91 91 89 87 94 87 84
Coimbatore 70 70 66 76 71 71 72 75 74 73 69 72
Cuddalore 71 61 70 65 66 71 74 64 64
Dharmapuri 54 54 44 60 66 68 66 72 67 66 58 69
Dindigul 53 67 54 62 67 69 74 74 64 68 67 70
Erode 61 70 68 69 64 68 73 70 67 70 70 68
Kancheepuram 75 58 68 75 69 72 77 62 71
Kanniyakumari 65 85 66 61 79 88 79 79 79 87 75 70
Karur 65 68 73 62 70 74 69 68 72
Krishnagiri 56 74 65
Madurai 72 68 64 71 73 73 75 83 71 72 73 79
Nagapattinam 60 78 59 67 67 71 61 70 67 76 56 73
Namakkal 66 63 76 67 69 70 61 63 69
Perambalur 60 58 71 60 72 72 55 62 67
Pudukkottai 63 58 67 69 76 66 72 74 67 66 67 69
Ramanathapuram 70 71 69 67 70 91 74 71 74 68 72 64
Salem 65 78 57 67 71 75 68 72 69 76 64 69
Sivaganga 68 67 65 72 74 69 72 77 73 70 64 65
South Arcot 62 60 71
Thanjavur 64 63 71 69 69 64 66 73 61 64 72 72
The Nilgiris 77 94 68 66 76 85 78 81 63 82 73 71
Theni 77 70 65 75 77 81 76 75 78
Thiruvallur 86 64 59 82 70 61 84 64 58
Thiruvarur 63 69 69 65 72 72 66 66 71
Thoothukkudi 62 69 67 79 61 73 75 79 68 71 68 71
Tiruchirappalli 60 69 65 67 69 70 67 72 66 65 70 67
Tirunelveli 69 73 73 64 72 69 74 66 73 72 69 61
Tiruvannamalai 75 77 60 65 82 79 74 69 74 82 64 82
Vellore 71 75 61 64 77 79 70 75 74 78 62 72
Viluppuram 54 65 55 66 61 78 68 69 65 72 63 69
Virudhunagar 71 71 67 69 70 72 73 75 69 72 70 74
Source: estimated from 15th, 16th, 17th and 18th Livestock census, Department of Animal Husbandry, Dairying and Fisheries, Ministry of Agriculture, Govt. of India.

30
Dairying in Tamil naDu A Statistical Profile 2014 Part II : Livestock Census
National Dairy Development Board
II.4. Livestock Density
TaBlE ii.4.1: District-wise Density of Total livestock and Bovine
Districtslivestock (No. per sq km) Bovine (No. per sq km)
1992 1997 2003 2007 1992 1997 2003 2007Tamil naDu 194 185 191 236 96 90 83 101
Ariyalur 295 114
Chengalpattu MGR 228 139
Chennai 406 421 61 95 307 314 39 35
Coimbatore 128 105 123 99 73 61 54 51
Cuddalore 256 195 186 153 104 97
Dharmapuri 143 171 210 104 70 73 88 54
Dindigul 136 140 142 137 51 63 50 53
Erode 161 165 209 235 73 77 77 97
Kancheepuram 230 179 334 132 108 175
Kanniyakumari 112 94 126 128 70 58 64 55
Karur 223 202 224 74 63 61
Krishnagiri 149 62
Madurai 137 94 186 350 69 45 64 95
Nagapattinam 287 247 308 297 160 120 128 122
Namakkal 319 286 338 154 120 150
Perambalur 206 211 201 100 83 75
Pudukkottai 203 208 150 443 108 112 78 164
Ramanathapuram 144 126 158 195 58 46 32 33
Salem 264 207 316 277 123 91 148 137
Sivaganga 205 158 183 169 70 67 71 56
South Arcot 323 148
Thanjavur 248 192 267 283 156 111 154 140
The Nilgiris 23 33 41 23 18 23 22 15
Theni 115 79 106 57 35 44
Thiruvallur 182 200 273 112 109 152
Thiruvarur 300 357 284 157 167 132
Thoothukkudi 154 141 158 462 50 41 39 272
Tiruchirappalli 224 227 237 269 96 97 92 108
Tirunelveli 161 139 206 347 67 62 74 92
Tiruvannamalai 237 234 136 220 121 124 80 117
Vellore 236 211 186 188 133 115 90 103
Viluppuram 280 278 220 248 161 155 121 124
Virudhunagar 119 122 224 264 37 36 71 71
Source: estimated from 15th, 16th, 17th and 18th Livestock census, Department of Animal Husbandry, Dairying and Fisheries, Ministry of Agriculture, Govt. of India.

31
Dairying in Tamil naDu A Statistical Profile 2014 Part II : Livestock Census
National Dairy Development Board
II.4. Livestock Density
TaBlE ii.4.2: District-wise Density of Poultry and Small ruminants
DistrictsPoultry (No. per sq km) Small ruminants (No. per sq km)
1997 2003 2007 1992 1997 2003 2007Tamil naDu 280 664 983 93 90 106 132
Ariyalur 304 175
Chengalpattu MGR 84
Chennai 510 195 414 82 91 21 60
Coimbatore 402 5,626 5,824 52 41 66 47
Cuddalore 157 91 143 93 84 78
Dharmapuri 224 344 357 71 94 121 50
Dindigul 108 325 470 81 75 90 84
Erode 339 646 823 85 86 131 137
Kancheepuram 202 80 278 96 69 157
Kanniyakumari 389 277 779 39 33 61 71
Karur 277 172 256 142 135 162
Krishnagiri 133 86
Madurai 91 107 305 64 48 122 254
Nagapattinam 173 7,096 246 126 126 170 174
Namakkal 3,683 78 12,593 142 159 182
Perambalur 101 129 159 97 127 122
Pudukkottai 221 71 231 94 95 71 277
Ramanathapuram 61 655 101 85 78 117 159
Salem 238 138 801 124 104 167 137
Sivaganga 134 151 359 134 90 110 112
South Arcot 167
Thanjavur 215 22 322 92 80 112 142
The Nilgiris 27 203 23 4 10 9 8
Theni 144 202 529 51 42 61
Thiruvallur 335 74 323 67 88 121
Thiruvarur 260 215 149 141 185 151
Thoothukkudi 120 259 99 95 116 183
Tiruchirappalli 205 262 586 119 126 142 159
Tirunelveli 91 139 90 74 130 249
Tiruvannamalai 87 54 79 110 105 55 101
Vellore 162 130 675 100 93 89 84
Viluppuram 143 123 349 104 110 97 119
Virudhunagar 83 305 352 79 83 149 190
Source: estimated from 15th, 16th, 17th and 18th Livestock census, Department of Animal Husbandry, Dairying and Fisheries, Ministry of Agriculture, Govt. of India.

32
Dairying in Tamil naDu A Statistical Profile 2014 Part II : Livestock Census
National Dairy Development Board

33
Dairying in Tamil naDu A Statistical Profile 2014 Part II : Livestock Census
National Dairy Development Board
II.5. Breed-wise Population
TaBlE ii.5.1: District and Breed-wise Population of indigenous Cattle in Tamil nadu - 2007
DistrictsBreed-wise Population of indigenous Cattle (‘000)
alambadi Bargur Jellicut Kangayam manapari umblacherry Other graded
non- Descript Total
Tamil naDu 32 21 34 315 102 217 266 2,819 3,806
Ariyalur 0 0 0 3 12 13 2 75 105
Chennai 0 0 0 0 0 0 0 2 2
Coimbatore 1 1 1 13 0 1 3 11 30
Cuddalore 5 1 0 1 1 0 7 76 91
Dharmapuri 1 1 0 5 0 0 20 142 170
Dindigul 0 0 0 33 0 0 3 9 46
Erode 1 5 0 70 0 0 12 42 130
Kancheepuram 2 3 0 26 3 2 19 288 342
Kanniyakumari 0 0 0 0 0 0 1 5 6
Karur 0 0 0 21 0 0 1 13 36
Madurai 0 0 1 3 3 0 6 65 79
Nagapattinam 1 0 0 1 2 77 8 39 129
Namakkal 0 1 0 13 0 0 7 14 35
Perambalur 0 0 1 2 2 1 4 8 18
Pudukkottai 2 1 21 33 33 23 14 295 423
Ramanathapuram 0 0 0 0 0 0 0 2 2
Salem 2 2 2 37 0 1 12 66 124
Sivaganga 1 0 1 2 3 3 2 149 162
Thanjavur 2 1 1 6 7 25 5 128 174
The Nilgiris 0 0 0 0 0 0 0 7 8
Theni 0 1 0 2 0 0 1 21 25
Thiruvallur 0 0 0 0 0 1 11 87 99
Thiruvarur 1 0 0 2 1 62 5 32 103
Thoothukkudi 2 0 0 4 0 2 32 262 302
Tiruchirappalli 1 0 3 15 31 0 8 53 112
Tirunelveli 3 0 0 6 0 0 6 127 143
Tiruvannamalai 1 0 0 1 0 0 4 198 204
Vellore 0 0 0 1 0 1 32 149 182
Viluppuram 4 2 0 7 1 0 35 375 424
Virudhunagar 2 0 1 7 0 2 6 80 99
Source: 18th Livestock census, Department of Animal Husbandry, Dairying and Fisheries, Ministry of Agriculture, Govt. of India.Zero denotes either nil or negligible.

34
Dairying in Tamil naDu A Statistical Profile 2014 Part II : Livestock Census
National Dairy Development Board
II.5. Breed-wise Population
TaBlE ii.5.2: District-wise male, Female and milch animals of alambadi and Bargur Breeds - 2007
Districtsalambadi Bargur
male Female milch male Female milchTamil naDu 8,129 22,842 8,111 10,636 10,181 3,613
Ariyalur 0 0 0 0 0 0
Chennai 10 28 3 8 26 8
Coimbatore 303 644 262 99 1,099 459
Cuddalore 426 4,968 1,448 478 598 148
Dharmapuri 388 1,013 303 270 396 104
Dindigul 14 73 11 1 4 2
Erode 228 346 90 3,386 1,260 381
Kancheepuram 313 1,279 627 1,623 1,023 366
Kanniyakumari 0 0 0 0 16 5
Karur 4 30 7 0 39 21
Madurai 53 248 127 54 82 53
Nagapattinam 101 1,279 490 95 217 38
Namakkal 15 53 22 154 473 167
Perambalur 36 58 26 39 66 24
Pudukkottai 767 1,462 464 723 729 260
Ramanathapuram 10 6 0 2 3 1
Salem 558 1,564 661 1,399 1,045 554
Sivaganga 275 248 71 23 43 17
Thanjavur 659 1,104 370 521 590 181
The Nilgiris 18 8 0 2 96 63
Theni 19 93 38 125 435 106
Thiruvallur 24 42 13 26 12 3
Thiruvarur 124 551 217 117 372 171
Thoothukkudi 319 945 544 54 160 33
Tiruchirappalli 194 991 412 90 121 45
Tirunelveli 835 1,391 645 12 34 11
Tiruvannamalai 314 328 126 152 134 63
Vellore 284 184 68 72 100 48
Viluppuram 1,282 2,310 584 966 872 199
Virudhunagar 556 1,596 482 145 136 82
Source: Directorate of Animal Husbandry and Veterinary Services, Govt. of Tamil Nadu.

35
Dairying in Tamil naDu A Statistical Profile 2014 Part II : Livestock Census
National Dairy Development Board
II.5. Breed-wise Population
TaBlE ii.5.3: District-wise male, Female and milch animals of Jellicut and Kangayam Breeds - 2007
DistrictsJellicut Kangayam
male Female milch male Female milchTamil naDu 21,183 13,005 3,900 138,350 174,652 59,166
Ariyalur 283 131 8 1,780 1,711 495
Chennai 3 14 2 16 19 5
Coimbatore 510 23 9 8,873 3,798 1,400
Cuddalore 23 76 43 626 555 206
Dharmapuri 355 126 43 1,274 3,560 1,057
Dindigul 395 8 4 10,886 22,205 7,271
Erode 244 254 86 24,115 46,046 16,008
Kancheepuram 152 201 78 10,449 15,977 5,692
Kanniyakumari 0 0 0 2 0 0
Karur 69 11 2 6,829 14,431 6,199
Madurai 1,154 156 48 2,006 1,485 516
Nagapattinam 34 162 48 276 662 168
Namakkal 95 93 21 3,717 9,057 3,148
Perambalur 146 391 147 1,925 337 85
Pudukkottai 12,496 8,147 2276 22,751 10,723 3,080
Ramanathapuram 14 0 0 58 0 0
Salem 1,042 479 130 11,713 25,675 7,899
Sivaganga 1,168 273 61 604 1,870 699
Thanjavur 468 328 146 4,229 1,405 444
The Nilgiris 0 6 4 14 107 69
Theni 309 32 19 870 902 285
Thiruvallur 17 25 7 80 40 10
Thiruvarur 57 93 24 1,863 140 43
Thoothukkudi 51 209 91 720 1,793 574
Tiruchirappalli 1,634 1,170 470 10,829 4,433 1,004
Tirunelveli 87 92 34 1,947 3,078 1,431
Tiruvannamalai 60 49 20 289 320 111
Vellore 13 2 0 419 159 62
Viluppuram 23 4 0 3,652 2,973 828
Virudhunagar 281 450 79 5,538 1,191 377
Source: Directorate of Animal Husbandry and Veterinary Services, Govt. of Tamil Nadu.

36
Dairying in Tamil naDu A Statistical Profile 2014 Part II : Livestock Census
National Dairy Development Board
II.5. Breed-wise Population
TaBlE ii.5.4: District-wise male, Female and milch animals of manapari and umblacherry Breeds - 2007
Districtsmanapari umblacherry
male Female milch male Female milchTamil naDu 52,419 49,547 15,773 78,662 135,810 48,823
Ariyalur 7,345 4,600 1,454 4,761 8,169 2,769
Chennai 0 0 0 0 82 48
Coimbatore 81 90 22 88 480 69
Cuddalore 561 391 125 38 102 29
Dharmapuri 146 145 33 132 103 37
Dindigul 55 206 75 22 62 32
Erode 160 100 44 66 111 79
Kancheepuram 739 1,824 791 600 1,518 669
Kanniyakumari 0 0 0 0 0 0
Karur 168 145 19 1 10 6
Madurai 1,993 1,047 342 37 70 34
Nagapattinam 2,009 337 65 21,142 53,383 19,099
Namakkal 37 51 29 9 42 11
Perambalur 1,604 342 99 414 836 310
Pudukkottai 14,722 18,444 6,480 11,332 11,679 3,921
Ramanathapuram 0 0 0 0 0 0
Salem 203 211 52 1,024 273 47
Sivaganga 1,056 1,873 485 1,194 2,250 1,194
Thanjavur 4,786 2,116 588 12,326 13,039 4,863
The Nilgiris 0 6 4 8 47 32
Theni 67 179 28 303 42 16
Thiruvallur 6 3 1 225 464 179
Thiruvarur 989 152 60 22,397 39,796 14,553
Thoothukkudi 47 207 46 284 862 184
Tiruchirappalli 14,657 16,233 4,666 51 373 116
Tirunelveli 104 199 78 202 333 108
Tiruvannamalai 18 62 11 400 0 0
Vellore 41 4 0 229 271 121
Viluppuram 521 447 129 175 290 91
Virudhunagar 304 133 47 1,202 1,123 206
Source: Directorate of Animal Husbandry and Veterinary Services, Govt. of Tamil Nadu.

37
Dairying in Tamil naDu A Statistical Profile 2014 Part II : Livestock Census
National Dairy Development Board
II.5. Breed-wise Population
TaBlE ii.5.5: District-wise male, Female and milch animals of Other graded and non-Descript indigenous Breeds - 2007
DistrictsOther graded non-Descript
male Female milch male Female milchTamil naDu 80,344 171,181 57,277 958,269 1,859,672 640,560
Ariyalur 425 1,495 413 22,511 51,990 17,510
Chennai 32 316 94 313 1,382 865
Coimbatore 964 1,749 637 4,622 6,264 2,573
Cuddalore 1,749 5,174 1,503 15,336 60,166 18,696
Dharmapuri 4,917 15,166 4,624 42,591 99,638 28,830
Dindigul 736 2,055 745 3,271 5,527 1,992
Erode 4,646 7,023 1,758 16,203 25,758 7,434
Kancheepuram 5,347 13,723 4,895 91,839 195,746 67,821
Kanniyakumari 213 832 309 1,591 3,835 1,229
Karur 175 1,275 472 3,016 10,276 3,980
Madurai 303 5,540 2,499 21,756 43,311 14,568
Nagapattinam 1,871 6,164 2,105 12,945 26,361 9,662
Namakkal 1,536 5,360 1,666 6,002 8,422 4,761
Perambalur 1,733 2,253 750 3,605 4,427 1,543
Pudukkottai 2,185 11,405 2,672 101,516 193,492 66,877
Ramanathapuram 6 6 1 1,099 517 205
Salem 3,338 8,710 2,787 30,101 35,309 11,511
Sivaganga 739 1,576 567 47,570 100,968 35,855
Thanjavur 911 3,970 1,312 46,590 81,385 28,034
The Nilgiris 133 360 81 1,307 5,672 1,602
Theni 90 621 303 8,681 12,005 4,522
Thiruvallur 4,925 6,231 2,550 38,634 48,110 15,464
Thiruvarur 724 3,816 1,275 9,250 23,002 8,196
Thoothukkudi 5,272 12,220 6,348 52,637 208,894 77,872
Tiruchirappalli 2,135 5,985 2,086 14,952 38,114 14,254
Tirunelveli 1,674 4,577 2,040 35,948 91,324 35,138
Tiruvannamalai 867 3,463 1,102 92,322 105,731 34,285
Vellore 10,276 21,271 5,844 65,326 83,237 27,990
Viluppuram 20,510 14,863 4,432 141,601 233,778 77,797
Virudhunagar 1,912 3,982 1,407 25,134 55,031 19,494
Source: Directorate of Animal Husbandry and Veterinary Services, Govt. of Tamil Nadu.

38
Dairying in Tamil naDu A Statistical Profile 2014 Part II : Livestock Census
National Dairy Development Board
II.5. Breed-wise Population
TaBlE ii.5.6: District and Breed-wise Population of Exotic and Crossbred animals in Tamil nadu - 2007
(‘000)
DistrictsExotic Crossbred Total Exotic
and CrossbredJersey HF Other Total Jersey HF Other TotalTamil naDu 236 46 58 339 5,281 1,498 265 7,044 7,383
Ariyalur 0 0 0 0 79 9 11 99 100
Chennai 0 0 0 0 0 0 0 1 1
Coimbatore 14 7 3 24 165 114 10 289 314
Cuddalore 9 1 1 11 209 16 11 235 246
Dharmapuri 12 6 0 19 133 127 3 263 282
Dindigul 3 1 0 4 170 30 1 201 205
Erode 14 1 1 16 290 104 9 403 420
Kancheepuram 12 2 3 17 190 53 20 263 279
Kanniyakumari 2 1 0 3 39 37 4 80 83
Karur 1 0 0 1 69 14 1 84 85
Madurai 3 0 0 4 188 65 13 266 270
Nagapattinam 3 1 2 5 124 19 24 167 172
Namakkal 7 2 1 10 171 69 1 241 251
Perambalur 2 0 1 2 87 10 9 106 109
Pudukkottai 18 4 9 31 159 53 16 229 260
Ramanathapuram 24 0 0 24 105 0 1 107 130
Salem 14 3 2 19 303 111 8 422 441
Sivaganga 2 0 0 2 57 4 3 64 66
Thanjavur 8 1 2 11 189 52 21 262 272
The Nilgiris 1 1 0 2 11 16 1 27 30
Theni 2 2 1 4 59 48 0 108 112
Thiruvallur 0 0 0 1 166 55 4 224 225
Thiruvarur 4 0 2 6 111 30 18 160 166
Thoothukkudi 13 2 0 15 547 82 14 642 657
Tiruchirappalli 5 0 0 5 254 43 15 312 318
Tirunelveli 37 6 23 67 224 51 19 294 361
Tiruvannamalai 2 0 0 3 439 69 3 510 513
Vellore 12 2 4 17 294 74 7 375 392
Viluppuram 7 0 1 8 329 96 9 434 441
Virudhunagar 4 1 1 6 122 46 8 176 182
Source: 18th Livestock census, Department of Animal Husbandry, Dairying and Fisheries, Ministry of Agriculture, Govt. of India.
Zero denotes either nil or negligible.
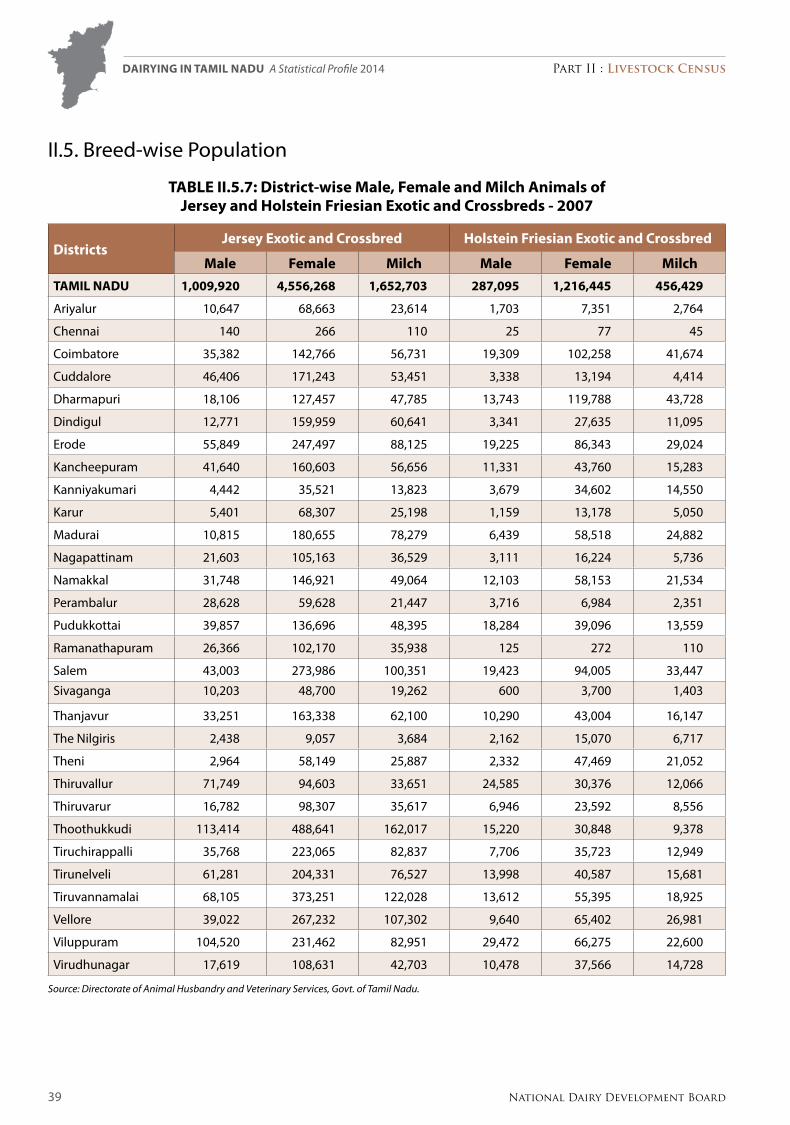
39
Dairying in Tamil naDu A Statistical Profile 2014 Part II : Livestock Census
National Dairy Development Board
II.5. Breed-wise Population
TaBlE ii.5.7: District-wise male, Female and milch animals of Jersey and Holstein Friesian Exotic and Crossbreds - 2007
DistrictsJersey Exotic and Crossbred Holstein Friesian Exotic and Crossbred
male Female milch male Female milchTamil naDu 1,009,920 4,556,268 1,652,703 287,095 1,216,445 456,429
Ariyalur 10,647 68,663 23,614 1,703 7,351 2,764
Chennai 140 266 110 25 77 45
Coimbatore 35,382 142,766 56,731 19,309 102,258 41,674
Cuddalore 46,406 171,243 53,451 3,338 13,194 4,414
Dharmapuri 18,106 127,457 47,785 13,743 119,788 43,728
Dindigul 12,771 159,959 60,641 3,341 27,635 11,095
Erode 55,849 247,497 88,125 19,225 86,343 29,024
Kancheepuram 41,640 160,603 56,656 11,331 43,760 15,283
Kanniyakumari 4,442 35,521 13,823 3,679 34,602 14,550
Karur 5,401 68,307 25,198 1,159 13,178 5,050
Madurai 10,815 180,655 78,279 6,439 58,518 24,882
Nagapattinam 21,603 105,163 36,529 3,111 16,224 5,736
Namakkal 31,748 146,921 49,064 12,103 58,153 21,534
Perambalur 28,628 59,628 21,447 3,716 6,984 2,351
Pudukkottai 39,857 136,696 48,395 18,284 39,096 13,559
Ramanathapuram 26,366 102,170 35,938 125 272 110
Salem 43,003 273,986 100,351 19,423 94,005 33,447
Sivaganga 10,203 48,700 19,262 600 3,700 1,403
Thanjavur 33,251 163,338 62,100 10,290 43,004 16,147
The Nilgiris 2,438 9,057 3,684 2,162 15,070 6,717
Theni 2,964 58,149 25,887 2,332 47,469 21,052
Thiruvallur 71,749 94,603 33,651 24,585 30,376 12,066
Thiruvarur 16,782 98,307 35,617 6,946 23,592 8,556
Thoothukkudi 113,414 488,641 162,017 15,220 30,848 9,378
Tiruchirappalli 35,768 223,065 82,837 7,706 35,723 12,949
Tirunelveli 61,281 204,331 76,527 13,998 40,587 15,681
Tiruvannamalai 68,105 373,251 122,028 13,612 55,395 18,925
Vellore 39,022 267,232 107,302 9,640 65,402 26,981
Viluppuram 104,520 231,462 82,951 29,472 66,275 22,600
Virudhunagar 17,619 108,631 42,703 10,478 37,566 14,728
Source: Directorate of Animal Husbandry and Veterinary Services, Govt. of Tamil Nadu.

40
Dairying in Tamil naDu A Statistical Profile 2014 Part II : Livestock Census
National Dairy Development Board
II.5. Breed-wise Population
TaBlE ii.5.8: District-wise male, Female and milch animals of Other Exotic and Crossbreds and Total Exotic and Crossbreds - 2007
DistrictsOther Exotic and Crossbred Total Exotic and Crossbred
male Female milch male Female milchTamil naDu 91,802 225,033 89,648 1,388,817 5,997,746 2,198,780
Ariyalur 3,150 8,031 3,013 15,500 84,045 29,391
Chennai 125 199 126 290 542 281
Coimbatore 4,631 9,598 3,154 59,322 254,622 101,559
Cuddalore 2,679 9,565 4,207 52,423 194,002 62,072
Dharmapuri 750 2,346 779 32,599 249,591 92,292
Dindigul 465 708 353 16,577 188,302 72,089
Erode 3,328 7,263 2,127 78,402 341,103 119,276
Kancheepuram 6,266 15,532 5,942 59,237 219,895 77,881
Kanniyakumari 335 3,986 2,052 8,456 74,109 30,425
Karur 143 984 327 6,703 82,469 30,575
Madurai 2,447 10,926 6,863 19,701 250,099 110,024
Nagapattinam 6,118 19,826 7,388 30,832 141,213 49,653
Namakkal 351 1,508 461 44,202 206,582 71,059
Perambalur 3,764 5,976 3,223 36,108 72,588 27,021
Pudukkottai 8,806 16,862 5,455 66,947 192,654 67,409
Ramanathapuram 364 1,050 349 26,855 103,492 36,397
Salem 2,533 7,650 2,699 64,959 375,641 136,497
Sivaganga 824 2,156 1,148 11,627 54,556 21,813
Thanjavur 6,047 16,478 6,898 49,588 222,820 85,145
The Nilgiris 224 668 292 4,824 24,795 10,693
Theni 194 910 312 5,490 106,528 47,251
Thiruvallur 1,567 2,435 803 97,901 127,414 46,520
Thiruvarur 4,747 15,738 6,498 28,475 137,637 50,671
Thoothukkudi 2,842 6,173 3,695 131,476 525,662 175,090
Tiruchirappalli 5,459 9,916 3,334 48,933 268,704 99,120
Tirunelveli 12,460 28,753 11,800 87,739 273,671 104,008
Tiruvannamalai 951 1,825 673 82,668 430,471 141,626
Vellore 3,118 7,265 2,310 51,780 339,899 136,593
Viluppuram 4,057 5,636 1,688 138,049 303,373 107,239
Virudhunagar 3,057 5,070 1,679 31,154 151,267 59,110
Source: Directorate of Animal Husbandry and Veterinary Services, Govt. of Tamil Nadu.

41
Dairying in Tamil naDu A Statistical Profile 2014 Part II : Livestock Census
National Dairy Development Board
II.5. Breed-wise Population
TaBlE ii.5.9: District and Breed-wise Population of Buffalo in Tamil nadu - 2007
DistrictsBuffalo Breed Population (‘000)
murrah Toda Other graded non-Descript Total Buffalo
Tamil naDu 247 50 474 1,238 2,009
Ariyalur 2 0 1 14 16
Chennai 1 0 0 2 3
Coimbatore 13 1 7 16 36
Cuddalore 0 0 0 19 20
Dharmapuri 5 2 5 53 65
Dindigul 15 8 34 24 81
Erode 42 6 79 115 242
Kancheepuram 20 5 23 107 154
Kanniyakumari 0 0 0 2 3
Karur 1 1 22 32 56
Madurai 1 0 2 3 6
Nagapattinam 8 1 1 22 32
Namakkal 22 2 90 105 220
Perambalur 3 0 0 2 5
Pudukkottai 20 1 4 59 84
Ramanathapuram 0 0 0 4 4
Salem 31 4 33 79 147
Sivaganga 1 0 1 7 8
Thanjavur 9 0 4 15 28
The Nilgiris 0 1 0 0 1
Theni 1 0 1 3 5
Thiruvallur 2 0 61 131 195
Thiruvarur 2 0 0 6 8
Thoothukkudi 19 9 63 228 319
Tiruchirappalli 7 1 9 30 47
Tirunelveli 9 2 24 80 115
Tiruvannamalai 1 0 0 21 23
Vellore 6 4 5 19 34
Viluppuram 0 0 0 33 33
Virudhunagar 4 2 4 11 21
Source: 18th Livestock census, Department of Animal Husbandry, Dairying and Fisheries, Ministry of Agriculture, Govt. of India.Zero denotes either nil or negligible.

42
Dairying in Tamil naDu A Statistical Profile 2014 Part II : Livestock Census
National Dairy Development Board
II.5. Breed-wise Population
TaBlE ii.5.10: District-wise male, Female and milch animals of murrah and Toda Buffalo Breeds - 2007
Districtsmurrah Toda
male Female milch male Female milchTamil naDu 63,183 173,218 63,848 11,693 37,718 10,359
Ariyalur 304 1,654 569 0 0 0
Chennai 434 568 384 491 391 43
Coimbatore 2,243 10,423 4,204 235 1,188 392
Cuddalore 67 333 139 9 31 14
Dharmapuri 844 4,472 1,585 87 1,468 572
Dindigul 2,536 12,721 5,336 246 7,637 992
Erode 13,279 29,018 10,865 1,890 4,561 1,402
Kancheepuram 5,651 13,529 5,735 1,129 3,636 1,275
Kanniyakumari 10 10 4 2 0 0
Karur 93 762 346 137 650 246
Madurai 215 1,273 666 4 70 33
Nagapattinam 2,004 5,726 2,047 99 1,052 399
Namakkal 3,600 18,767 6,716 545 1,858 650
Perambalur 1,459 1,613 408 92 30 4
Pudukkottai 6,773 12,831 4,363 338 547 236
Ramanathapuram 0 0 0 0 0 0
Salem 8,366 22,229 6,920 707 3,640 1,523
Sivaganga 152 505 242 21 61 14
Thanjavur 1,396 7,262 2,896 10 371 135
The Nilgiris 18 97 41 96 470 164
Theni 378 1,063 563 644 1,674 63
Thiruvallur 954 1,290 609 107 266 81
Thiruvarur 359 1,429 677 4 56 40
Thoothukkudi 4,793 4,440 16 2,239 2,540 0
Tiruchirappalli 1,629 5,733 2,126 85 489 192
Tirunelveli 2,595 6,363 2,926 644 1,674 779
Tiruvannamalai 402 1,058 341 25 37 11
Vellore 1,518 4,599 1,812 1,383 2,117 786
Viluppuram 22 119 43 14 35 25
Virudhunagar 1,089 3,331 1,269 410 1,169 288
Source: Directorate of Animal Husbandry and Veterinary Services, Govt. of Tamil Nadu.

43
Dairying in Tamil naDu A Statistical Profile 2014 Part II : Livestock Census
National Dairy Development Board
II.5. Breed-wise Population
TaBlE ii.5.11: District-wise male, Female and milch animals of Other graded and non-Descript Buffalo Breeds - 2007
DistrictsOther graded Buffalo non-Descript Buffalo
male Female milch male Female milch
Tamil naDu 112,945 321,470 112,112 308,412 935,194 340,165
Ariyalur 177 442 140 2,706 10,824 3,957
Chennai 17 61 38 583 1,147 577
Coimbatore 1,016 5,609 2,161 3,104 18,432 5,259
Cuddalore 134 365 146 4,201 14,644 4,408
Dharmapuri 460 4,233 1,612 7,097 46,070 16,647
Dindigul 4,222 29,752 10,806 3,402 20,215 8,306
Erode 16,069 63,022 21,967 29,352 85,273 27,207
Kancheepuram 4,833 18,361 7,089 23,158 83,597 32,173
Kanniyakumari 102 242 75 573 1,572 598
Karur 1,960 19,702 7,818 4,000 28,277 11,548
Madurai 183 1,479 589 643 2,338 964
Nagapattinam 206 826 309 4,314 17,614 6,719
Namakkal 18,474 71,245 24,226 20,170 85,223 31,232
Perambalur 66 176 30 670 1,116 299
Pudukkottai 1,206 2,944 1,215 18,536 40,780 14,156
Ramanathapuram 0 0 0 1,030 2,519 878
Salem 6,936 25,710 9,224 16,981 61,671 21,078
Sivaganga 205 375 114 1,461 5,055 1,623
Thanjavur 1,327 3,149 1,343 3,159 11,446 4,404
The Nilgiris 0 0 0 109 368 148
Theni 126 634 253 750 2,192 907
Thiruvallur 29,234 32,177 10,334 55,618 74,919 27,323
Thiruvarur 26 181 70 1,029 4,581 1,804
Thoothukkudi 15,376 8,354 702 55,432 172,716 64,040
Tiruchirappalli 830 8,615 2,600 6,027 23,563 8,432
Tirunelveli 6,897 16,833 6,517 21,604 58,261 22,880
Tiruvannamalai 72 266 104 5,378 15,473 5,353
Vellore 915 4,498 1,963 4,565 14,437 5,658
Viluppuram 109 226 100 9,188 23,343 8,274
Virudhunagar 1,767 1,993 567 3,572 7,528 3,313
Source: Directorate of Animal Husbandry and Veterinary Services, Govt. of Tamil Nadu.

44
Dairying in Tamil naDu A Statistical Profile 2014 Part II : Livestock Census
National Dairy Development Board

45 National Dairy Development Board
Part III : Cattle and Buffalo Breeds
Tamil Nadu has many indigenous draught cattle breeds like Kangayam, Bargur and Umblacherry. These animals are able to sustain scarcity of feed and water. They have low metabolic rate, low disease susceptibility, high nutrient conversion efficiency and low maintenance cost. With decline in the usage of bullock power in rural areas, the genetic superiority of these animals is yet to be fully explored. In absence of high quality indigenous milch cattle breeds, the state depends on crossbred cattle for milk production.
In case of buffaloes, Toda buffalo is the only indigenous and localised buffalo breed in Tamil Nadu. It has been named after an ancient tribe “Toda” of Nilgiris Hills. The body of this breed is long and deep, whereas legs are short and strong, and hence, suitable for the hilly region.
01

46
Dairying in Tamil naDu A Statistical Profile 2014 Part III : Cattle and buffalo breeds
National Dairy Development Board
III.1. Distribution of Native Breeds of Tamil NaduTABLE III.1.1: Distribution of Cattle Breeds of Tamil Nadu
Breeds Breeding Tract Utility Distribution
Kangayam Erode district Draught Breed Erode District, parts of Coimbatore, Dindigul, Karur,
Kancheepuram, Pudukkottai, Salem, Tiruchirappalli and
Namakkal districts of Tamil Nadu
Bargur Bhavani Taluka of
Erode district
Draught Breed Erode and Kancheepuram districts
Umblacherry Thanjavur and
Nagapattinam districts
Draught Breed Nagapattinam, Thanjavur, Thiruvarur and Pudukkottai districts
Source: Ae Nivsarkar et al., (2000), Animal Genetic resources of India, cattle and Buffalo, IcAr publication.Department of Animal Husbandry, Dairying and Fisheries , Ministry of Agriculture, Govt. of India.

47
Dairying in Tamil naDu A Statistical Profile 2014 Part III : Cattle and buffalo breeds
National Dairy Development Board
Distribution of Indigenous Cattle Breeds
Kangayam
Bargur

48
Dairying in Tamil naDu A Statistical Profile 2014 Part III : Cattle and buffalo breeds
National Dairy Development Board
Distribution of Indigenous Cattle Breeds
Umblacherry

49
Dairying in Tamil naDu A Statistical Profile 2014 Part III : Cattle and buffalo breeds
National Dairy Development Board
Distribution of Holstein Friesian and Jersey Crossbred
Holstein Friesian Crossbred
Jersey Crossbred

50
Dairying in Tamil naDu A Statistical Profile 2014 Part III : Cattle and buffalo breeds
National Dairy Development Board
III.1. Distribution of Native Breeds of Tamil NaduTABLE III.1.2: Distribution of Buffalo Breed of Tamil Nadu
Breeds Breeding Tract Utility Distribution
Toda The Nilgiri hills Draught Dindigul, Erode, Thoothukkudi, Kancheepuram, Salem, Vellore, Namakkal, Theni and Tirunelveli districts
Source: Ae Nivsarkar et al., (2000), Animal Genetic resources of India, cattle and Buffalo, IcAr publication.
Department of Animal Husbandry, Dairying and Fisheries , Ministry of Agriculture, Govt. of India.
Distribution of Buffalo Breed
Toda

51
Dairying in Tamil naDu A Statistical Profile 2014 Part III : Cattle and buffalo breeds
National Dairy Development Board
III.2. Performance of BreedsTABLE III.2.1: Performance of Cattle and Buffalo Breeds
Parameters Indigenous Cattle
Kangayam Bargur Umblacherry
Breed Population (‘000) 315 21 217
Adult Body Weight Male: 540 Female: 380
Male: 340 Female: 295
Male: 385 Female: 325
Lactation Yield (kg) 600 to 800 350 300-500
Lactation Length (days) 270 270-310 250-270
Calving Interval (days) 365-670 480-540 446±4
Age at First Calving (days) 1,100-1,500 1,230 1,593±12
Parameters Crossbred Cattle Buffalo
Jersey Crossbred HF Crossbred Toda
Breed Population (‘000) 5,281 1,498 50
Adult Body Weight Male: 300-450 Female: 300-325
Male: 300-450 Female: 300-350
Male: 380 Female: 380
Lactation Yield (kg) 1,123-2,135 1,940-2,700 500
Lactation Length (days) 258-305 286-305 200
Calving Interval (days) 360-480 360-480 480
Age at First Calving (days) 720-900 720-900 1,200-1,400
Source: Ae Nivsarkar et al., (2000), Animal Genetic resources of India, cattle and Buffalo, IcAr publication.Directorate of Animal Husbandry and Veterinary Services, Govt. of Tamil Nadu.

52
Dairying in Tamil naDu A Statistical Profile 2014 Part III : Cattle and buffalo breeds
National Dairy Development Board

Part IV : Milk Production
The total milk production in Tamil Nadu has increased at an average annual growth rate of 4.2 per cent during last decade and touched 7 million tonnes in 2013-14, accounting for 5.3 per cent of the country’s milk production. Cow milk accounted for 90 per cent of milk production and balance was buffalo milk. Within the cow milk basket, the share of crossbred milk to total milk production has increased from 23 per cent in 1992-93 to 80 per cent in 2012-13. Tiruvannamalai district has the highest crossbred cattle milk production followed by Salem and Vellore districts. Higher production of milk has improved the per capita availability of milk in the state from 169 grams/day in 1993-94 to 262 grams/day in 2012-13.
In order to support milk production, the government is implementing free cattle distribution scheme since 2011 and often managing fodder depots. On behalf of Tamil Nadu Coop. Milk Producers’ Federation Ltd, the government determines producers price and consumers price of milk.
While there is little improvement in productivity of buffaloes during last two decades, the productivity of crossbred animals has gone up considerably from 4.87 kgs per day to 6.81 kgs per day.

54
Dairying in Tamil naDu A Statistical Profile 2014 Part IV : Milk Production
National Dairy Development Board
IV.1. Production PerformanceTable IV.1.1: Year-wise In-milk bovine Population,
Milk Yield and Milk Production
Year In-milk bovine (‘000)
Milk Yield (kg per day)
bovine Milk Production (‘000 MT per annum)
1987-88 2,771 3.074 3,109.1
1988-89 2,940 3.017 3,237.8
1989-90 3,077 3.036 3,410.0
1990-91 3,118 2.965 3,374.7
1991-92 3,109 2.958 3,356.8
1992-93 3,093 3.071 3,468.2
1993-94 3,083 3.132 3,524.3
1994-95 3,075 3.291 3,693.8
1995-96 3,039 3.417 3,790.8
1996-97 3,103 3.511 3,976.5
1997-98 3,098 3.591 4,060.6
1998-99 3,152 3.714 4,272.8
1999-00 3,252 3.853 4,573.8
2000-01 3,351 4.013 4,907.0
2001-02 3,344 4.089 4,988.0
2002-03 3,179 3.983 4,622.3
2003-04 3,163 4.116 4,752.0
2004-05 3,139 4.175 4,783.8
2005-06 3,021 4.964 5,473.6
2006-07 3,338 5.151 6,276.0
2007-08 3,464 5.173 6,540.0
2008-09 3,477 5.241 6,651.0
2009-10 3,508 5.301 6,787.0
2010-11 3,642 5.139 6,831.3
2011-12 3,652 5.227 6,967.9
2012-13 3,409 5.630 7,004.7
Source: Integrated Sample Survey reports (1987-88 to 2012-13), Directorate of Animal Husbandry and Veterinary Services, Govt. of Tamil Nadu.

55
Dairying in Tamil naDu A Statistical Profile 2014 Part IV : Milk Production
National Dairy Development Board
IV.1. Production Performance: Animal PopulationTable IV.1.2: Year and District-wise In-milk bovine Population
DistrictsIn-milk bovine Population (‘000)
1993-94 1997-98 2003-04 2007-08 2008-09 2009-10 2010-11 2011-12 2012-13TaMIl NaDU 3,083 3,098 3,163 3,052 3,060 3,084 3,642 3,652 3,409
Ariyalur 57
Chengalpattu MGR 293 284
Chennai 29 29 18 3 3 3 4 6
Coimbatore 139 144 137 140 141 142 142 81 84
Cuddalore 140 106 104 104 115 104 92
Dharmapuri 127 124 164 111 110 112 126 96 106
Dindigul 110 113 92 93 96 101 129 131
Erode 183 196 179 183 183 186 238 174 156
Kancheepuram 166 109 107 106 146 176 186
Kanniyakumari 46 55 41 45 47 48 53 34 24
Karur 61 58 58 62 68 63 52
Krishnagiri 95 100 99 104 96 85
Madurai 265 177 100 84 84 88 107 110 90
Nagapattinam 166 99 87 87 89 103 107 99
Namakkal 157 131 135 137 157 149 130
Perambalur 89 89 89 88 96 95 36
Pudukkottai 131 125 103 85 84 88 127 171 174
Ramanathapuram 175 61 55 44 43 44 48 33 35
Salem 295 296 158 233 232 236 261 242 229
Sivaganga 57 69 64 64 65 75 81 63
South Arcot 305 114
Thanjavur 315 153 91 130 132 129 137 129 132
The Nilgiris 18 22 29 26 27 27 30 27 17
Theni 65 41 41 42 47 64 57
Thiruvallur 147 101 102 102 146 123 112
Thiruvarur 80 100 99 96 101 80 57
Thoothukkudi 59 58 57 56 58 83 117 66
Tiruchirappalli 270 249 115 116 116 117 123 130 143
Tirunelveli 176 122 111 159 161 157 187 178 177
Tiruppur 119 91
Tiruvannamalai 145 163 128 128 129 217 212 229
Vellore 318 181 189 159 157 156 179 203 194
Viluppuram 180 220 186 186 184 217 222 218
Virudhunagar 52 51 94 96 94 105 101 89
Source: Integrated Sample Survey reports (1993-94 to 2012-13), Directorate of Animal Husbandry and Veterinary Services, Govt. of Tamil Nadu.NoTe: For the year 1993-94, data for Thanjavur district also includes Nagapattinam district; Madurai includes Dindigul; ramanathapuram includes
Sivaganga and Virudhunagar; Tirunelveli includes Thoothukkudi; Vellore includes Tiruvannamalai.

56
Dairying in Tamil naDu A Statistical Profile 2014 Part IV : Milk Production
National Dairy Development Board
District-wise In-milk bovine Population 1993-94 1997-98
2003-04 2007-08
2011-12 2012-13

57
Dairying in Tamil naDu A Statistical Profile 2014 Part IV : Milk Production
National Dairy Development Board
IV.1. Production Performance: Animal PopulationTable IV.1.3: Year and District-wise In-milk Indigenous Cattle Population
DistrictsIn-milk Indigenous Cattle Population (‘000)
1993-94 1997-98 2003-04 2007-08 2008-09 2009-10 2010-11 2011-12 2012-13TaMIl NaDU 1,490 1,241 1,312 793 782 779 842 823 725
Ariyalur 20
Chengalpattu MGR 137 119
Chennai 8 10 5 1 1 1 1 1
Coimbatore 58 49 34 7 8 7 5 5 6
Cuddalore 63 32 31 30 32 26 19
Dharmapuri 78 67 78 19 18 19 23 16 10
Dindigul 28 32 12 12 12 13 24 15
Erode 47 40 45 32 31 31 36 24 23
Kancheepuram 81 53 52 51 59 66 77
Kanniyakumari 12 12 9 1 1 1 1 2 1
Karur 19 13 13 14 14 12 9
Krishnagiri 33 33 30 34 29 23
Madurai 89 49 36 11 12 14 15 18 15
Nagapattinam 81 56 36 37 37 37 33 27
Namakkal 28 10 11 11 12 14 12
Perambalur 35 24 24 22 23 20 3
Pudukkottai 79 66 55 54 52 54 55 87 79
Ramanathapuram 94 27 30 19 18 19 15 1 2
Salem 99 89 48 31 30 32 38 30 26
Sivaganga 33 44 39 38 38 41 42 34
South Arcot 189 59
Thanjavur 190 73 40 47 49 48 49 39 36
The Nilgiris 7 7 6 4 3 4 2 1 2
Theni 24 5 5 5 5 5 4
Thiruvallur 55 41 41 40 43 35 15
Thiruvarur 42 40 38 37 39 23 18
Thoothukkudi 23 24 13 12 13 13 17 11
Tiruchirappalli 131 92 55 21 20 20 19 22 20
Tirunelveli 79 43 38 35 35 32 37 39 35
Tiruppur 8 7
Tiruvannamalai 82 86 38 37 38 40 35 36
Vellore 193 76 74 32 31 29 38 34 27
Viluppuram 102 153 79 78 77 87 94 95
Virudhunagar 16 18 13 14 12 14 21 19
Source: Integrated Sample Survey reports (1993-94 to 2012-13), Directorate of Animal Husbandry and Veterinary Services, Govt. of Tamil Nadu.NoTe: For the year 1993-94, data for Thanjavur district also includes Nagapattinam district; Madurai includes Dindigul; ramanathapuram includes
Sivaganga and Virudhunagar; Tirunelveli includes Thoothukkudi; Vellore includes Tiruvannamalai.

58
Dairying in Tamil naDu A Statistical Profile 2014 Part IV : Milk Production
National Dairy Development Board
District-wise In-milk Indigenous Cattle Population 1993-94 1997-98
2003-04 2007-08
2011-12 2012-13

59
Dairying in Tamil naDu A Statistical Profile 2014 Part IV : Milk Production
National Dairy Development Board
IV.1. Production Performance: Animal PopulationTable IV.1.4: Year and District-wise In-milk Crossbred Cattle Population
DistrictsIn-milk Crossbred Cattle Population (‘000)
1993-94 1997-98 2003-04 2007-08 2008-09 2009-10 2010-11 2011-12 2012-13TaMIl NaDU 461 644 904 1,759 1,784 1,814 2,251 2,309 2,245
Ariyalur 33
Chengalpattu MGR 14 25
Chennai 2 2 4 1 1 1 1 3
Coimbatore 24 33 72 121 121 123 126 72 74
Cuddalore 51 62 62 64 68 67 68
Dharmapuri 9 13 36 62 62 63 71 59 71
Dindigul 27 43 61 62 64 65 80 88
Erode 40 56 43 80 82 83 127 92 92
Kancheepuram 23 24 25 26 47 66 62
Kanniyakumari 26 33 28 42 43 45 50 30 23
Karur 13 24 25 25 32 32 26
Krishnagiri 55 59 60 63 59 58
Madurai 76 70 39 65 65 66 85 86 72
Nagapattinam 25 14 37 38 39 53 62 63
Namakkal 34 62 63 64 84 75 66
Perambalur 28 59 59 60 65 69 32
Pudukkottai 11 15 21 23 23 25 62 66 79
Ramanathapuram 32 23 15 22 22 23 31 31 31
Salem 36 40 52 146 146 148 158 167 168
Sivaganga 8 14 22 23 24 31 37 27
South Arcot 54 31
Thanjavur 33 24 31 71 71 71 77 82 87
The Nilgiris 7 11 21 21 23 22 27 25 14
Theni 25 31 32 33 38 57 51
Thiruvallur 22 27 28 29 63 46 61
Thiruvarur 17 54 56 54 57 53 37
Thoothukkudi 11 20 37 38 39 51 87 47
Tiruchirappalli 34 46 27 82 82 83 89 93 111
Tirunelveli 19 18 37 102 105 106 129 108 113
Tiruppur 92 65
Tiruvannamalai 34 53 83 84 85 169 169 188
Vellore 45 46 78 116 116 118 131 156 158
Viluppuram 40 26 98 98 99 120 119 116
Virudhunagar 13 20 72 72 72 83 69 65
Source: Integrated Sample Survey reports (1993-94 to 2012-13), Directorate of Animal Husbandry and Veterinary Services, Govt. of Tamil Nadu.NoTe: For the year 1993-94, data for Thanjavur district also includes Nagapattinam district; Madurai includes Dindigul; ramanathapuram includes
Sivaganga and Virudhunagar; Tirunelveli includes Thoothukkudi; Vellore includes Tiruvannamalai.

60
Dairying in Tamil naDu A Statistical Profile 2014 Part IV : Milk Production
National Dairy Development Board
District-wise In-milk Crossbred Cattle Population
1993-94 1997-98
2003-04 2007-08
2011-12 2012-13

61
Dairying in Tamil naDu A Statistical Profile 2014 Part IV : Milk Production
National Dairy Development Board
IV.1. Production Performance: Animal PopulationTable IV.1.5: Year and District-wise In-milk buffalo Population
DistrictsIn-milk buffalo Population (‘000)
1993-94 1997-98 2003-04 2007-08 2008-09 2009-10 2010-11 2011-12 2012-13TaMIl NaDU 1,132 1,213 947 500 494 491 549 520 439
Ariyalur 4
Chengalpattu MGR 142 140
Chennai 19 17 9 1 1 1 2 2
Coimbatore 57 62 31 12 12 12 11 4 4
Cuddalore 26 12 11 10 15 11 5
Dharmapuri 40 44 50 30 30 30 32 21 25
Dindigul 55 38 19 19 20 23 25 28
Erode 96 100 91 71 70 72 75 58 41
Kancheepuram 62 32 30 29 40 44 47
Kanniyakumari 8 10 4 2 3 2 2 2 0
Karur 29 21 20 23 22 19 17
Krishnagiri 7 8 9 7 8 4
Madurai 100 58 25 8 7 8 7 6 3
Nagapattinam 60 29 14 12 13 13 12 9
Namakkal 95 59 61 62 61 60 52
Perambalur 26 6 6 6 8 6 1
Pudukkottai 41 44 27 8 9 9 10 18 16
Ramanathapuram 49 11 10 3 3 2 2 1 2
Salem 160 167 58 56 56 56 65 45 35
Sivaganga 16 11 3 3 3 3 2 2
South Arcot 62 24
Thanjavur 92 56 20 12 12 10 11 8 9
The Nilgiris 4 4 2 1 1 1 1 1 1
Theni 16 5 4 4 4 2 2
Thiruvallur 70 33 33 33 40 42 36
Thiruvarur 21 6 5 5 5 4 2
Thoothukkudi 25 14 7 6 6 19 13 8
Tiruchirappalli 105 111 33 13 14 14 15 15 12
Tirunelveli 78 61 36 22 21 19 21 31 29
Tiruppur 19 19
Tiruvannamalai 29 24 7 7 6 8 8 5
Vellore 80 59 37 11 10 9 10 13 9
Viluppuram 38 41 9 10 8 10 9 7
Virudhunagar 23 13 9 10 10 8 11 5
Source: Integrated Sample Survey reports (1993-94 to 2012-13), Directorate of Animal Husbandry and Veterinary Services, Govt. of Tamil Nadu.NoTe: For the year 1993-94, data for Thanjavur district also includes Nagapattinam district; Madurai includes Dindigul; ramanathapuram includes
Sivaganga and Virudhunagar; Tirunelveli includes Thoothukkudi; Vellore includes Tiruvannamalai.

62
Dairying in Tamil naDu A Statistical Profile 2014 Part IV : Milk Production
National Dairy Development Board
District-wise In-milk buffalo Population
1993-94 1997-98
2003-04 2007-08
2011-12 2012-13

63
Dairying in Tamil naDu A Statistical Profile 2014 Part IV : Milk Production
National Dairy Development Board
IV.2. Production Performance: Milk Yield Table IV.2.1: Year and District-wise bovine Milk Yield
Districtsbovine Milk Yield (kg/day)
1993-94 1997-98 2003-04 2007-08 2008-09 2009-10 2010-11 2011-12 2012-13TaMIl NaDU 3.13 3.59 4.12 5.01 5.08 5.13 5.14 5.23 5.63
Ariyalur 5.05
Chengalpattu MGR 3.27 3.16
Chennai 4.75 5.63 5.24 3.56 4.11 4.47 5.41 4.02
Coimbatore 3.92 4.28 5.12 6.52 5.89 6.42 6.58 6.48 7.03
Cuddalore 4.77 4.93 4.65 5.29 5.04 5.00 5.84
Dharmapuri 2.64 2.66 3.77 5.16 5.31 5.08 5.26 5.12 6.33
Dindigul 4.33 5.25 4.42 5.19 4.45 5.26 5.00 5.54
Erode 3.08 3.96 3.78 4.71 5.03 5.29 5.17 5.66 5.76
Kancheepuram 3.57 3.92 3.89 3.87 3.81 4.29 4.20
Kanniyakumari 4.05 5.22 5.31 7.68 8.09 8.16 7.98 8.20 8.06
Karur 4.13 5.20 5.01 4.83 4.85 5.29 5.10
Krishnagiri 4.96 5.55 5.37 5.28 5.70 6.31
Madurai 3.72 4.60 4.60 5.53 5.48 5.49 5.49 5.27 5.26
Nagapattinam 3.09 3.71 4.74 4.36 4.77 4.69 5.41 5.26
Namakkal 3.41 4.97 4.84 4.69 5.31 5.27 6.21
Perambalur 4.21 5.02 4.90 5.49 5.61 5.54 6.13
Pudukkottai 1.72 2.84 3.22 3.67 3.88 4.17 4.20 4.12 4.74
Ramanathapuram 2.81 4.17 3.69 4.17 4.04 4.32 4.48 4.99 5.14
Salem 3.06 2.95 4.41 5.30 5.06 5.36 5.04 5.47 6.46
Sivaganga 2.59 3.56 3.12 3.56 4.28 4.14 4.31 4.63
South Arcot 3.19 3.82
Thanjavur 2.17 2.81 3.90 4.15 4.56 4.90 4.73 5.08 5.43
The Nilgiris 3.52 6.28 5.70 9.45 10.67 10.42 11.41 9.09 7.88
Theni 4.97 4.74 5.72 5.36 5.99 5.72 6.08
Thiruvallur 4.17 4.20 4.25 4.16 4.36 4.21 5.37
Thiruvarur 3.21 4.40 4.47 4.45 4.59 5.01 4.79
Thoothukkudi 4.23 4.29 5.09 5.68 5.01 4.78 5.18 5.54
Tiruchirappalli 3.38 3.99 4.11 5.30 5.38 5.30 5.71 5.21 5.76
Tirunelveli 3.11 2.77 3.79 5.11 5.05 4.95 4.83 4.86 5.38
Tiruppur 6.01 6.09
Tiruvannamalai 3.59 4.35 5.48 5.58 5.64 5.36 5.48 6.51
Vellore 3.60 3.41 4.44 5.38 5.24 5.00 5.34 5.70 5.83
Viluppuram 3.88 3.33 4.92 4.80 4.91 4.68 4.81 4.81
Virudhunagar 3.32 5.02 5.68 5.99 5.54 5.44 5.31 5.29
Source: Integrated Sample Survey reports (1993-94 to 2012-13), Directorate of Animal Husbandry and Veterinary Services, Govt. of Tamil Nadu.NoTe: For the year 1993-94, data for Thanjavur district also includes Nagapattinam district; Madurai includes Dindigul; ramanathapuram includes
Sivaganga and Virudhunagar; Tirunelveli includes Thoothukkudi; Vellore includes Tiruvannamalai.

64
Dairying in Tamil naDu A Statistical Profile 2014 Part IV : Milk Production
National Dairy Development Board
District-wise In-milk bovine Milk Yield
1993-94 1997-98
2003-04 2007-08
2011-12 2012-13

65
Dairying in Tamil naDu A Statistical Profile 2014 Part IV : Milk Production
National Dairy Development Board
IV.2. Production Performance: Milk Yield Table IV. 2.2: Year and District-wise Indigenous Cattle Milk Yield
DistrictsIndigenous Cattle Milk Yield (kg/day)
1993-94 1997-98 2003-04 2007-08 2008-09 2009-10 2010-11 2011-12 2012-13TaMIl NaDU 2.36 2.40 2.66 2.76 2.77 2.78 2.52 2.58 2.72
Ariyalur 2.36
Chengalpattu MGR 3.01 2.23
Chennai 2.76 2.53 2.51 2.21 3.11 2.69 2.34 2.68
Coimbatore 2.73 1.99 3.02 2.95 2.38 3.02 2.86 2.56 2.98
Cuddalore 2.78 2.49 2.82 2.65 2.64 2.49 3.51
Dharmapuri 2.50 2.46 2.65 3.08 3.37 2.77 2.48 2.18 2.33
Dindigul 2.69 2.23 2.39 2.56 2.47 2.65 2.65 2.57
Erode 2.22 2.45 2.56 3.20 2.94 2.63 2.60 2.55 3.34
Kancheepuram 2.88 2.91 2.99 2.95 2.55 2.78 2.85
Kanniyakumari 2.42 1.97 2.48 3.18 3.22 3.67 2.61 3.00 2.57
Karur 3.05 3.00 2.63 2.83 2.75 2.81 2.29
Krishnagiri 2.68 2.94 2.38 2.55 2.35 2.33
Madurai 1.69 2.57 3.11 2.74 2.85 2.75 2.62 2.54 2.58
Nagapattinam 2.19 3.20 3.02 2.69 2.80 2.59 2.66 2.63
Namakkal 2.14 2.75 2.77 2.70 2.50 2.58 3.95
Perambalur 2.58 2.29 2.40 2.50 2.52 2.21 2.38
Pudukkottai 1.43 2.42 2.69 3.04 2.87 2.99 2.56 2.80 2.68
Ramanathapuram 2.17 2.54 2.72 2.97 2.98 2.91 2.56 2.77 2.57
Salem 2.63 2.59 2.56 3.38 3.01 2.96 2.57 2.24 1.96
Sivaganga 2.20 2.98 2.00 2.37 2.80 2.60 2.57 2.75
South Arcot 2.55 2.50
Thanjavur 1.42 1.92 2.14 2.45 2.25 2.56 2.65 2.67 2.79
The Nilgiris 1.74 2.79 2.63 3.35 3.77 2.96 2.55 2.34 2.76
Theni 3.14 2.90 3.01 3.20 2.71 2.53 2.66
Thiruvallur 2.49 2.73 2.86 2.87 2.38 2.58 2.78
Thiruvarur 2.56 2.82 2.14 2.60 2.62 2.70 2.28
Thoothukkudi 2.31 1.85 1.97 3.25 2.43 2.45 2.17 1.91
Tiruchirappalli 2.27 2.45 2.63 2.54 2.52 2.80 2.36 2.49 2.41
Tirunelveli 2.24 2.29 2.46 2.78 2.73 2.79 2.52 2.59 2.72
Tiruppur 2.59 2.72
Tiruvannamalai 2.45 3.33 2.92 2.66 2.58 2.35 2.30 4.76
Vellore 3.26 2.64 2.32 2.92 2.43 2.99 2.47 2.68 2.32
Viluppuram 2.71 2.40 2.74 3.31 2.97 2.43 2.63 2.44
Virudhunagar 2.22 2.58 2.27 2.72 2.65 2.38 2.51 1.80
Source: Integrated Sample Survey reports (1993-94 to 2012-13), Directorate of Animal Husbandry and Veterinary Services, Govt. of Tamil Nadu.NoTe: For the year 1993-94, data for Thanjavur district also includes Nagapattinam district; Madurai includes Dindigul; ramanathapuram includes
Sivaganga and Virudhunagar; Tirunelveli includes Thoothukkudi; Vellore includes Tiruvannamalai.

66
Dairying in Tamil naDu A Statistical Profile 2014 Part IV : Milk Production
National Dairy Development Board
District-wise Indigenous Cattle Milk Yield
1993-94 1997-98
2003-04 2007-08
2011-12 2012-13

67
Dairying in Tamil naDu A Statistical Profile 2014 Part IV : Milk Production
National Dairy Development Board
IV.2. Production Performance: Milk Yield Table IV.2.3: Year and District-wise Crossbred Cattle Milk Yield
DistrictsCrossbred Cattle Milk Yield (kg/day)
1993-94 1997-98 2003-04 2007-08 2008-09 2009-10 2010-11* 2011-12 2012-13TaMIl NaDU 4.87 5.72 6.18 6.25 6.33 6.39 6.39 6.41 6.81
Ariyalur 6.84
Chengalpattu MGR 4.92 5.69
Chennai 5.82 8.88 7.63 6.10 6.14 6.06 9.15 5.17
Coimbatore 5.43 5.45 6.33 7.02 6.36 6.85 6.94 6.82 7.56
Cuddalore 6.77 6.30 5.71 6.66 6.60 6.17 6.59
Dharmapuri 5.60 4.84 6.69 6.28 6.29 6.06 6.73 6.37 7.98
Dindigul 5.58 7.34 5.10 6.01 5.06 6.25 6.11 6.53
Erode 4.85 5.48 4.72 6.00 6.42 6.49 6.43 6.84 7.03
Kancheepuram 5.66 6.18 5.64 5.69 5.58 6.06 5.65
Kanniyakumari 4.71 7.04 6.59 7.76 8.38 8.55 8.24 9.00 8.21
Karur 5.07 7.44 6.95 6.44 6.22 6.81 7.13
Krishnagiri 6.47 7.21 7.09 6.86 7.55 7.91
Madurai 5.23 6.12 6.01 6.11 6.14 6.35 6.16 5.92 5.88
Nagapattinam 5.25 5.15 6.82 6.17 6.69 6.43 7.02 6.52
Namakkal 4.86 5.42 5.79 5.45 6.23 6.45 7.66
Perambalur 6.25 6.18 6.08 6.78 6.83 6.63 6.62
Pudukkottai 3.48 5.17 4.81 5.03 6.20 6.61 5.67 5.96 6.71
Ramanathapuram 4.45 6.10 5.15 5.46 5.01 5.49 5.46 5.17 5.48
Salem 4.35 7.05 6.84 6.10 5.72 6.23 6.09 6.33 7.60
Sivaganga 4.95 6.18 4.93 5.72 6.72 6.09 6.26 6.95
South Arcot 4.69 4.57
Thanjavur 4.34 4.83 5.10 5.33 6.13 6.55 6.21 6.23 6.53
The Nilgiris 6.41 9.54 6.74 10.99 11.98 11.97 12.29 9.40 8.74
Theni 7.19 5.22 6.33 5.95 6.67 6.10 6.55
Thiruvallur 6.74 5.85 5.83 6.20 6.02 5.74 6.45
Thiruvarur 4.93 5.55 6.08 5.80 6.12 6.11 5.92
Thoothukkudi 6.45 8.06 6.49 6.48 5.89 5.68 5.91 6.66
Tiruchirappalli 4.35 5.41 6.32 6.22 6.33 6.10 6.63 6.00 6.48
Tirunelveli 4.47 4.18 5.49 6.23 5.96 5.83 5.60 6.04 6.47
Tiruppur 6.78 6.92
Tiruvannamalai 5.55 5.85 6.72 7.11 7.13 6.07 6.24 6.90
Vellore 5.82 4.80 6.37 6.10 6.12 5.56 6.32 6.49 6.51
Viluppuram 6.52 6.02 6.72 6.09 6.55 6.47 6.61 6.77
Virudhunagar 4.30 7.79 6.59 6.89 6.29 6.11 6.47 6.38
Source: Integrated Sample Survey reports (1993-94 to 2012-13), Directorate of Animal Husbandry and Veterinary Services, Govt. of Tamil Nadu.* estimatedNoTe: For the year 1993-94, data for Thanjavur district also includes Nagapattinam district; Madurai includes Dindigul; ramanathapuram includes
Sivaganga and Virudhunagar; Tirunelveli includes Thoothukkudi; Vellore includes Tiruvannamalai.

68
Dairying in Tamil naDu A Statistical Profile 2014 Part IV : Milk Production
National Dairy Development Board
District-wise Crossbred Cattle Milk Yield
1993-94 1997-98
2003-04 2007-08
2011-12 2012-13

69
Dairying in Tamil naDu A Statistical Profile 2014 Part IV : Milk Production
National Dairy Development Board
IV.2. Production Performance: Milk Yield Table IV.2.4: Year and District-wise buffalo Milk Yield
Districtsbuffalo Milk Yield (kg/day)
1993-94 1997-98 2003-04 2007-08 2008-09 2009-10 2010-11 2011-12 2012-13TaMIl NaDU 3.44 3.68 4.13 4.15 4.22 4.25 4.04 4.09 4.40
Ariyalur 3.88
Chengalpattu MGR 3.35 3.49
Chennai 5.33 7.17 5.62 4.54 4.31 4.28 4.54 4.06
Coimbatore 4.56 5.50 4.61 3.64 3.61 4.18 4.22 4.07 4.31
Cuddalore 5.60 4.24 3.99 3.98 3.45 3.66 4.31
Dharmapuri 2.34 2.29 3.42 4.23 4.48 4.59 3.84 3.79 3.37
Dindigul 4.54 5.47 3.54 4.21 3.65 3.94 3.69 4.02
Erode 2.72 3.68 3.92 3.95 4.33 5.10 4.32 5.04 4.29
Kancheepuram 3.67 3.92 4.09 3.93 3.47 3.96 4.44
Kanniyakumari 4.58 3.41 3.21 5.65 5.40 3.42 3.86 3.93 3.76
Karur 4.40 4.19 4.23 4.42 4.45 4.42 3.48
Krishnagiri 3.15 3.95 3.84 3.94 3.78 5.27
Madurai 4.43 4.43 4.61 4.12 3.19 3.62 3.62 3.87 4.49
Nagapattinam 3.43 4.00 3.74 3.75 4.57 3.98 4.42 4.81
Namakkal 3.25 4.82 4.27 4.31 4.63 4.40 5.11
Perambalur 4.06 4.42 3.21 3.65 4.58 3.75 4.24
Pudukkottai 1.82 2.71 3.12 4.49 4.01 3.93 3.83 3.81 4.99
Ramanathapuram 2.99 4.36 4.44 3.79 3.63 3.55 3.68 3.48 3.17
Salem 3.04 2.17 3.72 4.26 4.38 4.44 3.93 4.44 4.48
Sivaganga 2.20 3.03 3.39 2.87 3.97 4.00 4.15 5.41
South Arcot 3.89 6.04
Thanjavur 2.94 3.53 5.52 3.47 4.68 4.14 3.78 4.31 4.55
The Nilgiris 1.75 4.81 3.06 4.52 5.56 4.32 7.02 3.89 4.26
Theni 4.39 3.70 3.88 3.74 3.59 3.70 4.33
Thiruvallur 4.73 4.68 4.69 3.93 3.89 3.77 4.56
Thiruvarur 3.00 4.86 4.92 3.79 3.96 3.60 4.46
Thoothukkudi 4.92 2.99 3.20 4.85 4.16 4.00 3.88 4.07
Tiruchirappalli 4.46 4.66 4.76 4.08 3.85 4.36 4.25 4.13 4.55
Tirunelveli 3.61 2.67 3.41 3.55 4.35 3.60 4.26 3.56 4.32
Tiruppur 3.64 4.49
Tiruvannamalai 4.41 4.68 4.86 3.54 3.64 4.04 3.65 3.97
Vellore 3.15 3.36 4.54 4.80 4.11 3.73 3.54 3.99 4.23
Viluppuram 4.28 5.01 5.00 3.93 3.34 3.40 3.65 4.39
Virudhunagar 3.53 3.80 2.87 4.23 3.62 3.76 3.53 4.89
Source: Integrated Sample Survey reports (1993-94 to 2012-13), Directorate of Animal Husbandry and Veterinary Services, Govt. of Tamil Nadu.NoTe: For the year 1993-94, data for Thanjavur district also includes Nagapattinam district; Madurai includes Dindigul; ramanathapuram includes
Sivaganga and Virudhunagar; Tirunelveli includes Thoothukkudi; Vellore includes Tiruvannamalai.

70
Dairying in Tamil naDu A Statistical Profile 2014 Part IV : Milk Production
National Dairy Development Board
District-wise buffalo Milk Yield
1993-94 1997-98
2003-04 2007-08
2011-12 2012-13
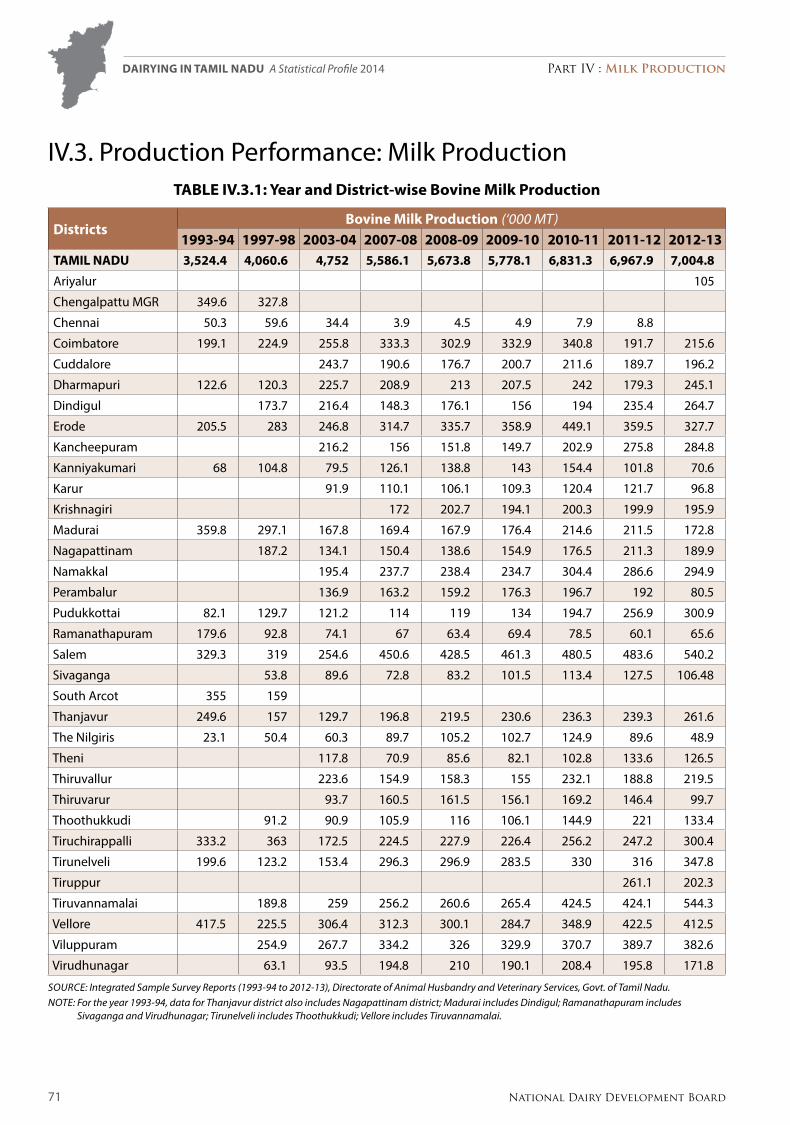
71
Dairying in Tamil naDu A Statistical Profile 2014 Part IV : Milk Production
National Dairy Development Board
IV.3. Production Performance: Milk ProductionTable IV.3.1: Year and District-wise bovine Milk Production
Districtsbovine Milk Production (‘000 MT)
1993-94 1997-98 2003-04 2007-08 2008-09 2009-10 2010-11 2011-12 2012-13TaMIl NaDU 3,524.4 4,060.6 4,752 5,586.1 5,673.8 5,778.1 6,831.3 6,967.9 7,004.8
Ariyalur 105
Chengalpattu MGR 349.6 327.8
Chennai 50.3 59.6 34.4 3.9 4.5 4.9 7.9 8.8
Coimbatore 199.1 224.9 255.8 333.3 302.9 332.9 340.8 191.7 215.6
Cuddalore 243.7 190.6 176.7 200.7 211.6 189.7 196.2
Dharmapuri 122.6 120.3 225.7 208.9 213 207.5 242 179.3 245.1
Dindigul 173.7 216.4 148.3 176.1 156 194 235.4 264.7
Erode 205.5 283 246.8 314.7 335.7 358.9 449.1 359.5 327.7
Kancheepuram 216.2 156 151.8 149.7 202.9 275.8 284.8
Kanniyakumari 68 104.8 79.5 126.1 138.8 143 154.4 101.8 70.6
Karur 91.9 110.1 106.1 109.3 120.4 121.7 96.8
Krishnagiri 172 202.7 194.1 200.3 199.9 195.9
Madurai 359.8 297.1 167.8 169.4 167.9 176.4 214.6 211.5 172.8
Nagapattinam 187.2 134.1 150.4 138.6 154.9 176.5 211.3 189.9
Namakkal 195.4 237.7 238.4 234.7 304.4 286.6 294.9
Perambalur 136.9 163.2 159.2 176.3 196.7 192 80.5
Pudukkottai 82.1 129.7 121.2 114 119 134 194.7 256.9 300.9
Ramanathapuram 179.6 92.8 74.1 67 63.4 69.4 78.5 60.1 65.6
Salem 329.3 319 254.6 450.6 428.5 461.3 480.5 483.6 540.2
Sivaganga 53.8 89.6 72.8 83.2 101.5 113.4 127.5 106.48
South Arcot 355 159
Thanjavur 249.6 157 129.7 196.8 219.5 230.6 236.3 239.3 261.6
The Nilgiris 23.1 50.4 60.3 89.7 105.2 102.7 124.9 89.6 48.9
Theni 117.8 70.9 85.6 82.1 102.8 133.6 126.5
Thiruvallur 223.6 154.9 158.3 155 232.1 188.8 219.5
Thiruvarur 93.7 160.5 161.5 156.1 169.2 146.4 99.7
Thoothukkudi 91.2 90.9 105.9 116 106.1 144.9 221 133.4
Tiruchirappalli 333.2 363 172.5 224.5 227.9 226.4 256.2 247.2 300.4
Tirunelveli 199.6 123.2 153.4 296.3 296.9 283.5 330 316 347.8
Tiruppur 261.1 202.3
Tiruvannamalai 189.8 259 256.2 260.6 265.4 424.5 424.1 544.3
Vellore 417.5 225.5 306.4 312.3 300.1 284.7 348.9 422.5 412.5
Viluppuram 254.9 267.7 334.2 326 329.9 370.7 389.7 382.6
Virudhunagar 63.1 93.5 194.8 210 190.1 208.4 195.8 171.8
Source: Integrated Sample Survey reports (1993-94 to 2012-13), Directorate of Animal Husbandry and Veterinary Services, Govt. of Tamil Nadu.NoTe: For the year 1993-94, data for Thanjavur district also includes Nagapattinam district; Madurai includes Dindigul; ramanathapuram includes
Sivaganga and Virudhunagar; Tirunelveli includes Thoothukkudi; Vellore includes Tiruvannamalai.

72
Dairying in Tamil naDu A Statistical Profile 2014 Part IV : Milk Production
National Dairy Development Board
District-wise bovine Milk Production
1993-94 1997-98
2003-04 2007-08
2011-12 2012-13

73
Dairying in Tamil naDu A Statistical Profile 2014 Part IV : Milk Production
National Dairy Development Board
IV.3. Production Performance: Milk ProductionTable IV.3.2: Year and District-wise Indigenous Cattle Milk Production
DistrictsIndigenous Cattle Milk Production (‘000 MT)
1993-94 1997-98 2003-04 2007-08 2008-09 2009-10 2010-11 2011-12 2012-13TaMIl NaDU 1,283.5 1,086.7 1,278.0 799.9 791.8 789.2 774.3 776.5 719.3
Ariyalur 17.5
Chengalpattu MGR 150.8 96.5
Chennai 7.8 8.9 4.3 0.6 1.0 1.0 1.4 1.1
Coimbatore 58.0 35.7 37.6 7.8 6.5 8.0 5.2 4.6 6.6
Cuddalore 64.2 28.9 31.9 28.9 28.9 23.6 23.8
Dharmapuri 70.6 60.1 75.5 20.8 22.4 19.3 22.3 13.0 8.9
Dindigul 27.6 26.2 10.1 10.7 10.8 12.6 23.1 14.0
Erode 38.2 36.1 42.3 37.3 33.5 29.4 33.0 22.4 27.5
Kancheepuram 85.4 55.9 56.5 54.3 56.4 67.3 80.3
Kanniyakumari 10.4 8.3 8.2 1.4 1.2 1.3 1.2 2.0 0.9
Karur 21.3 14.5 12.4 14.1 12.8 11.9 7.6
Krishnagiri 32.3 35.7 26.2 33.0 25.4 19.5
Madurai 54.1 46.3 41.4 11.3 12.7 13.6 14.0 16.4 13.7
Nagapattinam 65.1 65.4 39.8 35.9 37.7 33.5 32.2 26.0
Namakkal 21.6 10.3 10.6 11.0 10.9 12.9 16.3
Perambalur 33.1 20.3 20.6 20.6 21.9 16.8 2.1
Pudukkottai 41.1 58.0 53.7 59.4 54.9 58.8 51.5 89.2 77.4
Ramanathapuram 74.7 24.5 30.0 20.2 19.8 20.3 13.9 0.4 2.2
Salem 94.9 83.6 44.6 38.8 33.2 34.5 35.8 24.8 18.4
Sivaganga 26.4 47.6 28.6 32.6 39.0 40.4 39.6 34.5
South Arcot 175.3 53.7
Thanjavur 98.3 41.2 31.4 41.9 40.2 45.2 45.7 38.6 38.0
The Nilgiris 4.4 6.7 6.2 5.1 4.0 4.3 1.6 1.1 1.6
Theni 27.0 5.1 5.5 5.8 4.8 4.4 3.6
Thiruvallur 50.1 40.9 42.2 42.0 36.9 32.8 15.4
Thiruvarur 39.4 40.7 29.8 35.6 35.3 22.6 14.7
Thoothukkudi 19.0 16.3 9.4 14.2 11.5 11.4 13.9 7.6
Tiruchirappalli 108.3 82.2 52.7 19.2 17.9 20.7 17.4 19.8 17.9
Tirunelveli 66.3 36.1 34.1 35.9 35.0 32.2 33.3 37.2 34.7
Tiruppur 7.5 6.4
Tiruvannamalai 73.2 104.4 40.3 35.5 35.4 38.0 29.6 62.2
Vellore 230.3 73.5 63.0 33.5 27.1 32.0 33.8 33.2 22.9
Viluppuram 101.1 134.3 78.5 94.0 84.0 75.6 90.4 84.6
Virudhunagar 13.1 17.5 10.8 14.2 11.6 12.3 18.7 12.6
Source: Integrated Sample Survey reports (1993-94 to 2012-13), Directorate of Animal Husbandry and Veterinary Services, Govt. of Tamil Nadu.NoTe: For the year 1993-94, data for Thanjavur district also includes Nagapattinam district; Madurai includes Dindigul; ramanathapuram includes
Sivaganga and Virudhunagar; Tirunelveli includes Thoothukkudi; Vellore includes Tiruvannamalai.

74
Dairying in Tamil naDu A Statistical Profile 2014 Part IV : Milk Production
National Dairy Development Board
District-wise Indigeneous Cattle Milk Production
1993-94 1997-98
2003-04 2007-08
2011-12 2012-13
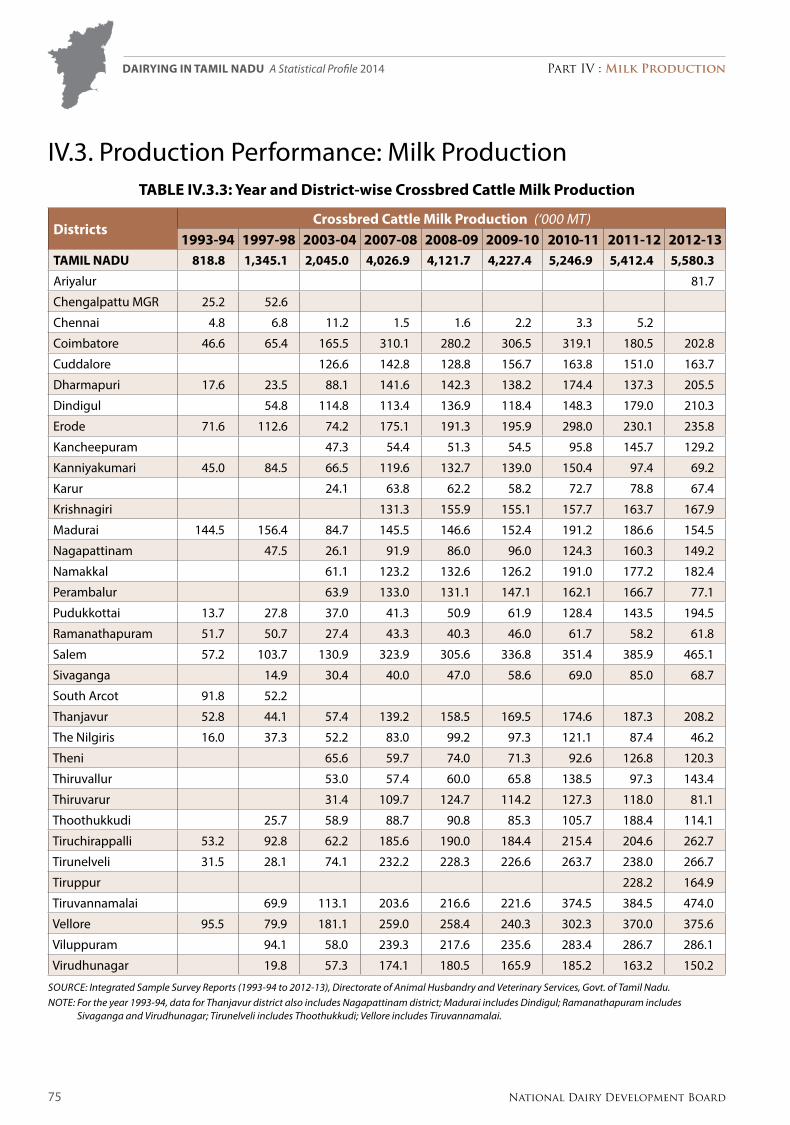
75
Dairying in Tamil naDu A Statistical Profile 2014 Part IV : Milk Production
National Dairy Development Board
IV.3. Production Performance: Milk ProductionTable IV.3.3: Year and District-wise Crossbred Cattle Milk Production
DistrictsCrossbred Cattle Milk Production (‘000 MT)
1993-94 1997-98 2003-04 2007-08 2008-09 2009-10 2010-11 2011-12 2012-13TaMIl NaDU 818.8 1,345.1 2,045.0 4,026.9 4,121.7 4,227.4 5,246.9 5,412.4 5,580.3
Ariyalur 81.7
Chengalpattu MGR 25.2 52.6
Chennai 4.8 6.8 11.2 1.5 1.6 2.2 3.3 5.2
Coimbatore 46.6 65.4 165.5 310.1 280.2 306.5 319.1 180.5 202.8
Cuddalore 126.6 142.8 128.8 156.7 163.8 151.0 163.7
Dharmapuri 17.6 23.5 88.1 141.6 142.3 138.2 174.4 137.3 205.5
Dindigul 54.8 114.8 113.4 136.9 118.4 148.3 179.0 210.3
Erode 71.6 112.6 74.2 175.1 191.3 195.9 298.0 230.1 235.8
Kancheepuram 47.3 54.4 51.3 54.5 95.8 145.7 129.2
Kanniyakumari 45.0 84.5 66.5 119.6 132.7 139.0 150.4 97.4 69.2
Karur 24.1 63.8 62.2 58.2 72.7 78.8 67.4
Krishnagiri 131.3 155.9 155.1 157.7 163.7 167.9
Madurai 144.5 156.4 84.7 145.5 146.6 152.4 191.2 186.6 154.5
Nagapattinam 47.5 26.1 91.9 86.0 96.0 124.3 160.3 149.2
Namakkal 61.1 123.2 132.6 126.2 191.0 177.2 182.4
Perambalur 63.9 133.0 131.1 147.1 162.1 166.7 77.1
Pudukkottai 13.7 27.8 37.0 41.3 50.9 61.9 128.4 143.5 194.5
Ramanathapuram 51.7 50.7 27.4 43.3 40.3 46.0 61.7 58.2 61.8
Salem 57.2 103.7 130.9 323.9 305.6 336.8 351.4 385.9 465.1
Sivaganga 14.9 30.4 40.0 47.0 58.6 69.0 85.0 68.7
South Arcot 91.8 52.2
Thanjavur 52.8 44.1 57.4 139.2 158.5 169.5 174.6 187.3 208.2
The Nilgiris 16.0 37.3 52.2 83.0 99.2 97.3 121.1 87.4 46.2
Theni 65.6 59.7 74.0 71.3 92.6 126.8 120.3
Thiruvallur 53.0 57.4 60.0 65.8 138.5 97.3 143.4
Thiruvarur 31.4 109.7 124.7 114.2 127.3 118.0 81.1
Thoothukkudi 25.7 58.9 88.7 90.8 85.3 105.7 188.4 114.1
Tiruchirappalli 53.2 92.8 62.2 185.6 190.0 184.4 215.4 204.6 262.7
Tirunelveli 31.5 28.1 74.1 232.2 228.3 226.6 263.7 238.0 266.7
Tiruppur 228.2 164.9
Tiruvannamalai 69.9 113.1 203.6 216.6 221.6 374.5 384.5 474.0
Vellore 95.5 79.9 181.1 259.0 258.4 240.3 302.3 370.0 375.6
Viluppuram 94.1 58.0 239.3 217.6 235.6 283.4 286.7 286.1
Virudhunagar 19.8 57.3 174.1 180.5 165.9 185.2 163.2 150.2
Source: Integrated Sample Survey reports (1993-94 to 2012-13), Directorate of Animal Husbandry and Veterinary Services, Govt. of Tamil Nadu.NoTe: For the year 1993-94, data for Thanjavur district also includes Nagapattinam district; Madurai includes Dindigul; ramanathapuram includes
Sivaganga and Virudhunagar; Tirunelveli includes Thoothukkudi; Vellore includes Tiruvannamalai.

76
Dairying in Tamil naDu A Statistical Profile 2014 Part IV : Milk Production
National Dairy Development Board
District-wise Crossbred Cattle Milk Production
1993-94 1997-98
2003-04 2007-08
2011-12 2012-13

77
Dairying in Tamil naDu A Statistical Profile 2014 Part IV : Milk Production
National Dairy Development Board
IV.3. Production Performance: Milk ProductionTable IV.3.4: Year and District-wise buffalo Milk Production
Districtsbuffalo Milk Production (‘000 MT)
1993-94 1997-98 2003-04 2007-08 2008-09 2009-10 2010-11 2011-12 2012-13TaMIl NaDU 1,422.1 1,628.8 1,429.0 759.3 760.3 761.5 810.1 779.0 705.2
Ariyalur 5.8
Chengalpattu MGR 173.6 178.7
Chennai 37.7 43.9 18.9 1.8 1.9 1.7 3.2 2.5
Coimbatore 94.5 123.8 52.7 15.4 16.2 18.4 16.5 6.6 6.2
Cuddalore 52.9 18.9 16.0 15.1 18.9 15.1 8.7
Dharmapuri 34.4 36.7 62.1 46.5 48.3 50.0 45.3 29.0 30.7
Dindigul 91.3 75.4 24.8 28.5 26.8 33.1 33.3 40.4
Erode 95.7 134.3 130.3 102.3 110.9 133.6 118.1 107.0 64.4
Kancheepuram 83.5 45.7 44.0 40.9 50.7 62.8 75.3
Kanniyakumari 12.6 12.0 4.8 5.1 4.9 2.7 2.8 2.4 0.5
Karur 46.5 31.8 31.5 37.0 34.9 31.0 21.8
Krishnagiri 8.4 11.1 12.8 9.6 10.8 8.5
Madurai 161.2 94.4 41.7 12.6 8.6 10.4 9.4 8.5 4.6
Nagapattinam 74.6 42.6 18.7 16.7 21.2 18.7 18.8 14.7
Namakkal 112.7 104.2 95.2 97.5 102.5 96.5 96.2
Perambalur 39.9 9.9 7.5 8.6 12.7 8.5 1.3
Pudukkottai 27.3 43.9 30.5 13.3 13.2 13.3 14.8 24.2 29.0
Ramanathapuram 53.2 17.6 16.7 3.5 3.3 3.1 2.9 1.5 1.6
Salem 177.2 131.7 79.1 87.9 89.7 90.0 93.3 72.9 56.7
Sivaganga 12.5 11.6 4.2 3.6 3.9 4.0 2.9 3.28
South Arcot 87.9 53.1
Thanjavur 98.5 71.7 40.9 15.7 20.8 15.9 16.0 13.4 15.4
The Nilgiris 2.7 6.4 1.9 1.6 2.0 1.1 2.2 1.1 1.1
Theni 25.2 6.1 6.1 5.0 5.4 2.4 2.6
Thiruvallur 120.5 56.6 56.1 47.2 56.7 58.7 60.7
Thiruvarur 22.9 10.1 7.0 6.3 6.6 5.8 3.9
Thoothukkudi 46.5 15.7 7.8 11.0 9.3 27.8 18.7 11.7
Tiruchirappalli 171.7 188.0 57.6 19.7 20.0 21.3 23.4 22.8 19.8
Tirunelveli 101.8 59.0 45.2 28.2 33.6 24.7 33.0 40.8 46.4
Tiruppur 25.4 31.0
Tiruvannamalai 46.7 41.5 12.3 8.5 8.4 12.0 10.0 8.1
Vellore 91.7 72.1 62.3 19.8 14.6 12.4 12.8 19.3 14.0
Viluppuram 59.7 75.4 16.4 14.4 10.3 11.7 12.6 11.9
Virudhunagar 30.2 18.7 9.9 15.3 12.6 10.9 13.9 9.0
Source: Integrated Sample Survey reports (1993-94 to 2012-13), Directorate of Animal Husbandry and Veterinary Services, Govt. of Tamil Nadu.NoTe: For the year 1993-94, data for Thanjavur district also includes Nagapattinam district; Madurai includes Dindigul; ramanathapuram includes
Sivaganga and Virudhunagar; Tirunelveli includes Thoothukkudi; Vellore includes Tiruvannamalai.

78
Dairying in Tamil naDu A Statistical Profile 2014 Part IV : Milk Production
National Dairy Development Board
District-wise buffalo Milk Production
1993-94 1997-98
2003-04 2007-08
2011-12 2012-13

79
Dairying in Tamil naDu A Statistical Profile 2014 Part IV : Milk Production
National Dairy Development Board
Tamil Nadu’s Milk Production (MMT) (Change due to no. of in-milk animals & average yield)
3.52
7.00
3.52
6.97
3.52
5.59
3.52
4.75
3.52
4.06
0.10
-0.04
0.87 0.52
2.962.58
2.111.130.520.02
3.52
3.52
bovine
Milk production in base year - 1993-1994 - MMT. Total milk production - MMT. Increase in total production due to change in numbers of in-milk animals - MMT. Increase in total milk production due to change in average yield - MMT.
0.71
buffalo
1993-94 1997-98 2003-04 2007-08 2011-12 2012-13
1.421.42
0.78
1.42
0.76
1.42
1.43
-0.26-0.84 -0.99-0.87
0.21 0.20 0.270.26
1.42
1.630.100.10
1.42
1.42
1993-94 1997-98 2003-04 2007-08 2011-12 2012-13

80
Dairying in Tamil naDu A Statistical Profile 2014 Part IV : Milk Production
National Dairy Development Board

81
Dairying in Tamil naDu A Statistical Profile 2014 Part IV : Milk Production
National Dairy Development Board
Tamil Nadu’s Milk Production (MMT) (Change due to no. of in-milk animals & average yield)
0.72
Indigenous Cattle
1.281.28
0.78
1.28
0.80
1.28
1.28
1.28
1.09
-0.16-0.22-0.60 -0.71-0.65
0.17 0.09 0.140.160.02
1.28
1.28
0.820.82
5.41 5.58
0.82
4.03
0.82
2.05
0.82
1.35 3.81 3.802.64
0.570.78 0.96
0.35
0.33
0.900.17
0.82
0.82
Crossbred Cattle
Milk production in base year - 1993-1994 - MMT. Total milk production - MMT. Increase in total production due to change in numbers of in-milk animals - MMT. Increase in total milk production due to change in average yield - MMT.
1993-94 1997-98 2003-04 2007-08 2011-12 2012-13
1993-94 1997-98 2003-04 2007-08 2011-12 2012-13

82
Dairying in Tamil naDu A Statistical Profile 2014 Part IV : Milk Production
National Dairy Development Board

83
Dairying in Tamil naDu A Statistical Profile 2014 Part IV : Milk Production
National Dairy Development Board
IV.3. Production Performance: Milk ProductionTable IV.3.5: Year and District-wise Milk Production Density
DistrictsMilk Production Density (kg/day/sq km)
1993-94 1997-98 2003-04 2007-08 2008-09 2009-10 2010-11 2011-12 2012-13TaMIl NaDU 74 85 100 117 119 121 144 146 147
Ariyalur 149
Chengalpattu MGR 122 114
Chennai 806 955 551 62 72 79 127 141
Coimbatore 73 82 94 122 111 122 125 111 125
Cuddalore 182 142 132 150 158 141 146
Dharmapuri 35 34 64 127 130 126 147 109 149
Dindigul 76 95 65 77 68 85 103 116
Erode 69 95 83 106 113 120 151 172 157
Kancheepuram 134 96 94 93 125 170 176
Kanniyakumari 111 172 130 207 227 234 253 167 116
Karur 87 104 100 103 114 115 92
Krishnagiri 92 108 103 107 106 104
Madurai 74 117 123 124 123 129 157 155 127
Nagapattinam 107 135 152 140 156 178 213 192
Namakkal 159 193 194 191 248 233 240
Perambalur 102 121 118 131 146 143 126
Pudukkottai 48 76 71 67 70 79 114 151 177
Ramanathapuram 39 62 50 45 42 46 53 40 44
Salem 105 102 134 237 226 243 253 255 284
Sivaganga 35 59 48 54 66 74 83 70
South Arcot 89 118
Thanjavur 83 127 105 159 177 186 191 193 211
The Nilgiris 25 54 65 97 113 111 135 96 53
Theni 100 60 72 69 87 113 107
Thiruvallur 179 124 127 124 186 151 176
Thiruvarur 122 210 211 204 221 191 130
Thoothukkudi 53 53 62 68 62 84 129 78
Tiruchirappalli 83 91 107 140 142 141 159 154 187
Tirunelveli 48 50 62 120 120 115 134 128 141
Tiruppur 138 107
Tiruvannamalai 82 112 111 113 115 184 184 236
Vellore 94 104 142 145 139 132 161 196 191
Viluppuram 97 102 127 124 125 141 148 145
Virudhunagar 41 60 126 136 123 135 126 111
Source: estimated from Integrated Sample Survey reports (1993-94 to 2012-13), Directorate of Animal Husbandry and Veterinary Services, Govt. of Tamil Nadu.NoTe: For the year 1993-94, data for Thanjavur district also includes Nagapattinam district; Madurai includes Dindigul; ramanathapuram includes
Sivaganga and Virudhunagar; Tirunelveli includes Thoothukkudi; Vellore includes Tiruvannamalai.

84
Dairying in Tamil naDu A Statistical Profile 2014 Part IV : Milk Production
National Dairy Development Board
District-wise Milk Production Density
1993-94 1997-98
2003-04 2007-08
2011-12 2012-13

85
Dairying in Tamil naDu A Statistical Profile 2014 Part IV : Milk Production
National Dairy Development Board
IV.4. Production Performance: Milk AvailabilityTable IV.4.1: Year and District-wise Per Capita Milk availability
DistrictsPer Capita availability of Milk (grams/day)
1993-94 1997-98 2003-04 2007-08 2008-09 2009-10 2010-11 2011-12 2012-13TaMIl NaDU 169 186 203 225 225 226 263 265 262
Ariyalur 378
Chengalpattu MGR 198 172
Chennai 35 39 21 2 3 3 5 5
Coimbatore 149 156 158 192 171 185 186 152 168
Cuddalore 285 211 193 217 225 199 204
Dharmapuri 134 123 209 406 407 390 447 326 438
Dindigul 256 301 197 231 203 249 299 332
Erode 238 313 253 301 315 331 407 437 392
Kancheepuram 193 122 115 110 144 189 189
Kanniyakumari 115 175 127 193 210 214 229 149 102
Karur 262 298 284 289 314 313 246
Krishnagiri 269 311 293 297 291 281
Madurai 187 227 173 163 159 164 197 191 153
Nagapattinam 217 243 263 241 267 302 358 319
Namakkal 348 400 395 383 490 455 461
Perambalur 309 353 341 374 413 398 385
Pudukkottai 166 253 223 201 208 232 333 435 504
Ramanathapuram 128 217 167 143 133 144 161 122 131
Salem 225 205 225 375 352 374 384 381 419
Sivaganga 131 206 158 178 214 235 261 215
South Arcot 196 171
Thanjavur 149 182 158 232 256 267 271 273 295
The Nilgiris 88 186 218 329 388 380 464 334 183
Theni 287 164 196 185 229 294 275
Thiruvallur 209 128 127 121 176 139 156
Thiruvarur 216 359 358 344 370 317 214
Thoothukkudi 164 155 173 188 170 229 346 207
Tiruchirappalli 217 227 191 237 238 233 261 249 299
Tirunelveli 136 128 151 277 274 259 297 281 306
Tiruppur 289 220
Tiruvannamalai 244 317 299 300 302 478 471 598
Vellore 221 188 235 228 217 203 246 294 284
Viluppuram 274 240 282 271 270 298 309 298
Virudhunagar 103 143 286 306 274 297 276 240
Source: estimated from Integrated Sample Survey reports (1993-94 to 2012-13), Directorate of Animal Husbandry and Veterinary Services, Govt. of Tamil Nadu.NoTe: For the year 1993-94, data for Thanjavur district also includes Nagapattinam district; Madurai includes Dindigul; ramanathapuram includes
Sivaganga and Virudhunagar; Tirunelveli includes Thoothukkudi; Vellore includes Tiruvannamalai.

86
Dairying in Tamil naDu A Statistical Profile 2014 Part IV : Milk Production
National Dairy Development Board
District-wise Per Capita Milk availability
1993-94 1997-98
2003-04 2007-08
2011-12 2012-13

87
Dairying in Tamil naDu A Statistical Profile 2014 Part IV : Milk Production
National Dairy Development Board
IV.5. Production Performance: Milk UtilisationTable IV.5.1: Milk Utilisation Pattern in Households (1993-94 to 2012-13)
(In Percent)
Items
1993-94 1997-98 2003-04 2007-08 2011-12 2012-13Co
w
buff
alo
Cow
buff
alo
Cow
buff
alo
Cow
buff
alo
Cow
buff
alo
Cow
buff
alo
Milk Sold as Fluid 78 86 84 82 86 85 86 89 87 88 88 88
Milk Consumed as Fluid 16 10 12 14 9 10 9 7 6 7 7 6
Milk Converted to Products 6 4 4 4 5 5 5 4 7 5 5 6
Source: Integrated Sample Survey reports (1993-94 to 2012-13), Directorate of Animal Husbandry and Veterinary Services, Govt. of Tamil Nadu.

88
Dairying in Tamil naDu A Statistical Profile 2014 Part IV : Milk Production
National Dairy Development Board

Part V : Veterinary Infrastructure And Service Delivery System
In Tamil Nadu, veterinary healthcare is being strengthened with focus on early diagnosis. To this end, the government is setting up new operation theatres in veterinary dispensaries, installed ultrasound scanners and modern outpatient buildings are to be constructed. The number of veterinary institutes in Tamil Nadu has almost doubled from 1,392 in 1997-98 to 2,579 in 2013-14.
The number of AI centres managed by the state government has increased to 3,429. The veterinarians carry out over 45 lakhs artificial inseminations annually. In addition to the state government, the dairy cooperatives also conduct about 17 lakhs AI per year.
In the area of disease prevention, the state government has increased the number of vaccination from a mere 3 lakhs in 1992-93 to 200 lakhs in 2013-14 after recent FMD outbreak. A total of 13 million bovine were treated in 2013-14, increased from 9 million in 2003-04.

Part V : Veterinary Infrastructure And Service Delivery System
90
Dairying in Tamil naDu A Statistical Profile 2014
National Dairy Development Board
V.1. Veterinary Infrastructure TABLE V.1.1: Year and District-wise Veterinary Institutes
DistrictsNumber of Veterinary Institutes
1997-98 2001-02 2003-04 2007-08 2008-09 2009-10 2010-11 2011-12 2012-13 2013-14TAMIL NADU 1,392 1,452 1,526 1,429 1,429 1,873 1,873 2,459 2,479 2,579
Ariyalur 24 31 40 40 41
Chennai 3 3 3 3 3 3 3 3 3 3
Coimbatore 76 77 85 86 86 68 68 92 92 101
Cuddalore 46 47 50 48 48 66 66 79 80 85
Dharmapuri 71 73 36 37 37 48 48 63 64 68
Dindigul 48 50 51 50 50 64 64 89 89 92
Erode 82 86 91 85 85 79 79 104 105 105
Kancheepuram 44 44 46 46 46 68 68 91 92 93
Kanniyakumari 32 36 39 35 35 41 41 53 53 53
Karur 25 27 28 26 26 36 36 52 52 56
Krishnagiri 40 40 40 49 49 61 62 70
Madurai 44 46 49 45 45 55 55 73 74 78
Nagapattinam 38 40 43 40 40 55 55 70 71 73
Namakkal 57 63 66 59 59 74 74 96 96 99
Perambalur 37 39 41 37 37 27 20 30 31 35
Pudukkottai 50 51 54 50 50 63 63 79 80 84
Ramanathapuram 32 32 34 31 31 39 39 55 56 56
Salem 71 75 77 81 81 106 106 137 138 144
Sivaganga 34 38 37 34 34 50 50 70 70 71
Thanjavur 67 71 73 66 66 82 82 104 105 108
The Nilgiris 18 18 19 18 18 22 22 26 26 29
Theni 33 34 9 0 0 36 36 47 47 49
Thiruvallur 42 44 50 43 43 62 62 81 82 85
Thiruvarur 44 45 46 40 40 53 53 69 69 69
Thoothukkudi 38 39 43 39 39 48 48 65 66 66
Tiruchirappalli 50 55 58 57 57 71 71 96 98 104
Tirunelveli 64 66 71 68 68 87 87 106 107 108
Tiruppur 27 30 30 66 66 91 91 96
Tiruvannamalai 63 63 65 56 56 80 80 105 106 112
Vellore 68 69 71 66 66 89 89 117 118 121
Viluppuram 78 81 83 77 77 112 112 146 147 153
Virudhunagar 37 40 41 36 36 50 50 69 69 72
(Veterinary Institutes includes Polyclinics, Clinician Centres, Veterinary Hospitals, Veterinary Dispensaries/Rural Veterinary Dispensaries/Mobile Veterinary Dispensaries/ Upgraded Veterinary Subcentres and Mobile Veterinary Units)
SoURCe: Directorate of Animal Husbandry and Veterinary Services, Govt. of Tamil Nadu, Chennai.

Part V : Veterinary Infrastructure And Service Delivery System
91
Dairying in Tamil naDu A Statistical Profile 2014
National Dairy Development Board
V.1. Veterinary Infrastructure TABLE V.1.2: District-wise AI Centres – Government Agencies
DistrictsNumber of AI Centres
1997-98 2001-02 2003-04 2007-08 2008-09 2009-10 2010-11 2011-12 2012-13 2013-14TAMIL NADU 3,518 3,575 3,569 3,258 3,258 3,258 3,358 3,359 3,429 3,429
Ariyalur 30 42 42 43 43
Chennai 12 12 12 3 3 3 3 3 7 7
Coimbatore 199 201 202 183 183 118 120 121 123 123
Cuddalore 150 148 148 137 137 137 141 141 144 144
Dharmapuri 139 142 63 63 63 62 68 68 71 71
Dindigul 176 178 178 164 164 164 168 168 170 170
Erode 189 194 194 178 178 122 125 124 126 126
Kancheepuram 138 137 137 128 128 129 132 132 132 132
Kanniyakumari 72 76 74 65 65 66 69 69 69 69
Karur 78 80 80 72 72 72 75 75 77 77
Krishnagiri 79 72 72 71 74 74 77 77
Madurai 155 157 157 144 144 144 145 145 149 149
Nagapattinam 90 92 91 84 84 84 87 87 89 89
Namakkal 105 111 110 98 98 98 101 101 103 103
Perambalur 78 75 75 68 68 38 34 34 36 36
Pudukkottai 123 124 124 111 111 111 115 115 117 117
Ramanathapuram 76 75 75 65 65 65 67 67 70 70
Salem 138 143 143 135 135 135 141 141 145 145
Sivaganga 123 128 127 117 117 117 118 118 120 120
Thanjavur 140 144 143 131 131 131 134 134 136 136
The Nilgiris 45 45 45 41 41 41 42 42 42 42
Theni 105 106 78 98 98 98 100 100 101 101
Thiruvallur 119 121 121 108 108 108 110 110 112 112
Thiruvarur 110 111 111 103 103 103 106 106 106 106
Thoothukkudi 111 112 112 101 101 101 101 104 105 105
Tiruchirappalli 129 134 134 124 124 124 127 127 131 131
Tirunelveli 141 143 143 132 132 132 139 136 139 139
Tiruppur 27 0 0 121 129 129 131 131
Tiruvannamalai 144 144 144 130 130 130 134 134 137 137
Vellore 147 149 149 137 137 137 142 143 148 148
Viluppuram 180 183 183 167 167 167 168 168 171 171
Virudhunagar 106 110 110 99 99 99 101 101 102 102
(AI Centres includes Polyclinics, Clinician Centres, Veterinary Hospitals, Veterinary Dispensaries/Rural Veterinary Dispensaries/Mobile Veterinary Dispensaries/ Upgraded Veterinary Subcentres, Mobile Veterinary Units and Subcentres)
SoURCe: Directorate of Animal Husbandry and Veterinary Services, Govt. of Tamil Nadu, Chennai.

Part V : Veterinary Infrastructure And Service Delivery System
92
Dairying in Tamil naDu A Statistical Profile 2014
National Dairy Development Board
V.1. Veterinary Infrastructure TABLE V.1.3: District-wise AI Centres – Cooperatives
DistrictsNumber of AI Centres
2007-08 2008-09 2009-10 2010-11 2011-12 2012-13TAMIL NADU 2,380 2,539 2,600 2,644 2,658 2,667
Ariyalur 11 8 8 8 11
Chennai 0 0 0 0 0 0
Coimbatore 185 191 196 206 210 210
Cuddalore 54 54 58 58 63 64
Dharmapuri 110 120 120 124 124 137
Dindigul 52 52 50 50 50 50
Erode 320 330 333 337 339 337
Kancheepuram 39 39 43 45 45 45
Kanniyakumari 18 18 18 18 18 18
Karur 55 60 59 63 63 65
Krishnagiri 49 49 49 55 55 54
Madurai 77 81 80 83 83 87
Nagapattinam 0 1 1 0 0 1
Namakkal 235 249 249 252 252 252
Perambalur 50 59 62 68 68 59
Pudukkottai 4 4 5 10 10 10
Ramanathapuram 12 15 15 12 12 12
Salem 360 372 372 372 372 372
Sivaganga 69 69 86 81 81 66
Thanjavur 25 25 25 18 22 23
The Nilgiris 48 48 49 43 43 37
Theni 48 48 53 57 57 53
Thiruvallur 5 5 5 4 4 4
Thiruvarur 11 11 11 4 6 23
Thoothukkudi 14 14 13 16 16 20
Tiruchirappalli 77 85 96 96 96 96
Tirunelveli 58 58 53 60 62 65
Tiruppur 0 0 0
Tiruvannamalai 170 184 195 196 196 181
Vellore 115 121 118 122 120 126
Viluppuram 120 158 170 170 165 166
Virudhunagar 0 8 8 16 18 23
SoURCe: Directorate of Animal Husbandry and Veterinary Services, Govt. of Tamil Nadu, Chennai.
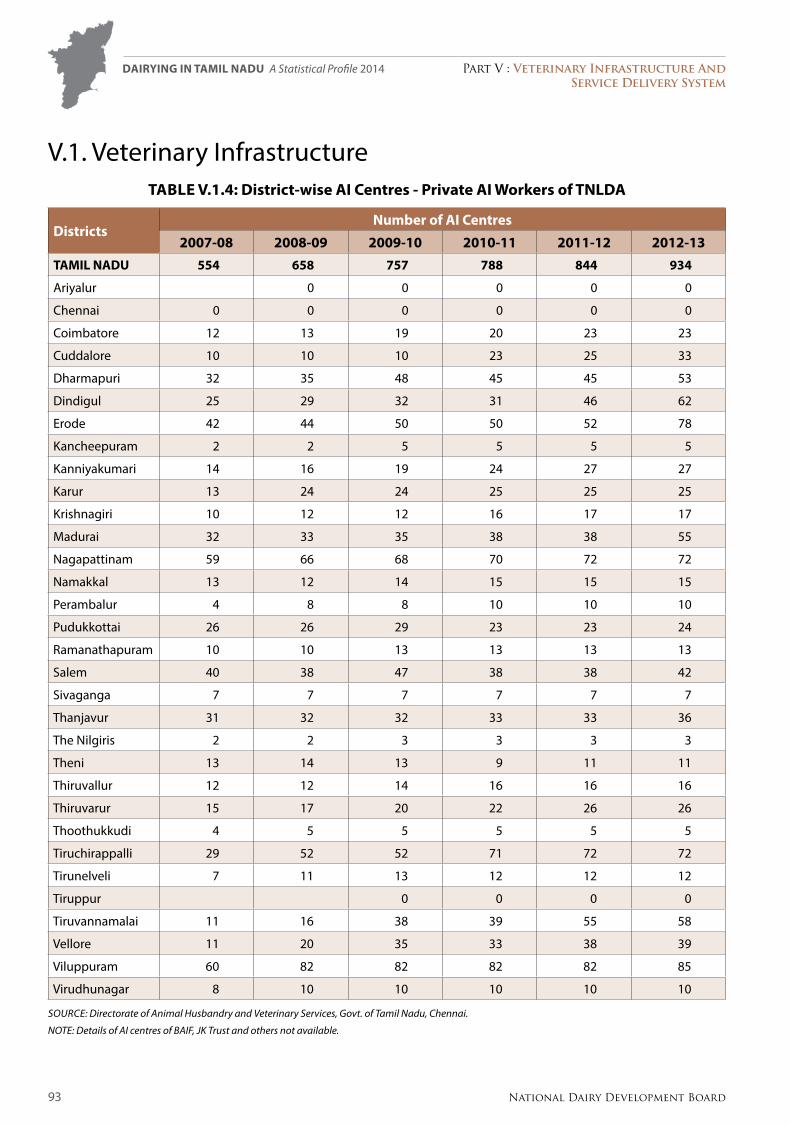
Part V : Veterinary Infrastructure And Service Delivery System
93
Dairying in Tamil naDu A Statistical Profile 2014
National Dairy Development Board
V.1. Veterinary Infrastructure TABLE V.1.4: District-wise AI Centres - Private AI Workers of TNLDA
DistrictsNumber of AI Centres
2007-08 2008-09 2009-10 2010-11 2011-12 2012-13TAMIL NADU 554 658 757 788 844 934
Ariyalur 0 0 0 0 0
Chennai 0 0 0 0 0 0
Coimbatore 12 13 19 20 23 23
Cuddalore 10 10 10 23 25 33
Dharmapuri 32 35 48 45 45 53
Dindigul 25 29 32 31 46 62
Erode 42 44 50 50 52 78
Kancheepuram 2 2 5 5 5 5
Kanniyakumari 14 16 19 24 27 27
Karur 13 24 24 25 25 25
Krishnagiri 10 12 12 16 17 17
Madurai 32 33 35 38 38 55
Nagapattinam 59 66 68 70 72 72
Namakkal 13 12 14 15 15 15
Perambalur 4 8 8 10 10 10
Pudukkottai 26 26 29 23 23 24
Ramanathapuram 10 10 13 13 13 13
Salem 40 38 47 38 38 42
Sivaganga 7 7 7 7 7 7
Thanjavur 31 32 32 33 33 36
The Nilgiris 2 2 3 3 3 3
Theni 13 14 13 9 11 11
Thiruvallur 12 12 14 16 16 16
Thiruvarur 15 17 20 22 26 26
Thoothukkudi 4 5 5 5 5 5
Tiruchirappalli 29 52 52 71 72 72
Tirunelveli 7 11 13 12 12 12
Tiruppur 0 0 0 0
Tiruvannamalai 11 16 38 39 55 58
Vellore 11 20 35 33 38 39
Viluppuram 60 82 82 82 82 85
Virudhunagar 8 10 10 10 10 10
SoURCe: Directorate of Animal Husbandry and Veterinary Services, Govt. of Tamil Nadu, Chennai.
NoTe: Details of AI centres of BAIF, JK Trust and others not available.

Part V : Veterinary Infrastructure And Service Delivery System
94
Dairying in Tamil naDu A Statistical Profile 2014
National Dairy Development Board

Part V : Veterinary Infrastructure And Service Delivery System
95
Dairying in Tamil naDu A Statistical Profile 2014
National Dairy Development Board
V.2. Service Delivery System - Artificial InseminationTABLE V.2.1: District-wise AI Performed by Government Agencies – Cattle
DistrictsNumber of AI Performed (‘000)
1992-93 1997-98 2003-04 2007-08 2008-09 2009-10 2010-11 2011-12 2012-13 2013-14TAMIL NADU 1,973.9 2,292.8 2,788.6 3,218.9 3,334.6 3,552.1 4,107.2 4,154.8 4,407.1 4,480.0
Ariyalur 67.5 69 72.8 71.6 72.6 78.1
Chennai 4.4 3.4 2.8 1.4 0.9 1.4 1.3 1.7 2.1 1.8
Coimbatore 195 223.6 256.3 251 250 161.7 191.9 229.7 245.3 226.3
Cuddalore 211.4 134.7 131.8 135.2 143 145.6 184.5 214.3 211.9 173.7
Dharmapuri 56.3 82.4 149.5 114 141.1 153.7 171.2 170.9 185.9 190.8
Dindigul 92.2 81.2 106.3 131.3 135.9 149.5 192.2 210.1 213.7 192.5
Erode 90.8 100.8 118 154.5 172.1 138.7 163.2 181.8 193.1 200.5
Kancheepuram 61.9 48.8 59.5 76.2 75.8 91.5 105.1 119.9 121.1 124.9
Kanniyakumari 57.1 59.1 79.3 75.7 78.8 80.4 89.6 95.1 97.7 99.3
Karur 37.7 34.4 52.5 57.8 71.4 94.2 94.4 91.2 91.2
Krishnagiri 102 121.7 130 142.7 145.5 148.3 161.2
Madurai 177.5 94.3 84.5 102.8 107.7 116.7 132.1 142 146.4 161
Nagapattinam 106 73.9 81 75.5 83.7 92.1 109.2 102.2 102.1 96.5
Namakkal 37.2 53.7 78.5 86.9 83.4 102 110.7 114.5 122.2
Perambalur 81.8 95.8 114.4 49.1 53 62.3 56.7 65.9 64
Pudukkottai 42.6 58.9 70.8 80 75 81.8 123.6 102.5 116.5 128
Ramanathapuram 14.9 14 16.5 16.2 16.9 19.6 24.8 24.8 29.3 32.4
Salem 113.4 96.6 154.9 156.3 148.4 143.1 177.9 215.1 267.6 237.4
Sivaganga 14.7 21.1 27.1 33.5 33.7 42.6 45.6 49.4 47.4 62.7
Thanjavur 117.7 148.2 170.8 200.9 214.2 210.3 239.4 205.6 205.5 200.7
The Nilgiris 8.3 9.1 11.1 17.7 18.1 23.6 24 23.4 24.2 24
Theni 59.1 67.6 67.8 72.5 68.1 74.2 58.3 65.7 73.1
Thiruvallur 44.7 52.9 54.2 58.8 64.9 76.9 84.9 84 90.7
Thiruvarur 83.1 89.2 100.8 97.1 109.1 114.7 100.6 125.8 116.8
Thoothukkudi 34.9 44.7 50.6 54.6 58.1 58.9 71.8 71 75 70.7
Tiruchirappalli 217.9 141.9 133.2 170.2 174.9 178 190.1 161.6 159.2 181.2
Tirunelveli 90.3 98.5 142.9 160.5 162.9 177.6 217.8 211.1 227.8 223.8
Tiruppur 141.7 156.7 168.2 195.1 184.8
Tiruvannamalai 90.2 87.6 138.9 153.2 162 183.8 201.3 180.7 189.9 222.4
Vellore 108.1 131.2 176.6 214.4 212.6 229.1 239.6 238.7 233.6 274.1
Viluppuram 116.2 141.3 179 164.4 190.6 219.1 215.7 244.9 264.2
Virudhunagar 68.3 79.1 91.3 94.6 93.1 91.2 95.4 96.4 104.3 109.1
SoURCe: Directorate of Animal Husbandry and Veterinary Services, Govt. of Tamil Nadu, Chennai. NoTe: AI done by private AI workers included.

Part V : Veterinary Infrastructure And Service Delivery System
96
Dairying in Tamil naDu A Statistical Profile 2014
National Dairy Development Board
V.2. Service Delivery System - Artificial InseminationTABLE V.2.2: District-wise AI Performed by Government Agencies – Buffaloes
DistrictsNumber of AI Performed (‘000)
1992-93 1997-98 2003-04 2007-08 2008-09 2009-10 2010-11 2011-12 2012-13 2013-14
TAMIL NADU 537.5 388.9 313.4 260.3 245.4 252.9 296.8 289.4 287.5 281.8
Ariyalur 2.3 2.4 2.6 2.2 2 1.7
Chennai 2.1 1.8 0.6 0.1 0.1 0.2 0.1 0.2 0.2 0.1
Coimbatore 40.3 25.4 22.1 9.6 9.1 5.8 20.2 3 4.5 2.4
Cuddalore 18.5 7.9 4.9 3.1 2.8 2.9 2.8 2.7 2.6 2
Dharmapuri 15.8 20.5 19.9 18.9 18.9 21.7 24.4 25.6 33.9 30
Dindigul 48.7 22.1 23.2 15.6 14.7 14.2 18.3 17.7 19.3 15.8
Erode 79.2 58.4 53.2 47.8 49.4 38 46.5 53.2 54.3 57
Kancheepuram 38.6 15.3 14.3 13.3 13 14.2 14.3 14.8 15.5 14.7
Kanniyakumari 2.7 1.9 1.2 0.7 0.6 0.6 0.5 0.6 0.4 0.6
Karur 18.3 21.5 12.6 11 14.7 20.4 19.1 17.7 22.6
Krishnagiri 3.6 3.6 4.5 6.5 5 3.8 3.7
Madurai 28.8 6.3 3.1 3.2 1.7 2.7 2.3 2.1 1.8 1.6
Nagapattinam 29 10.9 6.4 4.3 3.4 3 3.4 2.4 2 2
Namakkal 31.8 32.2 31.8 30.2 29.9 35.7 41.1 40 39.2
Perambalur 6.6 3.8 3.9 0.4 0.5 0.9 0.4 0.4 0.4
Pudukkottai 5.6 14.1 5.7 4.5 4.9 4.9 5.9 3.3 3.8 3.6
Ramanathapuram 0.8 0.5 0.4 0.3 0.2 0.2 0.1 0.1 0.1 0.1
Salem 79.9 43.3 30.1 23.5 21.9 21.9 21.6 23.8 25.8 23.1
Sivaganga 1.6 1.1 0.7 0.4 0.3 0.5 0.8 0.5 0.3 0.3
Thanjavur 32.9 25.4 14.2 9.3 9.1 8.6 8.6 8.3 5.3 4.4
The Nilgiris 0 0 0 0 0 0 0 0 0 0
Theni 3.1 2 1 0.7 0.7 0.7 0.8 0.5 0.9
Thiruvallur 9.9 7.8 7.4 6.5 6.5 8.3 8.4 6.8 7.4
Thiruvarur 9.5 3.4 4.1 2.2 2.2 3.9 5.1 1.9 1.2
Thoothukkudi 8.1 4.3 2.2 1.7 1.6 1.3 1.4 1.2 1.2 0.9
Tiruchirappalli 53.4 11.6 10.4 9.2 9.1 8.6 8 7.9 7.8 6.7
Tirunelveli 21.4 14.3 6.9 4.8 4.4 4.1 4.6 3.1 2.3 2.3
Tiruppur 16 18.8 20.8 21.4 22.5
Tiruvannamalai 7.8 3.7 2.7 2.7 2.9 2.9 3.6 3.1 3.3 4
Vellore 14.1 9 3.7 5.4 4.7 5.4 5.9 5.6 5.6 7.9
Viluppuram 8.4 15.7 16.7 15.3 13.3 5.2 6.8 2.7 2.3
Virudhunagar 8.2 3.5 1.2 0.7 0.6 0.5 0.6 0.5 0.3 0.3
SoURCe: Directorate of Animal Husbandry and Veterinary Services, Govt. of Tamil Nadu, Chennai.
NoTe: AI done by private AI workers included.

Part V : Veterinary Infrastructure And Service Delivery System
97
Dairying in Tamil naDu A Statistical Profile 2014
National Dairy Development Board
V.2. Service Delivery System - Artificial InseminationTABLE V.2.3: District-wise AI Performed by Government Agencies – Bovine
DistrictsNumber of AI Performed (‘000)
1992-93 1997-98 2003-04 2007-08 2008-09 2009-10 2010-11 2011-12 2012-13 2013-14
TAMIL NADU 2,511.4 2,681.7 3,102 3,479.2 3,580 3,805 4,404 4,444.2 4,694.6 4,761.8
Ariyalur 69.8 71.4 75.4 73.8 74.6 79.8
Chennai 6.5 5.2 3.4 1.5 1 1.6 1.4 1.9 2.3 1.9
Coimbatore 235.3 249 278.4 260.6 259.1 167.5 212.1 232.7 249.8 228.7
Cuddalore 229.9 142.6 136.7 138.3 145.8 148.5 187.3 217 214.5 175.7
Dharmapuri 72.1 102.9 169.4 132.9 160 175.4 195.6 196.5 219.8 220.8
Dindigul 140.9 103.3 129.5 146.9 150.6 163.7 210.5 227.8 233 208.3
Erode 170 159.2 171.2 202.3 221.5 176.7 209.7 235 247.4 257.5
Kancheepuram 100.5 64.1 73.8 89.5 88.8 105.7 119.4 134.7 136.6 139.6
Kanniyakumari 59.8 61 80.5 76.4 79.4 81 90.1 95.7 98.1 99.9
Karur 56 55.9 65.1 68.8 86.1 114.6 113.5 108.9 113.8
Krishnagiri 105.6 125.3 134.5 149.2 150.5 152.1 164.9
Madurai 206.3 100.6 87.6 106 109.4 119.4 134.4 144.1 148.2 162.6
Nagapattinam 135 84.8 87.4 79.8 87.1 95.1 112.6 104.6 104.1 98.5
Namakkal 69 85.9 110.3 117.1 113.3 137.7 151.8 154.5 161.4
Perambalur 88.4 99.6 118.3 49.5 53.5 63.2 57.1 66.3 64.4
Pudukkottai 48.2 73 76.5 84.5 79.9 86.7 129.5 105.8 120.3 131.6
Ramanathapuram 15.7 14.5 16.9 16.5 17.1 19.8 24.9 24.9 29.4 32.5
Salem 193.3 139.9 185 179.8 170.3 165 199.5 238.9 293.4 260.5
Sivaganga 16.3 22.2 27.8 33.9 34 43.1 46.4 49.9 47.7 63
Thanjavur 150.6 173.6 185 210.2 223.3 218.9 248 213.9 210.8 205.1
The Nilgiris 8.3 9.1 11.1 17.7 18.1 23.6 24 23.4 24.2 24
Theni 62.2 69.6 68.8 73.2 68.8 74.9 59.1 66.2 74
Thiruvallur 54.6 60.7 61.6 65.3 71.4 85.2 93.3 90.8 98.1
Thiruvarur 92.6 92.6 104.9 99.3 111.3 118.6 105.7 127.7 118
Thoothukkudi 43 49 52.8 56.3 59.7 60.2 73.2 72.2 76.2 71.6
Tiruchirappalli 271.3 153.5 143.6 179.4 184 186.6 198.1 169.5 167 187.9
Tirunelveli 111.7 112.8 149.8 165.3 167.3 181.7 222.4 214.2 230.1 226.1
Tiruppur 157.7 175.5 189 216.5 207.3
Tiruvannamalai 98 91.3 141.6 155.9 164.9 186.7 204.9 183.8 193.2 226.4
Vellore 122.2 140.2 180.3 219.8 217.3 234.5 245.5 244.3 239.2 282
Viluppuram 124.6 157 195.7 179.7 203.9 224.3 222.5 247.6 266.5
Virudhunagar 76.5 82.6 92.5 95.3 93.7 91.7 96 96.9 104.6 109.4
SoURCe: Directorate of Animal Husbandry and Veterinary Services, Govt. of Tamil Nadu, Chennai.
NoTe: AI done by private AI workers included.

Part V : Veterinary Infrastructure And Service Delivery System
98
Dairying in Tamil naDu A Statistical Profile 2014
National Dairy Development Board
V.2. Service Delivery System - Artificial InseminationTABLE V.2.4: District-wise AI Performed by Cooperatives - Cattle
DistrictsNumber of AI Performed (‘000)
2007-08 2008-09 2009-10 2010-11 2011-12 2012-13
TAMIL NADU 1,252.1 1,291.8 1,377.7 1,468.4 1,503.3 1,650.7
Ariyalur 4.5 6.2 7 9.3 7.6
Chennai 0 0 0 0 0
Coimbatore 78.3 82.4 89.2 110.2 119.4 124.3
Cuddalore 26 25.4 30.5 40.8 40.4 51.8
Dharmapuri 59.5 71.3 72.4 75.4 74.6 88.9
Dindigul 30.7 25.3 26.6 26.9 27.3 30
Erode 185.5 183.3 190.9 209.9 221.8 246
Kancheepuram 6.6 11.1 18 22 17.2 26.5
Kanniyakumari 5.3 6 6.4 6.3 5.3 5.6
Karur 19.6 20.9 23.5 25.3 26.1 22.5
Krishnagiri 31.7 35.3 33.1 32.9 28.8 41.8
Madurai 45.1 59.4 61.7 58.8 57.6 66.6
Nagapattinam 0 0.6 1.3 0 0 0.3
Namakkal 99.3 97.8 104.5 107.9 102.6 101.4
Perambalur 29.4 20.3 17.4 22 23.2 33.4
Pudukkottai 0 1.1 0.7 2.2 3.3 3.5
Ramanathapuram 2.9 2.9 3.3 4.4 5.1 7.1
Salem 199.1 194.5 174.5 168 175.1 177.8
Sivaganga 9.2 8.5 10.5 12.7 11.9 22.4
Thanjavur 12.8 6.2 9.3 11.7 18.3 23.2
The Nilgiris 10.2 8.4 7.9 7.2 7 8
Theni 34.6 42.9 48.2 52.8 47.1 44.7
Thiruvallur 0.6 1.3 1.6 1.6 1 3.3
Thiruvarur 8.5 7.4 12.1 4.1 4.4 7.7
Thoothukkudi 1.5 2.4 2.9 5.5 5.5 5.6
Tiruchirappalli 34.3 33.1 37 38.8 45.8 45.5
Tirunelveli 22.6 25 30 38 39.3 48.5
Tiruppur 0 0 0 0
Tiruvannamalai 136.1 139.5 152.1 149.7 155.2 144.9
Vellore 95.5 99.2 106.7 102.5 105.5 122.3
Viluppuram 67.1 74.3 96.1 117.8 117.9 131.9
Virudhunagar 0 1.6 3 6.2 6.9 7.6
SoURCe: Directorate of Animal Husbandry and Veterinary Services, Govt. of Tamil Nadu, Chennai.

Part V : Veterinary Infrastructure And Service Delivery System
99
Dairying in Tamil naDu A Statistical Profile 2014
National Dairy Development Board
V.2. Service Delivery System - Artificial InseminationTABLE V.2.5: District-wise AI Performed by Cooperatives - Buffaloes
DistrictsNumber of AI Performed (‘000)
2007-08 2008-09 2009-10 2010-11 2011-12 2012-13
TAMIL NADU 118.0 103.0 102.0 93.0 87.9 97.0
Ariyalur 0 0 0 0 0 0
Chennai 0 0 0 0 0 0
Coimbatore 0.7 0.3 0.5 0.4 0.4 0.2
Cuddalore 0.4 0.5 0.7 0.6 0.5 0.9
Dharmapuri 4.5 3.3 3.1 2.3 1.9 3.5
Dindigul 3.1 3.6 4.1 3.6 3.9 4.3
Erode 64.2 53.8 55.3 50.6 47.7 55.3
Kancheepuram 0.9 1.2 2.2 1.7 1.9 0.9
Kanniyakumari 0 0 0 0 0 0
Karur 1.7 1.4 1.8 1.7 1.8 1.4
Krishnagiri 1.5 1.5 0.9 1 0.5 1
Madurai 0 0 0 0 0* 0*
Nagapattinam 0 0 0 0 0 0
Namakkal 24.6 23.7 21.8 21.4 19.1 19.5
Perambalur 0.1 0* 0* 0* 0* 0
Pudukkottai 0 0 0 0.1 0 0
Ramanathapuram 0 0 0 0 0 0
Salem 13.3 11.6 9 6.9 7.9 7.8
Sivaganga 0 0 0 0 0 0
Thanjavur 0 0 0 0.1 0.3 0.2
The Nilgiris 0 0 0 0 0 0
Theni 0 0 0 0 0 0
Thiruvallur 0.1 0.2 0.3 0.1 0.2 0.3
Thiruvarur 0 0 0 0 0 0
Thoothukkudi 0* 0* 0.1 0* 0* 0
Tiruchirappalli 0.7 0.4 0.3 0.7 0.7 0.3
Tirunelveli 0.1 0.1 0.2 0.1 0.1 0*
Tiruppur 0 0 0 0 0 0
Tiruvannamalai 0.2 0.2 0.2 0.1 0 0
Vellore 0.3 0.4 0.3 0.6 0.1 0*
Viluppuram 1.7 0.8 1.4 1 0.9 1.3
Virudhunagar 0 0 0 0* 0* 0
* Negligible.SoURCe: Directorate of Animal Husbandry and Veterinary Services, Govt. of Tamil Nadu, Chennai.

Part V : Veterinary Infrastructure And Service Delivery System
100
Dairying in Tamil naDu A Statistical Profile 2014
National Dairy Development Board

Part V : Veterinary Infrastructure And Service Delivery System
101
Dairying in Tamil naDu A Statistical Profile 2014
National Dairy Development Board
V.2. Service Delivery System - Artificial InseminationTABLE V.2.6: District-wise AI Performed by Cooperatives - Bovine
DistrictsNumber of AI Performed (‘000)
2007-08 2008-09 2009-10 2010-11 2011-12 2012-13TAMIL NADU 1,370.1 1,394.8 1,479.8 1,561.4 1,591.2 1,747.7
Ariyalur 4.5 6.2 7 9.3 7.6
Chennai 0 0 0 0 0
Coimbatore 78.9 82.6 89.7 110.6 119.8 124.5
Cuddalore 26.4 25.9 31.2 41.4 40.9 52.7
Dharmapuri 64 74.6 75.5 77.7 76.5 92.3
Dindigul 33.8 28.8 30.7 30.5 31.3 34.3
Erode 249.7 237.1 246.2 260.5 269.5 301.3
Kancheepuram 7.5 12.3 20.2 23.7 19.1 27.4
Kanniyakumari 5.3 6 6.4 6.3 5.3 5.6
Karur 21.3 22.3 25.3 26.9 27.9 23.9
Krishnagiri 33.2 36.7 34 33.9 29.3 42.8
Madurai 45.1 59.4 61.7 58.8 57.6 66.6
Nagapattinam 0 0.6 1.3 0 0 0.3
Namakkal 123.9 121.4 126.3 129.3 121.7 120.9
Perambalur 29.5 20.3 17.4 22.1 23.2 33.4
Pudukkottai 0 1.1 0.7 2.2 3.3 3.5
Ramanathapuram 2.9 2.9 3.3 4.4 5.1 7.1
Salem 212.4 206.1 183.5 174.8 183 185.6
Sivaganga 9.2 8.5 10.5 12.7 11.9 22.4
Thanjavur 12.8 6.2 9.3 11.8 18.6 23.5
The Nilgiris 10.2 8.4 7.9 7.2 7 8
Theni 34.6 42.9 48.2 52.8 47.1 44.7
Thiruvallur 0.7 1.5 1.9 1.7 1.2 3.5
Thiruvarur 8.5 7.4 12.1 4.1 4.4 7.7
Thoothukkudi 1.5 2.4 2.9 5.6 5.5 5.6
Tiruchirappalli 35 33.5 37.3 39.5 46.5 45.8
Tirunelveli 22.6 25.1 30.2 38 39.4 48.5
Tiruppur 0 0 0 0
Tiruvannamalai 136.3 139.7 152.3 149.7 155.2 144.9
Vellore 95.9 99.6 106.9 103.1 105.7 122.3
Viluppuram 68.9 75.1 97.5 118.8 118.8 133.3
Virudhunagar 0 1.6 3 6.2 6.9 7.6
SoURCe: Directorate of Animal Husbandry and Veterinary Services, Govt. of Tamil Nadu, Chennai.

Part V : Veterinary Infrastructure And Service Delivery System
102
Dairying in Tamil naDu A Statistical Profile 2014
National Dairy Development Board
V.3. Service Delivery System - Animal HealthTABLE V.3.1: District-wise Vaccination Performed for Foot-and-Mouth Disease
by Government of Tamil Nadu
DistrictsFoot-and-Mouth Disease Vaccination (‘000)
1992-93 2001-02^ 2003-04 2007-08 2008-09 2009-10 2010-11 2011-12 2012-13 2013-14TAMIL NADU 321.9 354.3 2,128.1 7,541.2 13,390.2 9,525.9 8,832.2 13,194.3 10,266.1 20,080.9
Ariyalur 7.4 169.3 82 61.3 108.4 190.5 323.8
Chennai 0.2 7.1 0.3 1.2 2 1.7 1 6.7 23.5
Chengalpattu MGR 10.8
Coimbatore 11.8 21.0 97 328.6 527.9 542.1 265.8 267.4 327.8 615.2
Cuddalore 19.9 98.1 293.5 553.2 292.7 261.2 504.1 254.6 723
Dharmapuri 5.5 9.9 142.8 380.3 531.4 422 321.2 487.7 517.3 503.7
Dindigul 17.3 15.9 82.9 270.8 237.7 186.7 216.1 317.3 320.4 463.9
Erode 9.2 14.7 148.7 369.3 523.1 625.6 528.5 687.8 412.1 1,059.3
Kancheepuram 9.5 77.1 438.6 640.1 274.8 353.5 713.5 567.7 1,091.3
Kanniyakumari 6.2 45.9 41 0 0 0 0 0 0
Karur 6.6 44.2 35.7 400.9 146.1 279 301.6 141 261.6
Krishnagiri 269.9 601.7 299.5 23.6 573.1 484.1 1,067.9
Madurai 40.7 70.1 71.4 142.6 409.5 208.9 237.1 292.9 192 491.6
Nagapattinam 2.6 8.1 35.9 242.7 525.3 260.9 42.6 414.3 370 793.2
Namakkal 11.9 99.1 337.6 702.2 350.5 772.9 510.8 403.3 1,007.2
Perambalur 47.8 82.6 120.8 68 44.4 122.2 121.7 338.1
Pudukkottai 1.3 40.9 227.1 279.2 355.8 343 442.1 430.5 692
Ramanathapuram 13.3 1.8 22.6 51 139.0 111.4 73.6 179.9 126.6 193.3
Salem 16.5 19.2 86.2 480.2 1,179.9 540.5 1,089.6 970.9 721.6 968
Sivaganga 5.1 5.6 49.6 148.1 286.8 314.9 238.8 259.5 122.6 250.4
South Arcot 13.7
Thanjavur 10.7 17.6 91.4 396.7 662.7 314.9 341.8 465.9 415.7 687.8
The Nilgiris 33.2 47.2 16.9 50.9 9.8 6 58.7 74.8
Theni 0.3 40.9 95.8 179.7 541 70.7 96.1 100.9 161
Thiruvallur 7.9 120 366.1 290.2 332.4 208.4 381.1 234.6 664.3
Thiruvarur 17.7 9.5 458.1 558.4 270 270 287.8 288 639.4
Thoothukkudi 9.8 8.3 25.7 91 88.9 110.3 157.2 160.9 104.6 300.4
Tiruchirappalli 27.8 14.4 61.1 306.9 326.6 299.8 333.6 539.7 495.8 666.7
Tirunelveli 85.8 15.0 104.2 292.4 475.3 421.8 375.1 688.9 372.4 729.5
Tiruppur 338.9 406.1 490.2 414.6 424.4
Tiruvannamalai 9.9 13.7 127.5 430.1 826.9 330.9 454.2 770.7 712.8 1,429.7
Vellore 3.9 22.9 194.1 428.4 951.2 453.5 456 830 631.1 1,393.2
Viluppuram 8.1 86.7 336.2 749.7 695.3 412.2 979.3 497.3 1,541.7
Virudhunagar 18.9 6.8 36.7 152.3 433.9 282 183.5 343.6 228.8 501
NoTe: 2003-04 to 2013-14 FMD vaccination done for cattle only.^ Vaccination done by Veterinary Dispensaries and Mobile Veterinary Dispensaries.SoURCe: Annual Administrative Reports, Animal Husbandry Department, Tamil Nadu and Directorate of Animal Husbandry and Veterinary Services,
Govt. of Tamil Nadu, Chennai.

Part V : Veterinary Infrastructure And Service Delivery System
103
Dairying in Tamil naDu A Statistical Profile 2014
National Dairy Development Board
V.3. Service Delivery System - Animal HealthTABLE V.3.2: District-wise Vaccination Performed for Haemorrhagic Septicaemia
by Government of Tamil Nadu
DistrictsHaemorrhagic Septicaemia Vaccination (‘000)
1992-93 2001-02^ 2003-04 2007-08 2008-09 2009-10 2010-11 2011-12 2012-13 2013-14TAMIL NADU 1,226.1 1,169.7 1,084.1 2,543.3 2,046.0 581.4 371.3 708.1 460.7 508.9
Ariyalur 35.0 15.4 13 10.1 2.1 2.2 6.7
Chengalpattu MGR 190.9
Chennai 0.1 1.3 1.2 0.7 1.1 0* 0 0.4 0
Coimbatore 61.9 81.9 110.3 80.1 38.2 20.5 5.4 1.8 0 0.1
Cuddalore 79.7 48.9 125.9 77.8 6.8 3.6 1.5 0 0
Dharmapuri 96.9 39.9 38.9 10.8 1.4 3.5 6.1 0 0* 48.4
Dindigul 15.0 19.2 18.1 5.1 11.7 0* 0 0 0.3 0
Erode 25.5 54.3 51.8 4.7 16.9 23.2 4.5 14.8 0 7
Kancheepuram 52.9 97.8 428.3 410.8 82.3 47.4 589.2 353.3 76.2
Kanniyakumari 6.5 1.4 0.2 0.1 0.1 0 0.1 0 0
Karur 153.6 14.8 4.9 0.3 1.4 4.7 0 0 0.4
Krishnagiri 0 5.7 1.0 0.6 0 0 0 0
Madurai 19.0 10.2 20.6 28.4 18.8 10.7 13.8 7 4.9 10.5
Nagapattinam 112.9 27.3 12.7 9.9 48.7 6.2 11.6 9.5 26.8 100
Namakkal 48.5 25.4 4.3 1.8 0.7 4.6 1.5 0.8 15
Perambalur 22.1 27.8 7.4 8.6 6.2 3.7 0 0
Pudukkottai 44.4 28.8 47.4 0.5 11.9 4.9 0* 0.8 0.4
Ramanathapuram 15.7 10.8 8.2 3.3 0.5 2.1 3.1 0 0 0
Salem 96.3 88.2 97.4 11.3 0.9 0.3 0.6 1.4 12.2 0
Sivaganga 11.0 11.3 20.3 5.3 1.8 1.9 2.3 1.9 3.1 0.4
South Arcot 179.6
Thanjavur 66.5 78.3 25.8 5.5 7.7 6.2 18.9 4 1.9 0.3
The Nilgiris 4.8 0.3 1 0 0.4 1.1 0 0 0
Theni 0.3 8 41.9 15.2 5.5 3.7 0.3 0 2.8
Thiruvallur 26.6 69.9 322.8 36.6 50.8 53.5 42.3 33.1 0
Thiruvarur 28.1 13.9 12.7 15.0 4.2 3.1 0.3 0 100.6
Thoothukkudi 26.3 37.1 21.1 8.4 1.8 0.5 1.3 0 0 44.9
Tiruchirappalli 43.3 28.0 7.9 13.1 0.4 7.4 5 1.5 0.2 0
Tirunelveli 80.9 65.4 57.2 47.1 422.2 91.3 7.1 7.7 3.9 0.9
Tiruppur 1.7 0.4 0.5 0 0
Tiruvannamalai 56.9 40.7 49.8 36 12.0 7.4 24 8 5 1.3
Vellore 50.5 138.9 132.3 481.7 104.4 156.3 122.9 8.6 10.4 44.3
Viluppuram 5.1 59.5 759.4 771.0 53.3 0 0.2 0.8 48.8
Virudhunagar 20.6 8.4 19.6 8.8 4.8 1.5 1.6 0.2 0.5 0
* Negligible.^ Vaccination done by Veterinary Dispensaries and Mobile Veterinary Dispensaries.SoURCe: Annual Administrative Reports, Animal Husbandry Department, Tamil Nadu and Directorate of Animal Husbandry and Veterinary Services,
Govt. of Tamil Nadu, Chennai.

Part V : Veterinary Infrastructure And Service Delivery System
104
Dairying in Tamil naDu A Statistical Profile 2014
National Dairy Development Board
V.3. Service Delivery System - Animal HealthTABLE V.3.3: District-wise Vaccination Performed for Black Quarter
by Government of Tamil Nadu
DistrictsBlack Quarter Vaccination (‘000)
1992-93 2001-02^ 2003-04 2007-08 2008-09 2009-10 2010-11 2011-12 2012-13 2013-14TAMIL NADU 1,238 987.4 892.4 2,261.9 2,110.8 878.6 577.4 442.5 336.8 380.1
Ariyalur 20.3 13.3 13 7.7 5.2 3.7 2.8
Chennai 0 0 0.4 1.3 0 0 0.2 0 0 0
Chengalpattu MGR 59.2
Coimbatore 19.5 49.3 88.3 79.1 36.7 22.3 10.7 0.9 0 0.2
Cuddalore 88.4 33.5 202.5 266.2 64.4 40.4 33.8 57.2 54.1
Dharmapuri 109.7 47.1 32.6 23.1 1.6 2.5 1.1 0.8 0 0.7
Dindigul 15.5 19.1 17.5 18.1 225.6 68.5 4.5 12.1 0.3 0
Erode 34.4 53.1 43.2 24.6 376.6 89.5 63.3 16.9 22.4 18.4
Kancheepuram 29.5 21 388 20.6 93.8 67.3 94.8 102.3 137.2
Kanniyakumari 0.7 0.3 1.3 0.2 0.1 0* 0 0 0
Karur 12.4 14 5.1 177.1 72.4 36.7 23.2 6.1 0.9
Krishnagiri 0 10.6 2.1 1.1 0 0 0 0
Madurai 58.4 19.5 19.7 27.5 11.7 5.4 1.4 2 0.2 1.5
Nagapattinam 129.1 19.1 14 4.2 21.7 5.6 10.5 9.4 16.1 3.5
Namakkal 29.5 21.5 5.3 1.9 110 15.5 1.9 0.4 0
Perambalur 16.8 29.3 7.3 4.1 5.4 1.1 0 0
Pudukkottai 54.7 23.9 108.6 245.5 55.2 31.3 71 2 0.3
Ramanathapuram 41.8 7.9 4.3 2.4 0.1 0.3 0 0 0 0
Salem 98.6 88.1 82.6 12.1 2.3 4.4 91.1 3.5 0 13
Sivaganga 40.7 35.2 32.2 208.5 11.0 13.8 19 10.2 3.7 5.1
South Arcot 181.1
Thanjavur 82.4 93.6 35.4 134.3 42.7 38.9 25.7 30.6 6.3 5.9
The Nilgiris 6.2 0.8 3.2 60.0 0.6 16.8 0 0 0
Theni 0.2 6.5 23 13.9 3.2 1.1 0 0 0.5
Thiruvallur 17.1 54.5 34.5 16.5 10.6 18.2 12.2 38.1 0
Thiruvarur 26.5 13.4 9.6 32.4 8.8 4.6 0.4 0 0
Thoothukkudi 21.4 29.3 15.7 6.6 1.1 67.3 0 0 0 0
Tiruchirappalli 58.5 24.3 8.2 13.9 0.2 1.7 1 0.4 0 0
Tirunelveli 48.7 44.2 41.4 20.3 6.1 1.2 0.5 1.6 5 0
Tiruppur 13.8 1.7 0.2 0 0
Tiruvannamalai 106.4 61.6 48.6 42.9 21.3 14.7 16 4.2 3.1 25.5
Vellore 54.1 98.7 99.5 48.1 470.7 88 72.5 97.6 51 90.1
Viluppuram 64.6 82.4 764.1 20.8 2.5 11.7 8.2 19 20.6
Virudhunagar 16.7 8.8 20.5 9.8 2.8 0.9 1.6 0.2 0 0
* Negligible.^ Vaccination done by Veterinary Dispensaries and and Mobile Veterinary Dispensaries.SoURCe: Annual Administrative Reports, Animal Husbandry Department, Tamil Nadu and Directorate of Animal Husbandry and Veterinary Services,
Govt. of Tamil Nadu, Chennai.

Part V : Veterinary Infrastructure And Service Delivery System
105
Dairying in Tamil naDu A Statistical Profile 2014
National Dairy Development Board
V.3. Service Delivery System - Animal HealthTABLE V.3.4: District-wise Bovine Vaccination
DistrictsBovine Vaccination (‘000)
1992-93 2001-02^ 2003-04 2007-08 2008-09 2009-10 2010-11 2011-12 2012-13 2013-14TAMIL NADU 2,786 2,511 4,104 12,346 17,547 10,985 9,780 14,344 11,063 20,969
Ariyalur 62.7 198 108 79.1 115.7 196.4 333.3
Chengalpattu MGR 260.9
Chennai 0.3 0 8.8 2.8 1.9 3.1 1.7 1 7.1 23.5
Coimbatore 93.2 152.2 295.6 487.8 602.8 584.9 281.9 270.1 327.8 615.5
Cuddalore 188 180.5 621.9 897.2 363.9 305.2 539.4 311.8 777.1
Dharmapuri 212.1 96.9 214.3 414.2 534.4 428 328.4 488.5 517.3 552.8
Dindigul 47.8 54.2 118.5 294 475 255.2 220.6 329.4 320.7 463.9
Erode 69.1 122.1 243.7 398.6 916.6 738.3 596.3 719.5 434.5 1,084.7
Kancheepuram 91.9 195.9 1,254.9 1,071.5 450.9 468.2 1,397.5 1,023.3 1,304.7
Kanniyakumari 13.4 47.3 42.5 0.1 0.1 0 0.1 0 0
Karur 172.6 73 45.7 578.3 219.9 320.4 324.8 147.1 262.9
Krishnagiri 286.2 604.8 301.2 23.6 573.1 484.1 1,067.9
Madurai 118.1 99.8 111.7 198.5 440 225 252.3 301.9 197.1 503.6
Nagapattinam 244.6 54.5 62.6 256.8 595.7 272.7 64.7 433.2 412.9 896.7
Namakkal 89.9 146 347.2 705.9 461.2 793 514.2 404.5 1,022.2
Perambalur 86.7 139.7 135.5 80.7 56 127 121.7 338.1
Pudukkottai 100.4 93.6 383.1 525.2 422.9 379.2 513.1 433.3 692.4
Ramanathapuram 70.8 20.5 35.1 56.7 139.5 113.5 76.7 179.9 126.6 193.3
Salem 211.4 195.5 266.2 503.6 1,183.1 545.2 1,181.3 975.8 733.8 981
Sivaganga 56.8 52.1 102.1 361.9 299.6 330.6 260.1 271.6 129.4 255.9
South Arcot 374.4
Thanjavur 159.6 189.5 152.6 536.5 713.1 360 386.4 500.5 423.9 694
The Nilgiris 11 34.3 51.4 76.9 51.9 27.7 6 58.7 74.8
Theni 0.8 55.4 160.7 208.8 549.7 75.5 96.4 100.9 164.3
Thiruvallur 51.6 244.4 723.4 343.3 393.8 280.1 435.6 305.8 664.3
Thiruvarur 72.3 36.8 480.4 605.8 283 277.7 288.5 288 740
Thoothukkudi 57.5 74.7 62.5 106 91.8 178.1 158.5 160.9 104.6 345.3
Tiruchirappalli 129.6 66.7 77.2 333.9 327.2 308.9 339.6 541.6 496 666.7
Tirunelveli 215.4 124.6 202.8 359.8 903.6 514.3 382.7 698.2 381.3 730.4
Tiruppur 354.4 408.2 490.9 414.6 424.4
Tiruvannamalai 173.2 116 225.9 509 860.2 353 494.2 782.9 720.9 1,456.5
Vellore 108.5 260.5 425.9 958.2 1,526.3 697.8 651.4 936.2 692.5 1,527.6
Viluppuram 77.8 228.6 1,859.7 1,541.5 751.1 423.9 987.7 517.1 1,611.1
Virudhunagar 56.2 24 76.8 170.9 441.5 284.4 186.7 344 229.3 501
^ Vaccination done by Veterinary Dispensaries and Mobile Veterinary Dispensaries.Bovine Vaccination includes BQ, HS and FMD.SoURCe: Annual Administrative Reports, Animal Husbandry Department, Tamil Nadu and Directorate of Animal Husbandry and Veterinary Services
Govt. of Tamil Nadu, Chennai.

Part V : Veterinary Infrastructure And Service Delivery System
106
Dairying in Tamil naDu A Statistical Profile 2014
National Dairy Development Board
V.3. Service Delivery System - Animal HealthTABLE V.3.5: District-wise Bovine Treated
DistrictsBovine Treated (‘000)
2003-04 2007-08 2008-09 2009-10 2010-11 2011-12 2012-13 2013-14TAMIL NADU 9,472.1 10,353.2 10,093.9 10,102.0 10,676.9 10,381.4 11,451.8 13,295.8
Ariyalur 176.2 149.5 170.7 180.3 186.0 231.3
Chennai 10.9 11.3 10.7 7.6 11.1 13.5 5.5 5.3
Coimbatore 289.5 286.1 321.5 254.1 214.7 338.7 443.0 583.7
Cuddalore 420.0 336.9 388.5 395.9 399.4 440.6 411.7 452.6
Dharmapuri 455.8 235.1 239.5 271.6 290.5 294.7 357.8 463.6
Dindigul 353.5 401.3 357.6 382.9 456.2 405.9 463.0 513.4
Erode 473.6 576.3 556.8 359.9 435.3 418.9 429.7 517.0
Kancheepuram 404.3 385.4 380.7 398.0 400.8 340.0 367.5 407.9
Kanniyakumari 200.0 201.2 185.2 174.9 176.1 150.1 163.9 174.1
Karur 153.1 191.5 190.9 202.5 223.7 218.7 282.3 327.3
Krishnagiri 259.3 255.2 262.0 271.1 283.8 296.5 410.9
Madurai 297.9 369.1 352.4 377.6 414.0 378.0 411.4 435.5
Nagapattinam 208.0 173.4 180.2 189.4 195.2 171.2 292.4 279.0
Namakkal 354.5 446.5 465.5 454.8 491.7 485.0 585.5 583.7
Perambalur 285.9 326.3 130.1 125.1 165.1 173.3 220.9 259.0
Pudukkottai 165.9 274.6 257.5 266.1 315.6 283.5 258.0 406.8
Ramanathapuram 124.9 110.8 102.5 107.7 114.4 125.0 132.8 154.8
Salem 503.3 586.4 579.3 526.8 476.3 562.9 640.0 747.5
Sivaganga 175.3 187.3 169.6 169.6 177.5 162.2 152.4 178.5
Thanjavur 465.8 467.1 527.5 504.3 520.6 487.0 444.3 496.4
The Nilgiris 98.2 108.4 112.7 113.6 82.0 75.0 89.4 126.7
Theni 327.5 317.7 348.9 295.2 314.0 261.8 308.5 319.8
Thiruvallur 396.9 386.5 351.9 351.0 364.2 336.2 320.0 609.4
Thiruvarur 163.0 201.8 188.6 244.5 314.6 314.5 343.7 466.4
Thoothukkudi 176.0 163.4 143.2 132.0 147.6 140.3 144.4 164.8
Tiruchirappalli 433.6 600.5 540.6 472.3 469.4 439.5 446.1 551.1
Tirunelveli 334.5 377.3 365.6 372.3 438.2 424.2 416.3 453.5
Tiruppur 304.4 398.2 387.8 445.6 488.9
Tiruvannamalai 732.4 607.2 552.2 551.9 614.5 578.1 614.1 702.7
Vellore 564.5 698.3 679.5 667.7 683.3 602.8 782.2 832.3
Viluppuram 697.6 854.9 785.0 830.2 737.0 706.7 771.5 683.9
Virudhunagar 205.6 211.3 198.3 186.5 193.8 201.1 225.5 267.8
SoURCe: Directorate of Animal Husbandry and Veterinary Services, Govt. of Tamil Nadu, Chennai.

Part V : Veterinary Infrastructure And Service Delivery System
107
Dairying in Tamil naDu A Statistical Profile 2014
National Dairy Development Board
V.3. Service Delivery System - Animal HealthTABLE V.3.6: District-wise Bovine Castration
DistrictsBovine Castration (‘000)
2003-04 2007-08 2008-09 2009-10 2010-11 2011-12 2012-13 2013-14TAMIL NADU 207.4 208.3 208.4 224.2 206.0 201.1 159.3 165.1
Ariyalur 8.8 7.7 6.9 6.3 4.6 4.2
Chennai 0* 0.1 0* 0.1 0.1 0* 0* 0*
Coimbatore 4.2 9.3 11.0 5.6 6.3 3.8 4.4 4.8
Cuddalore 8.5 8.7 8.8 8.9 7.7 7.9 5.2 2.4
Dharmapuri 12.1 2.2 2.2 2.3 1.9 1.9 2.4 2.5
Dindigul 6.8 7.6 7.8 8.3 6.3 7.0 6.0 5.7
Erode 9.4 7.0 5.6 4.6 5.3 5.6 6.1 5.4
Kancheepuram 11.3 9.1 8.4 8.5 8.7 14.5 6.5 6.5
Kanniyakumari 1.0 1.0 1.0 0.9 1.0 0.9 0.7 0.6
Karur 4.6 3.3 6.3 2.2 3.1 2.8 2.3 1.9
Krishnagiri 7.9 8.5 7.9 8.6 7.8 6.6 6.9
Madurai 6.5 5.9 4.4 6.4 6.5 6.3 7.7 11.5
Nagapattinam 5.5 4.0 3.5 3.4 2.6 1.8 1.7 1.5
Namakkal 4.1 2.2 3.0 2.5 1.9 1.5 2.3 2.8
Perambalur 11.8 9.7 2.0 2.5 4.7 2.9 3.4 3.2
Pudukkottai 7.7 11.3 9.5 11.1 17.8 13.5 11.0 13.2
Ramanathapuram 2.8 4.9 2.8 3.1 2.5 2.8 2.4 2.9
Salem 13.4 9.5 12.0 9.8 6.1 8.3 7.0 5.9
Sivaganga 5.9 7.0 6.6 7.0 6.7 6.0 6.4 6.5
Thanjavur 13.8 18.6 20.1 20.2 16.1 15.3 10.0 7.1
The Nilgiris 0.7 1.6 0.9 1.0 0.6 0.1 0.1 0.2
Theni 3.8 3.5 3.3 3.7 3.5 5.1 3.6 5.1
Thiruvallur 7.8 6.9 6.5 7.0 4.9 7.1 4.6 1.7
Thiruvarur 11.1 12.8 14.8 17.6 18.5 19.8 8.0 8.5
Thoothukkudi 3.3 2.6 2.5 2.8 2.1 1.4 1.2 0.9
Tiruchirappalli 8.1 13.2 12.6 8.6 7.5 7.1 5.5 6.2
Tirunelveli 8.3 8.4 7.7 8.0 8.2 5.9 6.6 8.0
Tiruppur 5.6 9.4 5.0 4.9 4.1
Tiruvannamalai 16.9 13.2 12.6 13.7 12.3 11.1 10.4 8.8
Vellore 11.6 9.7 8.9 26.7 8.0 7.7 7.1 8.3
Viluppuram 5.6 5.9 5.2 5.4 9.0 12.9 9.5 15.9
Virudhunagar 0.8 1.1 1.0 1.3 1.4 1.0 1.3 2.1
*Negligible.
SoURCe: Directorate of Animal Husbandry and Veterinary Services, Govt. of Tamil Nadu, Chennai.

Part V : Veterinary Infrastructure And Service Delivery System
108
Dairying in Tamil naDu A Statistical Profile 2014
National Dairy Development Board

109 National Dairy Development Board
Part VI : Feed Resources
Tamil Nadu has a full-fledged institute, first of its kind in India, called “Institute of Animal Nutrition (IAN)” which is functioning at Post Graduate Research Institute in Animal Sciences campus, Kattupakkam (45 km from Chennai) since 1982. In addition, it has set-up an Animal Feed Analytical & Quality Laboratory at Namakkal in 1994. Considering the thrust on improving animal nutrition and feed resources, the deficiency of feed and fodder is likely to improve in Tamil Nadu.
Presently, the state needs around 50 million tonnes of dry matter as against availability of around 20 million tonnes. In a bid to overcome fodder shortages, the AH department is promoting cultivation of jowar green fodder. To this end, department is providing seed, fertiliser and offering 50 per cent subsidy on the production cost to progressive farmers. The area under the fodder crops has increased from 0.18 million hectare in 2000-01 to 0.24 million hectare in 2011-12.
Jowar, Cholam in Tamil is major fodder crop grown in the state. It is grown under the rain-fed as well as irrigated conditions in the districts of Coimbatore, Dindigul, Trichirapalli, Namakkal, Karur, Salem, Theni, Dharmapuri, Madurai and Vellore.
01

110
Dairying in Tamil naDu A Statistical Profile 2014 Part VI : Feed Resources
National Dairy Development Board
VI.1. Feed Resources - FodderTable VI.1.1: area under Fodder Crops and Gross Sown area
Districts
area Under Fodder Crops (‘000 ha) Gross Sown area (‘000 ha)20
00-0
1
2003
-04
2007
-08
2008
-09
2009
-10
2011
-12
2000
-01
2003
-04
2007
-08
2008
-09
2009
-10
2011
-12
TaMIl NaDU 188 224 172 173 173 240 6,338 5,316 5,815 5,824 5,572 5,890
Ariyalur 0.1 0.2 0.1 116 111 105
Chennai
Coimbatore 1.4 1.9 1.6 2.5 0.9 7.8 337 330 322 191 189 169
Cuddalore 0* 0* 0.1 0.1 0* 0.2 297 274 290 285 285 300
Dharmapuri 4.1 3.1 0.4 0.6 1.4 16.3 486 161 180 173 178 245
Dindugul 0.1 0.5 2.8 4.2 2.4 4.3 246 242 245 235 223 228
Erode 55.1 86.0 66.7 37.5 37.3 36.6 346 244 308 239 225 223
Kanchipuram 0* 0* 0* 0* 0* - 183 161 137 132 127 127
Kanyakumari - - - - - - 98 88 91 89 88 88
Karur 0.4 1.4 6.1 7.2 7.6 8.5 105 90 100 99 97 95
Krishnagiri 0.7 2.3 1.7 1.8 4.9 200 187 182 182 222
Madurai 2.7 3.8 5.1 2.7 2.0 1.8 163 108 151 151 127 141
Nagapattinam 0* - 0.1 0* 0* - 257 198 282 299 269 288
Namakkal 50.7 58.7 39.2 33.7 39.4 38.9 271 207 184 183 175 182
Perambalur 0.4 0.6 1.1 0.7 1.6 1.5 233 220 222 101 96 108
Pudukkottai 0* - 0* 0* 0* 0.1 161 137 153 154 152 159Ramanathapuram 0.6 0.5 0.2 0.1 0.1 0.1 184 190 187 189 191 191
Salem 38.0 30.6 20.7 25.0 24.6 59.9 398 216 218 259 249 323
Sivaganga 0.1 0.2 0.1 0.1 0.1 0.1 117 112 112 113 110 122
Thanjavur 0.2 0.2 0.2 0.2 0.2 0.2 272 194 280 273 255 285
The Nilgiris - - - - - - 77 78 78 78 77 76
Theni 0.5 1.0 1.1 0.8 0.9 0.8 123 115 120 126 124 144
Thiruppur 29.0 29.2 34.9 202 195 198
Thiruvallur 0* 0* 0* 0* 0* 0* 157 135 132 131 127 133
Tiruchirapalli 0.7 2.3 4.1 5.2 4.0 2.9 196 158 192 194 181 164
Tirunelveli 3.4 5.8 3.8 2.7 3.3 1.9 177 148 192 194 183 179
Tiruvannamalai 0* - 0.1 0.1 0.1 0.7 270 260 275 268 236 257
Tiruvarur 0* 0* - - 0.0 0.0 257 162 263 263 258 280
Toothukkudi 15.4 16.2 8.1 8.6 8.7 8.4 165 166 181 185 183 183
Vellore 0.3 0.4 0.6 0.6 0.6 1.7 254 222 222 212 193 191
Villupuram 0.4 0.0 0.5 0.5 0.7 0.5 372 356 374 371 363 361
Virudhunagar 13.4 10.3 7.4 9.2 5.8 6.8 138 142 135 140 122 124
* Negligible.Source: Directorate of economics and Statistics, Department of Agriculture and cooperation, Ministry of Agriculture, Govt. of India. – Means not reported/not available or reported zero.

111
Dairying in Tamil naDu A Statistical Profile 2014 Part VI : Feed Resources
National Dairy Development Board
VI.1. Feed Resources - FodderTable VI.1.2: District-wise Irrigated and Unirrigated area under Jowar Fodder Crop
DistrictsJowar (Cholam) (ha)
2007-08 2012-13Irrigated Unirrigated Total Irrigated Unirrigated Total
TaMIl NaDU 10,980 150,403 161,383 34,667 132,012 166,679
Ariyalur 1 177 178
Chennai 0 0 0
Coimbatore 158 497 655 192 2,474 2,666
Cuddalore 1 3 4 3 95 98
Dharmapuri 176 85 261 1,699 2,329 4,028
Dindigul 85 2,630 2,715 2,633 3,460 6,093
Erode 6,669 52,920 59,589 11,745 27,837 39,582
Kancheepuram 0 0 0 0 0 0
Kanniyakumari 0 0 0 0 0 0
Karur 59 5,920 5,979 766 7,268 8,034
Krishnagiri 53 2,138 2,191 549 1,854 2,403
Madurai 101 4,768 4,869 95 1,022 1,117
Nagapattinam 0 0 0 0 0 0
Namakkal 1,126 37,620 38,746 952 4,149 5,101
Perambalur 86 993 1,079 253 1,491 1,744
Pudukkottai 15 0 15 164 16 180
Ramanathapuram 0 133 133 0 2 2
Salem 1,253 19,200 20,453 11,553 33,600 45,153
Sivaganga 4 15 19 10 2 12
Thanjavur 0 0 0 35 0 35
The Nilgiris 0 0 0 0 0 0
Theni 141 665 806 316 483 799
Tiruppur 1,635 32,253 33,888
Thiruvallur 1 0 1 1 0 1
Tiruvannamalai 37 3 40 175 12 187
Thiruvarur 0 0 0 0 0 0
Thoothukkudi 65 8,003 8,068 31 6,500 6,531
Tiruchirappalli 90 3,923 4,013 145 1,578 1,723
Tirunelveli 368 3,268 3,636 332 1,057 1,389
Vellore 394 178 572 1,146 146 1,292
Villuppuram 55 335 390 168 288 456
Virudhunagar 43 7,106 7,149 68 3,919 3,987
Source: Season and crop report Tamil Nadu, Department of economic and Statistics, Govt. of Tamil Nadu.

112
Dairying in Tamil naDu A Statistical Profile 2014 Part VI : Feed Resources
National Dairy Development Board

113
Dairying in Tamil naDu A Statistical Profile 2014 Part VI : Feed Resources
National Dairy Development Board
VI.2. Feed Resources - Availability vs. RequirementTable VI.2.1: District-wise Dry Matter (DM) availability, Requirement and balance
Districtsavailable/ Required/
balance
Dry Matter availability, Requirement and balance (‘000 MT)
2003 2007 2008 2009 2010 2011Ariyalur Available 223.94 369.3 369.32 398.94
Required 629.86 630.35 630.86 631.39Balance -405.92 -261.05 -261.54 -232.45
Coimbatore Available 394.37 823.49 749.33 749.33 331.82 384.11Required 1,554.58 2,181.58 2,221.29 2,268.65 Balance -1,160.21 -1,358.09 -1,471.96 -1,519.32
Cuddalore Available 979.94 1,182.11 839.45 839.45 954.39 876.64Required 1,074.15 1,027.06 1,025.1 1,029.03 1,038.4 1,052.92Balance -94.21 155.05 -185.65 -189.58 -84.01 -176.28
Dharmapuri Available 616.7 618.94 584.54 584.54 519.9 767.2Required 1,249.67 1,540.56 1,631.35 1,739.05 1,865.53 2,013.08Balance -632.97 -921.62 -1,046.81 -1,154.51 -1,345.63 -1,245.88
Dindigul Available 627.59 973.93 1,335.03 1,335.03 1,119.77 1,236.325Required 1,059.83 1,118.71 1,150.2 1,186.92 1,228.97 1,276.59Balance -432.24 -144.78 184.83 148.11 -109.2 -40.265
Erode Available 1,192.05 1,375.17 1,375.17 982.48 954.289Required 2,563.26 2,687.42 2,836.91 3,014.9 3,225.28Balance -1,371.21 -1,312.25 -1,461.74 -2,032.42 -2,270.99
Kancheepuram Available 650.02 865.87 735.46 735.46 719.94 801.287Required 2,221.77 2,390.52 2,591.71 2,832.62 3,122.41Balance -1,355.9 -1,655.06 -1,856.25 -2,112.68 -2,321.12
Kanniyakumari Available 266.78 285.4 171.4 171.4 162.07 188.636Required 367.71 309.73 302.51 296.53 291.74 288.09Balance -100.93 -24.33 -131.11 -125.13 -129.67 -99.454
Karur Available 216.43 271.32 299.65 299.65 300.38 361.75Required 618.49 626.7 642.52 663.72 690.91 724.96Balance -402.06 -355.38 -342.87 -364.07 -390.53 -363.21
Madurai Available 356.61 577.52 591.58 591.58 487.44 647.288Required 794.79 1,257.4 1,396.8 1,557.64 1,743.01 1,956.55Balance -438.18 -679.88 -805.22 -966.06 -1,255.57 -1,309.26
Nagapattinam Available 386.56 1,080.89 484.36 484.36 760.5 954.208Required 1,283.23 967.67 980.49 998.87 1,022.89 1,052.68Balance -896.67 113.22 -496.13 -514.51 -262.39 -98.472
Namakkal Available 478.84 709.45 649.89 649.89 556.66 5,66.502Required 3,251.57 3,425.62 3,613.67 3,816.64 4,035.6Balance -2,542.12 -2,775.73 -2,963.78 -3,259.98 -3,469.1
Nilgiris Available 110.86 107.95 106.69 106.69 105.1 102.82Required 202.77 166.71 145.74 134.21 128.79Balance -94.82 -60.01 -39.04 -29.11 -25.98
Perambalur Available 792.39 561.69 561.69 398.56 448.77Required 361.54 320.52 289.29 265.51 247.62Balance 430.85 241.17 272.4 133.05 201.15
Pudukkottai Available 720.84 517.54 517.54 549.49 8,02.139Required 1,904.15 2,162.96 2,480.77 2,872.48 3,357.08Balance -1,183.31 -1,645.42 -1,963.23 -2,322.99 -2,554.94

114
Dairying in Tamil naDu A Statistical Profile 2014 Part VI : Feed Resources
National Dairy Development Board
Districtsavailable/ Required/
balance
Dry Matter availability, Requirement and balance (‘000 MT)
2003 2007 2008 2009 2010 2011Ramanathapuram Available 361.87 450.26 422.89 422.89 452.46 717.464
Required 471.95 648.57 717.33 799.19 895.83 1,009.58Balance -110.08 -198.31 -294.44 -376.3 -443.37 -292.116
Salem Available 472.22 669.99 845.18 845.18 863.71 1,047.215Required 2,169.73 2,495.59 2,887.88 3,360.87 3,932.35Balance -1,499.74 -1,650.41 -2,042.7 -2,497.16 -2,885.14
Sivaganga Available 334.86 298.31 322.87 322.87 318.74 565.239Required 699.55 627.53 582.87 556.95 544.37Balance -401.24 -304.66 -260 -238.21 20.869
Thanjavur Available 642.59 1,086.92 767.69 767.69 852.42 1,302.4Required 1,377.91 1,411.16 1,456.89 1,517.71 1,596.92Balance -290.99 -643.47 -689.2 -665.29 -294.52
Theni Available 338.49 484.97 610.45 610.45 529.78 569.608Required 207.18 505.6 580.73 672.1 783.21 918.41Balance 131.31 -20.63 29.72 -61.65 -253.43 -348.802
Thiruvallur Available 674.79 735.01 676.94 676.94 588.07 657.401Required 1,548.86 1,644.21 1,760.78 1,903.92 2,080.47Balance -813.85 -967.27 -1,083.84 -1,315.85 -1,423.07
Thiruvarur Available 322.47 437.23 437.23 810.9 1,224.36Required 800.84 748.41 707.15 675.74 653.51Balance -311.18 -269.92 135.16 570.85
Tiruchirappalli Available 473.67 771.85 620.63 620.63 725.71 753.849Required 1,677.25 1,537.66 1,523.13 1,514.75 1,512.32 1,515.79Balance -1,203.58 -765.81 -902.5 -894.12 -786.61 -761.941
Tirunelveli Available 616.51 866.69 840.98 840.98 815.77 969.497Required 2,194.35 2,431.5 2,725.45 3,090.01 3,542.45Balance -1,327.66 -1,590.52 -1,884.47 -2,274.24 -2,572.95
Tiruvannamallai Available 1,273.3 1,223.51 1,223.51 1,090.14 1,241.868Required 2,150.54 2,154.05 2,168.74 2,193.88 2,229.48Balance -877.24 -930.54 -945.23 -1,103.74 -987.612
Thoothukkudi Available 326.9 460.74 572.28 572.28 516.79 569.793Required 3,777.47 3,907.01 4,060.5 4,242.16 4,457.01Balance -3,316.73 -3,334.73 -3,488.22 -3,725.37 -3,887.22
Vellore Available 596.14 785.12 794.52 794.52 706.43 762.904Required 1,283.76 1,910.46 2,083.29 2,283.44 2,514.64 2,781.34Balance -687.62 -1,125.34 -1,288.77 -1,488.92 -1,808.21 -2,018.44
Viluppuram Available 999.54 1,687.86 1,615.23 1,615.23 1,622.63 1,726.128Required 1,656.43 2,481.05 2,677.2 2,913.99 3,199.93 3,545.45Balance -656.89 -793.19 -1,061.97 -1,298.76 -1,577.3 -1,819.32
Virudhunagar Available 358.36 653.18 574.12 574.12 412.05 526.721Required 988.71 883.08 800.47 736.12 686.65Balance -335.53 -308.96 -226.35 -324.07 -159.929
Krishnagiri Available 422.178 481.54 528.886 528.886 569.486 649.253Required Balance
Source: Feedbase 2012, National Institute of Animal Nutrition and Physiology, Bangalore.

115
Dairying in Tamil naDu A Statistical Profile 2014 Part VI : Feed Resources
National Dairy Development Board
VI.2. Feed Resources - Availability vs. RequirementTable VI.2.2: availability, Requirement and Surplus/Deficit of Feed Nutrient
YearDry Matter (‘000 MT)
availability Requirement Deficit/ Surplus
1997 15,818.70 37,896.96 -22,078.3
2003 16,220.62 33,247.09 -17,026.5
2007 25,384.10 42,976.96 -17,592.9
2008 20,092.76 45,153.96 -25,061.2
2009 20,092.76 47,600.00 -27,507.2
2010 20,004.10 50,355.00 -30,350.9
2011 23,641.71 53,468.24 -29,826.5
Source: Feedbase 2012, National Institute of Animal Nutrition and Physiology, Bangalore.
VI.3. Feed Resources - ConsumptionTable VI.3.1: Feed and Fodder Consumption – by animal
(kg/animal/day)
YearGreen Fodder Dry Fodder Concentrate
Cattle buffalo Cattle buffalo Cattle buffalo
1993-94 7.1 7.4 6.9 7.6 2.8 2.4
1997-98 6.8 7.6 6.5 7.7 3.2 3.1
2003-04 7.1 7.2 7.0 7.6 2.5 2.2
2007-08 7.2 5.7 5.9 5.6 1.8 1.5
2008-09 6.5 5.6 5.5 5.3 1.8 1.6
2009-10 8.4 5.7 6.6 6.5 2.2 2.4
2010-11 7.6 5.9 6.1 6.1 1.9 1.9
2011-12 7.5 5.1 6.4 5.3 2.2 2.0
Source: Integrated Sample Survey reports,(1993-94 to 2011-12), Govt. of Tamil Nadu.

116
Dairying in Tamil naDu A Statistical Profile 2014 Part VI : Feed Resources
National Dairy Development Board

National Dairy Development Board
Part VII : Agriculture
Tamil Nadu covers an area of 130,060 sq km, about four per cent of the geographical area of India. Out of the total reported area, 38 per cent is net sown area, 16 per cent is under forests and 20 per cent is fallow land.
The state has seven agro-climatic zones, of which the “high rainfall” and “hilly and high altitude” zones receive maximum rainfall. The Cauvery delta zone is popularly known as the ‘rice bowl’ of the state.
The net sown area of the state declined from 5,486 thousand ha in 1997-98 to 4,986 thousand ha in 2011-12, registered an annual decline of 0.68 per cent. However, the net irrigated area remained almost same at 2,964 thousand ha during the above periods. Wells and tube wells formed the major source of irrigation.
The groundwater status in the state is deteriorating as 36 per cent blocks are over exploited, 9 per cent critical, 17 per cent semi-critical and 3 per cent are salinity affected.

118
Dairying in Tamil naDu A Statistical Profile 2014 Part VII : Agriculture
National Dairy Development Board
Table VII.1.1: Details of agro-Climatic Zones
agro-Climatic Zones
Districts Covered
altitude (m)
annual average Rainfall
(mm)
area under Cultivation
(%)
Irrigated area to
Cultivated area (%)
Crops Grown Major Rivers
North eastern Zone
Kancheepuram, Thiruvallur, Vellore, Tiruvannamalai, Cuddalore, Viluppuram
100-200 1,109 50.5 Paddy, Jowar, Bajra, Ragi, Groundnut, Sugarcane and Cashewnut
Polar, Ponniar, Cheiyear, Vellar, Thenpennai, Manimuthar and Komugi
North Western Zone
Dharmapuri, Krishnagiri, Salem, Namakkal, Perambalur, Ariyalur
200-600 849 56.3 23 Paddy, Wheat, Maize, Ragi, Bajra, Sugarcane, Groundnut, Cotton, Sunflower
Cauvery, Thenpennai and Manimuthar
VII.1. Agro-Climatic Zones
Tamil Nadu – agro-Climatic Zones

119
Dairying in Tamil naDu A Statistical Profile 2014 Part VII : Agriculture
National Dairy Development Board
agro-Climatic Zones
Districts Covered
altitude (m)
annual average Rainfall
(mm)
area under Cultivation
(%)
Irrigated area to
Cultivated area (%)
Crops Grown Major Rivers
Western Zone
Coimbatore, Erode, Tiruppur, Dindigul, Theni,
200-600 654 44.5 42.4 Jowar, paddy, Pulses, Maize, Banana, Sugarcane, Groundnut
Cauvery, Noiyal, Bhavani, Uppar, Sirvani and Amaravathi
Cauvery Delta Zone
Thanjavur, Thiruvarur, Nagapattinam, Tiruchirappalli
100-200 956 60.2 50.1 Paddy, Sugarcane, Cotton, Groundnut, Sunflower, Banana and Ginger
Cauvery, Vennaru, Kudamuruti, Paminiar, Arasalar and Kollidam
Southern Zone
Madurai, Ramanathapuram, Tirunelveli, Sivaganga, Virudhunagar, Thoothukkudi, Pudukkottai, Karur
100-600 816 45 44 Paddy, Jowar, Bajra, Ragi, Groundnut, Cotton, Banana and Tobacco
Vaigai, Sitrar, Thamraparani, Numbiar, Pachaiyar, Kludar, Arjunar, Kodumudiyaar, Manimuthar, Periyar and Vaigai
High Rainfall Zone
Kanniyakumari 100-2,000 1,456 63.1 47.4 Paddy, Coconut, Vegetables, Cashew nut, Banana and Rubber
Pazhaiyar, Kothair and Paraliyar
Hilly and High altitude Zone
The Nilgiris 2,000 1857 28.9 0.84 Tea, Coffee, Vegetable, Paddy and Groundnut
Source: http://planningcommission.nic.in/reports/sereport/ser/7vgtn/v3_ch3.pdf, assessed on 09th July, 2014; http://dolr.nic.in/dolr/downloads/spsp/TAMILNADu%20STATe%20PerSPecTIVe%20&%20STrATeGIc%20PLAN.pdf, assessed on 09th July, 2014; http://agritech.tnau.ac.in/pdf/2012/Season%20&%20crop%20report%202012.pdf, assessed on 09th July, 2014.
120
Dairying in Tamil naDu A Statistical Profile 2014 Part VII : Agriculture
National Dairy Development Board

121
Dairying in Tamil naDu A Statistical Profile 2014 Part VII : Agriculture
National Dairy Development Board
VII.2. Land Use PatternTable VII.2.1: District-wise land Use Pattern
(‘000 ha)
Districts
Reporting area Forest area Fallow landPermanent Pasture and
Grazing landNet Sown area
2000
-01
2010
-11
2000
-01
2010
-11
2000
-01
2010
-11
2000
-01
2010
-11
2000
-01
2010
-11
TaMIl NaDU 12,974 13,033 2,133 2,125 2,362 2,595 123 110 5,303 4,954Ariyalur 193 1 20 1 108
Chennai - 17 - 0 - - - - - -
Coimbatore 747 472 159 112 161 96 1 0 317 173
Cuddalore 368 368 1 1 46 52 1 1 231 218
Dharmapuri 964 450 366 164 68 46 14 6 400 159
Dindugul 627 627 139 139 129 133 7 7 236 231
Erode 816 572 229 228 195 85 0 0 308 197
Kanchipuram 443 443 24 24 72 100 18 18 150 119
Kanya kumara 167 167 54 54 3 1 0 0 81 79
Karur 290 290 6 6 63 74 11 11 102 90
Krishnagiri 514 204 53 8 170
Madurai 374 374 50 48 87 85 0 0 148 135
Nagapattinam 272 272 5 5 20 23 1 1 150 153
Namakkal 336 337 44 44 23 54 7 7 196 160
Perambalur 369 176 25 16 42 24 1 0 216 97
Pudukkottai 466 466 24 24 101 111 5 5 158 149
Ramanathapuram 409 409 4 4 94 85 0 0 184 187Salem 521 521 126 126 24 59 6 4 265 223
Sivaganga 419 419 22 17 132 132 1 1 117 117
Thanjavur 340 340 3 3 31 34 2 1 203 201
The Nilgiris 254 254 143 143 11 12 5 5 77 76
Theni 289 324 104 104 35 34 0 0 112 114
Tiruppur 520 48 203 0 192
Thiruvallur 342 342 20 20 65 69 8 8 120 107
Tiruchirappalli 440 440 36 37 113 128 5 1 177 167
Tirunelveli 682 676 122 128 197 220 10 5 144 145
Tiruvannamalai 631 631 153 153 123 137 4 3 217 211
Thiruvarur 210 210 2 2 14 13 1 1 150 153
Thoothukkudi 459 471 11 11 128 87 5 5 159 185
Vellore 592 592 161 162 97 141 4 4 211 176
Villuppuram 722 722 72 72 112 99 4 4 338 339
Virudhunagar 424 424 27 26 175 183 1 1 135 123
(-) Not reported/not available or reported zero. Zero denotes either nil or Negligible.
Source: Directorate of economics and Statistics, Ministry of Agriculture, Govt. of India.

122
Dairying in Tamil naDu A Statistical Profile 2014 Part VII : Agriculture
National Dairy Development Board
VII.3. Area and ProductionTable VII.3.1: District-wise area under Crops and Production of Cereals and Pulses
Districts
Cereals Pulses
area (‘000 ha) Production (‘000 MT) area (‘000 ha) Production (‘000 MT)
*200
4-10
2011
-12
2012
-13
*200
4-10
2011
-12
2012
-13
*200
4-10
2011
-12
2012
-13
*200
4-10
2011
-12
2012
-13
TaMIl NaDU 2,613.8 2,541.7 2,134.9 6,831.6 9,779.0 5,392.9 567.1 666.9 512.7 212.3 332.4 212.6
Ariyalur 45.6 38.8 34.0 104.4 164.9 74.2 1.6 1.7 1.8 0.7 1.3 1.0
Coimbatore 42.8 30.3 28.9 36.0 62.6 37.1 11.9 12.2 9.9 4.4 3.2 4.1
Cuddallore 126.2 138.1 131.5 330.8 281.2 371.2 41.8 55.0 43.1 15.9 31.4 23.8
Dharmapuri 67.5 69.4 41.8 138.9 229.5 103.1 20.0 46.4 33.7 9.5 22.1 18.7
Dindigul 97.4 91.0 67.7 295.5 416.8 179.0 24.1 26.2 21.0 8.3 7.4 6.5
Erode 64.9 51.9 25.7 270.2 226.4 102.7 14.4 4.2 3.4 6.3 2.1 1.2
Kancheepuram 98.7 90.6 77.9 340.8 396.1 345.1 2.0 1.2 0.9 1.0 0.7 0.3
Kanniyakumari 19.7 16.6 12.4 84.8 90.1 57.9 1.3 0.7 0.4 0.4 0.4 0.2
Karur 44.4 36.1 20.9 67.1 91.0 57.6 6.0 11.8 7.3 2.3 7.7 3.9
Krishnagiri 72.5 71.3 69.5 142.7 228.8 161.6 24.8 35.8 46.9 10.2 19.1 25.0
Madurai 85.2 87.2 34.9 264.8 355.7 91.1 8.9 7.5 6.3 3.1 4.2 3.0
Nagapattinam 159.4 170.1 142.3 310.9 577.1 201.7 81.4 82.3 53.5 20.4 27.7 15.9
Namakkal 38.2 25.2 68.8 95.4 86.0 91.9 7.4 6.6 12.6 4.3 4.2 2.3
Perambalur 60.1 55.5 54.6 112.6 295.9 111.1 0.4 0.5 0.7 0.3 0.4 0.2
Pudukkottai 96.7 97.9 87.9 232.8 371.2 263.8 2.5 4.5 2.0 1.0 2.8 1.1
Ramanathapuram 133.8 132.6 122.3 212.1 443.8 74.9 3.6 4.0 3.2 1.2 1.7 1.0
Salem 76.3 89.4 68.5 211.6 364.1 248.7 18.7 41.7 39.3 8.1 13.0 14.6
Sivaganga 82.5 84.1 70.8 146.2 311.4 130.6 0.9 1.7 1.3 0.3 1.0 0.7
Thanjavur 163.5 182.2 147.9 459.5 730.3 434.4 24.8 32.7 17.2 8.8 22.8 9.3
The Nilgiris 1.0 0.4 0.3 3.4 1.6 1.2 0.0 0.0 0.0 0.0 0.0 0.0
Theni 40.7 39.6 28.7 153.5 195.6 128.7 7.7 11.1 7.5 3.8 4.5 3.5
Tirunelveli 97.4 98.6 59.4 379.5 528.4 220.5 24.2 16.4 15.1 10.5 13.9 5.8
Tiruppur 64.4 49.3 22.1 141.4 276.5 113.0 19.1 22.3 16.4 7.0 6.3 5.3
Thiruvallur 83.9 79.6 79.1 273.8 313.9 301.7 8.3 10.7 8.8 4.3 5.3 5.8
Tiruvannamalai 129.6 114.7 101.4 370.2 378.8 340.4 9.5 19.4 12.7 4.2 11.2 7.1
Thiruvarur 162.5 186.3 158.9 336.6 790.0 192.8 78.4 80.0 24.8 19.8 30.6 12.1
Thoothukkudi 53.4 53.3 57.0 160.9 239.6 69.1 57.2 65.6 60.4 23.0 45.4 9.9
Tiruchirappalli 107.7 96.3 75.1 287.7 350.2 169.0 8.9 6.4 3.6 4.2 4.3 1.5
Vellore 64.7 54.3 50.7 172.5 187.5 179.7 19.6 20.3 25.9 9.3 12.7 16.5
Villuppuram 174.7 150.9 132.4 524.8 544.8 431.8 20.9 24.1 24.3 11.7 16.3 10.1
Virudhunagar 58.2 60.1 61.6 170.0 248.9 107.4 16.9 13.5 8.6 7.9 9.1 2.2
*Average from 2004-05 to 2010-11. Zero denotes either nil or Negligible.
Source: Department of economics and Statistics, Govt. of Tamil Nadu.

123
Dairying in Tamil naDu A Statistical Profile 2014 Part VII : Agriculture
National Dairy Development Board
VII.3. Area and ProductionTable VII.3.2: District-wise area under Crops and Production of Food Grains and Oilseeds
Districts
Food Grains Oilseeds
area (‘000 ha) Production (‘000 MT) area (‘000 ha) Production (‘000 MT)
*200
4-10
2011
-12
2012
-13
*200
4-10
2011
-12
2012
-13
*200
4-10
2011
-12
2012
-13
*200
4-10
2011
-12
2012
-13
TaMIl NaDU 3,180.9 3,208.6 2,647.6 7,043.9 10,111.4 5,605.5 572.2 428.8 372.5 1,019.1 1,087.1 802.5
Ariyalur 47.2 40.5 35.8 105.1 166.2 75.2 20.1 14.2 9.7 32.0 54.3 23.3
Coimbatore 54.7 42.5 38.8 40.4 65.8 41.2 8.6 7.7 5.9 11.6 18.2 8.6
Cuddallore 168 193.1 174.6 346.7 312.6 395 19.3 12.7 14.0 42.3 36.6 41.5
Dharmapuri 87.5 115.8 75.5 148.4 251.6 121.8 13.6 18.2 12.1 26.3 55.3 26.9
Dindigul 121.5 117.2 88.7 303.8 424.2 185.5 15.3 13.4 7.8 36.6 45.2 18.5
Erode 79.3 56.1 29.1 276.5 228.5 103.9 44.5 26.5 19.8 64.4 31.9 24.3
Kancheepuram 100.7 91.8 78.8 341.8 396.8 345.4 22.0 16.6 16.6 74.4 62.5 57.5
Kanniyakumari 21 17.3 12.8 85.2 90.5 58.1 0.0 0.0 0.0 0.0 0.0 0.1
Karur 50.4 47.9 28.2 69.4 98.7 61.5 13.2 11.3 6.4 16.7 22.0 12.3
Krishnagiri 97.3 107.1 116.4 152.9 247.9 186.6 17.8 16.6 17.6 28.6 48.9 35.5
Madurai 94.1 94.7 41.2 267.9 359.9 94.1 6.1 4.2 3.0 9.2 6.9 4.9
Nagapattinam 240.8 252.4 195.8 331.3 604.8 217.6 4.4 3.4 2.8 8.7 10.2 5.3
Namakkal 45.6 31.8 81.4 99.7 90.2 94.2 38.5 26.8 29.4 63.0 64.8 39.5
Perambalur 60.5 56 55.3 112.9 296.3 111.3 3.3 2.5 1.6 5.1 4.8 3.8
Pudukkottai 99.2 102.4 89.9 233.8 374 264.9 22.8 19.1 13.2 34.6 39.3 24.8
Ramanathapuram 137.4 136.6 125.5 213.3 445.5 75.9 7.9 4.6 4.5 9.0 5.5 4.5
Salem 95 131.1 107.8 219.7 377.1 263.3 28.6 22.5 19.3 41.2 51.1 35.2
Sivaganga 83.4 85.8 72.1 146.5 312.4 131.3 5.4 6.3 3.8 6.8 16.7 9.1
Thanjavur 188.3 214.9 165.1 468.3 753.1 443.7 16.1 12.1 11.1 24.1 27.4 24.0
The Nilgiris 1 0.4 0.3 3.4 1.6 1.2 0.0 0.0 0.0 0.0 0.0 0.0
Theni 48.4 50.7 36.2 157.3 200.1 132.2 3.0 3.1 2.6 5.0 6.1 9.4
Tirunelveli 121.6 115 74.5 390 542.3 226.3 4.6 2.1 2.0 6.4 4.0 3.5
Tiruppur 83.5 71.6 38.5 148.4 282.8 118.3 10.4 9.9 5.4 17.1 20.9 6.6
Thiruvallur 92.2 90.3 87.9 278.1 319.2 307.5 16.7 10.5 10.9 56.2 40.9 47.2
Tiruvannamalai 139.1 134.1 114.1 374.4 390 347.5 88.9 57.7 57.6 144.4 155.0 120.5
Thiruvarur 240.9 266.3 183.7 356.4 820.6 204.9 4.1 4.9 4.1 7.8 23.4 11.0
Thoothukkudi 110.6 118.9 117.4 183.9 285 79 3.9 1.6 1.3 3.3 2.1 1.4
Tiruchirappalli 116.6 102.7 78.7 291.9 354.5 170.5 14.2 11.8 9.3 25.4 27.0 21.8
Vellore 84.3 74.6 76.6 181.8 200.2 196.2 52.5 43.2 39.5 89.2 96.4 82.8
Villuppuram 195.6 175 156.7 536.5 561.1 441.9 56.1 38.2 35.8 120.0 100.3 93.6
Virudhunagar 75.1 73.6 70.2 177.9 258 109.6 10.1 6.9 5.5 9.8 9.5 5.2
*Average from 2004-05 to 2010-11. Zero denotes either nil or Negligible. oilseeds includes only Groundnut and Gingely (Sesame).
Source: Department of economics and Statistics, Govt. of Tamil Nadu.

124
Dairying in Tamil naDu A Statistical Profile 2014 Part VII : Agriculture
National Dairy Development Board
VII.3. Area and ProductionTable VII.3.3: District-wise area under Crops and Production of Sugarcane and Cotton
Districts
Sugarcane Cotton
area (‘000 ha) Production (‘Lakh MT) area (‘000 ha) Production (‘000 bales)
*200
4-10
2011
-12
2012
-13
*200
4-10
2011
-12
2012
-13
*200
4-10
2011
-12
2012
-13
*200
4-10
2011
-12
2012
-13
TaMIl NaDU 317.3 346.4 359.9 342.3 389.7 340.1 111.2 135.8 133.2 205.2 381.8 255.5
Ariyalur 9.4 8.0 7.8 9.3 8.8 7.1 2.5 7.8 8.6 5.6 36.6 15.7
Coimbatore 2.2 1.5 1.4 1.9 1.9 1.5 2.8 1.4 0.6 3.5 5.6 1.0
Cuddallore 33.6 31.1 30.7 37.4 29.5 34.5 3.2 5.8 5.1 2.8 14.5 12.1
Dharmapuri 16.4 20.3 16.4 15.0 22.9 13.0 6.5 11.0 13.7 13.3 34.4 41.6
Dindigul 5.8 5.7 5.5 6.8 7.5 3.0 1.7 2.8 2.2 3.8 10.4 3.6
Erode 36.2 31.5 31.2 43.3 35.5 28.3 2.8 0.8 0.7 8.6 2.7 1.7
Kancheepuram 3.4 1.8 1.8 3.2 2.0 1.7 0.0 0.0 0.0 0.1 0.0 0.0
Kanniyakumari 0.0 0.0 1.3 0.0 0.0 0.0 0.0 0.0 0.0 0.0 0.0 0.0
Karur 5.9 8.1 6.6 5.7 11.1 6.2 0.2 0.1 0.1 0.4 0.2 0.1
Krishnagiri 2.4 2.2 1.2 2.2 2.3 1.1 1.7 1.7 1.5 2.3 4.4 4.0
Madurai 4.6 4.3 5.1 4.6 4.9 4.9 8.5 6.7 5.2 11.4 14.0 6.9
Nagapattinam 4.5 3.1 3.8 3.7 2.7 3.2 1.2 0.3 0.7 2.2 0.9 1.7
Namakkal 17.1 19.7 20.3 22.1 26.8 16.1 3.0 2.9 2.7 8.3 11.8 5.3
Perambalur 4.6 6.7 6.5 5.2 8.1 5.7 14.1 26.2 24.3 23.1 69.2 27.7
Pudukkottai 8.3 9.2 9.3 9.5 12.2 8.0 0.1 0.0 0.0 0.2 0.1 0.0
Ramanathapuram 0.4 0.6 4.2 0.4 0.7 0.5 2.5 2.0 1.6 1.9 4.4 1.1
Salem 10.9 12.2 15.5 10.5 12.2 13.2 14.7 17.0 15.8 32.7 48.4 47.0
Sivaganga 4.8 6.3 6.1 4.8 7.8 5.5 0.3 0.3 0.2 0.5 0.7 0.3
Thanjavur 12.8 10.7 11.9 13.9 11.9 12.9 0.8 1.0 1.0 2.0 2.9 3.3
The Nilgiris 0.0 0.0 0.0 0.0 0.0 0.0 0.0 0.0 0.0 0.0 0.0 0.0
Theni 6.9 7.1 6.4 8.6 9.3 8.1 2.0 1.6 1.2 4.7 6.3 4.8
Tirunelveli 5.0 5.1 4.7 4.9 4.4 2.7 3.8 2.7 2.5 9.0 8.5 5.1
Tiruppur 6.0 7.6 5.4 7.8 9.2 4.9 1.2 0.7 0.4 2.3 1.8 0.7
Thiruvallur 6.0 7.4 7.8 6.7 8.0 7.5 0.0 0.0 0.0 0.0 0.0 0.0
Tiruvannamalai 26.3 37.8 43.5 25.8 44.1 43.8 1.4 0.8 0.5 3.5 2.1 1.0
Thiruvarur 2.2 0.5 0.7 2.4 0.6 0.6 1.1 1.3 1.3 1.8 4.6 2.4
Thoothukkudi 0.3 0.6 3.4 0.3 0.7 0.4 4.7 3.6 3.8 6.3 9.0 3.8
Tiruchirappalli 5.8 5.2 4.9 5.8 5.8 3.5 7.6 14.4 16.9 15.0 37.6 17.5
Vellore 16.9 15.1 13.2 15.1 14.6 12.4 5.8 7.1 7.7 11.8 14.1 18.1
Villuppuram 55.2 73.5 79.5 61.8 80.6 87.0 6.2 6.2 6.9 13.3 13.0 17.1
Virudhunagar 3.5 3.3 3.7 3.6 3.7 3.0 10.9 9.6 8.2 15.0 23.3 11.9
* Average from 2004-05 to 2010-11, 1 bale = 170 kg. Zero denotes either nil or Negligible.
Source: Department of economics and Statistics, Govt. of Tamil Nadu.

125
Dairying in Tamil naDu A Statistical Profile 2014 Part VII : Agriculture
National Dairy Development Board
VII.4. Land Holding and Water ResourcesTable VII.4.1: Operational Holdings in Tamil Nadu
Size of Holding (ha)Total Holdings average Size of Holding
(ha)Number (‘000) area (‘000 ha)
Marginal 6,266.6 2,291.7 0.37
Small 1,181.3 1,643.7 1.39
Semi-medium 502.3 1,355.5 2.70
Medium 150.6 847.8 5.63
Large 17.4 349.7 20.13
All Classes 8,118.2 6,488.4 0.80
Source: Agricultural census Database, 2010-11, Ministry of Agriculture, Govt. of India.
Table VII.4.2: Net Irrigated area under Different Sources of Irrigation(‘000 ha)
Particulars 1997-98 2000-01 2003-04 2005-06 2007-08 2008-09 2010-11 2011-12
Gross Sown Area 6,558 6,338 5,316 6,033 5,815 5,824 5,753 5,890
Net Sown Area 5,486 5,303 4,689 5,244 5,062 5,043 4,954 4,986
Net Irrigated Area 2,945 2,888 2,148 2,920 2,864 2,931 2,912 2,964
Sources (net irrigated area) (‘000 ha)
Canals 838 833 449 800 753 766 747 746
Tanks 675 589 385 575 506 540 533 528
Wells and Tube Wells 1,413 1,449 1,298 1,536 1,593 1,614 1,622 1,683
Other Sources 19 16 15 7 11 11 9 7
Source: Directorate of economics and Statistics, Ministry of Agriculture, Govt. of India.
Table VII.4.3: Major River basins of Tamil Nadu
Rivers Origin length (km)
Catchment area (sq km) States Falling in the Catchment area
Cauvery Coorg (Karnataka) 800 81,155 Tamil Nadu, Karnataka, Kerala and Pondicherry
Source: Hydrology and Water resources Information System for India, National Institute of Hydrology, roorkee.
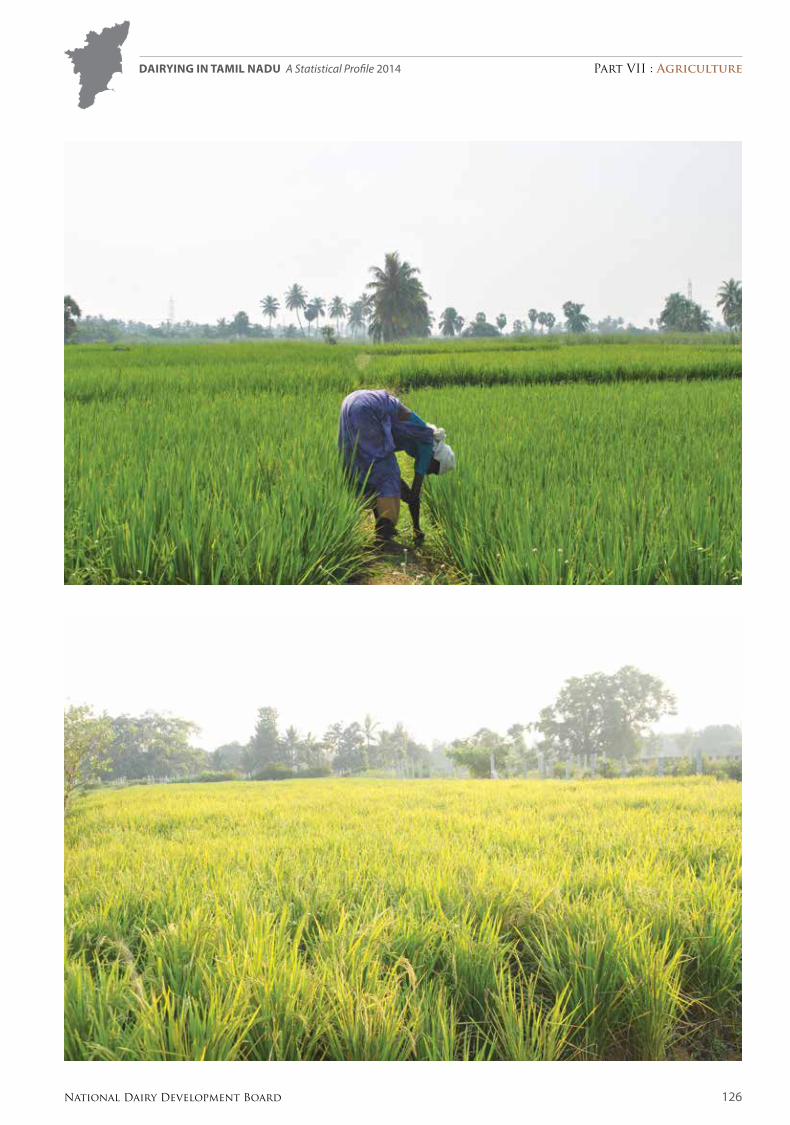
126
Dairying in Tamil naDu A Statistical Profile 2014 Part VII : Agriculture
National Dairy Development Board

127
Dairying in Tamil naDu A Statistical Profile 2014 Part VII : Agriculture
National Dairy Development Board
VII.4. Land HoldingTable VII.4.4: Medium River basins of Tamil Nadu – West-Flowing Rivers with Catchment area
Name of River Village/District (origin) length (km) Catchment area (sq km)
Bharathapuzha (known as Ponnani) Annamalai Hills 209 6,186
Kortalaiyar Chinglepet 131 3,521
Varahandi Vellore 94 3,044
Vellar Chithri Hills 193 8,558
Vaigai Madurai 258 7,031
Pambar Madurai 125 3,104
Gundar Madurai 146 5,647
Vaippar Tirunelveli 130 5,288
Tambraparni Tirunelveli 130 5,969
Source: Hydrology and Water resources Information System for India, National Institute of Hydrology, roorkee. http://www.nih.ernet.in/rbis/india_information/states_basins.htm assessed on 10th July, 2014.

128
Dairying in Tamil naDu A Statistical Profile 2014 Part VII : Agriculture
National Dairy Development Board
VII.5. RainfallTable VII.5.1: District- wise average annual Rainfall
Districtsaverage annual Rainfall (mm)
2004-05 to 2009-10 2011-12 2012-13TaMIl NaDU 1,062 968 743
Ariyalur 824 886 653
Chennai 1,467 1,623 960
Coimbatore 924 782 620
Cuddalore 1,526 1,348 914
Dharmapuri 929 762 786
Dindigul 994 941 630
Erode 766 763 534
Kancheepuram 1,286 1,363 943
Kanniyakumari 1,249 1,012 849
Karur 754 776 405
Krishnagiri 940 839 695
Madurai 904 940 565
Nagapattinam 1,617 1,088 1,078
Namakkal 824 682 496
Perambalur 940 769 493
Pudukkottai 962 947 709
Ramanathapuram 1,057 767 657
Salem 970 1,011 799
Sivaganga 1,038 1,002 723
Thanjavur 1,192 847 757
The Nilgiris 1,972 1,579 1,578
Theni 872 977 680
Thiruvallur 1,248 1,316 1,114
Thiruvarur 1,393 992 1,090
Thoothukkudi 791 670 426
Tiruchirappalli 932 875 563
Tirunelveli 961 919 821
Tiruppur 346
Tiruvannamalai 1,108 1,103 1,080
Vellore 950 897 884
Viluppuram 1,212 1,013 924
Virudhunagar 824 817 476
Source: Integrated Sample Survey reports (2004-05 to 2012-13), Govt. of Tamil Nadu.

129
Dairying in Tamil naDu A Statistical Profile 2014 Part VII : Agriculture
National Dairy Development Board
Status of Ground Water (% of Blocks)
Safe Semi - Critical Critical Over exploited Saline
2004 2009
blocks-wise Groundwater Status
2004 2009
2% 3%
37% 36%
9% 9%15% 17%
38% 35%
Safe Semi - Critical Critical Over exploited

130
Dairying in Tamil naDu A Statistical Profile 2014 Part VII : Agriculture
National Dairy Development Board
VII.6. Ground Water StatusTable VII.6.1: Distribution of blocks according to Ground Water Status
DistrictsNumber of blocks
Semi Critical Critical Over-exploited2004 2009 2004 2009 2004 2009
TaMIl NaDU 57 67 33 33 142 139
Chennai 1
Coimbatore 1 4 4 11 6
Cuddalore 8 3 2
Dharmapuri 1 1 7 7
Dindigul 2 2 10 11
Erode 2 6 3 1 3
Kancheepuram 3 4 2 1 2 3
Kanniyakumari
Karur 2 1 1 2 4
Krishnagiri 3 2 1 4 5
Madurai 3 2 1 1 3 5
Nagapattinam 1 1 4 4
Namakkal 3 5 2 2 8 6
Perambalur 4 4
Pudukkottai 1 3
Ramanathapuram 2 1
Salem 3 5 1 3 14 10
Sivaganga 1
Thanjavur 3 2 1 3 10
The Nilgiris
Theni 3 6 5 2
Thiruvallur 2 1 2 6 6
Thiruvarur 2 1 1 1 3
Thoothukkudi 2 2 1 1 7 3
Tiruchirappalli 2 1 4 9
Tirunelveli 1 3 2 4 4
Tiruppur 7 1 2
Tiruvannamalai 5 6 2 4 9 8
Vellore 3 1 1 3 16 14
Viluppuram 4 3 3 1 14 9
Virudhunagar 2 1 1 4 1 1
Source: Various reports of Dynamics of Ground Water resources, central Ground Water Board, Ministry of Water resources, Govt. of India.NoTe: 8 and 11 blocks for the State were Saline category in the year 2004 and 2009 respectively.

131
Dairying in Tamil naDu A Statistical Profile 2014 Glossary
National Dairy Development Board
GlossaryAI : Artificial Insemination is the process of deliberate introduction of sperm into the
female reproductive tract for impregnation.
Bovine : large ruminants like cattle, buffaloes, yak and mithun.
Breedable : female animals that have attained the age of puberty.
Breeding Tract : area where breeds/group of animals are found.
Calving Interval : period between two calvings.
Castration : technique by which males are made sterile for use in draught operations.
Crossbred : animal produced by hybridization of two different breeds.
DM : dry biomass available from feed and fodder.
Dry Animal : adult animals calved at least once but not in-milk at present.
Food Grains : cereals and pulses.
GSDP : basic measure of a State’s overall economic performance. It represents the market value of all final goods and services made within the borders of a State in a year.
Indigenous Animals : animals native to a particular area.
In-milk Animals : animals which are lactating.
Irrigation Intensity : (Gross irrigated area/Net irrigated area) * 100.
Lactation Length : number of days the animal secretes milk.
Lactation Yield : total milk production over period of 300/305 days.
Literacy Rate : percentage of literates in the age group above six years.
Livestock : domesticated mammals.
Male to Female Ratio : number of males to females.
Milch Animals : sum of in-milk and dry animals.
Milk Utilisation Pattern : quantities of milk retained for home consumption in liquid form, retained for product conversion and milk sold by the milk producers.
Marginal Holdings : farmers possessing less than one hectare of operational holding.
Small Holdings : greater than one hectare and less than two hectare of operational holding.
Semi Medium : greater than two and less than four hectare of operational holding.
Medium Holdings : are more than four and less than ten hectare of operational holding.
Large Holdings : are those larger than ten hectare of operational holding.
Population Density : number of human beings/animals per square km of geographical area.
Poultry : all categories of chicken, guinea fowls, turkey, ducks and quails.
Sex Ratio : number of females to 1,000 males in a population.
Small Ruminants : sum of sheep and goats.
Urbanisation : per cent of urban population to total population.
Wet to Dry Ratio : number of in-milk animals to dry ones.


National Dairy Development BoardPB No 40, Anand 388 001
Telephone: (02692) 260148/260149/260160Fax: (02692) 260157
E-mail: [email protected]
Dairying In Tamil Nadu