National Dairy Dairying In Board Development...
127
A Statistical Profile 2016 National Dairy Development Board Dairying In Odisha
Transcript of National Dairy Dairying In Board Development...
A Statistical Profile 2016
National Dairy Development
Board Dairying In Odisha
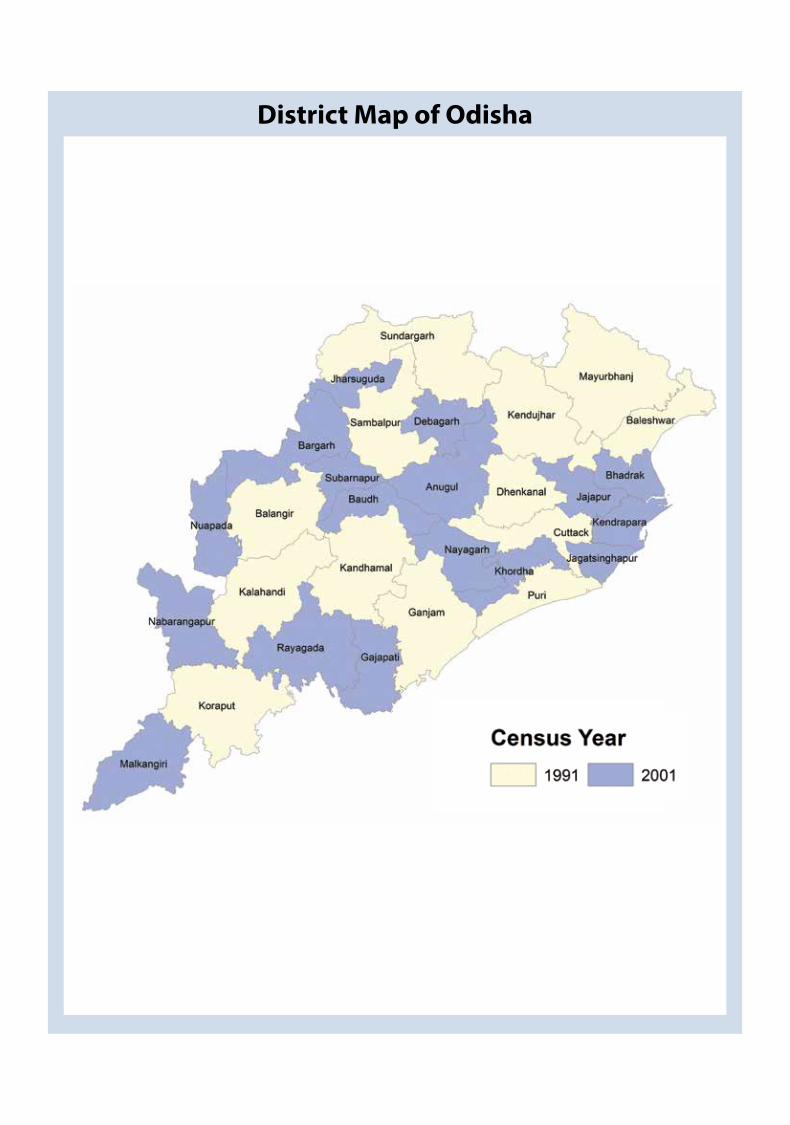
District Map of Odisha
National Dairy Development Board
Dairying in ODiSHa - A Statistical Profile 2016
In this publication “DAIRYING IN ODISHA - A Statistical Profile 2016”, the major highlights are: trend in human
demographics, livestock population and production; inputs for enhancement of productivity such as breeding,
health and nutrition, and public spending. This publication includes statistical tables and thematic maps on
selected parameters along with time series data of districts wherever available.
The objective of this publication is to provide a detailed presentation of various parameters, underlying factors and
their inter-linkages so as to enable effective planning and implementation of various development interventions.
We hope that a wide range of readers, students, researchers, veterinarians, planners, scientists, administrators,
policy makers and professionals in government and non-governmental organisations, will find this publication
useful. This publication aims at balancing the most comprehensive information with the most relevant.
We sincerely thank government and non-government agencies for providing information. While extreme care
has been taken in putting together data in a systematic and comprehensible manner, some errors cannot be
ruled out.
This publication “Dairying in Odisha - A Statistical Profile 2016” is amongst a series of similar publications for
different states being brought out by National Dairy Development Board (NDDB).
Dilip RathManaging Director, NDDB
February 2016Anand, Gujarat
Foreword

National Dairy Development Board
Dairying in ODiSHa - A Statistical Profile 2016
IndexI. GENERAL STATISTICSI.1. Odisha at a Glance I.1.1: General Statistics: Odisha vs. India . . . . . . . . . . . . . . . . . . . . . . . . . . . . . . . . . . . . . . . . . . . . . . . . . . . . . . . . . . . . . . . . . . . . .2 I.1.2: Formation of Districts in Odisha . . . . . . . . . . . . . . . . . . . . . . . . . . . . . . . . . . . . . . . . . . . . . . . . . . . . . . . . . . . . . . . . . . . . . . .4I.2. Social Statistics: Human Population I.2.1: Human Population by Residence and Sex –2001 . . . . . . . . . . . . . . . . . . . . . . . . . . . . . . . . . . . . . . . . . . . . . . . . . . . . . . .5 I.2.2: Human Population by Residence and Sex –2011 . . . . . . . . . . . . . . . . . . . . . . . . . . . . . . . . . . . . . . . . . . . . . . . . . . . . . . .7 I.2.3: Rural Households, Electricity and Tap Water Supply - 2001 and 2011 . . . . . . . . . . . . . . . . . . . . . . . . . . . . . . . . . . . .9 I.2.4: District-wise SC and ST Population – 2001 and 2011 . . . . . . . . . . . . . . . . . . . . . . . . . . . . . . . . . . . . . . . . . . . . . . . . . . 11I.3. State Economy I.3.1: Net State Domestic Product (NSDP) and Per Capita Income . . . . . . . . . . . . . . . . . . . . . . . . . . . . . . . . . . . . . . . . . . 13 I.3.2: Value of Output: Agriculture and Livestock . . . . . . . . . . . . . . . . . . . . . . . . . . . . . . . . . . . . . . . . . . . . . . . . . . . . . . . . . . 15 I.3.3: Approved Project Cost for Dairying under Rashtriya Krishi Vikas Yojana (RKVY) in Odisha . . . . . . . . . . . . . . 16 I.3.4: Approved Project Cost for Animal Husbandry under Rashtriya Krishi Vikas Yojana (RKVY) in Odisha . . . . . . . . . 16
II. LIVESTOCK CENSUSII.1. Animal Population II.1.1: Summary of Livestock Census (1997-2012) - Odisha . . . . . . . . . . . . . . . . . . . . . . . . . . . . . . . . . . . . . . . . . . . . . . . . . . 18 II.1.2: District-wise Bovine Population . . . . . . . . . . . . . . . . . . . . . . . . . . . . . . . . . . . . . . . . . . . . . . . . . . . . . . . . . . . . . . . . . . . . . 19 II.1.3: District-wise Female Population . . . . . . . . . . . . . . . . . . . . . . . . . . . . . . . . . . . . . . . . . . . . . . . . . . . . . . . . . . . . . . . . . . . . . 20 II.1.4: District-wise Breedable Population . . . . . . . . . . . . . . . . . . . . . . . . . . . . . . . . . . . . . . . . . . . . . . . . . . . . . . . . . . . . . . . . . . 21 II.1.5: District-wise In-milk Population . . . . . . . . . . . . . . . . . . . . . . . . . . . . . . . . . . . . . . . . . . . . . . . . . . . . . . . . . . . . . . . . . . . . . 23 II.1.6: District-wise Milch Population . . . . . . . . . . . . . . . . . . . . . . . . . . . . . . . . . . . . . . . . . . . . . . . . . . . . . . . . . . . . . . . . . . . . . . . 24 II.1.7: District-wise Male Population . . . . . . . . . . . . . . . . . . . . . . . . . . . . . . . . . . . . . . . . . . . . . . . . . . . . . . . . . . . . . . . . . . . . . . . 25II.2. Sex Ratio in Dairy Animals II.2.1: District-wise Male - Female Ratio . . . . . . . . . . . . . . . . . . . . . . . . . . . . . . . . . . . . . . . . . . . . . . . . . . . . . . . . . . . . . . . . . . . . 26II.3. Wet-Dry Ratio of Dairy Animals II.3.1: District-wise Wet-Dry Ratio . . . . . . . . . . . . . . . . . . . . . . . . . . . . . . . . . . . . . . . . . . . . . . . . . . . . . . . . . . . . . . . . . . . . . . . . . . 27II.4. Livestock Density II.4.1: District-wise Density of Total Livestock and Bovine . . . . . . . . . . . . . . . . . . . . . . . . . . . . . . . . . . . . . . . . . . . . . . . . . . . 28 II.4.2: District-wise Density of Small Ruminants . . . . . . . . . . . . . . . . . . . . . . . . . . . . . . . . . . . . . . . . . . . . . . . . . . . . . . . . . . . . 29II.5. Breed-wise Population II.5.1: District and Breed-wise Population of Indigenous Cattle in Odisha - 2007 . . . . . . . . . . . . . . . . . . . . . . . . . . . . . 31 II.5.2: District and Breed-wise Population of Crossbred Animals in Odisha - 2007 . . . . . . . . . . . . . . . . . . . . . . . . . . . . 32 II.5.3: District and Breed-wise Population of Buffalo in Odisha - 2007 . . . . . . . . . . . . . . . . . . . . . . . . . . . . . . . . . . . . . . . . 33
III. CATTLE AND BUFFALO BREEDSIII.1. Distribution of Native Breeds of Odisha III.1.1: Distribution of Cattle Breeds of Odisha . . . . . . . . . . . . . . . . . . . . . . . . . . . . . . . . . . . . . . . . . . . . . . . . . . . . . . . . . . . . . . . 36 III.1.2: Distribution of Buffalo Breeds of Odisha . . . . . . . . . . . . . . . . . . . . . . . . . . . . . . . . . . . . . . . . . . . . . . . . . . . . . . . . . . . . . 39III.2. Performance of Breeds III.2.1: Performance of Cattle Breeds . . . . . . . . . . . . . . . . . . . . . . . . . . . . . . . . . . . . . . . . . . . . . . . . . . . . . . . . . . . . . . . . . . . . . . . 41 III.2.2: Performance of Buffalo Breeds . . . . . . . . . . . . . . . . . . . . . . . . . . . . . . . . . . . . . . . . . . . . . . . . . . . . . . . . . . . . . . . . . . . . . . 42
IV. MILK PRODUCTIONIV.1. Production Performance IV.1.1: Year-wise In-milk Bovine Population, Milk Yield and Milk Production . . . . . . . . . . . . . . . . . . . . . . . . . . . . . . . . . . 44 IV.1.2: Year and District-wise In-milk Bovine Population . . . . . . . . . . . . . . . . . . . . . . . . . . . . . . . . . . . . . . . . . . . . . . . . . . . . . 45 IV.1.3: Year and District-wise In-milk Indigenous Cattle Population . . . . . . . . . . . . . . . . . . . . . . . . . . . . . . . . . . . . . . . . . . 47 IV.1.4: Year and District-wise In-milk Crossbred Cattle Population . . . . . . . . . . . . . . . . . . . . . . . . . . . . . . . . . . . . . . . . . . . 49 IV.1.5: Year and District-wise In-milk Buffalo Population . . . . . . . . . . . . . . . . . . . . . . . . . . . . . . . . . . . . . . . . . . . . . . . . . . . . . 51IV.2. Production Performance: Milk Yield IV.2.1: Year and District-wise Bovine Milk Yield . . . . . . . . . . . . . . . . . . . . . . . . . . . . . . . . . . . . . . . . . . . . . . . . . . . . . . . . . . . . . . 53 IV.2.2: Year and District-wise Indigenous Cattle Milk Yield . . . . . . . . . . . . . . . . . . . . . . . . . . . . . . . . . . . . . . . . . . . . . . . . . . . 55 IV.2.3: Year and District-wise Crossbred Cattle Milk Yield . . . . . . . . . . . . . . . . . . . . . . . . . . . . . . . . . . . . . . . . . . . . . . . . . . . . 57 IV.2.4: Year and District-wise Buffalo Milk Yield . . . . . . . . . . . . . . . . . . . . . . . . . . . . . . . . . . . . . . . . . . . . . . . . . . . . . . . . . . . . . . 59IV.3. Production Performance: Milk Production IV.3.1: Year and District-wise Bovine Milk Production . . . . . . . . . . . . . . . . . . . . . . . . . . . . . . . . . . . . . . . . . . . . . . . . . . . . . . . 61 IV.3.2: Year and District-wise Indigenous Cattle Milk Production . . . . . . . . . . . . . . . . . . . . . . . . . . . . . . . . . . . . . . . . . . . . . 63 IV.3.3: Year and District-wise Crossbred Cattle Milk Production . . . . . . . . . . . . . . . . . . . . . . . . . . . . . . . . . . . . . . . . . . . . . . 65 IV.3.4: Year and District-wise Buffalo Milk Production . . . . . . . . . . . . . . . . . . . . . . . . . . . . . . . . . . . . . . . . . . . . . . . . . . . . . . . 67 IV.3.5: Year and District-wise Total Milk Production Density . . . . . . . . . . . . . . . . . . . . . . . . . . . . . . . . . . . . . . . . . . . . . . . . . . 73IV.4. Production Performance: Milk Availability IV.4.1: Year and District-wise Per Capita Milk Availability. . . . . . . . . . . . . . . . . . . . . . . . . . . . . . . . . . . . . . . . . . . . . . . . . . . . . 75
National Dairy Development Board
Dairying in ODiSHa - A Statistical Profile 2016
IV.5. Production Performance: Milk Utilisation IV.5.1: Milk Utilisation Pattern in Households (1992-93 to 2012-13) . . . . . . . . . . . . . . . . . . . . . . . . . . . . . . . . . . . . . . . . . . 77 V. VETERINARY INFRASTRUCTURE AND SERVICE DELIVERY SYSTEMV.1. Veterinary Infrastructure V.1.1: Year and District-wise Veterinary Institutes . . . . . . . . . . . . . . . . . . . . . . . . . . . . . . . . . . . . . . . . . . . . . . . . . . . . . . . . . . . 80 V.1.2: District-wise AI Centres – Government Agencies . . . . . . . . . . . . . . . . . . . . . . . . . . . . . . . . . . . . . . . . . . . . . . . . . . . . . 81 V.1.3: District-wise AI Centres – Cooperatives & Others . . . . . . . . . . . . . . . . . . . . . . . . . . . . . . . . . . . . . . . . . . . . . . . . . . . . . 82V.2. Service Delivery System - Artificial Insemination V.2.1: District-wise AI Performed by Government Agencies – Cattle . . . . . . . . . . . . . . . . . . . . . . . . . . . . . . . . . . . . . . . . . 83 V.2.2: District-wise AI Performed by Government Agencies – Buffalo . . . . . . . . . . . . . . . . . . . . . . . . . . . . . . . . . . . . . . . . 84 V.2.3: District-wise AI Performed by Government Agencies – Bovine . . . . . . . . . . . . . . . . . . . . . . . . . . . . . . . . . . . . . . . . 85V.3. Service Delivery System - Animal Health V.3.1: District-wise Vaccination Performed for Foot-and-Mouth Disease . . . . . . . . . . . . . . . . . . . . . . . . . . . . . . . . . . . . . 86 V.3.2: District-wise Vaccination Preformed for Haemorrhagic Septicaemia . . . . . . . . . . . . . . . . . . . . . . . . . . . . . . . . . . 87 V.3.3: District-wise Vaccination Preformed for Black Quarter . . . . . . . . . . . . . . . . . . . . . . . . . . . . . . . . . . . . . . . . . . . . . . . . 88 V.3.4: District-wise Bovine Vaccination . . . . . . . . . . . . . . . . . . . . . . . . . . . . . . . . . . . . . . . . . . . . . . . . . . . . . . . . . . . . . . . . . . . . . 89 V.3.5: District-wise Total Cases Treated . . . . . . . . . . . . . . . . . . . . . . . . . . . . . . . . . . . . . . . . . . . . . . . . . . . . . . . . . . . . . . . . . . . . . 90 V.3.6: District-wise Total Castration. . . . . . . . . . . . . . . . . . . . . . . . . . . . . . . . . . . . . . . . . . . . . . . . . . . . . . . . . . . . . . . . . . . . . . . . . 91
VI. FEED RESOURCESVI.1. Feed Resources - Availability vs. Requirement VI.1.1: District-wise Dry Matter (DM) Availability, Requirement and Balance . . . . . . . . . . . . . . . . . . . . . . . . . . . . . . . . . . 94 VI.1.2: Availability, Requirement and Surplus/Deficit of Dry Matter . . . . . . . . . . . . . . . . . . . . . . . . . . . . . . . . . . . . . . . . . . 97VI.2. Feed Resources - Consumption VI.2.1: Year-wise Feed Consumption – Indigenous Cattle . . . . . . . . . . . . . . . . . . . . . . . . . . . . . . . . . . . . . . . . . . . . . . . . . . . . 97 VI.2.2: Year-wise Feed Consumption – Crossbred Cattle . . . . . . . . . . . . . . . . . . . . . . . . . . . . . . . . . . . . . . . . . . . . . . . . . . . . . 97 VI.2.3: Year-wise Feed Consumption – Buffalo. . . . . . . . . . . . . . . . . . . . . . . . . . . . . . . . . . . . . . . . . . . . . . . . . . . . . . . . . . . . . . . 98
VII. AGRICULTUREVII.1. Agro-Climatic Zones VII.1.1: Odisha’s Agro-Climatic Zones . . . . . . . . . . . . . . . . . . . . . . . . . . . . . . . . . . . . . . . . . . . . . . . . . . . . . . . . . . . . . . . . . . . . . . . 100 VII.1.2: Details of Agro-Climatic Zones. . . . . . . . . . . . . . . . . . . . . . . . . . . . . . . . . . . . . . . . . . . . . . . . . . . . . . . . . . . . . . . . . . . . . . 101VII.2. Land Use Pattern VII.2.1: District-wise Land Use Pattern . . . . . . . . . . . . . . . . . . . . . . . . . . . . . . . . . . . . . . . . . . . . . . . . . . . . . . . . . . . . . . . . . . . . . . 103VII.3. Area and Production VII.3.1: District-wise Area under Crops and Production – Cereals and Pulses . . . . . . . . . . . . . . . . . . . . . . . . . . . . . . . . . 104 VII.3.2: District-wise Area under Crops and Production – Food Grains and Oilseeds . . . . . . . . . . . . . . . . . . . . . . . . . . 105 VII.3.3: District-wise Area under Crops and Production – Sugarcane and Cotton . . . . . . . . . . . . . . . . . . . . . . . . . . . . . 106VII.4. Land Holding and Water Resources VII.4.1: Operational Holdings in Odisha . . . . . . . . . . . . . . . . . . . . . . . . . . . . . . . . . . . . . . . . . . . . . . . . . . . . . . . . . . . . . . . . . . . . 107 VII.4.2: Net Irrigated Area under Different Sources of Irrigation . . . . . . . . . . . . . . . . . . . . . . . . . . . . . . . . . . . . . . . . . . . . . 107 VII.4.3: Major River Basins of Odisha . . . . . . . . . . . . . . . . . . . . . . . . . . . . . . . . . . . . . . . . . . . . . . . . . . . . . . . . . . . . . . . . . . . . . . . 107 VII.4.4: Medium River Basins of Odisha . . . . . . . . . . . . . . . . . . . . . . . . . . . . . . . . . . . . . . . . . . . . . . . . . . . . . . . . . . . . . . . . . . . . . 109VII.5. Rainfall VII.5.1: District- wise Average Annual Rainfall . . . . . . . . . . . . . . . . . . . . . . . . . . . . . . . . . . . . . . . . . . . . . . . . . . . . . . . . . . . . . . 110
VIII. POLICIES AND SCHEMES FOR DAIRY DEVELOPMENT IN ODISHA. . . . . . . . . . . . . . . . . . . . . . . . . . 113
GLOSSARY . . . . . . . . . . . . . . . . . . . . . . . . . . . . . . . . . . . . . . . . . . . . . . . . . . . . . . . . . . . . . . . . . . . . . . . . . . . . . . . . . . . . . . . . . . . . . . . . . . . . . . 121
Part I : General Statistics
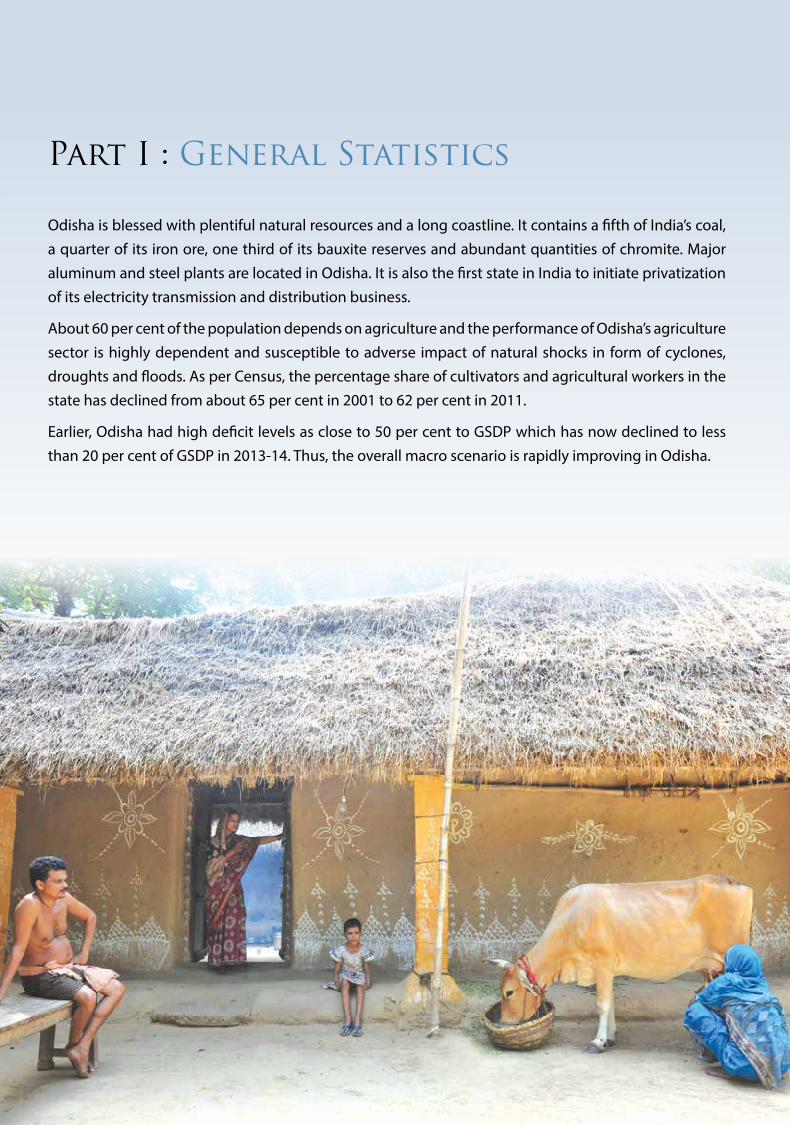
Odisha is blessed with plentiful natural resources and a long coastline. It contains a fifth of India’s coal, a quarter of its iron ore, one third of its bauxite reserves and abundant quantities of chromite. Major aluminum and steel plants are located in Odisha. It is also the first state in India to initiate privatization of its electricity transmission and distribution business.
About 60 per cent of the population depends on agriculture and the performance of Odisha’s agriculture sector is highly dependent and susceptible to adverse impact of natural shocks in form of cyclones, droughts and floods. As per Census, the percentage share of cultivators and agricultural workers in the state has declined from about 65 per cent in 2001 to 62 per cent in 2011.
Earlier, Odisha had high deficit levels as close to 50 per cent to GSDP which has now declined to less than 20 per cent of GSDP in 2013-14. Thus, the overall macro scenario is rapidly improving in Odisha.

2National Dairy Development Board
Dairying in ODiSHa - A Statistical Profile 2016 Part I : General Statistics
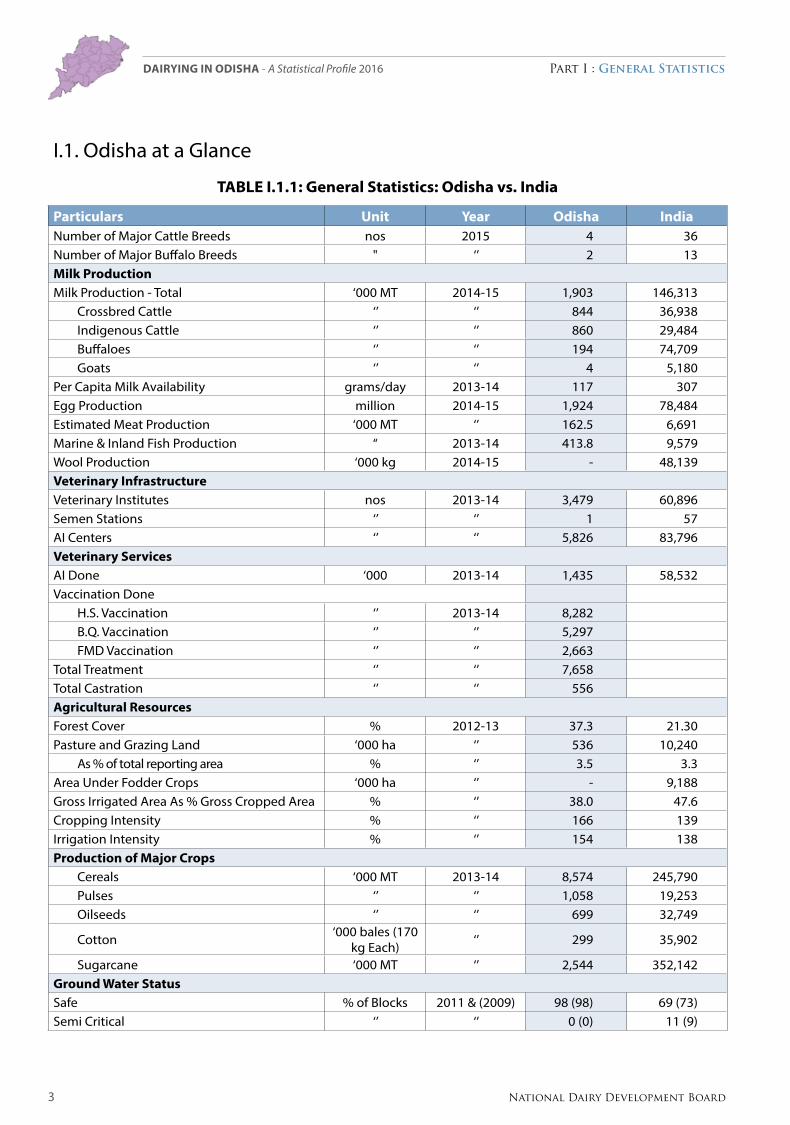
I.1. Odisha at a Glance
TABLE I.1.1: General Statistics: Odisha vs. India
Particulars Unit Year Odisha IndiaState Geography & Rural InfrastructureGeographical area ‘000 sq km 2011 155.8 3,287.3Districts Nos ‘’ 30 640Sub-Districts ‘’ ‘’ 476 5,924Villages ‘000 ‘’ 51.3 640.9Households Million ‘’ 9.6 249.5Rural Households
2001 ‘000 2001 6,783 137,4142011 ‘’ 2011 8,144 168,565
Rural Households with Electricity 2001 % 2001 19 442011 ‘’ 2011 36 55
Rural Households with Tap water supply2001 % 2001 3 242011 ‘’ 2011 7 31
Human PopulationPopulation Millions 2011 41.9 1,210.1
Urban (As % of total) % ‘’ 16.7 31.2Rural (As % of total) ‘’ ‘’ 83.3 68.8
Density of Population Persons/ sq.km ‘’ 269 382Scheduled Castes (As % of total) % ‘’ 17.1 16.6Scheduled Tribes (As % of total) ‘’ ‘’ 22.8 8.6Sex Ratio Ratio ‘’ 978 943Literacy Rate (excluding population of 0 to 6 age group)
Male % 2011 82.4 80.9Female % ‘’ 64.4 64.6Urban % ‘’ 86.5 84.1Rural % ‘’ 70.8 67.8
Per Capita Income (at current prices) ` 2013-14 54,241 74,380Livestock Population Million 2012 20.7 512.0Bovine ‘’ ‘’ 12.3 299.9
Indigenous Cattle ‘’ ‘’ 10.3 151.2Crossbred Cattle ‘’ ‘’ 1.3 39.7Buffaloes ‘’ ‘’ 0.7 108.7
Small Ruminants ‘’ ‘’ 8.1 200.2Poultry ‘’ ‘’ 19.9 729.2Livestock Population Million 2007 23.1 529.7Bovine ‘’ ‘’ 13.5 304.8
Indigenous Cattle ‘’ ‘’ 10.6 166.0Crossbred Cattle ‘’ ‘’ 1.7 33.1Buffaloes ‘’ ‘’ 1.2 105.3
Small Ruminants ‘’ ‘’ 8.9 212.1Poultry ‘’ ‘’ 20.6 648.9
3 National Dairy Development Board
Dairying in ODiSHa - A Statistical Profile 2016 Part I : General Statistics
I.1. Odisha at a Glance
TABLE I.1.1: General Statistics: Odisha vs. India
Particulars Unit Year Odisha IndiaNumber of Major Cattle Breeds nos 2015 4 36Number of Major Buffalo Breeds " ‘’ 2 13Milk ProductionMilk Production - Total ‘000 MT 2014-15 1,903 146,313
Crossbred Cattle ‘’ ‘’ 844 36,938Indigenous Cattle ‘’ ‘’ 860 29,484Buffaloes ‘’ ‘’ 194 74,709Goats ‘’ ‘’ 4 5,180
Per Capita Milk Availability grams/day 2013-14 117 307Egg Production million 2014-15 1,924 78,484Estimated Meat Production ‘000 MT ‘’ 162.5 6,691Marine & Inland Fish Production “ 2013-14 413.8 9,579Wool Production ‘000 kg 2014-15 - 48,139Veterinary InfrastructureVeterinary Institutes nos 2013-14 3,479 60,896Semen Stations ‘’ ‘’ 1 57AI Centers ‘’ ‘’ 5,826 83,796Veterinary Services AI Done ‘000 2013-14 1,435 58,532Vaccination Done
H.S. Vaccination ‘’ 2013-14 8,282 B.Q. Vaccination ‘’ ‘’ 5,297 FMD Vaccination ‘’ ‘’ 2,663
Total Treatment ‘’ ‘’ 7,658 Total Castration ‘’ ‘’ 556 Agricultural ResourcesForest Cover % 2012-13 37.3 21.30Pasture and Grazing Land ‘000 ha ‘’ 536 10,240
As % of total reporting area % ‘’ 3.5 3.3Area Under Fodder Crops ‘000 ha ‘’ - 9,188Gross Irrigated Area As % Gross Cropped Area % ‘’ 38.0 47.6Cropping Intensity % ‘’ 166 139Irrigation Intensity % ‘’ 154 138Production of Major Crops
Cereals ‘000 MT 2013-14 8,574 245,790Pulses ‘’ ‘’ 1,058 19,253Oilseeds ‘’ ‘’ 699 32,749
Cotton ‘000 bales (170 kg Each) ‘’ 299 35,902
Sugarcane ‘000 MT ‘’ 2,544 352,142Ground Water StatusSafe % of Blocks 2011 & (2009) 98 (98) 69 (73)Semi Critical ‘’ ‘’ 0 (0) 11 (9)
4National Dairy Development Board
Dairying in ODiSHa - A Statistical Profile 2016 Part I : General Statistics
I.1. Odisha at a Glance
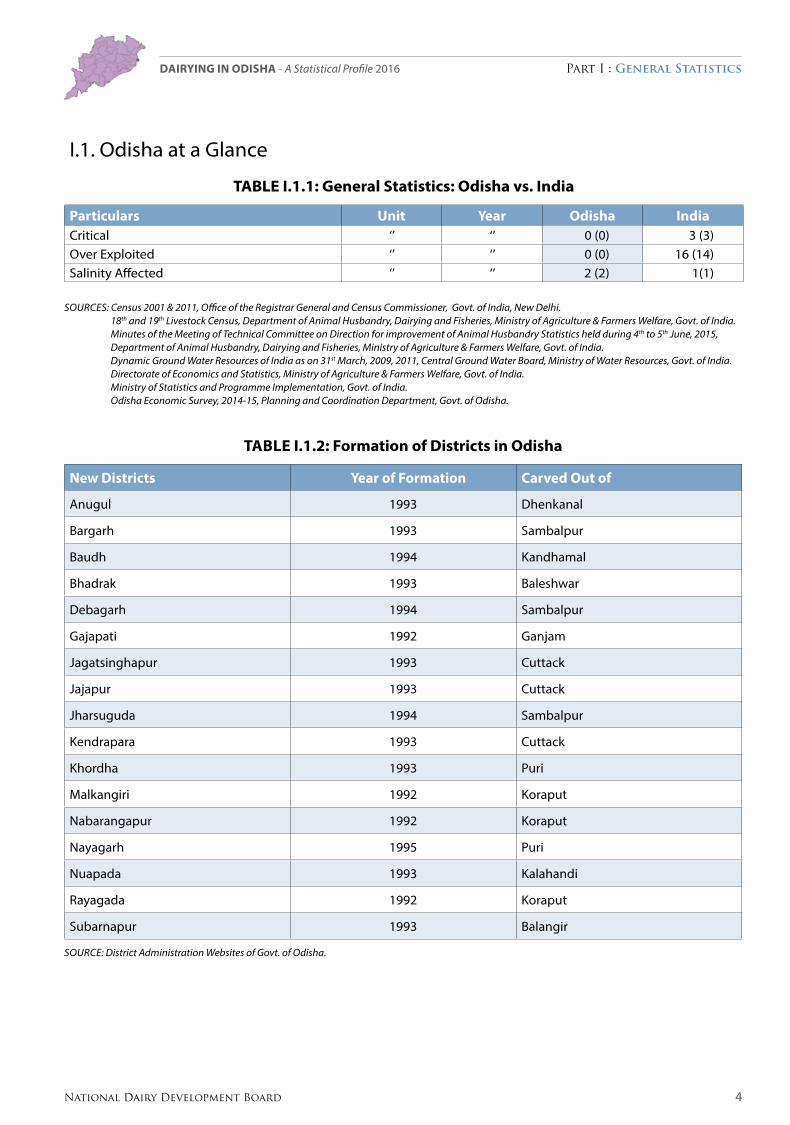
TABLE I.1.1: General Statistics: Odisha vs. India
Particulars Unit Year Odisha IndiaCritical ‘’ ‘’ 0 (0) 3 (3)Over Exploited ‘’ ‘’ 0 (0) 16 (14)Salinity Affected ‘’ ‘’ 2 (2) 1(1)
SourceS: census 2001 & 2011, office of the registrar General and census commissioner, Govt. of India, New Delhi. 18th and 19th Livestock census, Department of Animal Husbandry, Dairying and Fisheries, Ministry of Agriculture & Farmers Welfare, Govt. of India. Minutes of the Meeting of Technical committee on Direction for improvement of Animal Husbandry Statistics held during 4th to 5th June, 2015,
Department of Animal Husbandry, Dairying and Fisheries, Ministry of Agriculture & Farmers Welfare, Govt. of India. Dynamic Ground Water resources of India as on 31st March, 2009, 2011, central Ground Water Board, Ministry of Water resources, Govt. of India. Directorate of economics and Statistics, Ministry of Agriculture & Farmers Welfare, Govt. of India. Ministry of Statistics and Programme Implementation, Govt. of India. odisha economic Survey, 2014-15, Planning and coordination Department, Govt. of odisha.
TABLE I.1.2: Formation of Districts in Odisha
New Districts Year of Formation Carved Out of
Anugul 1993 Dhenkanal
Bargarh 1993 Sambalpur
Baudh 1994 Kandhamal
Bhadrak 1993 Baleshwar
Debagarh 1994 Sambalpur
Gajapati 1992 Ganjam
Jagatsinghapur 1993 Cuttack
Jajapur 1993 Cuttack
Jharsuguda 1994 Sambalpur
Kendrapara 1993 Cuttack
Khordha 1993 Puri
Malkangiri 1992 Koraput
Nabarangapur 1992 Koraput
Nayagarh 1995 Puri
Nuapada 1993 Kalahandi
Rayagada 1992 Koraput
Subarnapur 1993 Balangir
Source: District Administration Websites of Govt. of odisha.
5 National Dairy Development Board
Dairying in ODiSHa - A Statistical Profile 2016 Part I : General Statistics
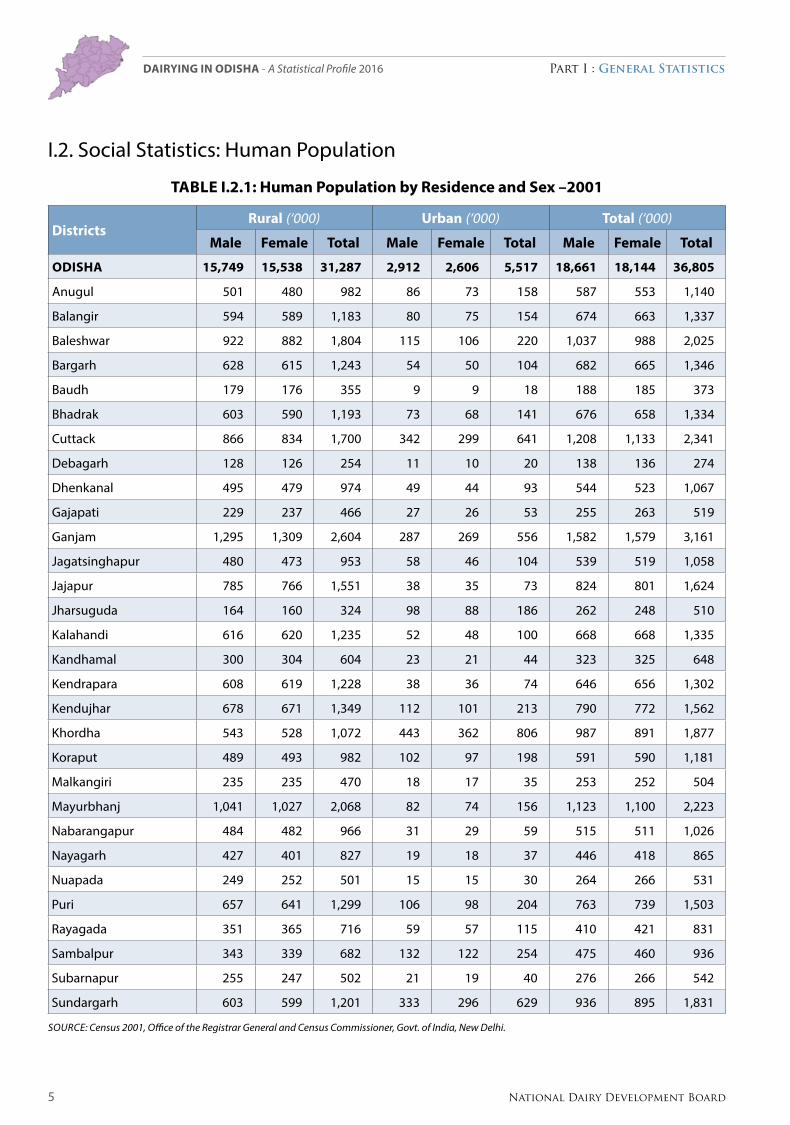
I.2. Social Statistics: Human Population
TABLE I.2.1: Human Population by Residence and Sex –2001
DistrictsRural (‘000) Urban (‘000) Total (‘000)
Male Female Total Male Female Total Male Female Total
ODISHA 15,749 15,538 31,287 2,912 2,606 5,517 18,661 18,144 36,805
Anugul 501 480 982 86 73 158 587 553 1,140
Balangir 594 589 1,183 80 75 154 674 663 1,337
Baleshwar 922 882 1,804 115 106 220 1,037 988 2,025
Bargarh 628 615 1,243 54 50 104 682 665 1,346
Baudh 179 176 355 9 9 18 188 185 373
Bhadrak 603 590 1,193 73 68 141 676 658 1,334
Cuttack 866 834 1,700 342 299 641 1,208 1,133 2,341
Debagarh 128 126 254 11 10 20 138 136 274
Dhenkanal 495 479 974 49 44 93 544 523 1,067
Gajapati 229 237 466 27 26 53 255 263 519
Ganjam 1,295 1,309 2,604 287 269 556 1,582 1,579 3,161
Jagatsinghapur 480 473 953 58 46 104 539 519 1,058
Jajapur 785 766 1,551 38 35 73 824 801 1,624
Jharsuguda 164 160 324 98 88 186 262 248 510
Kalahandi 616 620 1,235 52 48 100 668 668 1,335
Kandhamal 300 304 604 23 21 44 323 325 648
Kendrapara 608 619 1,228 38 36 74 646 656 1,302
Kendujhar 678 671 1,349 112 101 213 790 772 1,562
Khordha 543 528 1,072 443 362 806 987 891 1,877
Koraput 489 493 982 102 97 198 591 590 1,181
Malkangiri 235 235 470 18 17 35 253 252 504
Mayurbhanj 1,041 1,027 2,068 82 74 156 1,123 1,100 2,223
Nabarangapur 484 482 966 31 29 59 515 511 1,026
Nayagarh 427 401 827 19 18 37 446 418 865
Nuapada 249 252 501 15 15 30 264 266 531
Puri 657 641 1,299 106 98 204 763 739 1,503
Rayagada 351 365 716 59 57 115 410 421 831
Sambalpur 343 339 682 132 122 254 475 460 936
Subarnapur 255 247 502 21 19 40 276 266 542
Sundargarh 603 599 1,201 333 296 629 936 895 1,831
Source: census 2001, office of the registrar General and census commissioner, Govt. of India, New Delhi.
6National Dairy Development Board
Dairying in ODiSHa - A Statistical Profile 2016 Part I : General Statistics

7 National Dairy Development Board
Dairying in ODiSHa - A Statistical Profile 2016 Part I : General Statistics
I.2. Social Statistics: Human Population
TABLE I.2.2: Human Population by Residence and Sex –2011
DistrictsRural (‘000) Urban (‘000) Total (‘000)
Male Female Total Male Female Total Male Female Total
ODISHA 17,586 17,384 34,971 3,626 3,378 7,004 21,212 20,762 41,974
Anugul 546 521 1,067 109 97 207 656 618 1,274
Balangir 729 723 1,452 101 96 197 830 819 1,649
Baleshwar 1,056 1,011 2,067 129 124 253 1,186 1,135 2,321
Bargarh 673 659 1,331 77 74 150 749 732 1,481
Baudh 211 210 421 10 10 20 222 220 441
Bhadrak 665 655 1,320 95 91 186 760 746 1,506
Cuttack 971 918 1,888 382 354 736 1,353 1,272 2,624
Debagarh 147 143 290 12 11 22 158 154 313
Dhenkanal 551 524 1,075 61 56 118 613 580 1,193
Gajapati 248 259 507 35 35 71 283 295 578
Ganjam 1,384 1,377 2,761 396 372 768 1,779 1,750 3,529
Jagatsinghapur 517 504 1,021 61 55 116 578 559 1,137
Jajapur 857 836 1,692 69 66 135 926 901 1,827
Jharsuguda 176 172 348 121 111 231 297 283 580
Kalahandi 725 730 1,455 62 60 122 787 790 1,577
Kandhamal 324 337 661 36 36 72 360 373 733
Kendrapara 675 682 1,357 43 41 84 718 723 1,440
Kendujhar 775 774 1,549 132 121 253 906 895 1,802
Khordha 596 572 1,167 571 513 1,084 1,167 1,085 2,252
Koraput 564 590 1,153 115 111 226 679 701 1,380
Malkangiri 278 286 564 26 24 50 304 310 613
Mayurbhanj 1,158 1,169 2,327 99 94 193 1,256 1,264 2,520
Nabarangapur 561 573 1,133 44 44 88 605 616 1,221
Nayagarh 461 422 883 42 38 80 503 460 963
Nuapada 285 292 576 17 17 34 302 308 610
Puri 728 706 1,434 137 128 265 865 833 1,699
Rayagada 398 423 821 74 73 147 472 496 968
Sambalpur 369 364 733 158 150 308 527 514 1,041
Subarnapur 286 275 560 26 24 50 311 299 610
Sundargarh 676 679 1,355 385 353 738 1,061 1,032 2,093
Source: census 2011, office of the registrar General and census commissioner, Govt. of India, New Delhi.
8National Dairy Development Board
Dairying in ODiSHa - A Statistical Profile 2016 Part I : General Statistics
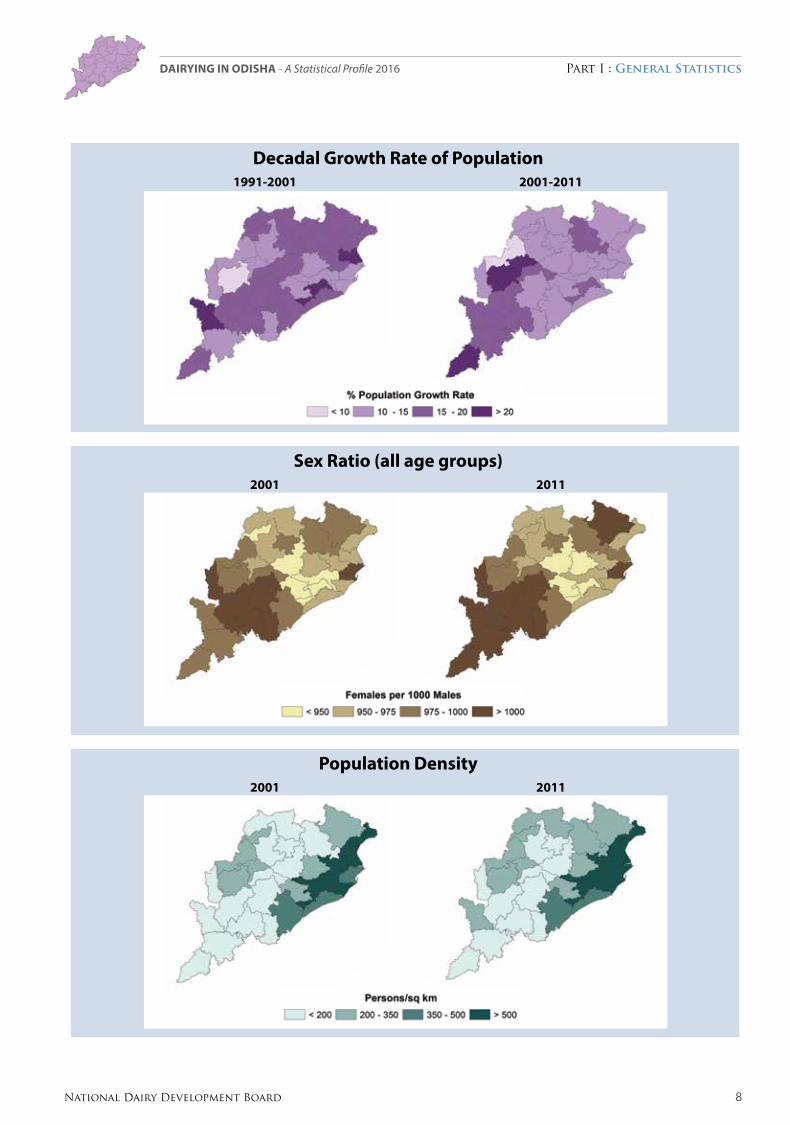
Decadal Growth Rate of Population 1991-2001 2001-2011
Sex Ratio (all age groups) 2001 2011
Population Density 2001 2011
9 National Dairy Development Board
Dairying in ODiSHa - A Statistical Profile 2016 Part I : General Statistics
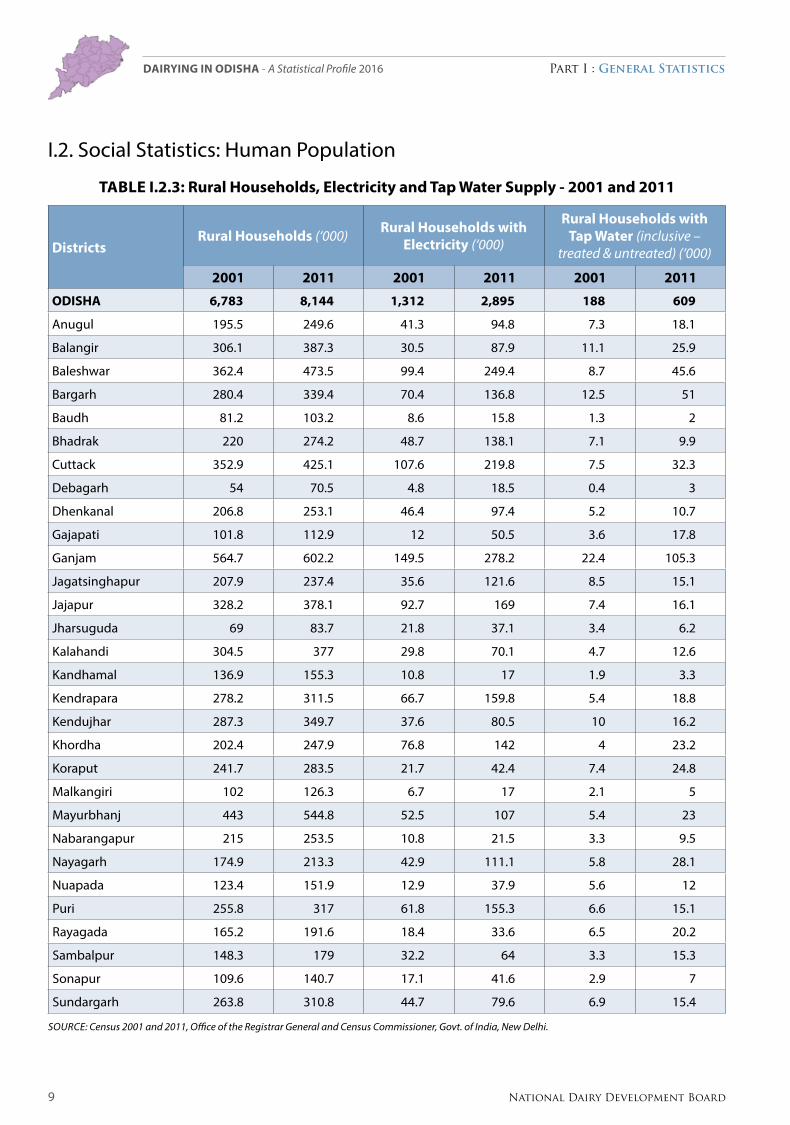
I.2. Social Statistics: Human Population
TABLE I.2.3: Rural Households, Electricity and Tap Water Supply - 2001 and 2011
DistrictsRural Households (‘000) Rural Households with
Electricity (‘000)
Rural Households with Tap Water (inclusive –
treated & untreated) (‘000)
2001 2011 2001 2011 2001 2011
ODISHA 6,783 8,144 1,312 2,895 188 609
Anugul 195.5 249.6 41.3 94.8 7.3 18.1
Balangir 306.1 387.3 30.5 87.9 11.1 25.9
Baleshwar 362.4 473.5 99.4 249.4 8.7 45.6
Bargarh 280.4 339.4 70.4 136.8 12.5 51
Baudh 81.2 103.2 8.6 15.8 1.3 2
Bhadrak 220 274.2 48.7 138.1 7.1 9.9
Cuttack 352.9 425.1 107.6 219.8 7.5 32.3
Debagarh 54 70.5 4.8 18.5 0.4 3
Dhenkanal 206.8 253.1 46.4 97.4 5.2 10.7
Gajapati 101.8 112.9 12 50.5 3.6 17.8
Ganjam 564.7 602.2 149.5 278.2 22.4 105.3
Jagatsinghapur 207.9 237.4 35.6 121.6 8.5 15.1
Jajapur 328.2 378.1 92.7 169 7.4 16.1
Jharsuguda 69 83.7 21.8 37.1 3.4 6.2
Kalahandi 304.5 377 29.8 70.1 4.7 12.6
Kandhamal 136.9 155.3 10.8 17 1.9 3.3
Kendrapara 278.2 311.5 66.7 159.8 5.4 18.8
Kendujhar 287.3 349.7 37.6 80.5 10 16.2
Khordha 202.4 247.9 76.8 142 4 23.2
Koraput 241.7 283.5 21.7 42.4 7.4 24.8
Malkangiri 102 126.3 6.7 17 2.1 5
Mayurbhanj 443 544.8 52.5 107 5.4 23
Nabarangapur 215 253.5 10.8 21.5 3.3 9.5
Nayagarh 174.9 213.3 42.9 111.1 5.8 28.1
Nuapada 123.4 151.9 12.9 37.9 5.6 12
Puri 255.8 317 61.8 155.3 6.6 15.1
Rayagada 165.2 191.6 18.4 33.6 6.5 20.2
Sambalpur 148.3 179 32.2 64 3.3 15.3
Sonapur 109.6 140.7 17.1 41.6 2.9 7
Sundargarh 263.8 310.8 44.7 79.6 6.9 15.4
Source: census 2001 and 2011, office of the registrar General and census commissioner, Govt. of India, New Delhi.

10National Dairy Development Board
Dairying in ODiSHa - A Statistical Profile 2016 Part I : General Statistics
Rural Households 2001 2011
Rural Households with Electricity 2001 2011
Rural Households with Tap Water 2001 2011
11 National Dairy Development Board
Dairying in ODiSHa - A Statistical Profile 2016 Part I : General Statistics
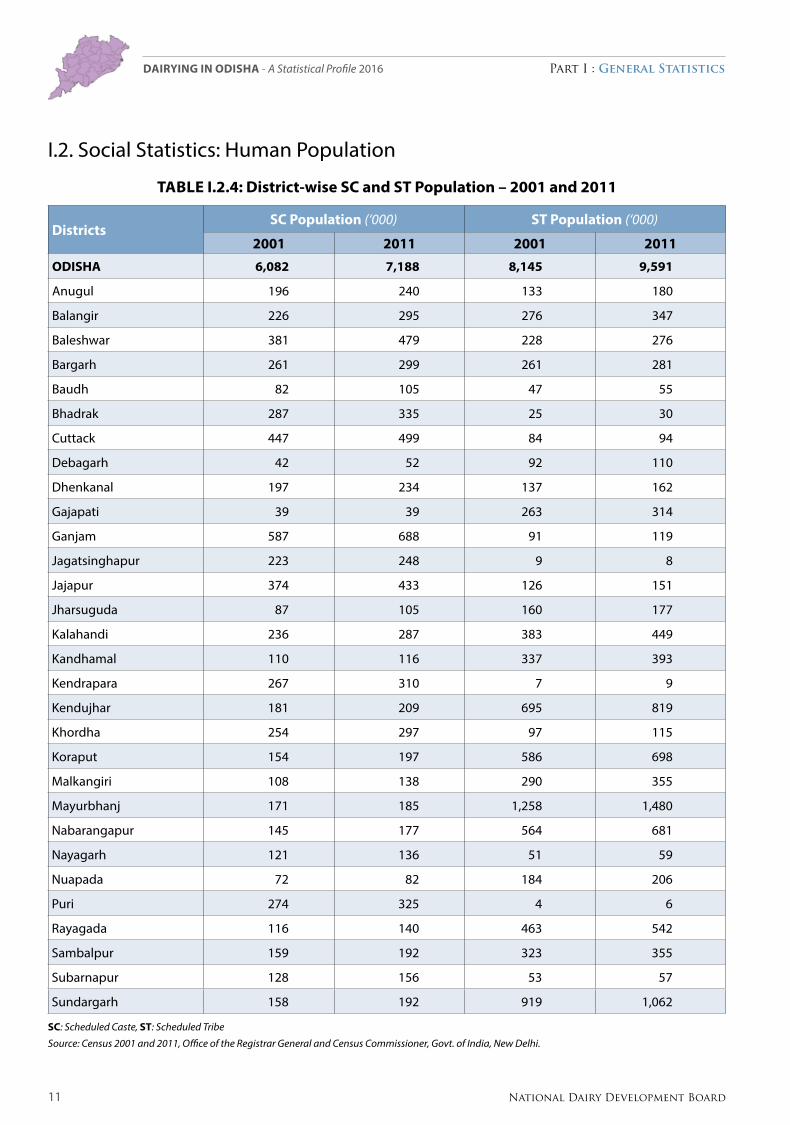
I.2. Social Statistics: Human Population
TABLE I.2.4: District-wise SC and ST Population – 2001 and 2011
DistrictsSC Population (‘000) ST Population (‘000)
2001 2011 2001 2011ODISHA 6,082 7,188 8,145 9,591
Anugul 196 240 133 180
Balangir 226 295 276 347
Baleshwar 381 479 228 276
Bargarh 261 299 261 281
Baudh 82 105 47 55
Bhadrak 287 335 25 30
Cuttack 447 499 84 94
Debagarh 42 52 92 110
Dhenkanal 197 234 137 162
Gajapati 39 39 263 314
Ganjam 587 688 91 119
Jagatsinghapur 223 248 9 8
Jajapur 374 433 126 151
Jharsuguda 87 105 160 177
Kalahandi 236 287 383 449
Kandhamal 110 116 337 393
Kendrapara 267 310 7 9
Kendujhar 181 209 695 819
Khordha 254 297 97 115
Koraput 154 197 586 698
Malkangiri 108 138 290 355
Mayurbhanj 171 185 1,258 1,480
Nabarangapur 145 177 564 681
Nayagarh 121 136 51 59
Nuapada 72 82 184 206
Puri 274 325 4 6
Rayagada 116 140 463 542
Sambalpur 159 192 323 355
Subarnapur 128 156 53 57
Sundargarh 158 192 919 1,062
SC: Scheduled caste, ST: Scheduled Tribe
Source: census 2001 and 2011, office of the registrar General and census commissioner, Govt. of India, New Delhi.
12National Dairy Development Board
Dairying in ODiSHa - A Statistical Profile 2016 Part I : General Statistics
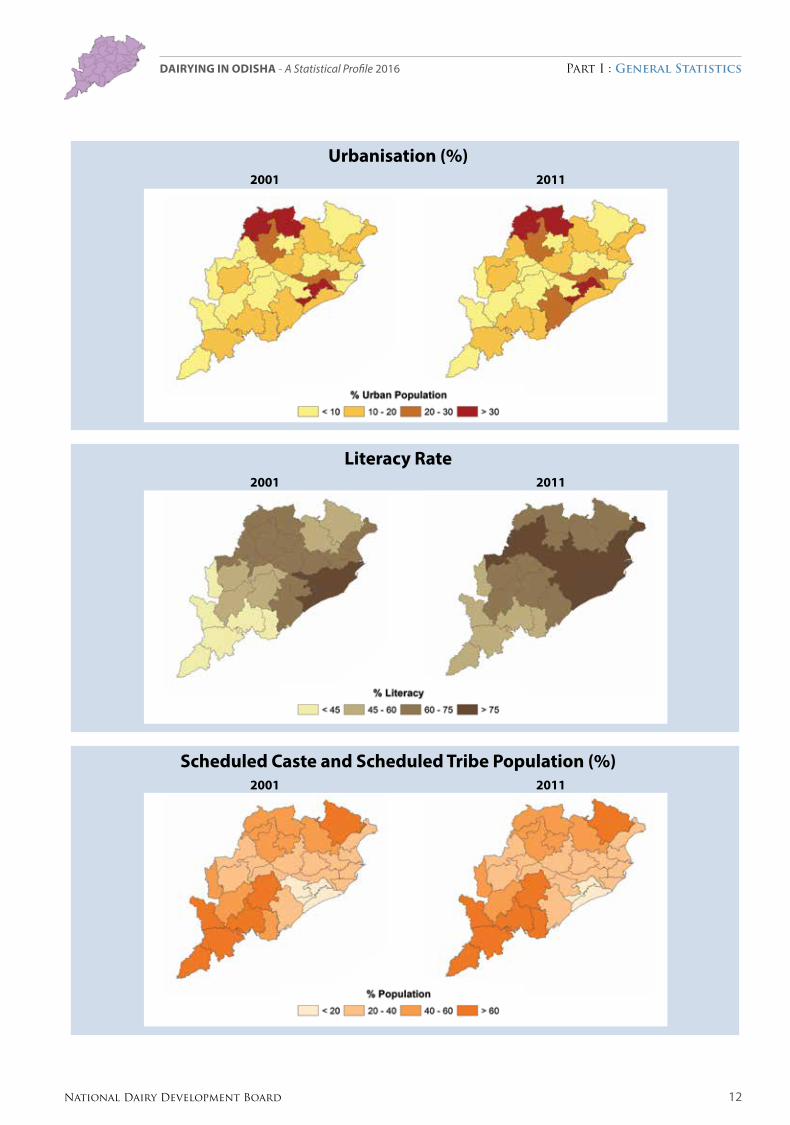
Urbanisation (%) 2001 2011
Literacy Rate 2001 2011
Scheduled Caste and Scheduled Tribe Population (%) 2001 2011
13 National Dairy Development Board
Dairying in ODiSHa - A Statistical Profile 2016 Part I : General Statistics
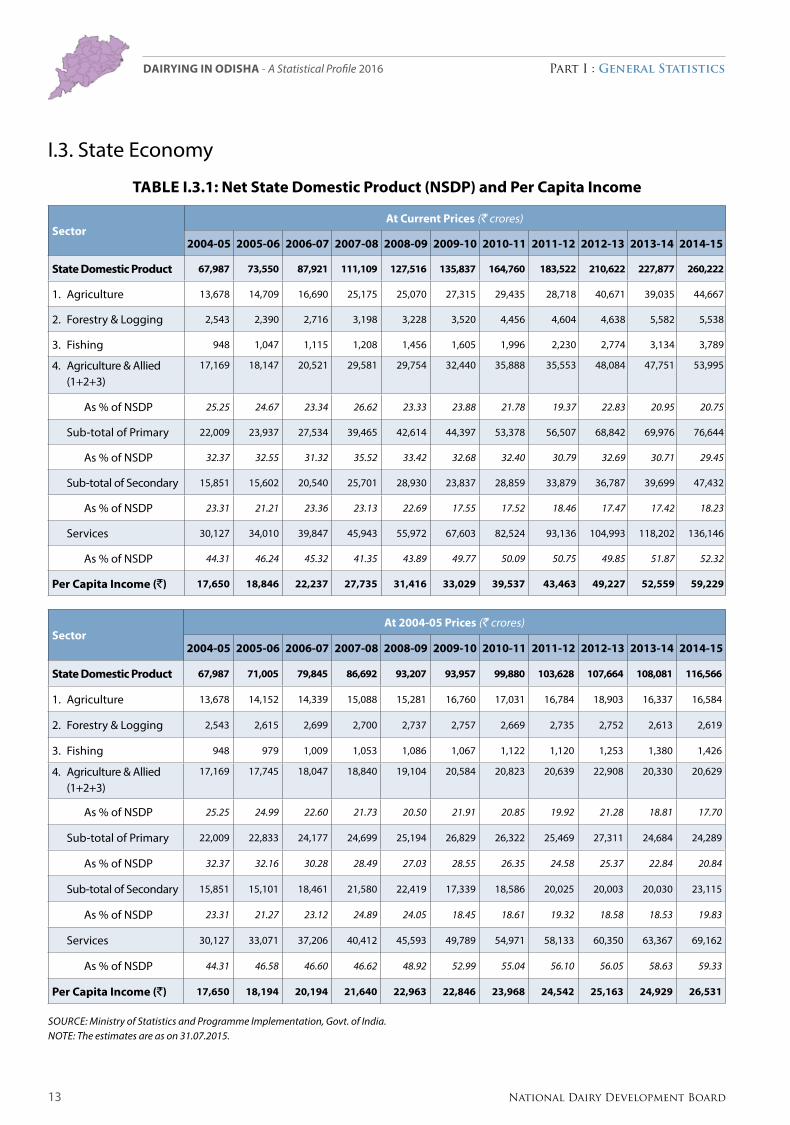
I.3. State Economy
TABLE I.3.1: Net State Domestic Product (NSDP) and Per Capita Income
SectorAt Current Prices (` crores)
2004-05 2005-06 2006-07 2007-08 2008-09 2009-10 2010-11 2011-12 2012-13 2013-14 2014-15
State Domestic Product 67,987 73,550 87,921 111,109 127,516 135,837 164,760 183,522 210,622 227,877 260,222
1. Agriculture 13,678 14,709 16,690 25,175 25,070 27,315 29,435 28,718 40,671 39,035 44,667
2. Forestry & Logging 2,543 2,390 2,716 3,198 3,228 3,520 4,456 4,604 4,638 5,582 5,538
3. Fishing 948 1,047 1,115 1,208 1,456 1,605 1,996 2,230 2,774 3,134 3,789
4. Agriculture & Allied (1+2+3)
17,169 18,147 20,521 29,581 29,754 32,440 35,888 35,553 48,084 47,751 53,995
As % of NSDP 25.25 24.67 23.34 26.62 23.33 23.88 21.78 19.37 22.83 20.95 20.75
Sub-total of Primary 22,009 23,937 27,534 39,465 42,614 44,397 53,378 56,507 68,842 69,976 76,644
As % of NSDP 32.37 32.55 31.32 35.52 33.42 32.68 32.40 30.79 32.69 30.71 29.45
Sub-total of Secondary 15,851 15,602 20,540 25,701 28,930 23,837 28,859 33,879 36,787 39,699 47,432
As % of NSDP 23.31 21.21 23.36 23.13 22.69 17.55 17.52 18.46 17.47 17.42 18.23
Services 30,127 34,010 39,847 45,943 55,972 67,603 82,524 93,136 104,993 118,202 136,146
As % of NSDP 44.31 46.24 45.32 41.35 43.89 49.77 50.09 50.75 49.85 51.87 52.32
Per Capita Income (`) 17,650 18,846 22,237 27,735 31,416 33,029 39,537 43,463 49,227 52,559 59,229
SectorAt 2004-05 Prices (` crores)
2004-05 2005-06 2006-07 2007-08 2008-09 2009-10 2010-11 2011-12 2012-13 2013-14 2014-15
State Domestic Product 67,987 71,005 79,845 86,692 93,207 93,957 99,880 103,628 107,664 108,081 116,566
1. Agriculture 13,678 14,152 14,339 15,088 15,281 16,760 17,031 16,784 18,903 16,337 16,584
2. Forestry & Logging 2,543 2,615 2,699 2,700 2,737 2,757 2,669 2,735 2,752 2,613 2,619
3. Fishing 948 979 1,009 1,053 1,086 1,067 1,122 1,120 1,253 1,380 1,426
4. Agriculture & Allied (1+2+3)
17,169 17,745 18,047 18,840 19,104 20,584 20,823 20,639 22,908 20,330 20,629
As % of NSDP 25.25 24.99 22.60 21.73 20.50 21.91 20.85 19.92 21.28 18.81 17.70
Sub-total of Primary 22,009 22,833 24,177 24,699 25,194 26,829 26,322 25,469 27,311 24,684 24,289
As % of NSDP 32.37 32.16 30.28 28.49 27.03 28.55 26.35 24.58 25.37 22.84 20.84
Sub-total of Secondary 15,851 15,101 18,461 21,580 22,419 17,339 18,586 20,025 20,003 20,030 23,115
As % of NSDP 23.31 21.27 23.12 24.89 24.05 18.45 18.61 19.32 18.58 18.53 19.83
Services 30,127 33,071 37,206 40,412 45,593 49,789 54,971 58,133 60,350 63,367 69,162
As % of NSDP 44.31 46.58 46.60 46.62 48.92 52.99 55.04 56.10 56.05 58.63 59.33
Per Capita Income (`) 17,650 18,194 20,194 21,640 22,963 22,846 23,968 24,542 25,163 24,929 26,531
Source: Ministry of Statistics and Programme Implementation, Govt. of India.NoTe: The estimates are as on 31.07.2015.
14National Dairy Development Board
Dairying in ODiSHa - A Statistical Profile 2016 Part I : General Statistics
15 National Dairy Development Board
Dairying in ODiSHa - A Statistical Profile 2016 Part I : General Statistics
I.3. State Economy
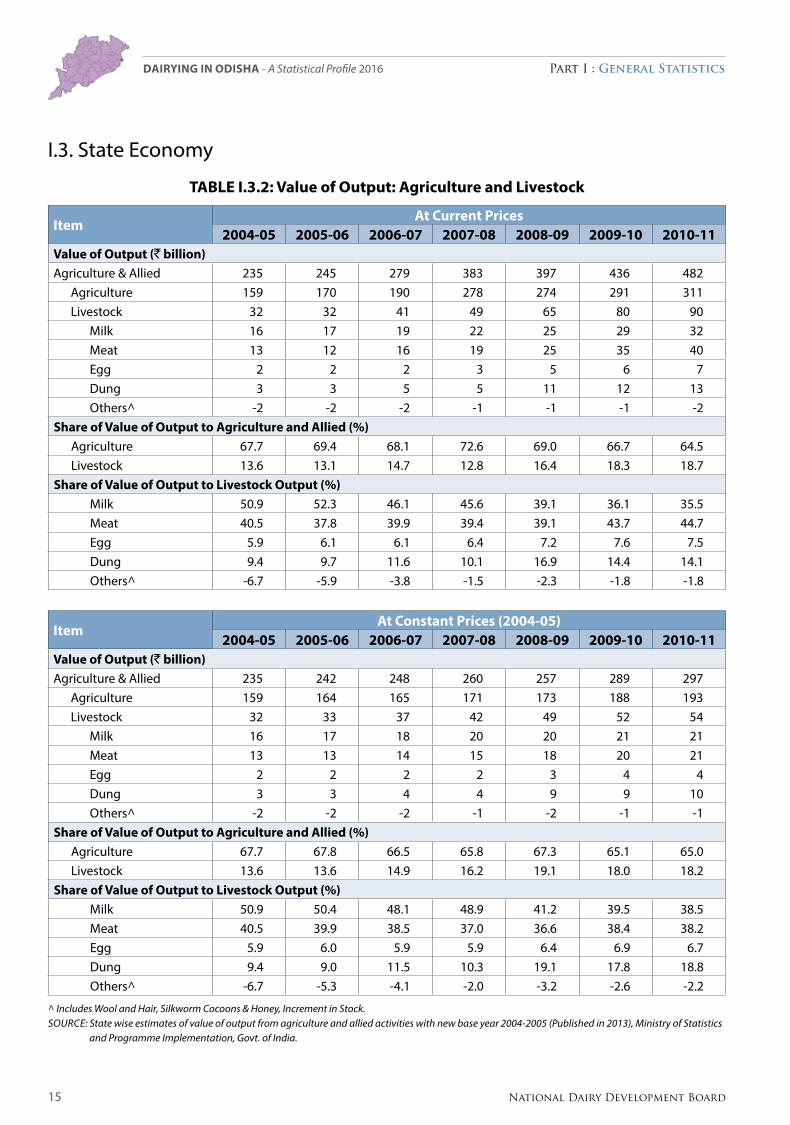
TABLE I.3.2: Value of Output: Agriculture and Livestock
Item At Current Prices
2004-05 2005-06 2006-07 2007-08 2008-09 2009-10 2010-11Value of Output (` billion)Agriculture & Allied 235 245 279 383 397 436 482
Agriculture 159 170 190 278 274 291 311Livestock 32 32 41 49 65 80 90
Milk 16 17 19 22 25 29 32Meat 13 12 16 19 25 35 40Egg 2 2 2 3 5 6 7Dung 3 3 5 5 11 12 13Others^ -2 -2 -2 -1 -1 -1 -2
Share of Value of Output to Agriculture and Allied (%)Agriculture 67.7 69.4 68.1 72.6 69.0 66.7 64.5Livestock 13.6 13.1 14.7 12.8 16.4 18.3 18.7
Share of Value of Output to Livestock Output (%)Milk 50.9 52.3 46.1 45.6 39.1 36.1 35.5Meat 40.5 37.8 39.9 39.4 39.1 43.7 44.7Egg 5.9 6.1 6.1 6.4 7.2 7.6 7.5Dung 9.4 9.7 11.6 10.1 16.9 14.4 14.1Others^ -6.7 -5.9 -3.8 -1.5 -2.3 -1.8 -1.8
Item At Constant Prices (2004-05)
2004-05 2005-06 2006-07 2007-08 2008-09 2009-10 2010-11 Value of Output (` billion)Agriculture & Allied 235 242 248 260 257 289 297
Agriculture 159 164 165 171 173 188 193Livestock 32 33 37 42 49 52 54
Milk 16 17 18 20 20 21 21Meat 13 13 14 15 18 20 21Egg 2 2 2 2 3 4 4Dung 3 3 4 4 9 9 10Others^ -2 -2 -2 -1 -2 -1 -1
Share of Value of Output to Agriculture and Allied (%)Agriculture 67.7 67.8 66.5 65.8 67.3 65.1 65.0Livestock 13.6 13.6 14.9 16.2 19.1 18.0 18.2
Share of Value of Output to Livestock Output (%)Milk 50.9 50.4 48.1 48.9 41.2 39.5 38.5Meat 40.5 39.9 38.5 37.0 36.6 38.4 38.2Egg 5.9 6.0 5.9 5.9 6.4 6.9 6.7Dung 9.4 9.0 11.5 10.3 19.1 17.8 18.8Others^ -6.7 -5.3 -4.1 -2.0 -3.2 -2.6 -2.2
^ Includes Wool and Hair, Silkworm cocoons & Honey, Increment in Stock.Source: State wise estimates of value of output from agriculture and allied activities with new base year 2004-2005 (Published in 2013), Ministry of Statistics
and Programme Implementation, Govt. of India.
16National Dairy Development Board
Dairying in ODiSHa - A Statistical Profile 2016 Part I : General Statistics
I.3. State Economy
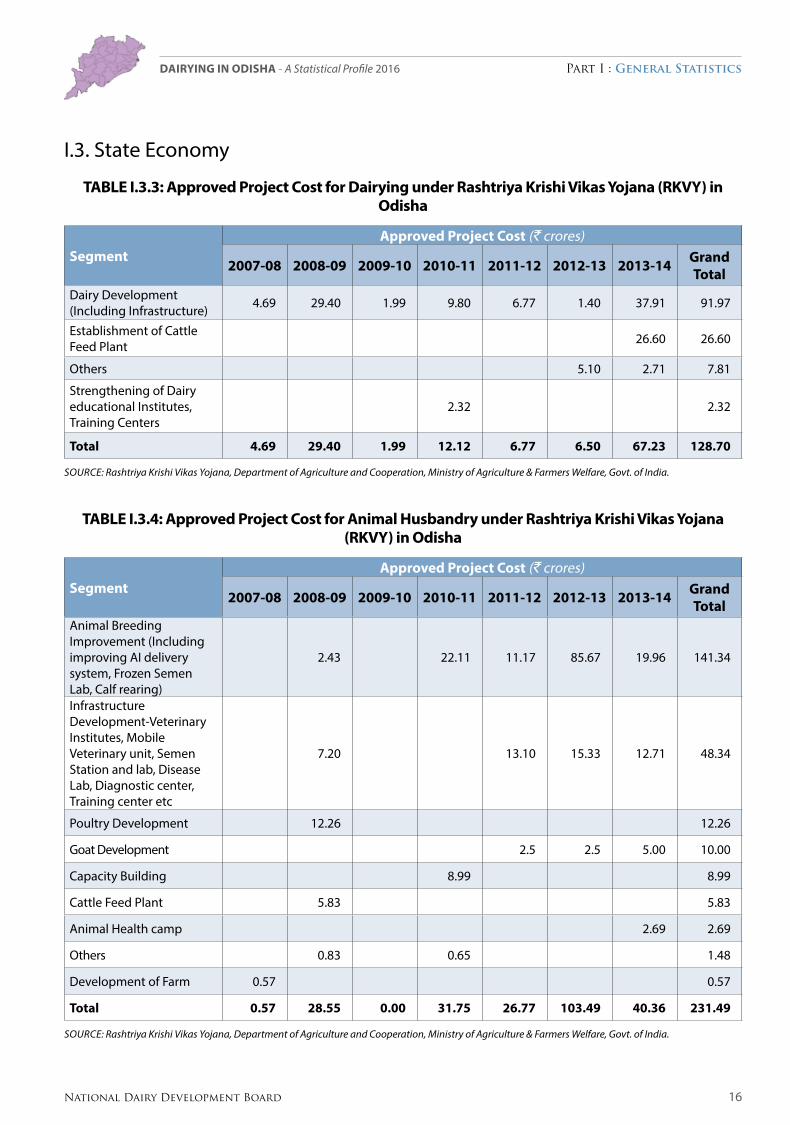
TABLE I.3.3: Approved Project Cost for Dairying under Rashtriya Krishi Vikas Yojana (RKVY) in Odisha
SegmentApproved Project Cost (` crores)
2007-08 2008-09 2009-10 2010-11 2011-12 2012-13 2013-14 Grand Total
Dairy Development (Including Infrastructure) 4.69 29.40 1.99 9.80 6.77 1.40 37.91 91.97
Establishment of Cattle Feed Plant 26.60 26.60
Others 5.10 2.71 7.81
Strengthening of Dairy educational Institutes, Training Centers
2.32 2.32
Total 4.69 29.40 1.99 12.12 6.77 6.50 67.23 128.70
Source: rashtriya Krishi Vikas Yojana, Department of Agriculture and cooperation, Ministry of Agriculture & Farmers Welfare, Govt. of India.
TABLE I.3.4: Approved Project Cost for Animal Husbandry under Rashtriya Krishi Vikas Yojana (RKVY) in Odisha
SegmentApproved Project Cost (` crores)
2007-08 2008-09 2009-10 2010-11 2011-12 2012-13 2013-14 Grand Total
Animal Breeding Improvement (Including improving AI delivery system, Frozen Semen Lab, Calf rearing)
2.43 22.11 11.17 85.67 19.96 141.34
Infrastructure Development-Veterinary Institutes, Mobile Veterinary unit, Semen Station and lab, Disease Lab, Diagnostic center, Training center etc
7.20 13.10 15.33 12.71 48.34
Poultry Development 12.26 12.26
Goat Development 2.5 2.5 5.00 10.00
Capacity Building 8.99 8.99
Cattle Feed Plant 5.83 5.83
Animal Health camp 2.69 2.69
Others 0.83 0.65 1.48
Development of Farm 0.57 0.57
Total 0.57 28.55 0.00 31.75 26.77 103.49 40.36 231.49
Source: rashtriya Krishi Vikas Yojana, Department of Agriculture and cooperation, Ministry of Agriculture & Farmers Welfare, Govt. of India.
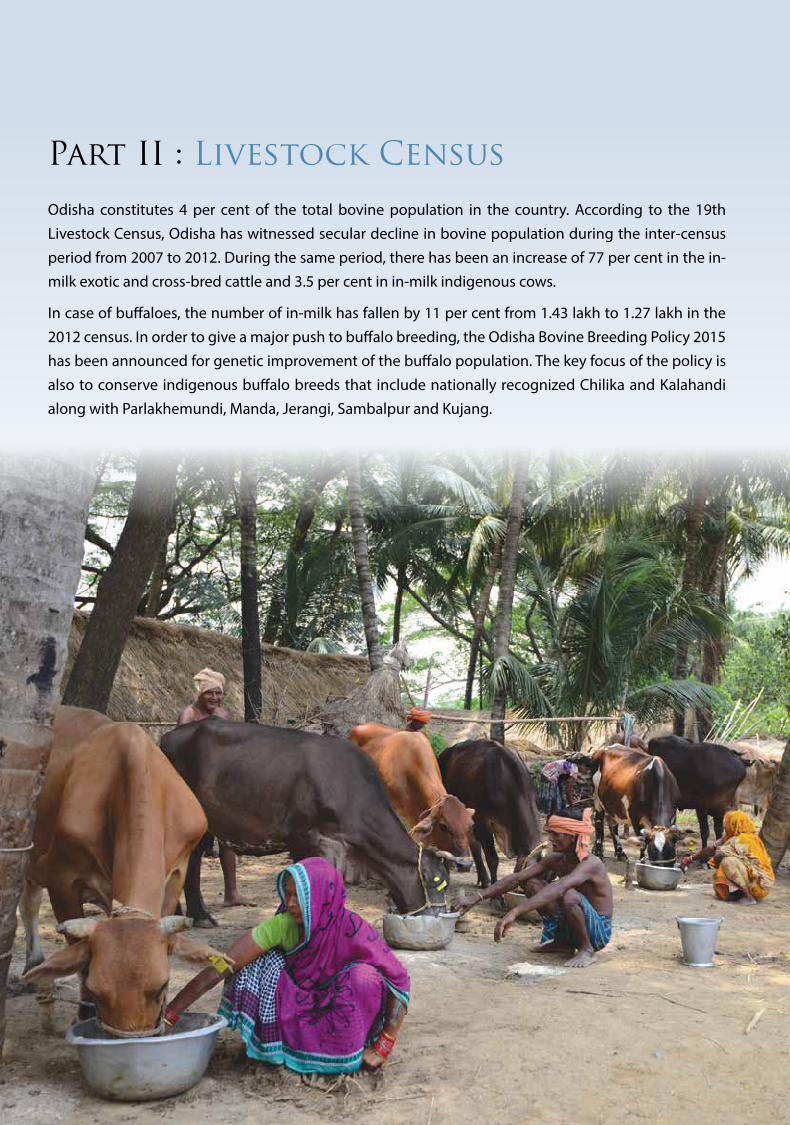
Part II : Livestock Census
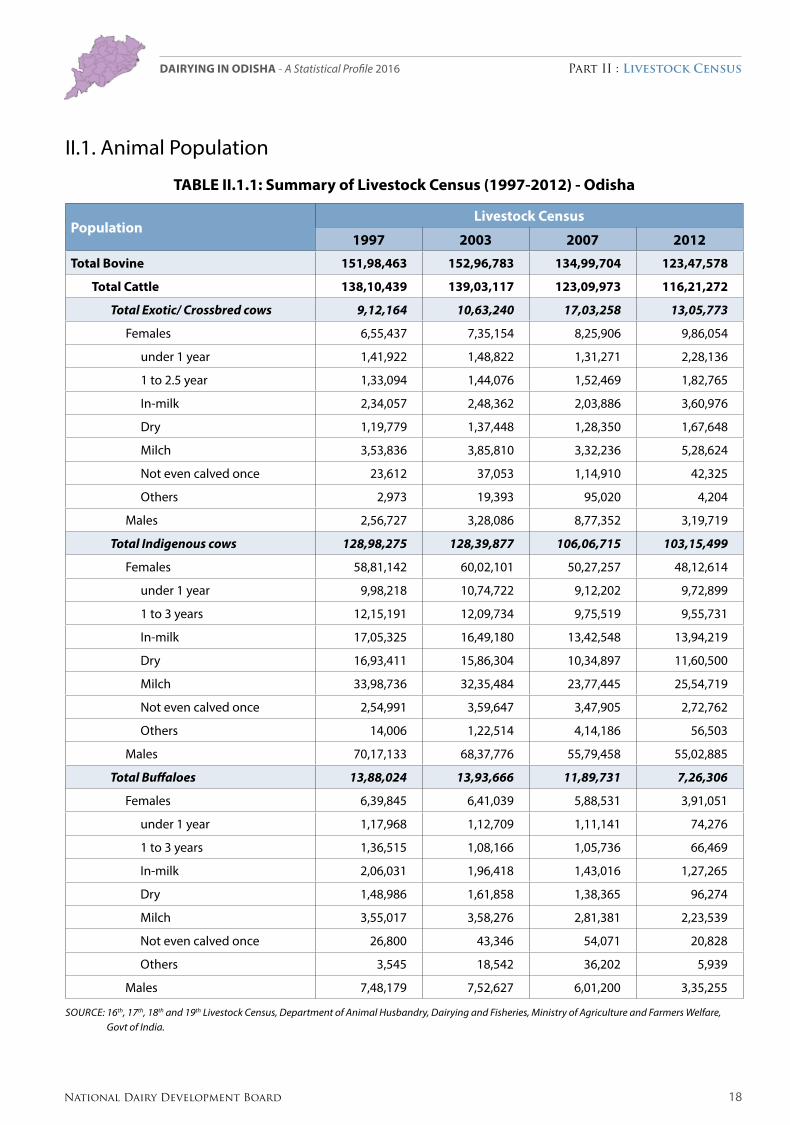
Odisha constitutes 4 per cent of the total bovine population in the country. According to the 19th Livestock Census, Odisha has witnessed secular decline in bovine population during the inter-census period from 2007 to 2012. During the same period, there has been an increase of 77 per cent in the in-milk exotic and cross-bred cattle and 3.5 per cent in in-milk indigenous cows.
In case of buffaloes, the number of in-milk has fallen by 11 per cent from 1.43 lakh to 1.27 lakh in the 2012 census. In order to give a major push to buffalo breeding, the Odisha Bovine Breeding Policy 2015 has been announced for genetic improvement of the buffalo population. The key focus of the policy is also to conserve indigenous buffalo breeds that include nationally recognized Chilika and Kalahandi along with Parlakhemundi, Manda, Jerangi, Sambalpur and Kujang.
18National Dairy Development Board
Part II : Livestock CensusDairying in ODiSHa - A Statistical Profile 2016
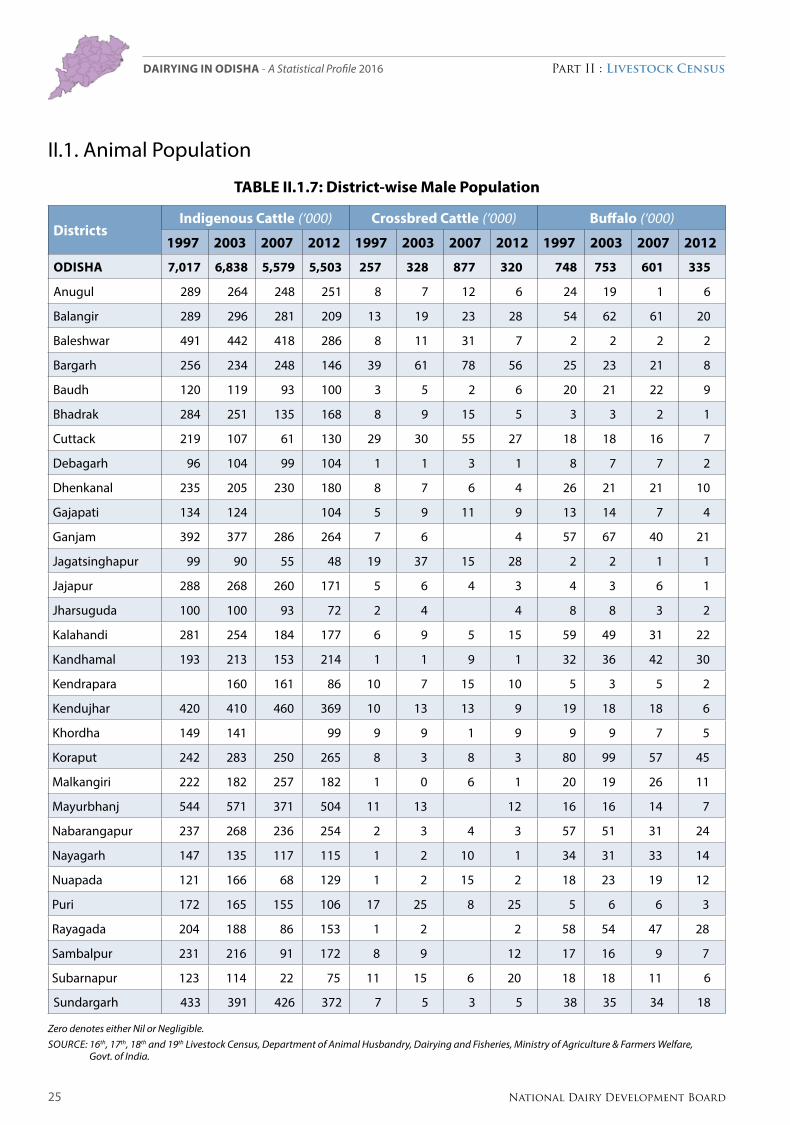
II.1. Animal Population
TABLE II.1.1: Summary of Livestock Census (1997-2012) - Odisha
PopulationLivestock Census
1997 2003 2007 2012
Total Bovine 151,98,463 152,96,783 134,99,704 123,47,578
Total Cattle 138,10,439 139,03,117 123,09,973 116,21,272
Total Exotic/ Crossbred cows 9,12,164 10,63,240 17,03,258 13,05,773
Females 6,55,437 7,35,154 8,25,906 9,86,054
under 1 year 1,41,922 1,48,822 1,31,271 2,28,136
1 to 2.5 year 1,33,094 1,44,076 1,52,469 1,82,765
In-milk 2,34,057 2,48,362 2,03,886 3,60,976
Dry 1,19,779 1,37,448 1,28,350 1,67,648
Milch 3,53,836 3,85,810 3,32,236 5,28,624
Not even calved once 23,612 37,053 1,14,910 42,325
Others 2,973 19,393 95,020 4,204
Males 2,56,727 3,28,086 8,77,352 3,19,719
Total Indigenous cows 128,98,275 128,39,877 106,06,715 103,15,499
Females 58,81,142 60,02,101 50,27,257 48,12,614
under 1 year 9,98,218 10,74,722 9,12,202 9,72,899
1 to 3 years 12,15,191 12,09,734 9,75,519 9,55,731
In-milk 17,05,325 16,49,180 13,42,548 13,94,219
Dry 16,93,411 15,86,304 10,34,897 11,60,500
Milch 33,98,736 32,35,484 23,77,445 25,54,719
Not even calved once 2,54,991 3,59,647 3,47,905 2,72,762
Others 14,006 1,22,514 4,14,186 56,503
Males 70,17,133 68,37,776 55,79,458 55,02,885
Total Buffaloes 13,88,024 13,93,666 11,89,731 7,26,306
Females 6,39,845 6,41,039 5,88,531 3,91,051
under 1 year 1,17,968 1,12,709 1,11,141 74,276
1 to 3 years 1,36,515 1,08,166 1,05,736 66,469
In-milk 2,06,031 1,96,418 1,43,016 1,27,265
Dry 1,48,986 1,61,858 1,38,365 96,274
Milch 3,55,017 3,58,276 2,81,381 2,23,539
Not even calved once 26,800 43,346 54,071 20,828
Others 3,545 18,542 36,202 5,939
Males 7,48,179 7,52,627 6,01,200 3,35,255
Source: 16th, 17th, 18th and 19th Livestock census, Department of Animal Husbandry, Dairying and Fisheries, Ministry of Agriculture and Farmers Welfare, Govt of India.

19 National Dairy Development Board
Part II : Livestock CensusDairying in ODiSHa - A Statistical Profile 2016
II.1. Animal Population
TABLE II.1.2: District-wise Bovine Population
DistrictsIndigenous Cattle (‘000) Crossbred Cattle (‘000) Buffalo (‘000)
1997 2003 2007 2012 1997 2003 2007 2012 1997 2003 2007 2012
ODISHA 12,898 12,840 10,607 10,315 912 1,063 1,703 1,306 1,388 1,394 1,190 726
Anugul 533 475 430 412 30 30 22 25 45 35 20 12
Balangir 478 486 428 294 30 42 88 67 100 120 118 41
Baleshwar 921 854 852 728 28 36 46 37 5 4 5 4
Bargarh 410 348 352 195 97 130 131 136 38 37 34 19
Baudh 230 225 178 164 7 11 7 14 39 42 41 17
Bhadrak 535 586 395 485 25 29 28 12 9 14 5
Cuttack 507 391 240 354 116 135 126 181 37 39 39 23
Debagarh 176 176 157 164 3 3 4 13 12 11 4
Dhenkanal 471 442 450 405 25 40 15 15 63 49 50 25
Gajapati 229 207 56 166 11 17 23 17 25 24 15 10
Ganjam 816 803 525 569 25 21 20 131 132 85 64
Jagatsinghapur 204 201 135 119 83 127 178 14 13 11 11
Jajapur 613 622 637 487 20 21 15 17 12 10 16 5
Jharsuguda 168 158 157 107 6 9 26 13 12 11 8 5
Kalahandi 463 416 291 277 18 21 13 34 96 81 56 44
Kandhamal 302 333 235 331 3 4 2 62 68 80 60
Kendrapara 189 427 396 297 59 32 48 66 32 17 16 14
Kendujhar 679 746 755 601 34 39 35 34 36 36 36 14
Khordha 359 349 257 48 47 59 20 20 14 12
Koraput 444 533 548 454 23 11 24 16 136 177 104 79
Malkangiri 400 324 462 349 3 2 11 5 35 35 48 21
Mayurbhanj 841 879 676 792 38 43 40 26 27 23 14
Nabarangapur 378 432 366 380 6 9 17 14 78 71 49 42
Nayagarh 317 280 223 223 7 8 24 6 47 46 49 20
Nuapada 206 271 124 193 3 4 18 5 32 42 34 24
Puri 377 369 409 274 85 111 170 17 20 27 16
Rayagada 358 323 142 281 4 8 7 112 108 102 64
Sambalpur 381 347 202 257 25 26 36 29 26 17 11
Subarnapur 216 199 89 122 25 30 26 43 29 28 17 10
Sundargarh 695 640 677 580 25 19 11 21 55 55 53 33
Source: 16th, 17th, 18th and 19th Livestock census, Department of Animal Husbandry, Dairying and Fisheries, Ministry of Agriculture & Farmers Welfare, Govt. of India.
20National Dairy Development Board
Part II : Livestock CensusDairying in ODiSHa - A Statistical Profile 2016
II.1. Animal Population
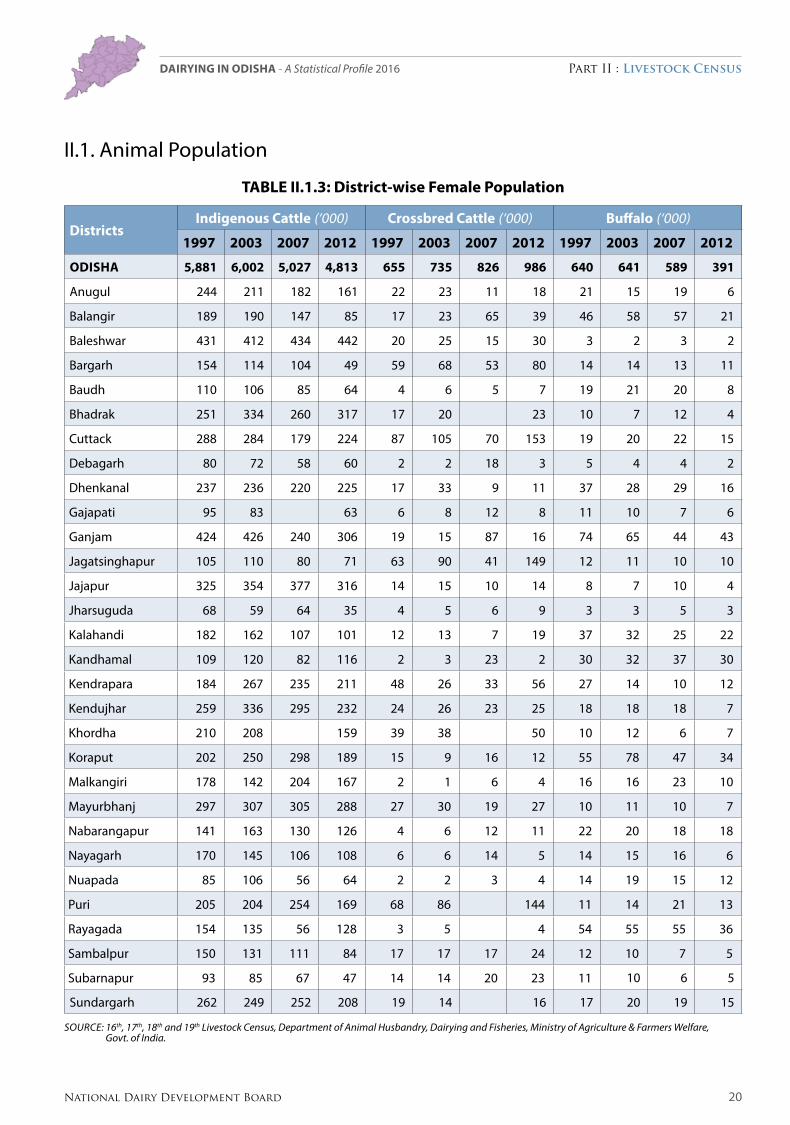
TABLE II.1.3: District-wise Female Population
DistrictsIndigenous Cattle (‘000) Crossbred Cattle (‘000) Buffalo (‘000)
1997 2003 2007 2012 1997 2003 2007 2012 1997 2003 2007 2012
ODISHA 5,881 6,002 5,027 4,813 655 735 826 986 640 641 589 391
Anugul 244 211 182 161 22 23 11 18 21 15 19 6
Balangir 189 190 147 85 17 23 65 39 46 58 57 21
Baleshwar 431 412 434 442 20 25 15 30 3 2 3 2
Bargarh 154 114 104 49 59 68 53 80 14 14 13 11
Baudh 110 106 85 64 4 6 5 7 19 21 20 8
Bhadrak 251 334 260 317 17 20 23 10 7 12 4
Cuttack 288 284 179 224 87 105 70 153 19 20 22 15
Debagarh 80 72 58 60 2 2 18 3 5 4 4 2
Dhenkanal 237 236 220 225 17 33 9 11 37 28 29 16
Gajapati 95 83 63 6 8 12 8 11 10 7 6
Ganjam 424 426 240 306 19 15 87 16 74 65 44 43
Jagatsinghapur 105 110 80 71 63 90 41 149 12 11 10 10
Jajapur 325 354 377 316 14 15 10 14 8 7 10 4
Jharsuguda 68 59 64 35 4 5 6 9 3 3 5 3
Kalahandi 182 162 107 101 12 13 7 19 37 32 25 22
Kandhamal 109 120 82 116 2 3 23 2 30 32 37 30
Kendrapara 184 267 235 211 48 26 33 56 27 14 10 12
Kendujhar 259 336 295 232 24 26 23 25 18 18 18 7
Khordha 210 208 159 39 38 50 10 12 6 7
Koraput 202 250 298 189 15 9 16 12 55 78 47 34
Malkangiri 178 142 204 167 2 1 6 4 16 16 23 10
Mayurbhanj 297 307 305 288 27 30 19 27 10 11 10 7
Nabarangapur 141 163 130 126 4 6 12 11 22 20 18 18
Nayagarh 170 145 106 108 6 6 14 5 14 15 16 6
Nuapada 85 106 56 64 2 2 3 4 14 19 15 12
Puri 205 204 254 169 68 86 144 11 14 21 13
Rayagada 154 135 56 128 3 5 4 54 55 55 36
Sambalpur 150 131 111 84 17 17 17 24 12 10 7 5
Subarnapur 93 85 67 47 14 14 20 23 11 10 6 5
Sundargarh 262 249 252 208 19 14 16 17 20 19 15
Source: 16th, 17th, 18th and 19th Livestock census, Department of Animal Husbandry, Dairying and Fisheries, Ministry of Agriculture & Farmers Welfare, Govt. of India.

21 National Dairy Development Board
Part II : Livestock CensusDairying in ODiSHa - A Statistical Profile 2016
II.1. Animal Population
TABLE II.1.4: District-wise Breedable Population
DistrictsIndigenous Cattle (‘000) Crossbred Cattle (‘000) Buffalo (‘000)
1997 2003 2007 2012 1997 2003 2007 2012 1997 2003 2007 2012
ODISHA 4,275 4,323 3,627 3,362 447 514 618 667 454 474 425 284
Anugul 175 151 119 111 15 16 6 12 15 11 11 4
Balangir 135 134 104 57 12 16 54 29 32 42 41 15
Baleshwar 319 293 293 305 13 17 11 19 2 2 2 2
Bargarh 116 81 70 35 39 48 36 56 10 10 9 8
Baudh 80 77 64 43 2 4 4 5 14 15 14 6
Bhadrak 181 243 215 219 11 15 15 7 5 10 3
Cuttack 202 198 126 152 61 72 49 103 14 15 13 11
Debagarh 60 54 43 44 1 1 15 2 4 3 3 1
Dhenkanal 172 166 162 154 11 28 6 7 27 21 21 11
Gajapati 66 62 46 4 6 9 6 8 7 4 4
Ganjam 301 299 171 212 14 11 64 12 53 47 32 32
Jagatsinghapur 73 77 53 48 43 61 28 94 9 8 7 7
Jajapur 230 249 272 218 9 10 7 9 5 5 7 3
Jharsuguda 49 42 55 25 3 4 5 6 2 2 3 2
Kalahandi 128 115 80 69 8 9 5 12 26 23 17 16
Kandhamal 81 90 62 84 2 2 11 1 22 25 29 22
Kendrapara 157 198 169 150 33 17 22 39 18 10 7 9
Kendujhar 189 244 212 161 16 18 16 17 13 14 13 5
Khordha 149 147 108 27 27 35 8 9 5 5
Koraput 151 193 220 140 11 6 12 9 39 61 35 25
Malkangiri 136 108 163 124 2 1 4 2 12 12 17 7
Mayurbhanj 214 225 209 199 18 21 13 19 7 8 7 6
Nabarangapur 104 115 91 92 3 4 10 8 16 14 13 14
Nayagarh 120 100 76 73 4 4 13 3 10 10 12 4
Nuapada 62 77 40 43 1 2 2 2 10 13 11 8
Puri 147 146 188 120 47 61 99 8 11 15 10
Rayagada 109 98 43 88 2 4 3 36 41 42 25
Sambalpur 110 96 74 61 12 12 12 17 9 8 6 4
Subarnapur 66 61 53 33 9 10 17 16 8 7 4 3
Sundargarh 192 181 171 148 13 10 5 11 12 16 14 11
Source: 16th, 17th, 18th and 19th Livestock census, Department of Animal Husbandry, Dairying and Fisheries, Ministry of Agriculture & Farmers Welfare, Govt. of India.
22National Dairy Development Board
Part II : Livestock CensusDairying in ODiSHa - A Statistical Profile 2016
23 National Dairy Development Board
Part II : Livestock CensusDairying in ODiSHa - A Statistical Profile 2016
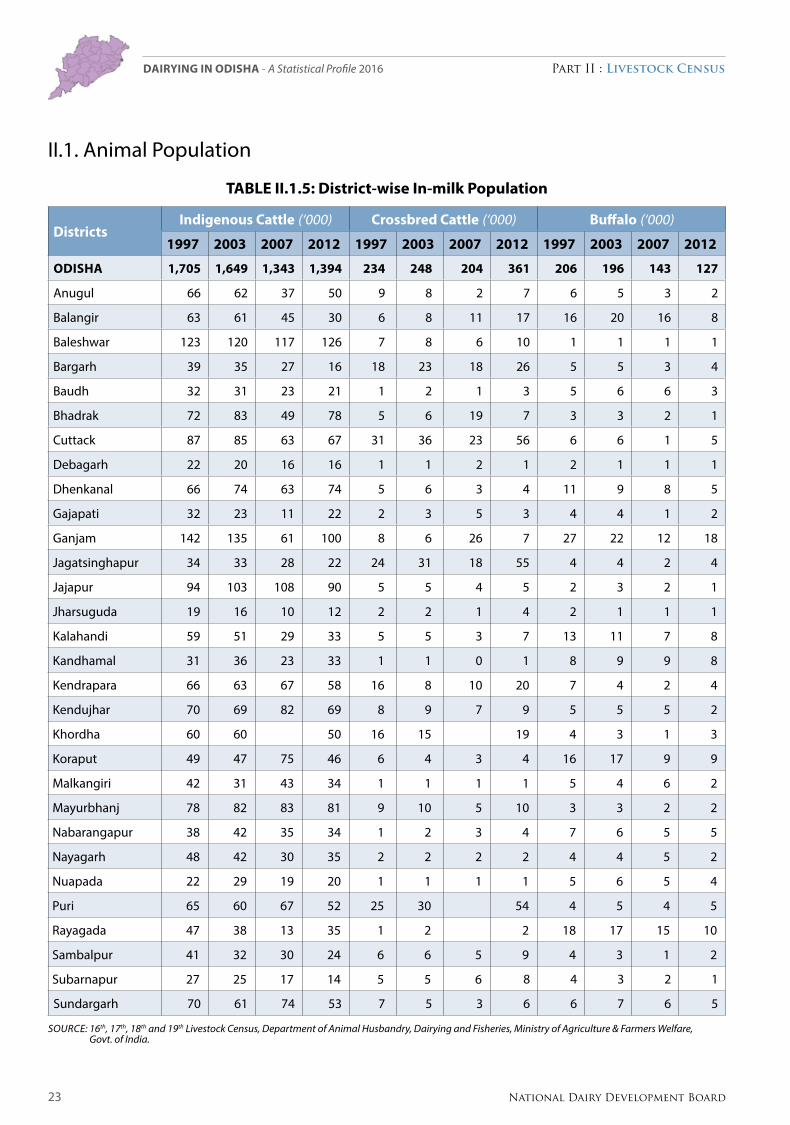
II.1. Animal Population
TABLE II.1.5: District-wise In-milk Population
DistrictsIndigenous Cattle (‘000) Crossbred Cattle (‘000) Buffalo (‘000)
1997 2003 2007 2012 1997 2003 2007 2012 1997 2003 2007 2012
ODISHA 1,705 1,649 1,343 1,394 234 248 204 361 206 196 143 127
Anugul 66 62 37 50 9 8 2 7 6 5 3 2
Balangir 63 61 45 30 6 8 11 17 16 20 16 8
Baleshwar 123 120 117 126 7 8 6 10 1 1 1 1
Bargarh 39 35 27 16 18 23 18 26 5 5 3 4
Baudh 32 31 23 21 1 2 1 3 5 6 6 3
Bhadrak 72 83 49 78 5 6 19 7 3 3 2 1
Cuttack 87 85 63 67 31 36 23 56 6 6 1 5
Debagarh 22 20 16 16 1 1 2 1 2 1 1 1
Dhenkanal 66 74 63 74 5 6 3 4 11 9 8 5
Gajapati 32 23 11 22 2 3 5 3 4 4 1 2
Ganjam 142 135 61 100 8 6 26 7 27 22 12 18
Jagatsinghapur 34 33 28 22 24 31 18 55 4 4 2 4
Jajapur 94 103 108 90 5 5 4 5 2 3 2 1
Jharsuguda 19 16 10 12 2 2 1 4 2 1 1 1
Kalahandi 59 51 29 33 5 5 3 7 13 11 7 8
Kandhamal 31 36 23 33 1 1 0 1 8 9 9 8
Kendrapara 66 63 67 58 16 8 10 20 7 4 2 4
Kendujhar 70 69 82 69 8 9 7 9 5 5 5 2
Khordha 60 60 50 16 15 19 4 3 1 3
Koraput 49 47 75 46 6 4 3 4 16 17 9 9
Malkangiri 42 31 43 34 1 1 1 1 5 4 6 2
Mayurbhanj 78 82 83 81 9 10 5 10 3 3 2 2
Nabarangapur 38 42 35 34 1 2 3 4 7 6 5 5
Nayagarh 48 42 30 35 2 2 2 2 4 4 5 2
Nuapada 22 29 19 20 1 1 1 1 5 6 5 4
Puri 65 60 67 52 25 30 54 4 5 4 5
Rayagada 47 38 13 35 1 2 2 18 17 15 10
Sambalpur 41 32 30 24 6 6 5 9 4 3 1 2
Subarnapur 27 25 17 14 5 5 6 8 4 3 2 1
Sundargarh 70 61 74 53 7 5 3 6 6 7 6 5
Source: 16th, 17th, 18th and 19th Livestock census, Department of Animal Husbandry, Dairying and Fisheries, Ministry of Agriculture & Farmers Welfare, Govt. of India.

24National Dairy Development Board
Part II : Livestock CensusDairying in ODiSHa - A Statistical Profile 2016
II.1. Animal Population
TABLE II.1.6: District-wise Milch Population
DistrictsIndigenous Cattle (‘000) Crossbred Cattle (‘000) Buffalo (‘000)
1997 2003 2007 2012 1997 2003 2007 2012 1997 2003 2007 2012
ODISHA 3,399 3,235 2,377 2,555 354 386 332 529 355 358 281 224
Anugul 139 118 82 86 12 12 4 10 11 9 6 3
Balangir 112 105 72 47 9 12 19 25 26 33 28 12
Baleshwar 253 223 206 221 10 12 8 13 1 1 1 1
Bargarh 93 63 47 27 31 37 27 42 8 8 6 6
Baudh 64 58 36 33 2 3 2 4 10 11 12 4
Bhadrak 140 159 80 164 8 10 38 12 5 4 5 2
Cuttack 159 152 92 118 47 55 35 80 11 11 9 8
Debagarh 47 42 32 33 1 1 5 1 3 3 2 1
Dhenkanal 139 129 109 122 8 9 5 6 21 16 16 9
Gajapati 54 49 18 34 3 5 7 4 7 6 1 3
Ganjam 243 233 103 165 12 9 10 43 38 22 27
Jagatsinghapur 58 59 41 38 35 48 22 77 7 7 4 6
Jajapur 181 190 185 167 7 8 6 8 4 5 5 2
Jharsuguda 40 33 16 19 2 3 2 5 2 2 2 2
Kalahandi 106 87 48 55 6 7 4 10 21 18 12 13
Kandhamal 66 70 48 62 1 2 1 1 18 20 23 17
Kendrapara 123 156 117 110 26 14 16 30 12 8 4 7
Kendujhar 146 142 158 124 13 14 10 13 10 10 9 4
Khordha 119 111 84 23 22 28 6 5 3 4
Koraput 117 123 162 107 9 5 6 7 30 34 19 19
Malkangiri 104 80 95 88 1 1 1 2 9 9 11 5
Mayurbhanj 167 171 150 150 14 15 7 14 5 6 4 4
Nabarangapur 85 89 62 71 2 4 5 6 13 11 9 11
Nayagarh 94 79 51 58 3 3 4 3 8 8 10 4
Nuapada 50 62 32 36 1 1 1 2 8 11 8 7
Puri 117 114 101 90 37 47 80 7 9 7 7
Rayagada 88 73 26 66 2 3 27 2 29 31 29 19
Sambalpur 89 76 50 48 9 9 8 13 7 6 3 3
Subarnapur 52 48 30 26 8 8 8 12 6 6 3 3
Sundargarh 155 141 127 107 11 8 4 9 10 13 10 9
Source: 16th, 17th, 18th and 19th Livestock census, Department of Animal Husbandry, Dairying and Fisheries, Ministry of Agriculture & Farmers Welfare, Govt. of India.
25 National Dairy Development Board
Part II : Livestock CensusDairying in ODiSHa - A Statistical Profile 2016
II.1. Animal Population
TABLE II.1.7: District-wise Male Population
DistrictsIndigenous Cattle (‘000) Crossbred Cattle (‘000) Buffalo (‘000)
1997 2003 2007 2012 1997 2003 2007 2012 1997 2003 2007 2012
ODISHA 7,017 6,838 5,579 5,503 257 328 877 320 748 753 601 335
Anugul 289 264 248 251 8 7 12 6 24 19 1 6
Balangir 289 296 281 209 13 19 23 28 54 62 61 20
Baleshwar 491 442 418 286 8 11 31 7 2 2 2 2
Bargarh 256 234 248 146 39 61 78 56 25 23 21 8
Baudh 120 119 93 100 3 5 2 6 20 21 22 9
Bhadrak 284 251 135 168 8 9 15 5 3 3 2 1
Cuttack 219 107 61 130 29 30 55 27 18 18 16 7
Debagarh 96 104 99 104 1 1 3 1 8 7 7 2
Dhenkanal 235 205 230 180 8 7 6 4 26 21 21 10
Gajapati 134 124 104 5 9 11 9 13 14 7 4
Ganjam 392 377 286 264 7 6 4 57 67 40 21
Jagatsinghapur 99 90 55 48 19 37 15 28 2 2 1 1
Jajapur 288 268 260 171 5 6 4 3 4 3 6 1
Jharsuguda 100 100 93 72 2 4 4 8 8 3 2
Kalahandi 281 254 184 177 6 9 5 15 59 49 31 22
Kandhamal 193 213 153 214 1 1 9 1 32 36 42 30
Kendrapara 160 161 86 10 7 15 10 5 3 5 2
Kendujhar 420 410 460 369 10 13 13 9 19 18 18 6
Khordha 149 141 99 9 9 1 9 9 9 7 5
Koraput 242 283 250 265 8 3 8 3 80 99 57 45
Malkangiri 222 182 257 182 1 0 6 1 20 19 26 11
Mayurbhanj 544 571 371 504 11 13 12 16 16 14 7
Nabarangapur 237 268 236 254 2 3 4 3 57 51 31 24
Nayagarh 147 135 117 115 1 2 10 1 34 31 33 14
Nuapada 121 166 68 129 1 2 15 2 18 23 19 12
Puri 172 165 155 106 17 25 8 25 5 6 6 3
Rayagada 204 188 86 153 1 2 2 58 54 47 28
Sambalpur 231 216 91 172 8 9 12 17 16 9 7
Subarnapur 123 114 22 75 11 15 6 20 18 18 11 6
Sundargarh 433 391 426 372 7 5 3 5 38 35 34 18
Zero denotes either Nil or Negligible.Source: 16th, 17th, 18th and 19th Livestock census, Department of Animal Husbandry, Dairying and Fisheries, Ministry of Agriculture & Farmers Welfare,
Govt. of India.
26National Dairy Development Board
Part II : Livestock CensusDairying in ODiSHa - A Statistical Profile 2016
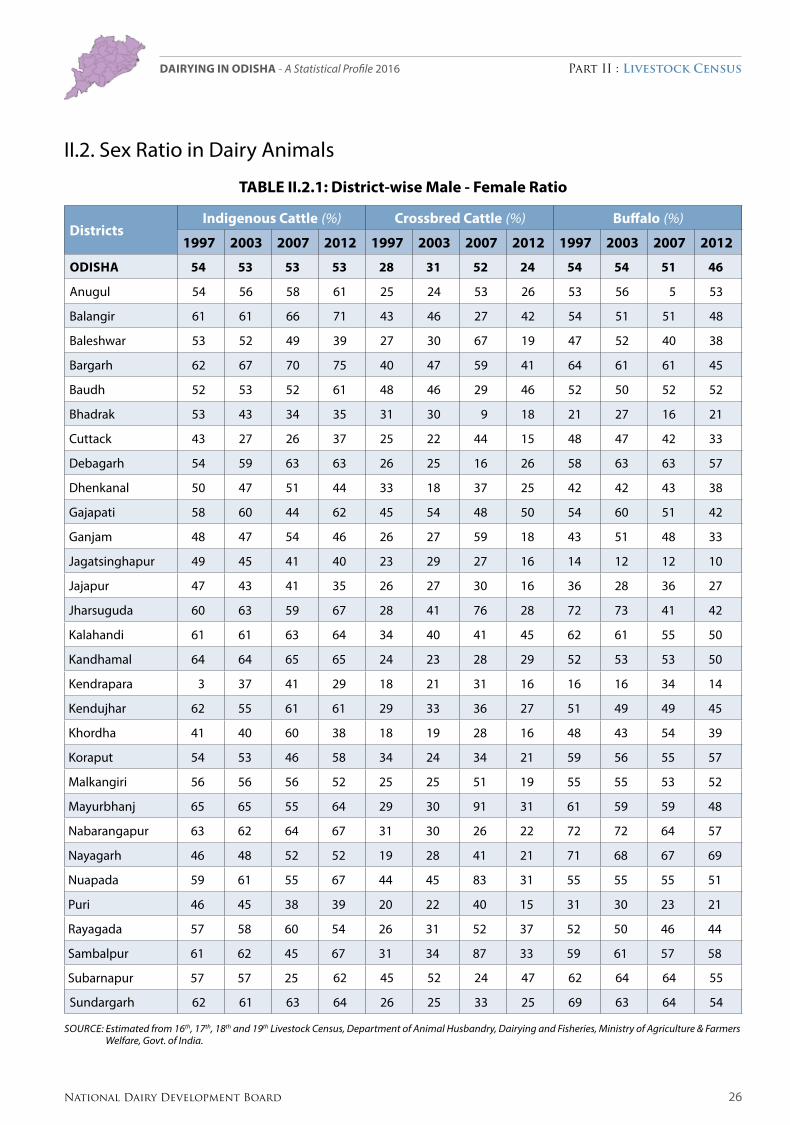
II.2. Sex Ratio in Dairy Animals
TABLE II.2.1: District-wise Male - Female Ratio
DistrictsIndigenous Cattle (%) Crossbred Cattle (%) Buffalo (%)
1997 2003 2007 2012 1997 2003 2007 2012 1997 2003 2007 2012
ODISHA 54 53 53 53 28 31 52 24 54 54 51 46
Anugul 54 56 58 61 25 24 53 26 53 56 5 53
Balangir 61 61 66 71 43 46 27 42 54 51 51 48
Baleshwar 53 52 49 39 27 30 67 19 47 52 40 38
Bargarh 62 67 70 75 40 47 59 41 64 61 61 45
Baudh 52 53 52 61 48 46 29 46 52 50 52 52
Bhadrak 53 43 34 35 31 30 9 18 21 27 16 21
Cuttack 43 27 26 37 25 22 44 15 48 47 42 33
Debagarh 54 59 63 63 26 25 16 26 58 63 63 57
Dhenkanal 50 47 51 44 33 18 37 25 42 42 43 38
Gajapati 58 60 44 62 45 54 48 50 54 60 51 42
Ganjam 48 47 54 46 26 27 59 18 43 51 48 33
Jagatsinghapur 49 45 41 40 23 29 27 16 14 12 12 10
Jajapur 47 43 41 35 26 27 30 16 36 28 36 27
Jharsuguda 60 63 59 67 28 41 76 28 72 73 41 42
Kalahandi 61 61 63 64 34 40 41 45 62 61 55 50
Kandhamal 64 64 65 65 24 23 28 29 52 53 53 50
Kendrapara 3 37 41 29 18 21 31 16 16 16 34 14
Kendujhar 62 55 61 61 29 33 36 27 51 49 49 45
Khordha 41 40 60 38 18 19 28 16 48 43 54 39
Koraput 54 53 46 58 34 24 34 21 59 56 55 57
Malkangiri 56 56 56 52 25 25 51 19 55 55 53 52
Mayurbhanj 65 65 55 64 29 30 91 31 61 59 59 48
Nabarangapur 63 62 64 67 31 30 26 22 72 72 64 57
Nayagarh 46 48 52 52 19 28 41 21 71 68 67 69
Nuapada 59 61 55 67 44 45 83 31 55 55 55 51
Puri 46 45 38 39 20 22 40 15 31 30 23 21
Rayagada 57 58 60 54 26 31 52 37 52 50 46 44
Sambalpur 61 62 45 67 31 34 87 33 59 61 57 58
Subarnapur 57 57 25 62 45 52 24 47 62 64 64 55
Sundargarh 62 61 63 64 26 25 33 25 69 63 64 54
Source: estimated from 16th, 17th, 18th and 19th Livestock census, Department of Animal Husbandry, Dairying and Fisheries, Ministry of Agriculture & Farmers Welfare, Govt. of India.
27 National Dairy Development Board
Part II : Livestock CensusDairying in ODiSHa - A Statistical Profile 2016
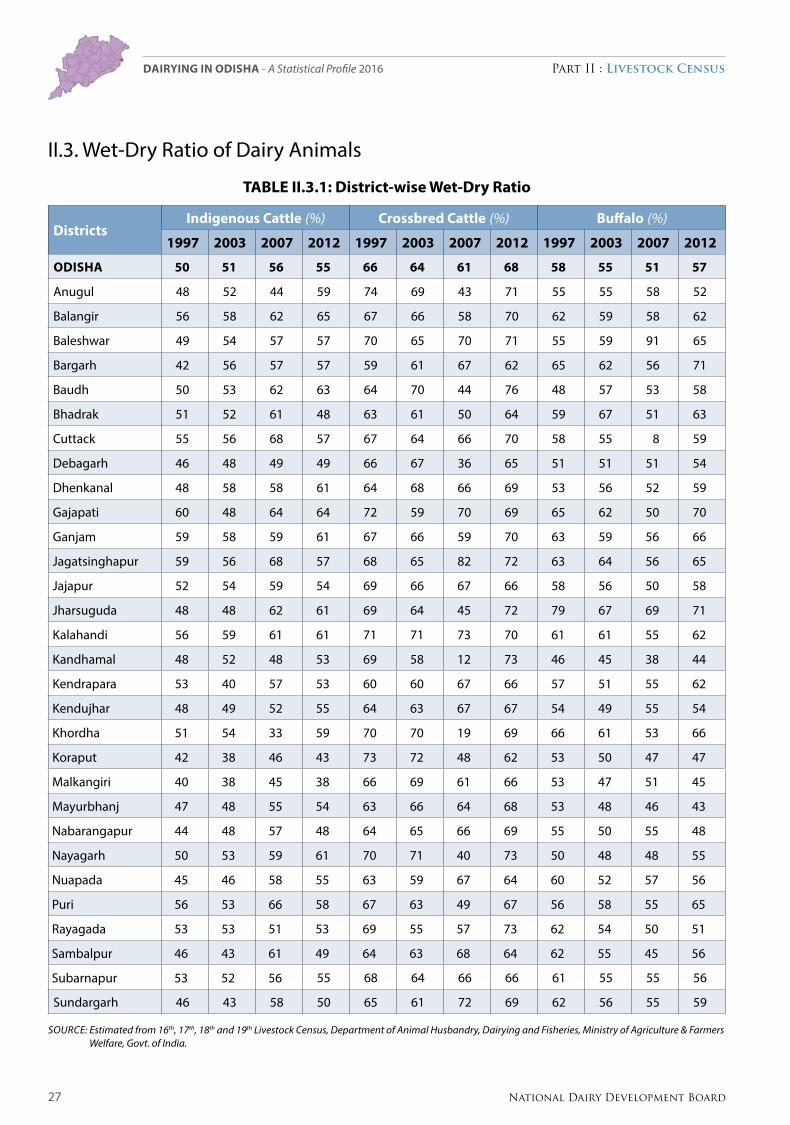
II.3. Wet-Dry Ratio of Dairy Animals
TABLE II.3.1: District-wise Wet-Dry Ratio
DistrictsIndigenous Cattle (%) Crossbred Cattle (%) Buffalo (%)
1997 2003 2007 2012 1997 2003 2007 2012 1997 2003 2007 2012
ODISHA 50 51 56 55 66 64 61 68 58 55 51 57
Anugul 48 52 44 59 74 69 43 71 55 55 58 52
Balangir 56 58 62 65 67 66 58 70 62 59 58 62
Baleshwar 49 54 57 57 70 65 70 71 55 59 91 65
Bargarh 42 56 57 57 59 61 67 62 65 62 56 71
Baudh 50 53 62 63 64 70 44 76 48 57 53 58
Bhadrak 51 52 61 48 63 61 50 64 59 67 51 63
Cuttack 55 56 68 57 67 64 66 70 58 55 8 59
Debagarh 46 48 49 49 66 67 36 65 51 51 51 54
Dhenkanal 48 58 58 61 64 68 66 69 53 56 52 59
Gajapati 60 48 64 64 72 59 70 69 65 62 50 70
Ganjam 59 58 59 61 67 66 59 70 63 59 56 66
Jagatsinghapur 59 56 68 57 68 65 82 72 63 64 56 65
Jajapur 52 54 59 54 69 66 67 66 58 56 50 58
Jharsuguda 48 48 62 61 69 64 45 72 79 67 69 71
Kalahandi 56 59 61 61 71 71 73 70 61 61 55 62
Kandhamal 48 52 48 53 69 58 12 73 46 45 38 44
Kendrapara 53 40 57 53 60 60 67 66 57 51 55 62
Kendujhar 48 49 52 55 64 63 67 67 54 49 55 54
Khordha 51 54 33 59 70 70 19 69 66 61 53 66
Koraput 42 38 46 43 73 72 48 62 53 50 47 47
Malkangiri 40 38 45 38 66 69 61 66 53 47 51 45
Mayurbhanj 47 48 55 54 63 66 64 68 53 48 46 43
Nabarangapur 44 48 57 48 64 65 66 69 55 50 55 48
Nayagarh 50 53 59 61 70 71 40 73 50 48 48 55
Nuapada 45 46 58 55 63 59 67 64 60 52 57 56
Puri 56 53 66 58 67 63 49 67 56 58 55 65
Rayagada 53 53 51 53 69 55 57 73 62 54 50 51
Sambalpur 46 43 61 49 64 63 68 64 62 55 45 56
Subarnapur 53 52 56 55 68 64 66 66 61 55 55 56
Sundargarh 46 43 58 50 65 61 72 69 62 56 55 59
Source: estimated from 16th, 17th, 18th and 19th Livestock census, Department of Animal Husbandry, Dairying and Fisheries, Ministry of Agriculture & Farmers Welfare, Govt. of India.
28National Dairy Development Board
Part II : Livestock CensusDairying in ODiSHa - A Statistical Profile 2016
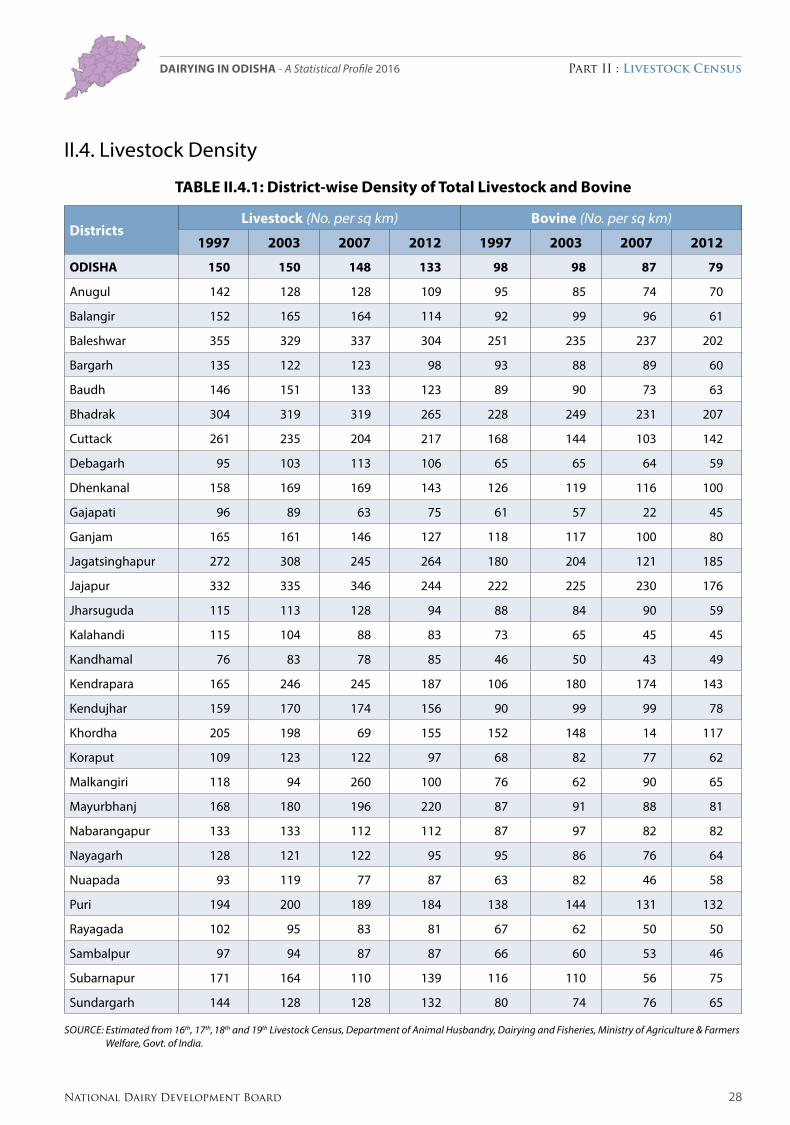
II.4. Livestock Density
TABLE II.4.1: District-wise Density of Total Livestock and Bovine
DistrictsLivestock (No. per sq km) Bovine (No. per sq km)
1997 2003 2007 2012 1997 2003 2007 2012
ODISHA 150 150 148 133 98 98 87 79
Anugul 142 128 128 109 95 85 74 70
Balangir 152 165 164 114 92 99 96 61
Baleshwar 355 329 337 304 251 235 237 202
Bargarh 135 122 123 98 93 88 89 60
Baudh 146 151 133 123 89 90 73 63
Bhadrak 304 319 319 265 228 249 231 207
Cuttack 261 235 204 217 168 144 103 142
Debagarh 95 103 113 106 65 65 64 59
Dhenkanal 158 169 169 143 126 119 116 100
Gajapati 96 89 63 75 61 57 22 45
Ganjam 165 161 146 127 118 117 100 80
Jagatsinghapur 272 308 245 264 180 204 121 185
Jajapur 332 335 346 244 222 225 230 176
Jharsuguda 115 113 128 94 88 84 90 59
Kalahandi 115 104 88 83 73 65 45 45
Kandhamal 76 83 78 85 46 50 43 49
Kendrapara 165 246 245 187 106 180 174 143
Kendujhar 159 170 174 156 90 99 99 78
Khordha 205 198 69 155 152 148 14 117
Koraput 109 123 122 97 68 82 77 62
Malkangiri 118 94 260 100 76 62 90 65
Mayurbhanj 168 180 196 220 87 91 88 81
Nabarangapur 133 133 112 112 87 97 82 82
Nayagarh 128 121 122 95 95 86 76 64
Nuapada 93 119 77 87 63 82 46 58
Puri 194 200 189 184 138 144 131 132
Rayagada 102 95 83 81 67 62 50 50
Sambalpur 97 94 87 87 66 60 53 46
Subarnapur 171 164 110 139 116 110 56 75
Sundargarh 144 128 128 132 80 74 76 65
Source: estimated from 16th, 17th, 18th and 19th Livestock census, Department of Animal Husbandry, Dairying and Fisheries, Ministry of Agriculture & Farmers Welfare, Govt. of India.
29 National Dairy Development Board
Part II : Livestock CensusDairying in ODiSHa - A Statistical Profile 2016
II.4. Livestock Density
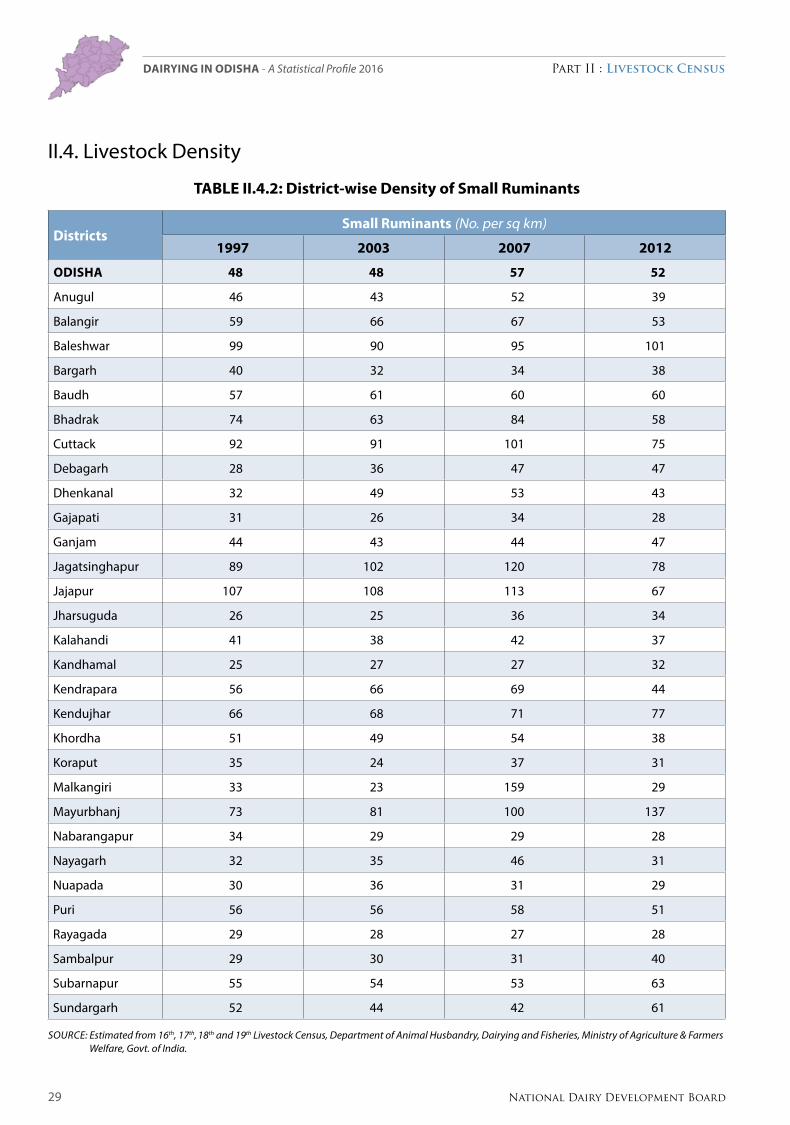
TABLE II.4.2: District-wise Density of Small Ruminants
DistrictsSmall Ruminants (No. per sq km)
1997 2003 2007 2012
ODISHA 48 48 57 52
Anugul 46 43 52 39
Balangir 59 66 67 53
Baleshwar 99 90 95 101
Bargarh 40 32 34 38
Baudh 57 61 60 60
Bhadrak 74 63 84 58
Cuttack 92 91 101 75
Debagarh 28 36 47 47
Dhenkanal 32 49 53 43
Gajapati 31 26 34 28
Ganjam 44 43 44 47
Jagatsinghapur 89 102 120 78
Jajapur 107 108 113 67
Jharsuguda 26 25 36 34
Kalahandi 41 38 42 37
Kandhamal 25 27 27 32
Kendrapara 56 66 69 44
Kendujhar 66 68 71 77
Khordha 51 49 54 38
Koraput 35 24 37 31
Malkangiri 33 23 159 29
Mayurbhanj 73 81 100 137
Nabarangapur 34 29 29 28
Nayagarh 32 35 46 31
Nuapada 30 36 31 29
Puri 56 56 58 51
Rayagada 29 28 27 28
Sambalpur 29 30 31 40
Subarnapur 55 54 53 63
Sundargarh 52 44 42 61
Source: estimated from 16th, 17th, 18th and 19th Livestock census, Department of Animal Husbandry, Dairying and Fisheries, Ministry of Agriculture & Farmers Welfare, Govt. of India.
30National Dairy Development Board
Part II : Livestock CensusDairying in ODiSHa - A Statistical Profile 2016
31 National Dairy Development Board
Part II : Livestock CensusDairying in ODiSHa - A Statistical Profile 2016
II.5. Breed-wise Population
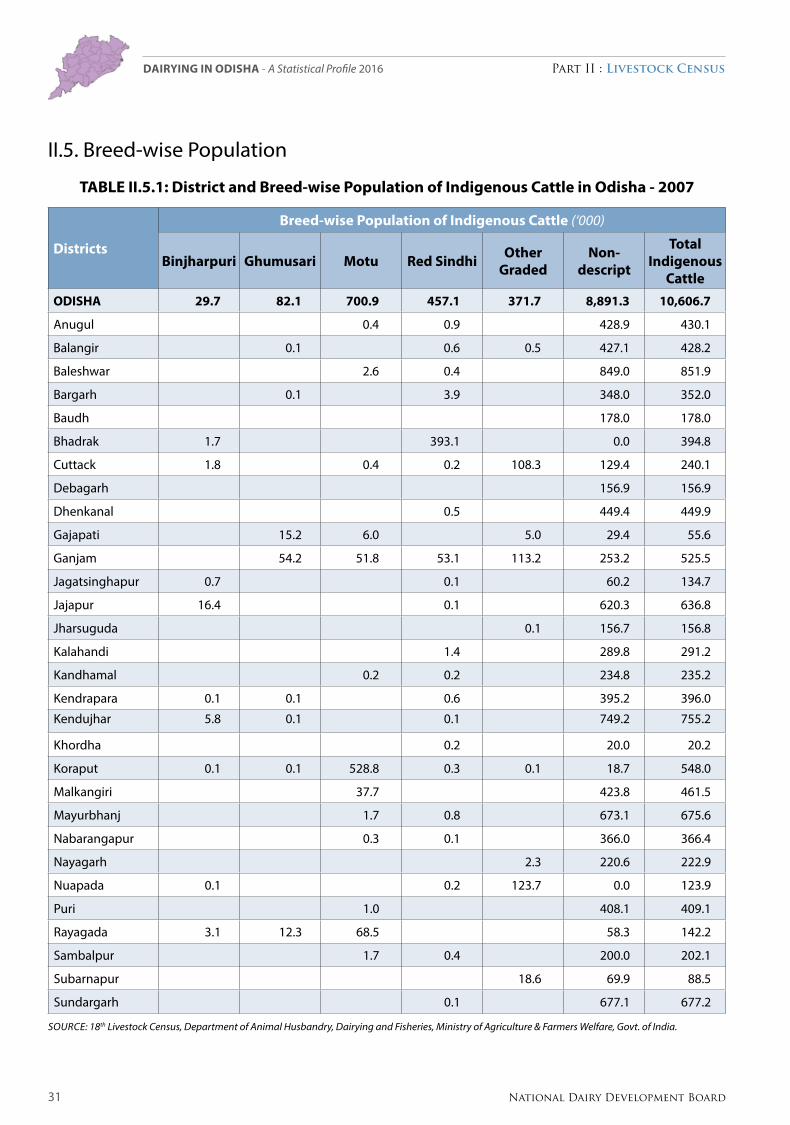
TABLE II.5.1: District and Breed-wise Population of Indigenous Cattle in Odisha - 2007
Districts
Breed-wise Population of Indigenous Cattle (‘000)
Binjharpuri Ghumusari Motu Red Sindhi Other Graded
Non- descript
Total Indigenous
CattleODISHA 29.7 82.1 700.9 457.1 371.7 8,891.3 10,606.7
Anugul 0.4 0.9 428.9 430.1
Balangir 0.1 0.6 0.5 427.1 428.2
Baleshwar 2.6 0.4 849.0 851.9
Bargarh 0.1 3.9 348.0 352.0
Baudh 178.0 178.0
Bhadrak 1.7 393.1 0.0 394.8
Cuttack 1.8 0.4 0.2 108.3 129.4 240.1
Debagarh 156.9 156.9
Dhenkanal 0.5 449.4 449.9
Gajapati 15.2 6.0 5.0 29.4 55.6
Ganjam 54.2 51.8 53.1 113.2 253.2 525.5
Jagatsinghapur 0.7 0.1 60.2 134.7
Jajapur 16.4 0.1 620.3 636.8
Jharsuguda 0.1 156.7 156.8
Kalahandi 1.4 289.8 291.2
Kandhamal 0.2 0.2 234.8 235.2
Kendrapara 0.1 0.1 0.6 395.2 396.0
Kendujhar 5.8 0.1 0.1 749.2 755.2
Khordha 0.2 20.0 20.2
Koraput 0.1 0.1 528.8 0.3 0.1 18.7 548.0
Malkangiri 37.7 423.8 461.5
Mayurbhanj 1.7 0.8 673.1 675.6
Nabarangapur 0.3 0.1 366.0 366.4
Nayagarh 2.3 220.6 222.9
Nuapada 0.1 0.2 123.7 0.0 123.9
Puri 1.0 408.1 409.1
Rayagada 3.1 12.3 68.5 58.3 142.2
Sambalpur 1.7 0.4 200.0 202.1
Subarnapur 18.6 69.9 88.5
Sundargarh 0.1 677.1 677.2
Source: 18th Livestock census, Department of Animal Husbandry, Dairying and Fisheries, Ministry of Agriculture & Farmers Welfare, Govt. of India.

32National Dairy Development Board
Part II : Livestock CensusDairying in ODiSHa - A Statistical Profile 2016
II.5. Breed-wise Population
TABLE II.5.2: District and Breed-wise Population of Crossbred Animals in Odisha - 2007
DistrictsCrossbred Cattle Population (‘000)
Jersey Crossbred Holstein Friesian Crossbred Other Crossbred Total Crossbred
ODISHA 1,343.7 15.1 344.3 1,703.2
Anugul 12.3 0.0 9.8 22.1
Balangir 62.1 0.5 25.8 88.3
Baleshwar 42.8 0.4 3.1 46.4
Bargarh 120.2 0.4 10.9 131.5
Baudh 7.2 7.2
Bhadrak 132.1 3.4 34.3 169.8
Cuttack 113.8 0.2 11.8 125.7
Debagarh 5.7 4.4 11.0 21.1
Dhenkanal 5.2 0.6 9.2 15.0
Gajapati 22.2 0.9 23.0
Ganjam 93.3 120.2 213.6
Jagatsinghapur 50.9 0.3 5.0 56.1
Jajapur 9.3 5.6 14.9
Jharsuguda 22.5 0.3 3.0 25.8
Kalahandi 9.7 0.2 2.6 12.5
Kandhamal 19.9 0.1 11.8 31.8
Kendrapara 43.9 0.6 3.8 48.3
Kendujhar 22.8 0.3 12.1 35.2
Khordha 2.5 0.1 1.1 3.6
Koraput 21.1 0.6 2.4 24.1
Malkangiri 4.7 6.6 11.3
Mayurbhanj 210.7 0.1 6.2 216.9
Nabarangapur 12.1 4.7 16.8
Nayagarh 19.6 0.2 4.2 23.9
Nuapada 11.3 6.3 17.6
Puri 18.2 2.1 20.3
Rayagada 101.1 1.0 9.3 111.4
Sambalpur 127.0 1.3 3.7 132.0
Subarnapur 20.6 5.7 26.2
Sundargarh 6.2 0.1 4.3 10.6
Source: 18th Livestock census, Department of Animal Husbandry, Dairying and Fisheries, Ministry of Agriculture & Farmers Welfare, Govt. of India.

33 National Dairy Development Board
Part II : Livestock CensusDairying in ODiSHa - A Statistical Profile 2016
II.5. Breed-wise Population
TABLE II.5.3: District and Breed-wise Population of Buffalo in Odisha - 2007
DistrictsBuffalo Breed Population (‘000)
Chilika Jerangi Kalahandi Kujang MandaParlekh-
mundiSambal-
puriOther
gradedNon-
descriptTotal
Buffalo
ODISHA 1.0 48.3 146.1 3.3 1.4 46.1 30.3 117.2 796.0 1,189.7
Anugul 0.2 20.2 20.4
Balangir 118.2 118.2
Baleshwar 4.7 4.7
Bargarh 4.8 29.3 34.1
Baudh 41.1 41.1
Bhadrak 13.8 13.8
Cuttack 0.6 37.9 38.5
Debagarh 1.7 9.0 10.6
Dhenkanal 0.6 49.2 50.0
Gajapati 0.8 0.3 1.1 6.7 5.7 14.6
Ganjam 0.4 0.4 84.0 84.8
Jagatsinghapur 2.2 9.1 11.3
Jajapur 16.0 16.0
Jharsuguda 0.2 0.7 0.1 6.6 7.6
Kalahandi 9.8 0.2 0.3 45.5 55.7
Kandhamal 0.2 79.3 79.5
Kendrapara 15.6 15.6
Kendujhar 0.1 0.3 35.5 35.9
Khordha 0.7 0.2 13.0 13.9
Koraput 0.3 46.1 0.3 24.0 33.2 104.0
Malkangiri 0.3 0.1 48.0 48.4
Mayurbhanj 23.1 23.1
Nabarangapur 0.4 1.3 0.2 47.6 49.5
Nayagarh 0.2 0.3 48.1 48.6
Nuapada 1.3 32.5 33.8
Puri 27.4 27.4
Rayagada 0.2 14.6 0.2 14.3 0.6 72.5 102.4
Sambalpur 16.7 16.7
Subarnapur 16.8 16.8
Sundargarh 4.2 48.6 52.9
Source: 18th Livestock census, Department of Animal Husbandry, Dairying and Fisheries, Ministry of Agriculture & Farmers Welfare, Govt. of India.
34National Dairy Development Board
Part II : Livestock CensusDairying in ODiSHa - A Statistical Profile 2016
Part III : Cattle and buffalo breeds
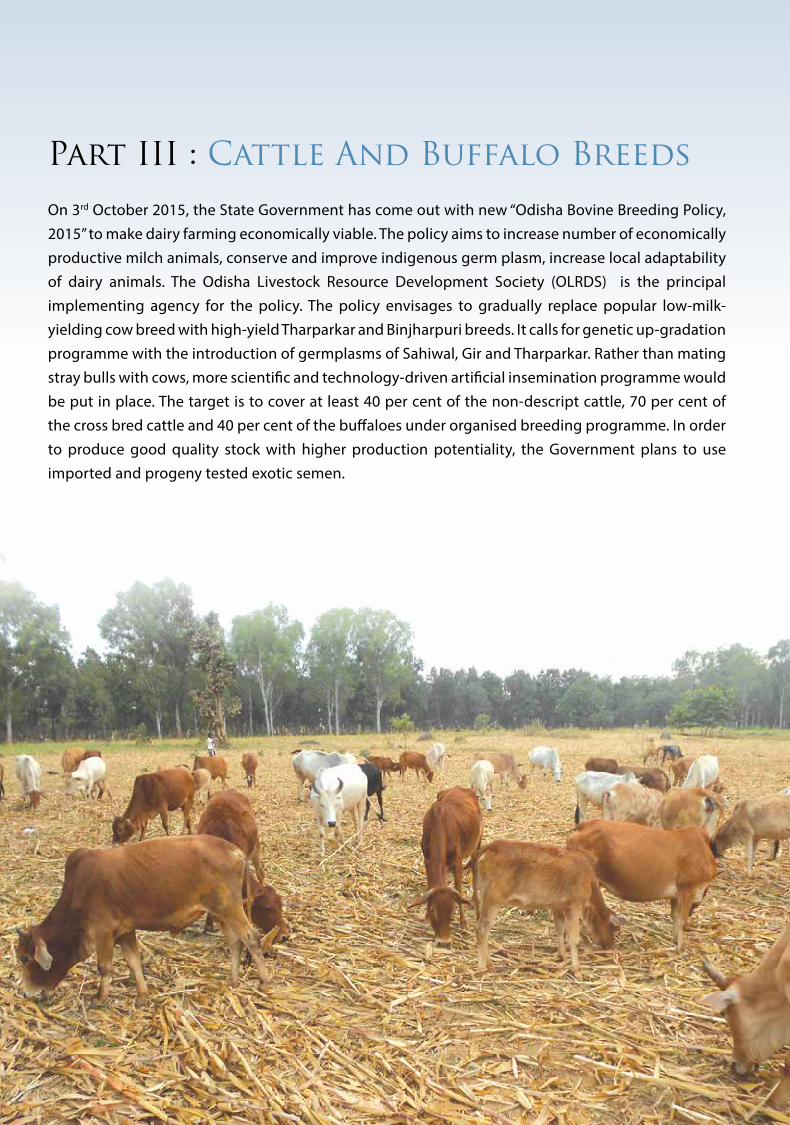
On 3rd October 2015, the State Government has come out with new “Odisha Bovine Breeding Policy, 2015” to make dairy farming economically viable. The policy aims to increase number of economically productive milch animals, conserve and improve indigenous germ plasm, increase local adaptability of dairy animals. The Odisha Livestock Resource Development Society (OLRDS) is the principal implementing agency for the policy. The policy envisages to gradually replace popular low-milk-yielding cow breed with high-yield Tharparkar and Binjharpuri breeds. It calls for genetic up-gradation programme with the introduction of germplasms of Sahiwal, Gir and Tharparkar. Rather than mating stray bulls with cows, more scientific and technology-driven artificial insemination programme would be put in place. The target is to cover at least 40 per cent of the non-descript cattle, 70 per cent of the cross bred cattle and 40 per cent of the buffaloes under organised breeding programme. In order to produce good quality stock with higher production potentiality, the Government plans to use imported and progeny tested exotic semen.
36National Dairy Development Board
Part III : Cattle and buffalo breedsDairying in ODiSHa - A Statistical Profile 2016
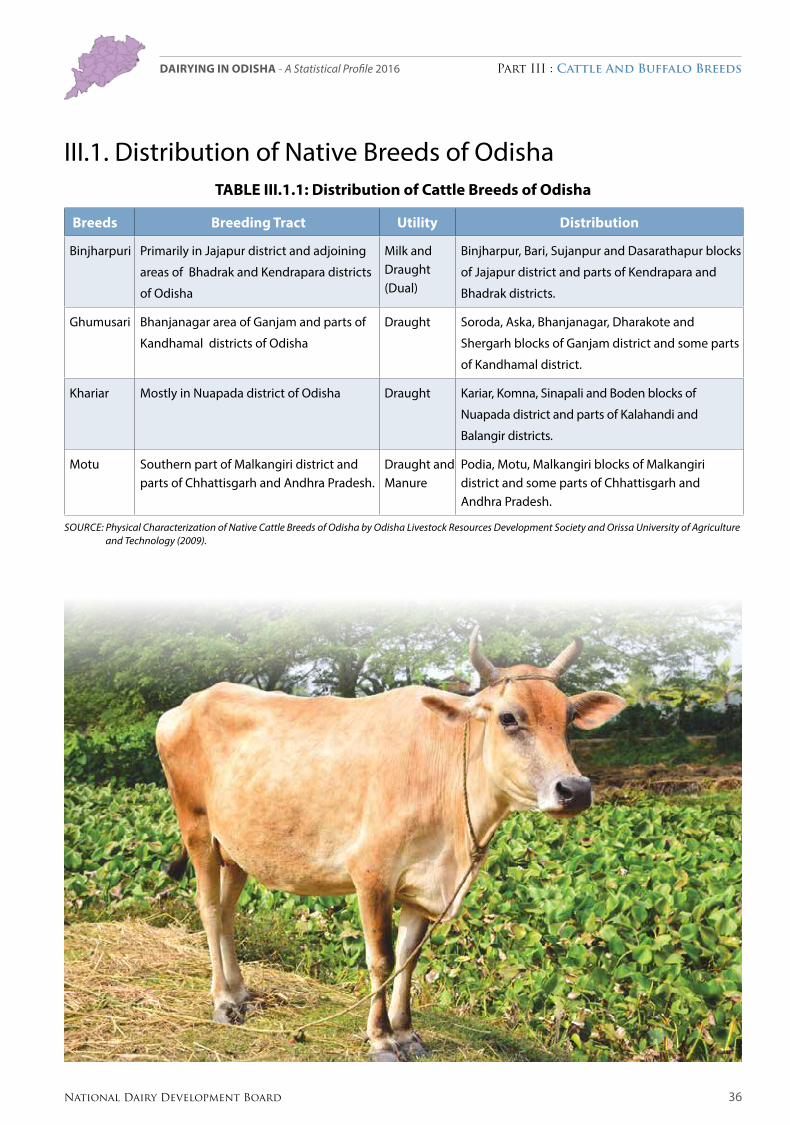
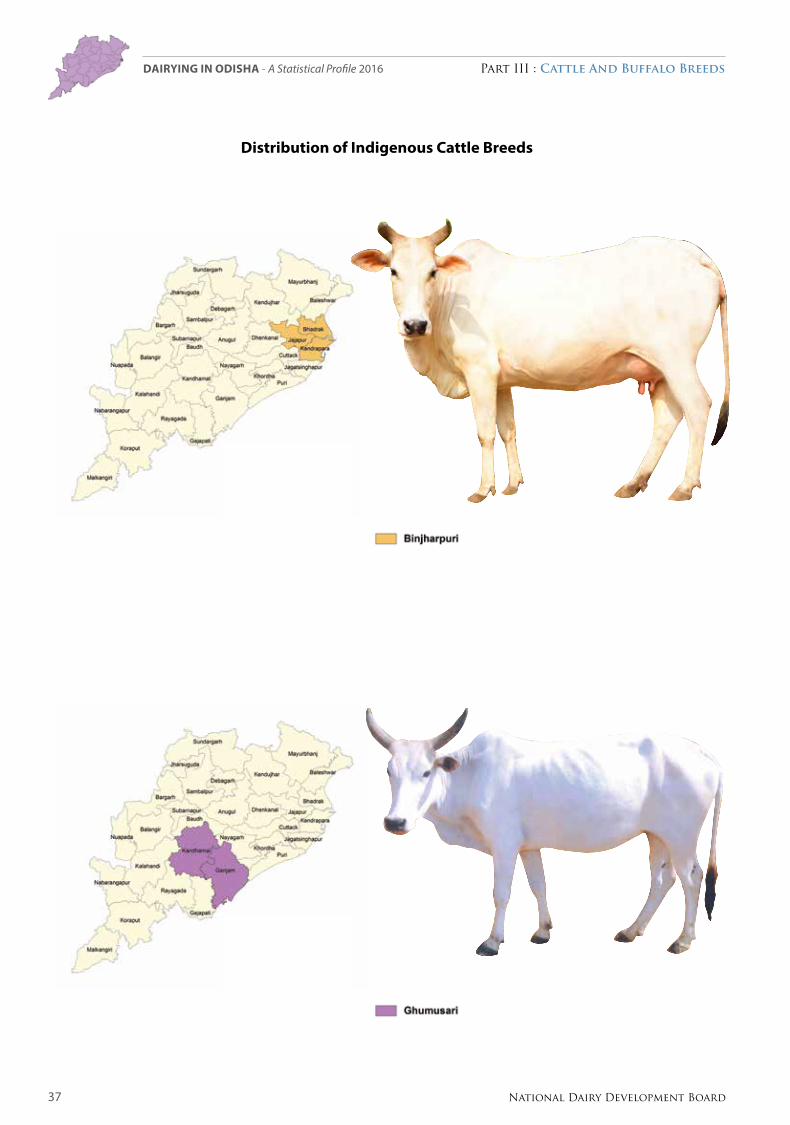
III.1. Distribution of Native Breeds of OdishaTABLE III.1.1: Distribution of Cattle Breeds of Odisha
Breeds Breeding Tract Utility Distribution
Binjharpuri Primarily in Jajapur district and adjoining
areas of Bhadrak and Kendrapara districts
of Odisha
Milk and Draught (Dual)
Binjharpur, Bari, Sujanpur and Dasarathapur blocks
of Jajapur district and parts of Kendrapara and
Bhadrak districts.
Ghumusari Bhanjanagar area of Ganjam and parts of
Kandhamal districts of Odisha
Draught Soroda, Aska, Bhanjanagar, Dharakote and
Shergarh blocks of Ganjam district and some parts
of Kandhamal district.
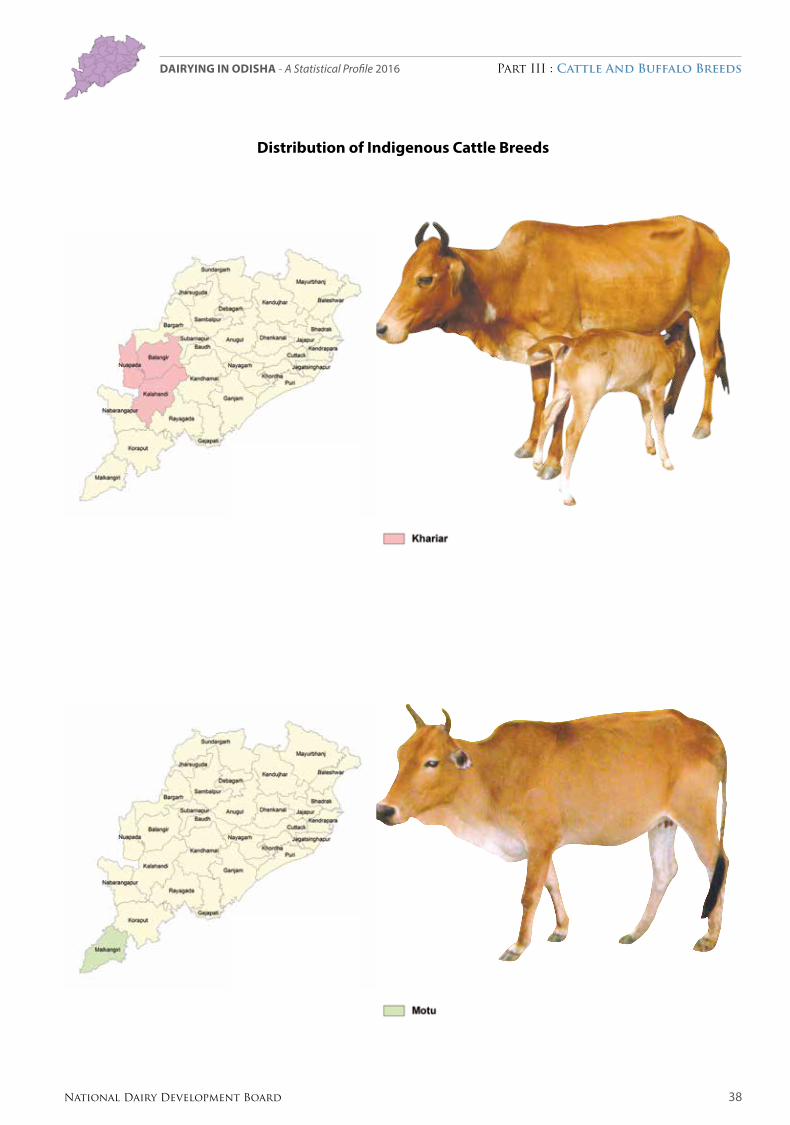
Khariar Mostly in Nuapada district of Odisha Draught Kariar, Komna, Sinapali and Boden blocks of
Nuapada district and parts of Kalahandi and
Balangir districts.
Motu Southern part of Malkangiri district and parts of Chhattisgarh and Andhra Pradesh.
Draught and Manure
Podia, Motu, Malkangiri blocks of Malkangiri district and some parts of Chhattisgarh and Andhra Pradesh.
Source: Physical characterization of Native cattle Breeds of odisha by odisha Livestock resources Development Society and orissa university of Agriculture and Technology (2009).
37 National Dairy Development Board
Part III : Cattle and buffalo breedsDairying in ODiSHa - A Statistical Profile 2016
Distribution of Indigenous Cattle Breeds
38National Dairy Development Board
Part III : Cattle and buffalo breedsDairying in ODiSHa - A Statistical Profile 2016
Distribution of Indigenous Cattle Breeds
39 National Dairy Development Board
Part III : Cattle and buffalo breedsDairying in ODiSHa - A Statistical Profile 2016
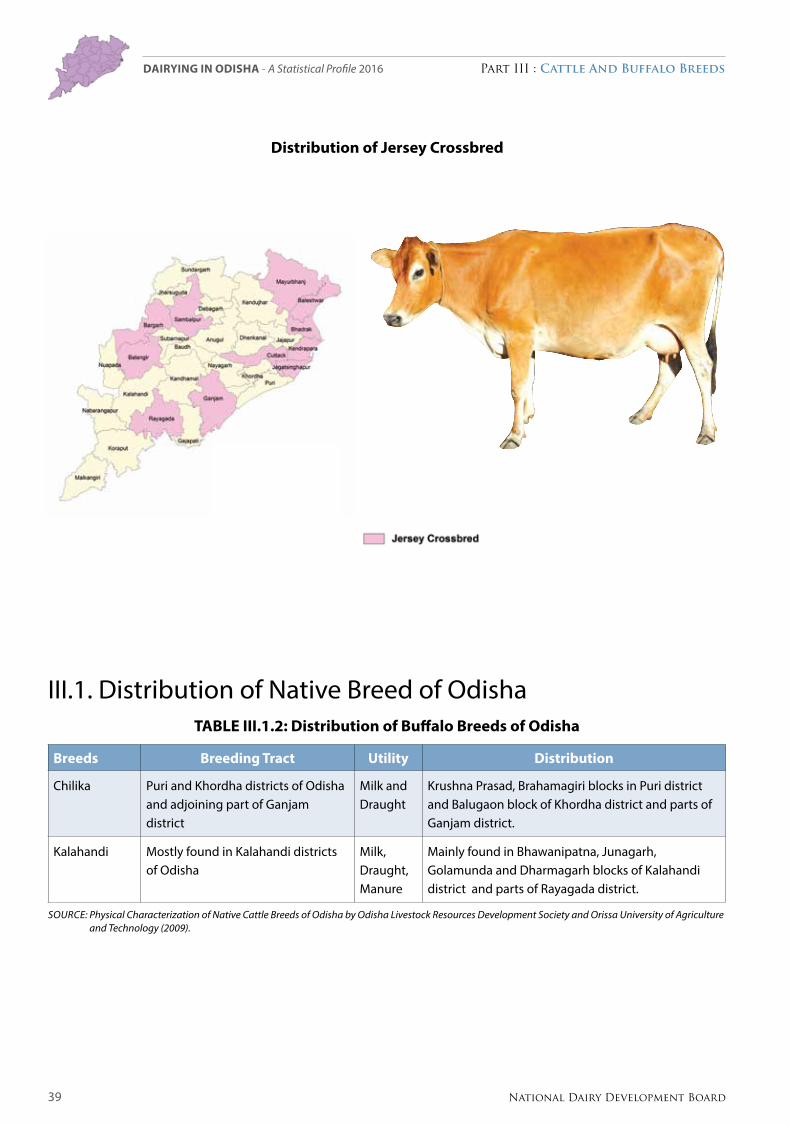
III.1. Distribution of Native Breed of OdishaTABLE III.1.2: Distribution of Buffalo Breeds of Odisha
Breeds Breeding Tract Utility Distribution
Chilika Puri and Khordha districts of Odisha and adjoining part of Ganjam district
Milk and Draught
Krushna Prasad, Brahamagiri blocks in Puri district and Balugaon block of Khordha district and parts of Ganjam district.
Kalahandi Mostly found in Kalahandi districts of Odisha
Milk, Draught, Manure
Mainly found in Bhawanipatna, Junagarh, Golamunda and Dharmagarh blocks of Kalahandi district and parts of Rayagada district.
Source: Physical characterization of Native cattle Breeds of odisha by odisha Livestock resources Development Society and orissa university of Agriculture and Technology (2009).
Distribution of Jersey Crossbred

40National Dairy Development Board
Part III : Cattle and buffalo breedsDairying in ODiSHa - A Statistical Profile 2016
Distribution of Buffalo Breeds
41 National Dairy Development Board
Part III : Cattle and buffalo breedsDairying in ODiSHa - A Statistical Profile 2016
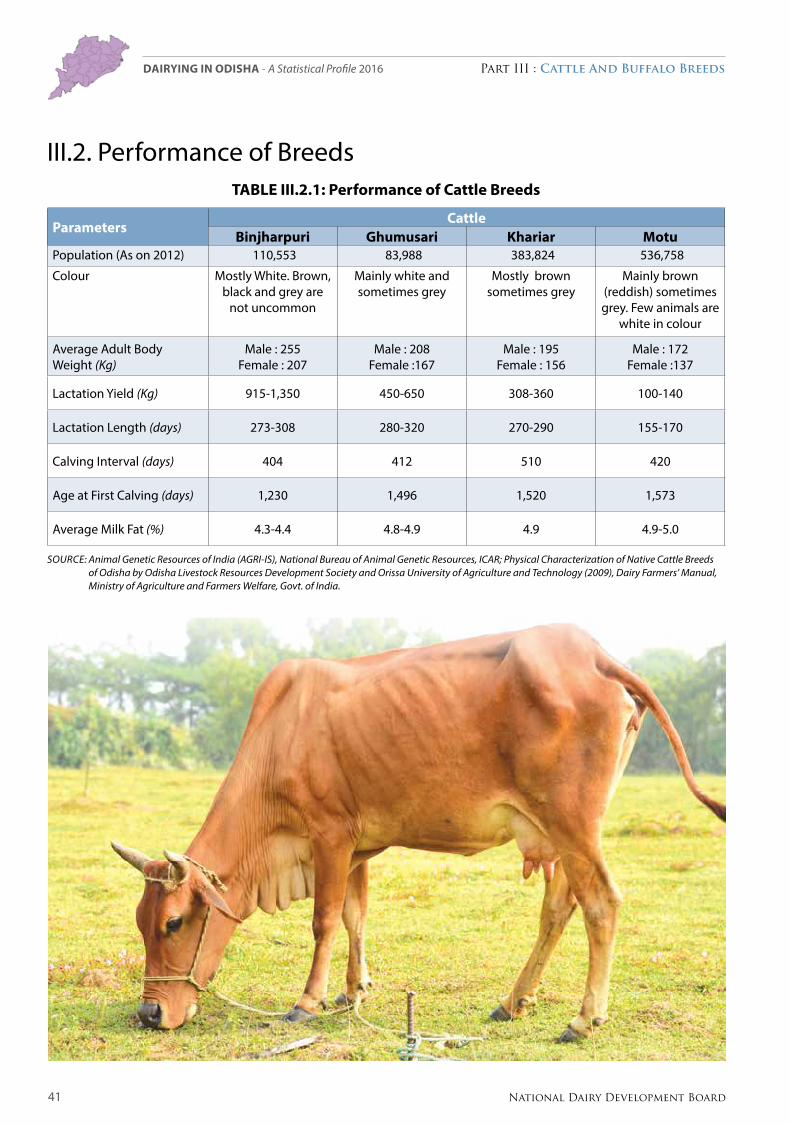
III.2. Performance of BreedsTABLE III.2.1: Performance of Cattle Breeds
Parameters Cattle
Binjharpuri Ghumusari Khariar MotuPopulation (As on 2012) 110,553 83,988 383,824 536,758
Colour Mostly White. Brown, black and grey are
not uncommon
Mainly white and sometimes grey
Mostly brown sometimes grey
Mainly brown (reddish) sometimes grey. Few animals are
white in colour
Average Adult Body Weight (Kg)
Male : 255Female : 207
Male : 208Female :167
Male : 195Female : 156
Male : 172Female :137
Lactation Yield (Kg) 915-1,350 450-650 308-360 100-140
Lactation Length (days) 273-308 280-320 270-290 155-170
Calving Interval (days) 404 412 510 420
Age at First Calving (days) 1,230 1,496 1,520 1,573
Average Milk Fat (%) 4.3-4.4 4.8-4.9 4.9 4.9-5.0
Source: Animal Genetic resources of India (AGrI-IS), National Bureau of Animal Genetic resources, IcAr; Physical characterization of Native cattle Breeds of odisha by odisha Livestock resources Development Society and orissa university of Agriculture and Technology (2009), Dairy Farmers’ Manual, Ministry of Agriculture and Farmers Welfare, Govt. of India.
42National Dairy Development Board
Part III : Cattle and buffalo breedsDairying in ODiSHa - A Statistical Profile 2016
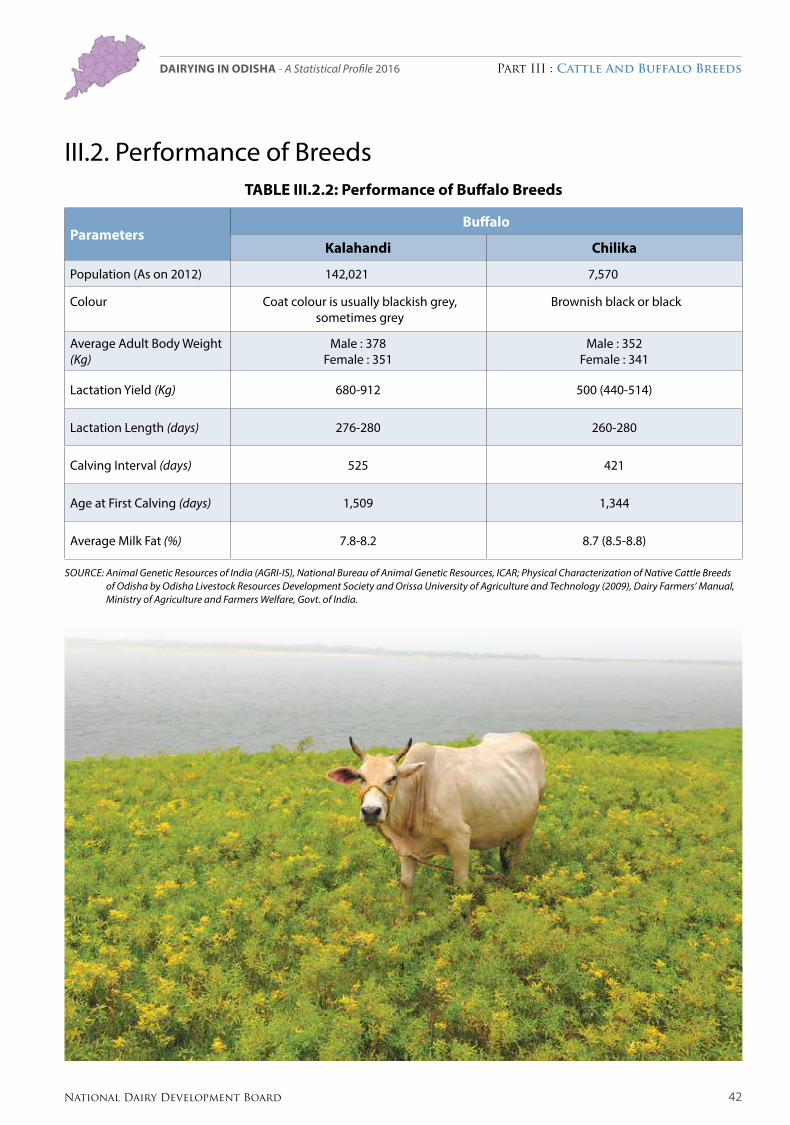
III.2. Performance of BreedsTABLE III.2.2: Performance of Buffalo Breeds
Parameters Buffalo
Kalahandi Chilika
Population (As on 2012) 142,021 7,570
Colour Coat colour is usually blackish grey, sometimes grey
Brownish black or black
Average Adult Body Weight (Kg)
Male : 378Female : 351
Male : 352Female : 341
Lactation Yield (Kg) 680-912 500 (440-514)
Lactation Length (days) 276-280 260-280
Calving Interval (days) 525 421
Age at First Calving (days) 1,509 1,344
Average Milk Fat (%) 7.8-8.2 8.7 (8.5-8.8)
Source: Animal Genetic resources of India (AGrI-IS), National Bureau of Animal Genetic resources, IcAr; Physical characterization of Native cattle Breeds of odisha by odisha Livestock resources Development Society and orissa university of Agriculture and Technology (2009), Dairy Farmers’ Manual, Ministry of Agriculture and Farmers Welfare, Govt. of India.
Part IV : Milk Production
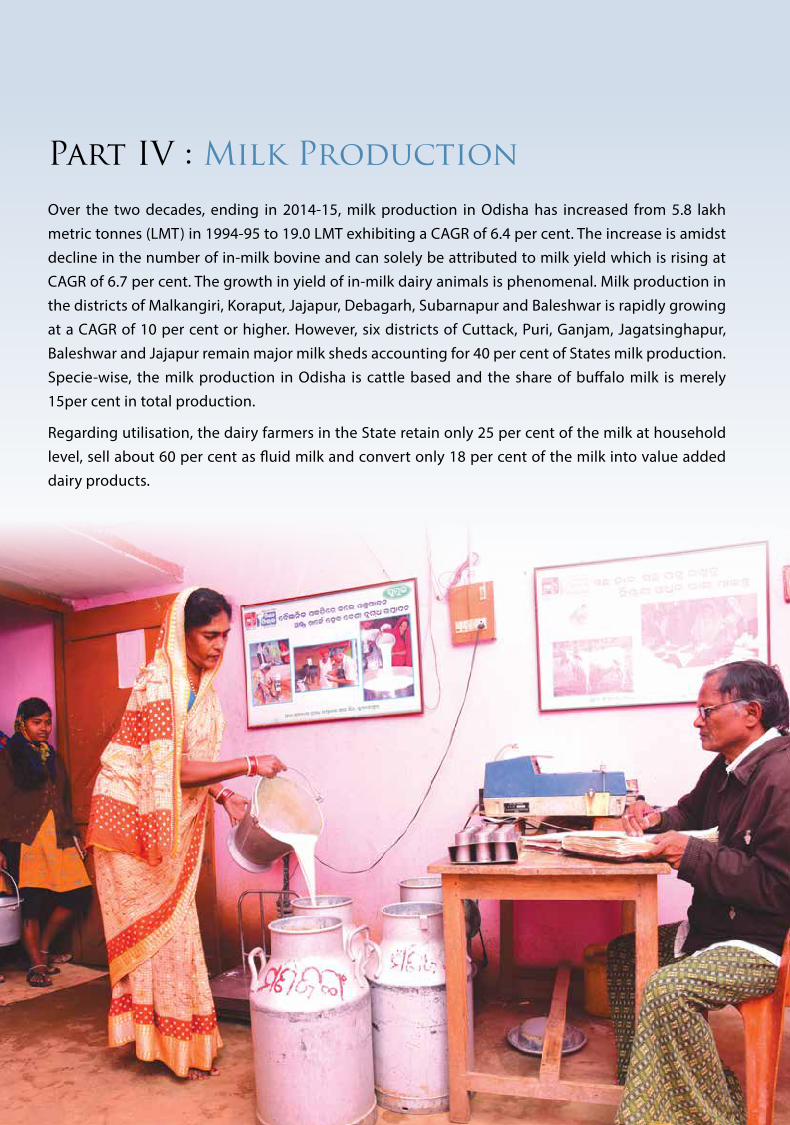
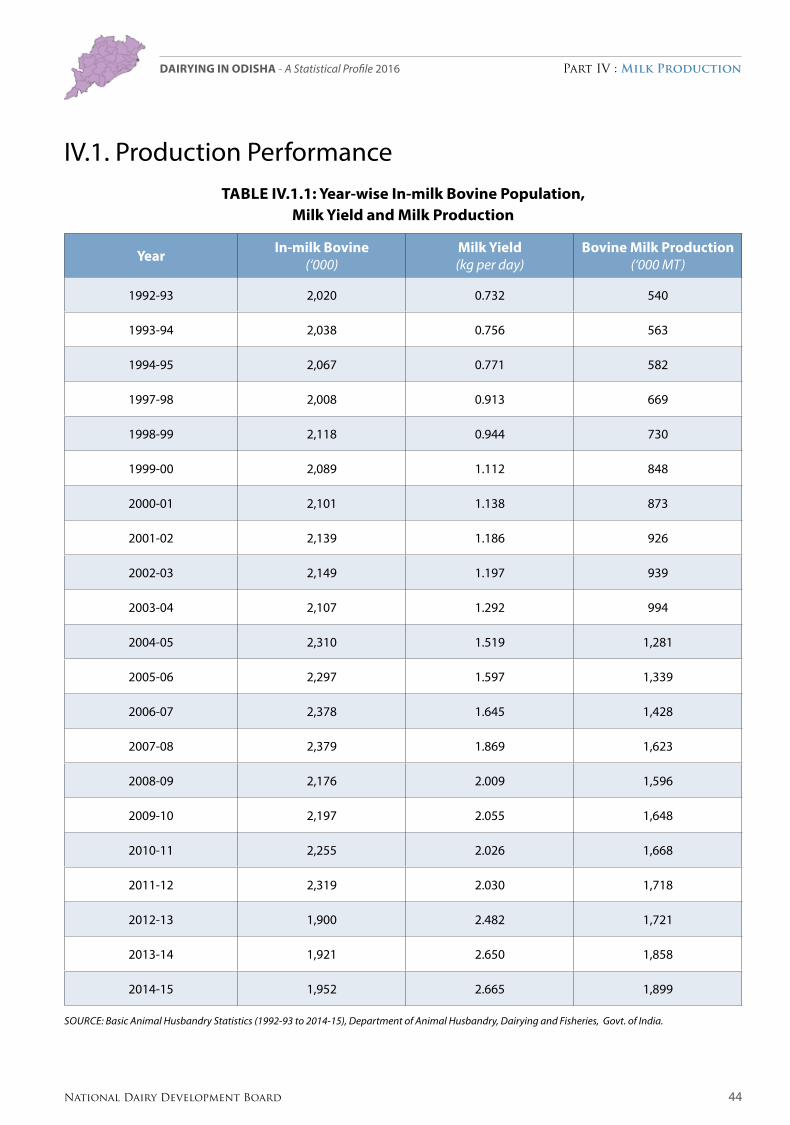
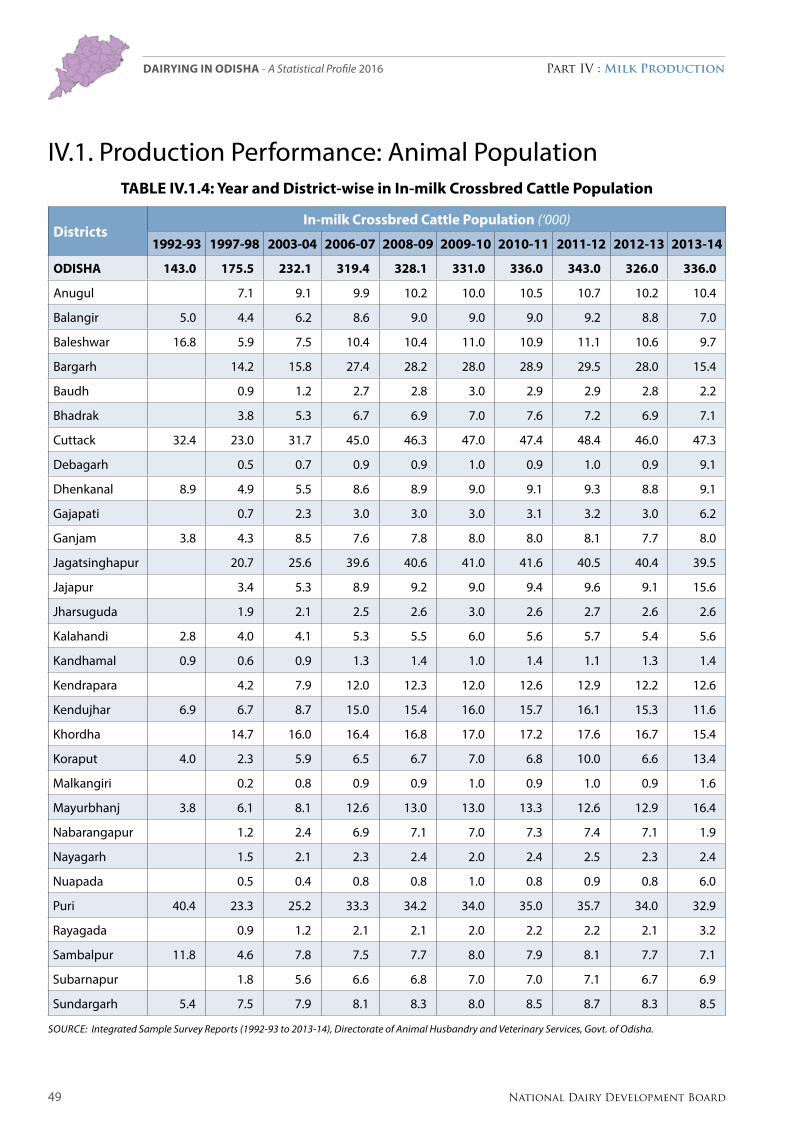
Over the two decades, ending in 2014-15, milk production in Odisha has increased from 5.8 lakh metric tonnes (LMT) in 1994-95 to 19.0 LMT exhibiting a CAGR of 6.4 per cent. The increase is amidst decline in the number of in-milk bovine and can solely be attributed to milk yield which is rising at CAGR of 6.7 per cent. The growth in yield of in-milk dairy animals is phenomenal. Milk production in the districts of Malkangiri, Koraput, Jajapur, Debagarh, Subarnapur and Baleshwar is rapidly growing at a CAGR of 10 per cent or higher. However, six districts of Cuttack, Puri, Ganjam, Jagatsinghapur, Baleshwar and Jajapur remain major milk sheds accounting for 40 per cent of States milk production. Specie-wise, the milk production in Odisha is cattle based and the share of buffalo milk is merely 15per cent in total production.
Regarding utilisation, the dairy farmers in the State retain only 25 per cent of the milk at household level, sell about 60 per cent as fluid milk and convert only 18 per cent of the milk into value added dairy products.
44National Dairy Development Board
Part IV : Milk ProductionDairying in ODiSHa - A Statistical Profile 2016
IV.1. Production PerformanceTable IV.1.1: Year-wise In-milk bovine Population,
Milk Yield and Milk Production
Year In-milk bovine (‘000)
Milk Yield (kg per day)
bovine Milk Production (‘000 MT)
1992-93 2,020 0.732 540
1993-94 2,038 0.756 563
1994-95 2,067 0.771 582
1997-98 2,008 0.913 669
1998-99 2,118 0.944 730
1999-00 2,089 1.112 848
2000-01 2,101 1.138 873
2001-02 2,139 1.186 926
2002-03 2,149 1.197 939
2003-04 2,107 1.292 994
2004-05 2,310 1.519 1,281
2005-06 2,297 1.597 1,339
2006-07 2,378 1.645 1,428
2007-08 2,379 1.869 1,623
2008-09 2,176 2.009 1,596
2009-10 2,197 2.055 1,648
2010-11 2,255 2.026 1,668
2011-12 2,319 2.030 1,718
2012-13 1,900 2.482 1,721
2013-14 1,921 2.650 1,858
2014-15 1,952 2.665 1,899
Source: Basic Animal Husbandry Statistics (1992-93 to 2014-15), Department of Animal Husbandry, Dairying and Fisheries, Govt. of India.

45 National Dairy Development Board
Part IV : Milk ProductionDairying in ODiSHa - A Statistical Profile 2016
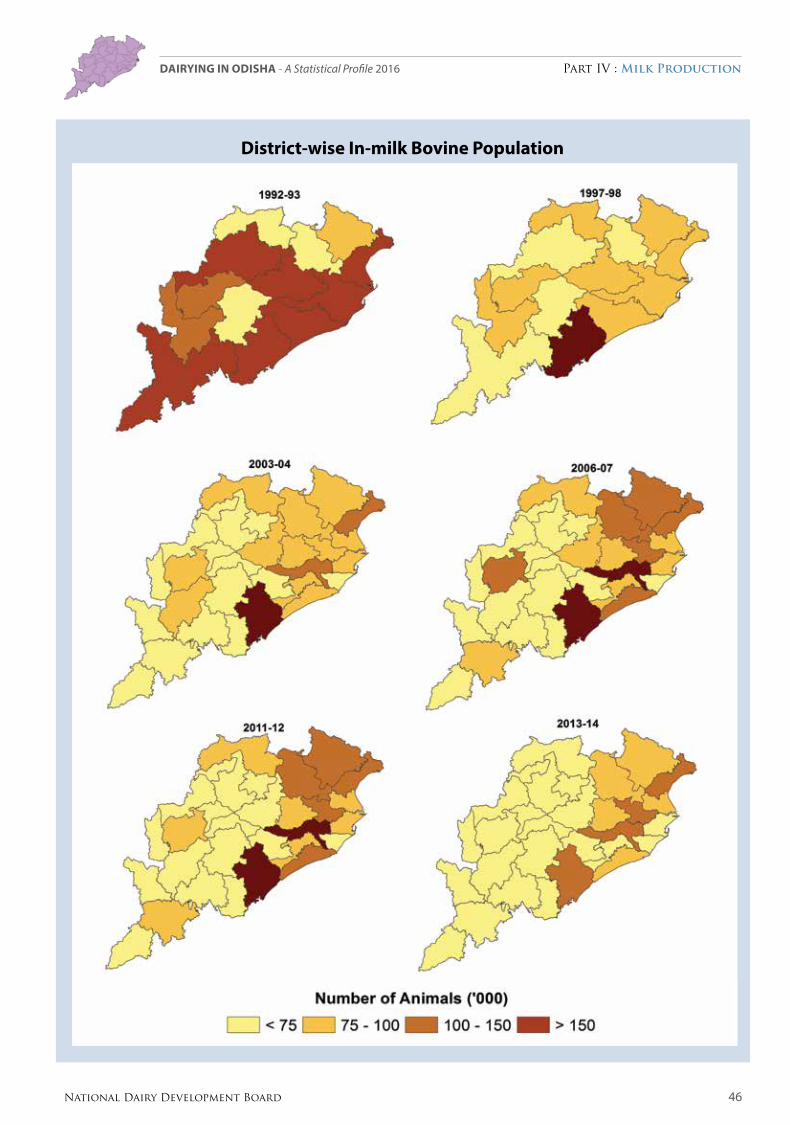
IV.1. Production Performance: Animal PopulationTable IV.1.2: Year and District-wise In-milk bovine Population
DistrictsIn-milk bovine Population (‘000)
1992-93 1997-98 2003-04 2006-07 2008-09 2009-10 2010-11 2011-12 2012-13 2013-14
ODISHa 2,019.5 2,008.1 2,107.5 2,377.9 2,176.9 2,197.0 2,255.0 2,314.0 1,907.1 1,921.0
Anugul 74.4 83.3 78.6 71.7 72.0 74.5 72.9 62.9 61.9
Balangir 145.6 88.0 77.6 102.7 95.0 95.0 96.8 99.8 81.1 71.0
Baleshwar 200.0 97.4 122.4 145.7 130.5 134.0 136.8 140.5 114.3 114.1
Bargarh 60.6 59.5 68.5 65.2 65.0 67.2 69.0 59.7 52.2
Baudh 33.3 38.5 40.4 36.9 37.0 38.1 39.2 31.7 31.4
Bhadrak 68.7 76.6 96.8 87.4 88.0 91.5 93.6 76.3 77.9
Cuttack 320.7 99.5 120.1 159.3 148.8 151.0 154.0 158.1 133.7 133.0
Debagarh 22.5 24.7 22.0 19.7 20.0 20.5 21.2 17.1 26.4
Dhenkanal 158.5 76.9 83.3 95.2 86.6 87.0 89.8 92.4 75.3 75.8
Gajapati 37.1 39.1 32.1 29.1 29.0 30.2 31.2 25.3 29.8
Ganjam 212.5 188.1 171.5 188.8 171.2 173.0 177.0 181.3 146.9 144.5
Jagatsinghapur 71.8 62.4 73.6 71.2 72.0 73.3 73.2 66.6 65.8
Jajapur 87.5 97.5 128.4 115.6 117.0 120.7 123.5 100.8 107.9
Jharsuguda 22.1 23.8 21.0 19.2 20.0 19.9 20.5 16.8 17.2
Kalahandi 121.2 81.9 77.5 72.3 66.1 67.0 68.1 70.2 56.9 57.5
Kandhamal 55.2 38.4 42.1 47.7 43.4 43.0 44.7 45.8 36.9 35.1
Kendrapara 62.8 77.8 85.0 77.6 78.0 80.6 82.9 68.2 66.2
Kendujhar 73.9 72.5 82.6 108.6 99.2 101.0 103.0 105.8 87.2 81.8
Khordha 102.8 80.5 81.0 74.5 76.0 77.4 79.5 66.3 72.5
Koraput 196.6 58.7 73.0 83.3 77.0 77.0 78.6 84.3 65.7 68.7
Malkangiri 38.6 47.6 50.3 45.3 45.0 46.9 48.4 38.9 47.6
Mayurbhanj 86.5 86.1 82.7 108.7 98.6 100.0 102.8 104.5 86.6 88.7
Nabarangapur 45.7 47.6 59.2 54.0 54.0 56.0 57.6 47.2 41.1
Nayagarh 59.1 53.7 48.9 44.1 45.0 45.8 47.2 38.0 37.0
Nuapada 41.4 27.7 36.4 33.0 34.0 34.0 35.2 28.2 31.4
Puri 206.5 79.0 95.3 105.6 99.2 99.0 102.4 105.2 89.5 98.3
Rayagada 63.2 68.5 65.3 59.8 59.0 61.3 63.2 50.8 49.6
Sambalpur 168.2 46.6 52.7 48.2 44.3 45.0 45.8 47.2 38.9 38.5
Subarnapur 28.1 38.1 38.9 35.9 36.0 37.2 38.1 31.5 32.3
Sundargarh 74.2 76.6 79.8 85.4 77.6 78.0 80.5 82.9 67.6 65.7
Source: Integrated Sample Survey reports (1992-93 to 2013-14), Directorate of Animal Husbandry and Veterinary Services, Govt. of odisha.
46National Dairy Development Board
Part IV : Milk ProductionDairying in ODiSHa - A Statistical Profile 2016
District-wise In-milk bovine Population
47 National Dairy Development Board
Part IV : Milk ProductionDairying in ODiSHa - A Statistical Profile 2016
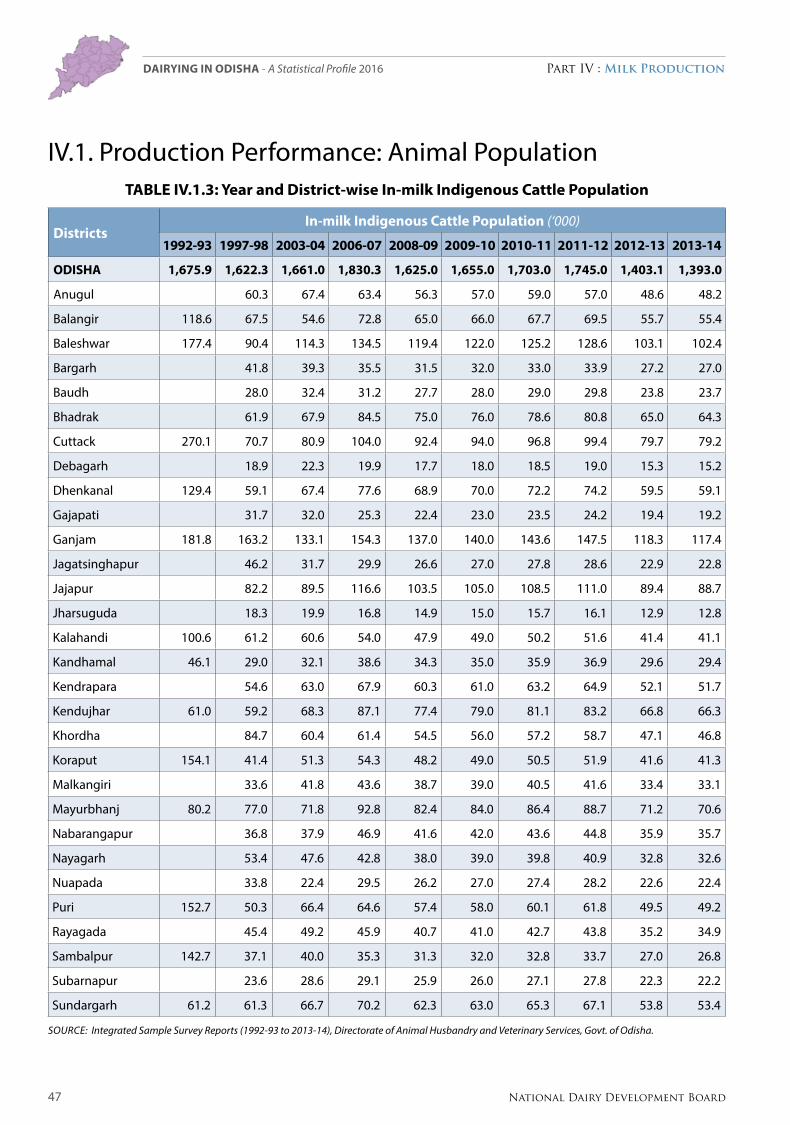
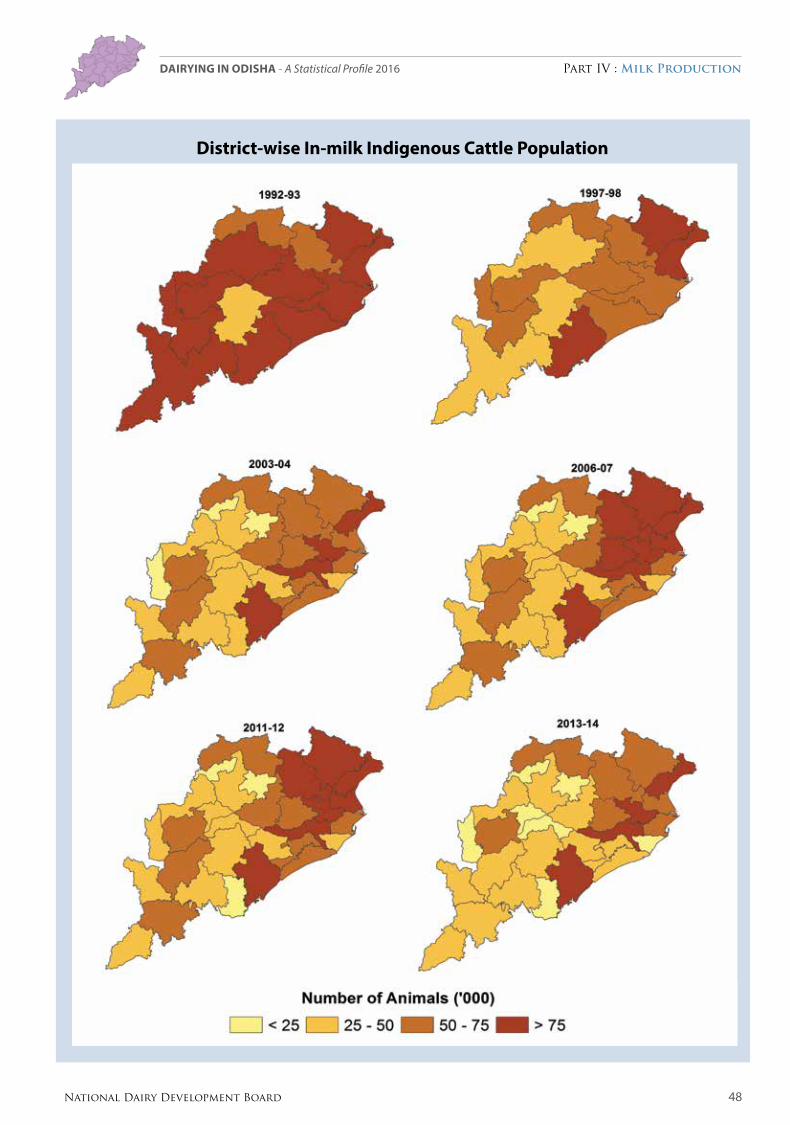
IV.1. Production Performance: Animal PopulationTable IV.1.3: Year and District-wise In-milk Indigenous Cattle Population
DistrictsIn-milk Indigenous Cattle Population (‘000)
1992-93 1997-98 2003-04 2006-07 2008-09 2009-10 2010-11 2011-12 2012-13 2013-14
ODISHa 1,675.9 1,622.3 1,661.0 1,830.3 1,625.0 1,655.0 1,703.0 1,745.0 1,403.1 1,393.0
Anugul 60.3 67.4 63.4 56.3 57.0 59.0 57.0 48.6 48.2
Balangir 118.6 67.5 54.6 72.8 65.0 66.0 67.7 69.5 55.7 55.4
Baleshwar 177.4 90.4 114.3 134.5 119.4 122.0 125.2 128.6 103.1 102.4
Bargarh 41.8 39.3 35.5 31.5 32.0 33.0 33.9 27.2 27.0
Baudh 28.0 32.4 31.2 27.7 28.0 29.0 29.8 23.8 23.7
Bhadrak 61.9 67.9 84.5 75.0 76.0 78.6 80.8 65.0 64.3
Cuttack 270.1 70.7 80.9 104.0 92.4 94.0 96.8 99.4 79.7 79.2
Debagarh 18.9 22.3 19.9 17.7 18.0 18.5 19.0 15.3 15.2
Dhenkanal 129.4 59.1 67.4 77.6 68.9 70.0 72.2 74.2 59.5 59.1
Gajapati 31.7 32.0 25.3 22.4 23.0 23.5 24.2 19.4 19.2
Ganjam 181.8 163.2 133.1 154.3 137.0 140.0 143.6 147.5 118.3 117.4
Jagatsinghapur 46.2 31.7 29.9 26.6 27.0 27.8 28.6 22.9 22.8
Jajapur 82.2 89.5 116.6 103.5 105.0 108.5 111.0 89.4 88.7
Jharsuguda 18.3 19.9 16.8 14.9 15.0 15.7 16.1 12.9 12.8
Kalahandi 100.6 61.2 60.6 54.0 47.9 49.0 50.2 51.6 41.4 41.1
Kandhamal 46.1 29.0 32.1 38.6 34.3 35.0 35.9 36.9 29.6 29.4
Kendrapara 54.6 63.0 67.9 60.3 61.0 63.2 64.9 52.1 51.7
Kendujhar 61.0 59.2 68.3 87.1 77.4 79.0 81.1 83.2 66.8 66.3
Khordha 84.7 60.4 61.4 54.5 56.0 57.2 58.7 47.1 46.8
Koraput 154.1 41.4 51.3 54.3 48.2 49.0 50.5 51.9 41.6 41.3
Malkangiri 33.6 41.8 43.6 38.7 39.0 40.5 41.6 33.4 33.1
Mayurbhanj 80.2 77.0 71.8 92.8 82.4 84.0 86.4 88.7 71.2 70.6
Nabarangapur 36.8 37.9 46.9 41.6 42.0 43.6 44.8 35.9 35.7
Nayagarh 53.4 47.6 42.8 38.0 39.0 39.8 40.9 32.8 32.6
Nuapada 33.8 22.4 29.5 26.2 27.0 27.4 28.2 22.6 22.4
Puri 152.7 50.3 66.4 64.6 57.4 58.0 60.1 61.8 49.5 49.2
Rayagada 45.4 49.2 45.9 40.7 41.0 42.7 43.8 35.2 34.9
Sambalpur 142.7 37.1 40.0 35.3 31.3 32.0 32.8 33.7 27.0 26.8
Subarnapur 23.6 28.6 29.1 25.9 26.0 27.1 27.8 22.3 22.2
Sundargarh 61.2 61.3 66.7 70.2 62.3 63.0 65.3 67.1 53.8 53.4
Source: Integrated Sample Survey reports (1992-93 to 2013-14), Directorate of Animal Husbandry and Veterinary Services, Govt. of odisha.
48National Dairy Development Board
Part IV : Milk ProductionDairying in ODiSHa - A Statistical Profile 2016
District-wise In-milk Indigenous Cattle Population
49 National Dairy Development Board
Part IV : Milk ProductionDairying in ODiSHa - A Statistical Profile 2016
IV.1. Production Performance: Animal PopulationTable IV.1.4: Year and District-wise in In-milk Crossbred Cattle Population
DistrictsIn-milk Crossbred Cattle Population (‘000)
1992-93 1997-98 2003-04 2006-07 2008-09 2009-10 2010-11 2011-12 2012-13 2013-14
ODISHa 143.0 175.5 232.1 319.4 328.1 331.0 336.0 343.0 326.0 336.0
Anugul 7.1 9.1 9.9 10.2 10.0 10.5 10.7 10.2 10.4
Balangir 5.0 4.4 6.2 8.6 9.0 9.0 9.0 9.2 8.8 7.0
Baleshwar 16.8 5.9 7.5 10.4 10.4 11.0 10.9 11.1 10.6 9.7
Bargarh 14.2 15.8 27.4 28.2 28.0 28.9 29.5 28.0 15.4
Baudh 0.9 1.2 2.7 2.8 3.0 2.9 2.9 2.8 2.2
Bhadrak 3.8 5.3 6.7 6.9 7.0 7.6 7.2 6.9 7.1
Cuttack 32.4 23.0 31.7 45.0 46.3 47.0 47.4 48.4 46.0 47.3
Debagarh 0.5 0.7 0.9 0.9 1.0 0.9 1.0 0.9 9.1
Dhenkanal 8.9 4.9 5.5 8.6 8.9 9.0 9.1 9.3 8.8 9.1
Gajapati 0.7 2.3 3.0 3.0 3.0 3.1 3.2 3.0 6.2
Ganjam 3.8 4.3 8.5 7.6 7.8 8.0 8.0 8.1 7.7 8.0
Jagatsinghapur 20.7 25.6 39.6 40.6 41.0 41.6 40.5 40.4 39.5
Jajapur 3.4 5.3 8.9 9.2 9.0 9.4 9.6 9.1 15.6
Jharsuguda 1.9 2.1 2.5 2.6 3.0 2.6 2.7 2.6 2.6
Kalahandi 2.8 4.0 4.1 5.3 5.5 6.0 5.6 5.7 5.4 5.6
Kandhamal 0.9 0.6 0.9 1.3 1.4 1.0 1.4 1.1 1.3 1.4
Kendrapara 4.2 7.9 12.0 12.3 12.0 12.6 12.9 12.2 12.6
Kendujhar 6.9 6.7 8.7 15.0 15.4 16.0 15.7 16.1 15.3 11.6
Khordha 14.7 16.0 16.4 16.8 17.0 17.2 17.6 16.7 15.4
Koraput 4.0 2.3 5.9 6.5 6.7 7.0 6.8 10.0 6.6 13.4
Malkangiri 0.2 0.8 0.9 0.9 1.0 0.9 1.0 0.9 1.6
Mayurbhanj 3.8 6.1 8.1 12.6 13.0 13.0 13.3 12.6 12.9 16.4
Nabarangapur 1.2 2.4 6.9 7.1 7.0 7.3 7.4 7.1 1.9
Nayagarh 1.5 2.1 2.3 2.4 2.0 2.4 2.5 2.3 2.4
Nuapada 0.5 0.4 0.8 0.8 1.0 0.8 0.9 0.8 6.0
Puri 40.4 23.3 25.2 33.3 34.2 34.0 35.0 35.7 34.0 32.9
Rayagada 0.9 1.2 2.1 2.1 2.0 2.2 2.2 2.1 3.2
Sambalpur 11.8 4.6 7.8 7.5 7.7 8.0 7.9 8.1 7.7 7.1
Subarnapur 1.8 5.6 6.6 6.8 7.0 7.0 7.1 6.7 6.9
Sundargarh 5.4 7.5 7.9 8.1 8.3 8.0 8.5 8.7 8.3 8.5
Source: Integrated Sample Survey reports (1992-93 to 2013-14), Directorate of Animal Husbandry and Veterinary Services, Govt. of odisha.
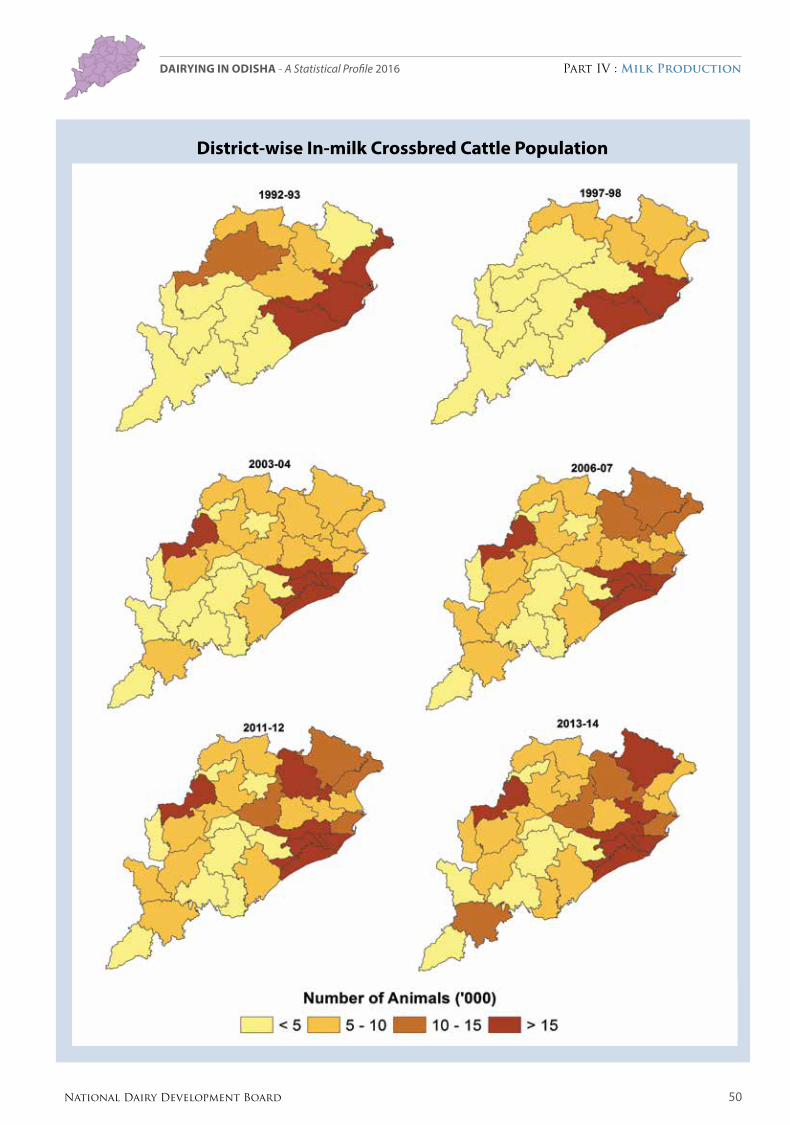
50National Dairy Development Board
Part IV : Milk ProductionDairying in ODiSHa - A Statistical Profile 2016
District-wise In-milk Crossbred Cattle Population
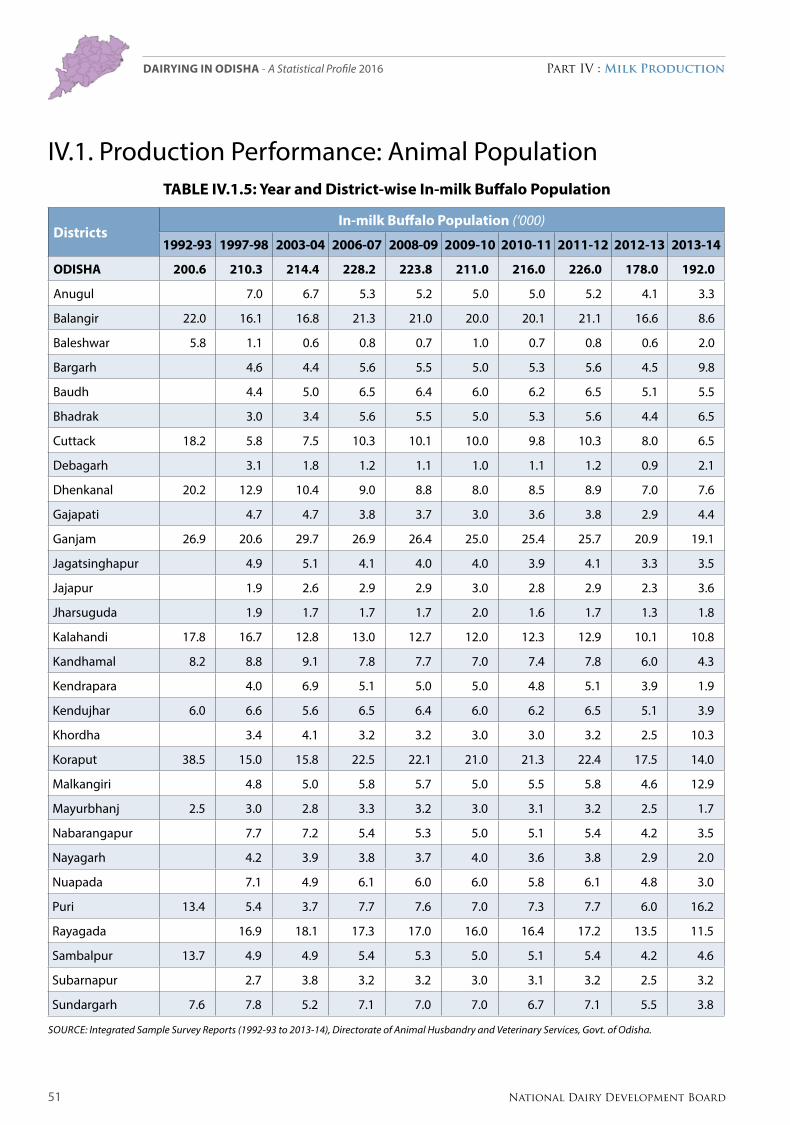
51 National Dairy Development Board
Part IV : Milk ProductionDairying in ODiSHa - A Statistical Profile 2016
IV.1. Production Performance: Animal PopulationTable IV.1.5: Year and District-wise In-milk buffalo Population
DistrictsIn-milk buffalo Population (‘000)
1992-93 1997-98 2003-04 2006-07 2008-09 2009-10 2010-11 2011-12 2012-13 2013-14
ODISHa 200.6 210.3 214.4 228.2 223.8 211.0 216.0 226.0 178.0 192.0
Anugul 7.0 6.7 5.3 5.2 5.0 5.0 5.2 4.1 3.3
Balangir 22.0 16.1 16.8 21.3 21.0 20.0 20.1 21.1 16.6 8.6
Baleshwar 5.8 1.1 0.6 0.8 0.7 1.0 0.7 0.8 0.6 2.0
Bargarh 4.6 4.4 5.6 5.5 5.0 5.3 5.6 4.5 9.8
Baudh 4.4 5.0 6.5 6.4 6.0 6.2 6.5 5.1 5.5
Bhadrak 3.0 3.4 5.6 5.5 5.0 5.3 5.6 4.4 6.5
Cuttack 18.2 5.8 7.5 10.3 10.1 10.0 9.8 10.3 8.0 6.5
Debagarh 3.1 1.8 1.2 1.1 1.0 1.1 1.2 0.9 2.1
Dhenkanal 20.2 12.9 10.4 9.0 8.8 8.0 8.5 8.9 7.0 7.6
Gajapati 4.7 4.7 3.8 3.7 3.0 3.6 3.8 2.9 4.4
Ganjam 26.9 20.6 29.7 26.9 26.4 25.0 25.4 25.7 20.9 19.1
Jagatsinghapur 4.9 5.1 4.1 4.0 4.0 3.9 4.1 3.3 3.5
Jajapur 1.9 2.6 2.9 2.9 3.0 2.8 2.9 2.3 3.6
Jharsuguda 1.9 1.7 1.7 1.7 2.0 1.6 1.7 1.3 1.8
Kalahandi 17.8 16.7 12.8 13.0 12.7 12.0 12.3 12.9 10.1 10.8
Kandhamal 8.2 8.8 9.1 7.8 7.7 7.0 7.4 7.8 6.0 4.3
Kendrapara 4.0 6.9 5.1 5.0 5.0 4.8 5.1 3.9 1.9
Kendujhar 6.0 6.6 5.6 6.5 6.4 6.0 6.2 6.5 5.1 3.9
Khordha 3.4 4.1 3.2 3.2 3.0 3.0 3.2 2.5 10.3
Koraput 38.5 15.0 15.8 22.5 22.1 21.0 21.3 22.4 17.5 14.0
Malkangiri 4.8 5.0 5.8 5.7 5.0 5.5 5.8 4.6 12.9
Mayurbhanj 2.5 3.0 2.8 3.3 3.2 3.0 3.1 3.2 2.5 1.7
Nabarangapur 7.7 7.2 5.4 5.3 5.0 5.1 5.4 4.2 3.5
Nayagarh 4.2 3.9 3.8 3.7 4.0 3.6 3.8 2.9 2.0
Nuapada 7.1 4.9 6.1 6.0 6.0 5.8 6.1 4.8 3.0
Puri 13.4 5.4 3.7 7.7 7.6 7.0 7.3 7.7 6.0 16.2
Rayagada 16.9 18.1 17.3 17.0 16.0 16.4 17.2 13.5 11.5
Sambalpur 13.7 4.9 4.9 5.4 5.3 5.0 5.1 5.4 4.2 4.6
Subarnapur 2.7 3.8 3.2 3.2 3.0 3.1 3.2 2.5 3.2
Sundargarh 7.6 7.8 5.2 7.1 7.0 7.0 6.7 7.1 5.5 3.8
Source: Integrated Sample Survey reports (1992-93 to 2013-14), Directorate of Animal Husbandry and Veterinary Services, Govt. of odisha.
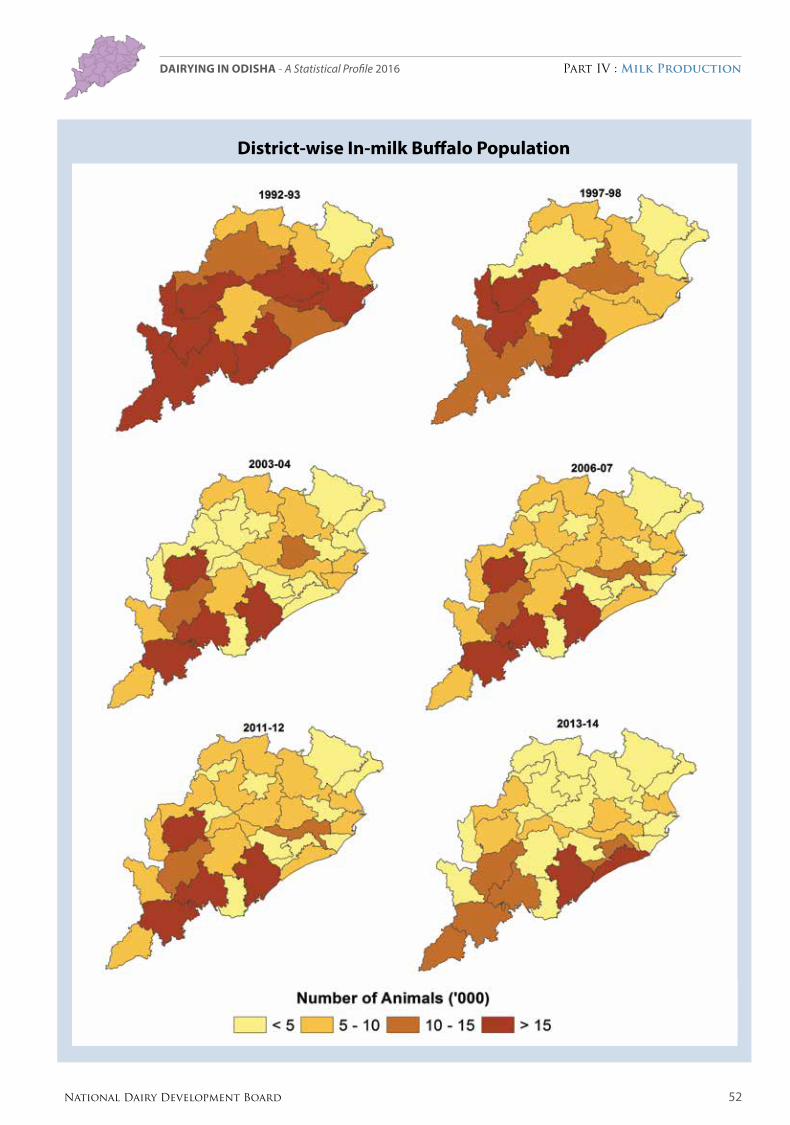
52National Dairy Development Board
Part IV : Milk ProductionDairying in ODiSHa - A Statistical Profile 2016
District-wise In-milk buffalo Population
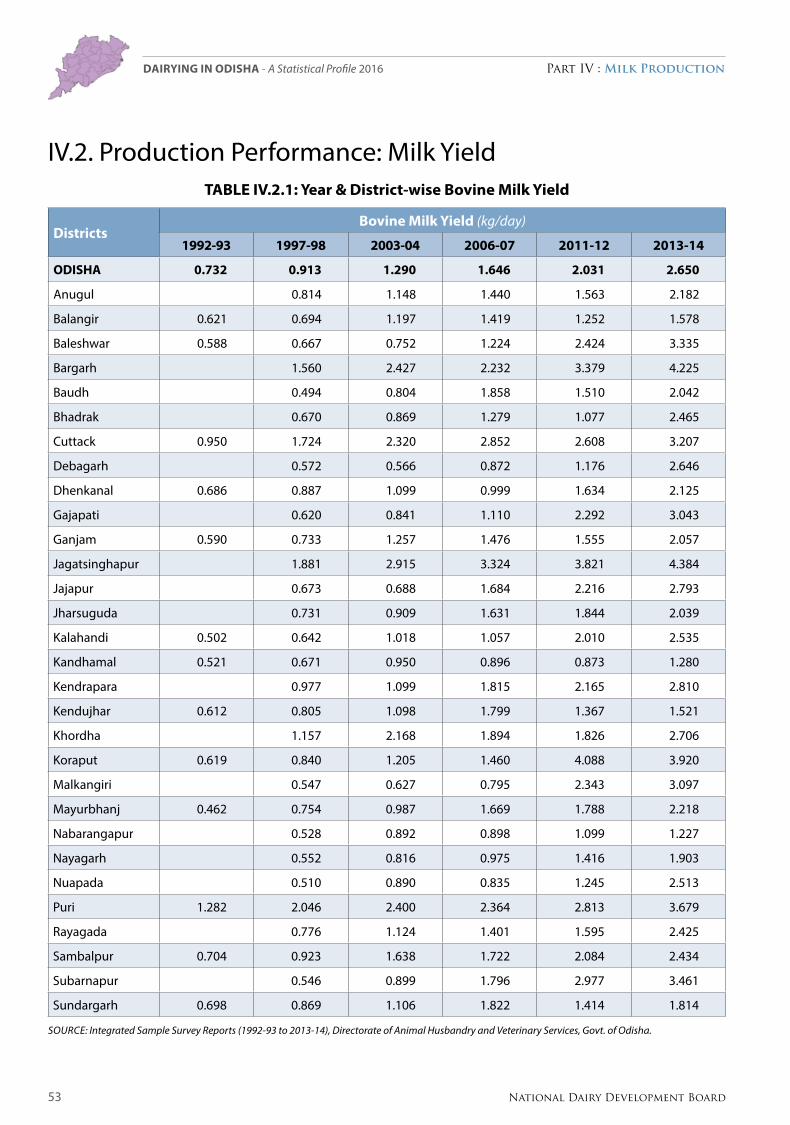
53 National Dairy Development Board
Part IV : Milk ProductionDairying in ODiSHa - A Statistical Profile 2016
IV.2. Production Performance: Milk Yield Table IV.2.1: Year & District-wise bovine Milk Yield
Districtsbovine Milk Yield (kg/day)
1992-93 1997-98 2003-04 2006-07 2011-12 2013-14
ODISHa 0.732 0.913 1.290 1.646 2.031 2.650
Anugul 0.814 1.148 1.440 1.563 2.182
Balangir 0.621 0.694 1.197 1.419 1.252 1.578
Baleshwar 0.588 0.667 0.752 1.224 2.424 3.335
Bargarh 1.560 2.427 2.232 3.379 4.225
Baudh 0.494 0.804 1.858 1.510 2.042
Bhadrak 0.670 0.869 1.279 1.077 2.465
Cuttack 0.950 1.724 2.320 2.852 2.608 3.207
Debagarh 0.572 0.566 0.872 1.176 2.646
Dhenkanal 0.686 0.887 1.099 0.999 1.634 2.125
Gajapati 0.620 0.841 1.110 2.292 3.043
Ganjam 0.590 0.733 1.257 1.476 1.555 2.057
Jagatsinghapur 1.881 2.915 3.324 3.821 4.384
Jajapur 0.673 0.688 1.684 2.216 2.793
Jharsuguda 0.731 0.909 1.631 1.844 2.039
Kalahandi 0.502 0.642 1.018 1.057 2.010 2.535
Kandhamal 0.521 0.671 0.950 0.896 0.873 1.280
Kendrapara 0.977 1.099 1.815 2.165 2.810
Kendujhar 0.612 0.805 1.098 1.799 1.367 1.521
Khordha 1.157 2.168 1.894 1.826 2.706
Koraput 0.619 0.840 1.205 1.460 4.088 3.920
Malkangiri 0.547 0.627 0.795 2.343 3.097
Mayurbhanj 0.462 0.754 0.987 1.669 1.788 2.218
Nabarangapur 0.528 0.892 0.898 1.099 1.227
Nayagarh 0.552 0.816 0.975 1.416 1.903
Nuapada 0.510 0.890 0.835 1.245 2.513
Puri 1.282 2.046 2.400 2.364 2.813 3.679
Rayagada 0.776 1.124 1.401 1.595 2.425
Sambalpur 0.704 0.923 1.638 1.722 2.084 2.434
Subarnapur 0.546 0.899 1.796 2.977 3.461
Sundargarh 0.698 0.869 1.106 1.822 1.414 1.814
Source: Integrated Sample Survey reports (1992-93 to 2013-14), Directorate of Animal Husbandry and Veterinary Services, Govt. of odisha.
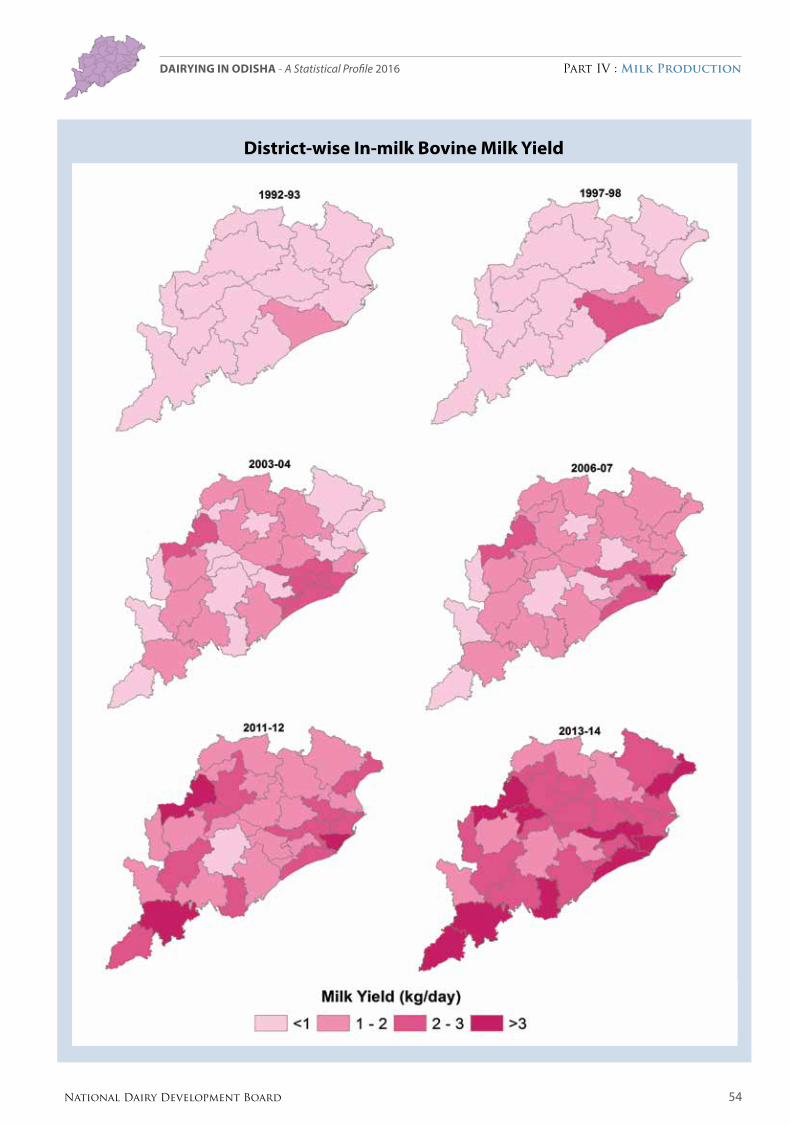
54National Dairy Development Board
Part IV : Milk ProductionDairying in ODiSHa - A Statistical Profile 2016
District-wise In-milk bovine Milk Yield

55 National Dairy Development Board
Part IV : Milk ProductionDairying in ODiSHa - A Statistical Profile 2016
IV.2. Production Performance: Milk Yield Table IV. 2.2: Year and District-wise Indigenous Cattle Milk Yield
DistrictsIndigenous Cattle Milk Yield (kg/day)
1992-93 1997-98 2003-04 2006-07 2011-12 2013-14
ODISHa 0.450 0.494 0.528 0.915 1.150 1.630
Anugul 0.488 0.508 0.948 0.860 1.400
Balangir 0.412 0.358 0.428 0.716 0.600 0.850
Baleshwar 0.418 0.466 0.456 0.915 2.150 3.050
Bargarh 0.542 0.737 0.525 2.150 3.060
Baudh 0.387 0.452 1.196 1.060 1.510
Bhadrak 0.485 0.468 0.891 0.750 1.740
Cuttack 0.582 0.778 0.765 1.664 1.100 1.560
Debagarh 0.342 0.442 0.490 0.470 0.660
Dhenkanal 0.475 0.447 0.502 0.552 0.950 1.350
Gajapati 0.392 0.417 0.561 1.470 2.080
Ganjam 0.413 0.566 0.590 0.971 1.010 1.440
Jagatsinghapur 0.662 0.787 1.205 1.240 1.760
Jajapur 0.533 0.406 1.307 1.450 2.050
Jharsuguda 0.411 0.501 0.799 0.850 1.210
Kalahandi 0.306 0.321 0.465 0.448 1.230 1.740
Kandhamal 0.358 0.400 0.491 0.540 0.580 0.830
Kendrapara 0.637 0.476 0.932 1.310 1.860
Kendujhar 0.368 0.430 0.464 1.099 0.500 0.700
Khordha 0.587 0.891 0.941 0.910 1.290
Koraput 0.388 0.477 0.427 0.600 2.840 2.990
Malkangiri 0.387 0.377 0.708 1.500 2.130
Mayurbhanj 0.364 0.468 0.514 1.000 0.780 1.110
Nabarangapur 0.335 0.398 0.475 0.580 0.820
Nayagarh 0.431 0.517 0.687 1.100 1.570
Nuapada 0.380 0.467 0.549 1.000 1.420
Puri 0.601 0.696 0.583 0.975 1.120 1.600
Rayagada 0.443 0.506 1.001 1.130 1.600
Sambalpur 0.427 0.540 0.699 0.799 1.110 1.130
Subarnapur 0.307 0.433 0.688 1.740 2.480
Sundargarh 0.411 0.447 0.528 1.037 0.630 0.900
Source: Integrated Sample Survey reports (1992-93 to 2013-14), Directorate of Animal Husbandry and Veterinary Services, Govt. of odisha.
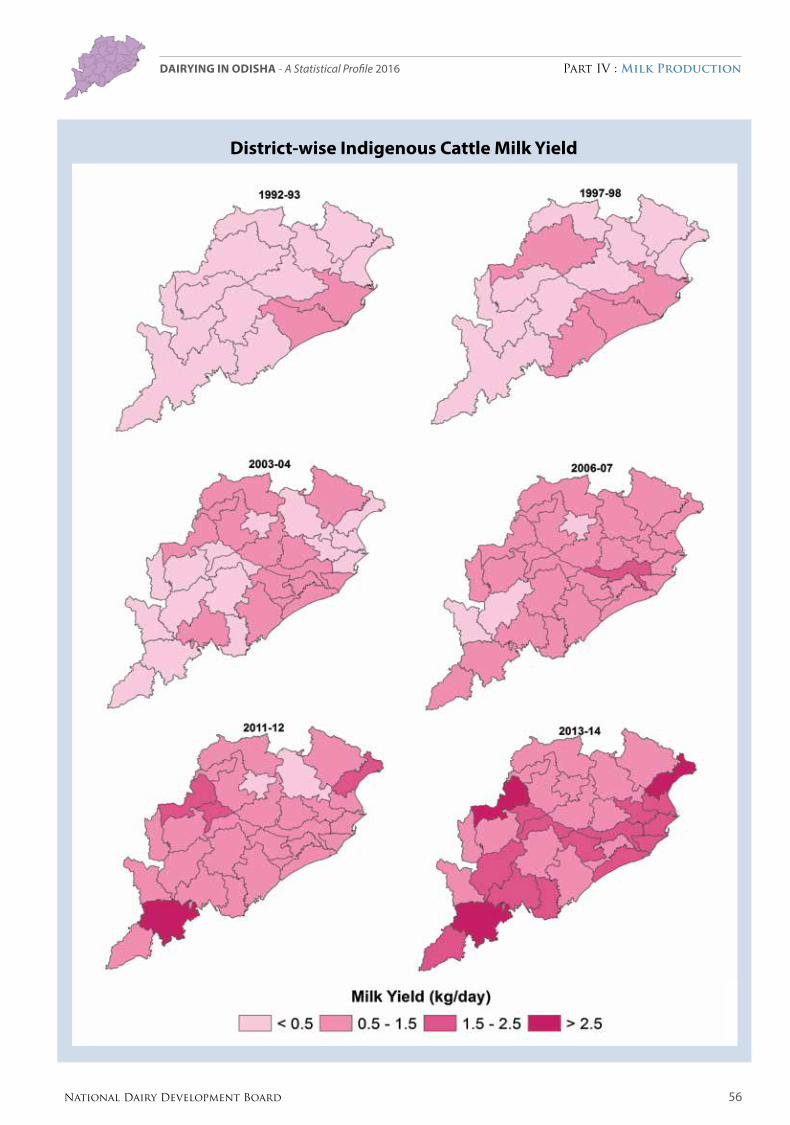
56National Dairy Development Board
Part IV : Milk ProductionDairying in ODiSHa - A Statistical Profile 2016
District-wise Indigenous Cattle Milk Yield
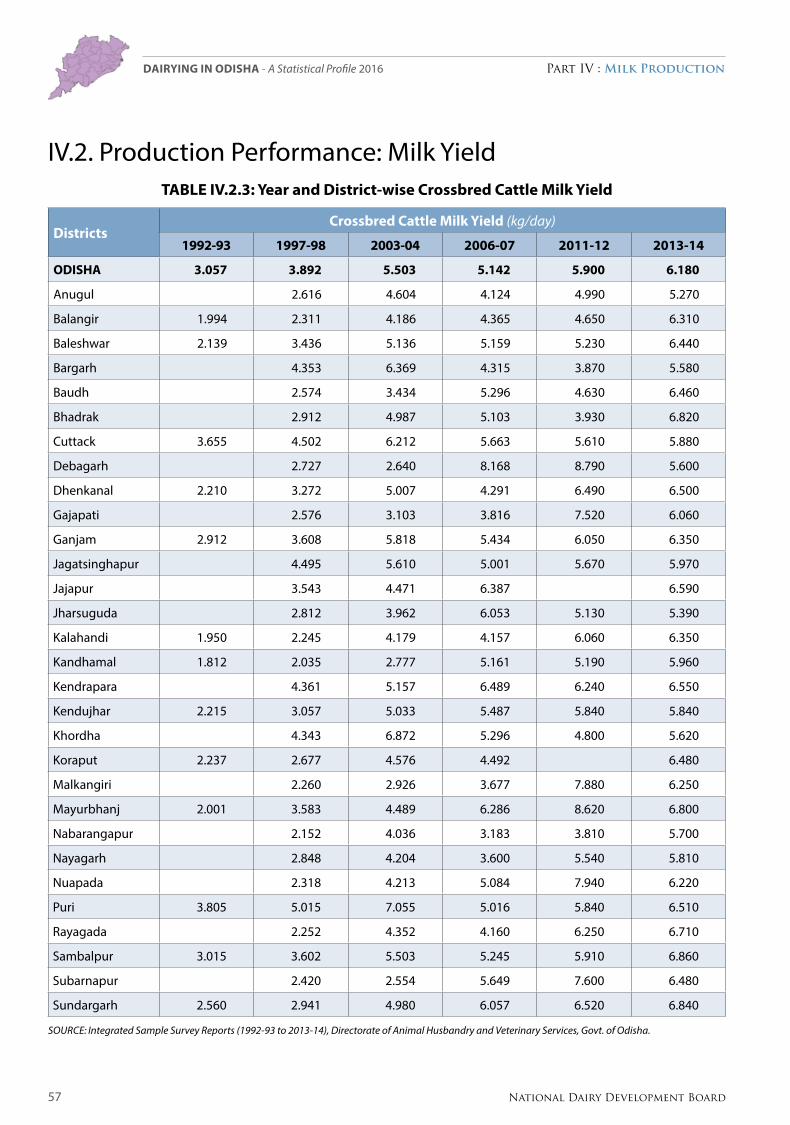
57 National Dairy Development Board
Part IV : Milk ProductionDairying in ODiSHa - A Statistical Profile 2016
IV.2. Production Performance: Milk Yield Table IV.2.3: Year and District-wise Crossbred Cattle Milk Yield
DistrictsCrossbred Cattle Milk Yield (kg/day)
1992-93 1997-98 2003-04 2006-07 2011-12 2013-14
ODISHa 3.057 3.892 5.503 5.142 5.900 6.180
Anugul 2.616 4.604 4.124 4.990 5.270
Balangir 1.994 2.311 4.186 4.365 4.650 6.310
Baleshwar 2.139 3.436 5.136 5.159 5.230 6.440
Bargarh 4.353 6.369 4.315 3.870 5.580
Baudh 2.574 3.434 5.296 4.630 6.460
Bhadrak 2.912 4.987 5.103 3.930 6.820
Cuttack 3.655 4.502 6.212 5.663 5.610 5.880
Debagarh 2.727 2.640 8.168 8.790 5.600
Dhenkanal 2.210 3.272 5.007 4.291 6.490 6.500
Gajapati 2.576 3.103 3.816 7.520 6.060
Ganjam 2.912 3.608 5.818 5.434 6.050 6.350
Jagatsinghapur 4.495 5.610 5.001 5.670 5.970
Jajapur 3.543 4.471 6.387 6.590
Jharsuguda 2.812 3.962 6.053 5.130 5.390
Kalahandi 1.950 2.245 4.179 4.157 6.060 6.350
Kandhamal 1.812 2.035 2.777 5.161 5.190 5.960
Kendrapara 4.361 5.157 6.489 6.240 6.550
Kendujhar 2.215 3.057 5.033 5.487 5.840 5.840
Khordha 4.343 6.872 5.296 4.800 5.620
Koraput 2.237 2.677 4.576 4.492 6.480
Malkangiri 2.260 2.926 3.677 7.880 6.250
Mayurbhanj 2.001 3.583 4.489 6.286 8.620 6.800
Nabarangapur 2.152 4.036 3.183 3.810 5.700
Nayagarh 2.848 4.204 3.600 5.540 5.810
Nuapada 2.318 4.213 5.084 7.940 6.220
Puri 3.805 5.015 7.055 5.016 5.840 6.510
Rayagada 2.252 4.352 4.160 6.250 6.710
Sambalpur 3.015 3.602 5.503 5.245 5.910 6.860
Subarnapur 2.420 2.554 5.649 7.600 6.480
Sundargarh 2.560 2.941 4.980 6.057 6.520 6.840
Source: Integrated Sample Survey reports (1992-93 to 2013-14), Directorate of Animal Husbandry and Veterinary Services, Govt. of odisha.

58National Dairy Development Board
Part IV : Milk ProductionDairying in ODiSHa - A Statistical Profile 2016
District-wise Crossbred Cattle Milk Yield
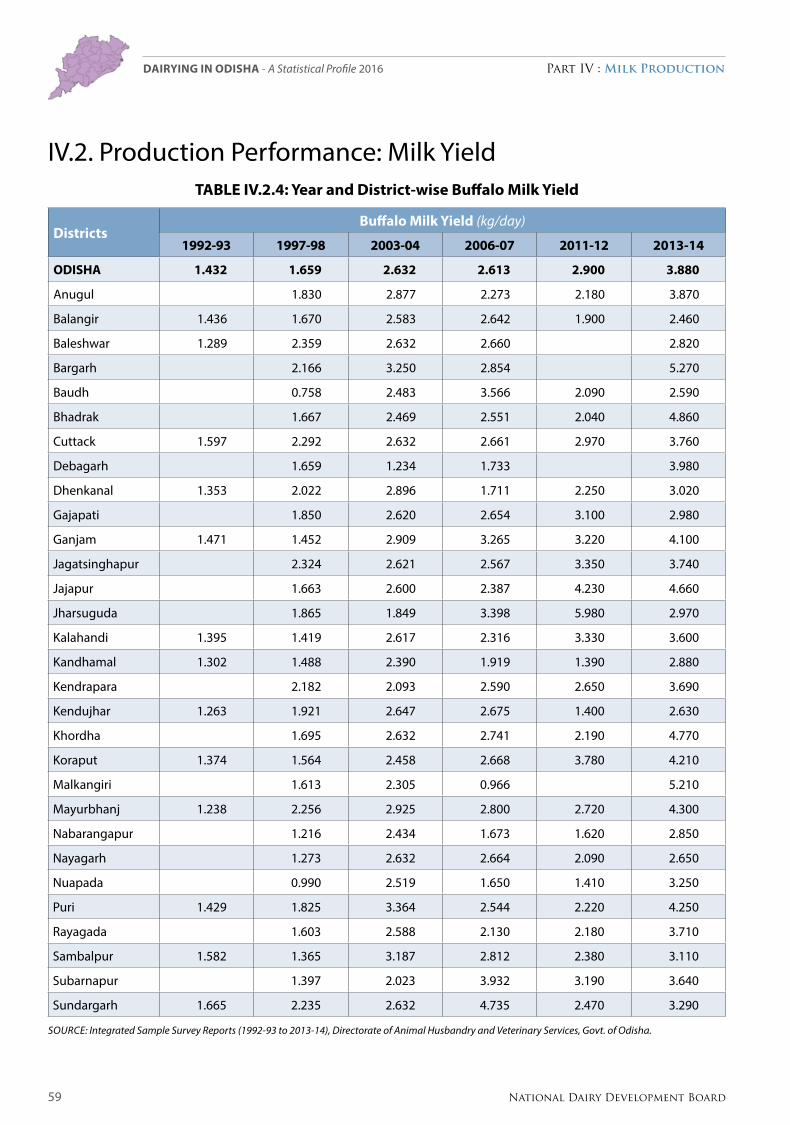
59 National Dairy Development Board
Part IV : Milk ProductionDairying in ODiSHa - A Statistical Profile 2016
IV.2. Production Performance: Milk Yield Table IV.2.4: Year and District-wise buffalo Milk Yield
Districtsbuffalo Milk Yield (kg/day)
1992-93 1997-98 2003-04 2006-07 2011-12 2013-14
ODISHa 1.432 1.659 2.632 2.613 2.900 3.880
Anugul 1.830 2.877 2.273 2.180 3.870
Balangir 1.436 1.670 2.583 2.642 1.900 2.460
Baleshwar 1.289 2.359 2.632 2.660 2.820
Bargarh 2.166 3.250 2.854 5.270
Baudh 0.758 2.483 3.566 2.090 2.590
Bhadrak 1.667 2.469 2.551 2.040 4.860
Cuttack 1.597 2.292 2.632 2.661 2.970 3.760
Debagarh 1.659 1.234 1.733 3.980
Dhenkanal 1.353 2.022 2.896 1.711 2.250 3.020
Gajapati 1.850 2.620 2.654 3.100 2.980
Ganjam 1.471 1.452 2.909 3.265 3.220 4.100
Jagatsinghapur 2.324 2.621 2.567 3.350 3.740
Jajapur 1.663 2.600 2.387 4.230 4.660
Jharsuguda 1.865 1.849 3.398 5.980 2.970
Kalahandi 1.395 1.419 2.617 2.316 3.330 3.600
Kandhamal 1.302 1.488 2.390 1.919 1.390 2.880
Kendrapara 2.182 2.093 2.590 2.650 3.690
Kendujhar 1.263 1.921 2.647 2.675 1.400 2.630
Khordha 1.695 2.632 2.741 2.190 4.770
Koraput 1.374 1.564 2.458 2.668 3.780 4.210
Malkangiri 1.613 2.305 0.966 5.210
Mayurbhanj 1.238 2.256 2.925 2.800 2.720 4.300
Nabarangapur 1.216 2.434 1.673 1.620 2.850
Nayagarh 1.273 2.632 2.664 2.090 2.650
Nuapada 0.990 2.519 1.650 1.410 3.250
Puri 1.429 1.825 3.364 2.544 2.220 4.250
Rayagada 1.603 2.588 2.130 2.180 3.710
Sambalpur 1.582 1.365 3.187 2.812 2.380 3.110
Subarnapur 1.397 2.023 3.932 3.190 3.640
Sundargarh 1.665 2.235 2.632 4.735 2.470 3.290
Source: Integrated Sample Survey reports (1992-93 to 2013-14), Directorate of Animal Husbandry and Veterinary Services, Govt. of odisha.
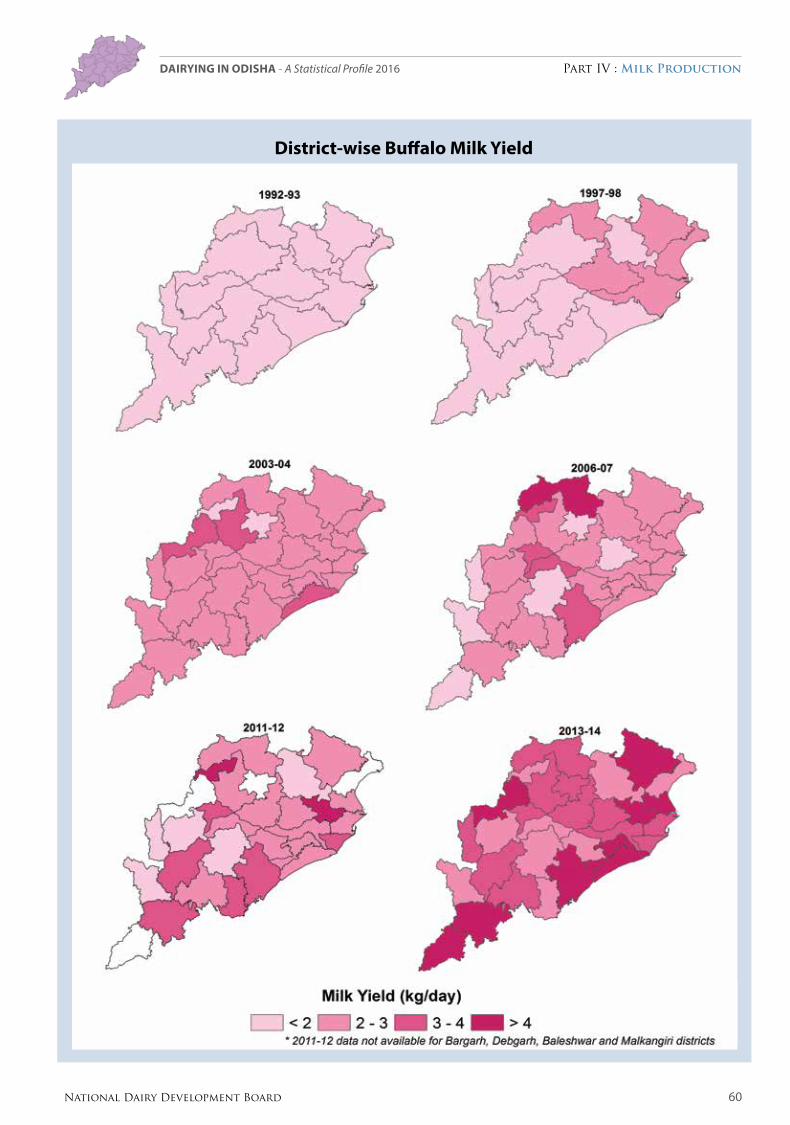
60National Dairy Development Board
Part IV : Milk ProductionDairying in ODiSHa - A Statistical Profile 2016
District-wise buffalo Milk Yield
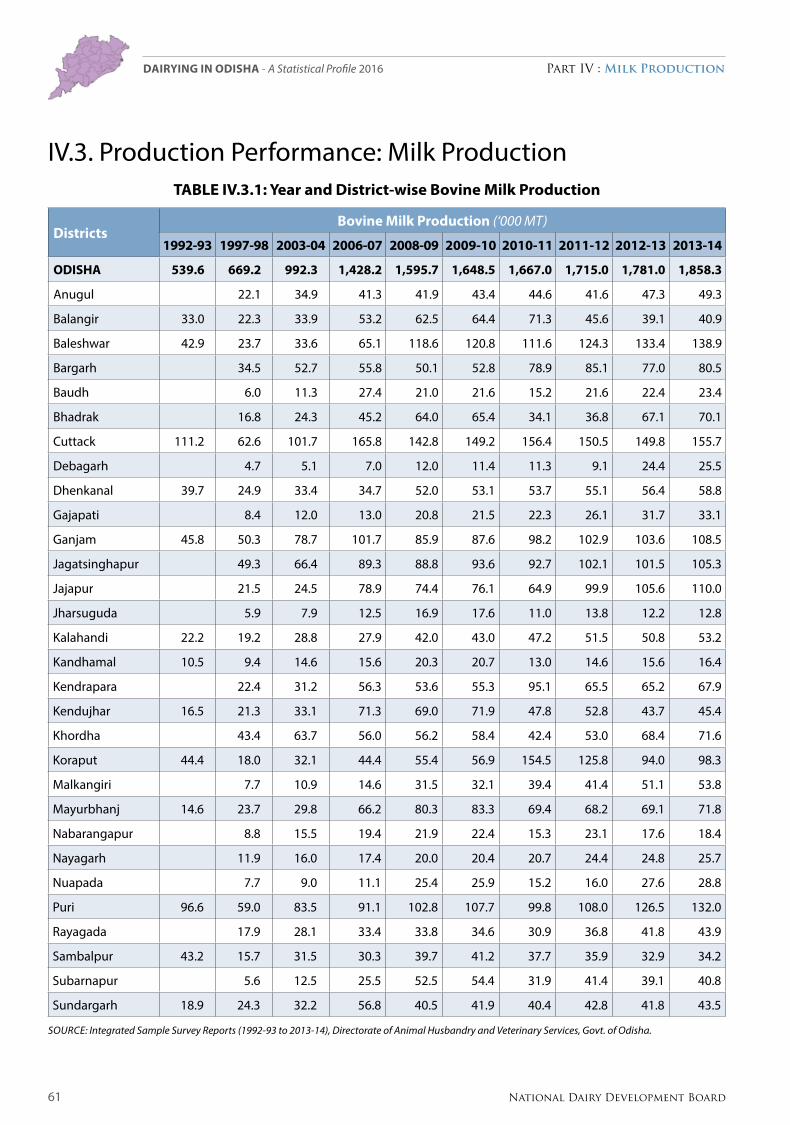
61 National Dairy Development Board
Part IV : Milk ProductionDairying in ODiSHa - A Statistical Profile 2016
IV.3. Production Performance: Milk ProductionTable IV.3.1: Year and District-wise bovine Milk Production
Districtsbovine Milk Production (‘000 MT)
1992-93 1997-98 2003-04 2006-07 2008-09 2009-10 2010-11 2011-12 2012-13 2013-14
ODISHa 539.6 669.2 992.3 1,428.2 1,595.7 1,648.5 1,667.0 1,715.0 1,781.0 1,858.3
Anugul 22.1 34.9 41.3 41.9 43.4 44.6 41.6 47.3 49.3
Balangir 33.0 22.3 33.9 53.2 62.5 64.4 71.3 45.6 39.1 40.9
Baleshwar 42.9 23.7 33.6 65.1 118.6 120.8 111.6 124.3 133.4 138.9
Bargarh 34.5 52.7 55.8 50.1 52.8 78.9 85.1 77.0 80.5
Baudh 6.0 11.3 27.4 21.0 21.6 15.2 21.6 22.4 23.4
Bhadrak 16.8 24.3 45.2 64.0 65.4 34.1 36.8 67.1 70.1
Cuttack 111.2 62.6 101.7 165.8 142.8 149.2 156.4 150.5 149.8 155.7
Debagarh 4.7 5.1 7.0 12.0 11.4 11.3 9.1 24.4 25.5
Dhenkanal 39.7 24.9 33.4 34.7 52.0 53.1 53.7 55.1 56.4 58.8
Gajapati 8.4 12.0 13.0 20.8 21.5 22.3 26.1 31.7 33.1
Ganjam 45.8 50.3 78.7 101.7 85.9 87.6 98.2 102.9 103.6 108.5
Jagatsinghapur 49.3 66.4 89.3 88.8 93.6 92.7 102.1 101.5 105.3
Jajapur 21.5 24.5 78.9 74.4 76.1 64.9 99.9 105.6 110.0
Jharsuguda 5.9 7.9 12.5 16.9 17.6 11.0 13.8 12.2 12.8
Kalahandi 22.2 19.2 28.8 27.9 42.0 43.0 47.2 51.5 50.8 53.2
Kandhamal 10.5 9.4 14.6 15.6 20.3 20.7 13.0 14.6 15.6 16.4
Kendrapara 22.4 31.2 56.3 53.6 55.3 95.1 65.5 65.2 67.9
Kendujhar 16.5 21.3 33.1 71.3 69.0 71.9 47.8 52.8 43.7 45.4
Khordha 43.4 63.7 56.0 56.2 58.4 42.4 53.0 68.4 71.6
Koraput 44.4 18.0 32.1 44.4 55.4 56.9 154.5 125.8 94.0 98.3
Malkangiri 7.7 10.9 14.6 31.5 32.1 39.4 41.4 51.1 53.8
Mayurbhanj 14.6 23.7 29.8 66.2 80.3 83.3 69.4 68.2 69.1 71.8
Nabarangapur 8.8 15.5 19.4 21.9 22.4 15.3 23.1 17.6 18.4
Nayagarh 11.9 16.0 17.4 20.0 20.4 20.7 24.4 24.8 25.7
Nuapada 7.7 9.0 11.1 25.4 25.9 15.2 16.0 27.6 28.8
Puri 96.6 59.0 83.5 91.1 102.8 107.7 99.8 108.0 126.5 132.0
Rayagada 17.9 28.1 33.4 33.8 34.6 30.9 36.8 41.8 43.9
Sambalpur 43.2 15.7 31.5 30.3 39.7 41.2 37.7 35.9 32.9 34.2
Subarnapur 5.6 12.5 25.5 52.5 54.4 31.9 41.4 39.1 40.8
Sundargarh 18.9 24.3 32.2 56.8 40.5 41.9 40.4 42.8 41.8 43.5
Source: Integrated Sample Survey reports (1992-93 to 2013-14), Directorate of Animal Husbandry and Veterinary Services, Govt. of odisha.
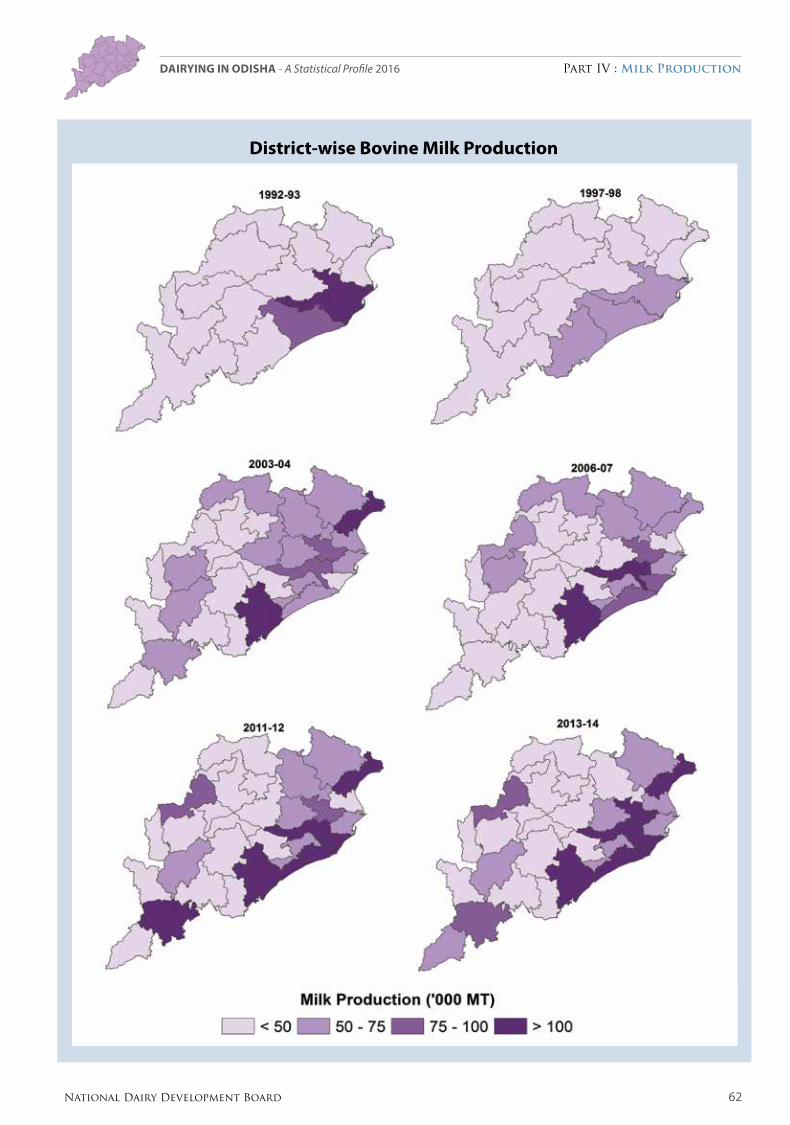
62National Dairy Development Board
Part IV : Milk ProductionDairying in ODiSHa - A Statistical Profile 2016
District-wise bovine Milk Production

63 National Dairy Development Board
Part IV : Milk ProductionDairying in ODiSHa - A Statistical Profile 2016
IV.3. Production Performance: Milk ProductionTable IV.3.2: Year and District-wise Indigenous Cattle Milk Production
DistrictsIndigenous Cattle Milk Production (‘000 MT)
1992-93 1997-98 2003-04 2006-07 2008-09 2009-10 2010-11 2011-12 2012-13 2013-14
ODISHa 275.1 292.6 320.2 611.1 712.4 718.7 727.0 734.0 794.0 828.0
Anugul 10.7 12.5 21.9 19.5 19.7 20.3 17.9 23.6 24.6
Balangir 17.8 8.8 8.5 19.0 28.2 28.5 31.8 15.2 16.4 17.1
Baleshwar 27.1 15.4 19.0 44.9 92.9 93.7 86.1 101.1 109.4 114.0
Bargarh 8.3 10.6 6.8 5.2 5.2 27.9 26.7 28.9 30.1
Baudh 4.0 5.3 13.6 11.7 11.8 8.4 11.6 12.6 13.1
Bhadrak 10.9 11.6 27.5 40.9 41.2 21.8 22.3 39.3 41.0
Cuttack 57.4 20.1 22.6 63.2 41.9 42.3 43.5 40.0 43.3 45.1
Debagarh 2.4 3.6 3.6 4.9 5.0 1.3 3.3 3.5 3.7
Dhenkanal 22.5 9.6 12.3 15.6 31.0 31.2 26.2 25.7 27.8 29.0
Gajapati 4.5 4.9 5.2 10.4 10.5 10.8 13.0 14.0 14.6
Ganjam 27.4 33.7 28.7 54.7 47.7 48.1 52.6 54.6 59.1 61.6
Jagatsinghapur 11.2 9.1 13.2 13.7 13.9 12.1 13.0 14.0 14.6
Jajapur 16.0 13.3 55.6 51.0 51.4 34.2 58.9 63.7 66.4
Jharsuguda 2.7 3.6 4.9 6.1 6.2 4.7 5.0 5.4 5.7
Kalahandi 11.2 7.2 10.3 8.8 19.4 19.5 21.1 23.1 25.0 26.1
Kandhamal 6.0 4.2 5.8 7.6 12.4 12.5 7.6 7.9 8.5 8.9
Kendrapara 12.7 11.0 23.1 29.0 29.3 52.5 31.2 33.7 35.2
Kendujhar 8.2 9.3 11.6 35.0 21.3 21.4 13.7 15.1 16.3 17.0
Khordha 18.1 19.6 21.1 22.2 22.4 16.5 19.5 21.1 22.0
Koraput 21.8 7.2 8.0 11.9 15.5 15.6 76.0 54.0 43.3 45.1
Malkangiri 4.7 5.8 11.3 17.6 17.8 18.4 22.8 24.7 25.7
Mayurbhanj 10.7 13.2 13.5 33.9 31.3 31.5 26.7 25.3 27.4 28.6
Nabarangapur 4.5 5.5 8.1 12.1 12.2 8.4 9.5 10.3 10.7
Nayagarh 8.4 9.0 10.7 12.9 13.0 13.6 16.5 17.9 18.6
Nuapada 4.7 3.8 5.9 19.0 19.2 7.2 10.3 11.1 11.6
Puri 33.5 12.8 14.1 23.0 25.1 25.3 23.8 25.4 27.5 28.7
Rayagada 7.3 9.1 16.8 16.4 16.6 16.4 18.1 19.6 20.4
Sambalpur 22.3 7.3 10.2 10.3 17.1 17.3 15.7 13.7 10.7 11.1
Subarnapur 2.6 4.5 7.3 21.5 21.7 12.8 17.8 19.2 20.1
Sundargarh 9.2 10.0 12.9 26.6 14.5 14.7 14.9 15.6 16.9 17.6
Source: Integrated Sample Survey reports (1992-93 to 2013-14), Directorate of Animal Husbandry and Veterinary Services, Govt. of odisha.

64National Dairy Development Board
Part IV : Milk ProductionDairying in ODiSHa - A Statistical Profile 2016
District-wise Indigenous Cattle Milk Production
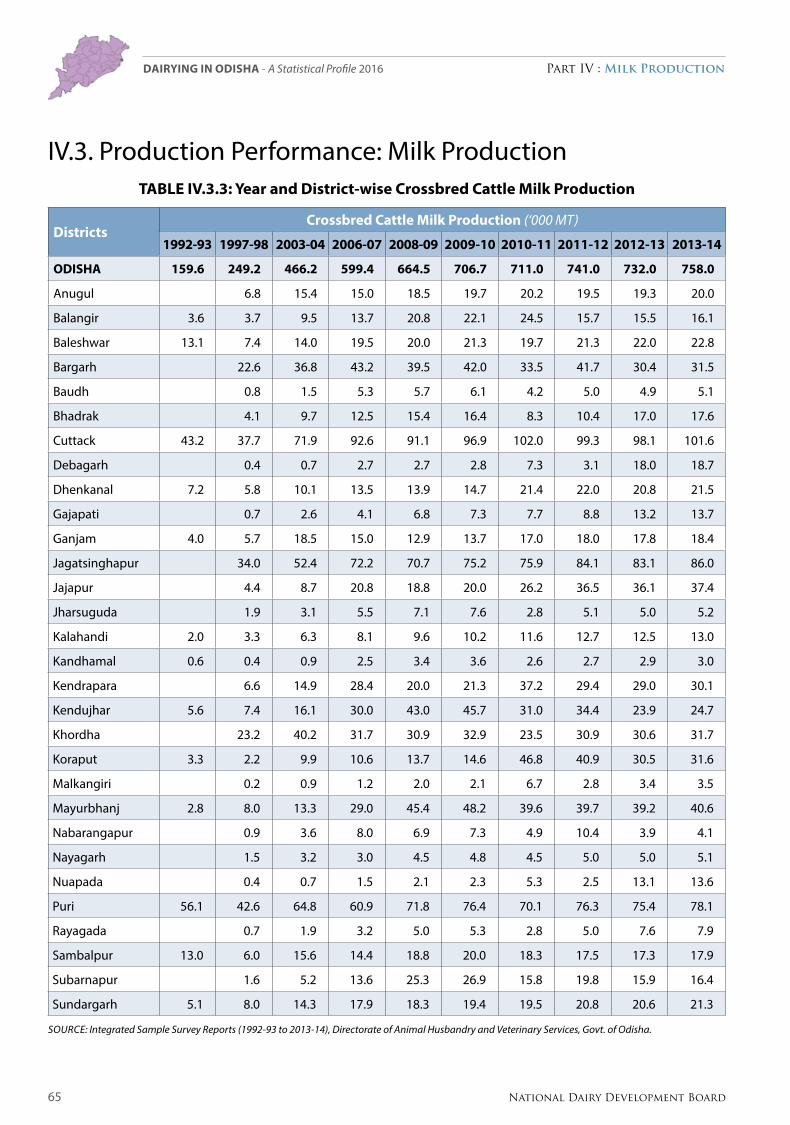
65 National Dairy Development Board
Part IV : Milk ProductionDairying in ODiSHa - A Statistical Profile 2016
IV.3. Production Performance: Milk ProductionTable IV.3.3: Year and District-wise Crossbred Cattle Milk Production
DistrictsCrossbred Cattle Milk Production (‘000 MT)
1992-93 1997-98 2003-04 2006-07 2008-09 2009-10 2010-11 2011-12 2012-13 2013-14
ODISHa 159.6 249.2 466.2 599.4 664.5 706.7 711.0 741.0 732.0 758.0
Anugul 6.8 15.4 15.0 18.5 19.7 20.2 19.5 19.3 20.0
Balangir 3.6 3.7 9.5 13.7 20.8 22.1 24.5 15.7 15.5 16.1
Baleshwar 13.1 7.4 14.0 19.5 20.0 21.3 19.7 21.3 22.0 22.8
Bargarh 22.6 36.8 43.2 39.5 42.0 33.5 41.7 30.4 31.5
Baudh 0.8 1.5 5.3 5.7 6.1 4.2 5.0 4.9 5.1
Bhadrak 4.1 9.7 12.5 15.4 16.4 8.3 10.4 17.0 17.6
Cuttack 43.2 37.7 71.9 92.6 91.1 96.9 102.0 99.3 98.1 101.6
Debagarh 0.4 0.7 2.7 2.7 2.8 7.3 3.1 18.0 18.7
Dhenkanal 7.2 5.8 10.1 13.5 13.9 14.7 21.4 22.0 20.8 21.5
Gajapati 0.7 2.6 4.1 6.8 7.3 7.7 8.8 13.2 13.7
Ganjam 4.0 5.7 18.5 15.0 12.9 13.7 17.0 18.0 17.8 18.4
Jagatsinghapur 34.0 52.4 72.2 70.7 75.2 75.9 84.1 83.1 86.0
Jajapur 4.4 8.7 20.8 18.8 20.0 26.2 36.5 36.1 37.4
Jharsuguda 1.9 3.1 5.5 7.1 7.6 2.8 5.1 5.0 5.2
Kalahandi 2.0 3.3 6.3 8.1 9.6 10.2 11.6 12.7 12.5 13.0
Kandhamal 0.6 0.4 0.9 2.5 3.4 3.6 2.6 2.7 2.9 3.0
Kendrapara 6.6 14.9 28.4 20.0 21.3 37.2 29.4 29.0 30.1
Kendujhar 5.6 7.4 16.1 30.0 43.0 45.7 31.0 34.4 23.9 24.7
Khordha 23.2 40.2 31.7 30.9 32.9 23.5 30.9 30.6 31.7
Koraput 3.3 2.2 9.9 10.6 13.7 14.6 46.8 40.9 30.5 31.6
Malkangiri 0.2 0.9 1.2 2.0 2.1 6.7 2.8 3.4 3.5
Mayurbhanj 2.8 8.0 13.3 29.0 45.4 48.2 39.6 39.7 39.2 40.6
Nabarangapur 0.9 3.6 8.0 6.9 7.3 4.9 10.4 3.9 4.1
Nayagarh 1.5 3.2 3.0 4.5 4.8 4.5 5.0 5.0 5.1
Nuapada 0.4 0.7 1.5 2.1 2.3 5.3 2.5 13.1 13.6
Puri 56.1 42.6 64.8 60.9 71.8 76.4 70.1 76.3 75.4 78.1
Rayagada 0.7 1.9 3.2 5.0 5.3 2.8 5.0 7.6 7.9
Sambalpur 13.0 6.0 15.6 14.4 18.8 20.0 18.3 17.5 17.3 17.9
Subarnapur 1.6 5.2 13.6 25.3 26.9 15.8 19.8 15.9 16.4
Sundargarh 5.1 8.0 14.3 17.9 18.3 19.4 19.5 20.8 20.6 21.3
Source: Integrated Sample Survey reports (1992-93 to 2013-14), Directorate of Animal Husbandry and Veterinary Services, Govt. of odisha.

66National Dairy Development Board
Part IV : Milk ProductionDairying in ODiSHa - A Statistical Profile 2016
District-wise Crossbred Cattle Milk Production
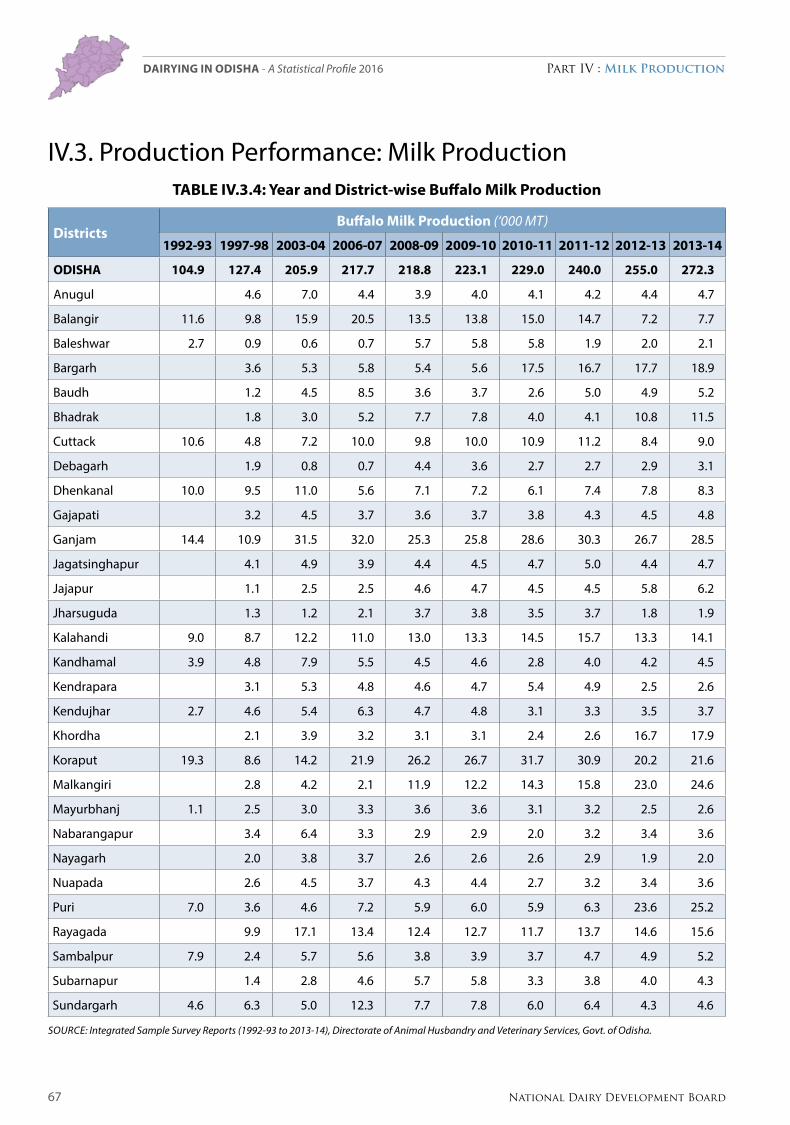
67 National Dairy Development Board
Part IV : Milk ProductionDairying in ODiSHa - A Statistical Profile 2016
IV.3. Production Performance: Milk ProductionTable IV.3.4: Year and District-wise buffalo Milk Production
Districtsbuffalo Milk Production (‘000 MT)
1992-93 1997-98 2003-04 2006-07 2008-09 2009-10 2010-11 2011-12 2012-13 2013-14
ODISHa 104.9 127.4 205.9 217.7 218.8 223.1 229.0 240.0 255.0 272.3
Anugul 4.6 7.0 4.4 3.9 4.0 4.1 4.2 4.4 4.7
Balangir 11.6 9.8 15.9 20.5 13.5 13.8 15.0 14.7 7.2 7.7
Baleshwar 2.7 0.9 0.6 0.7 5.7 5.8 5.8 1.9 2.0 2.1
Bargarh 3.6 5.3 5.8 5.4 5.6 17.5 16.7 17.7 18.9
Baudh 1.2 4.5 8.5 3.6 3.7 2.6 5.0 4.9 5.2
Bhadrak 1.8 3.0 5.2 7.7 7.8 4.0 4.1 10.8 11.5
Cuttack 10.6 4.8 7.2 10.0 9.8 10.0 10.9 11.2 8.4 9.0
Debagarh 1.9 0.8 0.7 4.4 3.6 2.7 2.7 2.9 3.1
Dhenkanal 10.0 9.5 11.0 5.6 7.1 7.2 6.1 7.4 7.8 8.3
Gajapati 3.2 4.5 3.7 3.6 3.7 3.8 4.3 4.5 4.8
Ganjam 14.4 10.9 31.5 32.0 25.3 25.8 28.6 30.3 26.7 28.5
Jagatsinghapur 4.1 4.9 3.9 4.4 4.5 4.7 5.0 4.4 4.7
Jajapur 1.1 2.5 2.5 4.6 4.7 4.5 4.5 5.8 6.2
Jharsuguda 1.3 1.2 2.1 3.7 3.8 3.5 3.7 1.8 1.9
Kalahandi 9.0 8.7 12.2 11.0 13.0 13.3 14.5 15.7 13.3 14.1
Kandhamal 3.9 4.8 7.9 5.5 4.5 4.6 2.8 4.0 4.2 4.5
Kendrapara 3.1 5.3 4.8 4.6 4.7 5.4 4.9 2.5 2.6
Kendujhar 2.7 4.6 5.4 6.3 4.7 4.8 3.1 3.3 3.5 3.7
Khordha 2.1 3.9 3.2 3.1 3.1 2.4 2.6 16.7 17.9
Koraput 19.3 8.6 14.2 21.9 26.2 26.7 31.7 30.9 20.2 21.6
Malkangiri 2.8 4.2 2.1 11.9 12.2 14.3 15.8 23.0 24.6
Mayurbhanj 1.1 2.5 3.0 3.3 3.6 3.6 3.1 3.2 2.5 2.6
Nabarangapur 3.4 6.4 3.3 2.9 2.9 2.0 3.2 3.4 3.6
Nayagarh 2.0 3.8 3.7 2.6 2.6 2.6 2.9 1.9 2.0
Nuapada 2.6 4.5 3.7 4.3 4.4 2.7 3.2 3.4 3.6
Puri 7.0 3.6 4.6 7.2 5.9 6.0 5.9 6.3 23.6 25.2
Rayagada 9.9 17.1 13.4 12.4 12.7 11.7 13.7 14.6 15.6
Sambalpur 7.9 2.4 5.7 5.6 3.8 3.9 3.7 4.7 4.9 5.2
Subarnapur 1.4 2.8 4.6 5.7 5.8 3.3 3.8 4.0 4.3
Sundargarh 4.6 6.3 5.0 12.3 7.7 7.8 6.0 6.4 4.3 4.6
Source: Integrated Sample Survey reports (1992-93 to 2013-14), Directorate of Animal Husbandry and Veterinary Services, Govt. of odisha.
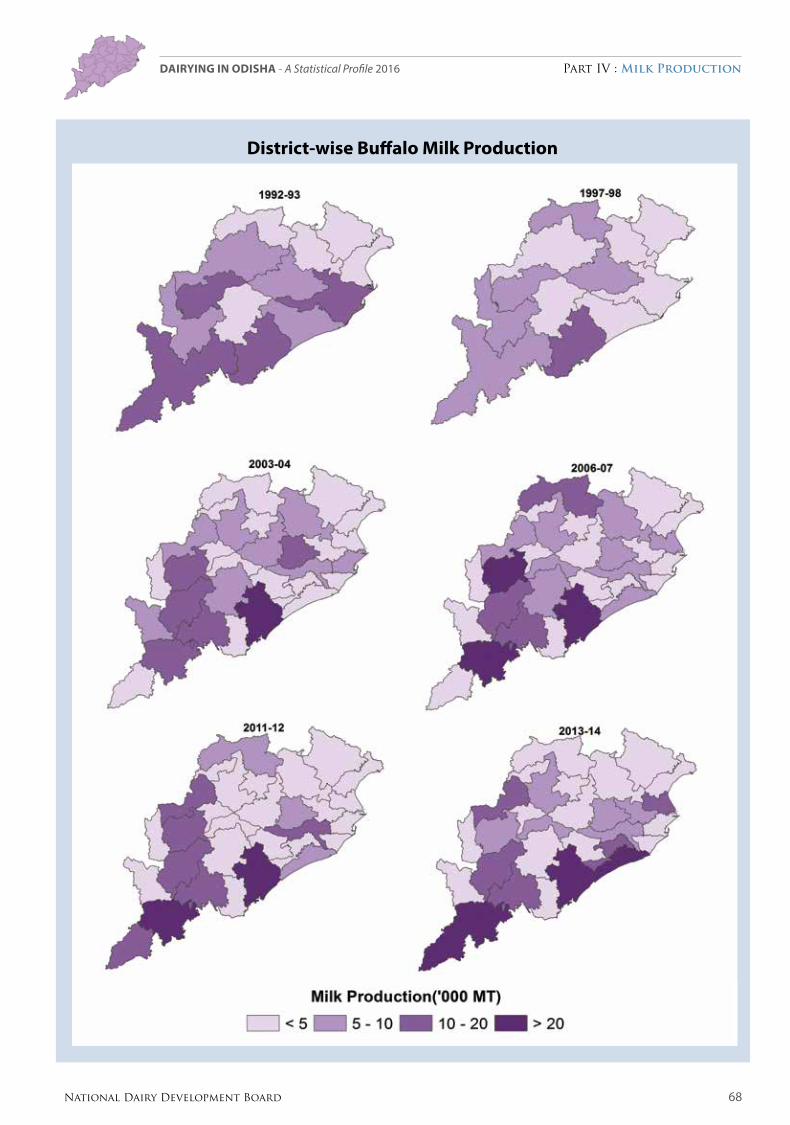
68National Dairy Development Board
Part IV : Milk ProductionDairying in ODiSHa - A Statistical Profile 2016
District-wise buffalo Milk Production
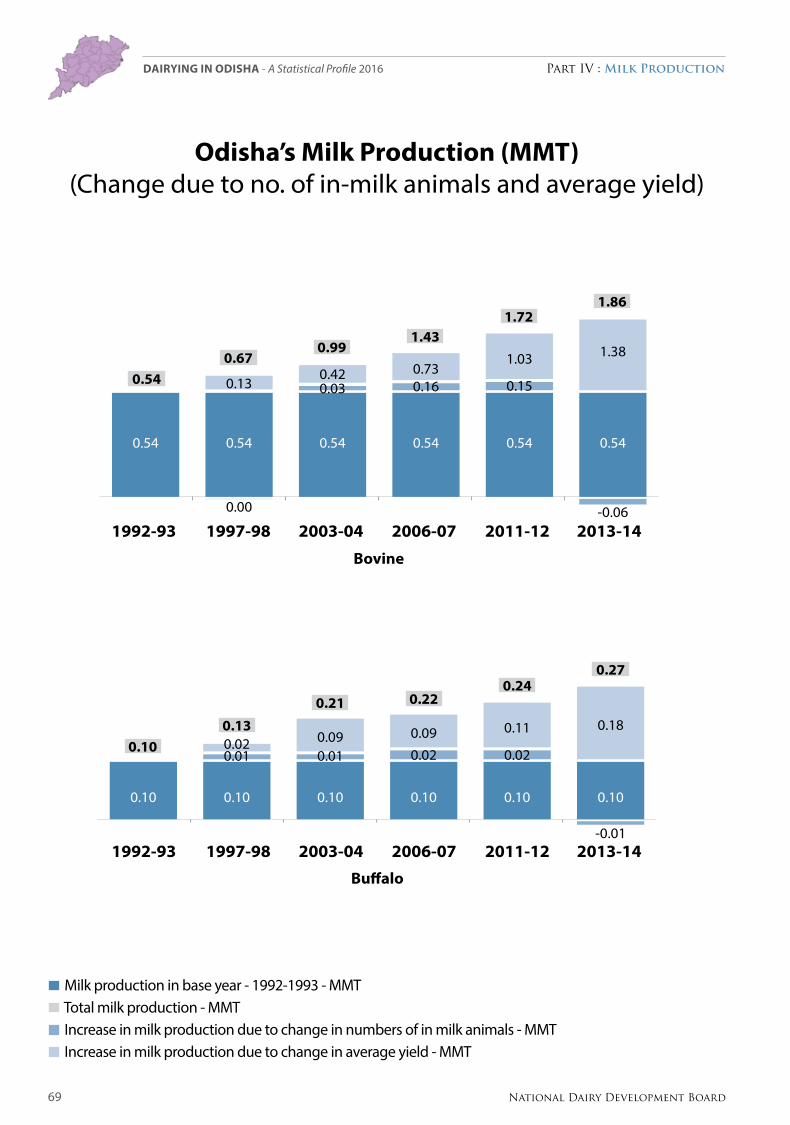
69 National Dairy Development Board
Part IV : Milk ProductionDairying in ODiSHa - A Statistical Profile 2016
Odisha’s Milk Production (MMT) (Change due to no. of in-milk animals and average yield)
0.540.540.540.540.54
0.670.99
1.431.72
1.86
0.00 -0.06
0.130.42 0.73
1.03 1.38
0.03 0.16 0.15
0.54
0.54
bovine
1992-93 1997-98 2003-04 2006-07 2011-12 2013-14
Milk production in base year - 1992-1993 - MMT Total milk production - MMT Increase in milk production due to change in numbers of in milk animals - MMT Increase in milk production due to change in average yield - MMT
buffalo
0.130.21 0.22
0.240.27
0.180.10
-0.011992-93 1997-98 2003-04 2006-07 2011-12 2013-14
0.02 0.09 0.09 0.11
0.01 0.01 0.02 0.02
0.100.100.100.100.100.10
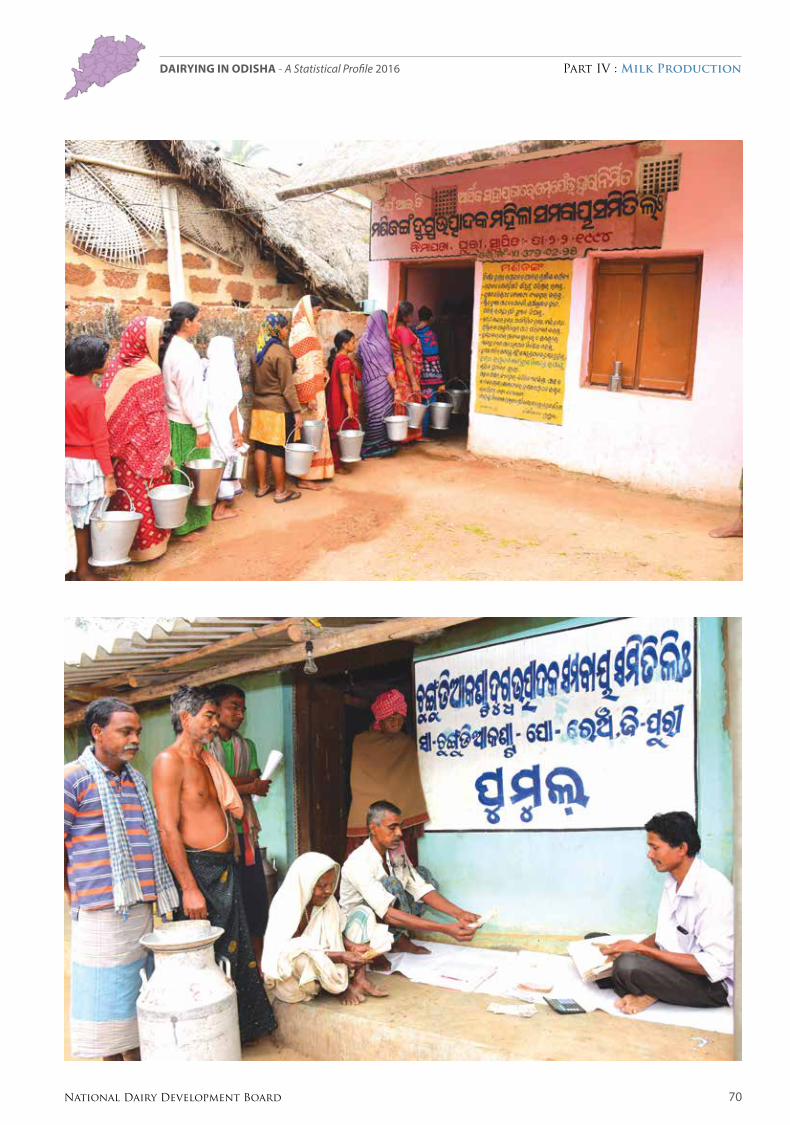
70National Dairy Development Board
Part IV : Milk ProductionDairying in ODiSHa - A Statistical Profile 2016
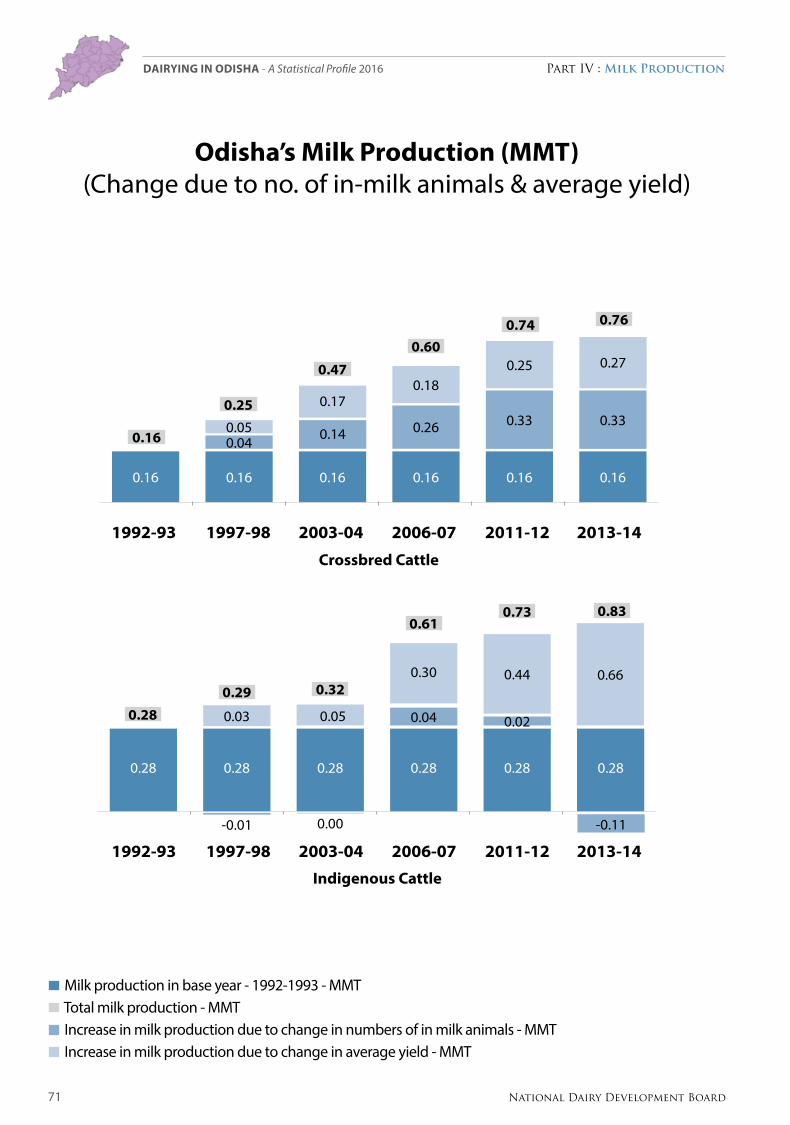
71 National Dairy Development Board
Part IV : Milk ProductionDairying in ODiSHa - A Statistical Profile 2016
Odisha’s Milk Production (MMT) (Change due to no. of in-milk animals & average yield)
Milk production in base year - 1992-1993 - MMT Total milk production - MMT Increase in milk production due to change in numbers of in milk animals - MMT Increase in milk production due to change in average yield - MMT
0.83
Indigenous Cattle
0.280.28
0.73
0.28
0.61
0.28
0.32
0.28
0.29
-0.11
0.04 0.02
-0.01 0.00
0.30 0.44 0.66
0.050.03
0.28
0.28
1992-93 1997-98 2003-04 2006-07 2011-12 2013-14
0.160.16
0.74 0.76
0.16
0.60
0.16
0.47
0.16
0.250.33 0.33
0.25 0.27
0.040.05
0.170.18
0.14 0.26
0.16
0.16
Crossbred Cattle
1992-93 1997-98 2003-04 2006-07 2011-12 2013-14

72National Dairy Development Board
Part IV : Milk ProductionDairying in ODiSHa - A Statistical Profile 2016

73 National Dairy Development Board
Part IV : Milk ProductionDairying in ODiSHa - A Statistical Profile 2016
IV.3. Production Performance: Milk ProductionTable IV.3.5: Year and District-wise Total Milk Production Density
DistrictsMilk Production Density (Kg/day/sq km)
1992-93 1997-98 2003-04 2006-07 2008-09 2009-10 2010-11 2011-12 2012-13 2013-14
ODISHa 9 12 17 25 28 29 29 30 31 33
Anugul 9 15 18 18 19 19 18 20 21
Balangir 10 9 14 22 26 27 30 19 16 17
Baleshwar 19 17 24 47 85 87 80 89 96 100
Bargarh 16 25 26 24 25 37 40 36 38
Baudh 5 10 24 19 19 13 19 20 21
Bhadrak 18 27 49 70 72 37 40 73 77
Cuttack 27 44 71 116 99 104 109 105 104 108
Debagarh 4 5 7 11 11 11 8 23 24
Dhenkanal 10 15 21 21 32 33 33 34 35 36
Gajapati 5 8 8 13 14 14 16 20 21
Ganjam 10 17 26 34 29 29 33 34 35 36
Jagatsinghapur 81 109 147 146 154 152 168 167 173
Jajapur 20 23 75 70 72 61 94 100 104
Jharsuguda 8 10 16 22 23 14 18 16 17
Kalahandi 5 7 10 10 14 15 16 18 18 18
Kandhamal 3 3 5 5 7 7 4 5 5 6
Kendrapara 23 32 58 56 57 99 68 68 70
Kendujhar 5 7 11 24 23 24 16 17 14 15
Khordha 42 62 55 55 57 41 52 67 70
Koraput 5 6 10 14 17 18 48 39 29 31
Malkangiri 4 5 7 15 15 19 20 24 25
Mayurbhanj 4 6 8 17 21 22 18 18 18 19
Nabarangapur 5 8 10 11 12 8 12 9 10
Nayagarh 8 11 12 14 14 15 17 17 18
Nuapada 5 6 8 18 18 11 11 20 20
Puri 26 46 66 72 81 85 79 85 100 104
Rayagada 7 11 13 13 13 12 14 16 17
Sambalpur 7 6 13 12 16 17 16 15 14 14
Subarnapur 7 15 30 62 64 37 48 46 48
Sundargarh 5 7 9 16 11 12 11 12 12 12
Source: estimated from Integrated Sample Survey reports (1992-93 to 2013-14), Directorate of Animal Husbandry and Veterinary Services, Govt. of odisha.
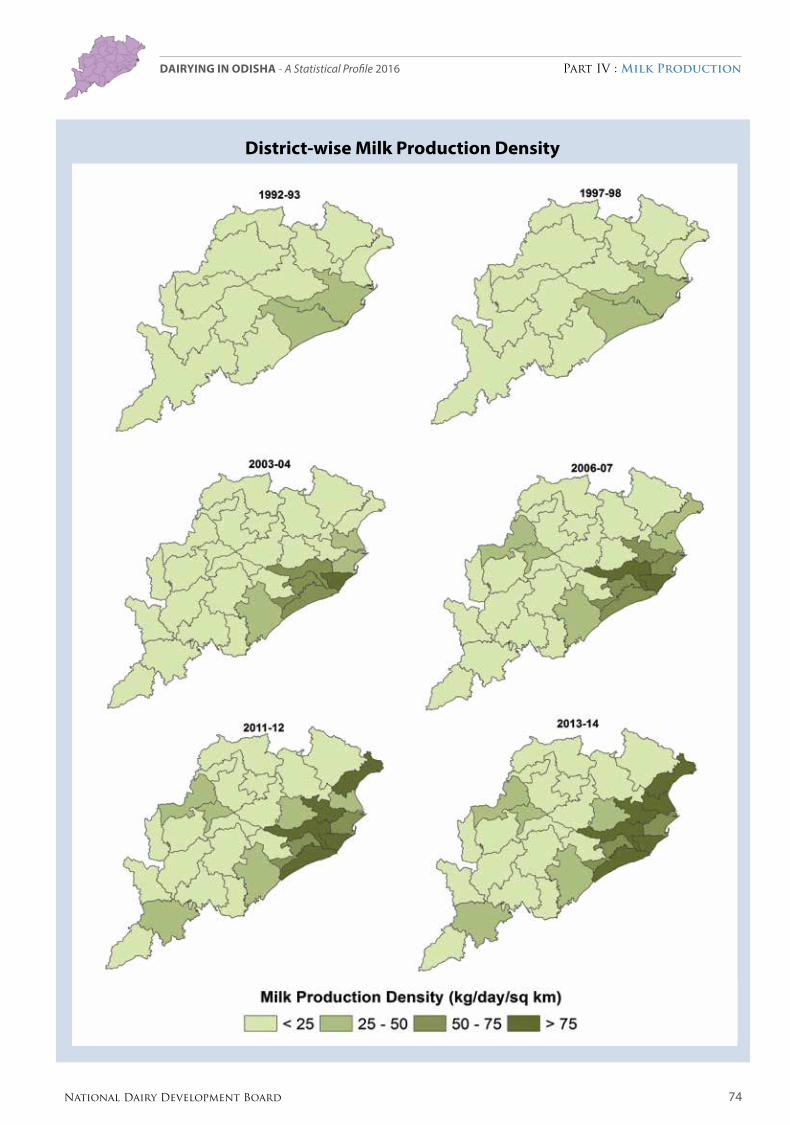
74National Dairy Development Board
Part IV : Milk ProductionDairying in ODiSHa - A Statistical Profile 2016
District-wise Milk Production Density

75 National Dairy Development Board
Part IV : Milk ProductionDairying in ODiSHa - A Statistical Profile 2016
IV.4. Production Performance: Milk AvailabilityTable IV.4.1: Year and District-wise Per Capita Milk availability
DistrictsPer Capita availability of Milk (grams/day)
1992-93 1997-98 2003-04 2006-07 2008-09 2009-10 2010-11 2011-12 2012-13 2013-14
ODISHa 46 53 72 100 108 110 110 112 115 118
Anugul 56 82 94 93 95 97 89 101 104
Balangir 52 48 67 98 111 111 121 76 64 65
Baleshwar 41 35 44 82 146 147 134 147 155 160
Bargarh 75 105 108 95 100 147 157 141 146
Baudh 47 80 185 137 138 96 134 137 141
Bhadrak 37 49 87 121 122 63 67 120 124
Cuttack 54 77 116 183 154 159 165 157 155 159
Debagarh 50 50 65 109 102 100 80 212 216
Dhenkanal 54 67 84 85 123 125 125 127 128 132
Gajapati 47 62 65 102 104 107 123 149 154
Ganjam 39 46 67 83 69 70 77 80 80 82
Jagatsinghapur 135 169 223 219 229 225 246 243 250
Jajapur 38 40 125 116 117 98 150 157 161
Jharsuguda 34 41 63 83 85 53 65 57 59
Kalahandi 38 42 57 52 77 77 83 89 87 89
Kandhamal 33 43 60 62 79 79 49 54 58 60
Kendrapara 50 64 113 105 107 183 125 123 126
Kendujhar 33 40 56 116 109 112 74 80 65 67
Khordha 68 90 75 72 74 53 64 82 84
Koraput 40 45 72 95 115 117 312 250 184 189
Malkangiri 45 57 71 150 149 180 185 224 231
Mayurbhanj 21 31 36 77 91 93 77 74 74 76
Nabarangapur 25 40 48 52 52 35 52 39 40
Nayagarh 40 50 53 59 59 60 69 70 72
Nuapada 42 45 53 119 119 69 71 122 126
Puri 72 115 149 156 172 178 163 174 202 208
Rayagada 63 90 102 100 101 89 104 117 121
Sambalpur 44 49 90 84 108 111 100 94 85 88
Subarnapur 29 62 122 244 251 145 185 174 179
Sundargarh 32 39 47 79 55 56 54 56 54 55
Source: estimated from Integrated Sample Survey reports (1992-93 to 2013-14), Directorate of Animal Husbandry and Veterinary Services, Govt. of odisha.
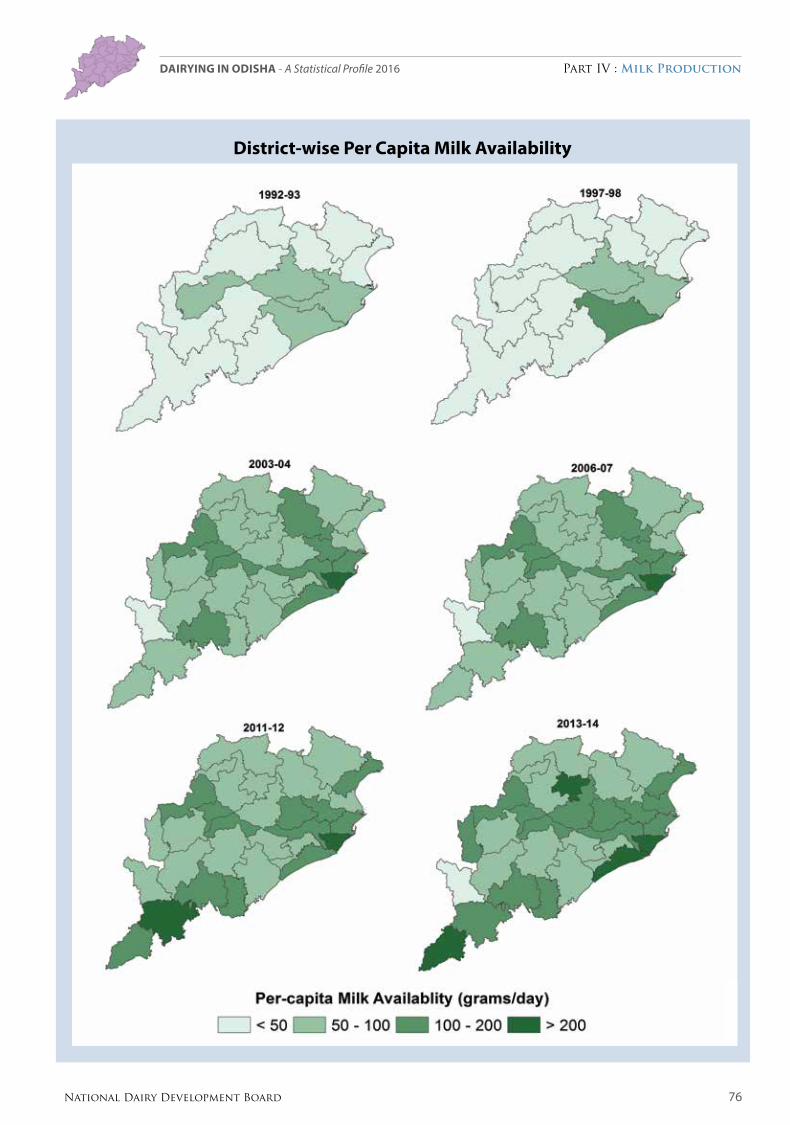
76National Dairy Development Board
Part IV : Milk ProductionDairying in ODiSHa - A Statistical Profile 2016
District-wise Per Capita Milk availability
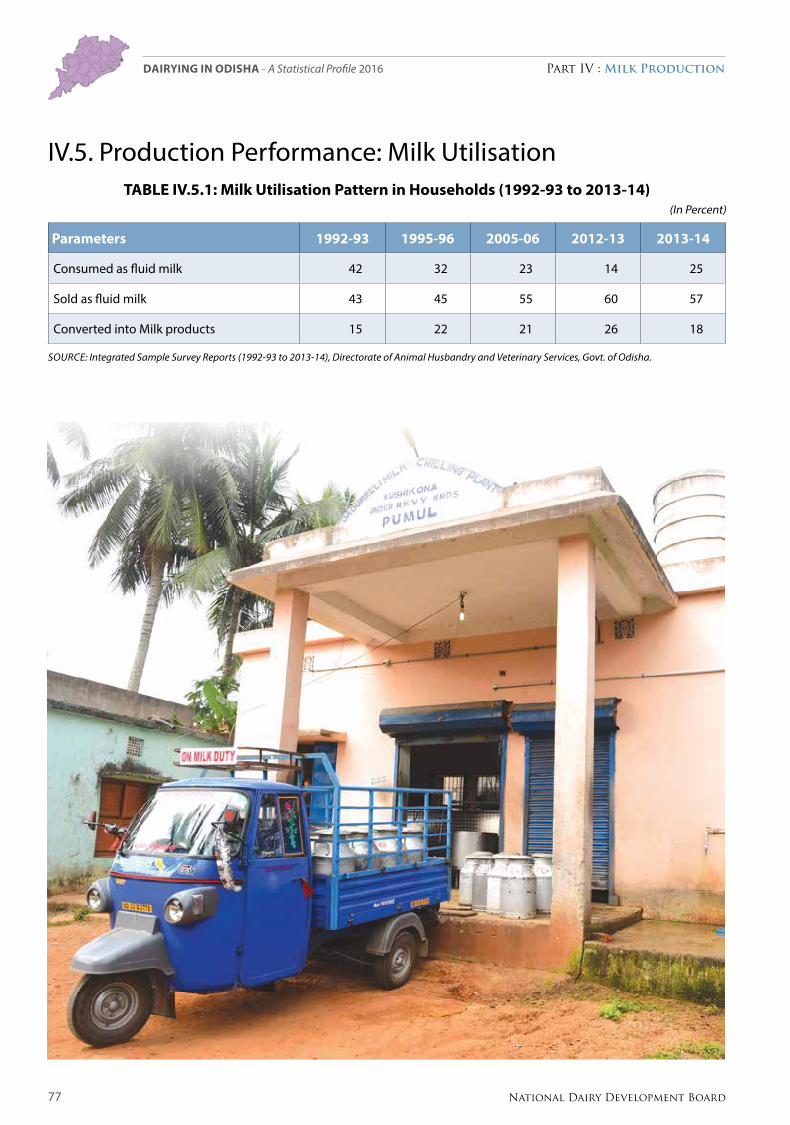
77 National Dairy Development Board
Part IV : Milk ProductionDairying in ODiSHa - A Statistical Profile 2016
IV.5. Production Performance: Milk UtilisationTable IV.5.1: Milk Utilisation Pattern in Households (1992-93 to 2013-14)
(In Percent)
Parameters 1992-93 1995-96 2005-06 2012-13 2013-14
Consumed as fluid milk 42 32 23 14 25
Sold as fluid milk 43 45 55 60 57
Converted into Milk products 15 22 21 26 18
Source: Integrated Sample Survey reports (1992-93 to 2013-14), Directorate of Animal Husbandry and Veterinary Services, Govt. of odisha.
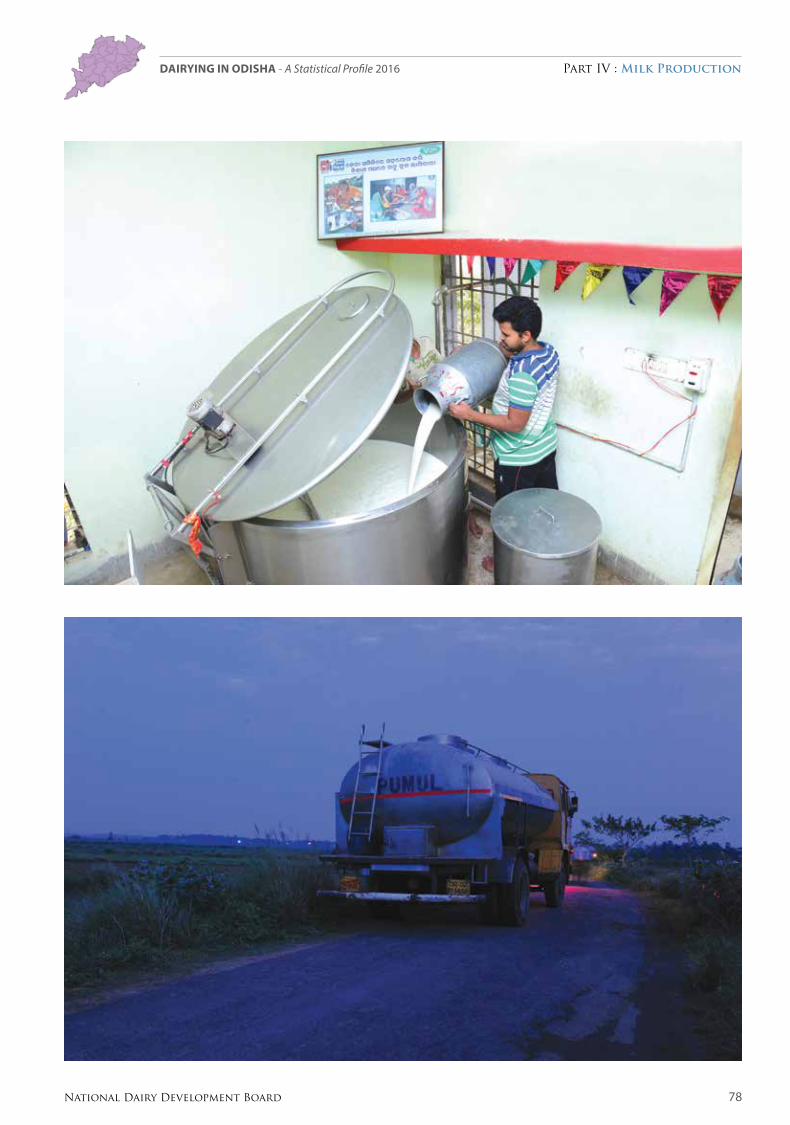
78National Dairy Development Board
Part IV : Milk ProductionDairying in ODiSHa - A Statistical Profile 2016

Part V : Veterinary Infrastructure And Service Delivery System
The State has devised several strategies for improving veterinary infrastructure and service delivery system. To this end, animal health care is being provided through a network of 540 veterinary hospitals & dispensaries and 2,939 Livestock Aid Centres (LAC) at Gram Panchayat level. Beside these, two Biological Products Institutes are functional at Bhubaneswar and Berhampur to provide different vaccines needed for the Disease Control Programme in the State.
Artificial insemination is a thrust area for dairy development and is being rendered through a network of 5,826 AI centres in the State. Special attention has been given for production of quality frozen semen for insemination purpose and accordingly activities at the Frozen Semen Bank (FSB) located at Cuttack has been strengthened with rearing of 39 Jersey, 18 Cross-bred, 16 Red-Sindhi and 12 Haryana donating breeding bulls. In addition, special infertility camps are organized in the state. Moreover, there are farms in the State to produce high pedigree bull calves.
A livestock insurance scheme covering 45,000 animals in 30 districts has been put in place and the premium of the insurance is subsidized to the tune of 50 per cent.
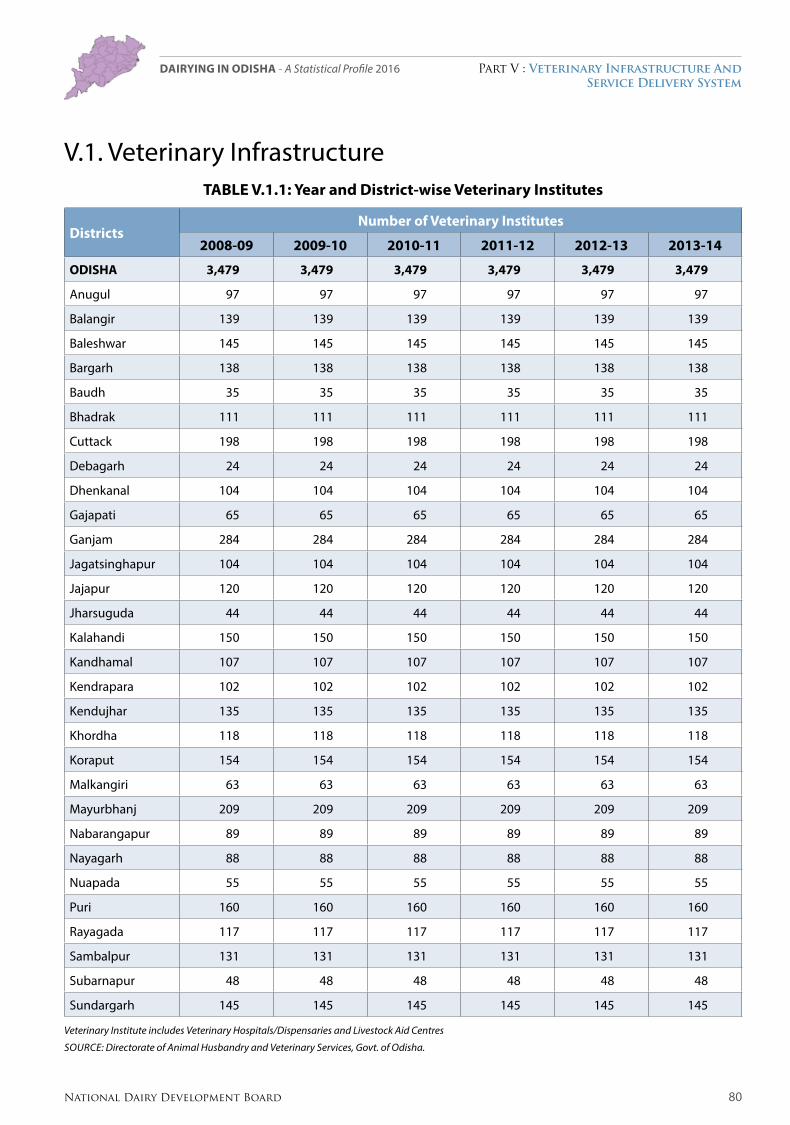
80National Dairy Development Board
Part V : Veterinary Infrastructure And Service Delivery System
Dairying in ODiSHa - A Statistical Profile 2016
V.1. Veterinary Infrastructure TABLE V.1.1: Year and District-wise Veterinary Institutes
DistrictsNumber of Veterinary Institutes
2008-09 2009-10 2010-11 2011-12 2012-13 2013-14
ODISHA 3,479 3,479 3,479 3,479 3,479 3,479
Anugul 97 97 97 97 97 97
Balangir 139 139 139 139 139 139
Baleshwar 145 145 145 145 145 145
Bargarh 138 138 138 138 138 138
Baudh 35 35 35 35 35 35
Bhadrak 111 111 111 111 111 111
Cuttack 198 198 198 198 198 198
Debagarh 24 24 24 24 24 24
Dhenkanal 104 104 104 104 104 104
Gajapati 65 65 65 65 65 65
Ganjam 284 284 284 284 284 284
Jagatsinghapur 104 104 104 104 104 104
Jajapur 120 120 120 120 120 120
Jharsuguda 44 44 44 44 44 44
Kalahandi 150 150 150 150 150 150
Kandhamal 107 107 107 107 107 107
Kendrapara 102 102 102 102 102 102
Kendujhar 135 135 135 135 135 135
Khordha 118 118 118 118 118 118
Koraput 154 154 154 154 154 154
Malkangiri 63 63 63 63 63 63
Mayurbhanj 209 209 209 209 209 209
Nabarangapur 89 89 89 89 89 89
Nayagarh 88 88 88 88 88 88
Nuapada 55 55 55 55 55 55
Puri 160 160 160 160 160 160
Rayagada 117 117 117 117 117 117
Sambalpur 131 131 131 131 131 131
Subarnapur 48 48 48 48 48 48
Sundargarh 145 145 145 145 145 145
Veterinary Institute includes Veterinary Hospitals/Dispensaries and Livestock Aid Centres
SourCe: Directorate of Animal Husbandry and Veterinary Services, Govt. of odisha.
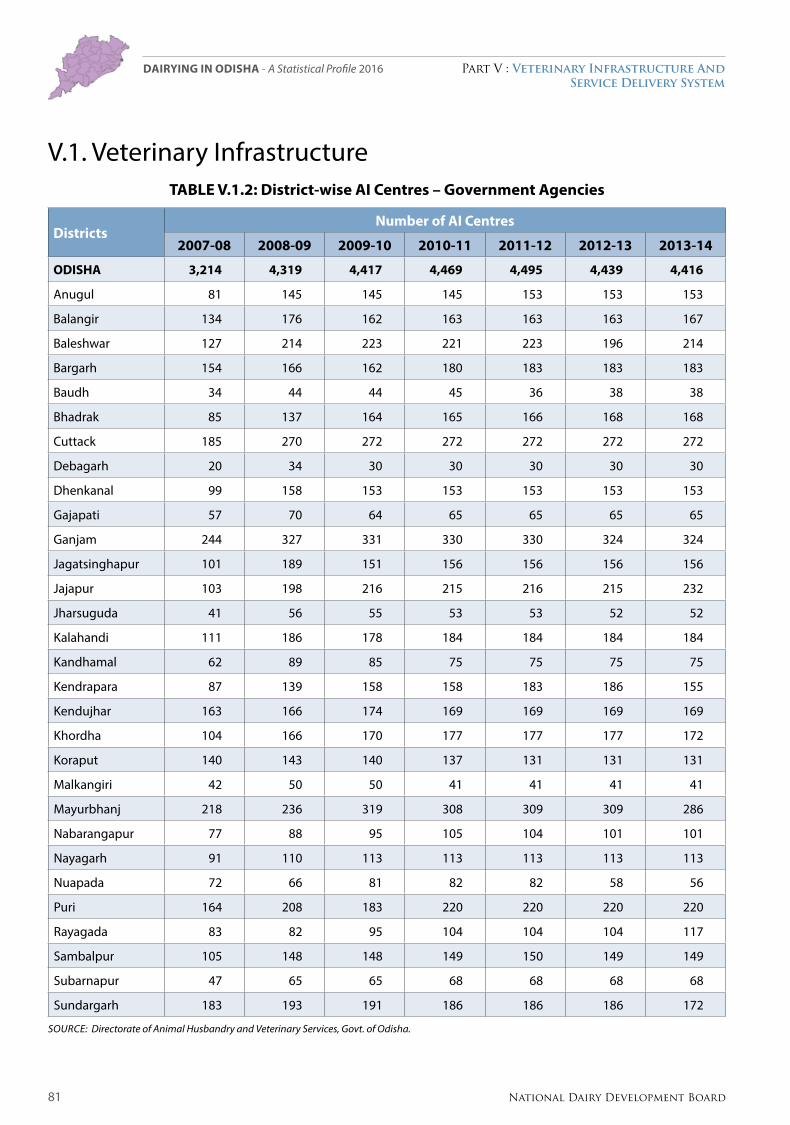
81 National Dairy Development Board
Part V : Veterinary Infrastructure And Service Delivery System
Dairying in ODiSHa - A Statistical Profile 2016
V.1. Veterinary Infrastructure TABLE V.1.2: District-wise AI Centres – Government Agencies
DistrictsNumber of AI Centres
2007-08 2008-09 2009-10 2010-11 2011-12 2012-13 2013-14
ODISHA 3,214 4,319 4,417 4,469 4,495 4,439 4,416
Anugul 81 145 145 145 153 153 153
Balangir 134 176 162 163 163 163 167
Baleshwar 127 214 223 221 223 196 214
Bargarh 154 166 162 180 183 183 183
Baudh 34 44 44 45 36 38 38
Bhadrak 85 137 164 165 166 168 168
Cuttack 185 270 272 272 272 272 272
Debagarh 20 34 30 30 30 30 30
Dhenkanal 99 158 153 153 153 153 153
Gajapati 57 70 64 65 65 65 65
Ganjam 244 327 331 330 330 324 324
Jagatsinghapur 101 189 151 156 156 156 156
Jajapur 103 198 216 215 216 215 232
Jharsuguda 41 56 55 53 53 52 52
Kalahandi 111 186 178 184 184 184 184
Kandhamal 62 89 85 75 75 75 75
Kendrapara 87 139 158 158 183 186 155
Kendujhar 163 166 174 169 169 169 169
Khordha 104 166 170 177 177 177 172
Koraput 140 143 140 137 131 131 131
Malkangiri 42 50 50 41 41 41 41
Mayurbhanj 218 236 319 308 309 309 286
Nabarangapur 77 88 95 105 104 101 101
Nayagarh 91 110 113 113 113 113 113
Nuapada 72 66 81 82 82 58 56
Puri 164 208 183 220 220 220 220
Rayagada 83 82 95 104 104 104 117
Sambalpur 105 148 148 149 150 149 149
Subarnapur 47 65 65 68 68 68 68
Sundargarh 183 193 191 186 186 186 172
SourCe: Directorate of Animal Husbandry and Veterinary Services, Govt. of odisha.
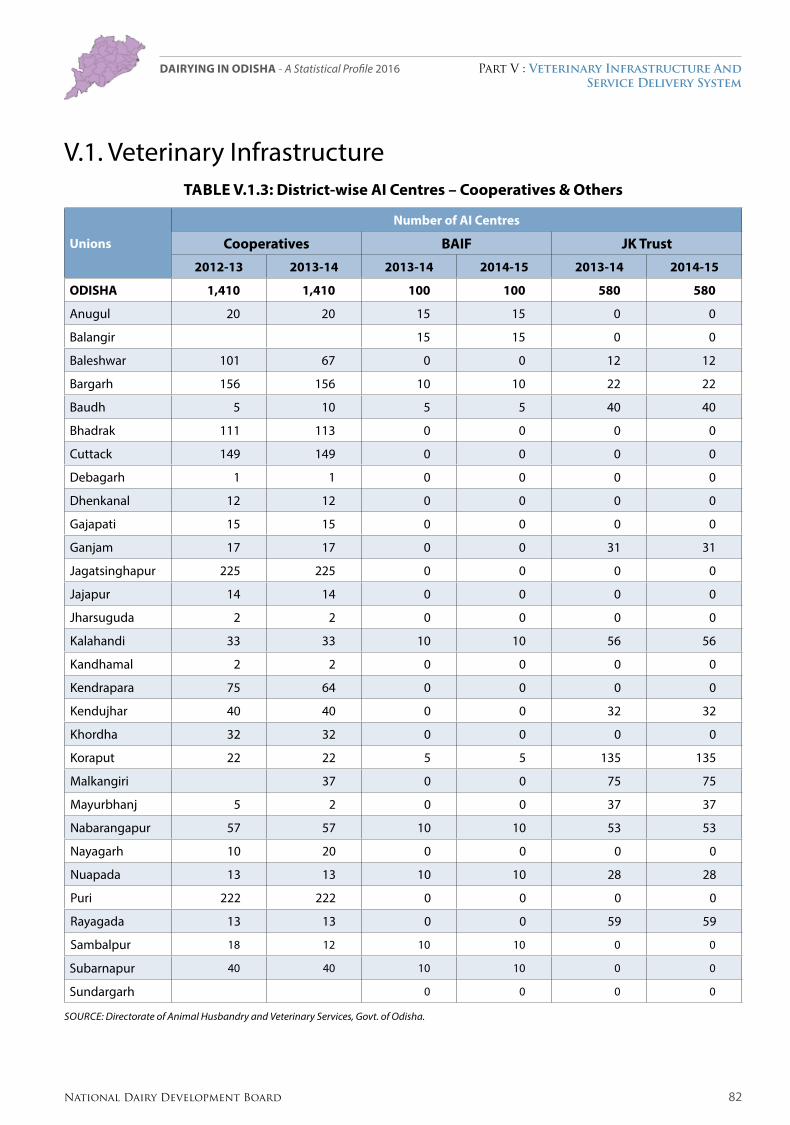
82National Dairy Development Board
Part V : Veterinary Infrastructure And Service Delivery System
Dairying in ODiSHa - A Statistical Profile 2016
V.1. Veterinary Infrastructure TABLE V.1.3: District-wise AI Centres – Cooperatives & Others
Unions
Number of AI Centres
Cooperatives BAIF JK Trust
2012-13 2013-14 2013-14 2014-15 2013-14 2014-15
ODISHA 1,410 1,410 100 100 580 580
Anugul 20 20 15 15 0 0
Balangir 15 15 0 0
Baleshwar 101 67 0 0 12 12
Bargarh 156 156 10 10 22 22
Baudh 5 10 5 5 40 40
Bhadrak 111 113 0 0 0 0
Cuttack 149 149 0 0 0 0
Debagarh 1 1 0 0 0 0
Dhenkanal 12 12 0 0 0 0
Gajapati 15 15 0 0 0 0
Ganjam 17 17 0 0 31 31
Jagatsinghapur 225 225 0 0 0 0
Jajapur 14 14 0 0 0 0
Jharsuguda 2 2 0 0 0 0
Kalahandi 33 33 10 10 56 56
Kandhamal 2 2 0 0 0 0
Kendrapara 75 64 0 0 0 0
Kendujhar 40 40 0 0 32 32
Khordha 32 32 0 0 0 0
Koraput 22 22 5 5 135 135
Malkangiri 37 0 0 75 75
Mayurbhanj 5 2 0 0 37 37
Nabarangapur 57 57 10 10 53 53
Nayagarh 10 20 0 0 0 0
Nuapada 13 13 10 10 28 28
Puri 222 222 0 0 0 0
Rayagada 13 13 0 0 59 59
Sambalpur 18 12 10 10 0 0
Subarnapur 40 40 10 10 0 0
Sundargarh 0 0 0 0
SourCe: Directorate of Animal Husbandry and Veterinary Services, Govt. of odisha.
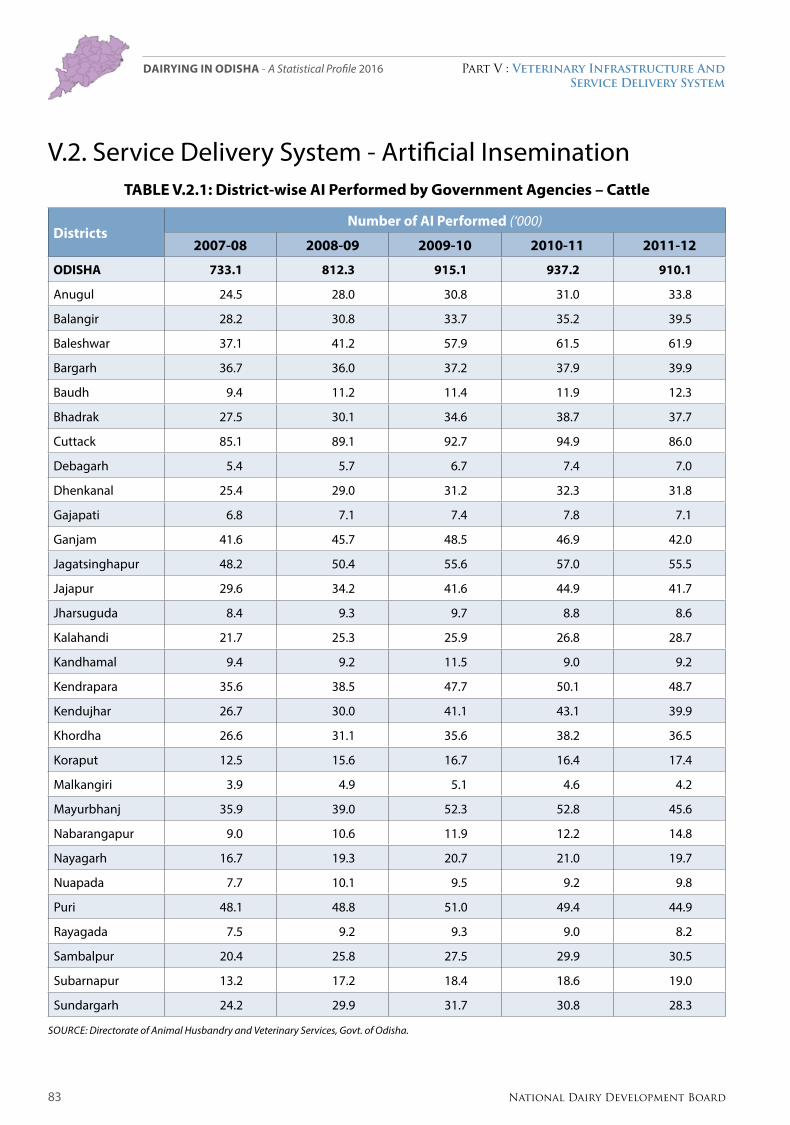
83 National Dairy Development Board
Part V : Veterinary Infrastructure And Service Delivery System
Dairying in ODiSHa - A Statistical Profile 2016
V.2. Service Delivery System - Artificial InseminationTABLE V.2.1: District-wise AI Performed by Government Agencies – Cattle
DistrictsNumber of AI Performed (‘000)
2007-08 2008-09 2009-10 2010-11 2011-12
ODISHA 733.1 812.3 915.1 937.2 910.1
Anugul 24.5 28.0 30.8 31.0 33.8
Balangir 28.2 30.8 33.7 35.2 39.5
Baleshwar 37.1 41.2 57.9 61.5 61.9
Bargarh 36.7 36.0 37.2 37.9 39.9
Baudh 9.4 11.2 11.4 11.9 12.3
Bhadrak 27.5 30.1 34.6 38.7 37.7
Cuttack 85.1 89.1 92.7 94.9 86.0
Debagarh 5.4 5.7 6.7 7.4 7.0
Dhenkanal 25.4 29.0 31.2 32.3 31.8
Gajapati 6.8 7.1 7.4 7.8 7.1
Ganjam 41.6 45.7 48.5 46.9 42.0
Jagatsinghapur 48.2 50.4 55.6 57.0 55.5
Jajapur 29.6 34.2 41.6 44.9 41.7
Jharsuguda 8.4 9.3 9.7 8.8 8.6
Kalahandi 21.7 25.3 25.9 26.8 28.7
Kandhamal 9.4 9.2 11.5 9.0 9.2
Kendrapara 35.6 38.5 47.7 50.1 48.7
Kendujhar 26.7 30.0 41.1 43.1 39.9
Khordha 26.6 31.1 35.6 38.2 36.5
Koraput 12.5 15.6 16.7 16.4 17.4
Malkangiri 3.9 4.9 5.1 4.6 4.2
Mayurbhanj 35.9 39.0 52.3 52.8 45.6
Nabarangapur 9.0 10.6 11.9 12.2 14.8
Nayagarh 16.7 19.3 20.7 21.0 19.7
Nuapada 7.7 10.1 9.5 9.2 9.8
Puri 48.1 48.8 51.0 49.4 44.9
Rayagada 7.5 9.2 9.3 9.0 8.2
Sambalpur 20.4 25.8 27.5 29.9 30.5
Subarnapur 13.2 17.2 18.4 18.6 19.0
Sundargarh 24.2 29.9 31.7 30.8 28.3
SourCe: Directorate of Animal Husbandry and Veterinary Services, Govt. of odisha.
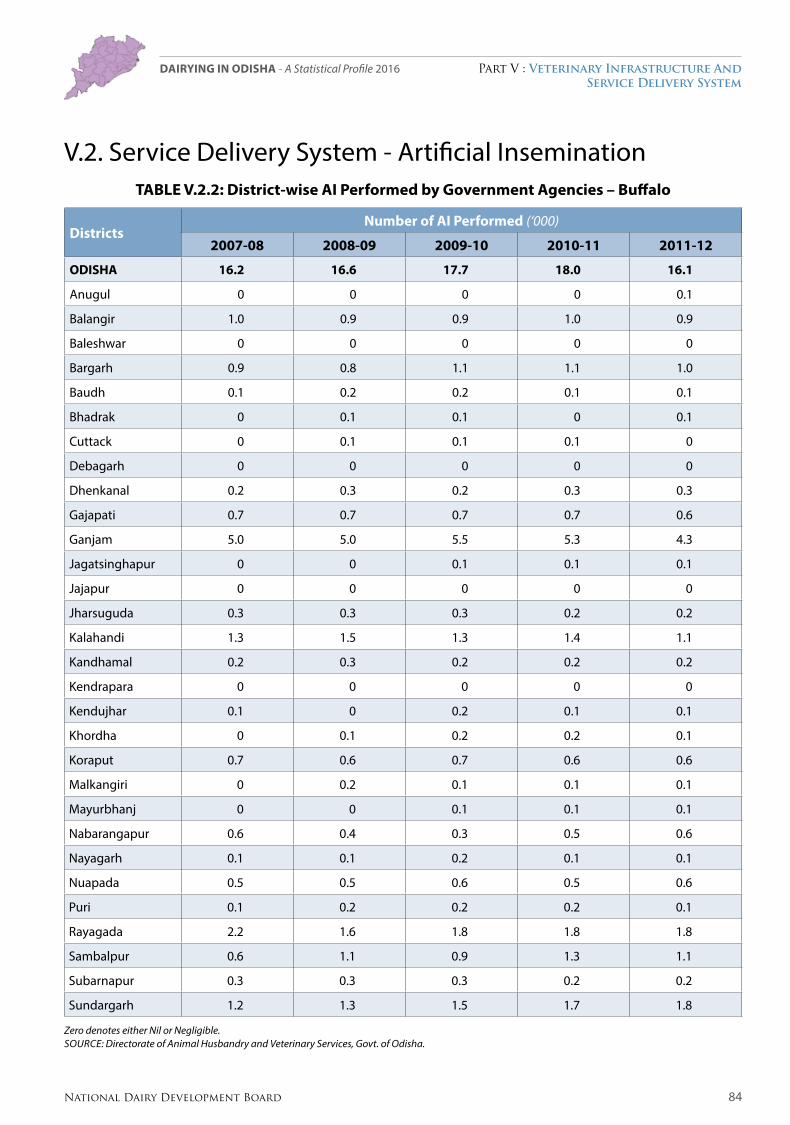
84National Dairy Development Board
Part V : Veterinary Infrastructure And Service Delivery System
Dairying in ODiSHa - A Statistical Profile 2016
V.2. Service Delivery System - Artificial InseminationTABLE V.2.2: District-wise AI Performed by Government Agencies – Buffalo
DistrictsNumber of AI Performed (‘000)
2007-08 2008-09 2009-10 2010-11 2011-12
ODISHA 16.2 16.6 17.7 18.0 16.1
Anugul 0 0 0 0 0.1
Balangir 1.0 0.9 0.9 1.0 0.9
Baleshwar 0 0 0 0 0
Bargarh 0.9 0.8 1.1 1.1 1.0
Baudh 0.1 0.2 0.2 0.1 0.1
Bhadrak 0 0.1 0.1 0 0.1
Cuttack 0 0.1 0.1 0.1 0
Debagarh 0 0 0 0 0
Dhenkanal 0.2 0.3 0.2 0.3 0.3
Gajapati 0.7 0.7 0.7 0.7 0.6
Ganjam 5.0 5.0 5.5 5.3 4.3
Jagatsinghapur 0 0 0.1 0.1 0.1
Jajapur 0 0 0 0 0
Jharsuguda 0.3 0.3 0.3 0.2 0.2
Kalahandi 1.3 1.5 1.3 1.4 1.1
Kandhamal 0.2 0.3 0.2 0.2 0.2
Kendrapara 0 0 0 0 0
Kendujhar 0.1 0 0.2 0.1 0.1
Khordha 0 0.1 0.2 0.2 0.1
Koraput 0.7 0.6 0.7 0.6 0.6
Malkangiri 0 0.2 0.1 0.1 0.1
Mayurbhanj 0 0 0.1 0.1 0.1
Nabarangapur 0.6 0.4 0.3 0.5 0.6
Nayagarh 0.1 0.1 0.2 0.1 0.1
Nuapada 0.5 0.5 0.6 0.5 0.6
Puri 0.1 0.2 0.2 0.2 0.1
Rayagada 2.2 1.6 1.8 1.8 1.8
Sambalpur 0.6 1.1 0.9 1.3 1.1
Subarnapur 0.3 0.3 0.3 0.2 0.2
Sundargarh 1.2 1.3 1.5 1.7 1.8
Zero denotes either Nil or Negligible.SourCe: Directorate of Animal Husbandry and Veterinary Services, Govt. of odisha.

85 National Dairy Development Board
Part V : Veterinary Infrastructure And Service Delivery System
Dairying in ODiSHa - A Statistical Profile 2016
V.2. Service Delivery System - Artificial InseminationTABLE V.2.3: District-wise AI Performed by Government Agencies – Bovine
DistrictsNumber of AI Performed (‘000)
2007-08 2008-09 2009-10 2010-11 2011-12 2012-13 2013-14
ODISHA 749.3 828.9 932.8 955.2 926.2 942.9 973.5
Anugul 24.5 28.0 30.8 31.0 33.9 26.5 28.3
Balangir 29.2 31.7 34.6 36.2 40.4 29.7 31.5
Baleshwar 37.1 41.2 57.9 61.5 61.9 64.3 64.3
Bargarh 37.6 36.8 38.3 39.0 40.9 35.5 38.8
Baudh 9.5 11.4 11.6 12.0 12.4 9.0 7.4
Bhadrak 27.5 30.2 34.7 38.7 37.8 37.6 36.9
Cuttack 85.1 89.2 92.8 95.0 86 70.9 80.4
Debagarh 5.4 5.7 6.7 7.4 7.0 7.7 9.8
Dhenkanal 25.6 29.3 31.4 32.6 32.1 31.6 29.8
Gajapati 7.5 7.8 8.1 8.5 7.7 7.9 6.4
Ganjam 46.6 50.7 54.0 52.2 46.3 43.7 42.2
Jagatsinghapur 48.2 50.4 55.7 57.1 55.6 53.8 57.9
Jajapur 29.6 34.2 41.6 44.9 41.7 38.0 41.6
Jharsuguda 8.7 9.6 10.0 9.0 8.8 8.0 8.3
Kalahandi 23.0 26.8 27.2 28.2 29.8 27.2 26.8
Kandhamal 9.6 9.5 11.7 9.2 9.4 10.5 10.3
Kendrapara 35.6 38.5 47.7 50.1 48.7 44.6 48.3
Kendujhar 26.8 30.0 41.3 43.2 40.0 33.5 35.2
Khordha 26.6 31.2 35.8 38.4 36.6 34.1 34.0
Koraput 13.2 16.2 17.4 17.0 18.0 17.3 16.7
Malkangiri 3.9 5.1 5.2 4.7 4.3 4.6 4.4
Mayurbhanj 35.9 39.0 52.4 52.9 45.7 45.7 43.7
Nabarangapur 9.6 11.0 12.2 12.7 15.4 12.2 11.2
Nayagarh 16.8 19.4 20.9 21.1 19.8 19.1 22.5
Nuapada 8.2 10.6 10.1 9.7 10.4 8.6 9.0
Puri 48.2 49.0 51.2 49.6 45.0 37.4 39.5
Rayagada 9.7 10.8 11.1 10.8 10.0 12.4 13.2
Sambalpur 21.0 26.9 28.4 31.2 31.6 26.0 28.5
Subarnapur 13.5 17.5 18.7 18.8 19.2 12.8 13.4
Sundargarh 25.4 31.2 33.2 32.5 30.1 27.0 30.4
SourCe: Directorate of Animal Husbandry and Veterinary Services, Govt. of odisha.
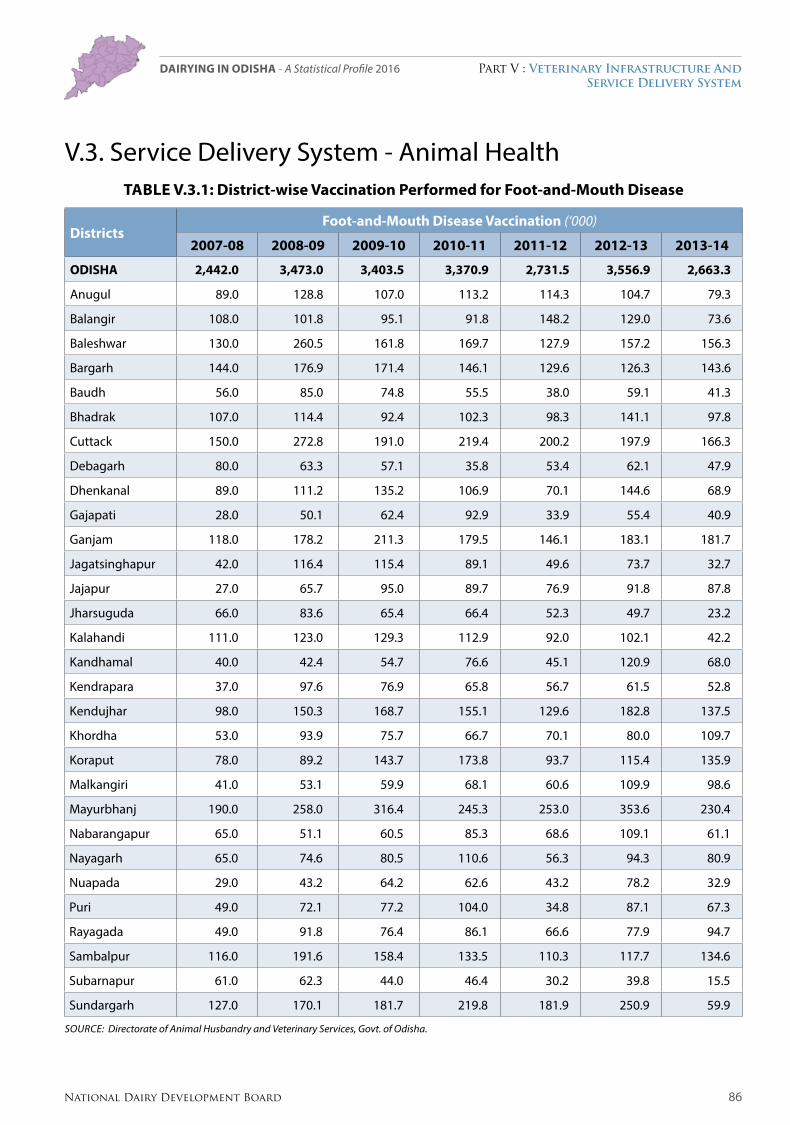
86National Dairy Development Board
Part V : Veterinary Infrastructure And Service Delivery System
Dairying in ODiSHa - A Statistical Profile 2016
V.3. Service Delivery System - Animal HealthTABLE V.3.1: District-wise Vaccination Performed for Foot-and-Mouth Disease
DistrictsFoot-and-Mouth Disease Vaccination (‘000)
2007-08 2008-09 2009-10 2010-11 2011-12 2012-13 2013-14
ODISHA 2,442.0 3,473.0 3,403.5 3,370.9 2,731.5 3,556.9 2,663.3
Anugul 89.0 128.8 107.0 113.2 114.3 104.7 79.3
Balangir 108.0 101.8 95.1 91.8 148.2 129.0 73.6
Baleshwar 130.0 260.5 161.8 169.7 127.9 157.2 156.3
Bargarh 144.0 176.9 171.4 146.1 129.6 126.3 143.6
Baudh 56.0 85.0 74.8 55.5 38.0 59.1 41.3
Bhadrak 107.0 114.4 92.4 102.3 98.3 141.1 97.8
Cuttack 150.0 272.8 191.0 219.4 200.2 197.9 166.3
Debagarh 80.0 63.3 57.1 35.8 53.4 62.1 47.9
Dhenkanal 89.0 111.2 135.2 106.9 70.1 144.6 68.9
Gajapati 28.0 50.1 62.4 92.9 33.9 55.4 40.9
Ganjam 118.0 178.2 211.3 179.5 146.1 183.1 181.7
Jagatsinghapur 42.0 116.4 115.4 89.1 49.6 73.7 32.7
Jajapur 27.0 65.7 95.0 89.7 76.9 91.8 87.8
Jharsuguda 66.0 83.6 65.4 66.4 52.3 49.7 23.2
Kalahandi 111.0 123.0 129.3 112.9 92.0 102.1 42.2
Kandhamal 40.0 42.4 54.7 76.6 45.1 120.9 68.0
Kendrapara 37.0 97.6 76.9 65.8 56.7 61.5 52.8
Kendujhar 98.0 150.3 168.7 155.1 129.6 182.8 137.5
Khordha 53.0 93.9 75.7 66.7 70.1 80.0 109.7
Koraput 78.0 89.2 143.7 173.8 93.7 115.4 135.9
Malkangiri 41.0 53.1 59.9 68.1 60.6 109.9 98.6
Mayurbhanj 190.0 258.0 316.4 245.3 253.0 353.6 230.4
Nabarangapur 65.0 51.1 60.5 85.3 68.6 109.1 61.1
Nayagarh 65.0 74.6 80.5 110.6 56.3 94.3 80.9
Nuapada 29.0 43.2 64.2 62.6 43.2 78.2 32.9
Puri 49.0 72.1 77.2 104.0 34.8 87.1 67.3
Rayagada 49.0 91.8 76.4 86.1 66.6 77.9 94.7
Sambalpur 116.0 191.6 158.4 133.5 110.3 117.7 134.6
Subarnapur 61.0 62.3 44.0 46.4 30.2 39.8 15.5
Sundargarh 127.0 170.1 181.7 219.8 181.9 250.9 59.9
SourCe: Directorate of Animal Husbandry and Veterinary Services, Govt. of odisha.
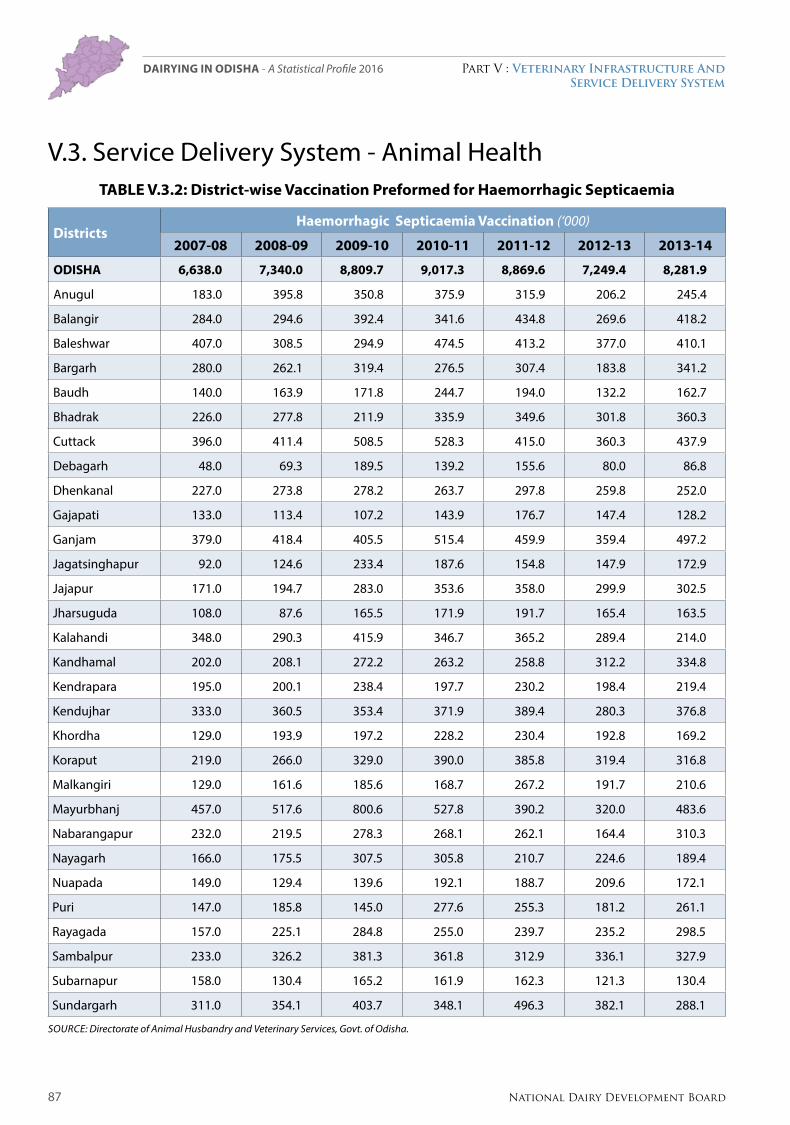
87 National Dairy Development Board
Part V : Veterinary Infrastructure And Service Delivery System
Dairying in ODiSHa - A Statistical Profile 2016
V.3. Service Delivery System - Animal HealthTABLE V.3.2: District-wise Vaccination Preformed for Haemorrhagic Septicaemia
DistrictsHaemorrhagic Septicaemia Vaccination (‘000)
2007-08 2008-09 2009-10 2010-11 2011-12 2012-13 2013-14
ODISHA 6,638.0 7,340.0 8,809.7 9,017.3 8,869.6 7,249.4 8,281.9
Anugul 183.0 395.8 350.8 375.9 315.9 206.2 245.4
Balangir 284.0 294.6 392.4 341.6 434.8 269.6 418.2
Baleshwar 407.0 308.5 294.9 474.5 413.2 377.0 410.1
Bargarh 280.0 262.1 319.4 276.5 307.4 183.8 341.2
Baudh 140.0 163.9 171.8 244.7 194.0 132.2 162.7
Bhadrak 226.0 277.8 211.9 335.9 349.6 301.8 360.3
Cuttack 396.0 411.4 508.5 528.3 415.0 360.3 437.9
Debagarh 48.0 69.3 189.5 139.2 155.6 80.0 86.8
Dhenkanal 227.0 273.8 278.2 263.7 297.8 259.8 252.0
Gajapati 133.0 113.4 107.2 143.9 176.7 147.4 128.2
Ganjam 379.0 418.4 405.5 515.4 459.9 359.4 497.2
Jagatsinghapur 92.0 124.6 233.4 187.6 154.8 147.9 172.9
Jajapur 171.0 194.7 283.0 353.6 358.0 299.9 302.5
Jharsuguda 108.0 87.6 165.5 171.9 191.7 165.4 163.5
Kalahandi 348.0 290.3 415.9 346.7 365.2 289.4 214.0
Kandhamal 202.0 208.1 272.2 263.2 258.8 312.2 334.8
Kendrapara 195.0 200.1 238.4 197.7 230.2 198.4 219.4
Kendujhar 333.0 360.5 353.4 371.9 389.4 280.3 376.8
Khordha 129.0 193.9 197.2 228.2 230.4 192.8 169.2
Koraput 219.0 266.0 329.0 390.0 385.8 319.4 316.8
Malkangiri 129.0 161.6 185.6 168.7 267.2 191.7 210.6
Mayurbhanj 457.0 517.6 800.6 527.8 390.2 320.0 483.6
Nabarangapur 232.0 219.5 278.3 268.1 262.1 164.4 310.3
Nayagarh 166.0 175.5 307.5 305.8 210.7 224.6 189.4
Nuapada 149.0 129.4 139.6 192.1 188.7 209.6 172.1
Puri 147.0 185.8 145.0 277.6 255.3 181.2 261.1
Rayagada 157.0 225.1 284.8 255.0 239.7 235.2 298.5
Sambalpur 233.0 326.2 381.3 361.8 312.9 336.1 327.9
Subarnapur 158.0 130.4 165.2 161.9 162.3 121.3 130.4
Sundargarh 311.0 354.1 403.7 348.1 496.3 382.1 288.1
SourCe: Directorate of Animal Husbandry and Veterinary Services, Govt. of odisha.
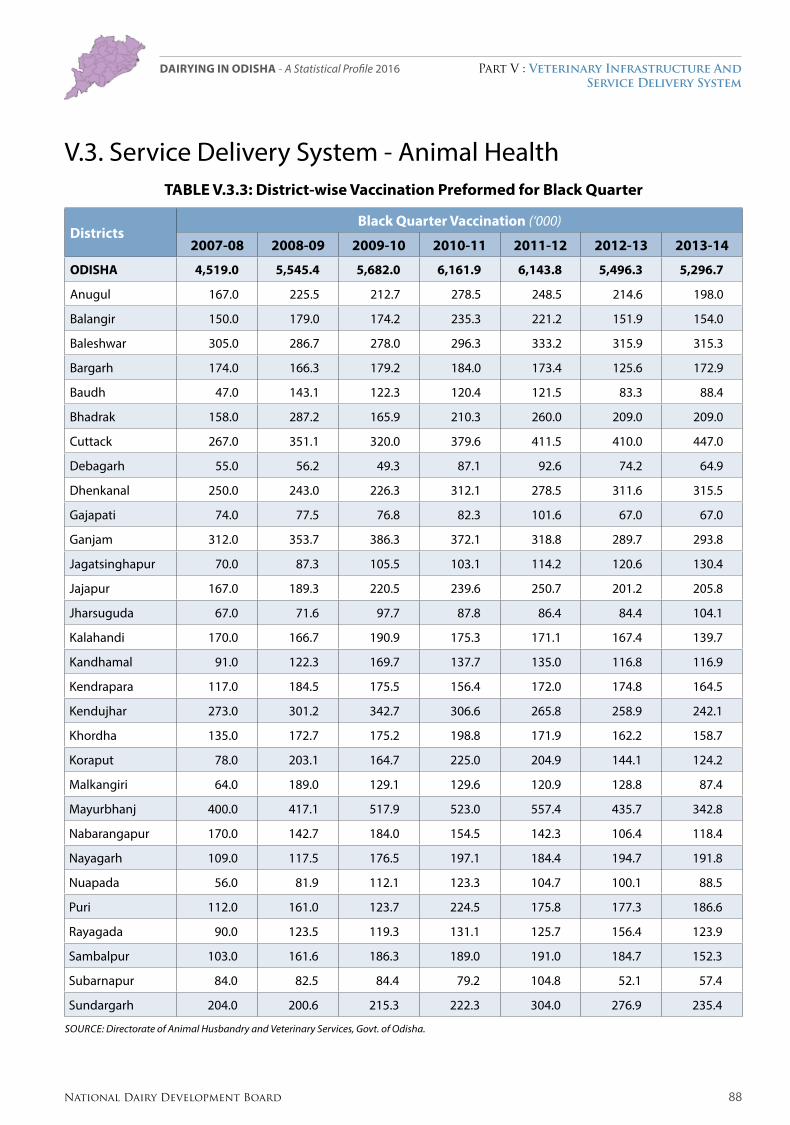
88National Dairy Development Board
Part V : Veterinary Infrastructure And Service Delivery System
Dairying in ODiSHa - A Statistical Profile 2016
V.3. Service Delivery System - Animal HealthTABLE V.3.3: District-wise Vaccination Preformed for Black Quarter
DistrictsBlack Quarter Vaccination (‘000)
2007-08 2008-09 2009-10 2010-11 2011-12 2012-13 2013-14
ODISHA 4,519.0 5,545.4 5,682.0 6,161.9 6,143.8 5,496.3 5,296.7
Anugul 167.0 225.5 212.7 278.5 248.5 214.6 198.0
Balangir 150.0 179.0 174.2 235.3 221.2 151.9 154.0
Baleshwar 305.0 286.7 278.0 296.3 333.2 315.9 315.3
Bargarh 174.0 166.3 179.2 184.0 173.4 125.6 172.9
Baudh 47.0 143.1 122.3 120.4 121.5 83.3 88.4
Bhadrak 158.0 287.2 165.9 210.3 260.0 209.0 209.0
Cuttack 267.0 351.1 320.0 379.6 411.5 410.0 447.0
Debagarh 55.0 56.2 49.3 87.1 92.6 74.2 64.9
Dhenkanal 250.0 243.0 226.3 312.1 278.5 311.6 315.5
Gajapati 74.0 77.5 76.8 82.3 101.6 67.0 67.0
Ganjam 312.0 353.7 386.3 372.1 318.8 289.7 293.8
Jagatsinghapur 70.0 87.3 105.5 103.1 114.2 120.6 130.4
Jajapur 167.0 189.3 220.5 239.6 250.7 201.2 205.8
Jharsuguda 67.0 71.6 97.7 87.8 86.4 84.4 104.1
Kalahandi 170.0 166.7 190.9 175.3 171.1 167.4 139.7
Kandhamal 91.0 122.3 169.7 137.7 135.0 116.8 116.9
Kendrapara 117.0 184.5 175.5 156.4 172.0 174.8 164.5
Kendujhar 273.0 301.2 342.7 306.6 265.8 258.9 242.1
Khordha 135.0 172.7 175.2 198.8 171.9 162.2 158.7
Koraput 78.0 203.1 164.7 225.0 204.9 144.1 124.2
Malkangiri 64.0 189.0 129.1 129.6 120.9 128.8 87.4
Mayurbhanj 400.0 417.1 517.9 523.0 557.4 435.7 342.8
Nabarangapur 170.0 142.7 184.0 154.5 142.3 106.4 118.4
Nayagarh 109.0 117.5 176.5 197.1 184.4 194.7 191.8
Nuapada 56.0 81.9 112.1 123.3 104.7 100.1 88.5
Puri 112.0 161.0 123.7 224.5 175.8 177.3 186.6
Rayagada 90.0 123.5 119.3 131.1 125.7 156.4 123.9
Sambalpur 103.0 161.6 186.3 189.0 191.0 184.7 152.3
Subarnapur 84.0 82.5 84.4 79.2 104.8 52.1 57.4
Sundargarh 204.0 200.6 215.3 222.3 304.0 276.9 235.4
SourCe: Directorate of Animal Husbandry and Veterinary Services, Govt. of odisha.
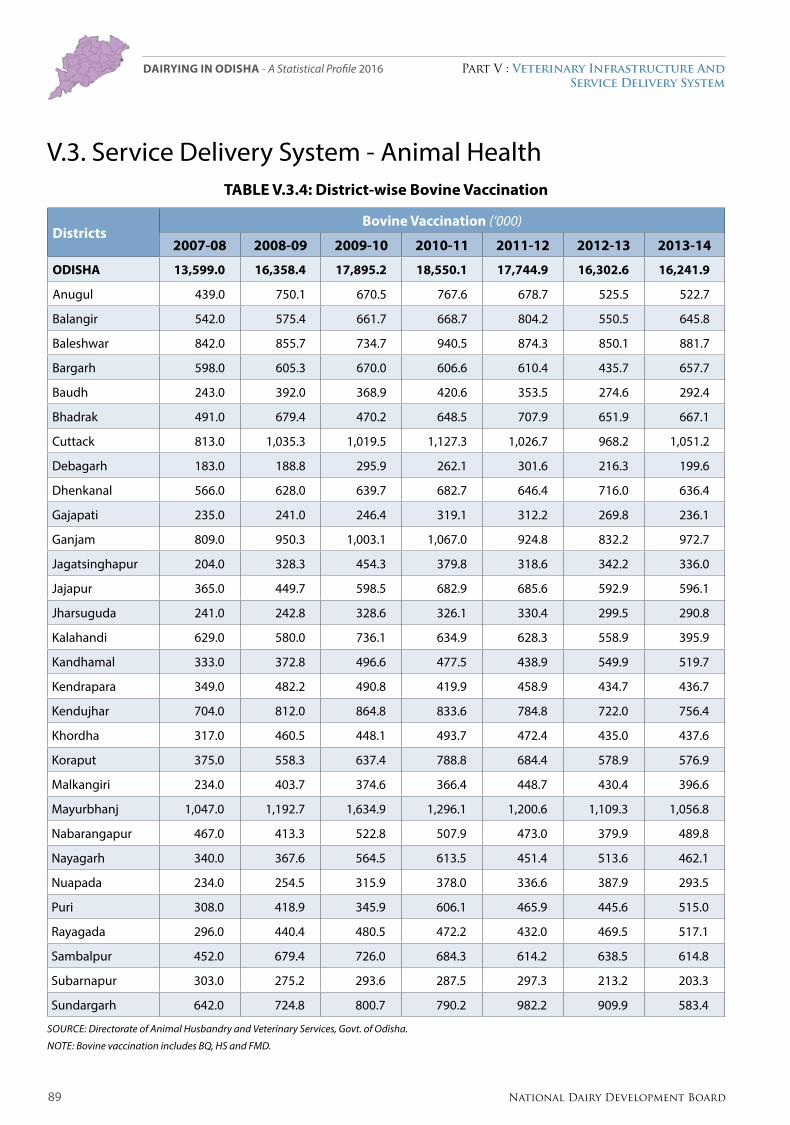
89 National Dairy Development Board
Part V : Veterinary Infrastructure And Service Delivery System
Dairying in ODiSHa - A Statistical Profile 2016
V.3. Service Delivery System - Animal HealthTABLE V.3.4: District-wise Bovine Vaccination
DistrictsBovine Vaccination (‘000)
2007-08 2008-09 2009-10 2010-11 2011-12 2012-13 2013-14
ODISHA 13,599.0 16,358.4 17,895.2 18,550.1 17,744.9 16,302.6 16,241.9
Anugul 439.0 750.1 670.5 767.6 678.7 525.5 522.7
Balangir 542.0 575.4 661.7 668.7 804.2 550.5 645.8
Baleshwar 842.0 855.7 734.7 940.5 874.3 850.1 881.7
Bargarh 598.0 605.3 670.0 606.6 610.4 435.7 657.7
Baudh 243.0 392.0 368.9 420.6 353.5 274.6 292.4
Bhadrak 491.0 679.4 470.2 648.5 707.9 651.9 667.1
Cuttack 813.0 1,035.3 1,019.5 1,127.3 1,026.7 968.2 1,051.2
Debagarh 183.0 188.8 295.9 262.1 301.6 216.3 199.6
Dhenkanal 566.0 628.0 639.7 682.7 646.4 716.0 636.4
Gajapati 235.0 241.0 246.4 319.1 312.2 269.8 236.1
Ganjam 809.0 950.3 1,003.1 1,067.0 924.8 832.2 972.7
Jagatsinghapur 204.0 328.3 454.3 379.8 318.6 342.2 336.0
Jajapur 365.0 449.7 598.5 682.9 685.6 592.9 596.1
Jharsuguda 241.0 242.8 328.6 326.1 330.4 299.5 290.8
Kalahandi 629.0 580.0 736.1 634.9 628.3 558.9 395.9
Kandhamal 333.0 372.8 496.6 477.5 438.9 549.9 519.7
Kendrapara 349.0 482.2 490.8 419.9 458.9 434.7 436.7
Kendujhar 704.0 812.0 864.8 833.6 784.8 722.0 756.4
Khordha 317.0 460.5 448.1 493.7 472.4 435.0 437.6
Koraput 375.0 558.3 637.4 788.8 684.4 578.9 576.9
Malkangiri 234.0 403.7 374.6 366.4 448.7 430.4 396.6
Mayurbhanj 1,047.0 1,192.7 1,634.9 1,296.1 1,200.6 1,109.3 1,056.8
Nabarangapur 467.0 413.3 522.8 507.9 473.0 379.9 489.8
Nayagarh 340.0 367.6 564.5 613.5 451.4 513.6 462.1
Nuapada 234.0 254.5 315.9 378.0 336.6 387.9 293.5
Puri 308.0 418.9 345.9 606.1 465.9 445.6 515.0
Rayagada 296.0 440.4 480.5 472.2 432.0 469.5 517.1
Sambalpur 452.0 679.4 726.0 684.3 614.2 638.5 614.8
Subarnapur 303.0 275.2 293.6 287.5 297.3 213.2 203.3
Sundargarh 642.0 724.8 800.7 790.2 982.2 909.9 583.4
SourCe: Directorate of Animal Husbandry and Veterinary Services, Govt. of odisha.
Note: Bovine vaccination includes BQ, HS and FMD.

90National Dairy Development Board
Part V : Veterinary Infrastructure And Service Delivery System
Dairying in ODiSHa - A Statistical Profile 2016
V.3. Service Delivery System - Animal HealthTABLE V.3.5: District-wise Total Cases Treated
DistrictsTotal Cases Treated (‘000)
2007-08 2008-09 2009-10 2010-11 2011-12 2012-13 2013-14
ODISHA 4,980.0 5,548.2 5,569.2 5,303.4 6,099.5 6,324.1 7,657.8
Anugul 145.0 186.6 181.9 182.4 244.1 202.3 218.1
Balangir 215.0 243.5 253.6 226.3 256.2 371.4 447.8
Baleshwar 298.0 296.7 351.9 332.2 418.0 459.7 510.9
Bargarh 125.0 127.8 140.2 124.9 137.8 142.6 115.1
Bhadrak 174.0 174.7 178.5 171.4 221.2 224.8 273.3
Baudh 58.0 73.6 78.9 75.4 106.4 90.9 87.1
Cuttack 291.0 396.6 317.8 258.4 317.0 294.9 413.7
Debagarh 43.0 39.8 53.0 45.9 77.4 67.8 79.5
Dhenkanal 178.0 202.8 190.5 205.8 207.3 234.3 255.0
Gajapati 39.0 42.3 45.3 49.9 49.0 64.3 50.0
Ganjam 362.0 384.7 388.9 397.6 391.7 446.0 618.1
Jagatsinghapur 114.0 126.1 114.7 109.4 150.6 142.1 180.9
Jajapur 207.0 227.1 166.0 150.3 194.7 152.6 183.3
Jharsuguda 47.0 55.1 58.7 54.3 64.4 71.0 71.5
Kalahandi 161.0 189.0 186.8 189.5 209.3 218.4 273.7
Kandhamal 130.0 162.8 176.7 163.9 169.1 230.6 282.6
Kendrapara 152.0 197.9 168.1 137.7 188.1 97.5 104.0
Kendujhar 306.0 329.4 358.7 336.4 394.3 358.0 369.4
Khordha 156.0 182.7 195.6 159.3 178.6 179.9 234.4
Koraput 128.0 153.4 153.7 167.6 176.8 194.7 423.4
Malkangiri 88.0 98.4 95.1 94.4 99.7 161.5 161.4
Mayurbhanj 503.0 507.0 603.7 599.6 606.0 584.9 632.8
Nabarangapur 65.0 62.6 72.1 79.8 115.5 110.4 104.8
Nayagarh 175.0 129.1 129.3 114.2 158.9 159.2 255.9
Nuapada 46.0 50.7 51.8 53.6 51.6 107.8 137.0
Puri 155.0 233.9 148.1 144.9 168.8 173.9 235.8
Rayagada 100.0 99.5 113.1 104.4 111.1 129.5 234.9
Sambalpur 178.0 187.6 186.7 183.6 211.1 218.4 229.4
Subarnapur 55.0 58.5 59.4 55.6 64.9 60.5 77.6
Sundargarh 286.0 328.3 350.4 334.7 359.9 374.2 396.4
SourCe: Directorate of Animal Husbandry and Veterinary Services, Govt. of odisha.
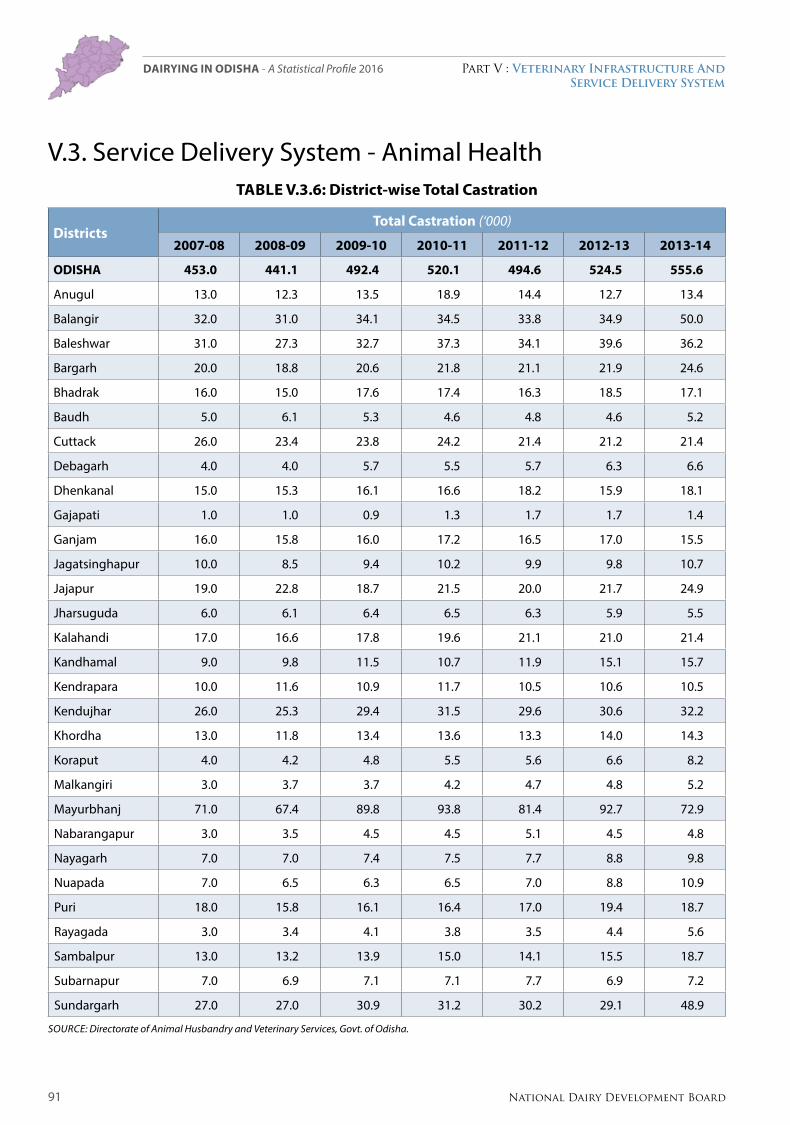
91 National Dairy Development Board
Part V : Veterinary Infrastructure And Service Delivery System
Dairying in ODiSHa - A Statistical Profile 2016
V.3. Service Delivery System - Animal HealthTABLE V.3.6: District-wise Total Castration
DistrictsTotal Castration (‘000)
2007-08 2008-09 2009-10 2010-11 2011-12 2012-13 2013-14
ODISHA 453.0 441.1 492.4 520.1 494.6 524.5 555.6
Anugul 13.0 12.3 13.5 18.9 14.4 12.7 13.4
Balangir 32.0 31.0 34.1 34.5 33.8 34.9 50.0
Baleshwar 31.0 27.3 32.7 37.3 34.1 39.6 36.2
Bargarh 20.0 18.8 20.6 21.8 21.1 21.9 24.6
Bhadrak 16.0 15.0 17.6 17.4 16.3 18.5 17.1
Baudh 5.0 6.1 5.3 4.6 4.8 4.6 5.2
Cuttack 26.0 23.4 23.8 24.2 21.4 21.2 21.4
Debagarh 4.0 4.0 5.7 5.5 5.7 6.3 6.6
Dhenkanal 15.0 15.3 16.1 16.6 18.2 15.9 18.1
Gajapati 1.0 1.0 0.9 1.3 1.7 1.7 1.4
Ganjam 16.0 15.8 16.0 17.2 16.5 17.0 15.5
Jagatsinghapur 10.0 8.5 9.4 10.2 9.9 9.8 10.7
Jajapur 19.0 22.8 18.7 21.5 20.0 21.7 24.9
Jharsuguda 6.0 6.1 6.4 6.5 6.3 5.9 5.5
Kalahandi 17.0 16.6 17.8 19.6 21.1 21.0 21.4
Kandhamal 9.0 9.8 11.5 10.7 11.9 15.1 15.7
Kendrapara 10.0 11.6 10.9 11.7 10.5 10.6 10.5
Kendujhar 26.0 25.3 29.4 31.5 29.6 30.6 32.2
Khordha 13.0 11.8 13.4 13.6 13.3 14.0 14.3
Koraput 4.0 4.2 4.8 5.5 5.6 6.6 8.2
Malkangiri 3.0 3.7 3.7 4.2 4.7 4.8 5.2
Mayurbhanj 71.0 67.4 89.8 93.8 81.4 92.7 72.9
Nabarangapur 3.0 3.5 4.5 4.5 5.1 4.5 4.8
Nayagarh 7.0 7.0 7.4 7.5 7.7 8.8 9.8
Nuapada 7.0 6.5 6.3 6.5 7.0 8.8 10.9
Puri 18.0 15.8 16.1 16.4 17.0 19.4 18.7
Rayagada 3.0 3.4 4.1 3.8 3.5 4.4 5.6
Sambalpur 13.0 13.2 13.9 15.0 14.1 15.5 18.7
Subarnapur 7.0 6.9 7.1 7.1 7.7 6.9 7.2
Sundargarh 27.0 27.0 30.9 31.2 30.2 29.1 48.9
SourCe: Directorate of Animal Husbandry and Veterinary Services, Govt. of odisha.

92National Dairy Development Board
Part V : Veterinary Infrastructure And Service Delivery System
Dairying in ODiSHa - A Statistical Profile 2016

Part VI : Feed Resources
Odisha is one of the few states that has estimated present demand for green fodder in the State at about 312 lakh MT and that of dry fodder at 139 lakh MT and juxtaposed these figures with availability of about 161 lakh MT green fodder and 106 lakh MT dry fodder. Accordingly, the activities of eight departmental fodder seed production units have been to provide fodder seeds (at subsidized rates), mini kits, perennial roots & slips to the farmers. Under fodder development programme, farmers are encouraged to develop fodder plots in their own land. It also provides chaff cutters and feeding troughs to the farmers. In addition to fodder plots, demonstrations are also being given for Azola and UTPS pits. Under technology-knowledge and strategy programme, breeder fodder seeds are produced which get multiplied into certified seeds in the farmers fields. Beside State Plan, many new schemes have been introduced to augment feed resources in Odisha.
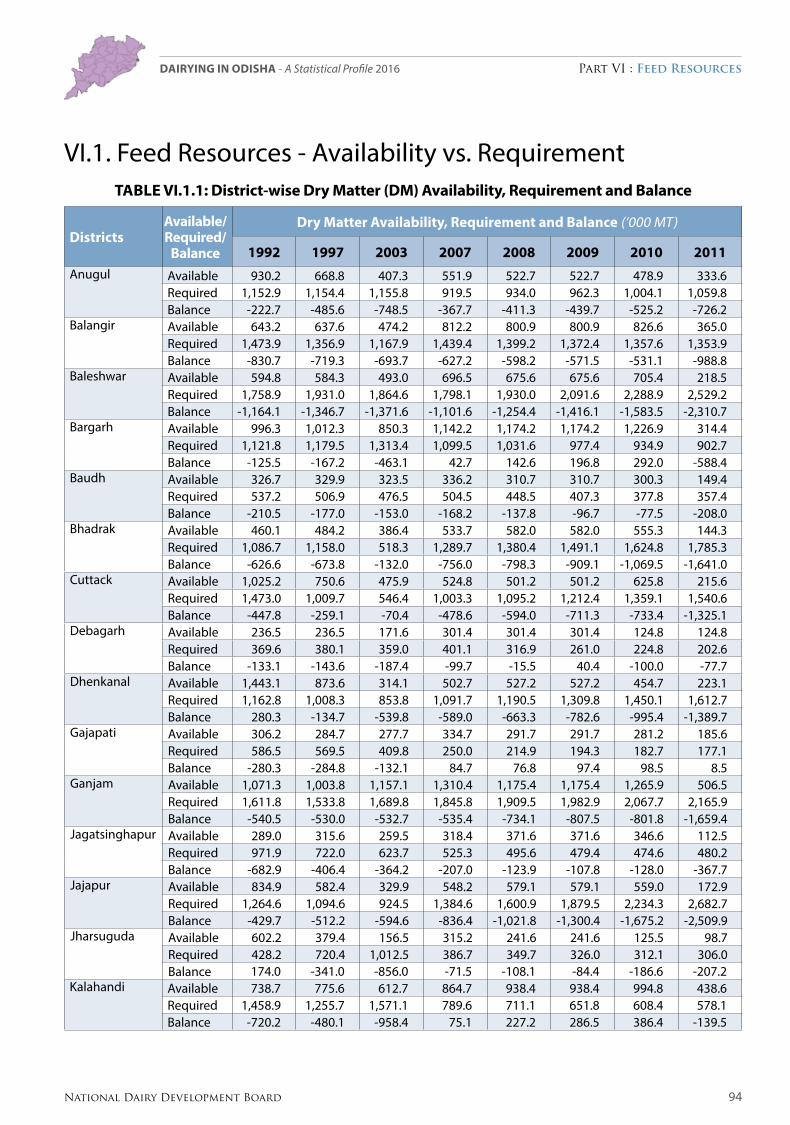
94National Dairy Development Board
Part VI : Feed ResourcesDairying in ODiSHa - A Statistical Profile 2016
VI.1. Feed Resources - Availability vs. RequirementTable VI.1.1: District-wise Dry Matter (DM) availability, Requirement and balance
Districtsavailable/ Required/
balance
Dry Matter availability, Requirement and balance (‘000 MT)
1992 1997 2003 2007 2008 2009 2010 2011Anugul Available 930.2 668.8 407.3 551.9 522.7 522.7 478.9 333.6
Required 1,152.9 1,154.4 1,155.8 919.5 934.0 962.3 1,004.1 1,059.8Balance -222.7 -485.6 -748.5 -367.7 -411.3 -439.7 -525.2 -726.2
Balangir Available 643.2 637.6 474.2 812.2 800.9 800.9 826.6 365.0Required 1,473.9 1,356.9 1,167.9 1,439.4 1,399.2 1,372.4 1,357.6 1,353.9Balance -830.7 -719.3 -693.7 -627.2 -598.2 -571.5 -531.1 -988.8
Baleshwar Available 594.8 584.3 493.0 696.5 675.6 675.6 705.4 218.5Required 1,758.9 1,931.0 1,864.6 1,798.1 1,930.0 2,091.6 2,288.9 2,529.2Balance -1,164.1 -1,346.7 -1,371.6 -1,101.6 -1,254.4 -1,416.1 -1,583.5 -2,310.7
Bargarh Available 996.3 1,012.3 850.3 1,142.2 1,174.2 1,174.2 1,226.9 314.4Required 1,121.8 1,179.5 1,313.4 1,099.5 1,031.6 977.4 934.9 902.7Balance -125.5 -167.2 -463.1 42.7 142.6 196.8 292.0 -588.4
Baudh Available 326.7 329.9 323.5 336.2 310.7 310.7 300.3 149.4Required 537.2 506.9 476.5 504.5 448.5 407.3 377.8 357.4Balance -210.5 -177.0 -153.0 -168.2 -137.8 -96.7 -77.5 -208.0
Bhadrak Available 460.1 484.2 386.4 533.7 582.0 582.0 555.3 144.3Required 1,086.7 1,158.0 518.3 1,289.7 1,380.4 1,491.1 1,624.8 1,785.3Balance -626.6 -673.8 -132.0 -756.0 -798.3 -909.1 -1,069.5 -1,641.0
Cuttack Available 1,025.2 750.6 475.9 524.8 501.2 501.2 625.8 215.6Required 1,473.0 1,009.7 546.4 1,003.3 1,095.2 1,212.4 1,359.1 1,540.6Balance -447.8 -259.1 -70.4 -478.6 -594.0 -711.3 -733.4 -1,325.1
Debagarh Available 236.5 236.5 171.6 301.4 301.4 301.4 124.8 124.8Required 369.6 380.1 359.0 401.1 316.9 261.0 224.8 202.6Balance -133.1 -143.6 -187.4 -99.7 -15.5 40.4 -100.0 -77.7
Dhenkanal Available 1,443.1 873.6 314.1 502.7 527.2 527.2 454.7 223.1Required 1,162.8 1,008.3 853.8 1,091.7 1,190.5 1,309.8 1,450.1 1,612.7Balance 280.3 -134.7 -539.8 -589.0 -663.3 -782.6 -995.4 -1,389.7
Gajapati Available 306.2 284.7 277.7 334.7 291.7 291.7 281.2 185.6Required 586.5 569.5 409.8 250.0 214.9 194.3 182.7 177.1Balance -280.3 -284.8 -132.1 84.7 76.8 97.4 98.5 8.5
Ganjam Available 1,071.3 1,003.8 1,157.1 1,310.4 1,175.4 1,175.4 1,265.9 506.5Required 1,611.8 1,533.8 1,689.8 1,845.8 1,909.5 1,982.9 2,067.7 2,165.9Balance -540.5 -530.0 -532.7 -535.4 -734.1 -807.5 -801.8 -1,659.4
Jagatsinghapur Available 289.0 315.6 259.5 318.4 371.6 371.6 346.6 112.5Required 971.9 722.0 623.7 525.3 495.6 479.4 474.6 480.2Balance -682.9 -406.4 -364.2 -207.0 -123.9 -107.8 -128.0 -367.7
Jajapur Available 834.9 582.4 329.9 548.2 579.1 579.1 559.0 172.9Required 1,264.6 1,094.6 924.5 1,384.6 1,600.9 1,879.5 2,234.3 2,682.7Balance -429.7 -512.2 -594.6 -836.4 -1,021.8 -1,300.4 -1,675.2 -2,509.9
Jharsuguda Available 602.2 379.4 156.5 315.2 241.6 241.6 125.5 98.7Required 428.2 720.4 1,012.5 386.7 349.7 326.0 312.1 306.0Balance 174.0 -341.0 -856.0 -71.5 -108.1 -84.4 -186.6 -207.2
Kalahandi Available 738.7 775.6 612.7 864.7 938.4 938.4 994.8 438.6Required 1,458.9 1,255.7 1,571.1 789.6 711.1 651.8 608.4 578.1Balance -720.2 -480.1 -958.4 75.1 227.2 286.5 386.4 -139.5

95 National Dairy Development Board
Part VI : Feed ResourcesDairying in ODiSHa - A Statistical Profile 2016
Districtsavailable/ Required/
balance
Dry Matter availability, Requirement and balance (‘000 MT)
1992 1997 2003 2007 2008 2009 2010 2011Kandhamal Available 88.3 105.7 70.9 140.5 140.7 140.7 88.6
Required 767.0 779.2 890.9 764.8 760.1 767.2 786.3Balance -678.7 -673.5 -820.1 -624.3 -619.3 -626.5 -697.8
Kendrapara Available 357.5 386.3 332.4 382.6 440.2 440.2 484.6 161.5Required 934.8 848.6 1,491.1 975.1 979.6 1,002.6 1,042.0 1,097.1Balance -577.3 -462.3 -1,158.6 -592.5 -539.4 -562.4 -557.4 -935.6
Kendujhar Available 643.9 588.9 533.8 745.6 853.3 853.3 728.2 369.0Required 1,416.2 1,075.9 735.5 1,734.6 1,998.4 2,318.1 2,705.4 3,174.9Balance -772.3 -487.0 -201.7 -989.0 -1,145.1 -1,464.8 -1,977.2 -2,805.9
Khordha Available 315.4 293.4 218.3 412.4 368.4 368.4 417.6 145.7Required 1,259.6 978.9 1,974.5 99.0 81.2 71.6 66.8 65.2Balance -944.2 -685.5 -1,756.3 313.4 287.2 296.8 350.8 80.5
Koraput Available 846.7 714.4 582.1 742.0 714.1 714.1 599.1 347.6Required 1,247.6 1,299.2 1,072.1 1,432.7 1,532.2 1,650.7 1,790.6 1,954.8Balance -400.9 -584.8 -490.0 -690.7 -818.1 -936.6 -1,191.5 -1,607.2
Malkangiri Available 411.0 408.9 342.1 479.8 475.7 475.7 423.3 266.3Required 805.3 1,012.0 752.9 1,183.0 1,228.7 1,280.8 1,339.9 1,406.7Balance -394.3 -603.1 -410.8 -703.2 -753.0 -805.1 -916.7 -1,140.4
Mayurbhanj Available 988.0 1,013.5 834.3 1,141.7 1,192.7 1,192.7 1,069.9 488.4Required 1,771.9 1,769.9 1,892.4 2,014.8 2,223.9 2,480.1 2,793.8 3,178.1Balance -783.9 -756.4 -1,058.1 -873.0 -1,031.1 -1,287.3 -1,723.9 -2,689.7
Nabarangapur Available 586.9 613.8 412.5 761.2 815.0 815.0 914.0 254.3Required 963.0 955.7 1,142.4 870.4 832.6 803.8 782.2 766.7Balance -376.1 -341.9 -730.0 -109.1 -17.7 11.1 131.8 -512.4
Nayagarh Available 361.8 345.5 296.2 427.4 394.8 394.8 418.8 201.0Required 804.6 785.4 969.3 639.9 601.5 571.3 548.3 531.6Balance -442.8 -439.9 -673.1 -212.5 -206.8 -176.6 -129.5 -330.6
Nuapada Available 326.1 345.6 257.6 394.6 433.6 433.6 370.8 215.9Required 609.5 590.9 819.3 399.7 362.5 335.0 314.7 300.2Balance -283.4 -245.3 -561.8 -5.1 71.1 98.7 56.1 -84.3
Puri Available 394.3 434.8 353.7 515.8 472.6 472.6 506.5 178.6Required 1,081.3 854.3 627.3 969.6 1,063.7 1,180.8 1,324.7 1,500.1Balance -687.0 -419.5 -273.6 -453.8 -591.1 -708.2 -818.2 -1,321.5
Rayagada Available 434.1 429.6 400.4 467.8 458.8 458.8 470.4 285.6Required 1,094.6 1,041.1 1,501.6 875.0 881.1 919.8 988.9 1,089.2Balance -660.5 -611.5 -1,101.2 -407.3 -422.2 -460.9 -518.5 -803.6
Sambalpur Available 652.0 582.5 512.9 703.3 758.2 758.2 539.7 310.6Required 915.4 908.0 1,131.3 750.9 696.7 655.5 624.8 603.0Balance -263.4 -325.5 -618.4 -47.6 61.5 102.7 -85.1 -292.5
Subarnapur Available 423.8 405.1 305.3 542.2 504.8 504.8 516.3 141.1Required 891.7 868.9 595.3 321.6 276.0 247.2 230.5 223.2Balance -467.9 -463.8 -290.0 220.6 228.8 257.6 285.8 -82.1
Sundargarh Available 679.6 721.2 637.9 804.5 833.6 833.6 612.3 420.8Required 1,454.3 1,635.9 1,777.0 1,528.1 1,436.9 1,356.8 1,286.8 1,225.7Balance -774.7 -914.7 -1,139.1 -723.6 -603.3 -523.3 -674.5 -804.9
Source: Feedbase 2012, National Institute of Animal Nutrition and Physiology, Bangalore.
96National Dairy Development Board
Part VI : Feed ResourcesDairying in ODiSHa - A Statistical Profile 2016
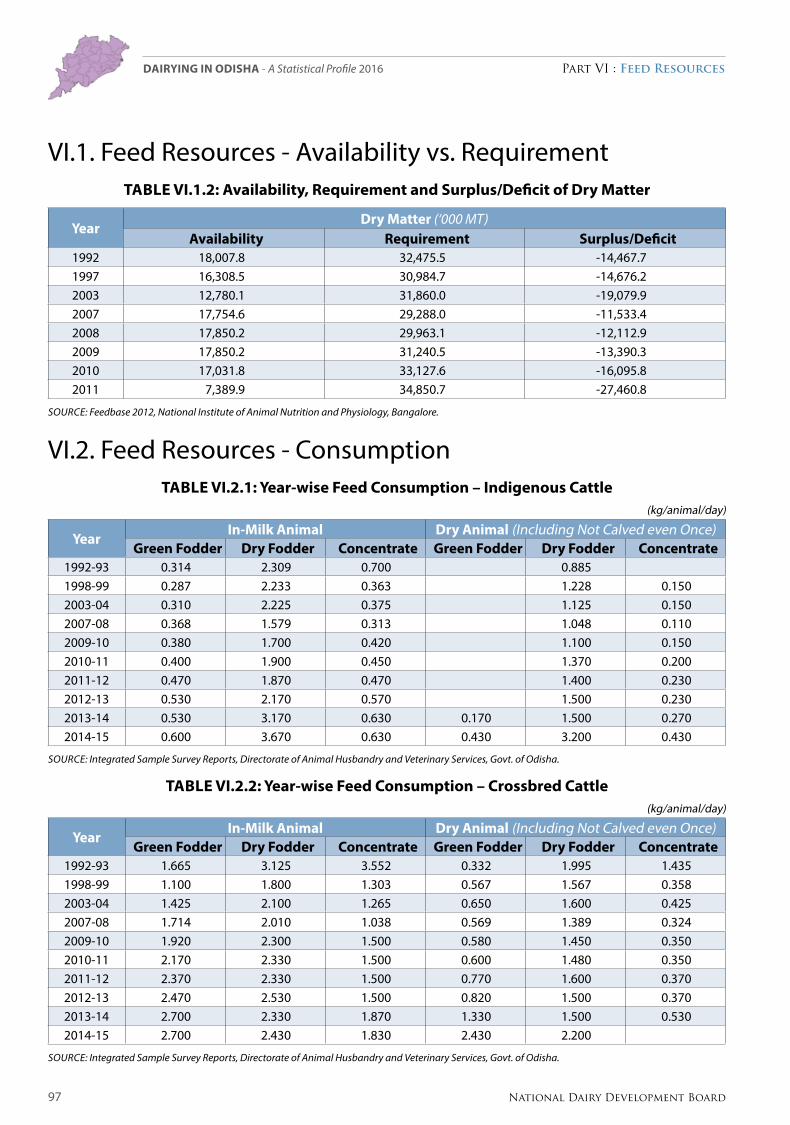
97 National Dairy Development Board
Part VI : Feed ResourcesDairying in ODiSHa - A Statistical Profile 2016
VI.1. Feed Resources - Availability vs. RequirementTable VI.1.2: availability, Requirement and Surplus/Deficit of Dry Matter
YearDry Matter (‘000 MT)
availability Requirement Surplus/Deficit1992 18,007.8 32,475.5 -14,467.71997 16,308.5 30,984.7 -14,676.22003 12,780.1 31,860.0 -19,079.92007 17,754.6 29,288.0 -11,533.42008 17,850.2 29,963.1 -12,112.92009 17,850.2 31,240.5 -13,390.32010 17,031.8 33,127.6 -16,095.82011 7,389.9 34,850.7 -27,460.8
Source: Feedbase 2012, National Institute of Animal Nutrition and Physiology, Bangalore.
VI.2. Feed Resources - ConsumptionTable VI.2.1: Year-wise Feed Consumption – Indigenous Cattle
(kg/animal/day)
YearIn-Milk animal Dry animal (Including Not Calved even Once)
Green Fodder Dry Fodder Concentrate Green Fodder Dry Fodder Concentrate1992-93 0.314 2.309 0.700 0.8851998-99 0.287 2.233 0.363 1.228 0.1502003-04 0.310 2.225 0.375 1.125 0.1502007-08 0.368 1.579 0.313 1.048 0.1102009-10 0.380 1.700 0.420 1.100 0.1502010-11 0.400 1.900 0.450 1.370 0.2002011-12 0.470 1.870 0.470 1.400 0.2302012-13 0.530 2.170 0.570 1.500 0.2302013-14 0.530 3.170 0.630 0.170 1.500 0.2702014-15 0.600 3.670 0.630 0.430 3.200 0.430
Source: Integrated Sample Survey reports, Directorate of Animal Husbandry and Veterinary Services, Govt. of odisha.
Table VI.2.2: Year-wise Feed Consumption – Crossbred Cattle(kg/animal/day)
YearIn-Milk animal Dry animal (Including Not Calved even Once)
Green Fodder Dry Fodder Concentrate Green Fodder Dry Fodder Concentrate1992-93 1.665 3.125 3.552 0.332 1.995 1.4351998-99 1.100 1.800 1.303 0.567 1.567 0.3582003-04 1.425 2.100 1.265 0.650 1.600 0.4252007-08 1.714 2.010 1.038 0.569 1.389 0.3242009-10 1.920 2.300 1.500 0.580 1.450 0.3502010-11 2.170 2.330 1.500 0.600 1.480 0.3502011-12 2.370 2.330 1.500 0.770 1.600 0.3702012-13 2.470 2.530 1.500 0.820 1.500 0.3702013-14 2.700 2.330 1.870 1.330 1.500 0.5302014-15 2.700 2.430 1.830 2.430 2.200
Source: Integrated Sample Survey reports, Directorate of Animal Husbandry and Veterinary Services, Govt. of odisha.
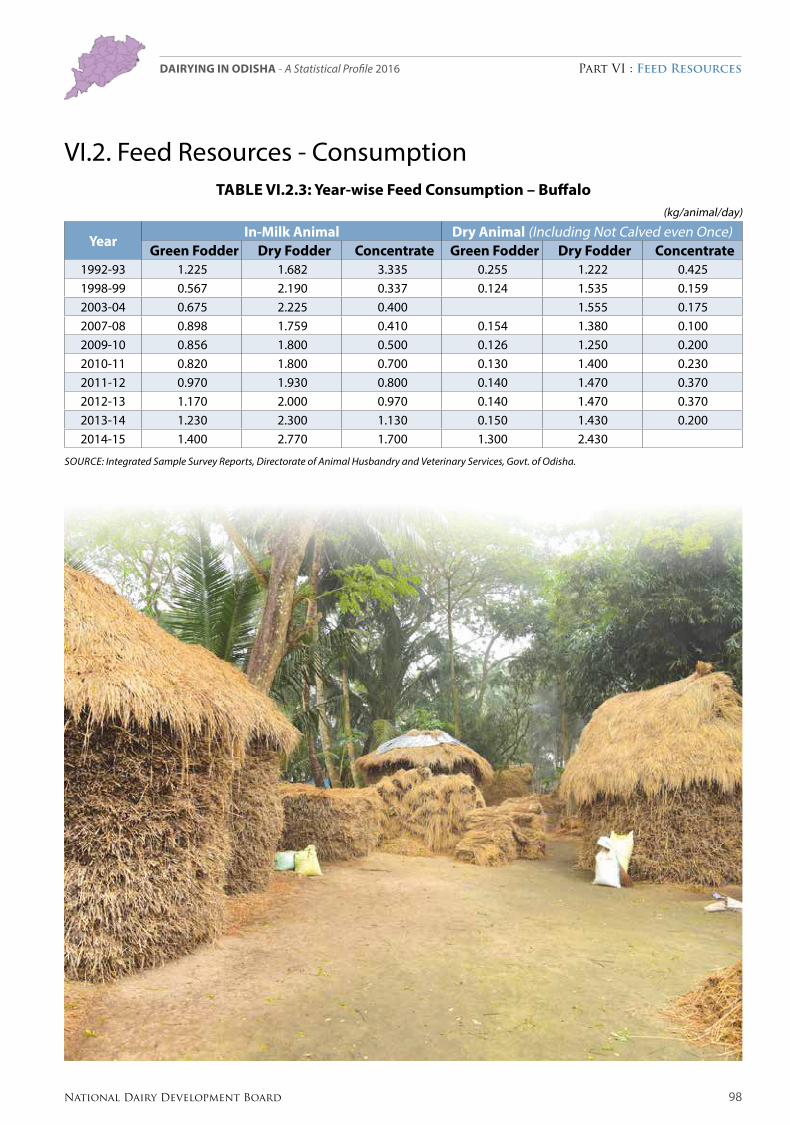
98National Dairy Development Board
Part VI : Feed ResourcesDairying in ODiSHa - A Statistical Profile 2016
VI.2. Feed Resources - ConsumptionTable VI.2.3: Year-wise Feed Consumption – buffalo
(kg/animal/day)
YearIn-Milk animal Dry animal (Including Not Calved even Once)
Green Fodder Dry Fodder Concentrate Green Fodder Dry Fodder Concentrate1992-93 1.225 1.682 3.335 0.255 1.222 0.4251998-99 0.567 2.190 0.337 0.124 1.535 0.1592003-04 0.675 2.225 0.400 1.555 0.1752007-08 0.898 1.759 0.410 0.154 1.380 0.1002009-10 0.856 1.800 0.500 0.126 1.250 0.2002010-11 0.820 1.800 0.700 0.130 1.400 0.2302011-12 0.970 1.930 0.800 0.140 1.470 0.3702012-13 1.170 2.000 0.970 0.140 1.470 0.3702013-14 1.230 2.300 1.130 0.150 1.430 0.2002014-15 1.400 2.770 1.700 1.300 2.430
Source: Integrated Sample Survey reports, Directorate of Animal Husbandry and Veterinary Services, Govt. of odisha.
National Dairy Development Board
Part VII : Agriculture
The agriculture sector in Odisha provides employment and sustenance to more than 60 per cent of the population. Cereals constitute more than 90 per cent of total production of food grains and paddy continues to be the dominant crop. It has more than 35 per cent area under irrigation. However, it has been observed that there has been a gradual shift from paddy to cash crops and from local variety of paddy to HYV paddy.
The sector is susceptible to natural calamities like cyclones, droughts and flash floods which results in wide annual fluctuations in the sectoral growth. The share of agricultural economy to GSDP has been going down over the years. Moreover, there are fluctuations in agricultural income in the state over the years, triggered by environmental factors.
In recent decade, the State economy of Odisha has witnessed a sectoral shift from agriculture towards industry and services sectors. Besides these shifts, agriculture is still being considered as a priority sector for the State and therefore, a new Agricultural Policy is being implemented since 2013. In the drought-hit western part of the state, the current rate of interest on crop loan has been reduced so that small, medium and marginal farmers of the State can continue with farming.

100National Dairy Development Board
Part VII : AgricultureDairying in ODiSHa - A Statistical Profile 2016
Table VII.1.1: Odisha’s agro-climatic Zones
North-Western Plateau North Central Plateau North Eastern Coastal Plain
East and South Eastern Coastal Plain North Eastern Ghat Eastern Ghat High Land
South Eastern Ghat Western Undulating Zone Western Central Table Land
Mid Central Table Land
Source: centre for environmental Studies, Forest and environment Department, Govt. of odisha.
VII.1. Agro-Climatic Zones
Odisha – agro-Climatic Zones
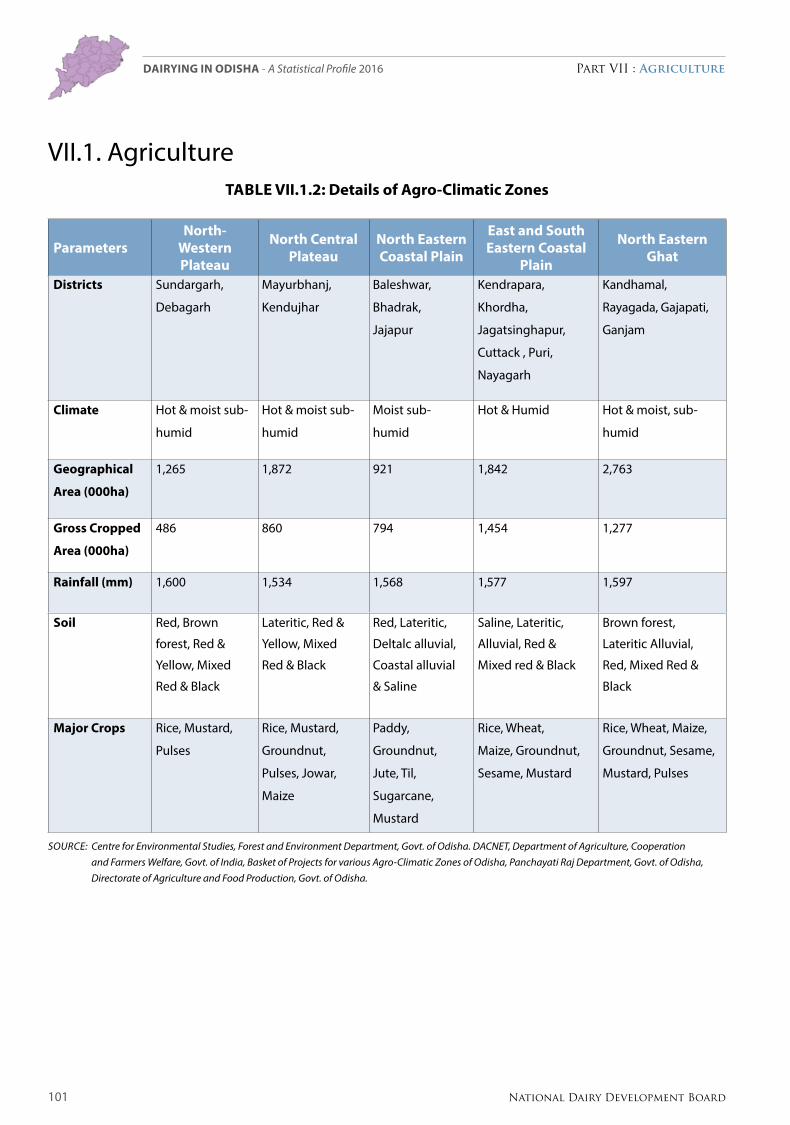
101 National Dairy Development Board
Part VII : AgricultureDairying in ODiSHa - A Statistical Profile 2016
VII.1. AgricultureTable VII.1.2: Details of agro-Climatic Zones
ParametersNorth-
Western Plateau
North Central Plateau
North eastern Coastal Plain
east and South eastern Coastal
Plain
North eastern Ghat
Districts Sundargarh,
Debagarh
Mayurbhanj,
Kendujhar
Baleshwar,
Bhadrak,
Jajapur
Kendrapara,
Khordha,
Jagatsinghapur,
Cuttack , Puri,
Nayagarh
Kandhamal,
Rayagada, Gajapati,
Ganjam
Climate Hot & moist sub-
humid
Hot & moist sub-
humid
Moist sub-
humid
Hot & Humid Hot & moist, sub-
humid
Geographical
area (000ha)
1,265 1,872 921 1,842 2,763
Gross Cropped
area (000ha)
486 860 794 1,454 1,277
Rainfall (mm) 1,600 1,534 1,568 1,577 1,597
Soil Red, Brown
forest, Red &
Yellow, Mixed
Red & Black
Lateritic, Red &
Yellow, Mixed
Red & Black
Red, Lateritic,
Deltalc alluvial,
Coastal alluvial
& Saline
Saline, Lateritic,
Alluvial, Red &
Mixed red & Black
Brown forest,
Lateritic Alluvial,
Red, Mixed Red &
Black
Major Crops Rice, Mustard,
Pulses
Rice, Mustard,
Groundnut,
Pulses, Jowar,
Maize
Paddy,
Groundnut,
Jute, Til,
Sugarcane,
Mustard
Rice, Wheat,
Maize, Groundnut,
Sesame, Mustard
Rice, Wheat, Maize,
Groundnut, Sesame,
Mustard, Pulses
Source: centre for environmental Studies, Forest and environment Department, Govt. of odisha. DAcNeT, Department of Agriculture, cooperation and Farmers Welfare, Govt. of India, Basket of Projects for various Agro-climatic Zones of odisha, Panchayati raj Department, Govt. of odisha, Directorate of Agriculture and Food Production, Govt. of odisha.
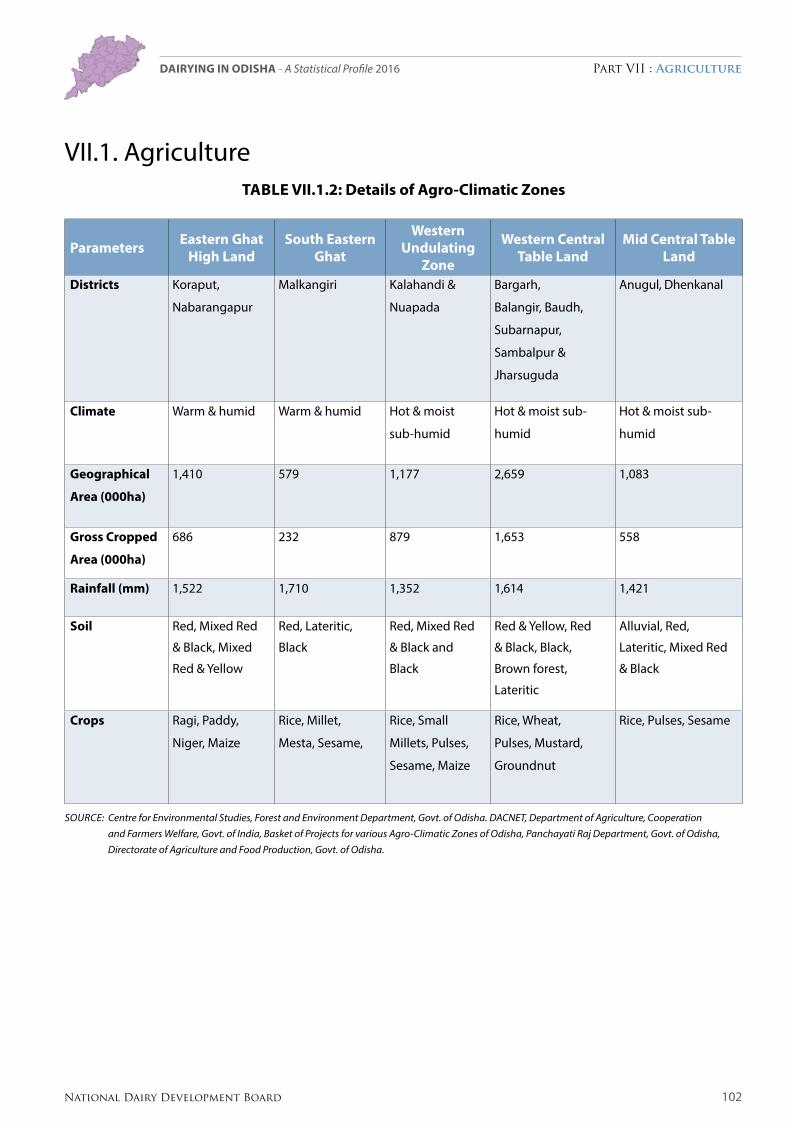
102National Dairy Development Board
Part VII : AgricultureDairying in ODiSHa - A Statistical Profile 2016
VII.1. AgricultureTable VII.1.2: Details of agro-Climatic Zones
Parameters eastern Ghat High land
South eastern Ghat
Western Undulating
Zone
Western Central Table land
Mid Central Table land
Districts Koraput,
Nabarangapur
Malkangiri Kalahandi &
Nuapada
Bargarh,
Balangir, Baudh,
Subarnapur,
Sambalpur &
Jharsuguda
Anugul, Dhenkanal
Climate Warm & humid Warm & humid Hot & moist
sub-humid
Hot & moist sub-
humid
Hot & moist sub-
humid
Geographical
area (000ha)
1,410 579 1,177 2,659 1,083
Gross Cropped
area (000ha)
686 232 879 1,653 558
Rainfall (mm) 1,522 1,710 1,352 1,614 1,421
Soil Red, Mixed Red
& Black, Mixed
Red & Yellow
Red, Lateritic,
Black
Red, Mixed Red
& Black and
Black
Red & Yellow, Red
& Black, Black,
Brown forest,
Lateritic
Alluvial, Red,
Lateritic, Mixed Red
& Black
Crops Ragi, Paddy,
Niger, Maize
Rice, Millet,
Mesta, Sesame,
Rice, Small
Millets, Pulses,
Sesame, Maize
Rice, Wheat,
Pulses, Mustard,
Groundnut
Rice, Pulses, Sesame
Source: centre for environmental Studies, Forest and environment Department, Govt. of odisha. DAcNeT, Department of Agriculture, cooperation and Farmers Welfare, Govt. of India, Basket of Projects for various Agro-climatic Zones of odisha, Panchayati raj Department, Govt. of odisha, Directorate of Agriculture and Food Production, Govt. of odisha.

103 National Dairy Development Board
Part VII : AgricultureDairying in ODiSHa - A Statistical Profile 2016
VII.2. Land Use PatternTable VII.2.1: District-wise land Use Pattern
(‘000 ha)
Districts
Geographical area Forest Permanent
Pasture Fallow land Net Sown area
2003
-04
2013
-14
2003
-04
2013
-14
2003
-04
2013
-14
2003
-04
2013
-14
2003
-04
2013
-14
ODISHa 15,571 15,571 5,813 5,813 443 494 803 985 5,796 5,424
Anugul 623 638 272 272 11 36 32 54 202 179
Balangir 657 657 154 154 32 46 15 67 335 292
Baleshwar 363 381 33 33 12 16 20 64 234 191
Bargarh 584 584 122 122 10 20 26 23 320 332
Baudh 345 310 128 128 17 17 33 8 88 85
Bhadrak 268 250 10 10 14 11 13 11 178 170
Cuttack 373 393 79 79 10 11 35 32 165 157
Debagarh 278 294 156 156 8 5 20 7 64 62
Dhenkanal 460 445 174 174 10 8 65 72 168 134
Gajapati 385 433 247 247 6 12 3 6 80 76
Ganjam 871 821 315 315 20 20 25 23 381 389
Jagatsinghapur 197 167 13 13 7 7 19 21 96 90
Jajapur 289 290 72 72 4 4 27 9 153 141
Jharsuguda 220 208 20 20 31 20 13 30 76 61
Kalahandi 836 792 314 254 23 23 27 59 364 335
Kandhamal 765 802 571 571 10 10 22 27 118 107
Kendrapara 255 264 25 25 8 8 26 31 140 135Kendujhar 830 830 310 310 34 20 16 53 296 245
Khordha 289 281 62 62 6 5 11 27 134 108
Koraput 790 881 188 188 28 45 44 51 276 272
Malkangiri 619 579 335 335 14 21 27 21 135 136
Mayurbhanj 1,042 1,042 439 439 24 28 78 94 399 356
Nabarangapur 529 529 246 246 4 8 18 13 212 181
Nayagarh 424 389 208 208 12 4 1 9 134 126
Nuapada 341 385 125 185 10 2 22 4 158 186
Puri 305 348 14 14 11 9 41 56 141 134
Rayagada 758 707 281 281 26 26 75 38 152 160
Sambalpur 670 666 363 363 12 13 33 32 178 179
Subarnapur 234 234 41 41 13 13 6 14 109 121
Sundargarh 971 971 496 496 16 26 11 29 309 284
Source: : Various Issues of odisha Agriculture Statistics, Directorate of Agriculture and Food Production, Govt. of odisha.
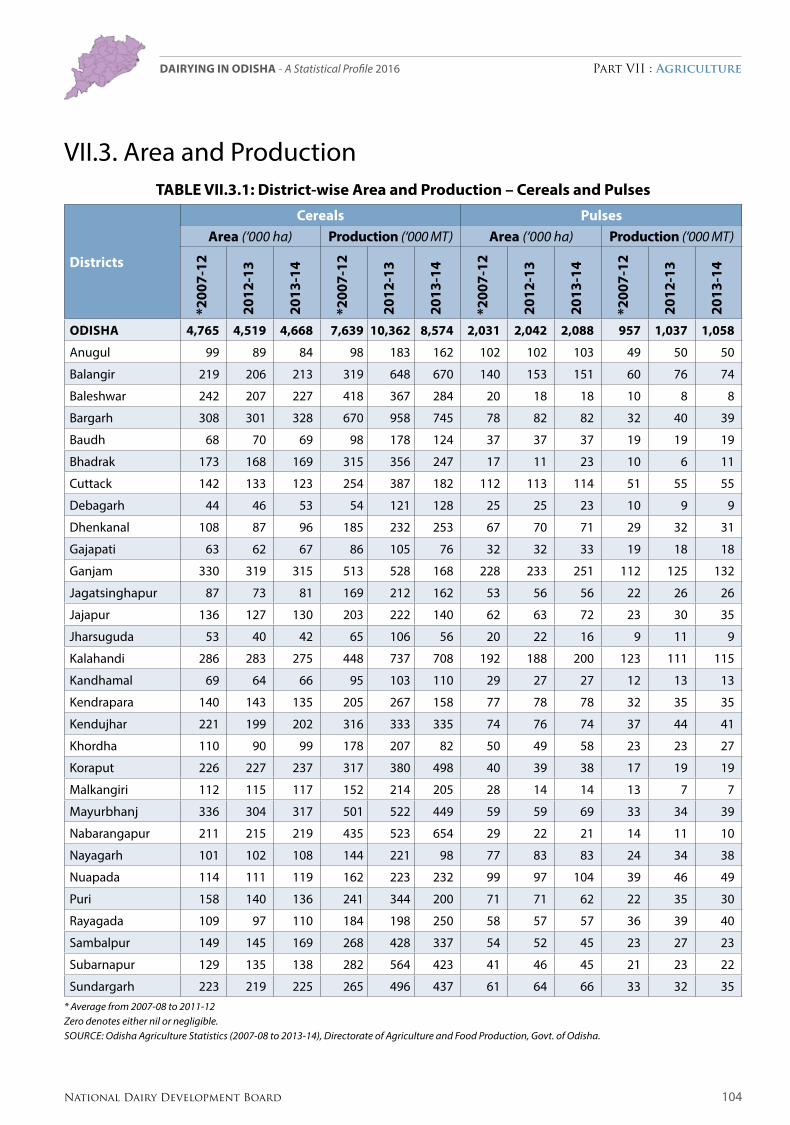
104National Dairy Development Board
Part VII : AgricultureDairying in ODiSHa - A Statistical Profile 2016
VII.3. Area and ProductionTable VII.3.1: District-wise area and Production – Cereals and Pulses
Districts
Cereals Pulsesarea (‘000 ha) Production (‘000 MT) area (‘000 ha) Production (‘000 MT)
*200
7-12
2012
-13
2013
-14
*200
7-12
2012
-13
2013
-14
*200
7-12
2012
-13
2013
-14
*200
7-12
2012
-13
2013
-14
ODISHa 4,765 4,519 4,668 7,639 10,362 8,574 2,031 2,042 2,088 957 1,037 1,058
Anugul 99 89 84 98 183 162 102 102 103 49 50 50
Balangir 219 206 213 319 648 670 140 153 151 60 76 74
Baleshwar 242 207 227 418 367 284 20 18 18 10 8 8
Bargarh 308 301 328 670 958 745 78 82 82 32 40 39
Baudh 68 70 69 98 178 124 37 37 37 19 19 19
Bhadrak 173 168 169 315 356 247 17 11 23 10 6 11
Cuttack 142 133 123 254 387 182 112 113 114 51 55 55
Debagarh 44 46 53 54 121 128 25 25 23 10 9 9
Dhenkanal 108 87 96 185 232 253 67 70 71 29 32 31
Gajapati 63 62 67 86 105 76 32 32 33 19 18 18
Ganjam 330 319 315 513 528 168 228 233 251 112 125 132
Jagatsinghapur 87 73 81 169 212 162 53 56 56 22 26 26
Jajapur 136 127 130 203 222 140 62 63 72 23 30 35
Jharsuguda 53 40 42 65 106 56 20 22 16 9 11 9
Kalahandi 286 283 275 448 737 708 192 188 200 123 111 115
Kandhamal 69 64 66 95 103 110 29 27 27 12 13 13
Kendrapara 140 143 135 205 267 158 77 78 78 32 35 35
Kendujhar 221 199 202 316 333 335 74 76 74 37 44 41
Khordha 110 90 99 178 207 82 50 49 58 23 23 27
Koraput 226 227 237 317 380 498 40 39 38 17 19 19
Malkangiri 112 115 117 152 214 205 28 14 14 13 7 7
Mayurbhanj 336 304 317 501 522 449 59 59 69 33 34 39
Nabarangapur 211 215 219 435 523 654 29 22 21 14 11 10
Nayagarh 101 102 108 144 221 98 77 83 83 24 34 38
Nuapada 114 111 119 162 223 232 99 97 104 39 46 49
Puri 158 140 136 241 344 200 71 71 62 22 35 30
Rayagada 109 97 110 184 198 250 58 57 57 36 39 40
Sambalpur 149 145 169 268 428 337 54 52 45 23 27 23
Subarnapur 129 135 138 282 564 423 41 46 45 21 23 22
Sundargarh 223 219 225 265 496 437 61 64 66 33 32 35* Average from 2007-08 to 2011-12 Zero denotes either nil or negligible. Source: odisha Agriculture Statistics (2007-08 to 2013-14), Directorate of Agriculture and Food Production, Govt. of odisha.
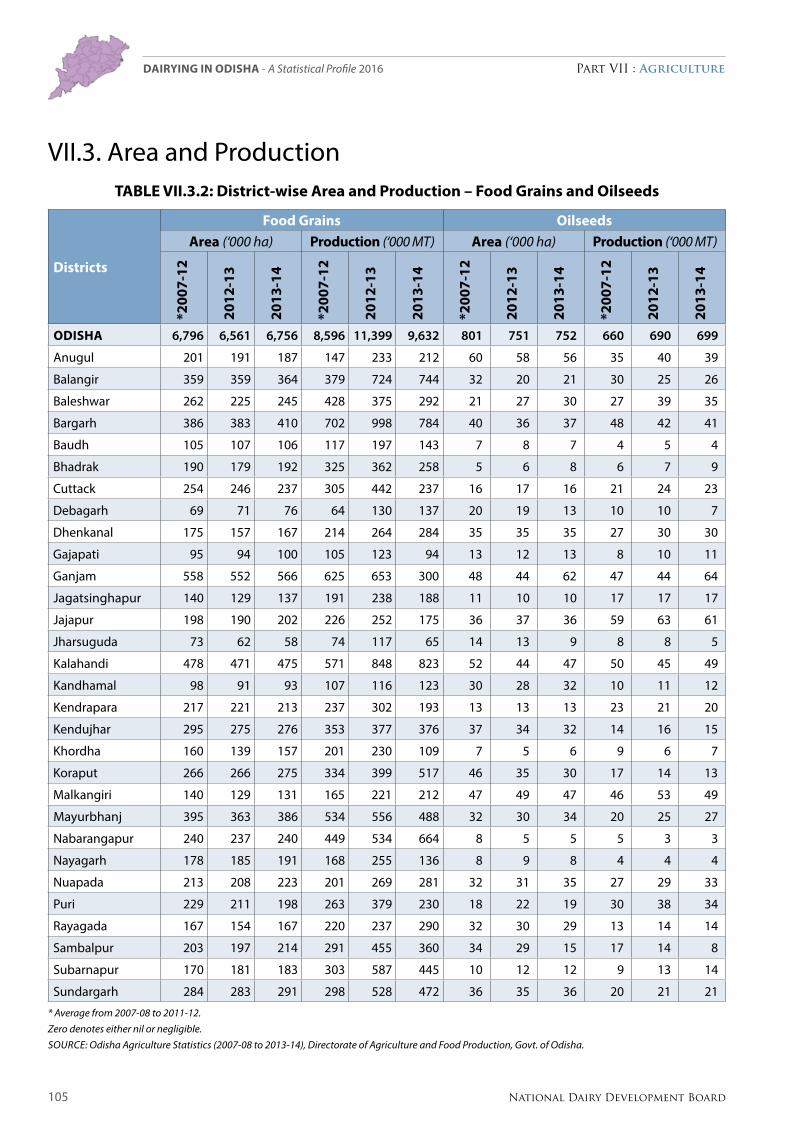
105 National Dairy Development Board
Part VII : AgricultureDairying in ODiSHa - A Statistical Profile 2016
VII.3. Area and ProductionTable VII.3.2: District-wise area and Production – Food Grains and Oilseeds
Districts
Food Grains Oilseeds area (‘000 ha) Production (‘000 MT) area (‘000 ha) Production (‘000 MT)
*200
7-12
2012
-13
2013
-14
*200
7-12
2012
-13
2013
-14
*200
7-12
2012
-13
2013
-14
*200
7-12
2012
-13
2013
-14
ODISHa 6,796 6,561 6,756 8,596 11,399 9,632 801 751 752 660 690 699
Anugul 201 191 187 147 233 212 60 58 56 35 40 39
Balangir 359 359 364 379 724 744 32 20 21 30 25 26
Baleshwar 262 225 245 428 375 292 21 27 30 27 39 35
Bargarh 386 383 410 702 998 784 40 36 37 48 42 41
Baudh 105 107 106 117 197 143 7 8 7 4 5 4
Bhadrak 190 179 192 325 362 258 5 6 8 6 7 9
Cuttack 254 246 237 305 442 237 16 17 16 21 24 23
Debagarh 69 71 76 64 130 137 20 19 13 10 10 7
Dhenkanal 175 157 167 214 264 284 35 35 35 27 30 30
Gajapati 95 94 100 105 123 94 13 12 13 8 10 11
Ganjam 558 552 566 625 653 300 48 44 62 47 44 64
Jagatsinghapur 140 129 137 191 238 188 11 10 10 17 17 17
Jajapur 198 190 202 226 252 175 36 37 36 59 63 61
Jharsuguda 73 62 58 74 117 65 14 13 9 8 8 5
Kalahandi 478 471 475 571 848 823 52 44 47 50 45 49
Kandhamal 98 91 93 107 116 123 30 28 32 10 11 12
Kendrapara 217 221 213 237 302 193 13 13 13 23 21 20
Kendujhar 295 275 276 353 377 376 37 34 32 14 16 15
Khordha 160 139 157 201 230 109 7 5 6 9 6 7
Koraput 266 266 275 334 399 517 46 35 30 17 14 13
Malkangiri 140 129 131 165 221 212 47 49 47 46 53 49
Mayurbhanj 395 363 386 534 556 488 32 30 34 20 25 27
Nabarangapur 240 237 240 449 534 664 8 5 5 5 3 3
Nayagarh 178 185 191 168 255 136 8 9 8 4 4 4
Nuapada 213 208 223 201 269 281 32 31 35 27 29 33
Puri 229 211 198 263 379 230 18 22 19 30 38 34
Rayagada 167 154 167 220 237 290 32 30 29 13 14 14
Sambalpur 203 197 214 291 455 360 34 29 15 17 14 8
Subarnapur 170 181 183 303 587 445 10 12 12 9 13 14
Sundargarh 284 283 291 298 528 472 36 35 36 20 21 21
* Average from 2007-08 to 2011-12.Zero denotes either nil or negligible.Source: odisha Agriculture Statistics (2007-08 to 2013-14), Directorate of Agriculture and Food Production, Govt. of odisha.

106National Dairy Development Board
Part VII : AgricultureDairying in ODiSHa - A Statistical Profile 2016
VII.3. Area and ProductionTable VII.3.3: District-wise area and Production – Sugarcane and Cotton
Districts
Sugarcane Cottonarea (‘000 ha) Production (‘000 MT) area (‘000 ha) Production (‘000 bales)
*200
7-12
2012
-13
2013
-14
*200
7-12
2012
-13
2013
-14
*200
7-12
2012
-13
2013
-14
*200
7-12
2012
-13
2013
-14
ODISHa 38 39 35 2,730 2,604 2,544 68 119 124 178 336 299
Anugul 0.27 0.13 0.07 16.7 9.0 4.1
Balangir 2.34 2.84 2.36 178.6 182.0 171 24.6 38 39.8 58.9 105.9 101.7
Baleshwar 0.35 0.27 0.25 21.7 18.0 15.5
Bargarh 1.01 0.63 0.64 73.9 43.0 47.1 0.2 1 1.7 0.6 3.8 4.3
Baudh 0.13 0.03 0.04 10.1 2.0 2.9 0.1 0.18 0.1 0.4
Bhadrak 0.62 0.43 0.38 45.6 29.0 26.9
Cuttack 2.71 2.98 2.27 163.4 182.0 160
Debagarh 0.04 0.09 0.14 2.4 5.0 8.5
Dhenkanal 0.85 0.9 1.1 57.5 64.0 79.3
Gajapati 0.13 0.05 0.06 10.5 3.0 4.2 0.5 1 1.2 1.4 2.4 3.3
Ganjam 3.11 3.42 3.67 232 223.0 265.9 1.4 2 0.9 2.1 4.1 1
Jagatsinghapur 0.72 0.78 0.79 50.1 47.0 56.5
Jajapur 1.28 2.07 2.07 77.3 132.0 144.5
Jharsuguda 0.11 0.24 0.24 9.2 16.0 18.3
Kalahandi 1.61 1.82 2.02 119.5 124.0 135 23.7 43 43.1 60.4 122.9 84.3
Kandhamal 0.01 0.01 0.01 0.4 1.0 0.5 0 0 0.6 0.1 0.8 1.4
Kendrapara 0.4 0.5 0.49 27.1 26.0 34.2
Kendujhar 0.13 0.07 0.05 7.7 5.0 3.4
Khordha 1.38 1.13 0.98 94.8 72.0 65.4
Koraput 10.36 10.64 9.98 860.8 738.0 788.2 0.2 1 1.2 0.4 2.7 3.4
Malkangiri 0.03 0.01 0.01 1.2 1.0 0.5
Mayurbhanj 0.12 0.03 0 6.2 2.0 0
Nabarangapur 4.18 4.3 4.26 222.9 284.0 268.6
Nayagarh 5.48 4.5 2.5 370.1 315.0 178.1
Nuapada 0.04 0.07 0.05 2 5.0 3.1 2.2 5 5.2 5.3 12.5 10.4
Puri 0.52 0.41 0.18 32.9 27.0 12.2
Rayagada 0.16 0.22 0.24 10.2 14.0 15.5 14.2 25 26.7 47.6 74.6 78.4
Sambalpur 0.06 0.05 0.05 3.4 3.0 3.3
Subarnapur 0.3 0.49 0.35 19.7 32.0 24.6 0.6 2 3.5 1.4 6.6 10.3
Sundargarh 0.04 0.06 0.09 2.8 4.0 6.3
* Average from 2007-08 to 2011-12. 1 bale = 170 kg.Zero denotes either nil or negligible.Source: odisha Agriculture Statistics (2007-08 to 2013-14), Directorate of Agriculture and Food Production, Govt. of odisha.
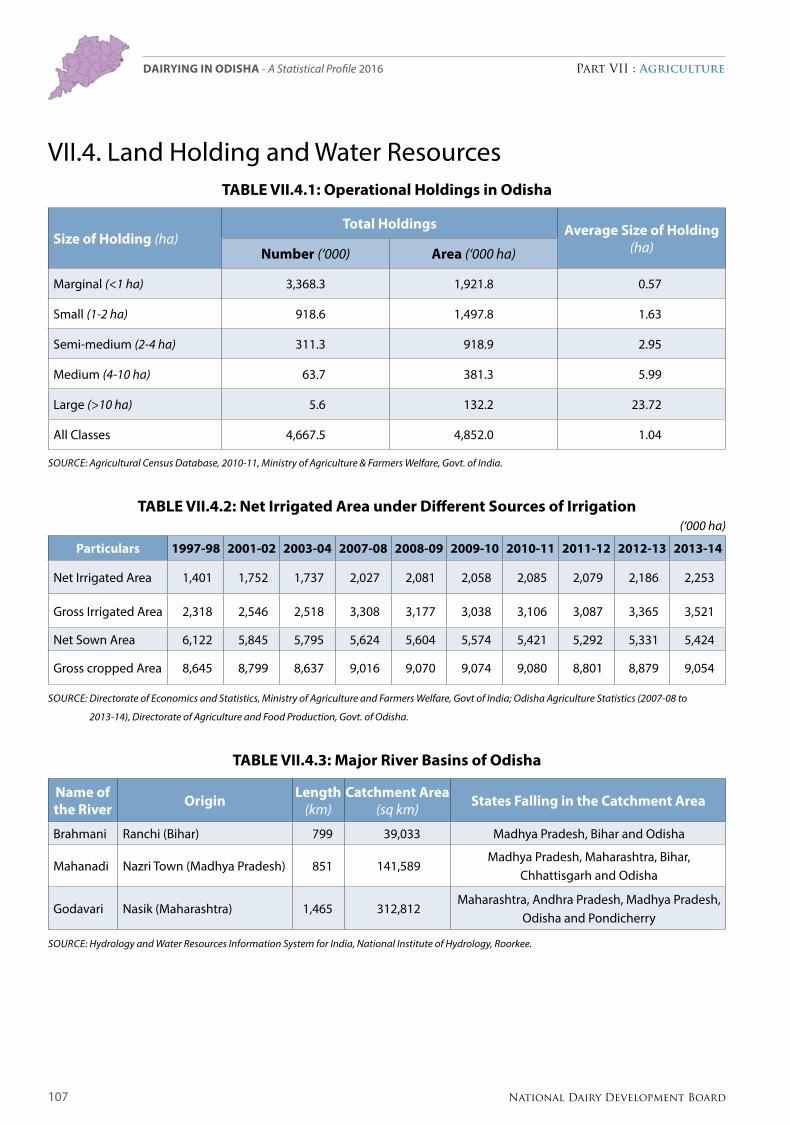
107 National Dairy Development Board
Part VII : AgricultureDairying in ODiSHa - A Statistical Profile 2016
VII.4. Land Holding and Water ResourcesTable VII.4.1: Operational Holdings in Odisha
Size of Holding (ha)Total Holdings average Size of Holding
(ha)Number (‘000) area (‘000 ha)
Marginal (<1 ha) 3,368.3 1,921.8 0.57
Small (1-2 ha) 918.6 1,497.8 1.63
Semi-medium (2-4 ha) 311.3 918.9 2.95
Medium (4-10 ha) 63.7 381.3 5.99
Large (>10 ha) 5.6 132.2 23.72
All Classes 4,667.5 4,852.0 1.04
Source: Agricultural census Database, 2010-11, Ministry of Agriculture & Farmers Welfare, Govt. of India.
Table VII.4.2: Net Irrigated area under Different Sources of Irrigation(‘000 ha)
Particulars 1997-98 2001-02 2003-04 2007-08 2008-09 2009-10 2010-11 2011-12 2012-13 2013-14
Net Irrigated Area 1,401 1,752 1,737 2,027 2,081 2,058 2,085 2,079 2,186 2,253
Gross Irrigated Area 2,318 2,546 2,518 3,308 3,177 3,038 3,106 3,087 3,365 3,521
Net Sown Area 6,122 5,845 5,795 5,624 5,604 5,574 5,421 5,292 5,331 5,424
Gross cropped Area 8,645 8,799 8,637 9,016 9,070 9,074 9,080 8,801 8,879 9,054
Source: Directorate of economics and Statistics, Ministry of Agriculture and Farmers Welfare, Govt of India; odisha Agriculture Statistics (2007-08 to
2013-14), Directorate of Agriculture and Food Production, Govt. of odisha.
Table VII.4.3: Major River basins of Odisha
Name of the River Origin length
(km)Catchment area
(sq km) States Falling in the Catchment area
Brahmani Ranchi (Bihar) 799 39,033 Madhya Pradesh, Bihar and Odisha
Mahanadi Nazri Town (Madhya Pradesh) 851 141,589Madhya Pradesh, Maharashtra, Bihar,
Chhattisgarh and Odisha
Godavari Nasik (Maharashtra) 1,465 312,812Maharashtra, Andhra Pradesh, Madhya Pradesh,
Odisha and Pondicherry
Source: Hydrology and Water resources Information System for India, National Institute of Hydrology, roorkee.

108National Dairy Development Board
Part VII : AgricultureDairying in ODiSHa - A Statistical Profile 2016
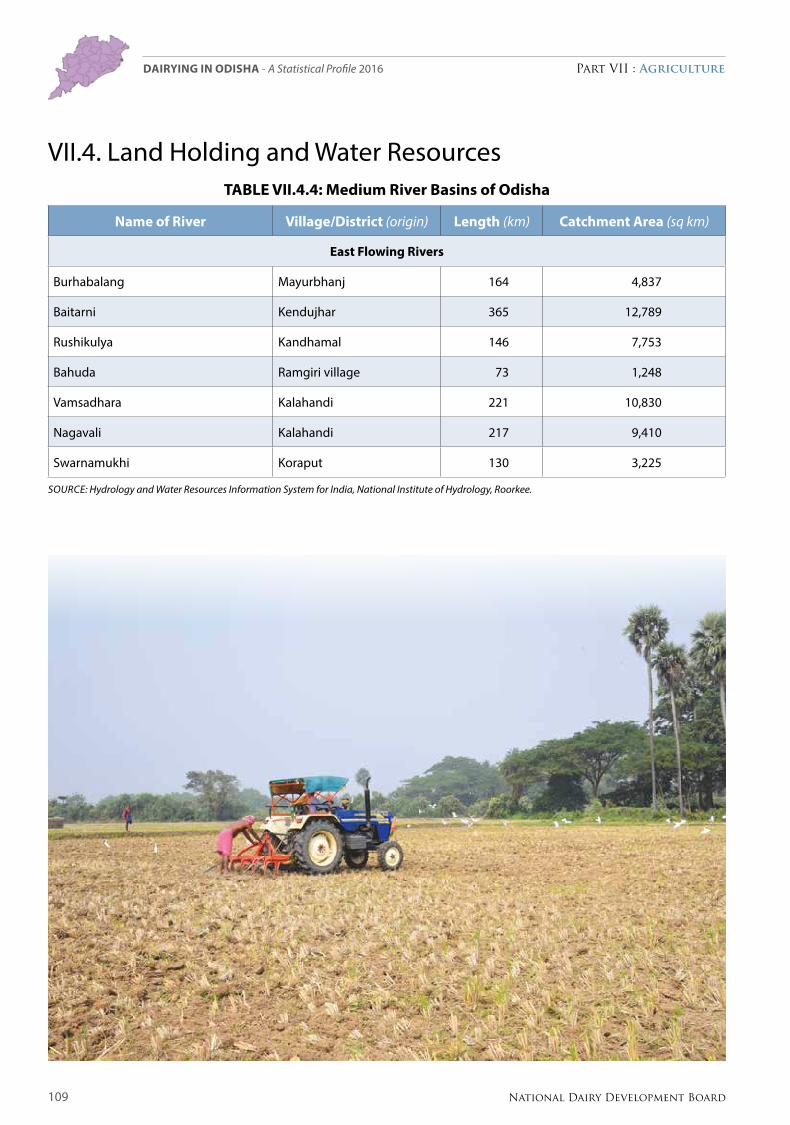
109 National Dairy Development Board
Part VII : AgricultureDairying in ODiSHa - A Statistical Profile 2016
VII.4. Land Holding and Water ResourcesTable VII.4.4: Medium River basins of Odisha
Name of River Village/District (origin) length (km) Catchment area (sq km)
east Flowing Rivers
Burhabalang Mayurbhanj 164 4,837
Baitarni Kendujhar 365 12,789
Rushikulya Kandhamal 146 7,753
Bahuda Ramgiri village 73 1,248
Vamsadhara Kalahandi 221 10,830
Nagavali Kalahandi 217 9,410
Swarnamukhi Koraput 130 3,225
Source: Hydrology and Water resources Information System for India, National Institute of Hydrology, roorkee.

110National Dairy Development Board
Part VII : AgricultureDairying in ODiSHa - A Statistical Profile 2016
VII.5. RainfallTable VII.5.1: District- wise average annual Rainfall
Districtsaverage annual Rainfall (mm)
2007 - 2011 2012 2013
ODISHa 1,449 1,384 1,653
Anugul 1,244 1,389 1,445
Balangir 1,346 1,268 1,423
Baleshwar 1,644 1,029 2,094
Bargarh 1,259 1,470 1,243
Baudh 1,406 1,221 1,170
Bhadrak 1,464 966 1,794
Cuttack 1,686 1,635 1,492
Debagarh 1,344 1,386 1,466
Dhenkanal 1,424 1,478 1,640
Gajapati 1,290 1,364 1,782
Ganjam 1,178 1,220 1,972
Jagatsinghapur 1,492 1,102 1,279
Jajapur 1,590 1,382 1,898
Jharsuguda 1,441 1,800 1,292
Kalahandi 1,597 1,423 1,856
Kandhamal 1,576 1,553 1,705
Kendrapara 1,525 1,119 1,714
Kendujhar 1,655 1,254 1,651
Khordha 1,368 1,331 1,873
Koraput 1,370 1,508 1,831
Malkangiri 1,413 1,718 1,783
Mayurbhanj 1,657 1,290 2,246
Nabarangapur 1,856 1,685 1,999
Nayagarh 1,392 1,735 2,055
Nuapada 1,230 929 1,455
Puri 1,337 1,265 1,765
Rayagada 1,314 1,287 1,486
Sambalpur 1,608 1,887 1,424
Subarnapur 1,355 1,404 1,315
Sundargarh 1,428 1,427 1,451
Source: odisha Agriculture Statistics (2007-08 to 2013-14), Directorate of Agriculture and Food Production, Govt. of odisha.
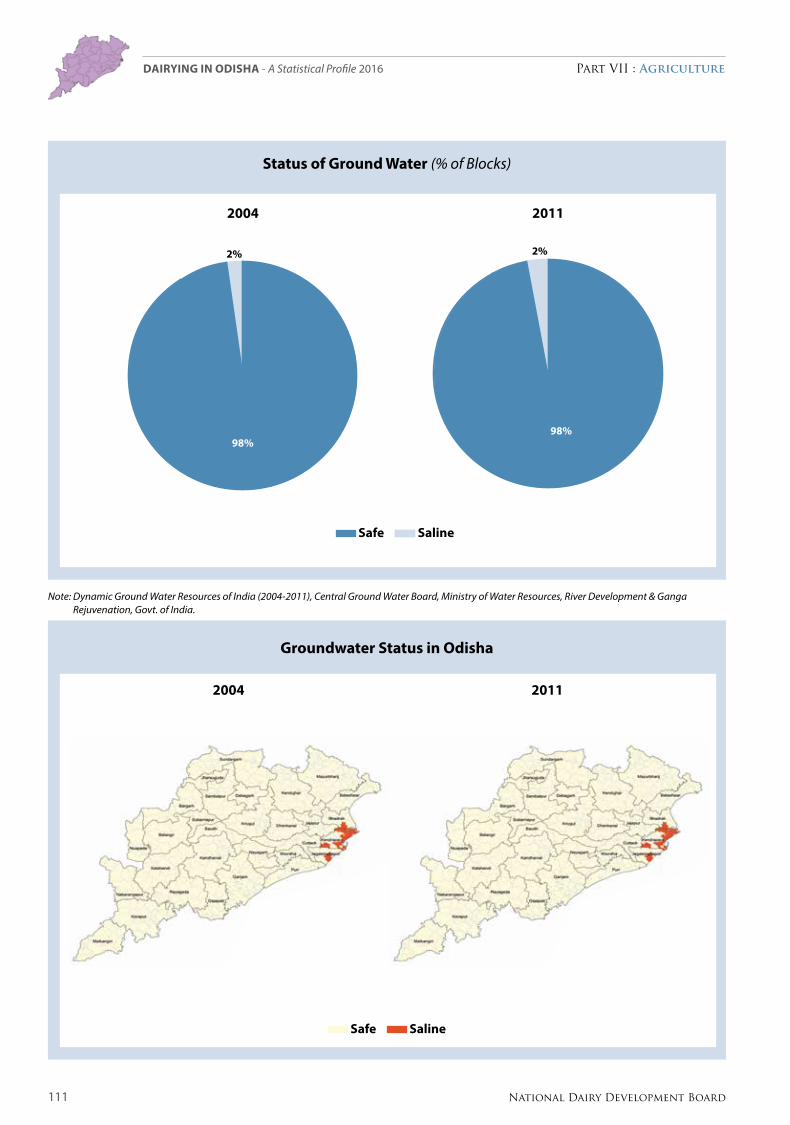
111 National Dairy Development Board
Part VII : AgricultureDairying in ODiSHa - A Statistical Profile 2016
Status of Ground Water (% of Blocks)
Safe Saline
2004 2011
Groundwater Status in Odisha
2004 2011
Safe Saline
Note: Dynamic Ground Water resources of India (2004-2011), central Ground Water Board, Ministry of Water resources, river Development & Ganga rejuvenation, Govt. of India.
98%
2%
98%
2%
112National Dairy Development Board
Part VII : AgricultureDairying in ODiSHa - A Statistical Profile 2016

113 National Dairy Development Board
Part VIII : Policies and schemes for dairy development In Odisha
The Department of Fisheries & Animal Resources Development Department (F&ARD) in Odisha came into existence in 1991 after being bifurcated from the erstwhile Forest, Fisheries & Animal Resources Development Department. Within F&ARD, there is a Directorate for Animal Husbandry & Veterinary Services (AH&VS) which is headed by a Director. In the field, AH&VS has thirteen Chief District Veterinary Officers in charge of 13 districts and in remaining 17 districts, the Sub-Divisional Veterinary Officers functioning in the district headquarter are looking after the districts affairs. Besides, there is a Frozen Semen Bank and 2 Orissa Biological Product Institutes. There are 540 veterinary hospitals (VDs), about 3,000 Livestock Aid Centres (LAC) to provide veterinary services. The activities of the department are supported by:
i) Odisha Livestock Resource Development Society (OLRDS): Formed and registered in 2000 for spearheading livestock breeding activities and ensuring timely and meaningful implementation of National Project for Cattle & Buffalo Breeding” (NPCBB) in the State of Orissa for breeding activities;
114National Dairy Development Board
Part VIII : Policies and schemes
for dairy development in Odisha
Dairying in ODiSHa - A Statistical Profile 2016
ii) The Odisha Cooperative Milk Producers Federation Ltd (OMFED): Established in the year 1980, the major objectives of the Federation is to carry out activities for promoting production, procurement, processing and marketing of milk and milk products for economic development of the rural dairy farming community.
iii) Utkal Gomangal Samiti (UGS): Established in the year 1936, the aim and objectives of the Samiti is to bring all round development of the livestock through up-gradation of local indigenous stock by providing improved bulls, Cows, Calves, Buffalo Bulls and Bucks etc. and to propagate different types of fodder cultivation, Cattle Feed and encourage public for the same.
iv) State Society for Prevention of Cruelty to Animals (SPCA) 59 of 1960 (Central Act): In 1976, Government of Odisha has enforced the Act in the state for wellbeing of animals. The main objective of this act is to generate public consciousness towards kindness and compassion to animals. Besides this, Animal Birth Control Programme (ABC), relief and rescue operation, animal health camp, media programmes, relief and rescue operations are also organised.
The ongoing schemes can be classified into four categories viz.A. Central Schemes for animal husbandry;B. States Schemes for animal husbandry; C. Central Schemes for dairy development;D. State Plan for dairy development – a) state sector & b) district sector.
ANIMAL HUSBANDRY
A. CENTRAL SCHEMES FOR ANIMAL HUSBANDRY (BUDGET HEAD 2403 – AH)
Central Scheme :
National Livestock Health and Disease Control Programme (LH & DC)
A.1 Assistance to States for Control of animal disease
This Centrally Sponsored Scheme is implemented with funding pattern of 75:25 as CS: SS. It aims to control livestock diseases through conducting mass vaccination and diagnosis of diseases in the newly established DDLs to reduce the morbidity & mortality of animals.
A.2 Establishment & Strengthening of existing Veterinary Hospitals & Dispensaries (ESVHD)
This Centrally Sponsored Scheme is implemented with funding pattern of 75:25 as CS: SS. It has been proposed to strengthen the existing veterinary hospitals
National Livestock Mission
A.3 Sub - Mission Livestock Development It addresses the concerns pertaining to Poultry, Sheep & Goat development in the State.
A.4 Sub- Mission: Fodder and Feed Development It aims to encourage the farmers for take up production of high yielding varieties of fodders to meet the feed and fodder demand. It envisages to procure seed from the Central Govt. Seed Production Farms.
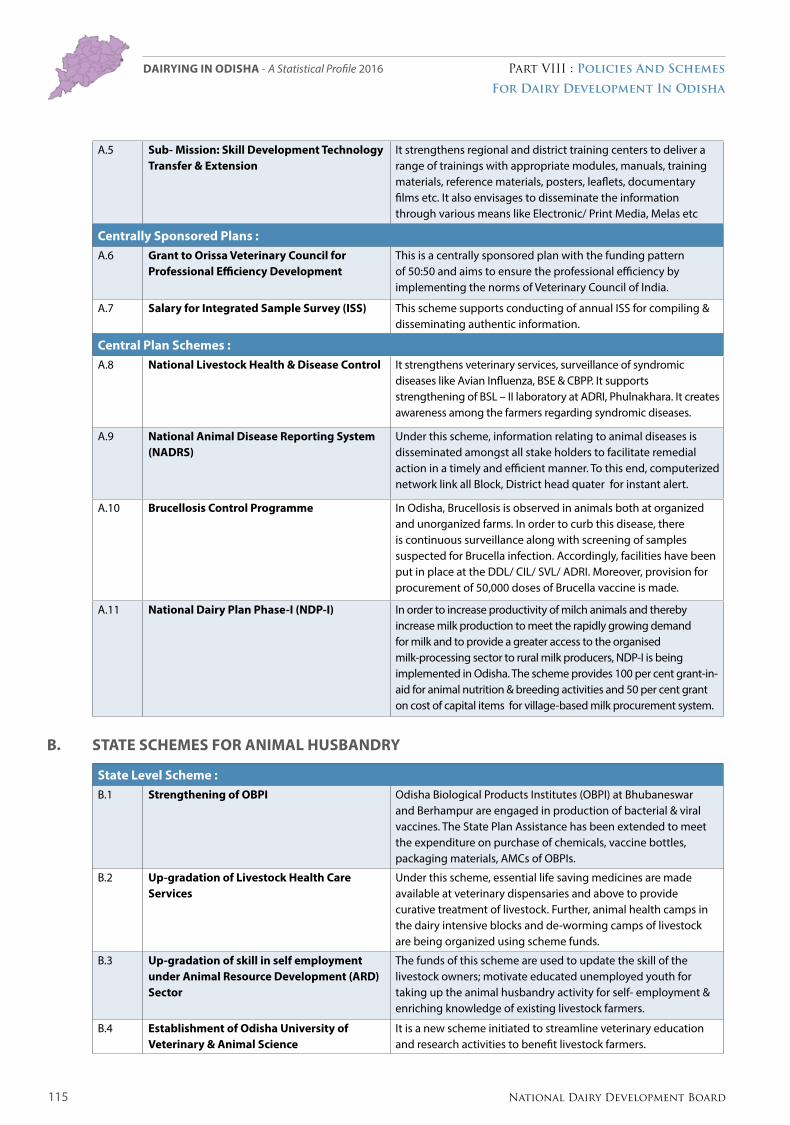
115 National Dairy Development Board
Part VIII : Policies and schemes
for dairy development in Odisha
Dairying in ODiSHa - A Statistical Profile 2016
A.5 Sub- Mission: Skill Development Technology Transfer & Extension
It strengthens regional and district training centers to deliver a range of trainings with appropriate modules, manuals, training materials, reference materials, posters, leaflets, documentary films etc. It also envisages to disseminate the information through various means like Electronic/ Print Media, Melas etc
Centrally Sponsored Plans :A.6 Grant to Orissa Veterinary Council for
Professional Efficiency Development This is a centrally sponsored plan with the funding pattern of 50:50 and aims to ensure the professional efficiency by implementing the norms of Veterinary Council of India.
A.7 Salary for Integrated Sample Survey (ISS) This scheme supports conducting of annual ISS for compiling & disseminating authentic information.
Central Plan Schemes :A.8 National Livestock Health & Disease Control It strengthens veterinary services, surveillance of syndromic
diseases like Avian Influenza, BSE & CBPP. It supports strengthening of BSL – II laboratory at ADRI, Phulnakhara. It creates awareness among the farmers regarding syndromic diseases.
A.9 National Animal Disease Reporting System (NADRS)
Under this scheme, information relating to animal diseases is disseminated amongst all stake holders to facilitate remedial action in a timely and efficient manner. To this end, computerized network link all Block, District head quater for instant alert.
A.10 Brucellosis Control Programme In Odisha, Brucellosis is observed in animals both at organized and unorganized farms. In order to curb this disease, there is continuous surveillance along with screening of samples suspected for Brucella infection. Accordingly, facilities have been put in place at the DDL/ CIL/ SVL/ ADRI. Moreover, provision for procurement of 50,000 doses of Brucella vaccine is made.
A.11 National Dairy Plan Phase-I (NDP-I) In order to increase productivity of milch animals and thereby increase milk production to meet the rapidly growing demand for milk and to provide a greater access to the organised milk-processing sector to rural milk producers, NDP-I is being implemented in Odisha. The scheme provides 100 per cent grant-in-aid for animal nutrition & breeding activities and 50 per cent grant on cost of capital items for village-based milk procurement system.
B. STATE SCHEMES FOR ANIMAL HUSBANDRY
State Level Scheme :B.1 Strengthening of OBPI Odisha Biological Products Institutes (OBPI) at Bhubaneswar
and Berhampur are engaged in production of bacterial & viral vaccines. The State Plan Assistance has been extended to meet the expenditure on purchase of chemicals, vaccine bottles, packaging materials, AMCs of OBPIs.
B.2 Up-gradation of Livestock Health Care Services
Under this scheme, essential life saving medicines are made available at veterinary dispensaries and above to provide curative treatment of livestock. Further, animal health camps in the dairy intensive blocks and de-worming camps of livestock are being organized using scheme funds.
B.3 Up-gradation of skill in self employment under Animal Resource Development (ARD) Sector
The funds of this scheme are used to update the skill of the livestock owners; motivate educated unemployed youth for taking up the animal husbandry activity for self- employment & enriching knowledge of existing livestock farmers.
B.4 Establishment of Odisha University of Veterinary & Animal Science
It is a new scheme initiated to streamline veterinary education and research activities to benefit livestock farmers.
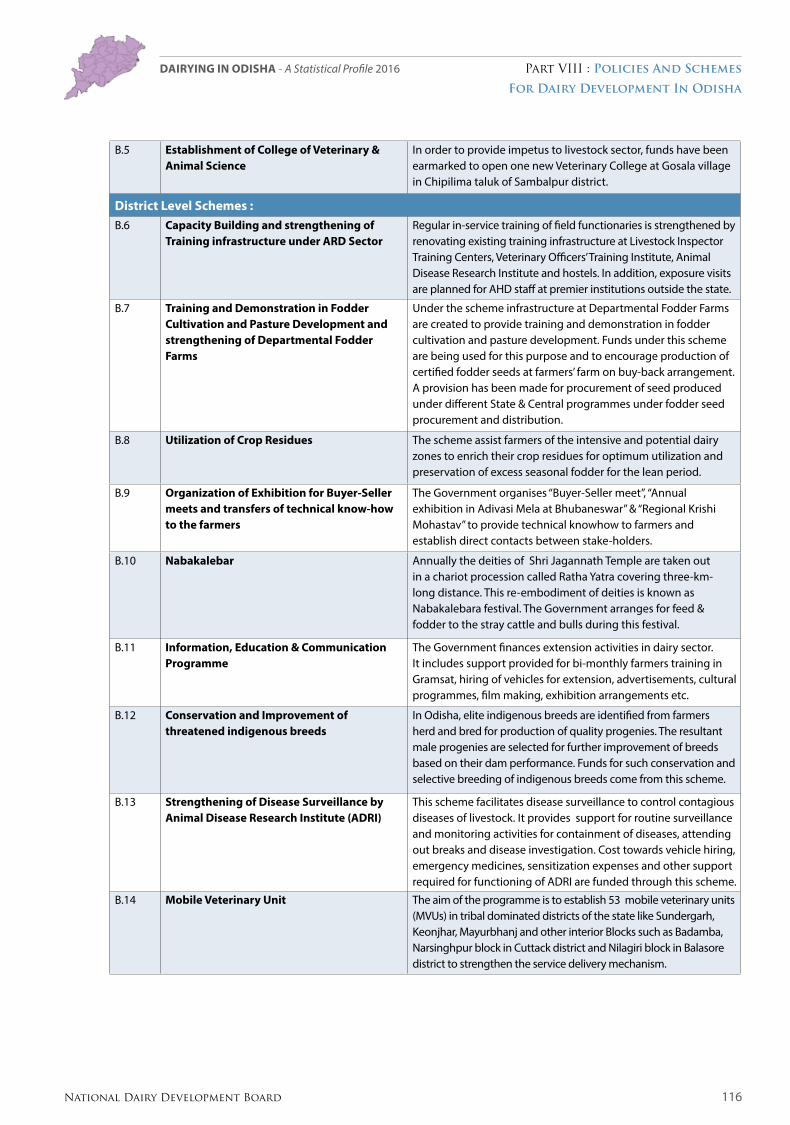
116National Dairy Development Board
Part VIII : Policies and schemes
for dairy development in Odisha
Dairying in ODiSHa - A Statistical Profile 2016
B.5 Establishment of College of Veterinary & Animal Science
In order to provide impetus to livestock sector, funds have been earmarked to open one new Veterinary College at Gosala village in Chipilima taluk of Sambalpur district.
District Level Schemes :B.6 Capacity Building and strengthening of
Training infrastructure under ARD SectorRegular in-service training of field functionaries is strengthened by renovating existing training infrastructure at Livestock Inspector Training Centers, Veterinary Officers’ Training Institute, Animal Disease Research Institute and hostels. In addition, exposure visits are planned for AHD staff at premier institutions outside the state.
B.7 Training and Demonstration in Fodder Cultivation and Pasture Development and strengthening of Departmental Fodder Farms
Under the scheme infrastructure at Departmental Fodder Farms are created to provide training and demonstration in fodder cultivation and pasture development. Funds under this scheme are being used for this purpose and to encourage production of certified fodder seeds at farmers’ farm on buy-back arrangement. A provision has been made for procurement of seed produced under different State & Central programmes under fodder seed procurement and distribution.
B.8 Utilization of Crop Residues The scheme assist farmers of the intensive and potential dairy zones to enrich their crop residues for optimum utilization and preservation of excess seasonal fodder for the lean period.
B.9 Organization of Exhibition for Buyer-Seller meets and transfers of technical know-how to the farmers
The Government organises “Buyer-Seller meet”, “Annual exhibition in Adivasi Mela at Bhubaneswar” & “Regional Krishi Mohastav” to provide technical knowhow to farmers and establish direct contacts between stake-holders.
B.10 Nabakalebar Annually the deities of Shri Jagannath Temple are taken out in a chariot procession called Ratha Yatra covering three-km-long distance. This re-embodiment of deities is known as Nabakalebara festival. The Government arranges for feed & fodder to the stray cattle and bulls during this festival.
B.11 Information, Education & Communication Programme
The Government finances extension activities in dairy sector. It includes support provided for bi-monthly farmers training in Gramsat, hiring of vehicles for extension, advertisements, cultural programmes, film making, exhibition arrangements etc.
B.12 Conservation and Improvement of threatened indigenous breeds
In Odisha, elite indigenous breeds are identified from farmers herd and bred for production of quality progenies. The resultant male progenies are selected for further improvement of breeds based on their dam performance. Funds for such conservation and selective breeding of indigenous breeds come from this scheme.
B.13 Strengthening of Disease Surveillance by Animal Disease Research Institute (ADRI)
This scheme facilitates disease surveillance to control contagious diseases of livestock. It provides support for routine surveillance and monitoring activities for containment of diseases, attending out breaks and disease investigation. Cost towards vehicle hiring, emergency medicines, sensitization expenses and other support required for functioning of ADRI are funded through this scheme.
B.14 Mobile Veterinary Unit The aim of the programme is to establish 53 mobile veterinary units (MVUs) in tribal dominated districts of the state like Sundergarh, Keonjhar, Mayurbhanj and other interior Blocks such as Badamba, Narsinghpur block in Cuttack district and Nilagiri block in Balasore district to strengthen the service delivery mechanism.

117 National Dairy Development Board
Part VIII : Policies and schemes
for dairy development in Odisha
Dairying in ODiSHa - A Statistical Profile 2016
DAIRY DEVELOPMENT
C. CENTRALLY SPONSORED SCHEMES UNDER BUDGET HEAD 2404-DD
C.1 Strengthening of Infrastructure for Quality & Clean Milk Production Programme (CMP)
This scheme is implemented through OMFED to strengthen the infrastructure for Quality & Clean Milk Production Programme (CMP). The Organisation share is being borne by OMFED. It is being implemented by OMFED in the District of Ganjam, Bolangir, Kalahandi, Nuapada, Koraput, Malkangiri, Nawarangpur & Raygada districts of Odisha. Under the project, the farmers are trained This project includes training of farmer, supply of 5 ltr Stainless Steel Milk Can & distribution of Safkit & laboratory equipment for BMC Level for Clean Milk Production.
C.2 National Programme for Bovine Breeding (NPBB)
The major objectives of the programme is to strengthen liquid nitrogen transport system; cure infertility control amongst dairy animals; extension & strengthening of the breeding network to cover more number of breedable bovines etc.
C.3 National Programme for Dairy Development (NPDD)
This is a new project being implemented by OMFED under NPDD. The aim of the scheme is to organize Dairy Cooperative societies, support members, install BMCs, up-grade skills, provide margin money, expand processing plants etc.
C.4 Intensive Dairy Development Programme (IDDP)
The IDDP Projects are being implemented by OMFED in different districts of Odisha like IDDP-VII project is implemented in Jagatsinghpur, Kendrapada & Nayagarh districts, IDDP-VIII in Koraput, Malkanagiri, Nawarangpur & Raygada districts, IDDP-IX in Ganjam & Gajapati districts, IDDP-X (Sambalpur, Baragarh, Jharsuguda, Sonepur & Deogarh districts).
D. DAIRY DEVELOPMENT-STATE PLAN UNDER BUDGET HEAD 2404-DD
State Sector :D.1 Strengthening of Dairy Organization The scheme envisages supply of breeding inputs to field
Frozen Semen Artificial Insemination (FSAI) centres of the AH department as well as Gomitra centers for conducting AIs and production of CB females. Identified bull mother farms of the State are being strengthened to rear quality bull mothers for production of donor bulls for the future. To this end, a MOU has been signed with NDDB to establish the Sperm Station for Eastern Region at Kathpal.
D.2 Promotion to Dairy Entrepreneurship The scheme facilitates dairy entrepreneurs to set-up modern dairy farms having 2 to 10 animals. As per the scheme, 10 per cent is entrepreneur’s margin, 25 per cent comes as capital subsidy (33.33 per cent for SC/ST beneficiaries) from state government and balance is financed by banks. The primary objective is to generate self-employment.
118National Dairy Development Board
Part VIII : Policies and schemes
for dairy development in Odisha
Dairying in ODiSHa - A Statistical Profile 2016
119 National Dairy Development Board
Part VIII : Policies and schemes
for dairy development in Odisha
Dairying in ODiSHa - A Statistical Profile 2016
District level :D.3 Interest Subvention on Long Term Credit
Support to Dairy FarmersLivestock farmers used to avail term loan from banks for equipments, machineries, shed, procurement of livestock and other activities towards asset creation in dairy farming through the ongoing schemes like DEDS, PDE, self finance etc. In order to increase the uptake of term loan in the state, the government provides interest subsidy/ subvention of 3 per cent of the interest rate charged on term loan availed by the dairy farmers. Further, additional interest subvention of 2 per cent will be provided to the farmers for regular/ timely repayment of their loan installment/ dues. The upper ceiling of project cost will be ` 10.00 lakh for availing the interest subvention.
D.4 Interest Subvention on Short Term Credit Support to Dairy Farmers
The scheme intends to facilitate credit linkage for livestock farming. Under the scheme, farmers pursuing dairy farming as an income generating activity and availing short term loan at 12 to 14 per cent interest rates would be eligible to avail interest subvention of 5 per cent and if they make timely payment, a further, 3 per cent interest incentive is given. Thus, a farmer availing short term loan for dairy farming and regular in repayment would get interest subvention of 8 per cent.
Source: Annual Plan on Animal Husbandry and Dairy Development Sector (2015-16), Department of Animal Husbandry, Govt. of odisha.
120National Dairy Development Board
Part VIII : Policies and schemes
for dairy development in Odisha
Dairying in ODiSHa - A Statistical Profile 2016

121 National Dairy Development Board
GlossaryDairying in ODiSHa - A Statistical Profile 2016
GlossaryAI : Artificial Insemination is the process of deliberate introduction of sperm into the
female reproductive tract for impregnation.
Bovine : Large ruminants like cattle, buffaloes, yak and mithun.
Breedable : Female animals that have attained the age of puberty.
Breeding Tract : Area where breeds/group of animals are found.
Calving Interval : Period between two calvings.
Castration : Technique by which males are made sterile for use in draught operations.
Crossbred : Animal produced by hybridization of two different breeds.
DM : Dry biomass available from feed and fodder.
Dry Animal : Adult animals calved at least once but not in-milk at present.
Food Grains : Cereals and pulses.
GSDP : Basic measure of a State’s overall economic performance. It represents the market value of all final goods and services made within the borders of a State in a year.
Indigenous Animals : Animals native to a particular area.
In-milk Animals : Animals which are lactating.
Irrigation Intensity : (Gross irrigated area/Net irrigated area) * 100.
Lactation Length : Number of days the animal secretes milk.
Lactation Yield : Total milk production over period of 300/305 days.
Literacy Rate : Percentage of literates in the age group above six years.
Livestock : Domesticated mammals.
Male to Female Ratio : Number of males to females.
Milch Animals : Sum of in-milk and dry animals.
Milk Utilisation Pattern : Quantities of milk retained for home consumption in liquid form, retained for product conversion and milk sold by the milk producers.
Marginal Holdings : Farmers possessing less than one hectare of operational holding.
Small Holdings : Greater than one hectare and less than two hectare of operational holding.
Semi Medium : Greater than two and less than four hectare of operational holding.
Medium Holdings : Are more than four and less than ten hectare of operational holding.
Large Holdings : Are those larger than ten hectare of operational holding.
Population Density : Number of human beings/animals per square km of geographical area.
Poultry : All categories of chicken, guinea fowls, turkey, ducks and quails.
Sex Ratio : Number of females to 1,000 males in a population.
Small Ruminants : Sum of sheep and goats.
Urbanisation : Per cent of urban population to total population.
Wet to Dry Ratio : Number of in-milk to dry animals.

National Dairy Development BoardPB No 40, Anand 388 001
Telephone: (02692) 260148/260149/260160Fax: (02692) 260157
E-mail: [email protected]: www.nddb.coop