National curriculum assessments at key stage 2 in … stage 2 mathematics attainment may be due to...
23
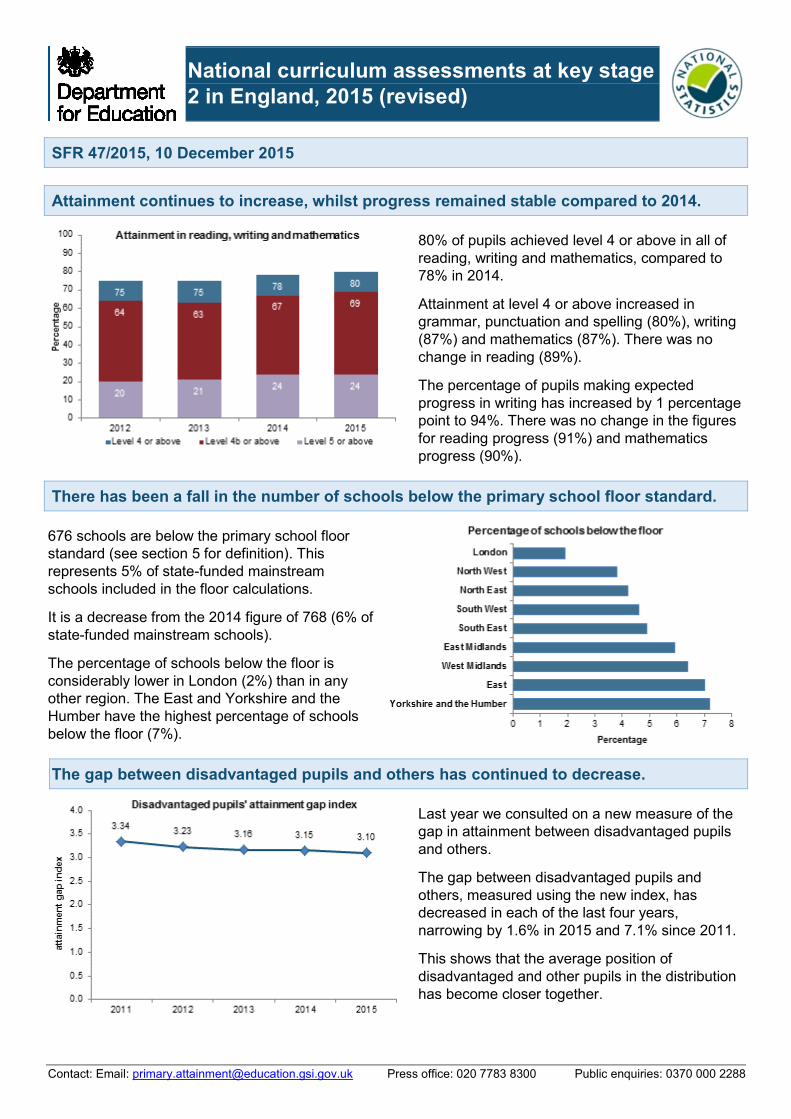
Contact: Email: [email protected] Press office: 020 7783 8300 Public enquiries: 0370 000 2288 National curriculum assessments at key stage 2 in England, 2015 (revised) SFR 47/2015, 10 December 2015 Attainment continues to increase, whilst progress remained stable compared to 2014. 80% of pupils achieved level 4 or above in all of reading, writing and mathematics, compared to 78% in 2014. Attainment at level 4 or above increased in grammar, punctuation and spelling (80%), writing (87%) and mathematics (87%). There was no change in reading (89%). The percentage of pupils making expected progress in writing has increased by 1 percentage point to 94%. There was no change in the figures for reading progress (91%) and mathematics progress (90%). There has been a fall in the number of schools below the primary school floor standard. 676 schools are below the primary school floor standard (see section 5 for definition). This represents 5% of state-funded mainstream schools included in the floor calculations. It is a decrease from the 2014 figure of 768 (6% of state-funded mainstream schools). The percentage of schools below the floor is considerably lower in London (2%) than in any other region. The East and Yorkshire and the Humber have the highest percentage of schools below the floor (7%). The gap between disadvantaged pupils and others has continued to decrease. Last year we consulted on a new measure of the gap in attainment between disadvantaged pupils and others. The gap between disadvantaged pupils and others, measured using the new index, has decreased in each of the last four years, narrowing by 1.6% in 2015 and 7.1% since 2011. This shows that the average position of disadvantaged and other pupils in the distribution has become closer together.
Transcript of National curriculum assessments at key stage 2 in … stage 2 mathematics attainment may be due to...
Contact: Email: [email protected] Press office: 020 7783 8300 Public enquiries: 0370 000 2288
National curriculum assessments at key stage
2 in England, 2015 (revised)
SFR 47/2015, 10 December 2015
Attainment continues to increase, whilst progress remained stable compared to 2014.
80% of pupils achieved level 4 or above in all of
reading, writing and mathematics, compared to
78% in 2014.
Attainment at level 4 or above increased in
grammar, punctuation and spelling (80%), writing
(87%) and mathematics (87%). There was no
change in reading (89%).
The percentage of pupils making expected
progress in writing has increased by 1 percentage
point to 94%. There was no change in the figures
for reading progress (91%) and mathematics
progress (90%).
There has been a fall in the number of schools below the primary school floor standard.
676 schools are below the primary school floor
standard (see section 5 for definition). This
represents 5% of state-funded mainstream
schools included in the floor calculations.
It is a decrease from the 2014 figure of 768 (6% of
state-funded mainstream schools).
The percentage of schools below the floor is
considerably lower in London (2%) than in any
other region. The East and Yorkshire and the
Humber have the highest percentage of schools
below the floor (7%).
The gap between disadvantaged pupils and others has continued to decrease.
Last year we consulted on a new measure of the
gap in attainment between disadvantaged pupils
and others.
The gap between disadvantaged pupils and
others, measured using the new index, has
decreased in each of the last four years,
narrowing by 1.6% in 2015 and 7.1% since 2011.
This shows that the average position of
disadvantaged and other pupils in the distribution
has become closer together.

2
Contents
Attainment by subject 3 1.
Progress between age 7 and age 11 6 2.
Attainment by school type 7 3.
School level attainment 8 4.
Floor standards 9 5.
Disadvantage gap index 10 6.
Pupil characteristics 12 7.
Local authority attainment 17 8.
Accompanying tables 19 9.
Further information is available 21 10.
National Statistics 22 11.
Technical Information 22 12.
Get in touch 22 13.
About this release
This statistical first release (SFR) provides revised 2015 key stage 2 national curriculum assessment results for pupils in schools in England at national, regional and local authority level.
It also provides figures on pupils’ expected progress between key stage 1 (typically age 7) and key stage 2 (typically age 11), a summary of the school level results provided in the performance tables and breakdowns by pupil characteristics.
In this publication
The following tables are included in the SFR:
KS2 national tables (Excel .xls)
KS2 local authority tables (Excel .xls)
KS2 pupil residency, school location and parliamentary constituency tables (Excel .xls)
Underlying data (open format .csv and metadata .txt.
The accompanying quality and methodology information documents, provide information on the data sources, their coverage and quality and explains the methodology used in producing the data.
Feedback
We are changing how our releases look and welcome feedback on any aspect of this document at [email protected].

3
Attainment by subject (Tables 1, 2a & 2b) 1.
Reading
Attainment in the reading test at level 4 or above is unchanged from 2014 at 89%; compared with 83% in
2010 and 67% in 19971. Attainment at level 4b or above increased by 2 percentage points to 80%.
Attainment at level 5 or above fell by 12 percentage point to 49% following the large increase (of 5
percentage points) last year. There was no change in attainment at level 6 in reading.
These pupils did not take the phonics screening check which is now taken by pupils aged 6 as it was only
introduced in 2012. Therefore, it is too soon for the emphasis on teaching phonics to younger pupils to
have had any direct impact on key stage 2 reading results.
Figure 1: Attainment in the reading test: England, 1997 – 2015 (all schools)
Source: National pupil database
Grammar, punctuation and spelling
Attainment in the grammar, punctuation and spelling test has increased from 76% in 2014 to 80% in 2015.
The percentage of pupils achieving level 4 or above remains below that for other subjects (80% compared
to 89% in reading, 87% in writing and 87% in mathematics). One reason may be that pupils and teachers
are still adjusting to the requirements of the new test since it was only introduced in 2013.
Conversely, compared to other subjects, attainment at level 5 or above is already very high in grammar,
punctuation and spelling: 56% of pupils achieved level 5 or above in grammar, punctuation and spelling
compared to 49% in reading, 36% in writing and 42% in mathematics. The old national curriculum that was
assessed in the 2013 to 2015 tests was not as explicit about the grammar, punctuation and spelling that
needed to be taught in key stage 2 as the new national curriculum that will start to be assessed from 2016.
Currently at level 4, pupils are expected to know and be using the curriculum content while at level 5 they
need to show that they can apply it accurately and consistently. It appears that once children have secured
the level 4 content and meta-language, their ability to apply it accurately and consistently progresses
rapidly. The differences between level 4 and level 5 are more significant in the other subjects.
1 The first year of reading tests in this format. 2 When standards are equated to determine the level thresholds for the test, it is necessary to either round up or down from the equivalent score to ensure the level threshold is a whole number. Therefore, we expect some annual variation in the results and, while we cannot be sure, the fall in the percentage at level 5 or above may be a reflection of this rather than a genuine fall in attainment at this level.

4
Figure 2: Attainment in the grammar, punctuation and spelling test: England, 2013 – 2015 (all schools)
Source: National pupil database
Writing
Attainment in writing teacher assessment has continued to increase in 2015: 87% of pupils achieved level 4
or above compared to 85% in 2014 and 81% in 2012. 36% of pupils achieved level 5 or above, compared
to 33% in 2013 and 28% in 2012.
Prior to 2011, attainment in writing was measured using a test rather than a teacher assessment. You
should be careful when comparing results for writing for 2012 and later years with those for earlier years.
See annex G of the quality and methodology information for guidance on comparisons over this period.
Figure 3: Attainment in writing teacher assessment: England, 2012 – 2015 (all schools)
Source: National pupil database
Mathematics
Attainment at level 4 (87%) has increased by 1 percentage point, which compares with 79% in 2010 and
54% in 19963. Attainment at level 4b or above (77%) has also continued to increase. Attainment at level 5
or above is unchanged from last year at 42%.
Most pupils who were at the end of key stage 2 in 2015 would have been at the end of key stage 1 in 2011.
Attainment levels in key stage 1 mathematics for 2011 were 1 percentage point higher than those in 2010,
matching the key stage 2 increase in 2015 compared with 2014. This suggests that the improvement in key
3 The first year of full participation in these tests.

5
stage 2 mathematics attainment may be due to pupils entering key stage 2 with better mathematics skills
rather than them making greater progress during key stage 2.
Figure 4: Attainment in the mathematics test: England, 1995 – 2015 (all schools)
Source: National pupil database
Distribution of test marks (Table 3b)
Pupils who are working below level 3 are not expected to take the tests and so do not receive a test mark. We would expect the number of pupils achieving the lowest marks to be slightly higher if all pupils took the test.
Figure 5 shows the distribution of the marks achieved on the tests in each subject. For all subjects, there is
a step change in the number of pupils achieving marks at the level thresholds. This is likely to be due to the
review process, where schools who believe that the mark scheme has not been applied correctly to a
pupil’s paper can ask for the marking of the paper to be reviewed. Since schools have to pay for any
reviews which do not result in a level change, they usually only apply for reviews where pupils marks are in
close proximity to a level threshold.
The mark distributions for grammar, punctuation and spelling and mathematics tests are similar. The most
commonly achieved marks in these subjects are around the middle of the level 5 mark range and many
pupils achieve full marks4 (4,372 pupils achieve full marks in grammar, punctuation and spelling and 3,396
pupils achieve full marks in mathematics). However, the mark distribution for reading is different - the most
commonly achieved mark in reading is the level 5 threshold and only 93 pupils achieve full marks.
This suggests that many pupils who achieve level 5 in reading only just achieve this level whereas in
mathematics and grammar, punctuation and spelling, the pupils achieving level 5 cover a range of abilities.
This is supported by the level 6 tests results - very few pupils achieve level 6 in reading but higher numbers
achieve level 6 in grammar, punctuation and spelling and mathematics. This may reflect higher
expectations in reading, rather than any subject differences in the ability of primary school teachers to
stretch the most able pupils.
4 The maximum marks are: reading 50; grammar, punctuation and spelling 70; and mathematics 100.

6
Figure 5: Distribution of test marks by subject England, 2015 (all schools)
Source: Performance tables data
Progress between age 7 and age 11 (Table 4) 2.
Pupils are expected to make at least two levels of progress between age 7 and age 11.
Since 2012, the proportion of children making expected progress in each subject has increased – by 2
percentage points for reading; by 4 percentage points for writing; and by 3 percentage points for
mathematics. However, there has been little change between 2014 and 2015.
The lack of change in progress in mathematics between 2014 and 2015, despite a slight increase in
attainment, supports the earlier comment that the increase in mathematics attainment may be driven by
pupils entering key stage 2 with better mathematics skills than the previous year.
Table A: Percentage of pupils making at least two levels of progress: England, 2012 - 2015 (state-funded schools)
Reading Writing Mathematics
2015 91% 94% 90%
2014 91% 93% 90%
2013 88% 92% 88%
2012 89% 90% 87%
Source: National pupil database

7
Attainment by school type (Tables 5a & 5b) 3.
Number of primary schools5
There were 14,889 state-funded mainstream primary schools with key stage 2 results in 2015.
12,804 (86%) were LA maintained schools.
1,375 (9%) were converter academies
689 (5%) were sponsored academies.
21 were free schools.
See the methodology and quality information for details about different types of school.
Attainment levels in mainstream academies and free schools as a group are very similar to those in local
authority maintained mainstream schools. But this masks important variation between the different types of
schools within this group. Converter academies have a higher percentage of pupils achieving level 4 or
above than the average for all state-funded mainstream schools. This may be explained by the fact that
schools which chose to convert to academies are usually already high performing schools.
The converse may be true of sponsored academies which as a group are below the average for state-
funded mainstream schools, as these were already low performing before their conversion to academy
status (see table B).
There are also differences in the percentages making expected progress in these two types of academy,
but these are smaller than the differences for attainment.
Table B: Attainment at age 11 by type of school England, 2015 (mainstream schools)
Attainment in reading, writing and mathematics
Level 4 or above
Level 5 or above
Progress in reading
Progress in writing
Progress in mathematics
LA maintained schools 81% 25% 92% 95% 91%
Academies and free schools
80% 23% 91% 95% 90%
Of which:
Sponsored academies 71% 15% 88% 93% 86%
Converter academies 84% 27% 93% 96% 91%
Source: National pupil database
The number of free schools with 11 year old pupils is too small to allow robust conclusions to be drawn
about their performance at the end of key stage 2. Please also note that many of the free schools which
currently have results are former independent schools rather than new provision, since the latter have only
been open for a relatively short time and many don’t yet have a cohort of 11 year old pupils.
It is difficult to interpret changes in results across years due to the conversion of schools from one type to
another. This means that comparing the headline figures for any of these groups captures not only the
change in performance, but also the change in composition. For example, if the additional schools to a
group all had attainment that was below the average for the group, the effect would be to lower the average
for the group even if each individual school saw no change in its own results.
A better way of showing time series is to look at individual cohorts of schools. These data are shown in
table C. Shaded cells highlight results from predecessor schools to aid comparison. For example, this table
shows that 271 sponsored academies opened during the 2012/13 academic year. In that year, 61% of
pupils in these schools achieved level 4 or above in reading, writing and mathematics. In the following
years, their attainment has increased to 68% in 2014 and 71% in 2015.
5 Where schools have changed type during the academic year, they are shown under their type as on 12 September 2014.

8
Attainment in sponsored academies increased from 67% to 71% between 2014 and 2015, compared to 1
percentage point in converter academies6 and LA maintained schools.
Measures of improvement are important. They show whether underperforming schools or groups of schools
(for example, schools that have become sponsored academies) are catching up with higher performing
schools. However, when interpreting such measures it should be noted that the extent to which a school
improves is related to a range of factors. Schools with the lowest previous outcomes tend to see the largest
improvements but simply controlling for starting points does nothing to account for the very different
circumstances which may exist in two schools. For example, in two schools with the same outcomes, pupils
might be far exceeding expectations given prior attainment in one while, in the other, pupils might be
making less progress than expected. This will affect the relative ability to demonstrate improvement.
For further discussion and analysis of these issues, see Attainment by pupils in academies 2012 and
Measuring the performance of schools within academy chains and local authorities.
Table C: Percentage of pupils achieving level 4 or above in reading, writing and mathematics in academies by length of time open England, 2012 - 2015 (mainstream schools)
7
Number of schools with results
8
2012 2013 2014 2015
Sponsored academies9 689 59% 61% 67% 71%
Open for one academic year 269 . . 66% 71%
Open for two academic years 271 . 61% 68% 71%
Open for three academic years 114 59% 60% 67% 68%
Open for four or more academic years 35 65% 66% 73% 76%
Converter academies9 1,375 79% 80% 82% 84%
Open for one academic year 364 . . 82% 84%
Open for two academic years 389 . 78% 81% 82%
Open for three academic years 363 80% 79% 83% 84%
Open for four or more academic years 259 81% 82% 84% 85%
LA maintained schools10
12,804 76% 77% 80% 81%
Source: National pupil database
School level attainment 4.
School level attainment is published in the performance tables. There is considerable variation between
schools in attainment levels. The percentage achieving level 4 or above in all of reading, writing and
mathematics in mainstream schools ranges from 21%11 to 100%. Almost two thirds of schools (63%) have
attainment of at least the national average. 8% of schools have attainment below the floor standard figure
of 65%.
The percentage achieving level 5 or above in reading, writing and mathematics ranges from 0% to 93%.
6 All gaps and changes are calculated from unrounded figures. 7 Includes schools which were mainstream sponsored academies, mainstream converter academies or LA maintained mainstreamed schools on 12 September 2014. 8 Results for all years include this same set of schools. 9 The ‘Sponsored academies’ and ‘Converter academies’ figures include data for all schools which were academies on 12 September 2014 irrespective of their type in previous years. 10 Since 2011, new provision has usually been met through the establishment of academies and free schools rather than LA maintained schools which limited the number of LA maintained schools opening over this period. As approximately 98% of LA maintained schools open in 2015 were also open in 2012, a breakdown by length of time open has not been provided. 11 Excluding schools where all results were annulled due to maladministration, schools which didn’t submit writing teacher assessment and schools with fewer than 11 eligible pupils.
9
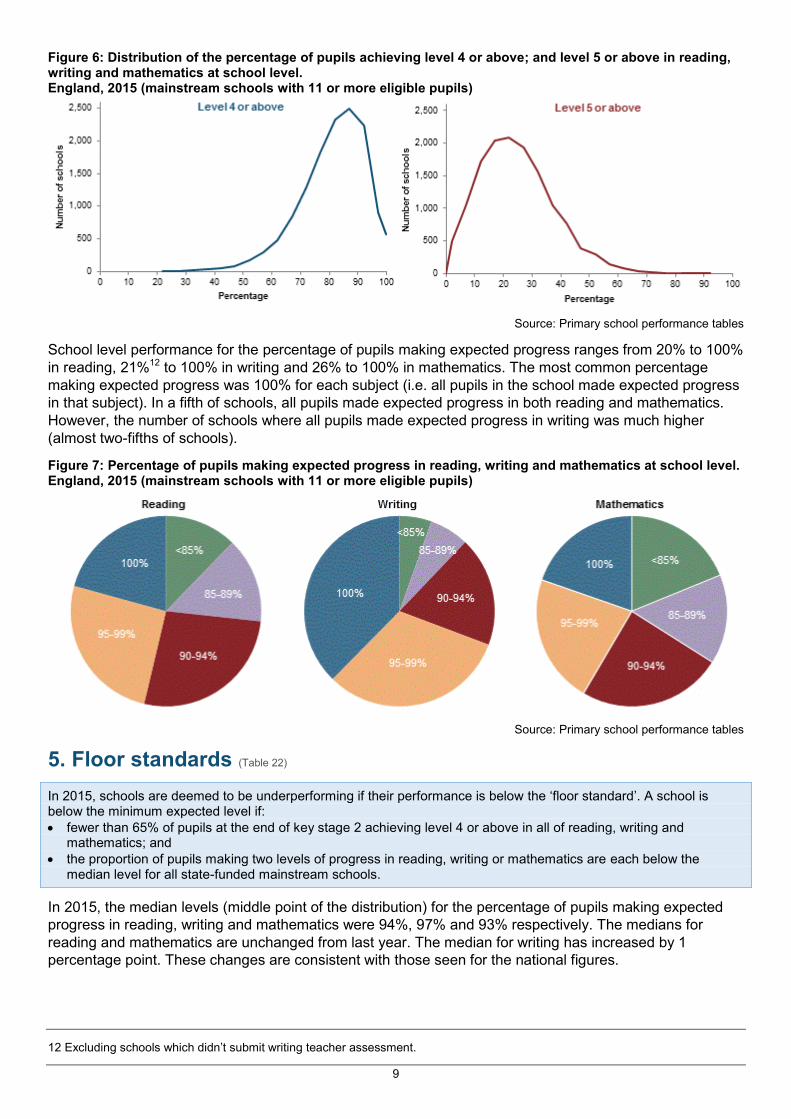
Figure 6: Distribution of the percentage of pupils achieving level 4 or above; and level 5 or above in reading, writing and mathematics at school level. England, 2015 (mainstream schools with 11 or more eligible pupils)
Source: Primary school performance tables
School level performance for the percentage of pupils making expected progress ranges from 20% to 100%
in reading, 21%12 to 100% in writing and 26% to 100% in mathematics. The most common percentage
making expected progress was 100% for each subject (i.e. all pupils in the school made expected progress
in that subject). In a fifth of schools, all pupils made expected progress in both reading and mathematics.
However, the number of schools where all pupils made expected progress in writing was much higher
(almost two-fifths of schools).
Figure 7: Percentage of pupils making expected progress in reading, writing and mathematics at school level. England, 2015 (mainstream schools with 11 or more eligible pupils)
Source: Primary school performance tables
Floor standards (Table 22) 5.
In 2015, schools are deemed to be underperforming if their performance is below the ‘floor standard’. A school is below the minimum expected level if:
fewer than 65% of pupils at the end of key stage 2 achieving level 4 or above in all of reading, writing and mathematics; and
the proportion of pupils making two levels of progress in reading, writing or mathematics are each below the median level for all state-funded mainstream schools.
In 2015, the median levels (middle point of the distribution) for the percentage of pupils making expected
progress in reading, writing and mathematics were 94%, 97% and 93% respectively. The medians for
reading and mathematics are unchanged from last year. The median for writing has increased by 1
percentage point. These changes are consistent with those seen for the national figures.
12 Excluding schools which didn’t submit writing teacher assessment.

10
676 schools are below the 2015 primary school floor standard. This is 5% of state-funded mainstream
schools included in the calculations. It is a decrease from the 2014 figure of 768 (6% of state-funded
mainstream schools).
Closed schools, including those which closed during the 2014/15 academic year and reopened as a
different type of school (for example, a sponsored academy) are excluded from the floor target. There were
204 closed schools in 2015 that would otherwise have been included in the floor target calculations – 47 of
these would have been below the floor.
Disadvantage gap index (Tables 11b & 11c) 6.
Experimental Statistics
Last year we consulted on a new measure of the gap in attainment between disadvantaged pupils and others which provides greater comparability between years. 'Calculating the index' (below figure 8) summarises how the measure is produced; and more details of the methodology and consultation were published in SFR 40/2014.
Disadvantaged pupils
In 2015, disadvantaged pupils are defined as: those who were known to be eligible for free school meals in any of the previous six years as indicated in any termly or annual school census, pupil referral unit (PRU) or alternative provision (AP) census; children looked after by the local authority for at least 1 day; or children who have been adopted from care.
32% of 11 year olds were classed as disadvantaged in 2015.
The gap between disadvantaged pupils and others, measured using the new index, has decreased in each
of the last four years, narrowing by 1.6% in the latest year and 7.1% since 2011 (see figure 8). This shows
that, as well as more disadvantaged pupils reaching the expected standard, the average position of
disadvantaged and other pupils in the distribution has become closer together.
Figure 8: Trend in the disadvantaged pupils’ attainment gap index England, 2011 to 2015 (state-funded schools)
Source: National pupil database
Calculating the Index
Pupils are ordered by average fine grade level13
in reading, writing and mathematics.
The average rank of disadvantaged pupils was 0.39, meaning the average pupil was around two fifths of the way up the distribution, while that of other pupils was 0.55, more than halfway up the distribution.
The disadvantaged pupils’ attainment gap index multiplies the difference between these by 20:
(0.549 – 0.394) x 20 = 3.10
The gap is measured on a scale of 0 to 10 (or minus 10 if disadvantaged pupils achieved higher).
13 Fine grade levels use marks awarded in test papers and level thresholds to discriminate between the top and bottom of each national curriculum level, eg pupils achieving level 4 will have a fine grade between 4.0 and 4.9. The score is an average of the fine grades in reading and mathematics tests and the writing assessment, therefore a pupil achieving a fine grade above 4 may not have achieved the expected level in all three areas. This methodology is set out in section H of the KS1-2 Value Added guidance.

11
Figure 9 shows the distribution of pupils’ results in 2015, from lowest attainment on the left to the highest
attainment on the right. Dark blue lines represent disadvantaged pupils, while light blue lines represent
others. Although there were some disadvantaged pupils among the highest attainers, they were more likely
to be clustered at the lower attaining end. The gap index measures the distance between the average
position of disadvantaged and other pupils in the distribution (shown by arrows); if disadvantage were not
associated with differences in attainment, pupils would be evenly spaced out and the gap would be zero,
but currently the average position of disadvantaged pupils is lower than others.
Figure 9: The distribution of pupil attainment, disadvantaged pupils and others14
England, 2015 (state-funded schools)
Source: National pupil database
To understand more about differences between the two groups, we can look at illustrative points in the
distribution and compare how likely pupils are to be particularly high or low achievers. Fine grade levels are
used to break down attainment; these subdivide national curriculum levels based on how close the marks
pupils achieved were to each level threshold.
For example, nine out of ten pupils (92%) who were not disadvantaged achieved a fine grade of 4.0 or
above, equivalent to just reaching the level 4 boundary in each assessment. Disadvantaged pupils are
more likely to be at the low achieving end, so only eight out of ten disadvantaged pupils (81%) achieved
this standard. Similarly only one quarter of disadvantaged pupils achieved a fine grade of 5.0 or above
across their assessments (equivalent to the level 5 threshold) while almost half (47%) of other pupils did.
Disadvantaged pupils are also under-represented at the high achieving end. The top fifth of non-
disadvantaged pupils achieved a fine grade of 5.5 or above (equivalent to being a comfortable level 5 in
each assessment); however only 6% of disadvantaged pupils reached this standard.
Odds ratios are used to compare pupil’s chances of achieving different outcomes.15 When an outcome is
achieved by almost all or very few pupils, there might be a small difference in the proportions achieving it,
but a large difference in the likelihood of achieving (or the risk of not achieving) that outcome. The odds
against disadvantaged pupils achieving at or above most fine grade levels (ie between 3.0 and 5.0) are
around two and a half times as high as for other pupils. The odds ratio increases at higher attainment
thresholds, with the odds against achieving a fine grade of 5.5 or above being over three times as high for
disadvantaged pupils as others, and over four times as high at 6.0 (meaning pupils were assessed at level
6 in at least one area).The higher odds ratios indicate the difficulty of achieving top marks at key stage 2 for
disadvantaged pupils (see table D).
14 The diagram shows the position of every 1000th disadvantaged pupil and every 1000
th other pupil at the end of key stage 2, in
order of their average fine grade level across reading, writing and mathematics. The average position for each group is indicated. 15 Odds ratios compare different pupils’ chances of achieving or missing out on a measure. The odds ratio against pupils in each group achieving a standard are calculated; eg 25% of disadvantaged pupils achieve 5.0 or above so the odds against them achieving are 3 to 1 (ie 75% vs 25%). For each disadvantaged pupil who achieves, 3 others do not. The odds ratio compares the odds for disadvantaged pupils with the odds for the other group. If the odds against disadvantaged pupils achieving are higher the ratio will be greater than 1, suggesting that disadvantaged pupils are less likely to achieve. A higher ratio indicates a higher disparity in pupils’ chances. The odds ratios shown have been calculated from unrounded percentages.

12
Table D: Attainment of disadvantaged pupils and others across the distribution England, 2015 (state-funded schools)
Percentage of pupils achieving: Odds ratio:
Fine grade level at or above
Disadvantaged pupils
Other pupils All pupils Percentage point gap
Disadvantaged compared to others
3.0 94% 98% 97% 3 2.5
4.0 81% 92% 88% 11 2.5
5.0 25% 47% 40% 22 2.6
5.5 6% 18% 14% 12 3.2
6.0 1% 6% 4% 4 4.1
Source: National pupil database
Pupil characteristics (Tables 9a - 11) 7.
Characteristics definitions
Some definitions of characteristics have changed. See the pupil characteristics and geography information document for the definitions used.
Figure 10: Attainment at level 4 or above in reading, writing and mathematics for different groups England, 2015 (state-funded schools)
Source: National pupil database
Gender
Attainment in reading, writing and mathematics combined has improved for both boys and girls. However,
girls continue to outperform boys at all levels. The gender gap at level 4 or above has remained at 6
percentage points. The gender gaps for higher attainment have narrowed slightly to 3 percentage points for
level 4b or above and 5 percentage points for level 5 and above.
Figure 11: Attainment in reading, writing and mathematics combined by gender England, 2012 – 2015 (all schools)
Source: National pupil database

13
Girls have continued to outperform boys in the reading and grammar, punctuation and spelling tests. Girls
also performed better than boys in the writing teacher assessment. As in previous years, boys and girls
have similar levels of attainment at level 4 or above in the mathematics tests but boys outperform girls at
level 5 or above.
Figure 12: Attainment by subject and gender England, 2015 (all schools)
Source: National pupil database
Attainment by prior attainment bands (Tables 7 & 8)
Pupils are grouped into prior attainment bands based on their key stage 1 (KS1) results.
Low attaining = below level 2 at the end of KS1.
Middle attaining = at level 2 at the end of KS1.
High attaining = above level 2 at the end of KS1. Any pupils without KS1 results are excluded. More information is provided in the quality and methodology information.
16% of pupils are classed as having low prior attainment, 55% as middle prior attainment and 23% as high prior attainment.
As might be expected, pupils with high prior attainment are more likely than those with middle prior
attainment to achieve higher results at the end of key stage 2. Similarly, those with middle prior attainment
are more likely than those with low prior attainment to achieve higher results.
Figure 13: Attainment in reading, writing and mathematics by prior attainment England, 2015 (all schools)
Source: National pupil database
Pupils with low prior attainment are also less likely to make expected progress in each subject than those
with either middle or high prior attainment.
Table 7 in the annex gives more detailed information on pupils with low prior attainment. Pupils who were at
level 1 at the end of key stage 1 are almost as likely as those with higher prior attainment to make expected
progress. However, those who were working below level 1 at the end of key stage 1 are much less likely to
make expected progress. For some very low attaining pupils at the end of key stage 1 reaching level 2 by
the end of key stage 2 may not be realistic.

14
Figure 14: Pupils making expected progress by prior attainment England, 2015 (state-funded schools)
Source: National pupil database
Free school meal (FSM) eligibility (Tables 9a - 10b & 11a)
16% of 11 year old pupils are known to be eligible for free school meals.
Attainment in reading, writing and mathematics for FSM pupils has risen and the attainment gap has
narrowed by 1 percentage point since 2014 to 17 percentage points; 66% of pupils known to be eligible for
FSM achieved level 4 or above in all of reading, writing and mathematics compared with 83% of all other
pupils.
The FSM attainment gap is at its narrowest in reading (11 percentage points), but widest for grammar,
punctuation and spelling (16 percentage points).
FSM pupils continue to make less progress between KS1 and KS2 than their peers. There has been no
change in the size of the gaps.
87% FSM pupils made expected progress in reading compared with 92% of all other pupils.
91% FSM pupils made expected progress in writing compared with 95% of all other pupils.
84% FSM pupils made expected progress in mathematics compared with 91% of all other pupils.
Disadvantage (Tables 9a & 9b)
In 2015, disadvantaged pupils are defined as: those who were known to be eligible for free school meals in any of the previous six years as indicated in any termly or annual school census, pupil referral unit (PRU) or alternative provision (AP) census; children looked after by the local authority for at least 1 day; or children who have been adopted from care.
32% of 11 year olds were classed as disadvantaged in 2015.
This section is included for transparency, however we recommend that the new gap index (see page 10) is
used in preference to the information presented here.
The attainment of disadvantaged pupils has risen across all subject areas in 2015 and the attainment gap
at level 4 or above has narrowed (see figure 15). 70% of disadvantaged pupils achieved level 4 or above in
all of reading, writing and mathematics - an increase of 2 percentage points from last year. 85% of all other
pupils achieved level 4 or above. The attainment gap at level 4 or above now stands at 15 percentage
points, a narrowing of 1 percentage point since 2014, and 3 percentage points since 2012.

15
Figure 15: Percentage of disadvantaged pupils achieving level 4 or above England, 2012 to 2015 (state-funded schools)
Source: National pupil database
The percentage of disadvantaged pupils making expected progress in writing has risen by 1 percentage
point. The figures for reading and mathematics are unchanged from 2014. The gaps for all subjects are
unchanged.
Special Educational Needs (SEN) (Tables 9a, 9b, 10b & 10c)
19% of 11 year old pupils have a special educational need: 3% with a statement or education, health and care plan and 16% without.
39% of pupils with SEN achieved level 4 or above in all of reading, writing and mathematics, compared with
90% of pupils with no identified SEN, resulting in an attainment gap of 51 percentage points; unchanged
from 2014.
Of all reported characteristics, pupils with SEN have the largest attainment gap when compared to those
without any identified SEN. However, in 2015 attainment of SEN pupils has increased across all areas.
78% of SEN pupils made expected progress in reading, 83% the expected level of progress in writing, and
74% expected progress in mathematics.
Of pupils with a specified primary need, those with a visual impairment were the highest achieving with
61% achieving level 4 or above in reading, writing and mathematics, still well below the national average.
Pupils with a hearing impairment were only slightly behind on 56%.
Ethnicity (Tables 9a – 10a, 10c)
76% of 11 year old pupils are white, 10% are Asian, 6% are black, 5% are mixed and less than 1% are Chinese.
Attainment at age 11 continues to vary between different ethnic groups. Chinese pupils remain the highest
achieving group. The percentage of Chinese pupils achieving level 4 or above in all of reading, writing and
mathematics is 8 percentage points above the national average. The attainment gap between Chinese
pupils and the national average has narrowed by 2 percentage points since 2014.
Pupils from a black background remain the lowest performing major group, but they are now only just
behind the national average. 79% of pupils from a black background achieved level 4 or above in all of
reading, writing and mathematics; an increase of 2 percentage points since 2014.
Attainment of the other major groups remains broadly similar to the national average.
Within the more detailed ethnic groupings, pupils from an Indian background are the highest performing
group in reading, writing and mathematics (87%), only marginally behind Chinese pupils. In reading, writing
and grammar, punctuation and spelling, attainment at level 4 or above is broadly similar for Indian and
Chinese pupils. However in mathematics, Chinese pupils outperform Indian pupils (96% of Chinese pupils
achieve level 4 or above in mathematics compared to 92% of Indian pupils).

16
Gypsy/Roma pupils are still the lowest performers but have seen a small improvement from 2014.
Figure 16: Percentage of pupils achieving level 4 or above in reading, writing and mathematics by ethnicity England, 2015 (state-funded schools)
Source: National pupil database
There are variations in pupil attainment across key groups of interest:
White British FSM boys are still underperforming, although there is some improvement. In 2015,
59% of white British boys known to be eligible for FSM achieved level 4 or above in reading, writing
and mathematics. This is an increase of 3 percentage points since 2014 which means they are now
21 percentage points behind the national average.
Black Caribbean FSM boys are also still below the national average. In 2015, 63% of black
Caribbean boys known to be eligible for FSM achieved level 4 or above in all of reading, writing and
mathematics. This is an increase of 1 percentage point since 2014 but they remain 17 percentage
points behind the national average.
English as a first language (Tables 9a & 9b)
18% of 11 year old pupils have a first language other than English.
Attainment in reading, writing and mathematics for pupils whose first language is other than English has
risen but the attainment gap remains at 4 percentage points. 77% of pupils whose first language is other
than English achieved level 4 or above in all of reading, writing and mathematics compared with 81% of
pupils whose first language is English.
Pupils with English as a first language outperformed those whose first language is not English in each of
the key stage 2 subject areas, with the exception of the grammar, spelling and punctuation test where there
is no gap. Attainment gaps in each subject have remained similar to 2014. The attainment gaps in reading
and writing are wider than in mathematics.
Income Deprivation Affecting Children Index (IDACI) (Table A1)
Deprived areas are defined by the Income Deprivation Affecting Children Index (IDACI) (see the pupil characteristics and geography methodology for more details).
In 2015, 89% of pupils resident in the least deprived areas achieved level 4 or above in reading, writing and
mathematics compared to 75% of pupils resident in the most deprived areas – an attainment gap of 13
percentage points. The attainment gap has fallen by 2 percentage points since 2014.

17
Figure 17: Percentage of pupils achieving level 4 or above in reading, writing and mathematics by deprivation England, 2011 to 2015 (state-funded schools)
Source: National pupil database
Local authority attainment (Tables 12 - 27) 8.
There is considerable variation between local authorities in attainment levels. Those local authorities with
the lowest attainment tend to have below average percentages making expected progress. Table E shows
the minimum and maximum LA percentages achieving level 4 or above in each subject and also the
minimum and maximum LA percentages making expected progress in each subject (excluding the City of
London and Isles of Scilly which only have 1 school each).
Table E: Minimum and maximum local authority percentages: England, 2015 (state-funded schools only)
Minimum Maximum Range (percentage
points)
% achieving level 4 or above
Reading, writing and mathematics 73% 91% 18
Reading test 84% 96% 12
Grammar, punctuation and spelling test 72% 92% 20
Mathematics test 80% 95% 15
Writing teacher assessment 83% 94% 11
% making expected progress
Reading 85% 97% 12
Writing 88% 98% 10
Mathematics 80% 96% 16
Source: National pupil database
The difference between the lowest and highest performing local authorities is considerably greater for
grammar, punctuation and spelling than for the other subjects. However, this is partly due to two local
authorities having very high attainment in this subject.
The highest performing local authorities are concentrated in London. The poorest performing areas are in
Yorkshire and East Anglia.

18
Figure 18: Percentage of pupils achieving level 4 or above in reading, writing and mathematics by local authority: England, 2015 (state-funded schools)
Source: National pupil database
Floor standard (Table 22)
There is considerable variation across local authorities in the percentage of primary schools below the floor.
23 local authorities have no schools below the floor and 13 of these also had no schools below the floor last
year. However, there are 15 local authorities where at least 1 in 10 primary schools is below the floor. In
Central Bedfordshire, 16% of schools (5 schools out of 32) were below the floor. Doncaster and Wakefield
also had high levels of schools below the floor – 14% of their schools.
The variation in the percentage of schools below the floor by local authority is shown in figure 19.
Poole has seen the most improvement in the percentage of their schools below the floor. In 2014, 27% of
schools in Poole were below the floor but in 2015, this figure has halved (13%). However, it remains among
one of the worst performing authorities. There have also been large improvements in Barnsley (16% in
2014 and 5% in 2015) and Rutland (18% in 2014 and 8% in 2015).
Torbay and Central Bedfordshire have seen the greatest increases in the percentage of their schools below
the floor between 2014 and 2015. The figure for Torbay increased from 0% to 10% (3 schools out of 29)
while that for the Central Bedfordshire has increased from 8% to 16% (5 schools out of 32).

19
Figure 19: Percentage of schools below the floor by local authority England, 2015
Source: Primary school performance tables
Accompanying tables 9.
The following tables are available in Excel format on the department’s statistics website:
National tables
1 Levels of attainment in key stage 2 tests by subject, 1995 to 2015
2a Attainment in key stage 2 tests by gender, 2007 to 2015
2b Attainment in key stage 2 teacher assessments by gender, 2007 to 2015
2c Attainment at key stage 2 in combinations of subjects by gender, 2007 to 2015
3a Levels of attainment at key stage 2 by subject and gender, 2015
3b Distribution of test marks by subject, 2015
4 Expected progress between key stage 1 and key stage 2 by gender, 2009 to 2015
5a Attainment of pupils at key stage 2 by school type, 2015
5b Attainment at level 4 or above in reading test, writing TA and mathematics test in academies by length of time open, 2012 to 2015
6 Attainment of pupils at key stage 2 by school phase, 2015
7 Attainment of pupils at key stage 2 by prior attainment at key stage 1, 2015
8 Attainment of pupils at key stage 2 by prior attainment bands and gender, 2015
9a Levels of attainment at key stage 2 by pupil characteristics, 2012 to 2015
9b Attainment at level 4b or above at key stage 2 by pupil characteristics, 2013 to 2015
10a Attainment at level 4 or above at key stage 2 by ethnicity, free school meal eligibility and gender, 2012 to 2015
10b Attainment at level 4 or above at key stage 2 by SEN provision, free school meal eligibility and gender, 2012 to 2015
10c Attainment at level 4 or above at key stage 2 by SEN provision, ethnicity and gender, 2012 to 2015
11a Impact indicator 3.7: Attainment gap at age 11 between free school meal pupils and all other pupils, 2012 to 2015
11b Time series of the disadvantage gap index at key stage 2, 2011 to 2015 (Experimental Statistics)
11c Fine grade breakdown of the attainment of disadvantage pupils and others, 2011 to 2015 (Experimental Statistics)

20
Local authority and regional tables
12 Attainment at key stage 2 in reading test, writing TA and mathematics test by local authority, region and gender, 2012 to 2015
13 Attainment in key stage 2 reading by local authority, region and gender, 2015
14 Attainment in key stage 2 grammar, punctuation and spelling test by local authority, region and gender, 2015
15 Attainment in key stage 2 mathematics by local authority, region and gender, 2015
16 Attainment in key stage 2 writing teacher assessment by local authority, region and gender, 2015
17 Attainment in key stage 2 English teacher assessment by local authority, region and gender, 2015
18 Attainment in key stage 2 science teacher assessment by local authority, region and gender, 2015
19 Percentage of pupils making expected progress in reading between key stage 1 and key stage 2, by local authority and region, 2012 to 2015
20 Percentage of pupils making expected progress in writing between key stage 1 and key stage 2, by local authority and region, 2012 to 2015
21 Percentage of pupils making expected progress in mathematics between key stage 1 and key stage 2, by local authority and region, 2009 to 2015
22 Number of schools not reaching the floor standard by local authority and region, 2014 to 2015
23 Attainment at level 4 or above in key stage 2 by ethnicity and local authority, 2012 to 2015
24 Attainment at level 4 or above in key stage 2 by first language and local authority, 2012 to 2015
25 Attainment at level 4 or above in key stage 2 by free school meal eligibility and local authority, 2012 to 2015
26 Attainment at level 4 or above in key stage 2 by disadvantaged pupils and local authority, 2012 to 2015
27 Attainment at level 4 or above in key stage 2 by SEN provision and local authority, 2012 to 2015
Pupil residency based tables
A1 Attainment at level 4 or above in key stage 2 by IDACI decile of pupil residence, 2013 to 2015
A2 Attainment at level 4 or above in key stage 2 by degree of rurality of pupil residence, 2013 to 2015
A3 Attainment at level 4 or above in key stage 2 by local authority district and region of pupil residence, 2013 to 2015
A4 Attainment at level 4 or above in key stage 2 by IDACI decile and degree of rurality of pupil residence, 2013 to 2015
School location based tables
B1 Attainment at level 4 or above in key stage 2 by degree of rurality of school location, 2015
B2 Attainment at level 4 or above in key stage 2 by local authority district and region of school location, 2015
B3 Attainment at level 4 or above in key stage 2 by parliamentary constituency of school location, 2015
When reviewing the tables, please note that:
We preserve confidentiality The Code of Practice for Official Statistics requires us to take reasonable
steps to ensure that our published or disseminated statistics protect
confidentiality.
so we suppress some
figures,
Values of 1 or 2, or a percentage based on 1 or 2 pupils who achieved; or
0, 1 or 2 pupils who did not achieve a particular level are suppressed.
Some additional figures have been suppressed to prevent the possibility
of a suppressed figure being revealed.
This suppression is consistent with our Statistical policy statement on
confidentiality.
adopt symbols to help
identify this
Symbols are used in the tables as follows:
. not applicable
.. not available
# not published due to lack of sufficiently representative data as a
result of industrial action (2010 figures only)
x publication of that figure would be disclosive

21
and round numbers Percentages in this SFR are given to the nearest whole number but all
gaps and differences have been calculated on unrounded data. Therefore
some figures may not match those produced from the rounded figures
shown in the tables.
All pupil numbers at regional level are rounded to the nearest 10. This is
so that it is not possible to deduce the figures for LAs which have been
suppressed. However percentages have been calculated from unrounded
data.
We haven’t made any
significant changes this year
Since national curriculum assessments at key stage 2 were introduced in
1995, there have been a number of changes to the process by which the
assessments are run and tests are marked which are likely to affect year
on year comparisons.
There were significant changes to KS2 assessment in 2012 and 2013
which are described in the quality and methodology information which
accompanies this SFR.
There were no significant changes to how primary school assessments
were conducted in 2015. However, this is the first year in which all tests
have been marked onscreen.
This is revised data 2015 figures in this publication are based on revised data. Once final data
is available, we will make an assessment of the level of change between
revised and final data. If the impact on local authority and characteristics
breakdowns is significant, we will reissue the tables with final data in
Spring 2016.
Any unplanned revisions will be made in accordance with our Statistical
policy statement on revisions.
We provide underlying data The SFR is accompanied by national and local authority underlying data
and metadata describing this data. This data is provided in csv format so
that it can be loaded into the software of your choice.
Further information is available 10.
School level figures School level data has been published in the performance tables.
Data for lower level
geographies
Pupil residency based tables showing 2015 small area attainment data
will be published by the Office for National Statistics (ONS) on the
neighbourhood statistics service (NeSS) website in summer 2016.
Characteristics breakdowns Characteristics breakdowns are included in this SFR.
Provisional data Provisional 2015 data was published on 27 August 2015 in SFR 30/2015.
Previously published figures SFR50/2014: National curriculum assessments at key stage 2, 2014
Primary school performance tables 2014
Attainment for other key
stages
SFR32/2015: Phonics screening check and key stage 1 assessments:
England 2015
SFR37/2015: Provisional GCSE and equivalent results in England: 2014
to 2015
SFR38/2015: A level and other level 3 results: 2014 to 2015 (provisional)

22
Assessing the performance
of academies
SFR09/2015 Measuring the performance of schools within academy
chains and local authorities
Pupil numbers SFR15/2015: Schools, Pupils and their Characteristics: January 2015
Attainment in Scotland,
Wales, Northern Ireland and
international comparisons.
See the quality and methodology information which accompanies this
release for details of similar data available for other areas.
National Statistics 11.
The United Kingdom Statistics Authority has designated these statistics as National Statistics, in
accordance with the Statistics and Registration Service Act 2007 and signifying compliance with the Code
of Practice for Official Statistics.
Designation can be broadly interpreted to mean that the statistics:
meet identified user needs;
are well explained and readily accessible;
are produced according to sound methods, and
are managed impartially and objectively in the public interest.
Once statistics have been designated as National Statistics it is a statutory requirement that the Code of
Practice shall continue to be observed.
The Department has a set of statistical policies in line with the Code of Practice for Official Statistics.
Technical Information 12.
The following quality and methodology information documents accompany this SFR:
Attainment in primary schools in England
Pupil characteristic and geography methodology
These documents provide further information on the data sources, their coverage, the quality and how the
data is validated and processed.
National curriculum assessment figures published in this statistical first release (SFR) are based on the
data that has been used to prepare the 2015 primary school performance tables. This data has been
shared with schools and local authorities as part of the checking exercise. It includes revised key stage 2
national curriculum tests and teacher assessment data provided to the Department by the Standards and
Testing Agency (STA) by 10 November 2015. It includes the outcomes of reviews. This SFR revises earlier
published figures and incorporates amendments received from schools through the checking exercise for
the 2015 primary school performance tables. The figures may be subsequently updated with:
any changes that result from the completion of outstanding maladministration investigations
further changes resulting from errata requests from schools after publication of the performance
tables.
The effect of these amendments on the national results has previously been negligible.
Get in touch 13.
Media enquiries
Press Office News Desk, Department for Education, Sanctuary Buildings, Great Smith Street, London
SW1P 3BT. Tel: 020 7783 8300
Other enquiries/feedback
Jayne Middlemas, Education Data Division, Department for Education, 2 St Paul’s Place, 125 Norfolk
Street, Sheffield S1 2FJ. Tel: 0114 2742117 [email protected]

23
© Crown copyright 2015
This publication (not including logos) is licensed under the terms of the Open Government Licence v3.0
except where otherwise stated. Where we have identified any third party copyright information you will need
to obtain permission from the copyright holders concerned.
To view this licence:
visit www.nationalarchives.gov.uk/doc/open-government-licence/version/3
email [email protected]
write to Information Policy Team, The National Archives, Kew, London, TW9 4DU
About this publication:
enquiries Jayne Middlemas, Education Data Division, Department for Education, 2 St Paul’s Place, 125
Norfolk Street, Sheffield S1 2FJ.
Tel: 0114 2742117
Email: [email protected]
Download https://www.gov.uk/government/collections/statistics-key-stage-2
Reference: SFR 47/2015
Follow us on Twitter:
@educationgovuk Like us on Facebook:
facebook.com/educationgovuk