National curriculum assessments at key stage 2 in England ... · 85% of pupils who met the phonics...
20
1 National curriculum assessments at key stage 2 in England, 2019 (provisional) 5 September 2019 This publication provides provisional attainment statistics for key stage 2 (KS2) national curriculum assessments. This data extends the interim publication published on 9 July 2019. It includes results for pupils in schools in England at national, regional and local authority level by phonics prior attainment by pupil characteristics such as gender, disadvantage and special educational needs by school characteristics such as school type, phase and religious character It is accompanied by tables in Excel and open data formats providing further detail. It is also accompanied by underlying data that provides results at local authority district and constituency level. 65% pupils reached the expected standard in reading, writing and maths (combined), and 11% pupils reached the higher standard in all three subjects 65% of pupils reached the expected standard in all of reading, writing and maths (combined) in 2019, up from 64% in 2018. 11% of pupils reached the higher standard in 2019, up from 10% in 2018. Attainment in reading, writing and maths (combined) in 2018 and 2019 is not directly comparable to earlier years (2016 and 2017) because of changes to the writing TA frameworks in 2018. Figure 1: Percentage achieving the expected standard and higher standard in reading, writing and maths (combined) 53 61 64 65 5 9 10 11 0 20 40 60 80 100 2016 2017 2018 2019 Expected Standard Higher Standard Source: National pupil database Changes to the writing TA framework
Transcript of National curriculum assessments at key stage 2 in England ... · 85% of pupils who met the phonics...
1
National curriculum assessments at key stage 2 in England, 2019 (provisional)
5 September 2019
This publication provides provisional attainment statistics for key stage 2 (KS2) national curriculum assessments. This data extends the interim publication published on 9 July 2019. It includes results for pupils in schools in England
at national, regional and local authority level by phonics prior attainment by pupil characteristics such as gender, disadvantage and special educational needs by school characteristics such as school type, phase and religious character
It is accompanied by tables in Excel and open data formats providing further detail. It is also accompanied by underlying data that provides results at local authority district and constituency level.
65% pupils reached the expected standard in reading, writing and maths (combined), and 11% pupils reached the higher standard in all three subjects
65% of pupils reached the expected standard in all of reading, writing and maths (combined) in 2019, up from 64% in 2018.
11% of pupils reached the higher standard in 2019, up from 10% in 2018.
Attainment in reading, writing and maths (combined) in 2018 and 2019 is not directly comparable to earlier years (2016 and 2017) because of changes to the writing TA frameworks in 2018.
Figure 1: Percentage achieving the expected standard and higher standard in reading, writing and maths (combined)
5361 64 65
5 9 10 11
0
20
40
60
80
100
2016 2017 2018 2019
Expected Standard Higher Standard
Source: National pupil database
Changes to the writing TA framework

2
85% of pupils who met the phonics standard in year 1 attained the expected standard in reading at the end key stage 2
Of pupils who met the expected standard in phonics in year 1 in 2014, 85% went on to meet the expected standard in the KS2 reading test in 2019 (Figure 2). Of pupils who met the expected standard in phonics by the end of year 2 in 2015 (but not in year 1), 56% went on to meet the expected standard in KS2 reading. Of those pupils who did not reach the expected standard by the end of year 2, 23% met the KS2 reading expected standard.
The proportion of pupils who went on to meet the expected standard in reading, having met the expected standard in phonics in year 1, has fallen from 88% in 2018 to 85% in 2019.
These two cohorts, who sat the KS2 reading test in 2018 and 2019, had seen a big increase in the proportion meeting the expected standards in phonics in year 1 (in 2013 and 2014).
Section 4 provides further discussion of the trends in reading attainment by phonics prior attainment.
23
56
85
30
62
88
31
64
88
0 20 40 60 80 100
Not reached phonics standard by the end ofyear 2
Reached phonics standard by the end ofyear 2 but not the end of year 1
Reached phonics standard by the end ofyear 1
2017
2018
2019
Source: National pupil database
Figure 2: Percentage achieving the expected standard in KS2 reading test by phonics outcome

3
The gender gap in reading has increased driving an increase in the overall gender gap
Girls continue to outperform boys across all subjects at the expected standard. In 2019, 70% of girls reached the expected standard in reading, writing and maths (combined) compared to 60% of boys, a gender gap1 of 10 percentage points (pp), up from 8pp in 2018. This has been driven by an increase in the gender gap in reading, where both boys and girls saw a fall in the proportion reaching the expected standard between 2018 and 2019, but the fall was higher for boys (down 3pp to 69%) than girls (down 1pp to 78%).
The gap between disadvantaged pupils and others has remained stable
Provisional data used for this publication shows the gap between disadvantaged pupils and others, measured using the disadvantage gap index, narrowed by 0.2% in the latest year (Figure 4). However, due to differences in the way the disadvantaged group is captured in the provisional data (explained in Section 5 below), we expect the index to show no change or a slight increase when the revised statistics are published in December.
1 All percentage point differences are calculated using unrounded figures
6069
78 73 7280
7078 79 83 85 86
0
20
40
60
80
100
Reading,writing and
maths
Reading Maths Grammar,punctuationand spelling
Writingteacher
assessment
Scienceteacher
assessment
Boys Girls
3.34 3.23 3.16 3.15 3.10 3.03 2.99 2.90 2.89
0.00.51.01.52.02.53.03.54.0
2011 2012 2013 2014 2015 2016 2017 2018 2019
Figure 4: Disadvantage attainment gap index
Figure 3: Percentage of boys and girls achieving the expected standard in test subjects
Source: National pupil database
Source: National pupil database

4
Contents Attainment in reading, writing and maths (combined) (Table N1a) ................. 5
Attainment by subject (Tables N1b, N2a, N2b) .............................................. 5
Scaled scores (Tables N2a, N2b) .................................................................. 7
Key Stage 2 reading attainment by phonics prior attainment (Table N7)........ 7
Attainment by pupil characteristics (Table N5) ............................................... 8
Attainment by school characteristics (Table N4) .......................................... 13
Local authority attainment (Tables L1 to L3c) .............................................. 15
List of additional tables ................................................................................ 17
Underlying data ........................................................................................... 19
Further information will be available ............................................................. 19
National Statistics ........................................................................................ 19
Technical Information .................................................................................. 20
Get in touch ................................................................................................. 20
About this release
This publication provides provisional 2019 key stage 2 national curriculum assessment results for pupils in schools in England at national, regional and local authority level. It provides additional information to that in the national curriculum assessments at key stage 2 in England, 2019 (interim) publication published on 9 July 2019. 2018 figures in this publication are based on revised data due to delays to the delivery of the final dataset. These figures will be updated based on final data in the release in December 2019. Due to the minimal differences between these datasets, updating the 2018 figures is unlikely to lead to any revisions to the statistics reported in this publication. Information on progress made by pupils between the end of key stage 1 and the end of key stage 2 will be provided in the revised release in December. Further breakdown by pupil characteristics will also be provided in the revised release.
In this publication The following tables are included in the statistical publication: KS2 national and local authority tables (Excel .xls) Underlying data (open format .csv and metadata .txt.)
The accompanying methodology document provides information on the data sources, their coverage and quality and explains the methodology used in producing the data.
Feedback We are changing how our releases look and welcome feedback on any aspect of this document at [email protected]

5
Pupils take national curriculum assessments in year 6 at the end of KS2, when most pupils will reach age 11 by the end of the school year. Pupils take tests (commonly referred to as SATs) in reading, maths and grammar, punctuation and spelling (GPS) and receive a statutory teacher assessment (TA) in writing and science.
Attainment in reading, writing and maths (combined) (Table N1a) To reach the expected standard, a pupil must achieve a scaled score of 100 or more in reading, maths and GPS, or an outcome of ‘reaching the expected standard’ or ‘working at greater depth’ in the writing TA, or an outcome of ‘reaching the expected standard’ in the science TA. The ‘working at greater depth’ standard is not used for the science TA. The combined reading, writing, and maths measure uses the reading and maths test results along with the outcome of the writing teacher assessment (TA). To reach the expected standard in all of reading, writing and maths, a pupil must achieve a scaled score of 100 or more in reading and maths tests and an outcome of 'reaching the expected standard' or 'working at greater depth' in the writing TA. Together, these subjects give a broad measure of pupil attainment. To reach the higher standard, a pupil must achieve a scaled score of 110 or more in the reading and maths tests, and an outcome of ‘working at greater depth’ in the writing TA.
65% of pupils reached the expected standard in all of reading, writing and maths (combined) in 2019, up from 64% in 2018. 11% of pupils reached the higher standard in 2019, up from 10% in 20182. Attainment in all of reading, writing and maths is not directly comparable to earlier years (2016 and 2017) because of changes to the writing TA frameworks in 2018.
Attainment by subject (Tables N1b, N2a, N2b) In the reading test, 73% of pupils reached the expected standard in 2019, down by 2pp from 2018.
In the maths test, 79% of pupils reached the expected standard, up by 3pp from 20183. In the GPS test, 78% of pupils reached the expected standard, unchanged from 2018. In the writing teacher assessment, 78% of pupils reached the expected standard, unchanged from 20184. In the science teacher assessment, 83% of pupils reached the expected standard5.
All percentage point differences are calculated using unrounded figures.
2 Includes pupils who achieved a high score in reading and maths and who were working at greater depth in writing. 3 Please note that the final maths figure for 2018 is 75%, revised down from the 76% figure published in December 2018. Key stage 2 results data is subject to amendments and corrections in December-January of each year. Consequently, the calculation of final attainment figures may lead to revisions to the previously published data. 4 Attainment in the writing TA in 2018 and 2019 is not directly comparable to earlier years (2016 and 2017) due to changes to the writing TA framework in 2017/18. 5 Attainment in the science TA in 2019 is not directly comparable to 2018 due to changes to the science TA framework.
66 70 73 7481
72 75 77 7682
75 75 78 78 8273
79 78 78 83
0
20
40
60
80
100
Reading test Maths test GPS test Writing TA Science TA
Figure 5: Percentage achieving the expected standard in individual subjects
2016 2017 2018 2019
Source: National pupil database Changes to teacher assessment frameworks
6
In the reading test, 27% of pupils reached the higher standard in 2019, down by 1 percentage point from 2018. In the maths test, 27% of pupils reached the higher standard, up by 3pp from 2018. In the GPS test, 36% of pupils reached the higher standard, up by 1 percentage point from 2018. In the writing teacher assessment, 20% of pupils reached the higher standard, unchanged from 20186.
Source: National pupil database
Attainment at the expected standard is highest in maths and lowest in reading. Table 1 summarises attainment at the expected standard and the higher standard in the key stage 2 subjects. Table 1: Attainment in KS2 tests or teacher assessments by subject (percentage point changes from 2018 shown in brackets) England, 2019 (all schools) Reaching the expected standard Achieving the higher
standard Reading test 73% (-2pp) 27% (-1pp) Maths test 79% (+3pp) 27% (+3pp) GPS test 78% (no change) 36% (+1pp) Writing TA 78% (no change) 20% (no change) Science TA 83% Not applicable
Changes made within the 2017/18 writing TA frameworks mean that judgements in 2018 and 2019 are not directly comparable to those made using the previous interim frameworks in 2016 and 2017.
6 Attainment in writing TA in 2018 and 2019 is not directly comparable to earlier years (2016 and 2017) due to changes to the writing TA framework in 2017/18.
19 17
23
15
25 23
31
18
2824
34
20
27 27
36
20
0
10
20
30
40
50
Reading test Maths test GPS test Writing TA
Figure 6: Percentage achieving the higher standard in individual subjects
2016 2017 2018 2019
Changes to the writing TA framework
Source: National pupil database

7
Scaled scores (Tables N2a, N2b) We use scaled scores to report the results of tests so we can make accurate comparisons of performance over time. The average scaled score is calculated as the mean scaled score of all pupils awarded a scaled score. Pupils who did not take the test are excluded from the calculation. Average scaled scores remained largely stable compared to 2018. The average scaled score in reading fell by 1 score to 104. The average scaled score in maths increased by 1 score to 105. The average scaled score in GPS remained the same at 106.
Table 2: Average scaled score, England, 2019 (all schools)
Subject 2016 2017 2018 2019 Reading test 103 104 105 104 Maths test 103 104 104 105 GPS test 104 106 106 106
Source: National pupil database
Key Stage 2 reading attainment by phonics prior attainment (Table N7) As expected, pupils who performed well in the phonics screening check also did well in the key stage 2 reading test. Of pupils who reached the phonics standard in year 1 in 2014, 85% went on to meet the expected standard in the KS2 reading test in 2019. Of pupils who met the expected standard in phonics by the end of year 2 (but not in year 1), 56% went on to meet the expected standard. Of those pupils who did not reach the expected standard by the end of year 2, 23% met the expected standard.
Table 4 shows reading attainment by phonics prior attainment set in the context of trends in phonics attainment. It shows how the cohort who reached the expected standard in reading in 2019 and previous years performed in the phonics check. For example, around three quarters (73%) of pupils who were eligible for the reading test in 2019 reached the phonics standard in year 1. For that group of pupils - those who reached the phonics standard by the end of year 1 - 85% went on to reach the expected standard (in the reading test) in 2019. Similarly, 68% of pupils eligible for the reading test in 2018 reached the phonics standard by end of year 1. Of that group, 88% went on to reach the expected standard in reading. The overall picture shown by table 4 is that the fall in the proportion of pupils who met the expected standards in phonics in year 1 who subsequently went on to meet the expected standard in reading at KS2 is in the context of rapidly increasing phonics attainment across these cohorts.
Table 4: Percentage of pupils who met the expected standard in phonics, and reading attainment by phonics prior attainment
Year in which the KS2 reading test was sat
2017 2018 2019
Reached phonics standard by the end of year 1
of those, the percentage who reached the expected standard in reading
Reached phonics standard by the end of year 2 but not by the end of year 1
of those, the percentage who reached the expected standard in reading
Not reached phonics standard by the end of year 2
57% 68% 73%
88% 88% 85%
28% 20% 17%
64% 62% 56%
15% 11% 10%
of those, the percentage who reached the expected standard in reading
31% 30% 23%
Source: National pupil database

8
Attainment by pupil characteristics (Table N5) This section discusses attainment by gender, disadvantage, special education needs (SEN), first language and ethnicity.
Please note that the statistics on disadvantage in this publication are provisional and do not include pupils in the care of the local authority for a day or more in the last year unless they were eligible for free school meals during the last 6 years or they have ceased to be looked after in the last year. See the section on Disadvantaged Pupils below for further information.
Figure 10: Percentage reaching the expected standard in reading, writing and maths for different characteristics groups England, 2019 (state-funded schools)
Source: National pupil database
Gender gaps Girls continue to outperform boys at the expected standard across all test subjects. In 2019, 70% of girls reached the expected standard in reading, writing and maths (combined) compared to 60% of boys, a gender gap3 of 10pp, up from 8pp in 2018. This has been driven by an increase in the gender gap in reading, with 78% of girls reaching the expected standard compared to 69% of boys.
The biggest attainment gap between boys and girls remains in the writing teacher assessment at 12pp.
13% of girls achieved the higher standard in all of reading, writing and maths (combined) compared to 9% of boys – a gap of 4pp. This has increased from a gap of 3pp in 2018.
At the higher standard, the extent of the gender gap in individual subjects remains largely stable, with maths remaining the only subject in which boys outperform girls.
6465
7422
6847
7151
7060
0 20 40 60 80 100
First language other than EnglishEnglish
Not SENSEN
All other pupilsFSM
All other pupilsDisadvantaged
GirlsBoys
Percentage achieving the expected standard

9
Table 5: Attainment by gender, England, 2019 (all schools) Boys Girls Difference7 2018 2019 2018 2019 2018 2019
Reaching the expected standard Reading, writing, and maths 61% 60% 68% 70% 8pp 10pp Reading test 72% 69% 79% 78% 8pp 9pp Maths test 75% 78% 76% 79% 1pp 1pp GPS test 73% 73% 82% 83% 9pp 9pp Writing teacher assessment 72% 72% 84% 85% 12pp 12pp Achieving a high score/greater depth
Reading, writing, and maths 8% 9% 12% 13% 3pp 4pp Reading test 24% 22% 33% 32% 9pp 10pp Maths test 26% 29% 22% 24% 4pp 5pp GPS test 30% 31% 39% 41% 9pp 10pp Writing teacher assessment 15% 15% 25% 25% 11pp 10pp
Disadvantage gap index (Table N6)
The disadvantage gap index8 summarises the relative attainment gap between disadvantaged pupils and all other pupils. The gap index is more resilient to changes to assessment and therefore offers greater comparability between years. The index ranks all pupils in the country. A disadvantage gap of zero would indicate that there is no difference between the average performance of disadvantaged and non-disadvantaged pupils. We measure whether the disadvantage gap is getting larger or smaller over time. The statistics about disadvantage in this publication are provisional and do not include pupils in the care of a local authority - unless they were eligible for free school meals during the last 6 years or ceased to be looked-after in the last year. These pupils will be included in revised disadvantage statistics in December. We expect this to have a small impact on the disadvantage gap index (an increase of around 0.02 in the gap index in recent years). These pupils will be included in revised disadvantage statistics in December. We expect this to have a small impact on the disadvantage gap index (an estimated increase of around 0.02 in the gap index – based on 2016 to 2018 data).
Provisional data used for this publication shows the gap between disadvantaged pupils and others, measured using the disadvantage gap index, narrowed by 0.2% in the latest year (Figure 11).
However, due to differences in the way the disadvantaged group is captured (explained above), we expect the index to show no change or a slight increase when the revised statistics are published in December.
7 All percentage point differences are calculated from unrounded figures 8 More details of the methodology and consultation were published in SFR 40/2014.
Source: National pupil database

10
Figure 11: Trend in the disadvantaged pupils’ attainment gap index England, 2011 to 2019 (state-funded schools)
Source: National pupil database
Disadvantaged Pupils (Table N5)
Disadvantaged pupils are ordinarily defined as: those who were registered as eligible for free school meals at any point in the last six years, children looked after by a local authority or have left local authority care in England and Wales through adoption, a special guardianship order, a residence order or a child arrangements order. As noted above, the statistics about disadvantage in this publication are provisional and do not include pupils in the care of a local authority - unless they were also eligible for free school meals during the last 6 years or ceased to be looked-after in the last year. These pupils will be included in revised disadvantage statistics in December. We expect this to have only a marginal impact on the statistics, which are expected to change by less than half a percentage point. In 2019, 30% of pupils at the end of key stage 2 were classed as disadvantaged
In 2019, 51% of disadvantaged pupils reached the expected standard in all of reading, writing and maths compared to 71% of all other pupils, a difference of 19pp. Table 6 shows that the gap in attainment at the expected standard in reading, writing and maths has decreased (from 21pp) since 2016. However, the gap at the higher standard between disadvantaged pupils and all other pupils has increased from 5pp in 2016 to 8pp in 2019.
Table 6: Attainment by disadvantage status, England, 2019 (state-funded schools) Disadvantaged pupils All other pupils Difference9
Reaching the expected standard in reading, writing and maths
2016 39% 60% +21pp 2017 47% 67% +20pp2018 51% 70% +20pp 2019 51% 71% +19pp Reaching the higher standard in reading, writing and maths
2016 2% 7% +5pp 2017 4% 11% +7pp 2018 4% 12% +8pp 2019 5% 13% +8pp
Source: National pupil database
9 All gaps are calculated from unrounded figures
3.34 3.23 3.16 3.15 3.10 3.03 2.99 2.90 2.89
0.00.51.01.52.02.53.03.54.0
2011 2012 2013 2014 2015 2016 2017 2018 2019

11
Special Education Needs (SEN) (Table N5)
SEN pupils are categorised as 'SEN with an Education, health and care (EHC) plan' or 'SEN support'. In 2019, 18% of pupils at the end of key stage 2 had a special educational need: 3% with a statement or education, health and care plan and 15% with ‘SEN support’
Of all reported characteristics, the difference between the comparison groups is largest when looking at SEN (Figure 10). In 2019, 22% of pupils with SEN reached the expected standard in all of reading, writing and maths, compared with 74% of pupils with no identified SEN, resulting in an attainment gap of 52pp.
Table 7: Attainment by SEN status, England, 2019 (state-funded schools) All SEN pupils No identified SEN Difference10
Reaching the expected standard in reading, writing and maths
2016 14% 62% +48pp 2017 18% 70% +52pp 2018 21% 74% +52pp 2019 22% 74% +52pp
Source: National pupil database
English as a first language (Table N5)
In 2019, 21% of pupils at the end of key stage 2 had a first language other than English
The attainment gap between pupils whose first language is English and those whose first language is other than English has fallen to 1pp from 4pp in 2016. In 2019, 64% of pupils whose first language was other than English reached the expected standard in all of reading, writing and maths compared with 65% of pupils whose first language is English. At individual subject level, the gap between pupils whose first language was English and those whose first language is other than English is largest in reading at 5pp, with 69% of pupils whose first language was other than English reaching the expected standard in reading compared with 74% of pupils whose first language is English. Conversely, pupils whose first language is other than English performed better in maths and in grammar, punctuation and spelling. Table 8: Attainment by first language, England, 2019 (state-funded schools) Other than English English Difference
11 Reaching the expected standard in reading, writing and maths
2016 50% 54% +4pp 2017 58% 62% +4pp 2018 63% 65% +2pp 2019 64% 65% +1pp
Source: National pupil database
10 All gaps are calculated from unrounded figures 11 All gaps are calculated from unrounded figures
12
Ethnicity (Table N5)
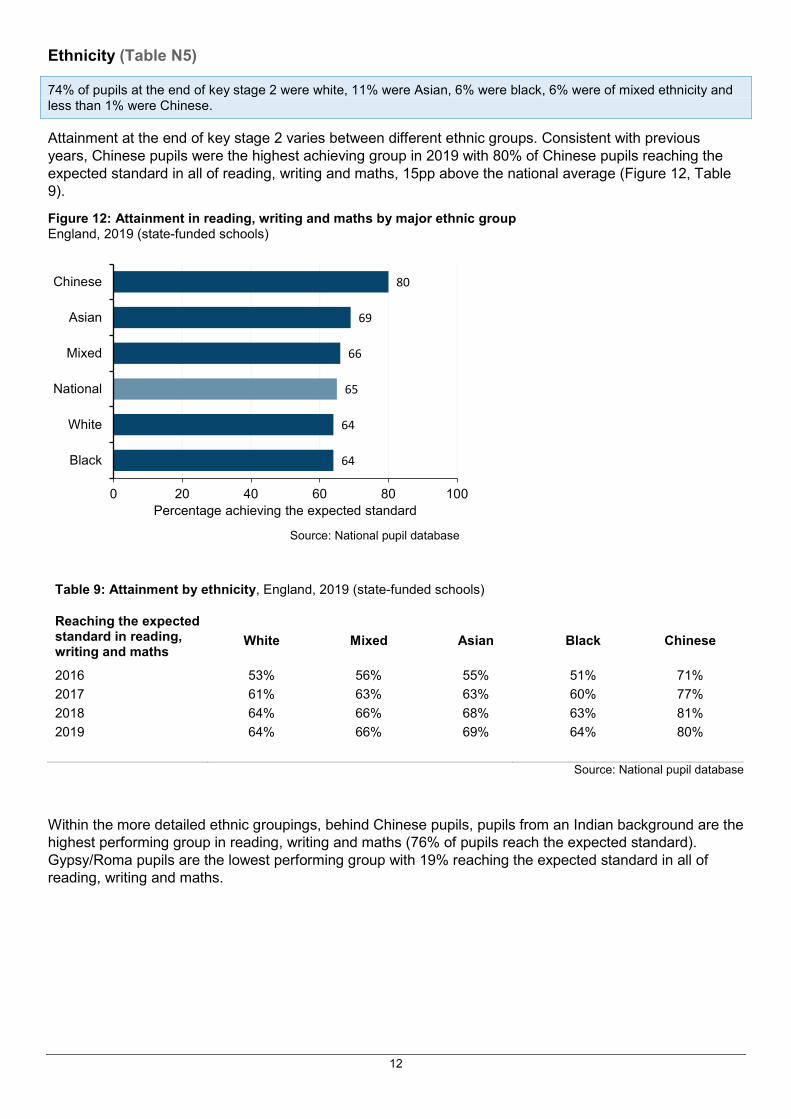
74% of pupils at the end of key stage 2 were white, 11% were Asian, 6% were black, 6% were of mixed ethnicity and less than 1% were Chinese.
Attainment at the end of key stage 2 varies between different ethnic groups. Consistent with previous years, Chinese pupils were the highest achieving group in 2019 with 80% of Chinese pupils reaching the expected standard in all of reading, writing and maths, 15pp above the national average (Figure 12, Table 9).
Figure 12: Attainment in reading, writing and maths by major ethnic group England, 2019 (state-funded schools)
Source: National pupil database
Table 9: Attainment by ethnicity, England, 2019 (state-funded schools)
Reaching the expected standard in reading, writing and maths
White Mixed Asian Black Chinese
2016 53% 56% 55% 51% 71% 2017 61% 63% 63% 60% 77% 2018 64% 66% 68% 63% 81% 2019 64% 66% 69% 64% 80%
Source: National pupil database
Within the more detailed ethnic groupings, behind Chinese pupils, pupils from an Indian background are the highest performing group in reading, writing and maths (76% of pupils reach the expected standard). Gypsy/Roma pupils are the lowest performing group with 19% reaching the expected standard in all of reading, writing and maths.
64
64
65
66
69
80
0 20 40 60 80 100
Black
White
National
Mixed
Asian
Chinese
Percentage achieving the expected standard

13
Attainment by school characteristics (Table N4) School type
There were 15,153 state-funded mainstream primary schools with key stage 2 results in 2019. Since 2016, there have been substantial changes to the makeup of school types in England (Table 10). The proportion of LA maintained schools decreased from 82% in 2016 to 68% in 2019. There have been corresponding increases in the proportion of sponsored and converter academies to 9% and 22% respectively. It should be noted that the conversion of schools from one type to another means that the headline figures capture not only change in performance but also change in school type. While the number of free schools has increased to 81, free schools make up a very small proportion of schools. See the accompanying methodology and quality information document for details about different types of school.
Table 10: Number and percentage of schools by school type England, 2019 (State-funded mainstream schools) 2016 2017 2018 2019 All state-funded mainstream primary schools
14,930 14,977 15,055 15,153
LA maintained schools 12,292 82% 11,784 79% 11,044 73% 10,368 68% Sponsored academies 866 6% 983 7% 1,187 8% 1,352 9% Converter academies 1,744 12% 2,174 15% 2,767 18% 3,352 22% Free schools 28 0% 36 0% 57 0% 81 1%
Source: National pupil database

14
Attainment for different school types is summarised in Table 11.
Attainment levels in mainstream academies and free schools as a group are broadly like those in local authority maintained mainstream schools. Within the academies group, converter academies had broadly similar proportions of pupils achieving the expected standard than the averages for all state-funded mainstream schools. On the other hand, sponsored academies as a group are below the average for state-funded mainstream schools but were typically low performing before their conversion to academy status.
Table 11: Attainment by type of school, England, 2019 (State- funded mainstream schools)
Reading, writing, and maths Type of school Reaching the expected standard: Reaching the higher standard: LA maintained schools 66% 11% Academies and free schools
65% 10%
Of which: Sponsored academies 58% 7% Converter academies 67% 11% Free schools 62% 11%
All state-funded mainstream schools
66% 11%
Reaching the expected standard in:
Type of school Reading test Writing TA Maths test GPS test LA maintained schools 75% 80% 80% 80% Academies and free schools
73% 79% 79% 78%
Of which: Sponsored academies 66% 74% 73% 71% Converter academies 75% 81% 81% 80%
Free schools 71% 77% 77% 78% All state-funded mainstream schools
74% 79% 80% 79%
Source: National pupil database
Attainment in academies over time
As noted above, the conversion of schools from one type to another means that the headline figures capture not only change in performance but also change in school type. It is difficult, therefore, to assess the impact of converting to an academy by looking only at the headline figures in 2019. In order to address this, Table N3 of the accompanying tables provides a time series showing how reading, writing and maths attainment changes in years after a school becomes an academy. This time series shows that the academies that have been open the longest have the highest attainment. In converter academies that have been open for 8 years or more, 71% of pupils reached the expected standard in reading, writing and maths while in sponsored academies 61% of pupils reached the expected standard. In converter academies open for one academic year 66% of pupils reached the expected standard while in sponsored academies open for one year 54% reached the standard.

15
Local authority attainment (Tables L1 to L3c) There is considerable variation between local authorities12 in attainment (Table 12). The difference between the lowest and highest performing local authorities was greatest in reading, writing and maths (combined) with a range of 27 pp, a decrease from 33 pp in 2018. This change has been driven by an increase in the lower minimum attainment (53% in 2019 compared to 48% in 2018).
Table 12: Minimum and maximum local authority attainmentEngland, 2019 (state-funded schools) % reaching the expected standard in
Minimum Maximum Range (percentage points13)
Reading, writing and maths 53% 80% 27
Reading test 62% 87% 25 Maths test 70% 90% 20 GPS test 70% 91% 20 Writing TA 68% 88% 20 Science TA 74% 92% 19 Average scaled scores
Minimum Maximum Range
Reading test 102 108 6 Maths test 103 109 6 GPS test 104 110 6
Source: National pupil database
The map in Figure 13 shows the percentage of pupils reaching the expected standard in reading, writing and maths by local authority. This map reveals a complex picture of attainment across England, with a range of high and low attainment in different regions. Inner and Outer London remain the highest achieving regions with 69% of pupils in both regions achieving the expected standard in reading, writing and maths combined respectively. The region with the lowest attainment was the East Midlands where 62% pupils achieved the expected standard.
12 City of London and Isles of Scilly are not included in this analysis as they only have one school each. 13 All percentage point differences are calculated using unrounded figures.

16
Figure 13: Percentage of pupils reaching the expected standard in reading, writing and maths by local authority. England, 2019 (state-funded schools only)
Source: National pupil database

17
List of additional tables The following tables are available in Excel and open data format on the department’s statistics website:
National tables Table N1a Attainment at the end of key stage 2 in reading, writing TA and maths by gender, 2016 -
2019 Table N1b Attainment in key stage 2 tests by subject and gender, 2019 Table N2a Attainment at the end of key stage 2 by subject and gender, 2016 – 2019 Table N2b Distribution of scaled scores by subject, 2019 Table N3 Attainment of pupils at the end of key stage 2 in academies by length of time open, 2019 Table N4 Attainment of pupils at the end of key stage 2 by school type, school phase, school cohort
size and religious character, 2019 Table N5 Attainment of pupils at the end of key stage 2 by subject and pupil characteristics, 2019 Table N6 Disadvantaged gap index at key stage 2, 2011 – 2019 Table N7 Key stage 2 reading test by phonics prior attainment and gender, 2019
Local authority tables Table L1 Attainment at the end of key stage 2 in reading, writing and maths by region, local authority
and gender, 2019 Table L2a Attainment of all pupils at the end of key stage 2 tests by region and local authority, 2019 Table L2b Attainment of boys at the end of key stage 2 tests by region and local authority, 2019 Table L2c Attainment of girls at the end of key stage 2 tests by region and local authority, 2019 Table L3a Attainment of all pupils at the end of key stage 2 teacher assessments by region and local
authority, 2019 Table L3b Attainment of boys at the end of key stage 2 teacher assessments by region and local
authority, 2019 Table L3c Attainment of girls at the end of key stage 2 teacher assessments by region and local
authority, 2019

18
When reviewing the tables, please note that:
We preserve confidentiality The Code of Practice for Official Statistics requires us to take reasonable steps to ensure that our published or disseminated statistics protect confidentiality.
We suppress some figures Values of 1 or 2, or a percentage based on 1 or 2 pupils who achieved; or 0, 1 or 2 pupils who did not achieve a particular level are suppressed. Some additional figures have been suppressed to prevent the possibility of a suppressed figure being revealed. This suppression is consistent with our Statistical policy statement on confidentiality.
We adopt symbols to help identify this
Symbols are used in the tables as follows: . not applicable * LA level data based on a single school
Percentages in this publication are given to the nearest whole number but all gaps and differences have been calculated on unrounded data. Therefore, some figures may not match those produced from the rounded figures shown in the tables.
This is provisional data 2019 figures in this publication are provisional. We will publish revised figures in the revised ‘National curriculum assessments at key stage 2’ publication in December. Small differences may not be indicative of a true difference in attainment. This is because there may be small differences between these figures and the revised figures published later in the year. The differences between provisional and revised national figures are usually negligible but LA level figures may be larger. 2018 figures in this publication are based on revised data. We will publish final figures for 2018 in the revised ‘National curriculum assessments at key stage 2’ publication in December. Any unplanned revisions will be made in accordance with our Statistical policy statement on revisions.
We provide underlying data See section 9 below.

19
Underlying data The publication is accompanied by underlying data in csv format so that it can be loaded into the software of your choice. It is supplied in both the existing format (type A) and a new format (type B) designed to be more convenient to users. This data provides:
National level attainment figures broken down by pupil characteristics - gender, ethnicity, free school meal eligibility, special educational needs provision and disadvantage. (Type A and B formats)
National level attainment figures broken down by school characteristics - school type, school phase, and religious character of school. (Types A and B)
Local authority level attainment figures broken down by gender. (Types A and B)
Local authority district level attainment figures broken down by gender. (Type B only)
Constituency level attainment figures broken down by gender. (Type B only)
Metadata describing this data is supplied.
Further information will be available
Pupil characteristics breakdowns at local authority level
Local authority level data with pupil characteristics breakdowns - including data broken down by gender, ethnicity, free school meal eligibility, special educational needs provision and disadvantage - will be published in the revised publication in December.
Pupil characteristics breakdowns at local authority district level
Local authority district level data with pupil characteristics breakdowns - including data broken down by free school meal eligibility and disadvantage - will be published in the revised publication in December.
Progress measures Information on progress for different pupil groups and for local authorities will be published in the revised publication in December.
School level figures School level data will be published in the performance tables in December.
Previously published figures National curriculum assessments at key stage 2 in England, 2019 (interim) National curriculum assessments: key stage 2, 2018 (provisional) National curriculum assessments at key stage 2, 2018 (revised) Primary school performance tables 2018
National Statistics The United Kingdom Statistics Authority designated these statistics as National Statistics in September 2014, in accordance with the Statistics and Registration Service Act 2007 and signifying compliance with the code of practice for official statistics. Designation can be broadly interpreted to mean that the statistics: meet identified user needs
are well explained and readily accessible are produced according to sound methods are managed impartially and objectively in the public interest Once statistics have been designated as National Statistics it is a statutory requirement that the code of practice shall continue to be observed. Information on improvements made to these statistics to continue their compliance with the Code of Practice will be provided in a quality and methodology information document to be published on 5th September 2019. The Department has a set of statistical policies in line with the code of practice for statistics.
20
Technical Information A quality and methodology information document accompanies this publication. This provides further information on the data sources, their coverage and quality and explain the methodology used in producing the data, including how it is validated and processed.
National curriculum assessment figures published in this publication are based on the data that will be used to prepare the 2019 primary school performance tables. This data was shared with schools and local authorities as part of the checking exercise on 2 September 2019.
It is based on test and teacher assessment data provided to the Department by the Standards and Testing Agency (STA) on 9 July 2019.
Get in touch Media enquiries Press Office News Desk, Department for Education, Sanctuary Buildings, Great Smith Street, London SW1P 3BT. Tel: 020 7783 8300
Other enquiries/feedback Simon Dickason, Education Data Division, Department for Education, Sanctuary Buildings, Great Smith Street, London, SW1P 3BT. Tel: 020 7783 8761 [email protected]
© Crown copyright 2019
This publication (not including logos) is licensed under the terms of the Open Government Licence v3.0 except where otherwise stated. Where we have identified any third party copyright information you will need to obtain permission from the copyright holders concerned.
To view this licence: visit www.nationalarchives.gov.uk/doc/open-government-licence/version/3 email [email protected] write to Information Policy Team, The National Archives, Kew, London, TW9 4DU
About this publication: enquiries Simon Dickason, Education Data Division, Department for Education, Sanctuary Buildings,
Great Smith Street, London, SW1P 3BT tel: 020 7783 8761 email: [email protected] download https://www.gov.uk/government/collections/statistics-key-stage-2
Reference: National curriculum assessments at KS2 in England, 2019 (provisional)
Follow us on Twitter: @educationgovuk
Like us on Facebook: facebook.com/educationgovuk