National Crop Insurance Servicescropinsurance.org/wp-content/uploads/2016/02/RMA... · ·...
42
National Crop Insurance Services FEBRUARY 15, 2016 BRANDON WILLIS, ADMINISTRATOR USDA RISK MANAGEMENT AGENCY
Transcript of National Crop Insurance Servicescropinsurance.org/wp-content/uploads/2016/02/RMA... · ·...
National Crop Insurance Services FEBRUARY 15, 2016
BRANDON WILLIS, ADMINISTRATOR
USDA RISK MANAGEMENT AGENCY
2
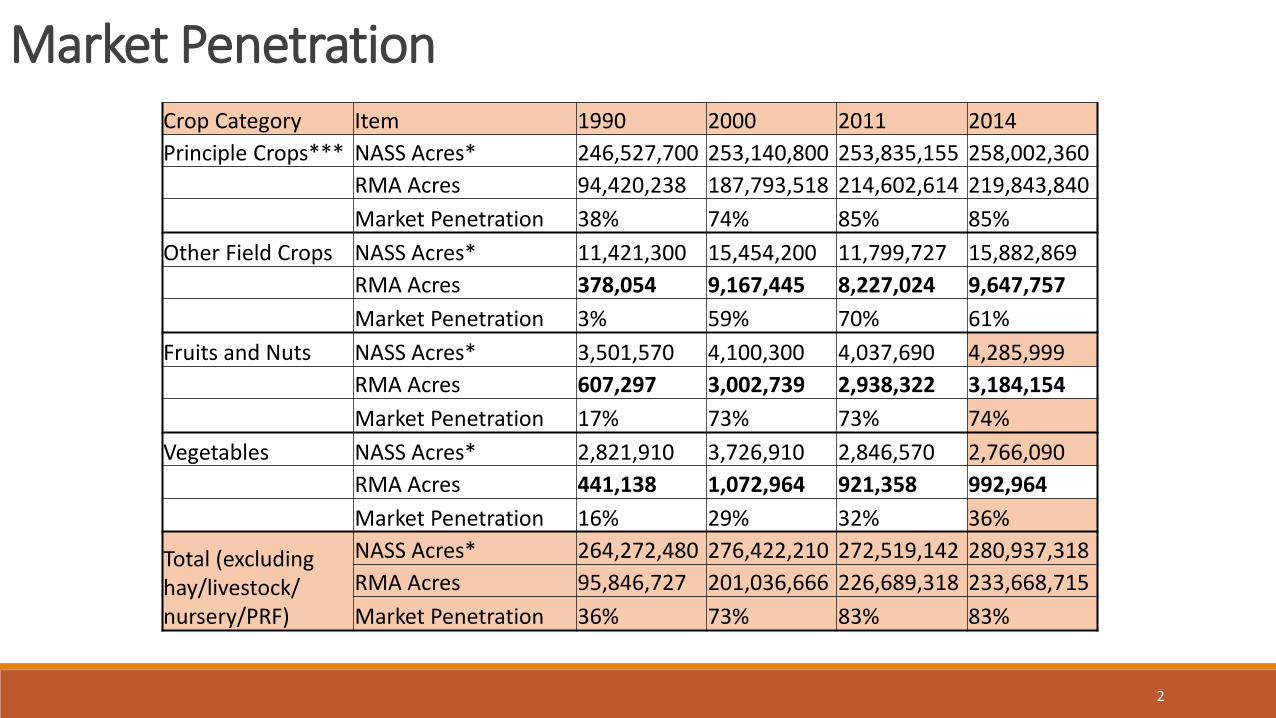
Market Penetration Crop Category Item 1990 2000 2011 2014
Principle Crops*** NASS Acres* 246,527,700 253,140,800 253,835,155 258,002,360
RMA Acres 94,420,238 187,793,518 214,602,614 219,843,840
Market Penetration 38% 74% 85% 85%
Other Field Crops NASS Acres* 11,421,300 15,454,200 11,799,727 15,882,869
RMA Acres 378,054 9,167,445 8,227,024 9,647,757
Market Penetration 3% 59% 70% 61%
Fruits and Nuts NASS Acres* 3,501,570 4,100,300 4,037,690 4,285,999
RMA Acres 607,297 3,002,739 2,938,322 3,184,154
Market Penetration 17% 73% 73% 74%
Vegetables NASS Acres* 2,821,910 3,726,910 2,846,570 2,766,090
RMA Acres 441,138 1,072,964 921,358 992,964
Market Penetration 16% 29% 32% 36%
Total (excluding hay/livestock/ nursery/PRF)
NASS Acres* 264,272,480 276,422,210 272,519,142 280,937,318
RMA Acres 95,846,727 201,036,666 226,689,318 233,668,715
Market Penetration 36% 73% 83% 83%

3
Rank 2015 Commodity 2015 Liability Percent of Total
1 CORN $40.2 Billion 39.3%
2 SOYBEANS $24.2 Billion 23.7%
3 WHEAT $8.4 Billion 8.2%
4 COTTON $3.0 Billion 2.9%
5 ALMONDS $2.9 Billion 2.9%
6 RICE $1.5 Billion 1.5%
7 NURSERY $1.5 Billion 1.4%
8 GRAPES $1.5 Billion 1.4%
9 ORANGE TREES $1.3 Billion 1.2%
10 APPLES $1.2 Billion 1.1%
ALL OTHER $16.5 Billion 16.3%
TOTAL $102 Billion
Top 10 Commodities Nationwide by Liability
4
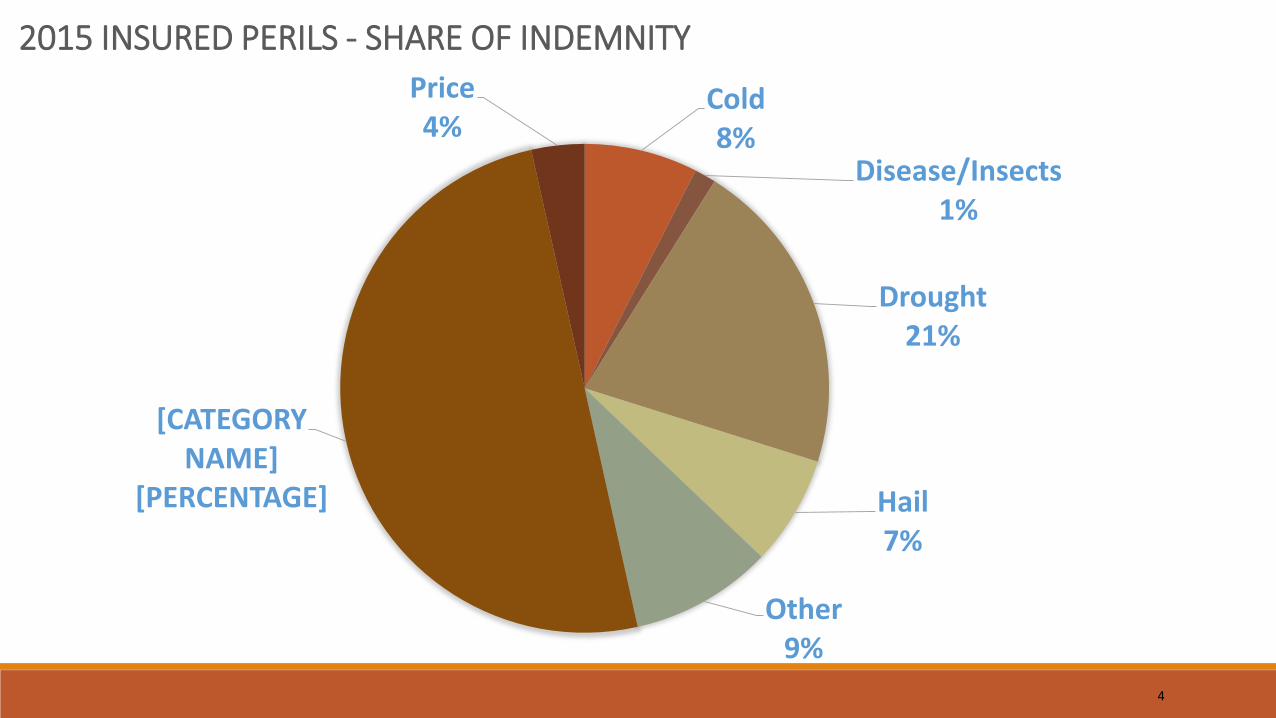
Cold 8%
Disease/Insects 1%
Drought 21%
Hail 7%
Other 9%
[CATEGORY NAME]
[PERCENTAGE]
Price 4%
2015 INSURED PERILS - SHARE OF INDEMNITY
5
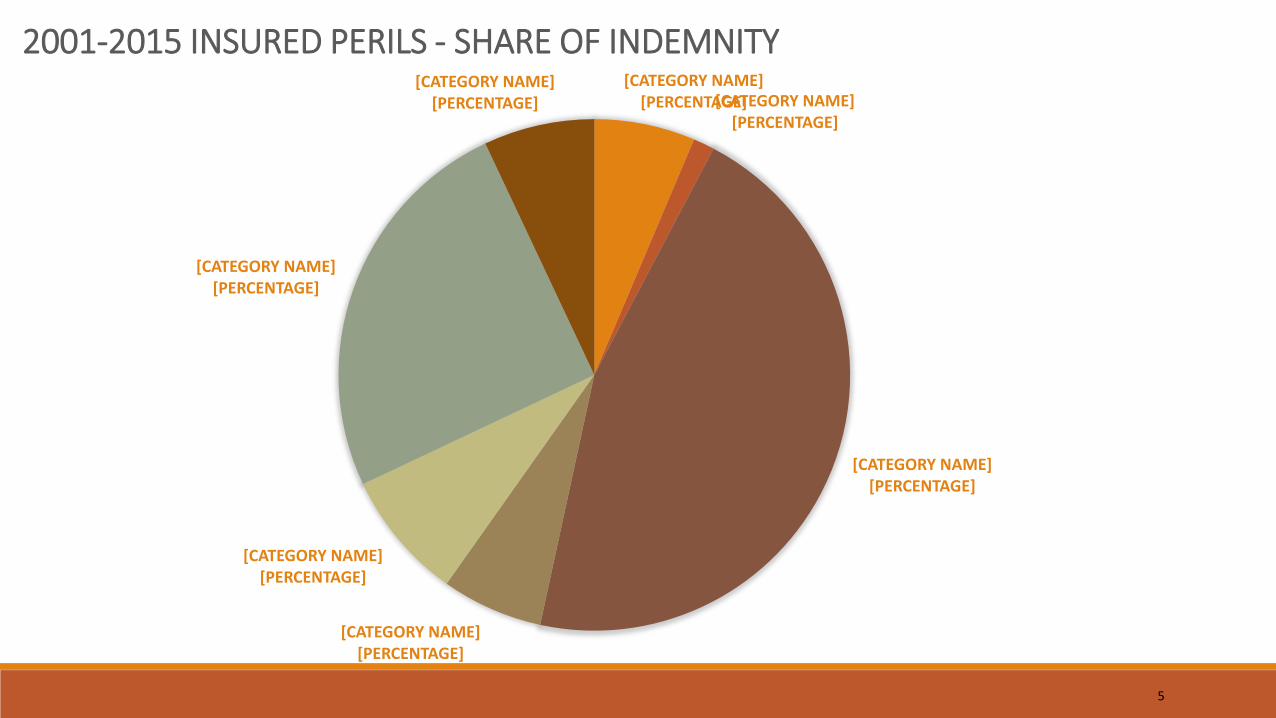
[CATEGORY NAME] [PERCENTAGE] [CATEGORY NAME]
[PERCENTAGE]
[CATEGORY NAME] [PERCENTAGE]
[CATEGORY NAME] [PERCENTAGE]
[CATEGORY NAME] [PERCENTAGE]
[CATEGORY NAME] [PERCENTAGE]
[CATEGORY NAME] [PERCENTAGE]
2001-2015 INSURED PERILS - SHARE OF INDEMNITY
6
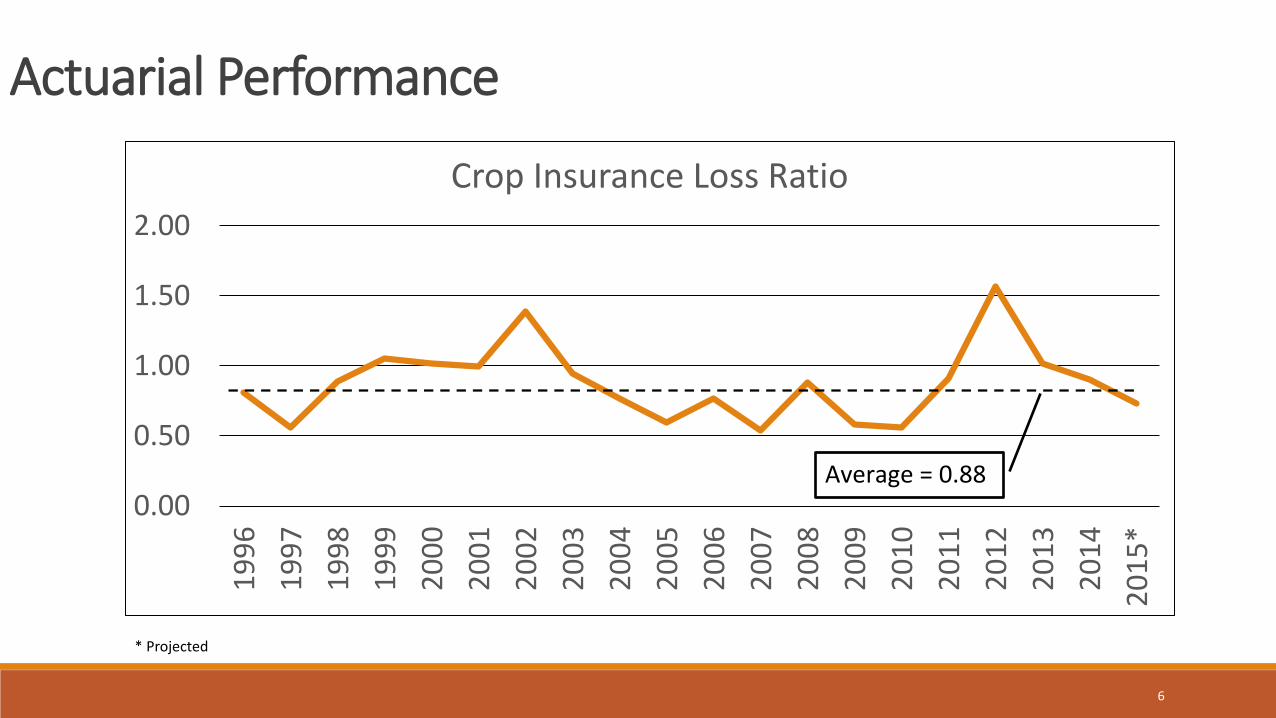
Actuarial Performance
0.00
0.50
1.00
1.50
2.001
99
6
19
97
19
98
19
99
20
00
20
01
20
02
20
03
20
04
20
05
20
06
20
07
20
08
20
09
20
10
20
11
20
12
20
13
20
14
20
15
*
Crop Insurance Loss Ratio
Average = 0.88
* Projected

7
2014 Farm Bill Implementation Update
• Conservation Compliance
• Late Payment of Debt
• Beginning Farmer/Rancher
• Organics
• Whole Farm Revenue Program (WFRP)
• APH – Yield Exclusion (APH-YE)
• Supplemental Coverage Option (SCO)
• Stacked Income Protection (STAX)
• Required Studies
8
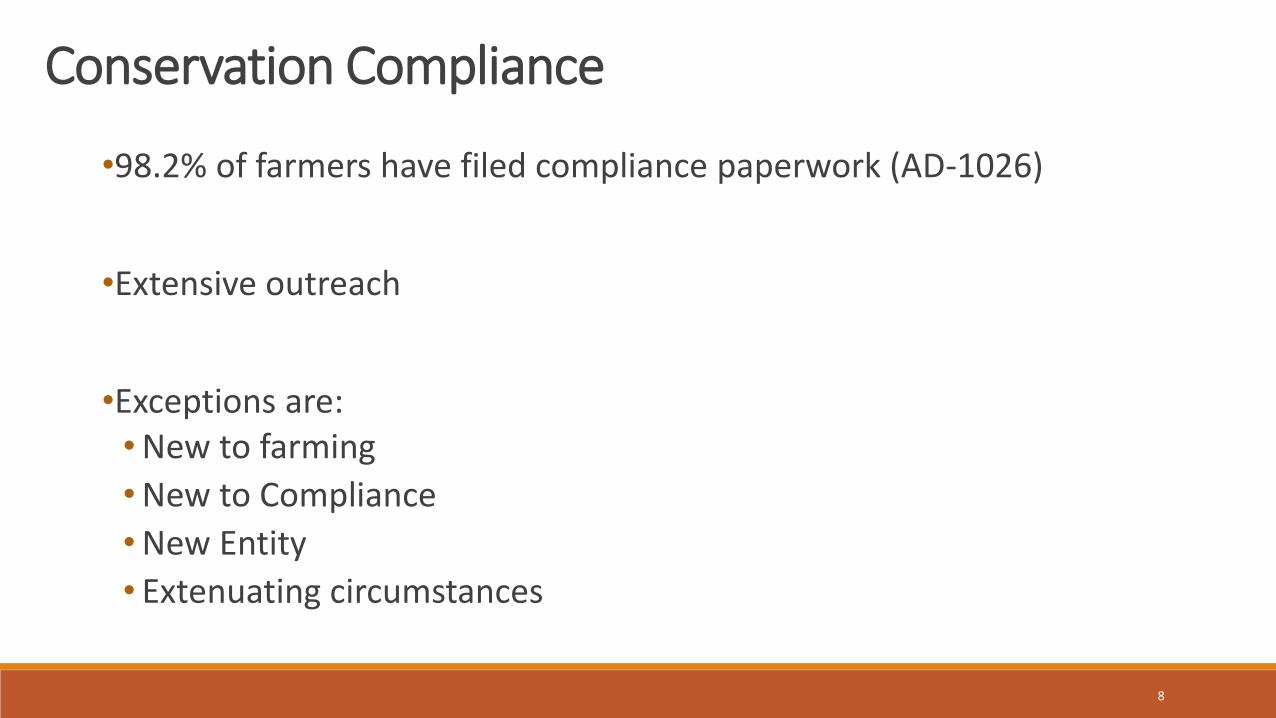
Conservation Compliance
•98.2% of farmers have filed compliance paperwork (AD-1026)
•Extensive outreach
•Exceptions are: •New to farming
•New to Compliance
•New Entity
• Extenuating circumstances
9
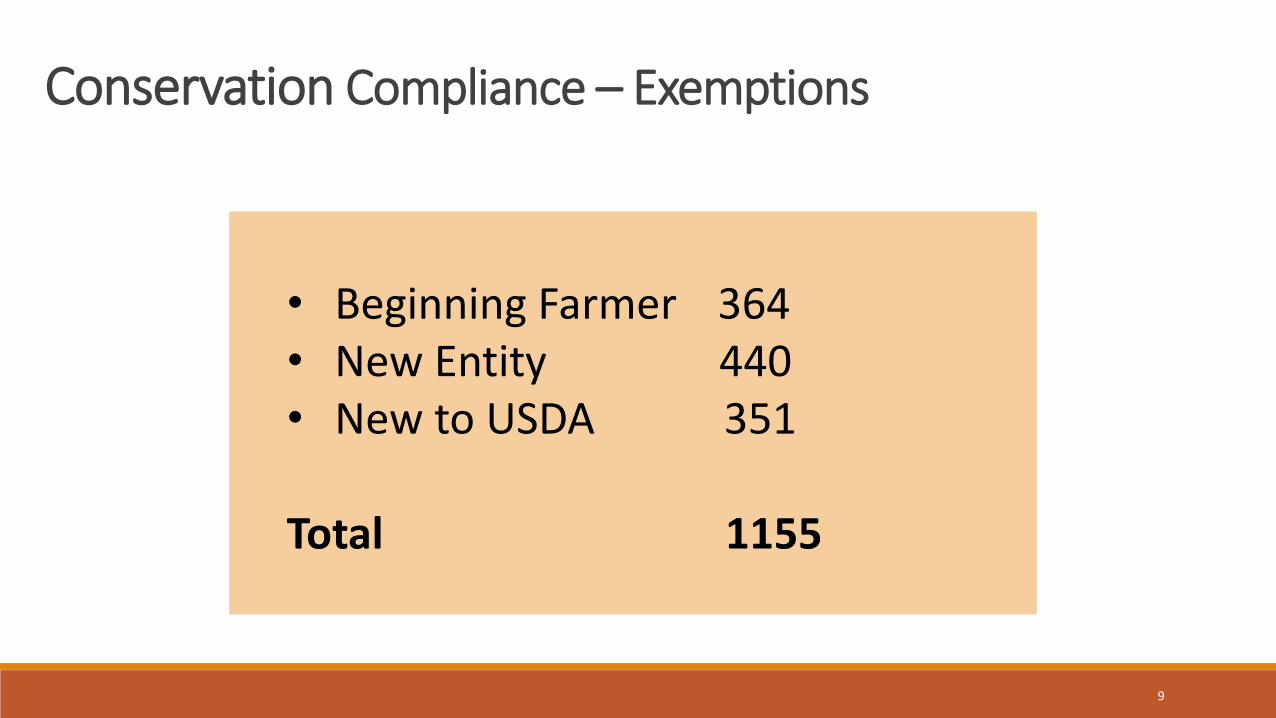
Conservation Compliance – Exemptions
• Beginning Farmer 364 • New Entity 440 • New to USDA 351 Total 1155

10
Late Payment of Debt
Farm Bill - Late Payment of Debt FYTD In-Process Approved Denied Rescinded
RMA Administrator Request 15 2 9 0 4
AIP Status 47 - Debt Satisfied 7 Day Transit 279 N/A 279 N/A N/A
AIP Status 48 - Debt Satisfied Small
Amounts/Clearly Transposed 35 N/A 35 N/A N/A

11
Beginning Farmer/Rancher Analysis Reinsurance Year 2015 – All States
Count of Total RMA Producers
555,988
Count of Primary Producers with BFR
13,713
BFR Additional Premium Subsidy
$12,872,808
Administrative Fees Waived
$1,667,550
Count of BFR Producers Using Yields From a Previous Operator
1,219
Count of BFR Producers with YA
4,943
BFR Net Acres
3,804,947
12
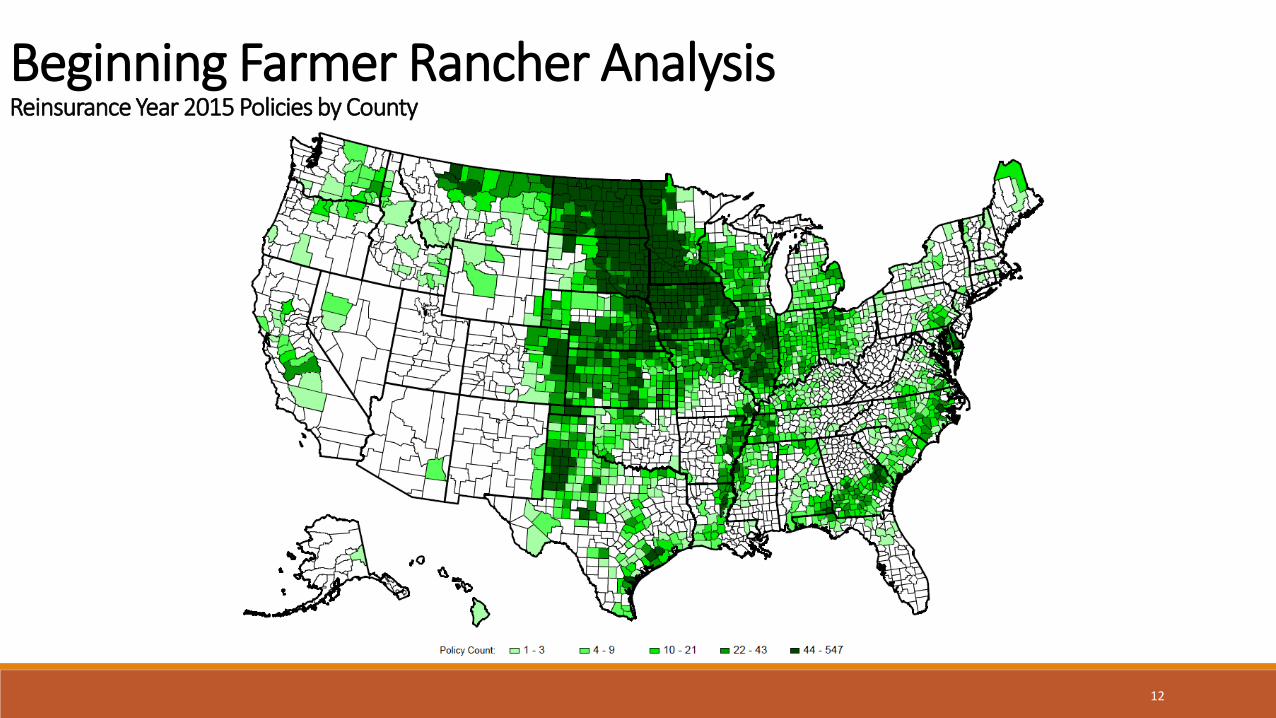
Beginning Farmer Rancher Analysis Reinsurance Year 2015 Policies by County
13
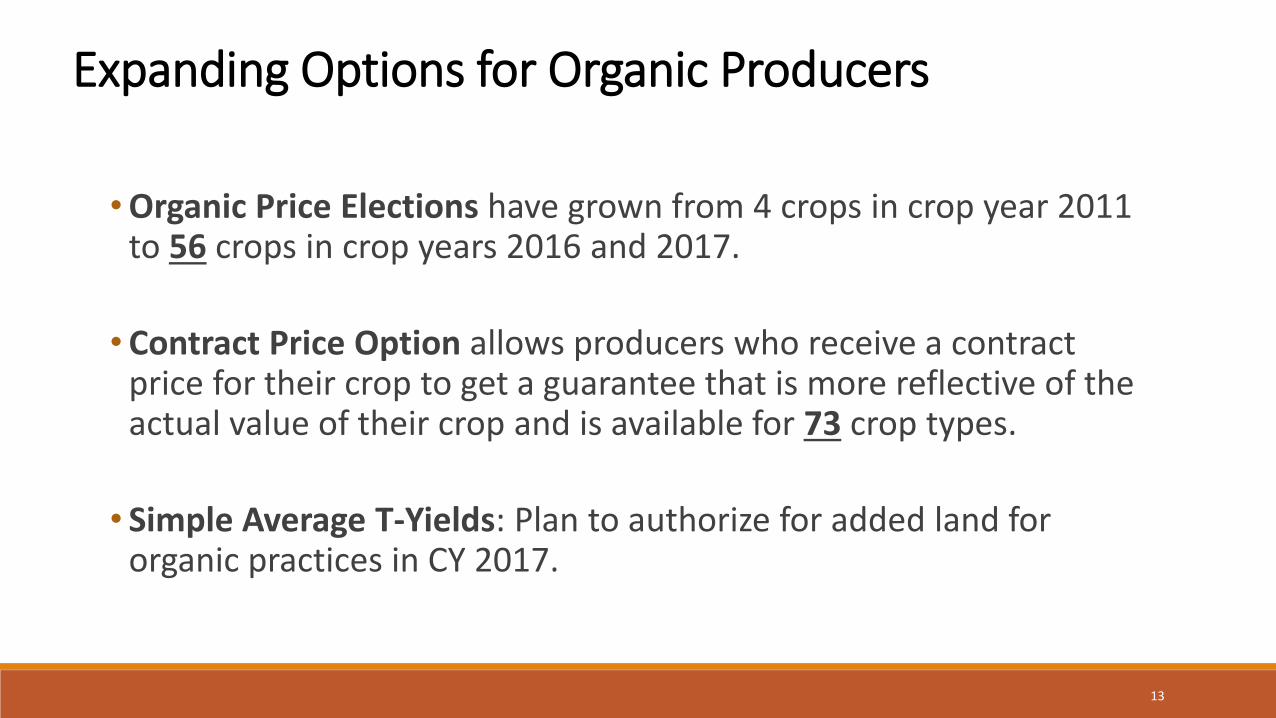
•Organic Price Elections have grown from 4 crops in crop year 2011 to 56 crops in crop years 2016 and 2017.
• Contract Price Option allows producers who receive a contract price for their crop to get a guarantee that is more reflective of the actual value of their crop and is available for 73 crop types.
• Simple Average T-Yields: Plan to authorize for added land for organic practices in CY 2017.
Expanding Options for Organic Producers

Organic Price Elections Over the Years From 4 to 56 Crops
2011 Corn; Cotton; Soybeans; Processing Tomatoes (CA) 2012 Corn; Cotton; Soybeans; Processing Tomatoes (CA)
2013 ADDED: Avocados (CA); Fresh Freestone Peaches (CA); Fresh Nectarines (CA); Fresh Plums (CA) 2014 ADDED: Almonds (CA); Blueberries (CA, OR, WA); Peppermint; Juice Grapes (WA); Oats; Fresh and Processing Apples (WA); Pears (WA, OR); Stonefruit - Fresh Apricots (CA, ID, OR, WA); Fresh Nectarines; Plums; Freestone Peaches (ID, OR, WA) 2015 ADDED: Millet; Figs; Walnuts; Flax; Popcorn; Corn Silage; Grain Sorghum; Raisins; Hybrid Sorghum Seed; Hybrid Corn Seed, Silage Sorghum.
2016 ADDED: Barley, Burley Tobacco, Cabbage, Cigar Binder Tobacco, Cranberries, Cultivated Wild Rice, Dry Air Tobacco, Dry Peas (select
states), Flue Cured Tobacco, Forage Production (with the inclusion of Alfalfa in select states), Fresh Market Sweet Corn, Hybrid Sweet Corn Seed, Maryland Tobacco, Onions (fresh Onions in select states), Pinto Beans, Potatoes, Processing Clingstone Peaches, Rice, Rye, Safflower, Sugarcane, Sunflower, Table Grapes, and Wheat. The availability of organic price elections has been expanded for: Avocadoes in Florida, Blueberries in all remaining states, and Pears in California
2017 ADDED so far: Citrus (AZ, CA, FL): Grapefruit; Lemons; Mandarins; Oranges; Tangelos
14
15
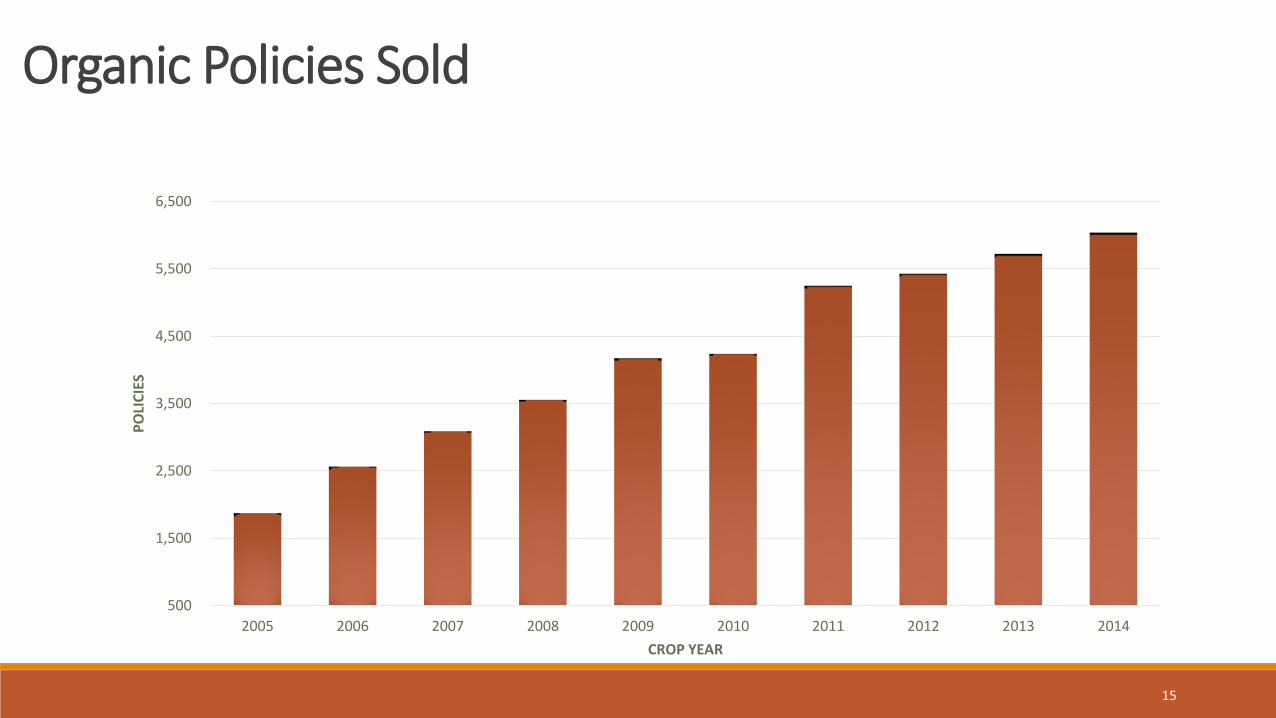
Organic Policies Sold
500
1,500
2,500
3,500
4,500
5,500
6,500
2005 2006 2007 2008 2009 2010 2011 2012 2013 2014
PO
LIC
IES
CROP YEAR
16
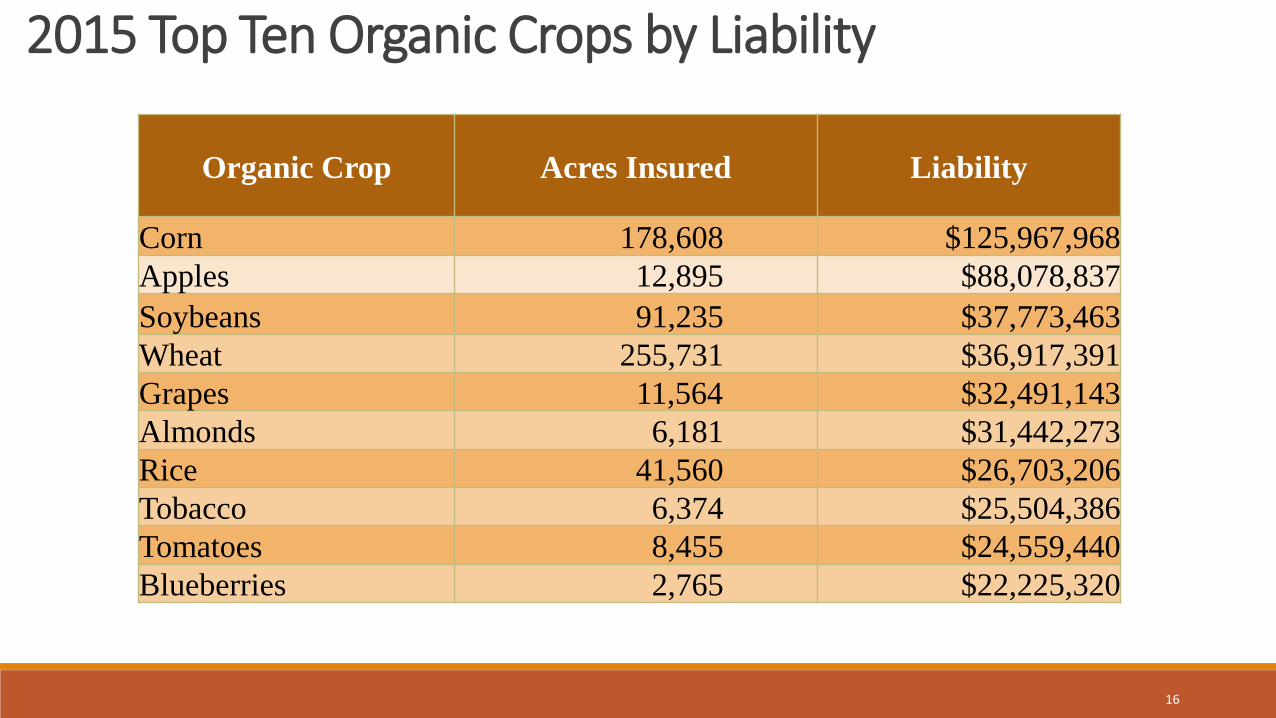
2015 Top Ten Organic Crops by Liability
Organic Crop Acres Insured Liability
Corn 178,608 $125,967,968
Apples 12,895 $88,078,837
Soybeans 91,235 $37,773,463
Wheat 255,731 $36,917,391
Grapes 11,564 $32,491,143
Almonds 6,181 $31,442,273
Rice 41,560 $26,703,206
Tobacco 6,374 $25,504,386
Tomatoes 8,455 $24,559,440
Blueberries 2,765 $22,225,320
17
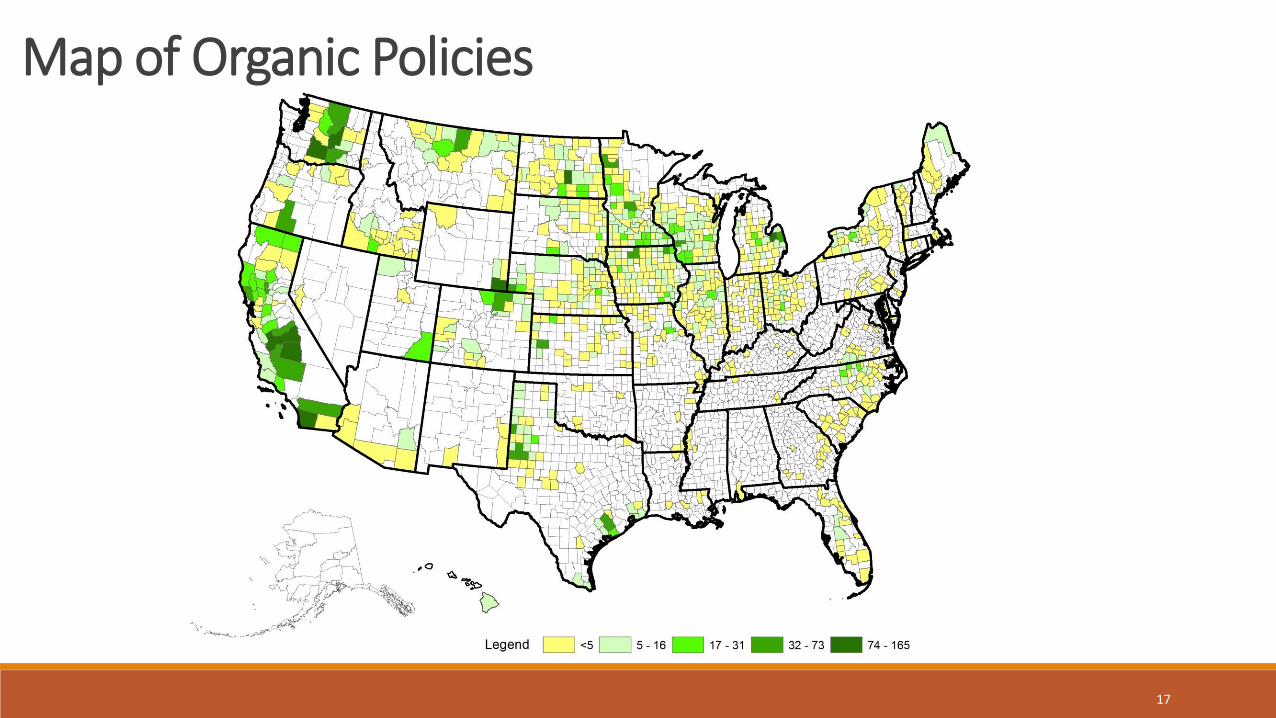
Map of Organic Policies
18
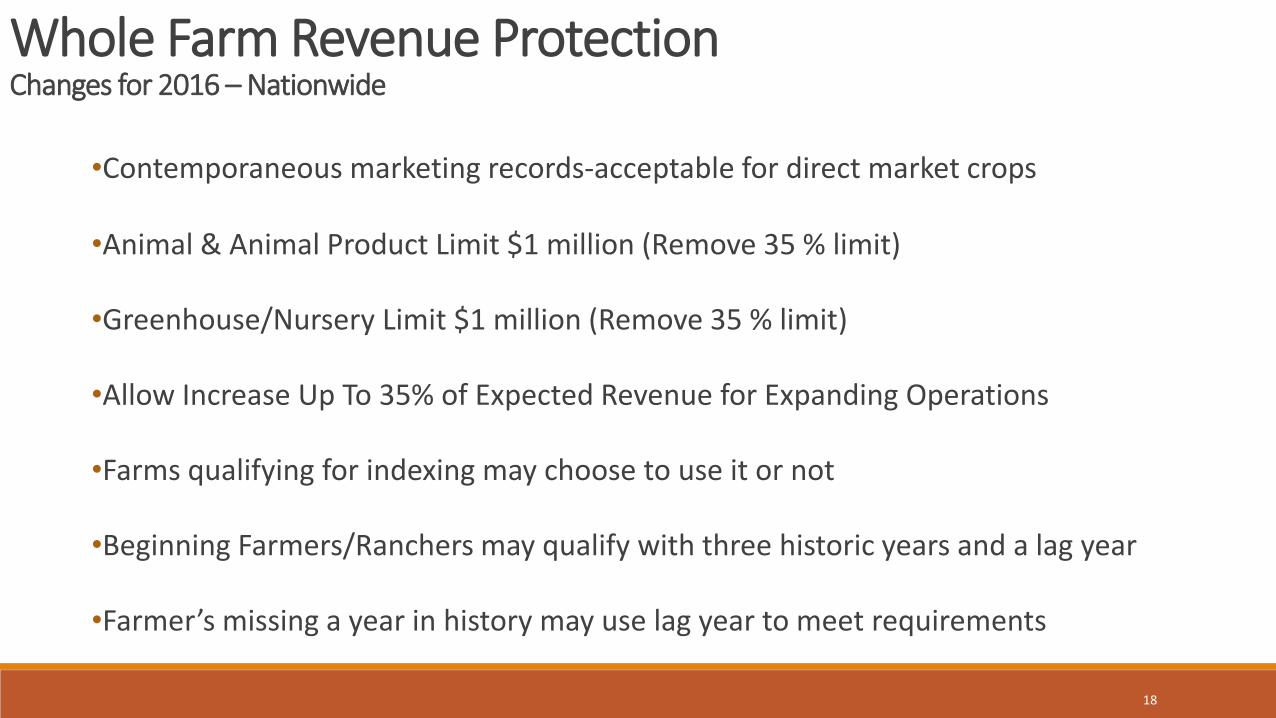
Whole Farm Revenue Protection Changes for 2016 – Nationwide
•Contemporaneous marketing records-acceptable for direct market crops
•Animal & Animal Product Limit $1 million (Remove 35 % limit)
•Greenhouse/Nursery Limit $1 million (Remove 35 % limit)
•Allow Increase Up To 35% of Expected Revenue for Expanding Operations
•Farms qualifying for indexing may choose to use it or not
•Beginning Farmers/Ranchers may qualify with three historic years and a lag year
•Farmer’s missing a year in history may use lag year to meet requirements
19
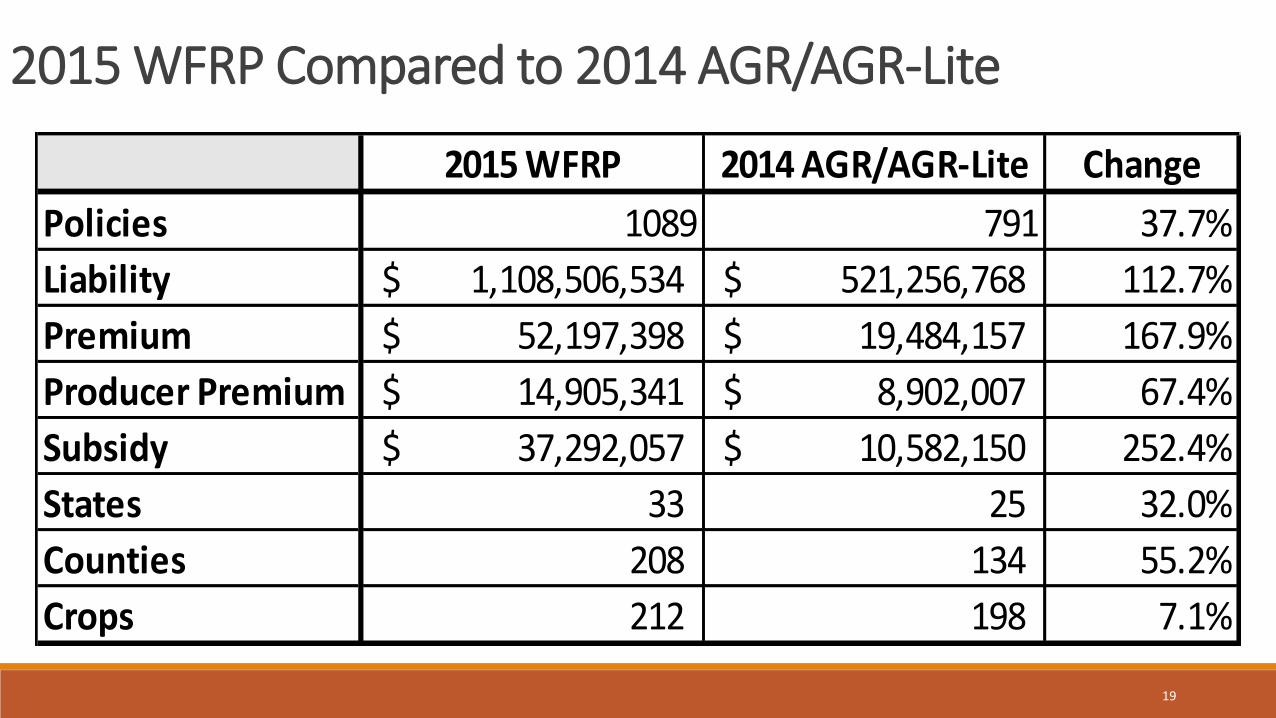
2015 WFRP Compared to 2014 AGR/AGR-Lite
2015 WFRP 2014 AGR/AGR-Lite Change
Policies 1089 791 37.7%
Liability 1,108,506,534$ 521,256,768$ 112.7%
Premium 52,197,398$ 19,484,157$ 167.9%
Producer Premium 14,905,341$ 8,902,007$ 67.4%
Subsidy 37,292,057$ 10,582,150$ 252.4%
States 33 25 32.0%
Counties 208 134 55.2%
Crops 212 198 7.1%
20
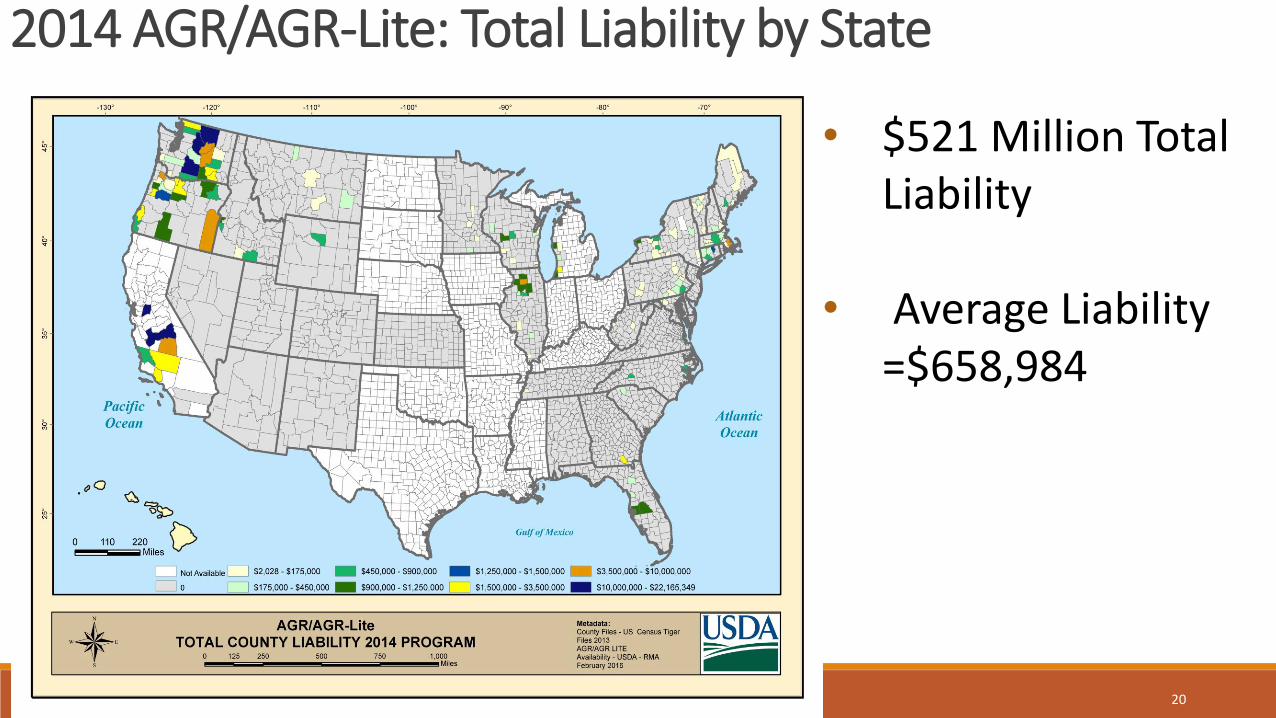
2014 AGR/AGR-Lite: Total Liability by State
• $521 Million Total Liability
• Average Liability =$658,984

21
2015 WFRP: Total Liability by State • $1.1B Total Liability
• Average Liability =
$1,017,912
• 80% in WA, ID, OR
• No 2015 availability in ‘white counties’

0.00
0.50
1.00
1.50
2.00
2.50
3.00
3.50
4.00
4.50
22
WFRP: Average # of Crops by $ of Liability
Dollars of Liability
Ave
rage
Nu
mb
er
of
Cro
ps
Average Number of Crops for all Policies = 3.21
(# of policies)
23
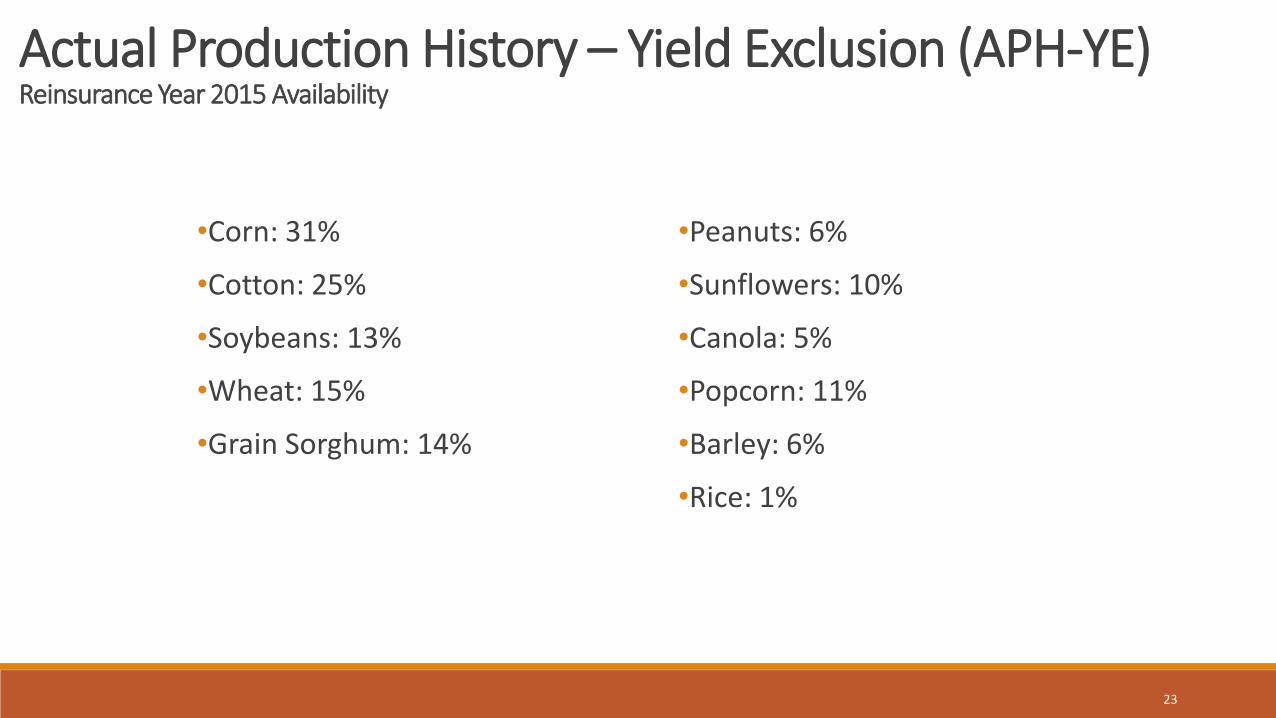
Actual Production History – Yield Exclusion (APH-YE) Reinsurance Year 2015 Availability
•Corn: 31%
•Cotton: 25%
•Soybeans: 13%
•Wheat: 15%
•Grain Sorghum: 14%
•Peanuts: 6%
•Sunflowers: 10%
•Canola: 5%
•Popcorn: 11%
•Barley: 6%
•Rice: 1%
24
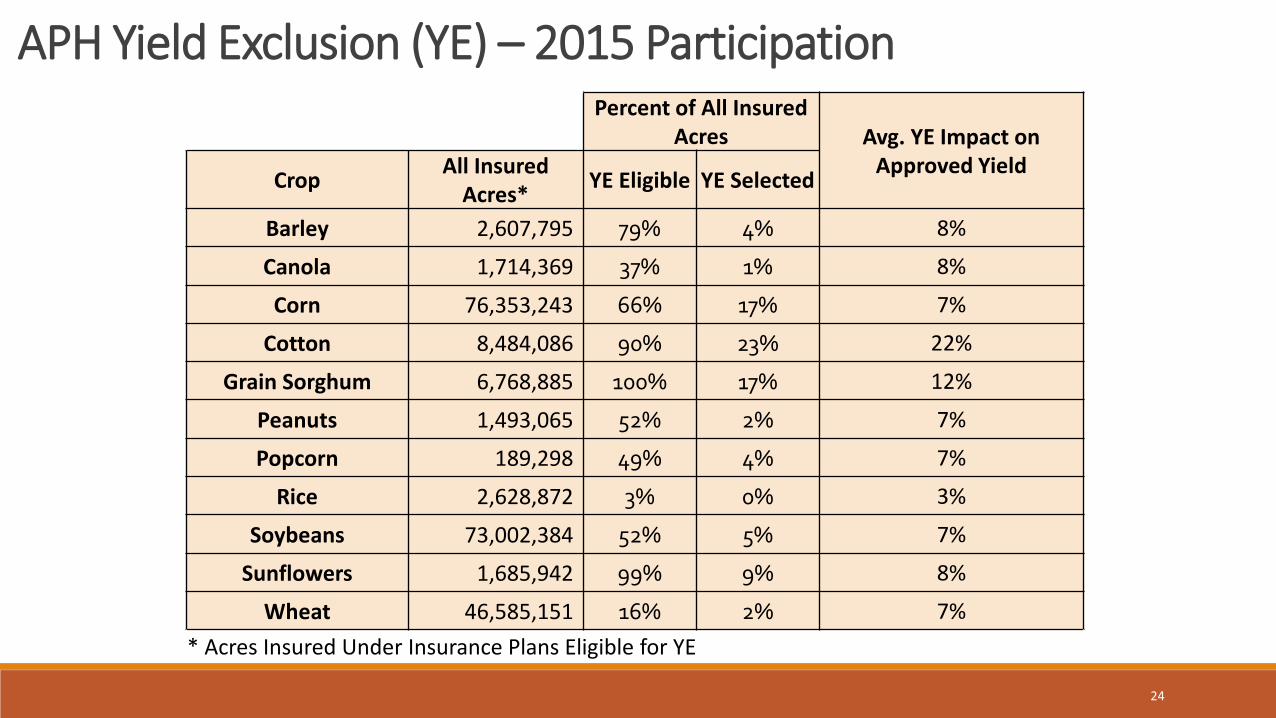
APH Yield Exclusion (YE) – 2015 Participation Percent of All Insured
Acres Avg. YE Impact on Approved Yield
Crop All Insured
Acres* YE Eligible YE Selected
Barley 2,607,795 79% 4% 8%
Canola 1,714,369 37% 1% 8%
Corn 76,353,243 66% 17% 7%
Cotton 8,484,086 90% 23% 22%
Grain Sorghum 6,768,885 100% 17% 12%
Peanuts 1,493,065 52% 2% 7%
Popcorn 189,298 49% 4% 7%
Rice 2,628,872 3% 0% 3%
Soybeans 73,002,384 52% 5% 7%
Sunflowers 1,685,942 99% 9% 8%
Wheat 46,585,151 16% 2% 7%
* Acres Insured Under Insurance Plans Eligible for YE
25
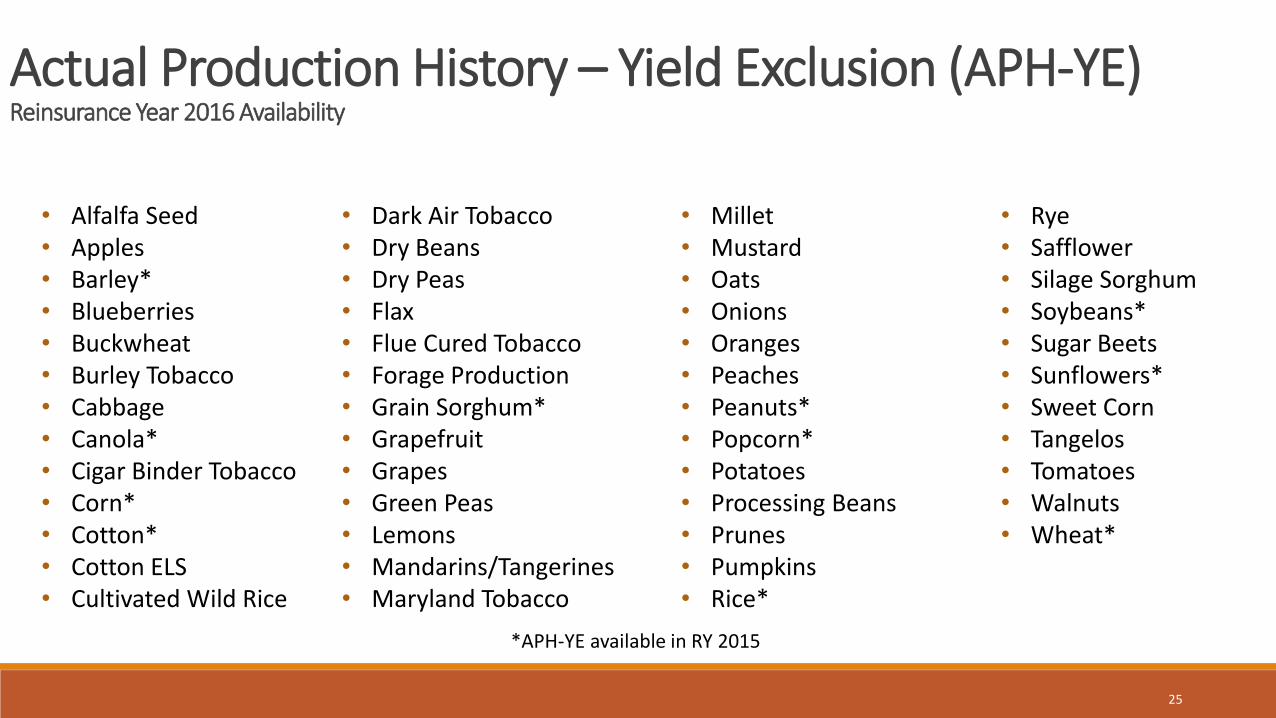
Actual Production History – Yield Exclusion (APH-YE) Reinsurance Year 2016 Availability
• Alfalfa Seed • Apples • Barley* • Blueberries • Buckwheat • Burley Tobacco • Cabbage • Canola* • Cigar Binder Tobacco • Corn* • Cotton* • Cotton ELS • Cultivated Wild Rice
• Dark Air Tobacco • Dry Beans • Dry Peas • Flax • Flue Cured Tobacco • Forage Production • Grain Sorghum* • Grapefruit • Grapes • Green Peas • Lemons • Mandarins/Tangerines • Maryland Tobacco
• Millet • Mustard • Oats • Onions • Oranges • Peaches • Peanuts* • Popcorn* • Potatoes • Processing Beans • Prunes • Pumpkins • Rice*
• Rye • Safflower • Silage Sorghum • Soybeans* • Sugar Beets • Sunflowers* • Sweet Corn • Tangelos • Tomatoes • Walnuts • Wheat*
*APH-YE available in RY 2015
26
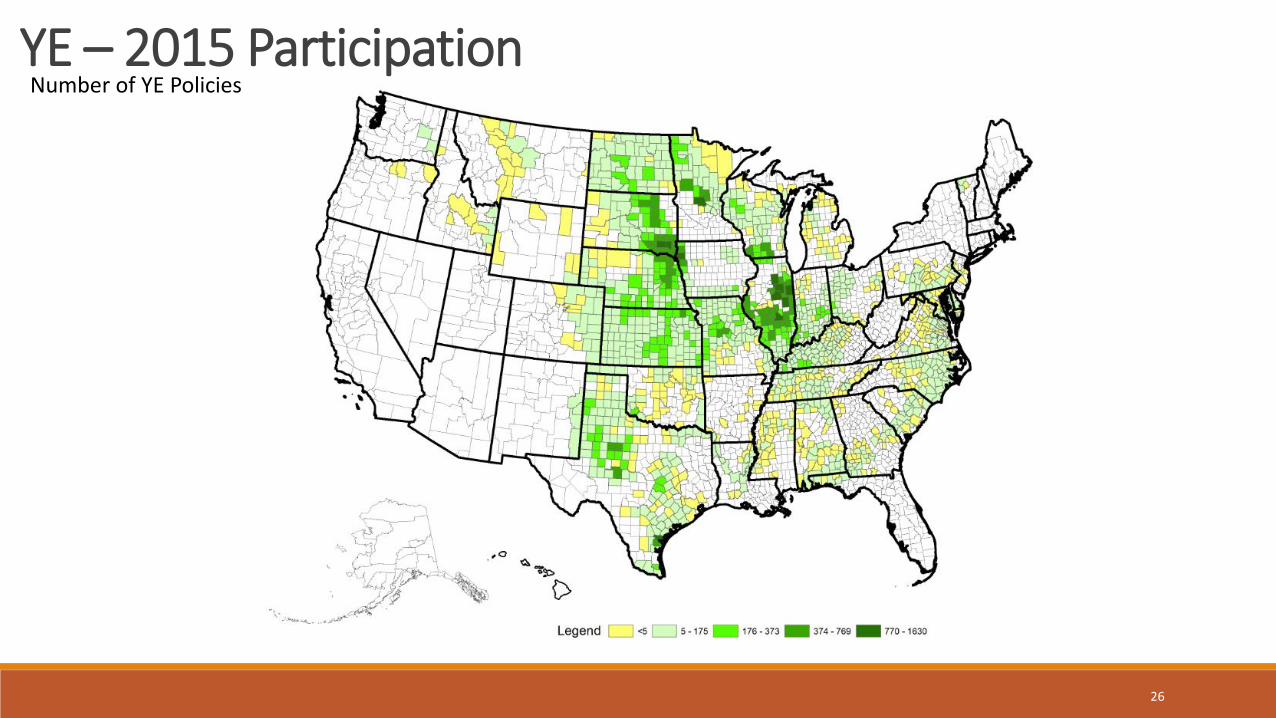
YE – 2015 Participation Number of YE Policies
27
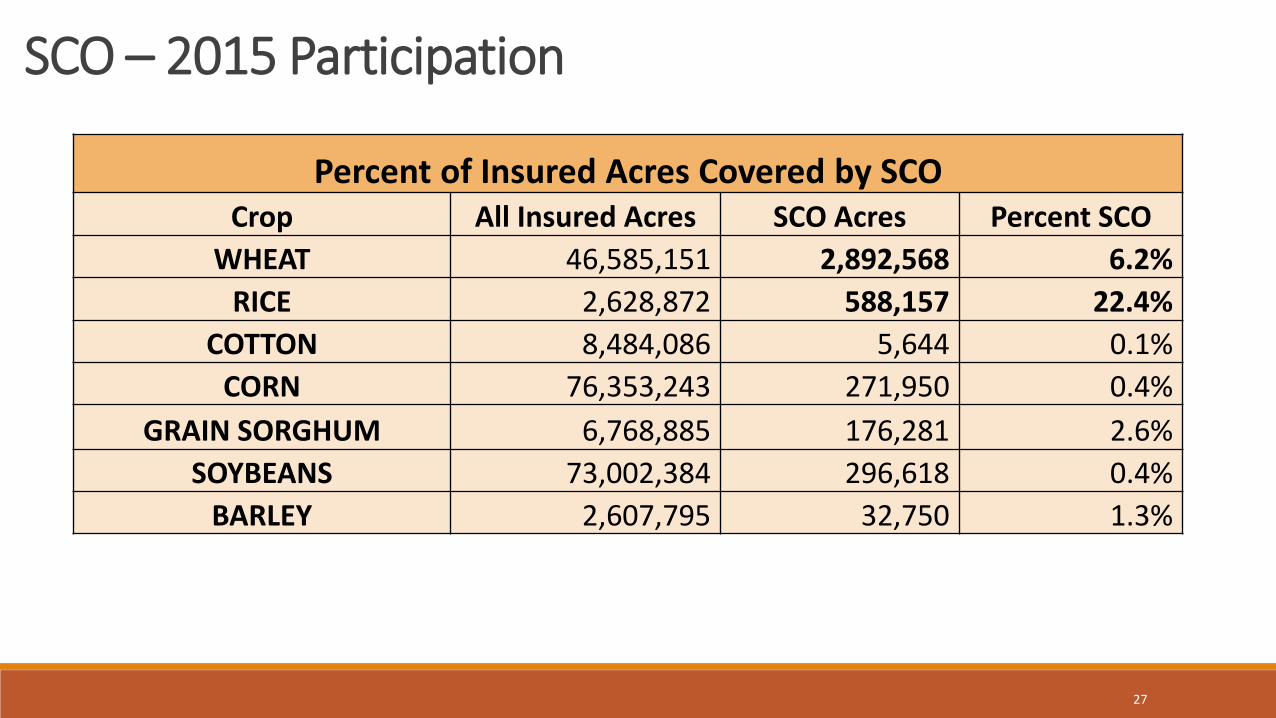
SCO – 2015 Participation
Percent of Insured Acres Covered by SCO Crop All Insured Acres SCO Acres Percent SCO
WHEAT 46,585,151 2,892,568 6.2%
RICE 2,628,872 588,157 22.4%
COTTON 8,484,086 5,644 0.1%
CORN 76,353,243 271,950 0.4%
GRAIN SORGHUM 6,768,885 176,281 2.6%
SOYBEANS 73,002,384 296,618 0.4%
BARLEY 2,607,795 32,750 1.3%
28
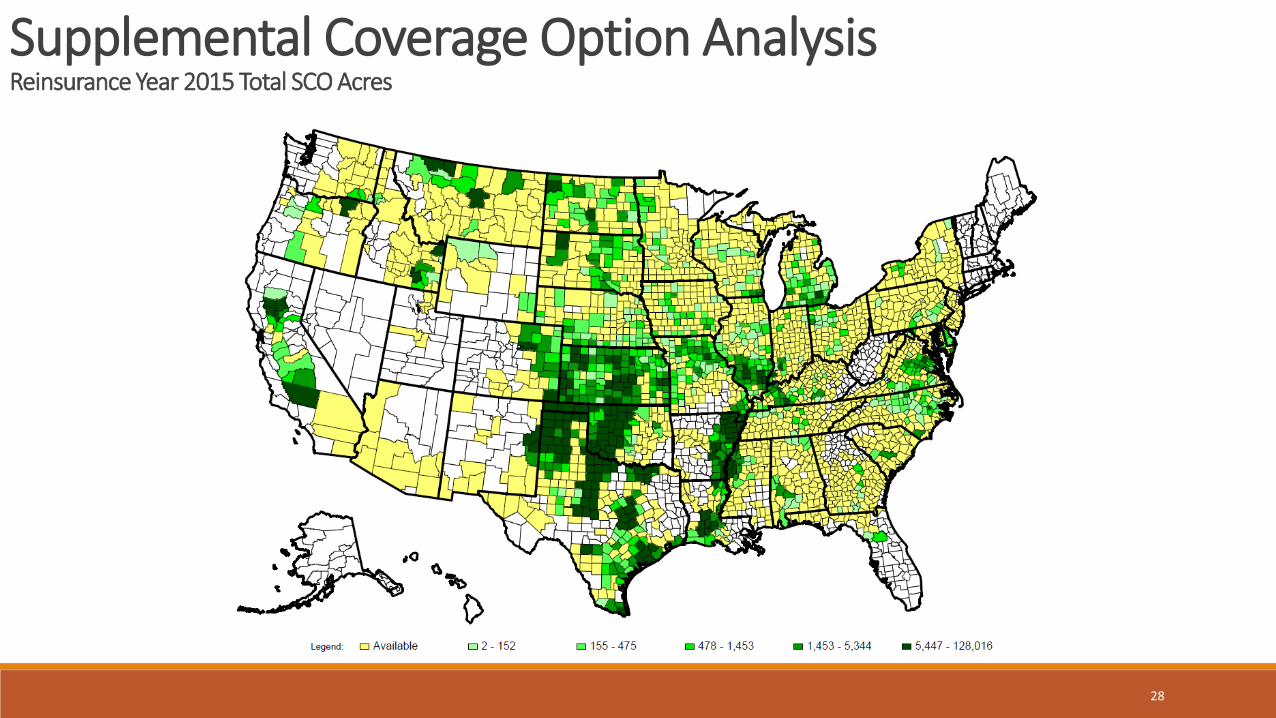
Supplemental Coverage Option Analysis Reinsurance Year 2015 Total SCO Acres

29
Supplemental Coverage Option (SCO) Reinsurance Year 2016 Availability
• Alfalfa Seed • Almonds • Apples • Barley* • Blueberries • Buckwheat • Burley Tobacco • Canola • Cigar Binder Tobacco • Corn* • Cotton* • Cotton ELS • Cucumbers • Cultivated Wild Rice • Dark Air Tobacco
• Dry Beans • Dry Peas • Fire Cured Tobacco • Flax • Flue Cured Tobacco • Forage Production • Grain Sorghum* • Grapefruit • Grapes • Grass Seed • Green Peas • Hybrid Corn Seed • Hybrid Seed Rice • Hybrid Sorghum Seed • Lemons
• Mandarins/Tangerines • Millet • Mint • Mustard • Oats • Onions • Oranges • Peaches • Peanuts • Popcorn • Potatoes • Processing Beans • Prunes • Pumpkins • Rice*
• Rye • Safflower • Sesame • Silage Sorghum • Soybeans* • Sugar Beets • Sugarcane • Sunflowers • Sweet Corn • Tangelos • Tomatoes • Walnuts • Wheat*
*SCO available in RY 2015
30
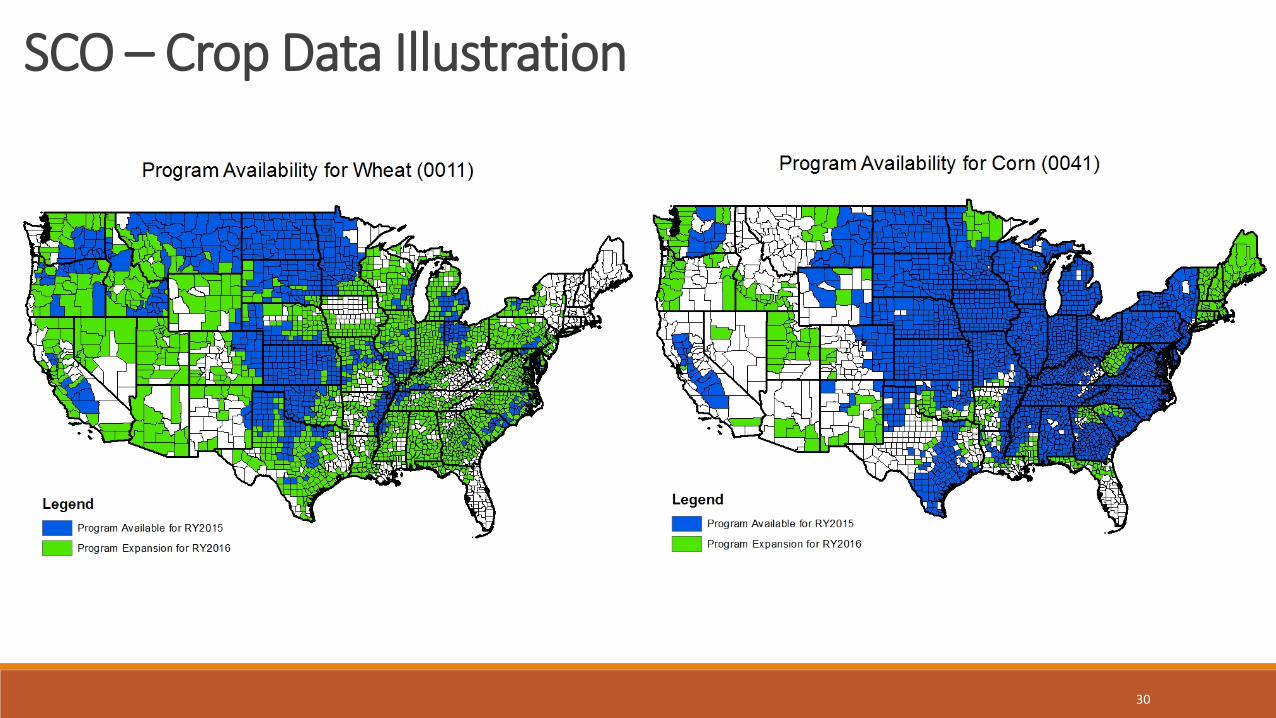
SCO – Crop Data Illustration
31
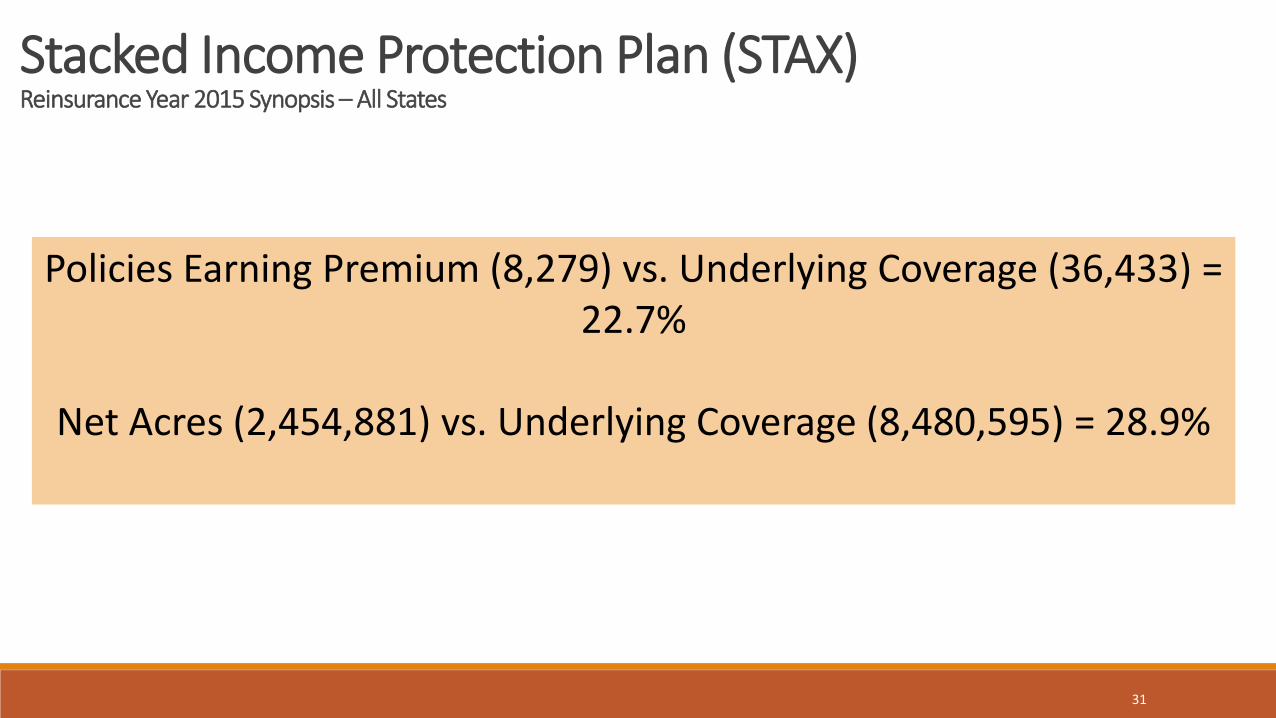
Stacked Income Protection Plan (STAX) Reinsurance Year 2015 Synopsis – All States
Policies Earning Premium (8,279) vs. Underlying Coverage (36,433) = 22.7%
Net Acres (2,454,881) vs. Underlying Coverage (8,480,595) = 28.9%
32
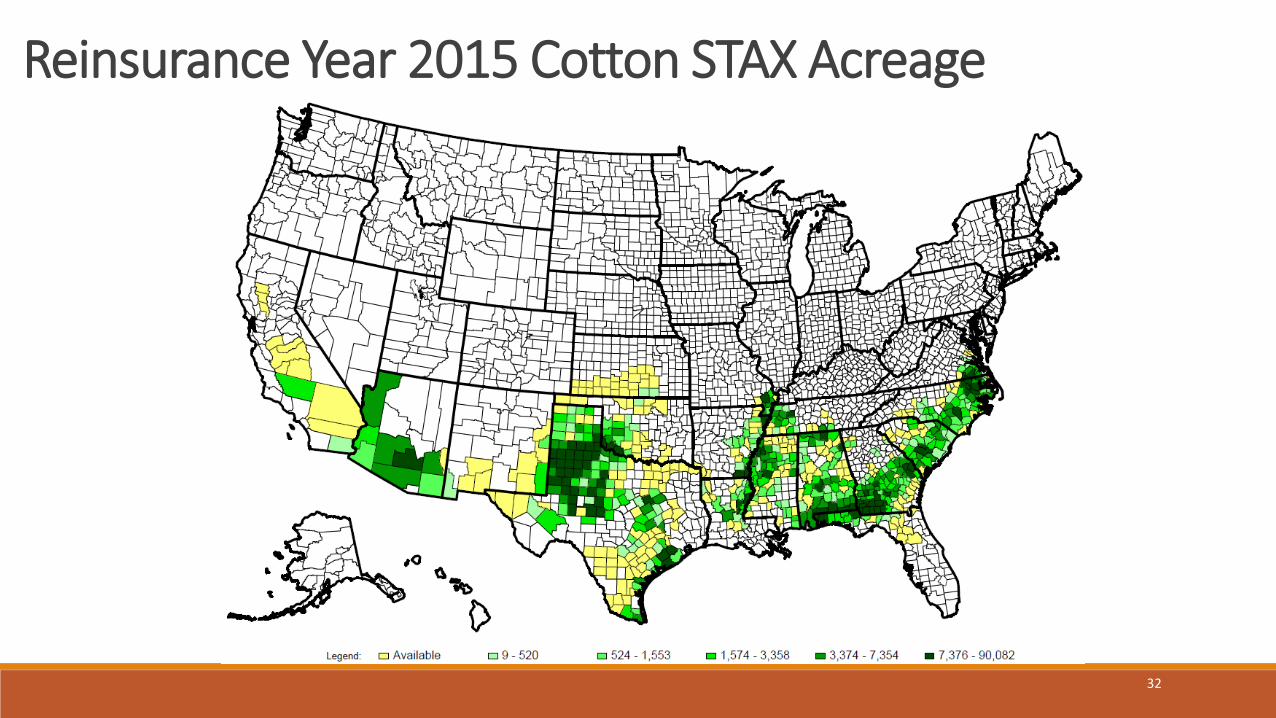
Reinsurance Year 2015 Cotton STAX Acreage
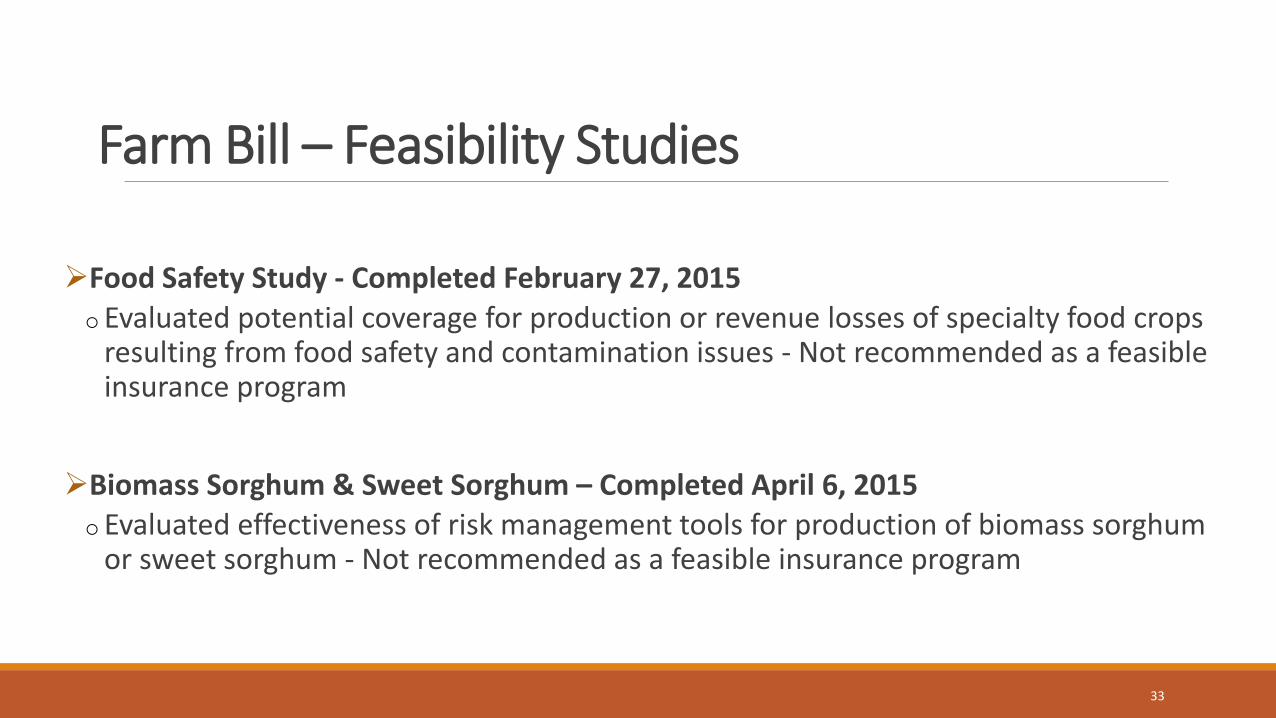
Farm Bill – Feasibility Studies
Food Safety Study - Completed February 27, 2015 o Evaluated potential coverage for production or revenue losses of specialty food crops
resulting from food safety and contamination issues - Not recommended as a feasible insurance program
Biomass Sorghum & Sweet Sorghum – Completed April 6, 2015 o Evaluated effectiveness of risk management tools for production of biomass sorghum
or sweet sorghum - Not recommended as a feasible insurance program
33
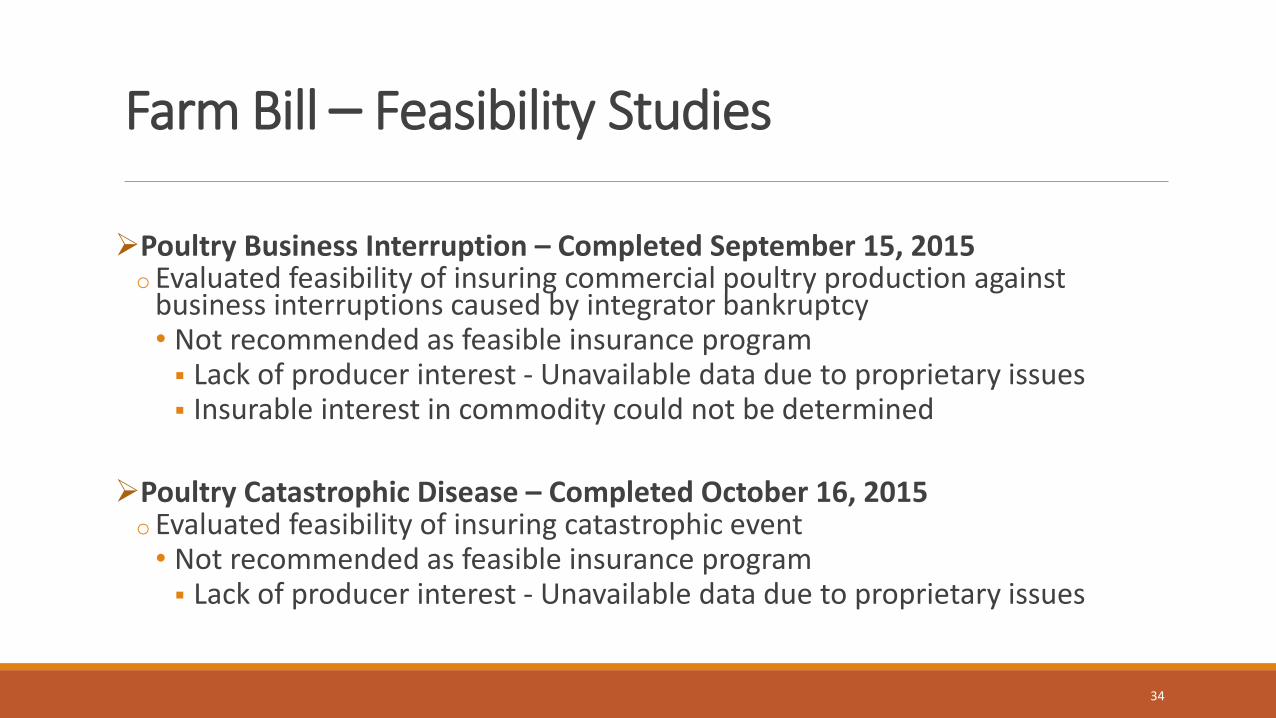
Farm Bill – Feasibility Studies
Poultry Business Interruption – Completed September 15, 2015 o Evaluated feasibility of insuring commercial poultry production against
business interruptions caused by integrator bankruptcy • Not recommended as feasible insurance program Lack of producer interest - Unavailable data due to proprietary issues Insurable interest in commodity could not be determined
Poultry Catastrophic Disease – Completed October 16, 2015 o Evaluated feasibility of insuring catastrophic event • Not recommended as feasible insurance program Lack of producer interest - Unavailable data due to proprietary issues
34
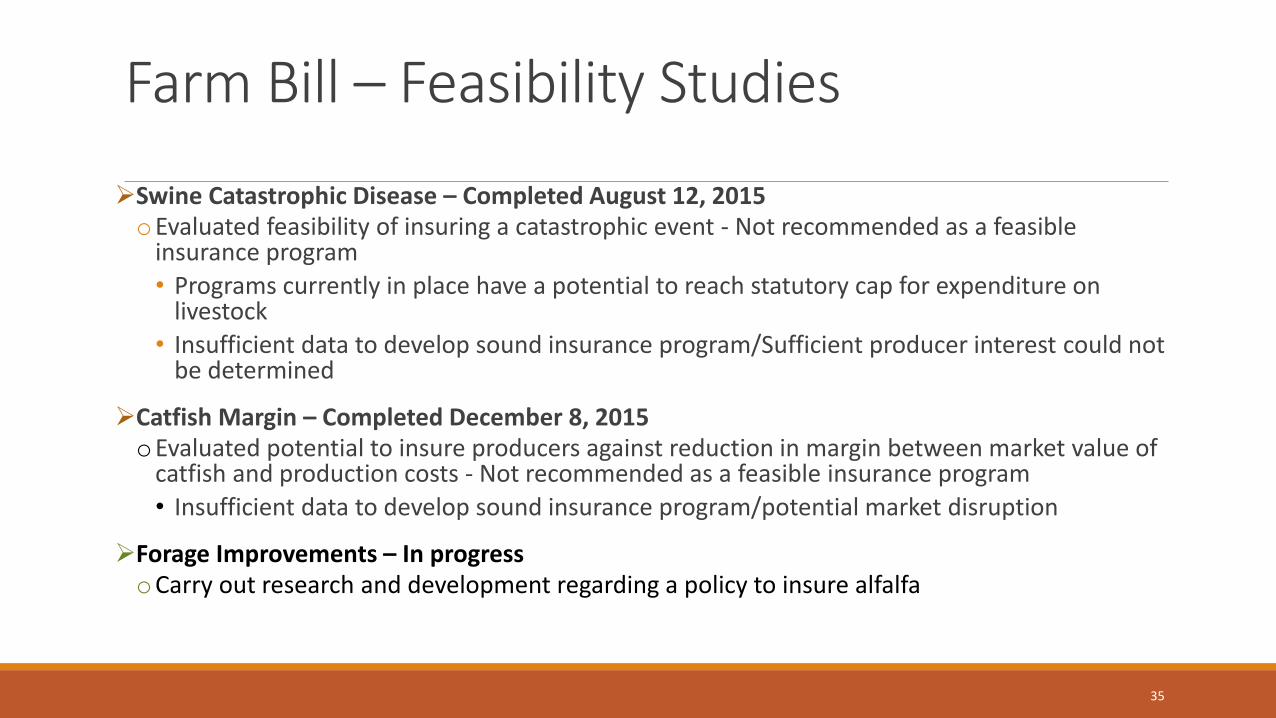
Farm Bill – Feasibility Studies
Swine Catastrophic Disease – Completed August 12, 2015 oEvaluated feasibility of insuring a catastrophic event - Not recommended as a feasible
insurance program
• Programs currently in place have a potential to reach statutory cap for expenditure on livestock
• Insufficient data to develop sound insurance program/Sufficient producer interest could not be determined
Catfish Margin – Completed December 8, 2015 oEvaluated potential to insure producers against reduction in margin between market value of
catfish and production costs - Not recommended as a feasible insurance program
• Insufficient data to develop sound insurance program/potential market disruption
Forage Improvements – In progress oCarry out research and development regarding a policy to insure alfalfa
35
36
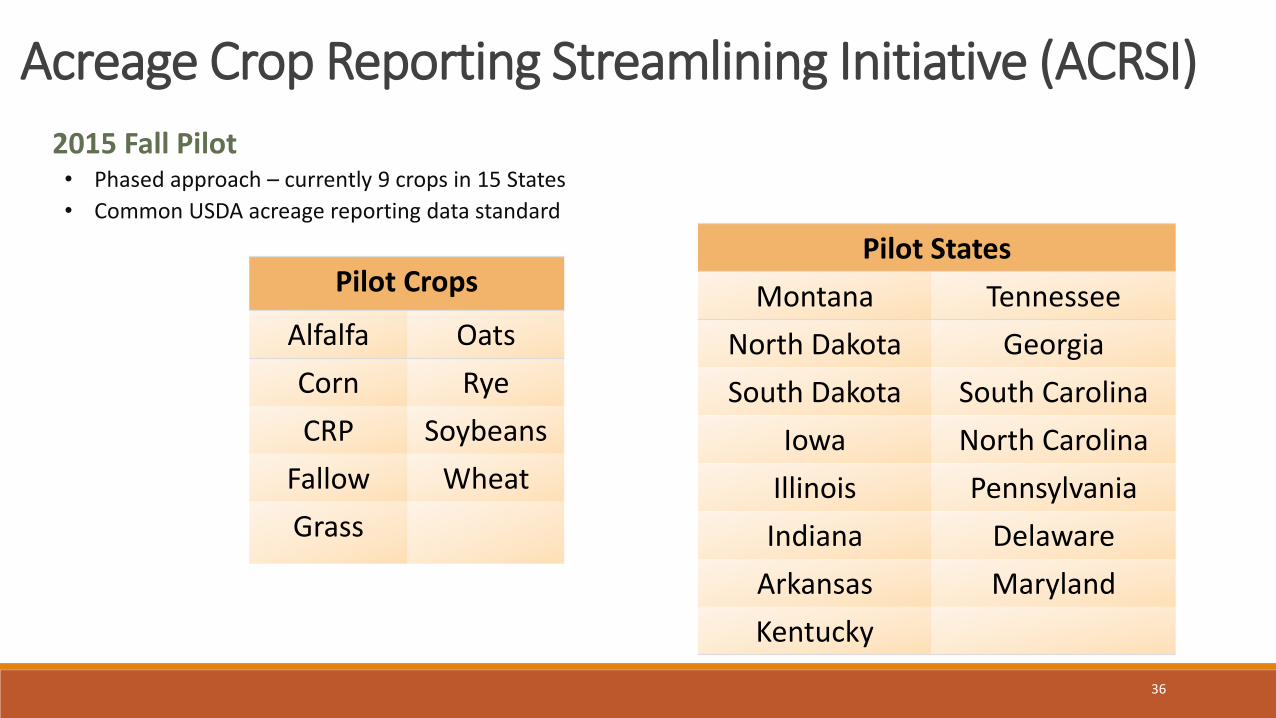
Acreage Crop Reporting Streamlining Initiative (ACRSI)
2015 Fall Pilot • Phased approach – currently 9 crops in 15 States
• Common USDA acreage reporting data standard
Pilot States
Montana Tennessee
North Dakota Georgia
South Dakota South Carolina
Iowa North Carolina
Illinois Pennsylvania
Indiana Delaware
Arkansas Maryland
Kentucky
Pilot Crops
Alfalfa Oats
Corn Rye
CRP Soybeans
Fallow Wheat
Grass

37
ACRSI 2015 Fall Pilot
38
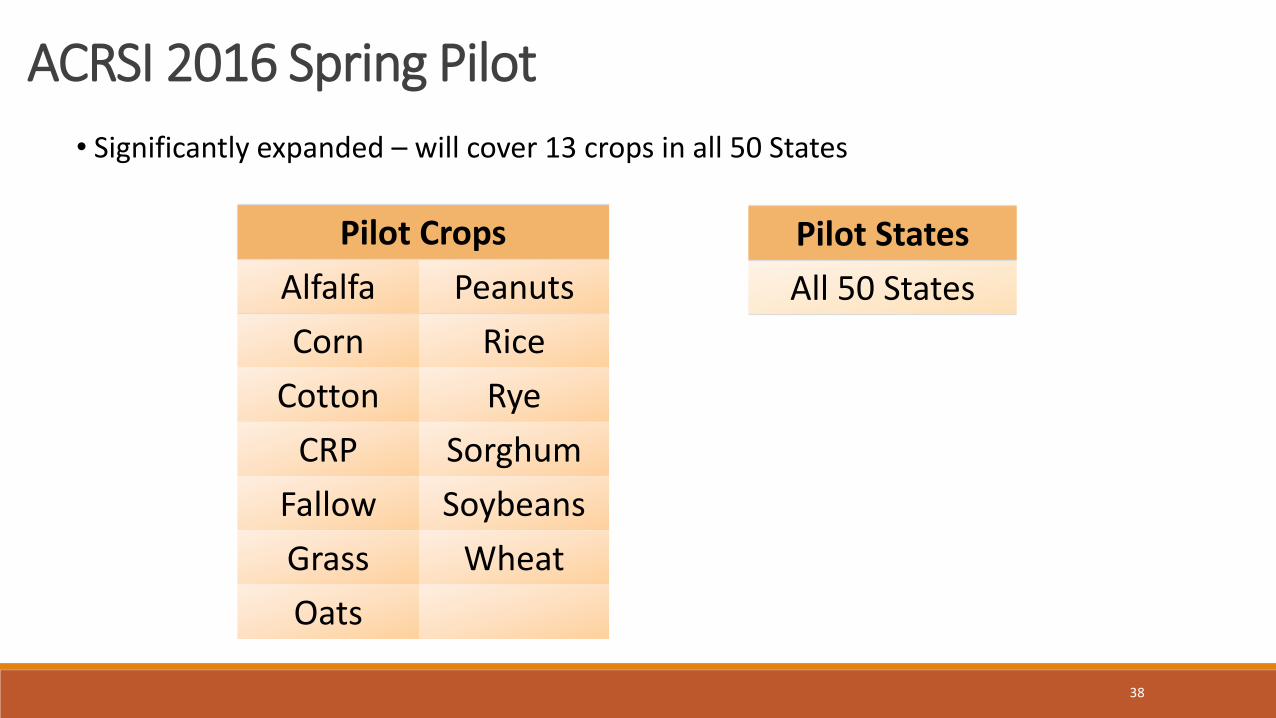
ACRSI 2016 Spring Pilot
• Significantly expanded – will cover 13 crops in all 50 States
Pilot Crops
Alfalfa Peanuts
Corn Rice
Cotton Rye
CRP Sorghum
Fallow Soybeans
Grass Wheat
Oats
Pilot States
All 50 States
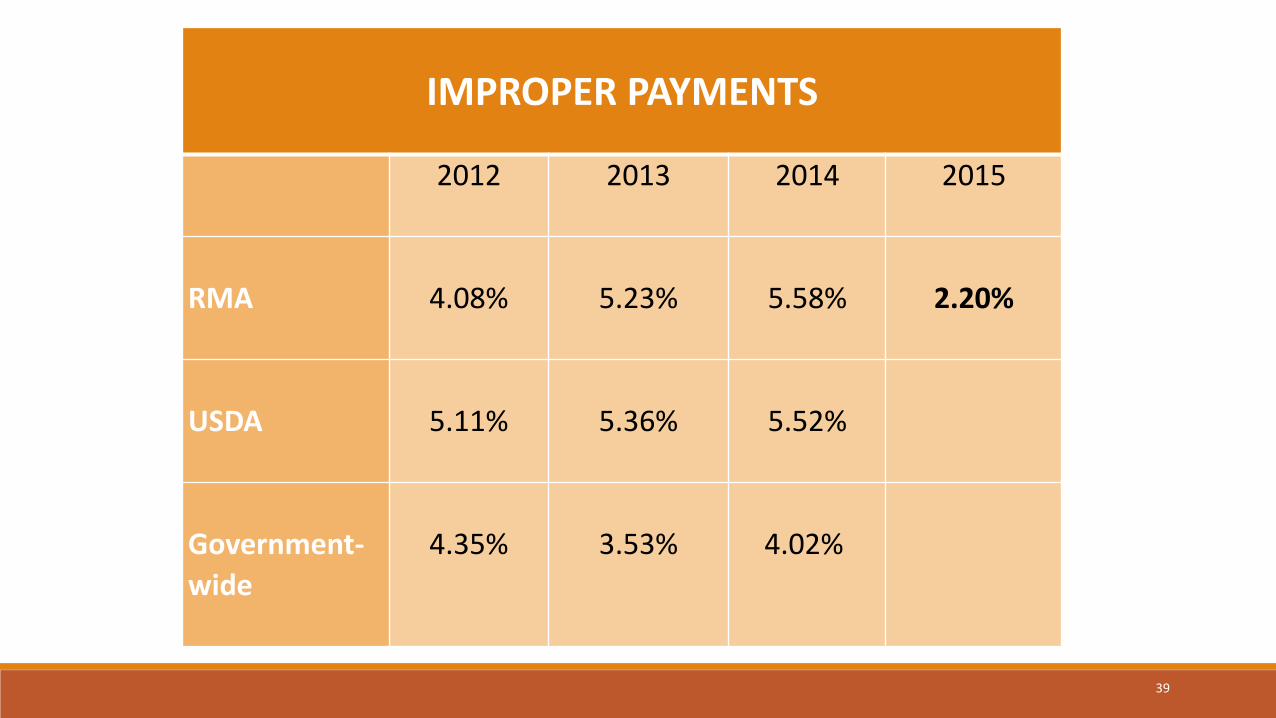
IMPROPER PAYMENTS
2012
2013 2014 2015
RMA
4.08%
5.23%
5.58%
2.20%
USDA
5.11%
5.36%
5.52%
Government-
wide
4.35%
3.53%
4.02%
39
40
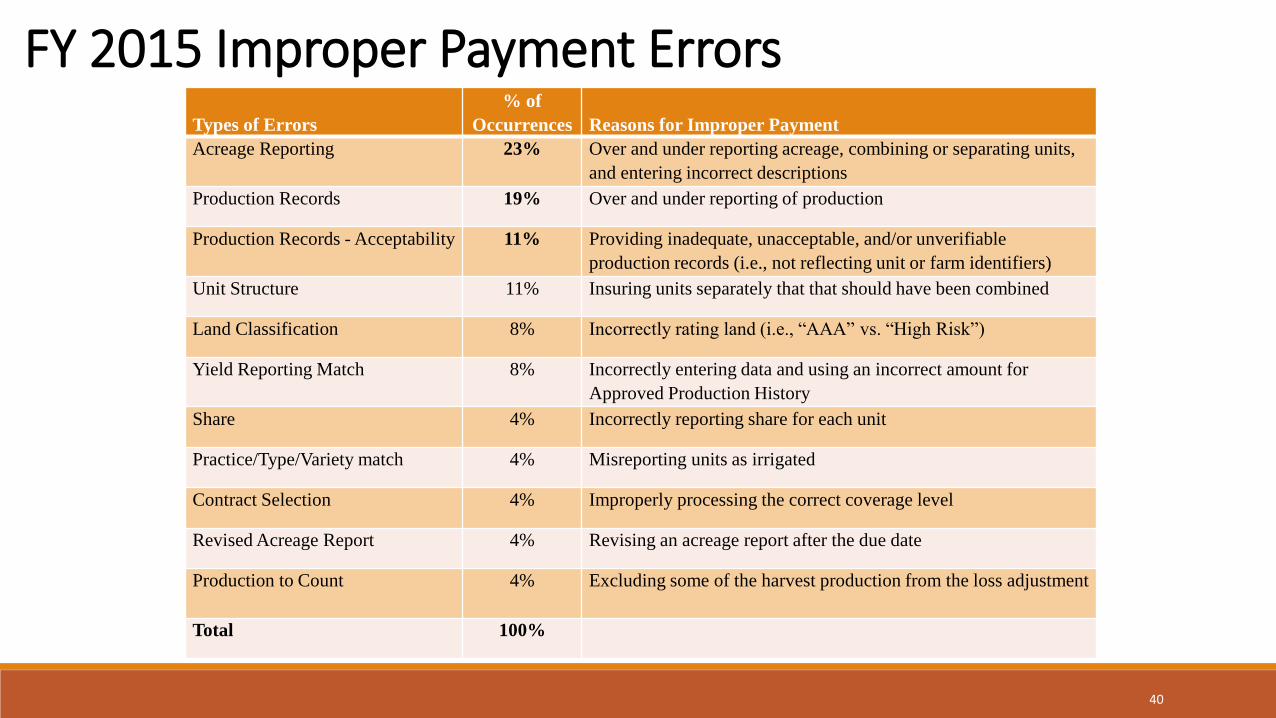
FY 2015 Improper Payment Errors Types of Errors
% of
Occurrences Reasons for Improper Payment
Acreage Reporting 23% Over and under reporting acreage, combining or separating units,
and entering incorrect descriptions
Production Records 19% Over and under reporting of production
Production Records - Acceptability 11% Providing inadequate, unacceptable, and/or unverifiable
production records (i.e., not reflecting unit or farm identifiers)
Unit Structure 11% Insuring units separately that that should have been combined
Land Classification 8% Incorrectly rating land (i.e., “AAA” vs. “High Risk”)
Yield Reporting Match 8% Incorrectly entering data and using an incorrect amount for
Approved Production History
Share 4% Incorrectly reporting share for each unit
Practice/Type/Variety match 4% Misreporting units as irrigated
Contract Selection 4% Improperly processing the correct coverage level
Revised Acreage Report 4% Revising an acreage report after the due date
Production to Count 4% Excluding some of the harvest production from the loss adjustment
Total 100%
41
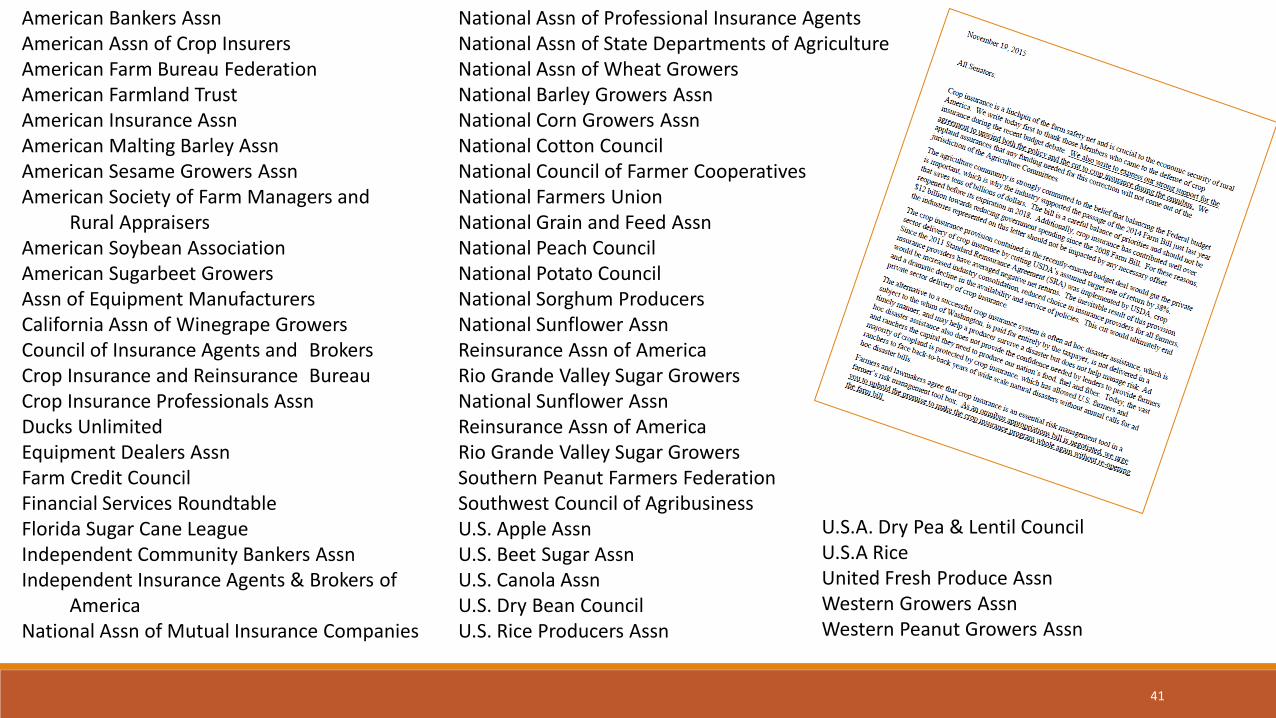
U.S.A. Dry Pea & Lentil Council U.S.A Rice United Fresh Produce Assn Western Growers Assn Western Peanut Growers Assn
American Bankers Assn American Assn of Crop Insurers American Farm Bureau Federation American Farmland Trust American Insurance Assn American Malting Barley Assn American Sesame Growers Assn American Society of Farm Managers and Rural Appraisers American Soybean Association American Sugarbeet Growers Assn of Equipment Manufacturers California Assn of Winegrape Growers Council of Insurance Agents and Brokers Crop Insurance and Reinsurance Bureau Crop Insurance Professionals Assn Ducks Unlimited Equipment Dealers Assn Farm Credit Council Financial Services Roundtable Florida Sugar Cane League Independent Community Bankers Assn Independent Insurance Agents & Brokers of America National Assn of Mutual Insurance Companies
National Assn of Professional Insurance Agents National Assn of State Departments of Agriculture National Assn of Wheat Growers National Barley Growers Assn National Corn Growers Assn National Cotton Council National Council of Farmer Cooperatives National Farmers Union National Grain and Feed Assn National Peach Council National Potato Council National Sorghum Producers National Sunflower Assn Reinsurance Assn of America Rio Grande Valley Sugar Growers National Sunflower Assn Reinsurance Assn of America Rio Grande Valley Sugar Growers Southern Peanut Farmers Federation Southwest Council of Agribusiness U.S. Apple Assn U.S. Beet Sugar Assn U.S. Canola Assn U.S. Dry Bean Council U.S. Rice Producers Assn

Thanks for all YOU do!
BRANDON C. WILLIS, ADMINISTRATOR