NATIONAL - cphfs.in Drug Survey.pdf · were NSQ. Besides, presenting the main results, the...
70
Chapter 10 Survey Results and Analysis NATIONAL DRUG SURVEY
Transcript of NATIONAL - cphfs.in Drug Survey.pdf · were NSQ. Besides, presenting the main results, the...

CHAPTER
Chapter 10Survey Results and Analysis
NATIONALDRUG SURVEY

Ministry of Health & Family Welfare | National Drug Survey 2014-16142
Survey Results and Analysis

Ministry of Health & Family Welfare | National Drug Survey 2014-16 143
National Institute of Biologicals
INTRODUCTION
This chapter presents how the samples were drawn, the results of sample collections, results of laboratory tests and the estimates of extent of NSQ
and Spurious drugs. It has been found from the survey, that out of the 47,012 samples tested, 13 samples (0.0245%) were Spurious and 1,850 samples (3.16%) were NSQ. Besides, presenting the main results, the estimates of extent of NSQ and Spurious drugs, various issues in connection with this survey are presented and discussed. Some of the issues include:
l Source wise and location wise distribution of samples drawn under survey
l Batch consistency
l Hit rates
l Inclusion probabilities of molecule IDs
l Contribution of tests to failure of samples
l Analysis of date expired samples
l NSQ percentages for molecules and manufacturing units etc.
In the process, some interesting metrics are derived and the results on them are presented. For example, instead of simply looking at whether a sampled formulation has crossed its expiry date, one can examine the distribution of remaining shelf life, that is, the time from the date of sample collection to the expiry date. One of the purposes of this chapter is to provide supplementary information on the type of issues that may arise in conducting massive surveys like this. Such knowledge will be useful in conducting future surveys of this nature.
Analysis of the survey data was performed keeping in mind a variety of questions with regard to two aspects. One aspect deals with issues related to conduct of the survey and quality of data collected. The other aspect deals with results of laboratory tests and estimates of the extent of NSQ and Spurious drugs. The analysis was planned by first writing down a series of questions relating to
SURVEY RESULTS AND ANALYSIS

Ministry of Health & Family Welfare | National Drug Survey 2014-16144
Survey Results and Analysis
above mentioned aspects. A quick glance at these questions, listed below, will serve as a good preamble for the contents of this chapter.
Questions on Conduct of the Survey
These questions are related to conduct and performance of the survey and its design.
l What is the Source for drawing samples?
l What are the targeted and achieved sample sizes?
l Are the samples drawn from the selected sources? If not, what is the extent of deviation?
l Survey is aimed at collecting 6 samples from each Source. What is the distribution of number of samples collected from each Source?
l How good is the representation of samples? Do they cover the entire country?
l How well are the States and districts represented by the samples?
l How are the locations such as corporations, metropolitan cities, municipal towns, taluk headquarters and villages represented in the samples?
l What is the coverage of selected molecules?
l What is the coverage of dosage forms?
Questions on Quality of Drugs
These questions are related to quality of drugs based on laboratory test results.
l What is the extent of NSQ and Spurious drug estimates?
l What is the distribution of number of laboratory tests which contributed to NSQ samples?
l What is the quality of samples from the same batches collected from different geographic locations across the country?
l What are the main sources of NSQ or Spurious drugs?
l How is the time to expiry (gap between date of sample collection and expiry date) distributed?
We explored the answers to the questions listed above and summarized the results. The survey was aimed at analyzing the three sources - retail outlets,

Ministry of Health & Family Welfare | National Drug Survey 2014-16 145
National Institute of Biologicals
Government sources and Ports separately. Some aspects were common to the three sources and some of the queries needed specific answers to each Source separately. The data were analyzed accordingly.
SAMPLING
Based on the outcome of the pilot study, the data collection form was used in the pilot study was modified and finalized. This form was used for the retail outlets and Government sources. For the Ports, a slightly modified sampling procedure had to be adopted because unlike the first two sources, samples had to be drawn from imported medicines from airports and sea ports. The form for data collection for Ports differed from that for other two sources mainly in the selection of molecules and formulations. For Ports, a sample was drawn from each formulation, of each molecule, of each batch number, of every consignment, provided that the molecule was in the list of the 224 molecules. As per the sampling design, for retail outlets and Government sources, selection of samples was made in three stages.
In the first stage selection of sources (a Source is either from retail outlets or Government i.e. State Government Medical Store Depots, CGHS, ESI Dispensaries and Civil Hospital Stores) was made using simple random sampling from the list of all registered sources. In the second stage, molecules were selected from each selected Source using the random list of molecules generated for each selected Source and included in Part-C of the Data form. In the third stage, one formulation was selected from each selected molecule using the prescribed method of random sampling using Part-D of the Data Form.
Selection of sources
In order to draw the first stage samples from Retail outlets and Government sources, the list of all registered sources was needed. The States/UTs provided the lists of 4,24,525 registered retail outlets in 572 districts out of 676 districts in the country. For the remaining 104 districts, the States/UTs were able to provide only the number of registered outlets i.e. 32,978, without any information in respect of Address of outlets, Licensing details etc. Even for those retail outlets where the information was made available, the quality of the data on registered outlets was inadequate.
States/UTs of Bihar, Dadra and Nagar Haveli, Daman and Diu, Meghalaya and Uttarakhand, provided only district-wise number of Retail outlets i.e. 32,978. Therefore, notional IDs for these 32,978 Retail outlets were generated for each of the districts of the above States/UTs for the purpose of sample selection. Thus, making the total number of retail outlets including the ones

Ministry of Health & Family Welfare | National Drug Survey 2014-16146
Survey Results and Analysis
with notional IDs for stage one sampling was 4,57,503 (4,24,525+32,978). Of these, 6,081 retail outlets were selected using simple random sampling and the R-software package. The addresses for retail outlets with notional IDs were obtained through Google for the respective districts.
With regard to Government sources, the total number was 10,555 but the complete information was available only for 3,060 sources. The total targeted sample size was 1,507. It was decided that there should be at least one sample from each district. For selection of Government sources to be sampled, the three stage procedure similar to retail outlets was adopted.
Distribution of Samples
A total of 47,954 samples were drawn by 945 trained drug inspectors. Henceforth, drug inspectors are referred to as Sample Drawing Officers (SDOs). Each SDO was accompanied by either a representative of Civil Society or Pharmacy Council of India to ensure that the samples were drawn in an unbiased manner. Six formulations from six different molecules were planned to be drawn from each Source. The survey deployed 936 SDOs for drawing samples from Retail outlets and Government sources. Samples from Ports were drawn by 9 SDOs. Out of the 47,954 samples drawn under the survey, 47,012 samples drawn from 1421 Government sources and 5717 retail outlets
Exhibit 10.1Source wise distribution of samples drawn under the survey
Ministry of Health & Family Welfare | National Drug Survey 2014-16 147
National Institute of Biologicals
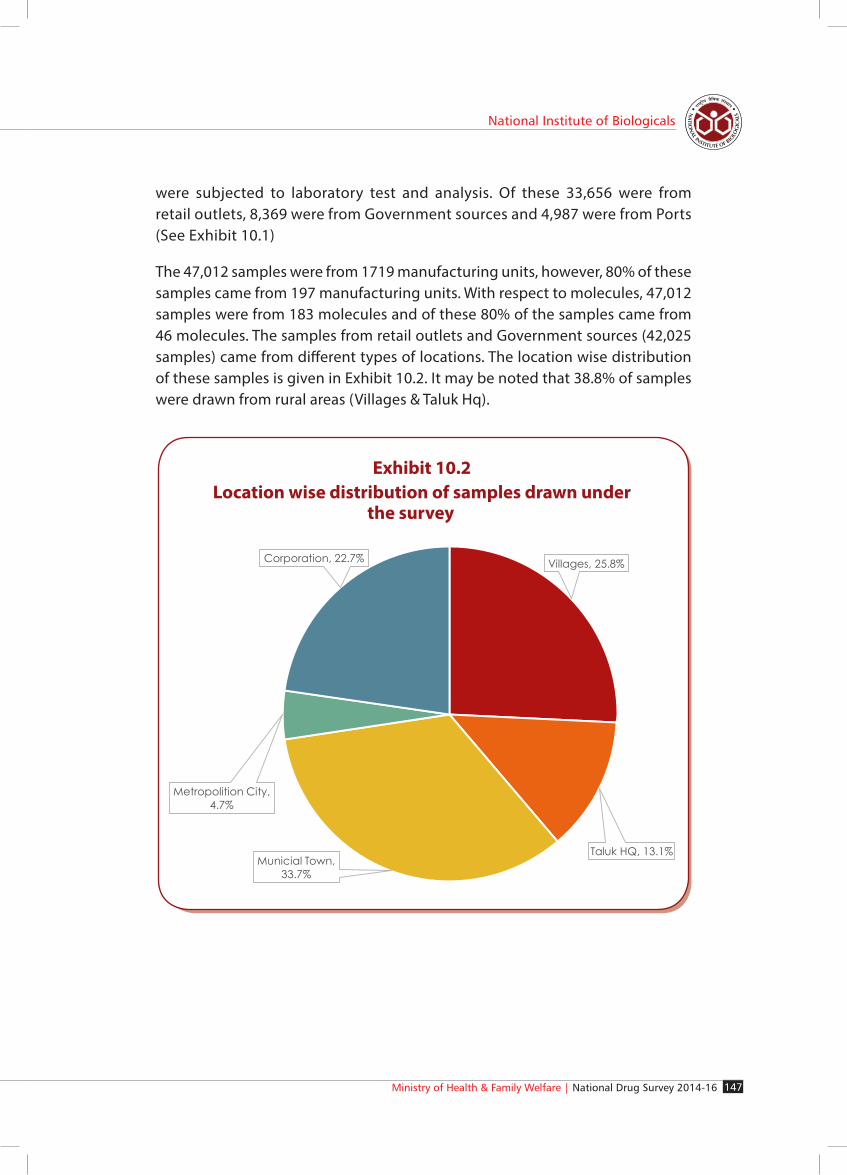
were subjected to laboratory test and analysis. Of these 33,656 were from retail outlets, 8,369 were from Government sources and 4,987 were from Ports (See Exhibit 10.1)
The 47,012 samples were from 1719 manufacturing units, however, 80% of these samples came from 197 manufacturing units. With respect to molecules, 47,012 samples were from 183 molecules and of these 80% of the samples came from 46 molecules. The samples from retail outlets and Government sources (42,025 samples) came from different types of locations. The location wise distribution of these samples is given in Exhibit 10.2. It may be noted that 38.8% of samples were drawn from rural areas (Villages & Taluk Hq).
Exhibit 10.2Location wise distribution of samples drawn under
the survey
Ministry of Health & Family Welfare | National Drug Survey 2014-16148
Survey Results and Analysis
Selection of Formulations
According to the sampling procedure, it was required to list all formulations available in adequate quantity under a selected molecule in Part-D of the data form and select one randomly with the specified procedure. For Ports this was not necessary as in that case samples had been drawn from every consignment.
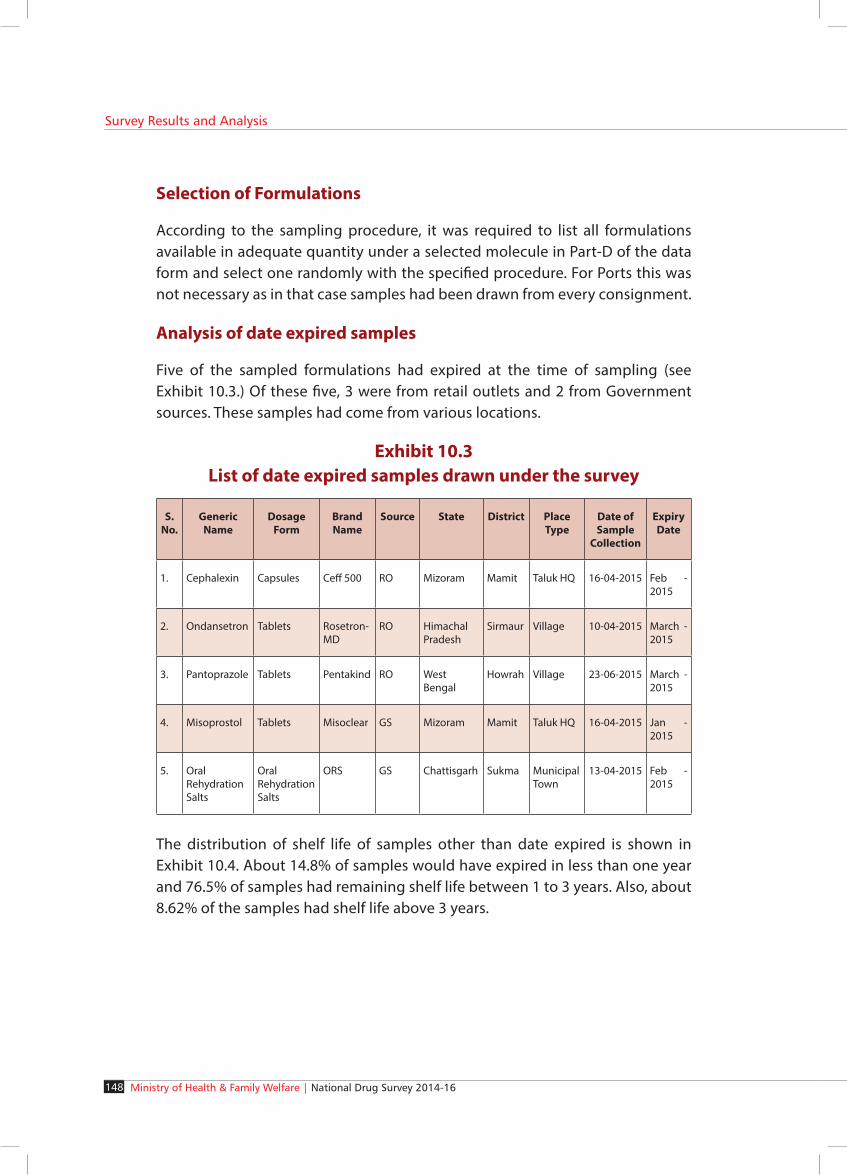
Analysis of date expired samples
Five of the sampled formulations had expired at the time of sampling (see Exhibit 10.3.) Of these five, 3 were from retail outlets and 2 from Government sources. These samples had come from various locations.
Exhibit 10.3List of date expired samples drawn under the survey
S. No.
Generic Name
Dosage Form
Brand Name
Source State District Place Type
Date of Sample
Collection
Expiry Date
1. Cephalexin Capsules Ceff 500 RO Mizoram Mamit Taluk HQ 16-04-2015 Feb - 2015
2. Ondansetron Tablets Rosetron-MD
RO Himachal Pradesh
Sirmaur Village 10-04-2015 March - 2015
3. Pantoprazole Tablets Pentakind RO West Bengal
Howrah Village 23-06-2015 March - 2015
4. Misoprostol Tablets Misoclear GS Mizoram Mamit Taluk HQ 16-04-2015 Jan - 2015
5. Oral Rehydration Salts
Oral Rehydration Salts
ORS GS Chattisgarh Sukma Municipal Town
13-04-2015 Feb - 2015
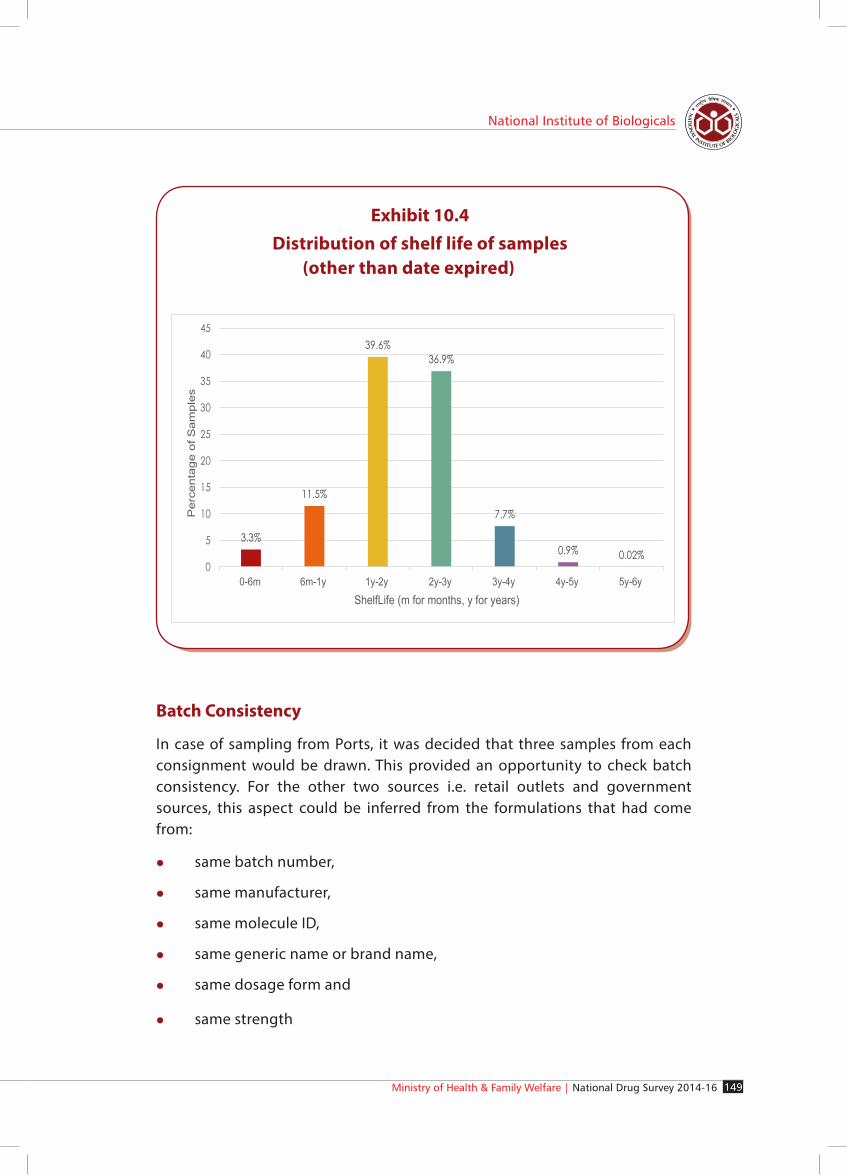
The distribution of shelf life of samples other than date expired is shown in Exhibit 10.4. About 14.8% of samples would have expired in less than one year and 76.5% of samples had remaining shelf life between 1 to 3 years. Also, about 8.62% of the samples had shelf life above 3 years.
Ministry of Health & Family Welfare | National Drug Survey 2014-16 149
National Institute of Biologicals
Exhibit 10.4Distribution of shelf life of samples
(other than date expired)
Batch Consistency
In case of sampling from Ports, it was decided that three samples from each consignment would be drawn. This provided an opportunity to check batch consistency. For the other two sources i.e. retail outlets and government sources, this aspect could be inferred from the formulations that had come from:
l same batch number,
l same manufacturer,
l same molecule ID,
l same generic name or brand name,
l same dosage form and
l same strength
Ministry of Health & Family Welfare | National Drug Survey 2014-16150
Survey Results and Analysis
These formulations which had all these six fields common were called repeat samples. It was observed that from the retail outlets and Government sources, 9,262 samples were drawn from 3,854 repeat batches. That is, there were formulations with the same values for the six fields mentioned above. With regard to Port, 598 samples were drawn from 268 repeat batches. .
Hit Rates
SDOs were asked to draw samples from their assigned sources (the ones given to them with names and addresses). It was possible that samples were drawn from unassigned sources. This might have happened for various reasons such as: (i) the assigned Source was either non-existent or closed at the time of survey, (ii) the specified address was incorrect, (iii) location could not be reached due to weather conditions or other reasons, (iv) the SDO and/or the team members did not draw the samples from assigned outlets. According to the statistical principles, it is desirable that the percentage of assigned sources in the total samples drawn is high. We called this percentage as hit rate. Hit rate could be computed for each SDO or for a district or a State or for the entire set of drawn samples.
Out of the 5,717 retail outlets, 3,495 (61.3%) were the originally assigned and the balance 2222 (38.7%) were unassigned, i.e. hit rate for retail outlets was 61.3%. As per the sampling procedure, if an assigned outlet was not existent or closed at the time of survey visit, the SDOs were supposed to select a nearest retail outlet leaving the choice to the representative of Civil Society /Pharmacy Council of India as member of the team.
The procedure for drawing samples from the Ports was described in the chapter of main survey. Samples were drawn from all consignments pertaining to the 224 molecules. A total of 4,987 samples were collected from the ports by nine SDOs.
RETAIL OUTLETS
The survey data comprises mainly three parts:
Part-A data: This contains stage one data, namely,
l Outlet ID (outlet ID is identified uniquely by the Data Form number),
l State/UT,
l District and type of location of the outlet,
l ID of the SDO who visited the outlet, outlet address,
Ministry of Health & Family Welfare | National Drug Survey 2014-16 151
National Institute of Biologicals
l Whether the outlet visited was the assigned one or not, if the outlet was not the assigned one then the reason for choosing the unassigned one, and
l Sample collection date.
Part-B data: In part-B data, the particulars of the collected sample were captured. It contained:
l Sample ID,
l Serial Number of the molecule (from list of molecules in Part C of the Data Form),
l Molecule ID,
l Generic and brand names,
l Batch number of the sample,
l Name, license number, address and country of the manufacturer of the sample,
l Date of manufacturing, expiry date and the date of drawl of sample,
l Sample dosage form,
l Total quantity of the sample available in the outlet,
l Quantity of sample drawn,
l Number of formulations with adequate quantity under the molecule ID of the sample.
Laboratory Data: For each sampled formulation, laboratory data provides data on:
l Sample ID,
l Lab ID where the test is performed,
l Results of various tests performed,
l Protocol ID for the tests, and
l Whether the sampled formulation was NSQ or not.
Ministry of Health & Family Welfare | National Drug Survey 2014-16152
Survey Results and Analysis
For all tests performed, the test results provided were binary in nature, that is, it was only mentioned whether a sampled formulation passed (complied) or not (not complied) in a particular test.
Analysis of Part-A Data
Coverage of Outlets and Hit Rates
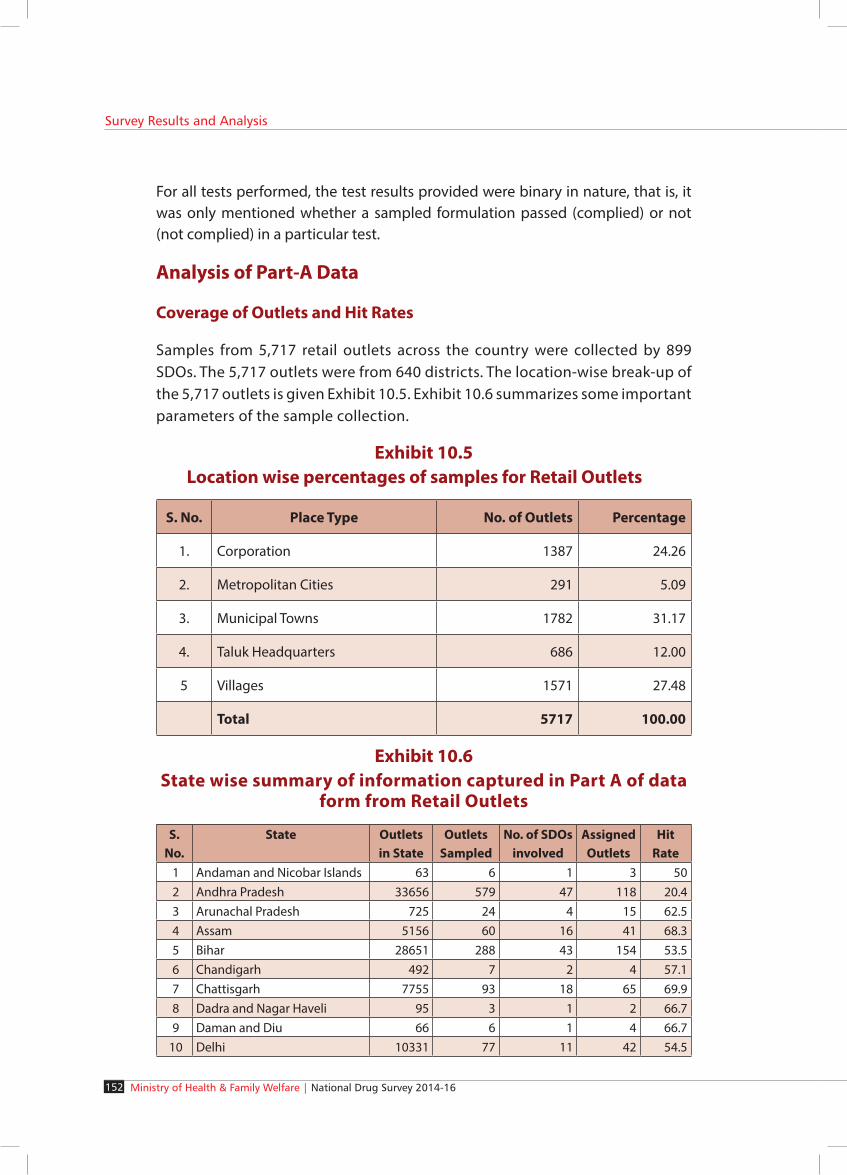
Samples from 5,717 retail outlets across the country were collected by 899 SDOs. The 5,717 outlets were from 640 districts. The location-wise break-up of the 5,717 outlets is given Exhibit 10.5. Exhibit 10.6 summarizes some important parameters of the sample collection.
Exhibit 10.5Location wise percentages of samples for Retail Outlets
S. No. Place Type No. of Outlets Percentage
1. Corporation 1387 24.26
2. Metropolitan Cities 291 5.09
3. Municipal Towns 1782 31.17
4. Taluk Headquarters 686 12.00
5 Villages 1571 27.48
Total 5717 100.00
Exhibit 10.6State wise summary of information captured in Part A of data
form from Retail Outlets
S. No.
State Outlets in State
Outlets Sampled
No. of SDOs involved
Assigned Outlets
Hit Rate
1 Andaman and Nicobar Islands 63 6 1 3 50 2 Andhra Pradesh 33656 579 47 118 20.4 3 Arunachal Pradesh 725 24 4 15 62.5 4 Assam 5156 60 16 41 68.3 5 Bihar 28651 288 43 154 53.5 6 Chandigarh 492 7 2 4 57.1 7 Chattisgarh 7755 93 18 65 69.9 8 Dadra and Nagar Haveli 95 3 1 2 66.7 9 Daman and Diu 66 6 1 4 66.7
10 Delhi 10331 77 11 42 54.5

Ministry of Health & Family Welfare | National Drug Survey 2014-16 153
National Institute of Biologicals
S. No.
State Outlets in State
Outlets Sampled
No. of SDOs involved
Assigned Outlets
Hit Rate
11 Goa 536 6 2 4 66.7
12 Gujarat 17213 230 56 199 86.5
13 Haryana 10931 142 20 108 76.1
14 Himachal Pradesh 2688 27 9 24 88.9
15 Jammu and Kashmir 7699 74 21 50 67.6
16 Jharkhand 8319 387 28 223 59.9
17 Karnataka 22595 276 49 234 84.8
18 Kerala 27520 256 38 209 81.6
19 Lakshadweep 1 1 1 1 100
20 Madhya Pradesh 18654 144 34 108 75
21 Maharashtra 48558 652 88 513 78.7
22 Manipur 1840 13 4 2 15.4
23 Meghalaya 208 15 6 14 93.3
24 Mizoram 325 17 7 11 64.7
25 Nagaland 245 22 6 18 81.8
26 Orissa 13218 160 40 118 73.8
27 Puducherry 428 13 5 12 92.3
28 Punjab 13078 117 31 87 74.4
29 Rajasthan 18515 249 55 171 68.7
30 Sikkim 236 5 2 2 40
31 Tamilnadu 27296 340 69 235 69.1
32 Telangana 29223 367 55 168 45.8
33 Tripura 316 16 4 13 81.3
34 Uttar Pradesh 51890 497 72 338 68
35 Uttarakhand 3958 42 4 32 76.2
36 West Bengal 45023 506 50 153 30.2
Total 457503 5717 899 3495 61.3
Hit Rates
Out of 6,081 retail outlets targeted, samples were drawn from 5,717 retail outlets. Of these 5,717 retail outlets from which samples were drawn, 3,495 were the assigned retail outlets and the balance 2,222 retail outlets were unassigned ones. Barring Lakshadweep which had only one assigned outlet, the overall hit rate is 61.3%. The hit rates of the States/UTs varied from 15.4 to 93.3 percent. Hit rates of States/UTs can be seen in Exhibit 10.6. Fifty percent of the States/UTs had hit rate above 68% and 75 percent of the states have

Ministry of Health & Family Welfare | National Drug Survey 2014-16154
Survey Results and Analysis
hit rate above 57%. Hit rates were very high (>80%) for Gujarat, Himachal Pradesh, Kerala, Karnataka, Lakshadweep, Meghalaya, Nagaland, Puducherry and Tripura. Distribution of hit rate of States/UTs is shown in Exhibit 10.7. Hit rate in 11 States/UTs was between 60-70% and 3 States/UTs had a hit rate between 90-100%. One State each had a hit rate between 10-20%, 20-30% and 30-40% respectively. The data show that 26 States/UTs (72.2%) out of 36 had a hit rate of more than 60%.
Exhibit 10.7Hit rate distribution of 36 States/UTs for Retail Outlets
Analysis of Part-B Data
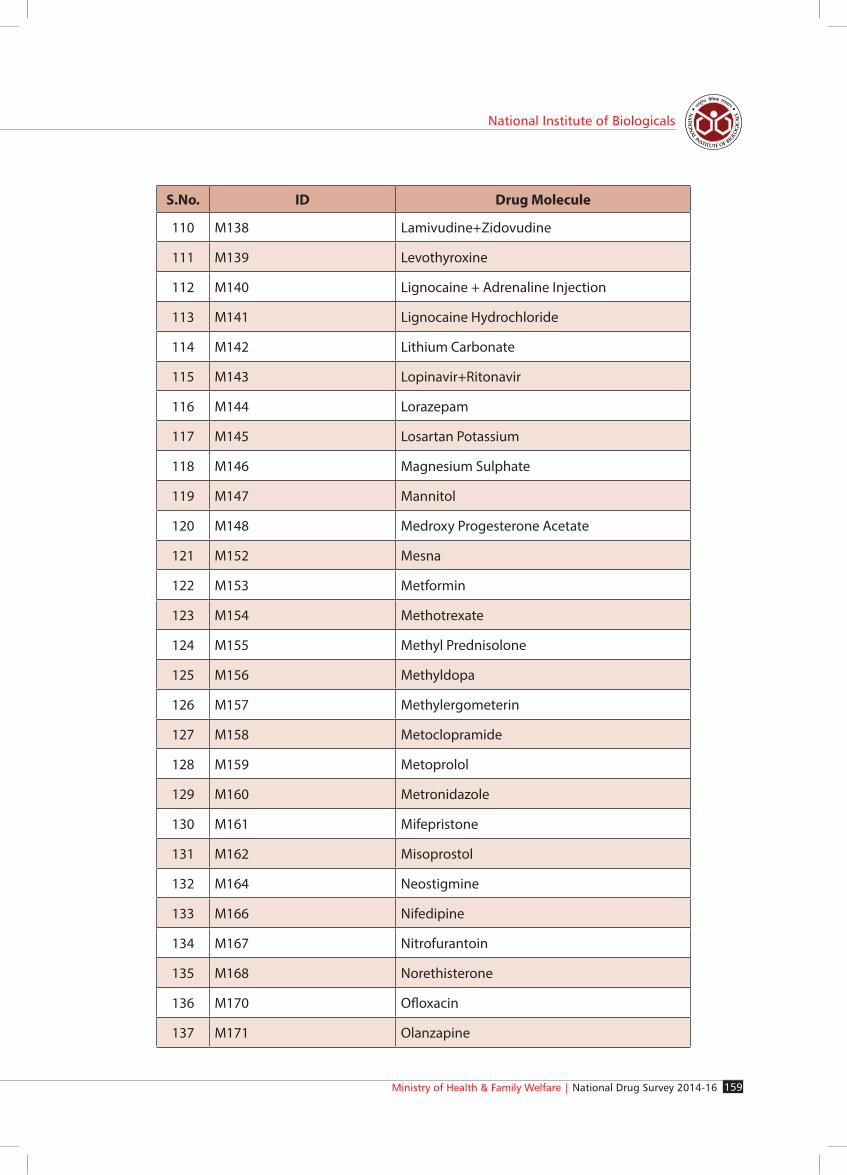
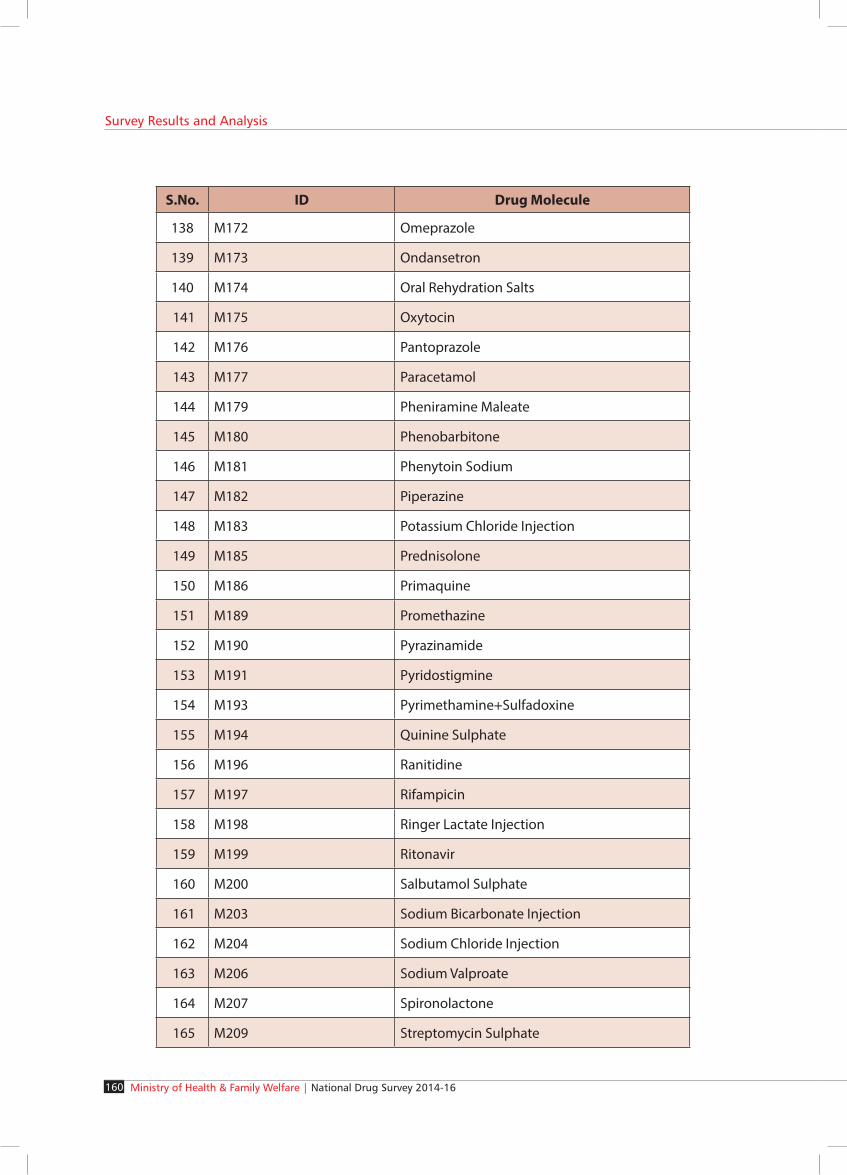
In Part-B, data on each sampled formulation was captured. From the 5,717 retail outlets, a total of 33,656 samples were drawn from 177 different molecules (79%) out of the 224. This means that 47 of the 224 molecules could not be drawn in the survey. List of molecules for which samples were drawn in the survey is given in Exhibit 10.8.

Ministry of Health & Family Welfare | National Drug Survey 2014-16 155
National Institute of Biologicals
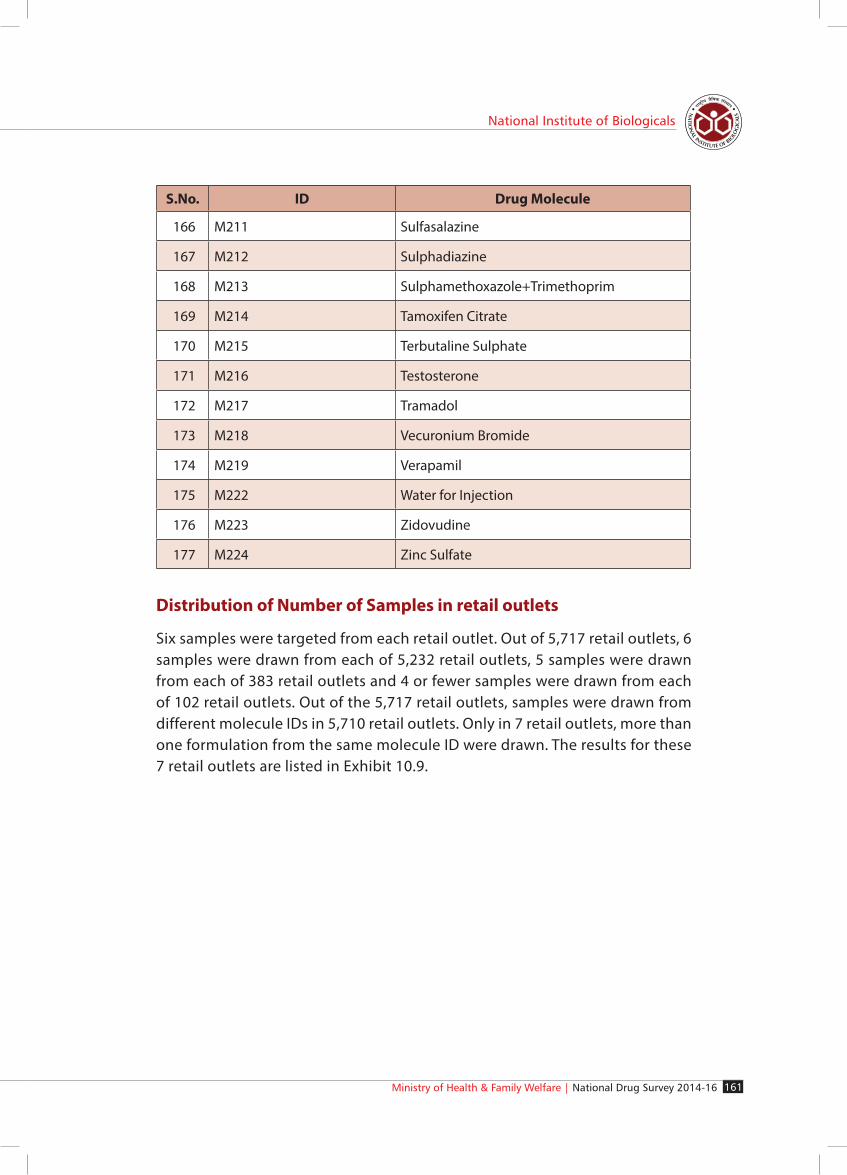
Exhibit 10.8List of molecules for which samples were drawn from retail
outlets under the survey
S.No. ID Drug Molecule
1 M001 25% Dextrose
2 M003 5-Fluorouracil
3 M006 Acetyl Salicylic Acid
4 M007 Acyclovir
5 M008 Adrenaline Bitartrate
6 M009 Albendazole
7 M010 Allopurinol
8 M011 Alprazolam
9 M012 Aluminium Hydroxide+Magnesium Hydroxide
10 M013 Amikacin
11 M014 Amiodarone
12 M015 Amitriptyline
13 M016 Amlodipine
14 M017 Amlodipine+Losartan Potassium
15 M018 Amoxicillin
16 M019 Amoxicillin+Clavulinic Acid
17 M020 Ampicillin
18 M022 Aspirin+Caffeine
19 M023 Atenolol
20 M024 Atorvastatin
21 M025 Atracurium Besylate
22 M027 Azathioprine
23 M028 Azithromycin
24 M029 Beclomethasone Dipropionate
25 M030 Benzathine Benzylpenicillin
26 M031 Bisacodyl

Ministry of Health & Family Welfare | National Drug Survey 2014-16156
Survey Results and Analysis
S.No. ID Drug Molecule
27 M034 Carbamazepine
28 M035 Carbidopa+Levodopa Tablets
29 M036 Carbimazole
30 M037 Cefixime
31 M038 Cefotaxime
32 M039 Ceftazidime
33 M040 Ceftriaxone
34 M041 Cephalexin
35 M042 Cetirizine
36 M044 Chloroquine Phosphate
37 M045 Chlorpheniramine Maleate
38 M046 Chlorpromazine Hydrochloride
39 M048 Ciprofloxacin Hydrochlorid
40 M051 Clindamycin
41 M052 Clofazimine
42 M053 Clomiphene Citrate
43 M054 Clopidogrel
44 M055 Clotrimazole
45 M058 Colchicine
46 M060 Compound Sodium Chloride+Dextrose Injection
47 M062 Concentrated Vitamin A+D Solution
48 M063 Cyclophosphamide
49 M064 Danazol
50 M065 Dapsone
51 M067 Dexamethasone
52 M068 Dexchlorpheniramine Maleate
53 M069 Dextromethorphan
54 M070 Dextrose Injection

Ministry of Health & Family Welfare | National Drug Survey 2014-16 157
National Institute of Biologicals
S.No. ID Drug Molecule
55 M073 Dextrose+Sodium Chloride Injection (5% & 0.9%)
56 M074 Dextrose+Sodium Chloride Injection
57 M075 Diazepam
58 M076 Diclofenac
59 M077 Dicyclomine Hydrochloride
60 M079 Diethylcarbamazine Citrate
61 M080 Digoxin
62 M082 Diltiazem
63 M083 Dobutamine
64 M084 Domperidone
65 M085 Dopamine Hydrochloride
66 M086 Doxycycline
67 M087 Efavirenz
68 M088 Efavirenz+Emtricitabine+Tenofovir
69 M091 Enalapril Maleate
70 M092 Erythromycin Estolate
71 M093 Ethambutol
72 M094 Ethambutol+Isoniazid
73 M095 Ethambutol+Isoniazid+Pyrazinamide+ Rifampicin
74 M096 Ethambutol+Isoniazid+Rifampicin
75 M097 Ethinylestradiol
76 M098 Ethinylestradiol+Levonorgesterol
77 M099 Ethinylestradiol+Norethisterone
78 M100 Etophylline+Theophylline Prolonged-release
79 M101 Etoposide
80 M102 Famotidine
81 M103 Fluconazole

Ministry of Health & Family Welfare | National Drug Survey 2014-16158
Survey Results and Analysis
S.No. ID Drug Molecule
82 M104 Fluoxetine Hydrochloride
83 M105 Flutamide
84 M106 Folic Acid+Iron
85 M108 Furosemide
86 M109 Gentamicin
87 M110 Glibenclamide
88 M111 Glyceryl Trinitrate
89 M112 Griseofulvin
90 M113 Haloperidol
91 M114 Hydrochlorothiazide+Irbesartan
92 M115 Hydrochlorothiazide+Losartan Potassium
93 M116 Hydrochlorothiazide+Ramipril
94 M117 Hydrochlorothiazide+Valsartan
95 M118 Hydrochlorthiazide
96 M120 Hydrocortisone Sodium Succinate
97 M122 Hyoscine Butyl Bromide
98 M123 Ibuprofen
99 M124 Imatinib
100 M125 Imipramine
101 M127 Iodine
102 M128 Isoniazid
103 M129 Isoniazid+Pyrazinamide+Rifampicin
104 M130 Isoniazid+Rifampicin
105 M132 Isosorbide Mononitrate/Dinitrate
106 M133 Lamivudine
107 M134 Lamivudine+Nevirapine+Stavudine
108 M135 Lamivudine+Nevirapine+Zidovudine
109 M136 Lamivudine+Stavudine
Ministry of Health & Family Welfare | National Drug Survey 2014-16 159
National Institute of Biologicals
S.No. ID Drug Molecule
110 M138 Lamivudine+Zidovudine
111 M139 Levothyroxine
112 M140 Lignocaine + Adrenaline Injection
113 M141 Lignocaine Hydrochloride
114 M142 Lithium Carbonate
115 M143 Lopinavir+Ritonavir
116 M144 Lorazepam
117 M145 Losartan Potassium
118 M146 Magnesium Sulphate
119 M147 Mannitol
120 M148 Medroxy Progesterone Acetate
121 M152 Mesna
122 M153 Metformin
123 M154 Methotrexate
124 M155 Methyl Prednisolone
125 M156 Methyldopa
126 M157 Methylergometerin
127 M158 Metoclopramide
128 M159 Metoprolol
129 M160 Metronidazole
130 M161 Mifepristone
131 M162 Misoprostol
132 M164 Neostigmine
133 M166 Nifedipine
134 M167 Nitrofurantoin
135 M168 Norethisterone
136 M170 Ofloxacin
137 M171 Olanzapine
Ministry of Health & Family Welfare | National Drug Survey 2014-16160
Survey Results and Analysis
S.No. ID Drug Molecule
138 M172 Omeprazole
139 M173 Ondansetron
140 M174 Oral Rehydration Salts
141 M175 Oxytocin
142 M176 Pantoprazole
143 M177 Paracetamol
144 M179 Pheniramine Maleate
145 M180 Phenobarbitone
146 M181 Phenytoin Sodium
147 M182 Piperazine
148 M183 Potassium Chloride Injection
149 M185 Prednisolone
150 M186 Primaquine
151 M189 Promethazine
152 M190 Pyrazinamide
153 M191 Pyridostigmine
154 M193 Pyrimethamine+Sulfadoxine
155 M194 Quinine Sulphate
156 M196 Ranitidine
157 M197 Rifampicin
158 M198 Ringer Lactate Injection
159 M199 Ritonavir
160 M200 Salbutamol Sulphate
161 M203 Sodium Bicarbonate Injection
162 M204 Sodium Chloride Injection
163 M206 Sodium Valproate
164 M207 Spironolactone
165 M209 Streptomycin Sulphate
Ministry of Health & Family Welfare | National Drug Survey 2014-16 161
National Institute of Biologicals
S.No. ID Drug Molecule
166 M211 Sulfasalazine
167 M212 Sulphadiazine
168 M213 Sulphamethoxazole+Trimethoprim
169 M214 Tamoxifen Citrate
170 M215 Terbutaline Sulphate
171 M216 Testosterone
172 M217 Tramadol
173 M218 Vecuronium Bromide
174 M219 Verapamil
175 M222 Water for Injection
176 M223 Zidovudine
177 M224 Zinc Sulfate
Distribution of Number of Samples in retail outlets
Six samples were targeted from each retail outlet. Out of 5,717 retail outlets, 6 samples were drawn from each of 5,232 retail outlets, 5 samples were drawn from each of 383 retail outlets and 4 or fewer samples were drawn from each of 102 retail outlets. Out of the 5,717 retail outlets, samples were drawn from different molecule IDs in 5,710 retail outlets. Only in 7 retail outlets, more than one formulation from the same molecule ID were drawn. The results for these 7 retail outlets are listed in Exhibit 10.9.

Ministry of Health & Family Welfare | National Drug Survey 2014-16162
Survey Results and Analysis
Exhibit 10.9Seven outlets in which more than one formulation was selected
from same molecule
S. No. Form No. Molecule ID No. Formulation sampled
State SDO ID
1. F1195 M019 3 Jammu and Kashmir
335
1. F1195 M103 2 Jammu and Kashmir
335
2. F2225 M028 2 Karnataka 86
3. F2825 M160 2 West Bengal 1001
4. F3865 M048 2 Uttar Pradesh 514
5. F4029 M037 2 Haryana 43
6. F4259 M160 2 Delhi 664
7. F4789 M145 2 Kerala 658
Inclusion Probabilities of Molecule IDs
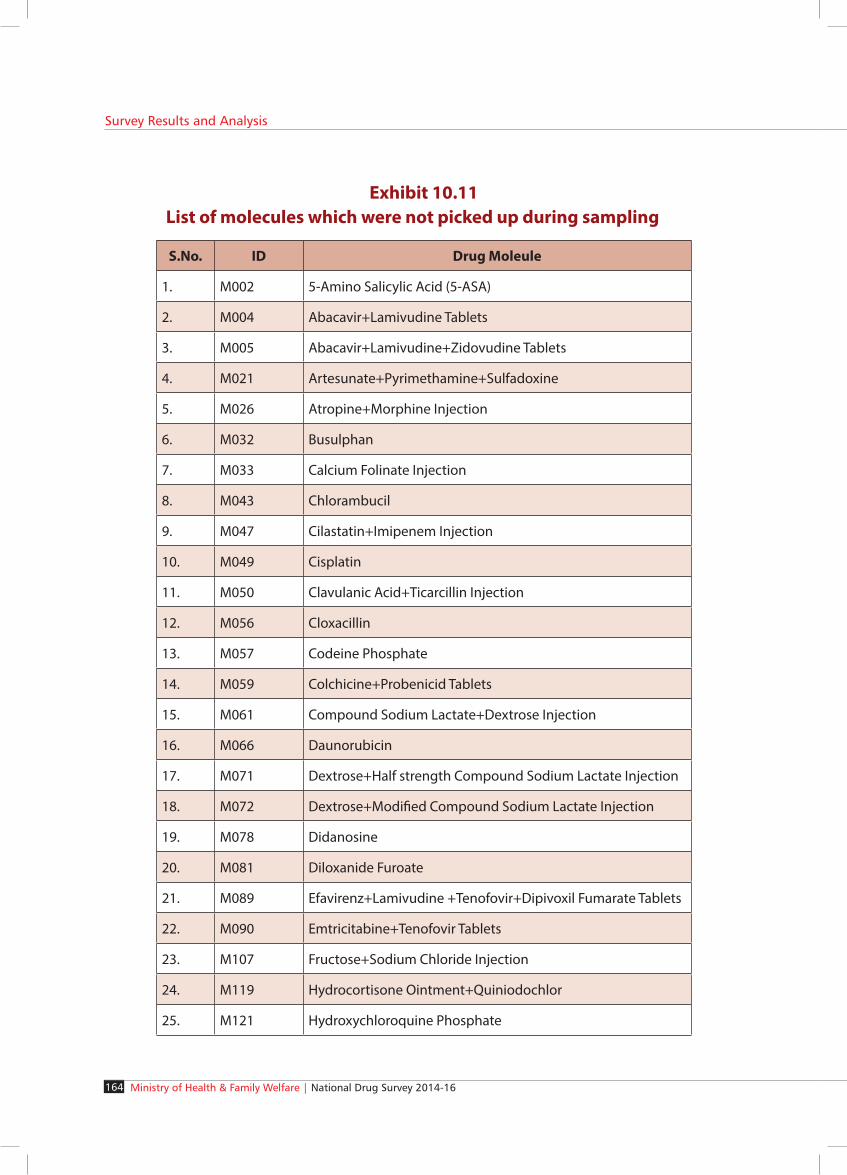
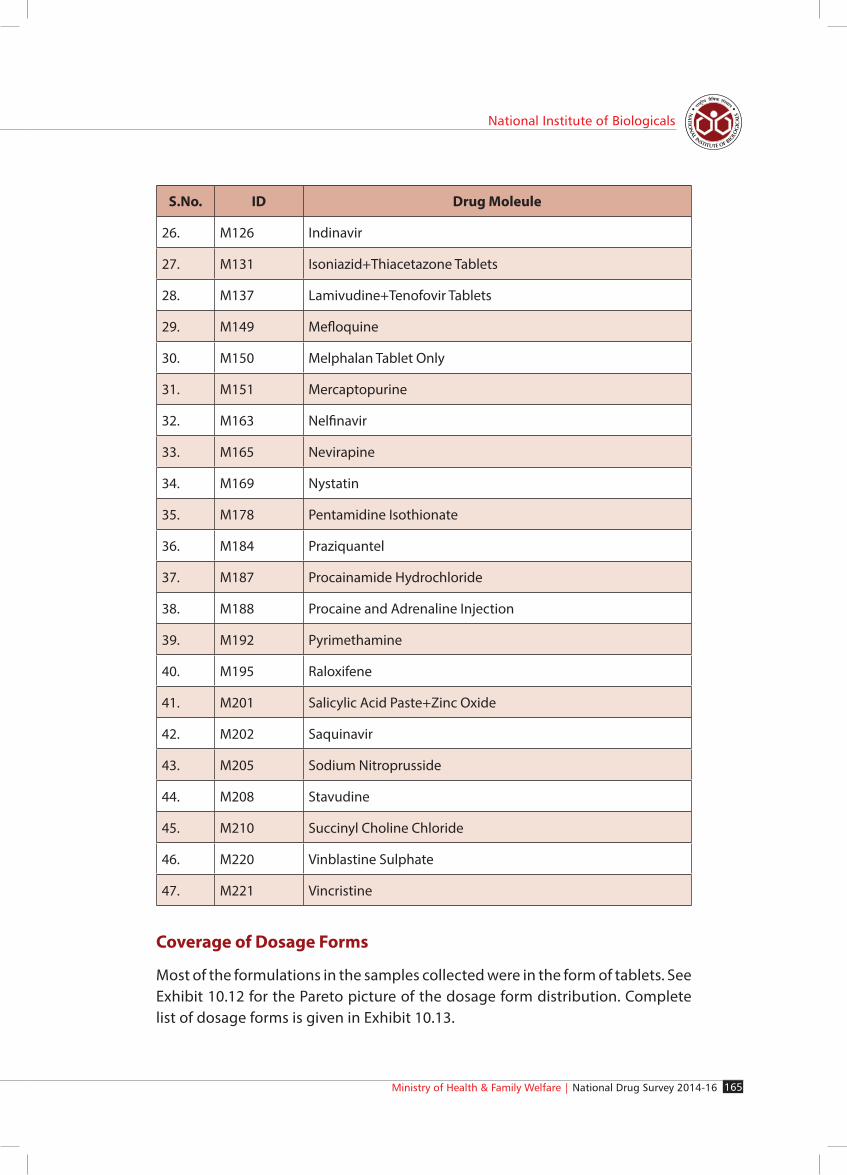
The sampling procedure provided equal opportunity to all the 224 molecules for inclusion in the sample. However, the selection depended on the availability of molecules in the outlets. In all, 177 molecules got included in the sampled formulations from retail outlets. From the sampled data, we could compute the chance of molecule inclusion in the sample. This chance varied from 0 to 6 percent. Some of the molecules along with their inclusion chances (specified as percentage) are shown in Exhibit 10.10 List of 47 molecules which were not picked up during sampling is presented in Exhibit 10.11.

Ministry of Health & Family Welfare | National Drug Survey 2014-16 163
National Institute of Biologicals
Exhi
bit 1
0.10
Mol
ecul
e in
clus
ion
chan
ces
for r
etai
l out
lets
Som
e of
the
Mol
ecul
es w
ith
high
cha
nce
Som
e of
the
Mol
ecul
es w
ith
low
cha
nce
S.
No.
IDG
ener
ic N
ame
No.
of
Form
ulat
ions
in
the
Sam
ple
Incl
usio
n Ch
ance
sS.
No.
IDG
ener
ic N
ame
No.
of F
orm
ulat
ions
in th
e Sa
mpl
eIn
clus
ion
Chan
ces
1.M
177
Para
ceta
mol
1956
5.81
1.M
183
Pota
ssiu
m C
hlor
ide
Inje
ctio
n5
0.01
2.M
196
Rani
tidin
e18
865.
602.
M05
8Co
lchi
cine
90.
03
3.M
042
Cetir
izin
e14
254.
233.
M06
4D
anaz
ol9
0.03
4.M
172
Om
epra
zole
1059
3.15
4.M
085
Dop
amin
e H
ydro
chlo
ride
90.
03
5.M
160
Met
roni
dazo
le10
493.
125.
M20
3So
dium
Bic
arbo
nate
Inje
ctio
n9
0.03
6.M
185
Pred
niso
lon
1039
3.09
6.M
215
Terb
utal
ine
Sulp
hate
90.
03
7.M
067
Dexa
met
haso
ne10
363.
087.
M07
7D
icyc
lom
ine
Hyd
roch
lorid
e10
0.03
8.M
016
Am
lodi
pine
1024
3.04
8.M
162
Mis
opro
stol
120.
04
9.M
170
Oflo
xaci
n80
02.
389
M07
4D
extr
ose+
Sodi
um
Chlo
ride
Inje
ctio
n
140.
04
Ministry of Health & Family Welfare | National Drug Survey 2014-16164
Survey Results and Analysis
Exhibit 10.11List of molecules which were not picked up during sampling
S.No. ID Drug Moleule
1. M002 5-Amino Salicylic Acid (5-ASA)
2. M004 Abacavir+Lamivudine Tablets
3. M005 Abacavir+Lamivudine+Zidovudine Tablets
4. M021 Artesunate+Pyrimethamine+Sulfadoxine
5. M026 Atropine+Morphine Injection
6. M032 Busulphan
7. M033 Calcium Folinate Injection
8. M043 Chlorambucil
9. M047 Cilastatin+Imipenem Injection
10. M049 Cisplatin
11. M050 Clavulanic Acid+Ticarcillin Injection
12. M056 Cloxacillin
13. M057 Codeine Phosphate
14. M059 Colchicine+Probenicid Tablets
15. M061 Compound Sodium Lactate+Dextrose Injection
16. M066 Daunorubicin
17. M071 Dextrose+Half strength Compound Sodium Lactate Injection
18. M072 Dextrose+Modified Compound Sodium Lactate Injection
19. M078 Didanosine
20. M081 Diloxanide Furoate
21. M089 Efavirenz+Lamivudine +Tenofovir+Dipivoxil Fumarate Tablets
22. M090 Emtricitabine+Tenofovir Tablets
23. M107 Fructose+Sodium Chloride Injection
24. M119 Hydrocortisone Ointment+Quiniodochlor
25. M121 Hydroxychloroquine Phosphate
Ministry of Health & Family Welfare | National Drug Survey 2014-16 165
National Institute of Biologicals
S.No. ID Drug Moleule
26. M126 Indinavir
27. M131 Isoniazid+Thiacetazone Tablets
28. M137 Lamivudine+Tenofovir Tablets
29. M149 Mefloquine
30. M150 Melphalan Tablet Only
31. M151 Mercaptopurine
32. M163 Nelfinavir
33. M165 Nevirapine
34. M169 Nystatin
35. M178 Pentamidine Isothionate
36. M184 Praziquantel
37. M187 Procainamide Hydrochloride
38. M188 Procaine and Adrenaline Injection
39. M192 Pyrimethamine
40. M195 Raloxifene
41. M201 Salicylic Acid Paste+Zinc Oxide
42. M202 Saquinavir
43. M205 Sodium Nitroprusside
44. M208 Stavudine
45. M210 Succinyl Choline Chloride
46. M220 Vinblastine Sulphate
47. M221 Vincristine
Coverage of Dosage Forms
Most of the formulations in the samples collected were in the form of tablets. See Exhibit 10.12 for the Pareto picture of the dosage form distribution. Complete list of dosage forms is given in Exhibit 10.13.

Ministry of Health & Family Welfare | National Drug Survey 2014-16166
Survey Results and Analysis
Exhibit 10.12Dosage form distribution of the samples
Exhibit 10.13Summary of dosage forms in the samples from retail outlets
S.No. Dosage Form Count Percentage
1 Tablets 27035 80.33
2 Capsules 2210 6.57
3 Injections Small Volume Parenterals (SVP) 1183 3.52
4 Suspensions 1136 3.38
5 Oral Rehydration Salts 793 2.36
6 Liquids 473 1.41
7 Injections Large Volume Parenterals (LVP) 305 0.91
8 Powder for Injections 134 0.4

Ministry of Health & Family Welfare | National Drug Survey 2014-16 167
National Institute of Biologicals
S.No. Dosage Form Count Percentage
9 Dispersible Tablets 97 0.29
10 Powder for Oral Liquids 70 0.21
11 Cream (non-sterile) 48 0.14
12 Gel (non-sterile) 47 0.14
13 Eye Drop 42 0.12
14 Ointment (Non-sterile) 28 0.08
15 Granules (Non-sterile) 11 0.03
16 Gel (sterile) 10 0.03
17 Ointment (sterile) 8 0.02
18 Paste (Non-sterile) 8 0.02
19 Bulk Drugs 6 0.02
20 Inhalers 3 0.01
21 Lozenges 3 0.01
22 Suppositories 3 0.01
23 Antacids Sachets 1 0
24 Ear Drops 1 0
25 Orally Disintegrating Strips 1 0
Analysis of Lab Data
In this section the results on quality of medicines are presented with respect to two aspects viz. the shelf life and the results of lab tests.
Lab Test Results and NSQ Proportions
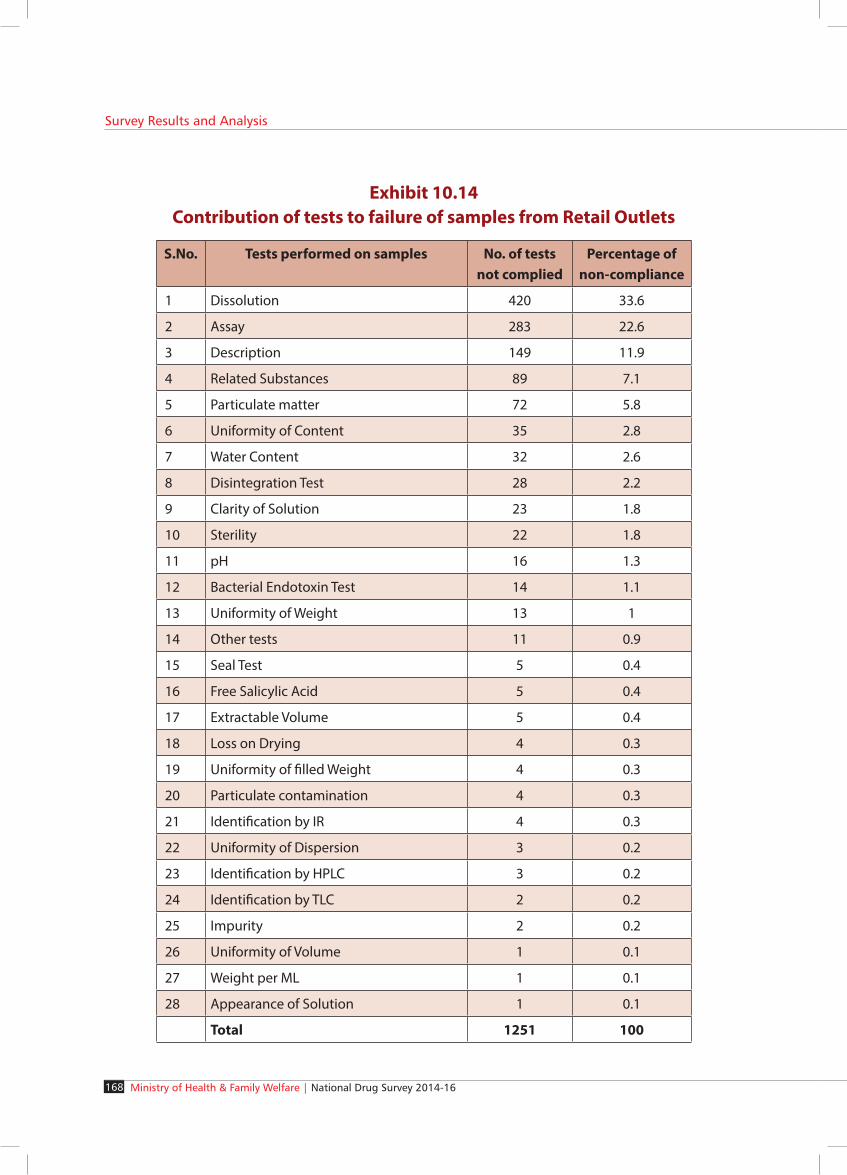
The samples drawn under survey were subjected to test/analysis at 10 Central/State Government Drug Testing Laboratories. A total of 69 different tests were performed on samples in the labs. Not all the 69 tests were applicable to all formulations. Samples from retail outlets failed in one or more of the 28 out of these 69 tests. The list of these 28 tests and the number of tests that samples failed in each of these 28 tests are summarized in Exhibit 10.14. From this figure, it can be seen that in case of retail outlets, failure due to dissolution test contributed to 33.6% of non-compliance. Failure in assay contributed to 22.6% of non-compliance and failure in description contributed to 11.9% of non-compliance, and so on.
Ministry of Health & Family Welfare | National Drug Survey 2014-16168
Survey Results and Analysis
Exhibit 10.14Contribution of tests to failure of samples from Retail Outlets
S.No. Tests performed on samples No. of tests not complied
Percentage of non-compliance
1 Dissolution 420 33.6
2 Assay 283 22.6
3 Description 149 11.9
4 Related Substances 89 7.1
5 Particulate matter 72 5.8
6 Uniformity of Content 35 2.8
7 Water Content 32 2.6
8 Disintegration Test 28 2.2
9 Clarity of Solution 23 1.8
10 Sterility 22 1.8
11 pH 16 1.3
12 Bacterial Endotoxin Test 14 1.1
13 Uniformity of Weight 13 1
14 Other tests 11 0.9
15 Seal Test 5 0.4
16 Free Salicylic Acid 5 0.4
17 Extractable Volume 5 0.4
18 Loss on Drying 4 0.3
19 Uniformity of filled Weight 4 0.3
20 Particulate contamination 4 0.3
21 Identification by IR 4 0.3
22 Uniformity of Dispersion 3 0.2
23 Identification by HPLC 3 0.2
24 Identification by TLC 2 0.2
25 Impurity 2 0.2
26 Uniformity of Volume 1 0.1
27 Weight per ML 1 0.1
28 Appearance of Solution 1 0.1
Total 1251 100

Ministry of Health & Family Welfare | National Drug Survey 2014-16 169
National Institute of Biologicals
Out of the 33,656 samples tested from retail outlets, 1011 failed in one or more of the 28 tests and were declared as NSQ. This information is summarized in Exhibit 10.15. The break-up of the results for the 1011 samples is presented in Exhibit 10.16.
Exhibit 10.15Contribution of tests to failures of samples from Retail Outlets
Exhibit 10.16Break-up of 1011 NSQ samples from retail outlets that have
failed in one or more tests
Number of tests not complied
1 2 3 4 Total
Number of sampled formulation
809 166 31 5 1011

Ministry of Health & Family Welfare | National Drug Survey 2014-16170
Survey Results and Analysis
The estimated NSQ percentage for retail outlets in India is 3% with the upper 95% confidence limit of 3.19%. The estimates were also obtained for each State. Exhibit 10.17 presents the estimated NSQ percentages with approximate upper and lower 95% confidence limits for the states.
Exhibit 10.17Estimates of NSQ percentages for retail outlets with approximate
upper and lower 95% confidence limit (CL)
S. No.
State* No. of Formulations
Number of NSQ
Samples
NSQ %
Lower 95% CL
Upper 95%
CL
1 ANDAMAN AND NICOBAR
ISLANDS
35 0 0.00 0.00 0.00
2 ANDHRA PRADESH 3437 132 3.84 3.20 4.48
3 ARUNACHAL PRADESH 128 3 2.34 0.00 4.96
4 ASSAM 348 10 2.87 1.12 4.63
5 BIHAR 1694 53 3.13 2.30 3.96
6 CHANDIGARH 40 1 2.50 0.00 7.34
7 CHATTISGARH 549 16 2.91 1.51 4.32
8 DADRA AND NAGAR
HAVELI
18 0 0.00 0.00 0.00
9 DAMAN AND DIU 36 1 2.78 0.00 8.15
10 DELHI 453 7 1.55 0.41 2.68
11 GOA 36 0 0.00 0.00 0.00
12 GUJARAT 1372 65 4.74 3.61 5.86
13 HARYANA 842 33 3.92 2.61 5.23
14 HIMACHAL PRADESH 161 5 3.11 0.43 5.79
15 JAMMU AND KASHMIR 441 15 3.40 1.71 5.09
16 JHARKHAND 2294 40 1.74 1.21 2.28
17 KARNATAKA 1633 42 2.57 1.80 3.34
18 KERALA 1523 30 1.97 1.27 2.67
19 LAKSHADWEEP 6 1 16.67 0.00 46.49
20 MADHYA PRADESH 853 19 2.23 1.24 3.22
21 MAHARASHTRA 3803 121 3.18 2.62 3.74
22 MANIPUR 76 4 5.26 0.24 10.28

Ministry of Health & Family Welfare | National Drug Survey 2014-16 171
National Institute of Biologicals
S.
No.
State* No. of
Formulations
Number
of NSQ
Samples
NSQ
%
Lower
95% CL
Upper
95%
CL
23 MEGHALAYA 84 5 5.95 0.89 11.01
24 MIZORAM 102 9 8.82 3.32 14.33
25 NAGALAND 117 8 6.84 2.26 11.41
26 ORISSA 954 35 3.67 2.48 4.86
27 PUDUCHERRY 78 4 5.13 0.23 10.02
28 PUNJAB 691 29 4.20 2.70 5.69
29 RAJASTHAN 1483 44 2.97 2.10 3.83
30 SIKKIM 29 1 3.45 0.00 10.09
31 TAMILNADU 2013 77 3.83 2.99 4.66
32 TELANGANA 2137 62 2.90 2.19 3.61
33 TRIPURA 96 5 5.21 0.76 9.65
34 UTTAR PRADESH 2871 85 2.96 2.34 3.58
35 UTTARAKHAND 231 7 3.03 0.82 5.24
36 WEST BENGAL 2992 42 1.40 0.98 1.83
All Retail Outlets 33656 1011 3.00 2.83 3.19
National average of NSQ from retail Sources is 3.00%. Rows in Pink have NSQ percentage above National average and Rows in green have NSQ percentages below National average.
Note: When proportions are estimated, larger sample sizes yield more precise estimates. The precision is expressed in terms of confidence intervals. When the sample is large, we have narrow confidence interval, and when the sample size is small we have wide confidence interval. For instance, NSQ of 3.84% for Andhra Pardesh has a confidence interval of 3.2 - 4.48 based on the sample size of 3437 whereas NSQ of 16.67% for Lakshadweep has confidence interval of 0 - 46.49 based on a sample size of 6. Thus the estimate NSQ percentage is more precise for Andhra Pradesh compared to that of Lakshdweep.
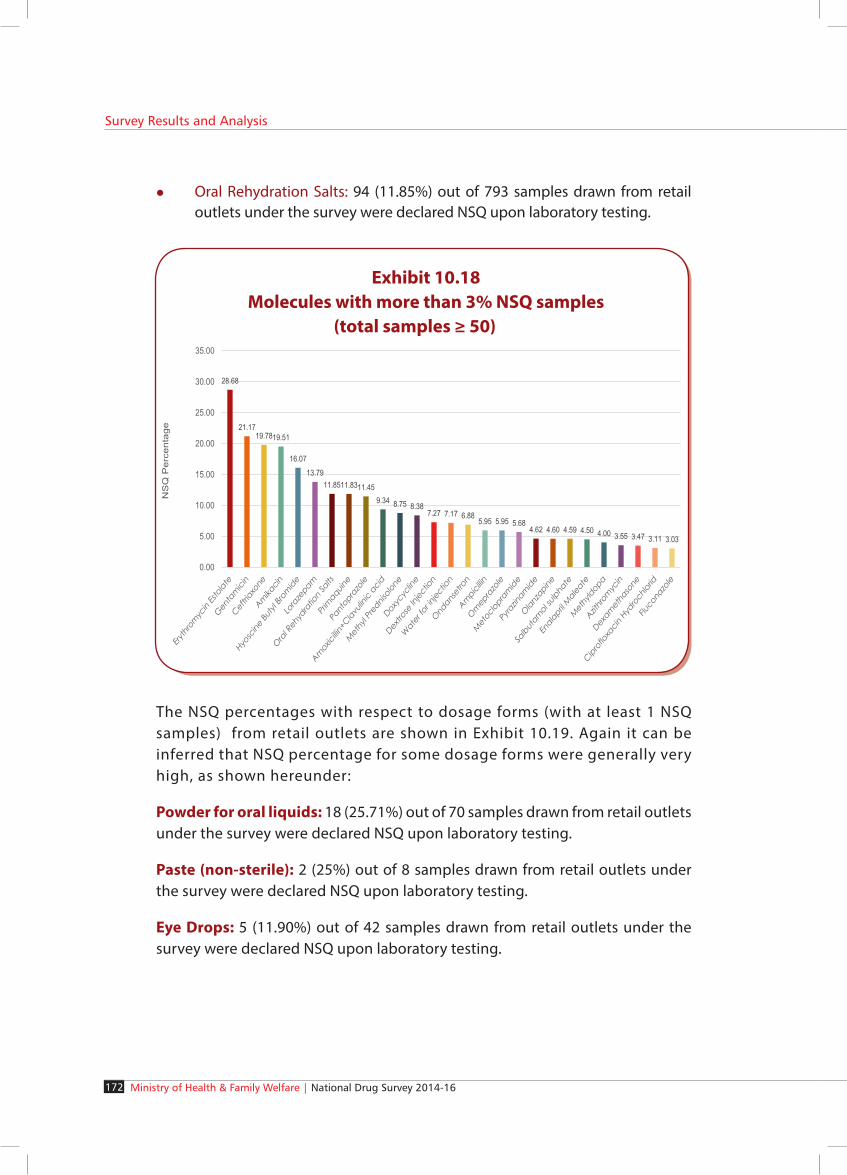
The NSQ percentages were also estimated for molecules with at least 100 samples from retail outlets. These are shown in Exhibit 10.18. Few examples are hereunder:
l Erythromycin Estolate: 39 (28.68%) out of 136 samples drawn from retail outlets under the survey were declared NSQ upon laboratory testing.
l Gentamicin: 29 (21.17%) out of 137 samples drawn from retail outlets under the survey were declared NSQ upon laboratory testing.
l Amikacin: 32 (19.51%) out of 164 samples drawn from retail outlets under the survey were declared NSQ upon laboratory testing.
Ministry of Health & Family Welfare | National Drug Survey 2014-16172
Survey Results and Analysis
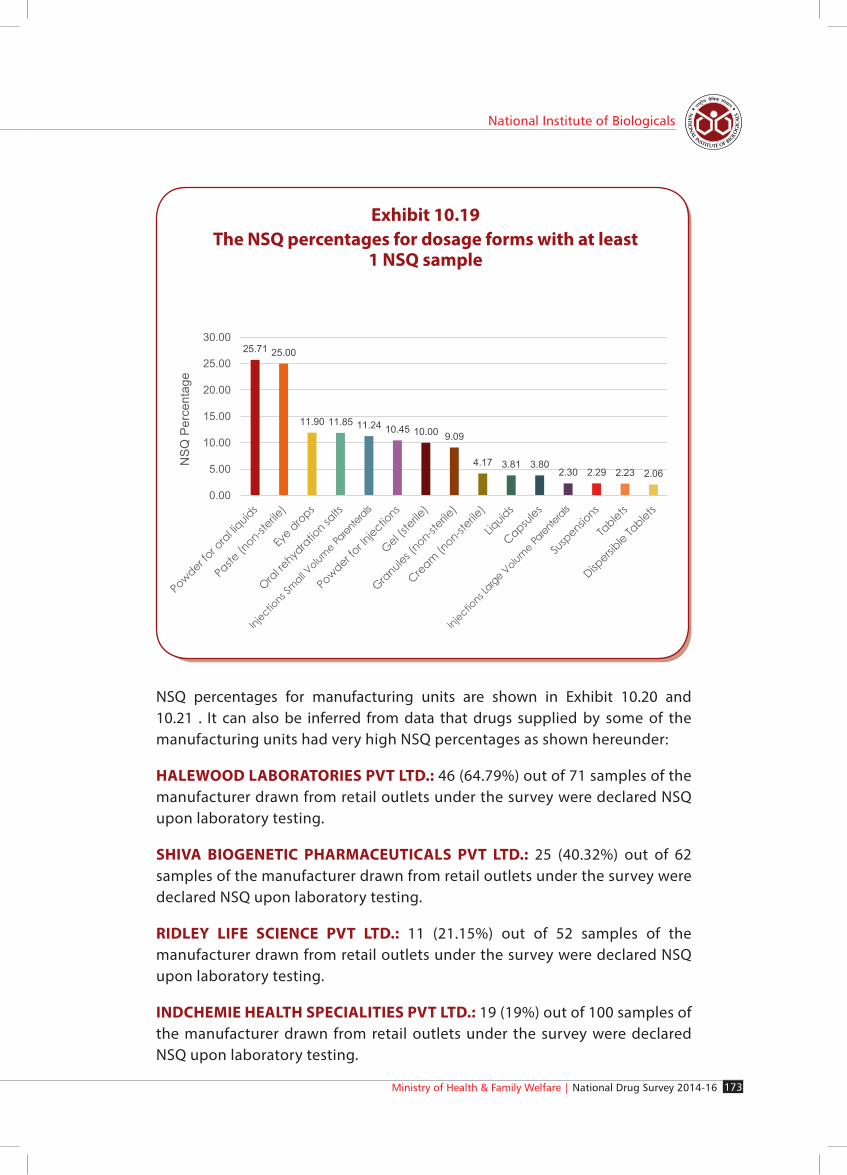
The NSQ percentages with respect to dosage forms (with at least 1 NSQ samples) from retail outlets are shown in Exhibit 10.19. Again it can be inferred that NSQ percentage for some dosage forms were generally very high, as shown hereunder:
Powder for oral liquids: 18 (25.71%) out of 70 samples drawn from retail outlets under the survey were declared NSQ upon laboratory testing.
Paste (non-sterile): 2 (25%) out of 8 samples drawn from retail outlets under the survey were declared NSQ upon laboratory testing.
Eye Drops: 5 (11.90%) out of 42 samples drawn from retail outlets under the survey were declared NSQ upon laboratory testing.
Exhibit 10.18Molecules with more than 3% NSQ samples
(total samples ≥ 50)
l Oral Rehydration Salts: 94 (11.85%) out of 793 samples drawn from retail outlets under the survey were declared NSQ upon laboratory testing.
Ministry of Health & Family Welfare | National Drug Survey 2014-16 173
National Institute of Biologicals
Exhibit 10.19The NSQ percentages for dosage forms with at least
1 NSQ sample
NSQ percentages for manufacturing units are shown in Exhibit 10.20 and 10.21 . It can also be inferred from data that drugs supplied by some of the manufacturing units had very high NSQ percentages as shown hereunder:
HALEWOOD LABORATORIES PVT LTD.: 46 (64.79%) out of 71 samples of the manufacturer drawn from retail outlets under the survey were declared NSQ upon laboratory testing.
SHIVA BIOGENETIC PHARMACEUTICALS PVT LTD.: 25 (40.32%) out of 62 samples of the manufacturer drawn from retail outlets under the survey were declared NSQ upon laboratory testing.
RIDLEY LIFE SCIENCE PVT LTD.: 11 (21.15%) out of 52 samples of the manufacturer drawn from retail outlets under the survey were declared NSQ upon laboratory testing.
INDCHEMIE HEALTH SPECIALITIES PVT LTD.: 19 (19%) out of 100 samples of the manufacturer drawn from retail outlets under the survey were declared NSQ upon laboratory testing.
10.19
Parente
rals
Parente
rals
Large

Ministry of Health & Family Welfare | National Drug Survey 2014-16174
Survey Results and Analysis
Exhibit 10.20Manufacturing units with sample size more than 50 and NSQ
Percentage above retail average of 3.00%
S.
No.Manufacturing Unit State
No. of
samples
No. of NSQ
Samples
%
NSQ
1 HALEWOOD LABORATORIES PVT
LTD
GUJARAT 71 46 64.79
2 SHIVA BIOGENETIC
PHARMACEUTICALS PVT LTD
HIMACHAL PRADESH 62 25 40.32
3 RIDLEY LIFE SCIENCE PVT LTD DELHI 52 11 21.15
4 INDCHEMIE HEALTH
SPECIALITIES PVT LTD
SIKKIM 100 19 19.00
5 NOEL PHARMA INDIA PVT LTD HIMACHAL PRADESH 73 12 16.44
6 SCOTT EDIL PHAMACIA LTD HIMACHAL PRADESH 127 20 15.75
7 ZEE LABORATORIES LTD HIMACHAL PRADESH 56 8 14.29
8 CRESCENT THERAPEUTICS LTD HIMACHAL PRADESH 100 13 13.00
9 LABORATE PHARMACEUTICALS
INDIA LTD
HIMACHAL PRADESH 85 10 11.76
10 NITIN LIFESCIENCES LTD HARYANA 61 6 9.84
11 R.K. LABORATORIES PVT LTD HIMACHAL PRADESH 52 5 9.62
12 BIOCHEM PHARMACEUTICALS
INDUSTRIES LTD
DAMAN AND DIU 67 5 7.46
13 SKYMAP PHARMACEUTICALS
LTD
UTTARAKHAND 84 5 5.95
14 G S PHARMACEUTICALS PVT LTD UTTARAKHAND 79 4 5.06
15 INNOVA CAPTAB PVT LTD HIMACHAL PRADESH 67 3 4.48
16 ALEMBIC PHARMACEUTICALS
LTD
HIMACHAL PRADESH 231 9 3.90
17 CIPLA LTD DAMAN AND DIU 114 4 3.51
18 PARENTERAL DRUGS INDIA LTD HIMACHAL PRADESH 122 4 3.28

Ministry of Health & Family Welfare | National Drug Survey 2014-16 175
National Institute of Biologicals
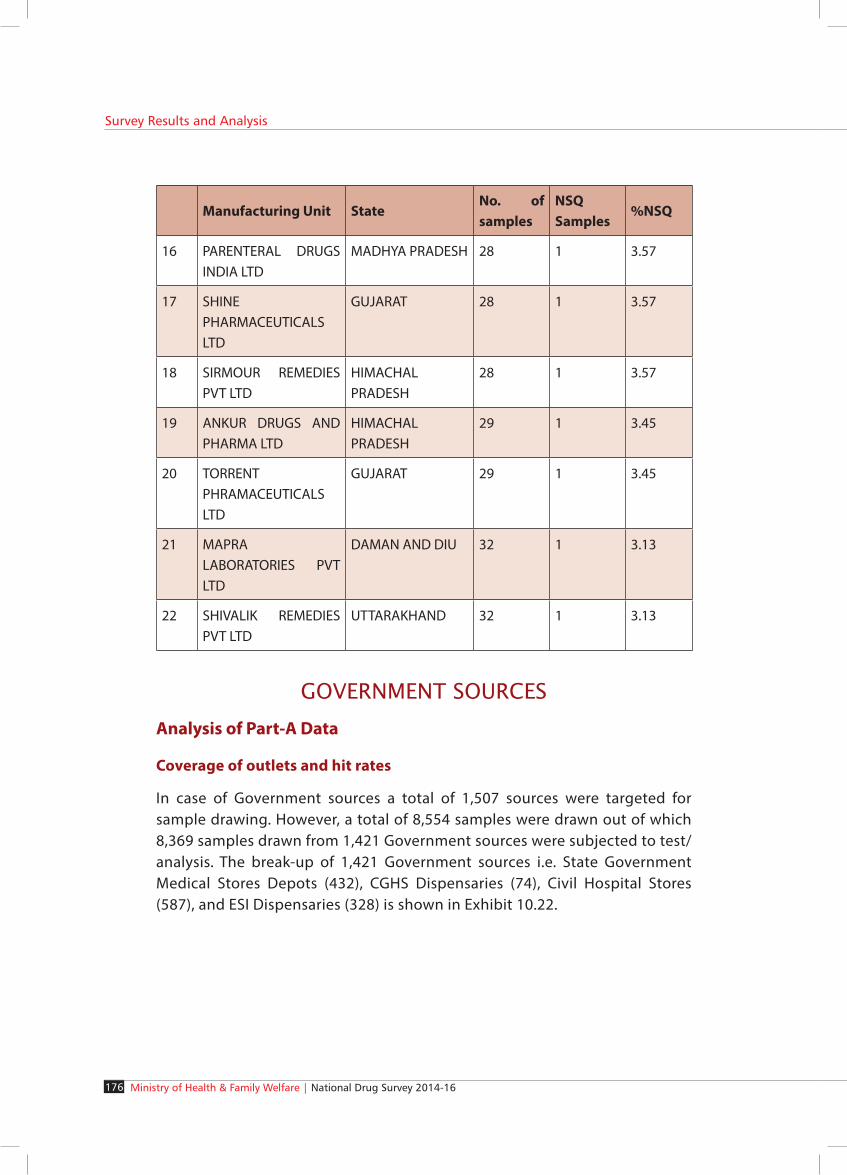
Fig 10.21Manufacturing units with sample size between 25-49 and NSQ
Percentage above retail average of 3.00%
Manufacturing Unit StateNo. of
samplesNSQ
Samples%NSQ
1 ACME DIET CARE PVT LTD
GUJARAT 32 29 90.63
2 VINTOCHEM PHARMACEUTICALS
MADHYA PRADESH 35 21 60.00
3 PFIZER LIMITED MAHARASHTRA 46 26 56.52
4 KORTEN PHAMACEUTICALS PVT LTD
MAHARASHTRA 29 10 34.48
5 EG PHARMACEUTICALS
HIMACHAL PRADESH
27 5 18.52
6 SAITECH MEDICARE PVT LTD
HIMACHAL PRADESH
31 4 12.90
7 TIRUPATI MEDICARE LTD
HIMACHAL PRADESH
32 4 12.50
8 BIOGENETIC DRUGS PVT LTD
HIMACHAL PRADESH
36 3 8.33
9 COTEC HEALTHCARE PVT LTD
UTTARAKHAND 25 2 8.00
10 PURE & CARE HEALTHCARE PVT LTD
UTTARAKHAND 38 3 7.89
11 BRD MADILABS HIMACHAL PRADESH
27 2 7.41
12 MEPROMAX LIFESCIENCES PVT LTD
UTTARAKHAND 30 2 6.67
13 SUN PHARMA LABORATORIES LTD
GUJARAT 30 2 6.67
14 NEON LABORATORIES LTD
MAHARASHTRA 42 2 4.76
15 PREET REMEDIES PVT LTD
HIMACHAL PRADESH
47 2 4.26
Ministry of Health & Family Welfare | National Drug Survey 2014-16176
Survey Results and Analysis
Manufacturing Unit StateNo. of samples
NSQ Samples
%NSQ
16 PARENTERAL DRUGS INDIA LTD
MADHYA PRADESH 28 1 3.57
17 SHINE PHARMACEUTICALS LTD
GUJARAT 28 1 3.57
18 SIRMOUR REMEDIES PVT LTD
HIMACHAL PRADESH
28 1 3.57
19 ANKUR DRUGS AND PHARMA LTD
HIMACHAL PRADESH
29 1 3.45
20 TORRENT PHRAMACEUTICALS LTD
GUJARAT 29 1 3.45
21 MAPRA LABORATORIES PVT LTD
DAMAN AND DIU 32 1 3.13
22 SHIVALIK REMEDIES PVT LTD
UTTARAKHAND 32 1 3.13
GOVERNMENT SOURCESAnalysis of Part-A Data
Coverage of outlets and hit rates
In case of Government sources a total of 1,507 sources were targeted for sample drawing. However, a total of 8,554 samples were drawn out of which 8,369 samples drawn from 1,421 Government sources were subjected to test/analysis. The break-up of 1,421 Government sources i.e. State Government Medical Stores Depots (432), CGHS Dispensaries (74), Civil Hospital Stores (587), and ESI Dispensaries (328) is shown in Exhibit 10.22.

Ministry of Health & Family Welfare | National Drug Survey 2014-16 177
National Institute of Biologicals
The state wise break-up along with particulars of number of sources from which samples were drawn, the number and percentage of assigned ones in them, hit rate, the number of SDOs involved in the drawl of samples, are given in Exhibit 10.23. Samples were collected from 619 districts. The distribution of number of sampled Government sources per district is presented in Exhibit 10.24. The overall hit rate achieved for Government sources was 92.4%.
Exhibit 10.25 presents the location type wise distribution of Government sources. 44.2% percent of the sources were from municipal towns, 18.5% were from villages and 17.3% were from taluk headquarters. Hence, in case of Government sources 35.8% of the samples were drawn from rural areas.
Exhibit 10.22Composition of Government sources
10.22
(432),
(587),
(74),
(328),

Ministry of Health & Family Welfare | National Drug Survey 2014-16178
Survey Results and Analysis
Exhibit 10.23State wise break up of Govt. Sources
State sources in Population
No. of Outlets
Sampled
Assigned Hit Rate
Number of SDOs
Andaman and Nicobar Islands
2 2 2 100.0 1
Andhra Pradesh 1461 16 15 93.8 12
Arunachal Pradesh 19 18 13 72.2 4
Assam 65 48 44 91.7 16
Bihar 709 41 37 90.2 25
Chandigarh 8 1 1 100.0 1
Chattisgarh 323 47 38 80.9 17
Dadra and Nagar Haveli 2 1 1 100.0 1
Daman and Diu 3 2 2 100.0 1
Delhi 132 7 7 100.0 2
Goa 11 2 2 100.0 2
Gujarat 161 62 57 91.9 30
Haryana 132 34 32 94.1 19
Himachal Pradesh 53 18 18 100.0 9
Jammu and Kashmir 21 34 34 100.0 20
Jharkhand 22 36 29 80.6 19
Karnataka 181 68 57 83.8 33
Kerala 1438 159 158 99.4 31
Lakshadweep 1 1 1 100.0 1
Madhya Pradesh 50 96 94 97.9 31
Maharashtra 236 75 70 93.3 35
Manipur 7 23 23 100.0 4
Meghalaya 11 12 12 100.0 6
Mizoram 9 15 15 100.0 7
Nagaland 22 18 18 100.0 6
Orissa 237 44 40 90.9 29

Ministry of Health & Family Welfare | National Drug Survey 2014-16 179
National Institute of Biologicals
State sources in Population
No. of Outlets
Sampled
Assigned Hit Rate
Number of SDOs
Puducherry 79 7 6 85.7 4
Punjab 169 62 58 93.5 22
Rajasthan 737 78 65 83.3 29
Sikkim 6 4 4 100.0 2
Tamilnadu 1391 98 92 93.9 34
Telangana 900 28 19 67.9 11
Tripura 19 16 16 100.0 4
Uttar Pradesh 305 188 175 93.1 70
Uttarakhand 10 22 20 90.9 4
West Bengal 1623 38 38 100.0 19
Total 10555 1421 1313 92.4 560
Exhibit 10.24Distribution of number of sampled Government sources
in districts
No. of
sources
1 2 3 4 5 6 8 9 11 12 13 14 15 16 20 Total
No. of
Districts
205 246 105 36 5 6 1 3 1 4 1 1 1 3 1 619
Percent 33.1 39.7 17 5.8 0.8 1 0.2 0.5 0.2 0.6 0.2 0.2 0.2 0.5 0.2 100

Ministry of Health & Family Welfare | National Drug Survey 2014-16180
Survey Results and Analysis
Exhibit 10.25Location type wise distribution of Government sources
Six samples were targeted from each Government source. Out of 1421 Government sources 6 samples were drawn from each of 1297 (91.3%) of the Government sources, 5 samples were drawn from each of 104 (7.3%) of the Government. sources and 4 or fewer samples were drawn from remaining 20 (1.4%) of Government sources. The distribution is shown in Exhibit 10.26.
Exhibit 10.26Distribution of number of samples drawn from Government
source
No. Samples 1 2 3 4 5 6 Total
No. sources 3 1 2 14 104 1297 1421
Percentage 0.2 0.1 0.1 1 7.3 91.3 100

Ministry of Health & Family Welfare | National Drug Survey 2014-16 181
National Institute of Biologicals
Analysis of Part-B Data of Government sources
Coverage of Molecules
Total 8,369 samples from 158 molecules were covered from Government sources under the survey. Exhibit 10.27 shows the list of molecules for which samples were drawn from Government sources under the survey. Fifty-six molecules contributed to 80% of the samples drawn from Government sources. Paracetamol was the most frequently sampled molecule. Exhibit 10.28 shows molecule inclusion chances from Government sources.
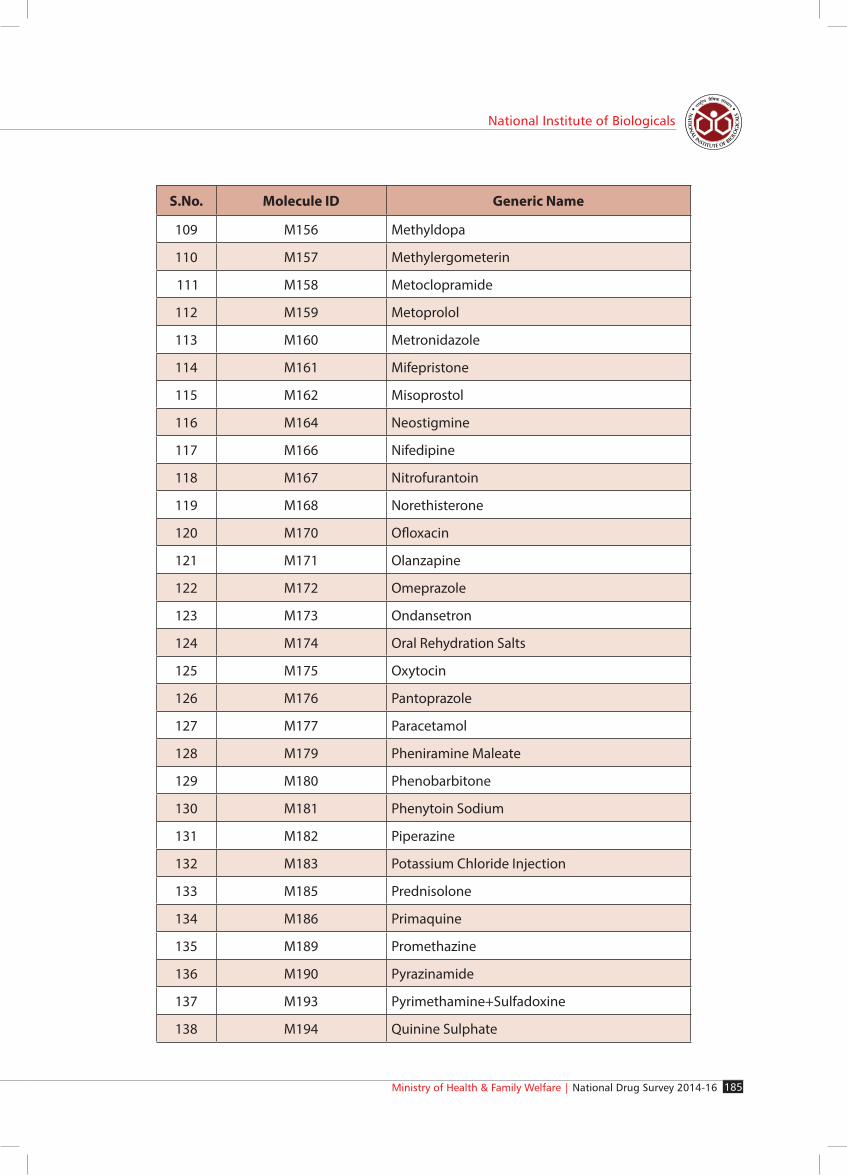
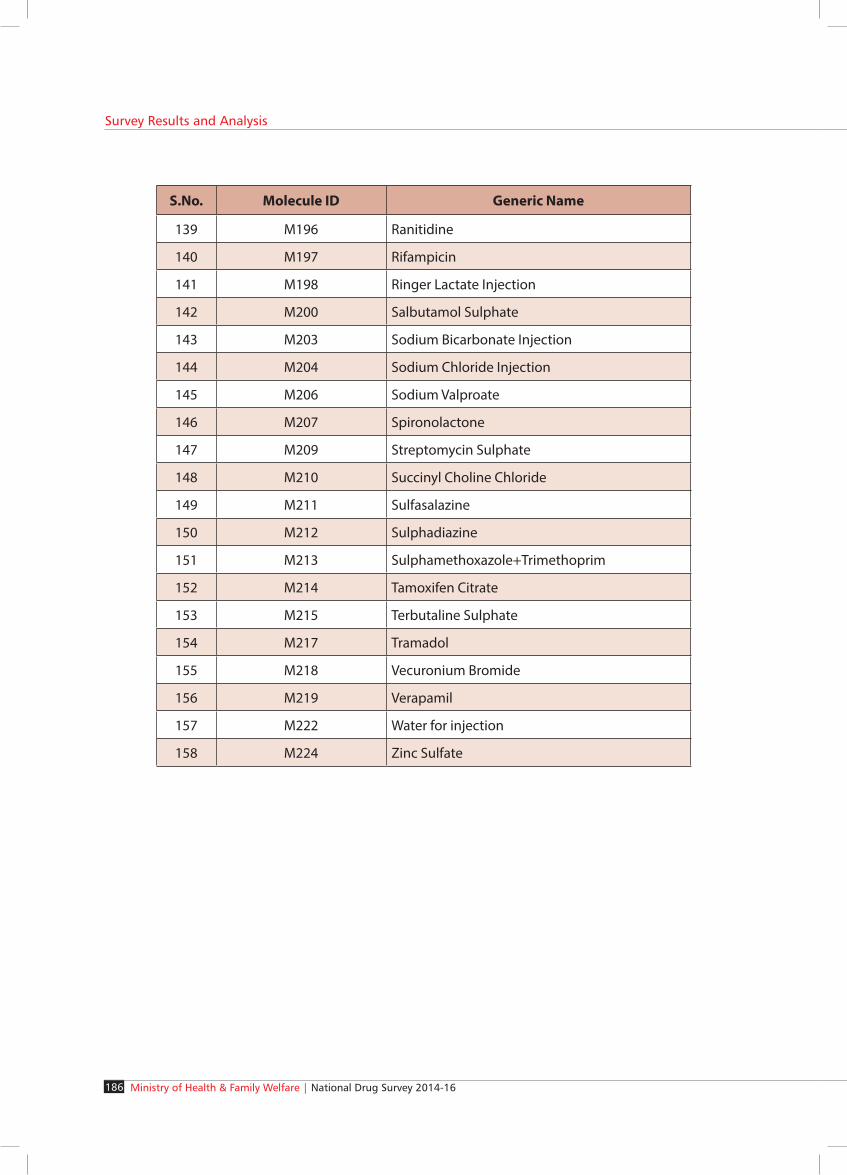
Exhibit 10.27lists the molecule sampled from Government sources
S.No. Molecule ID Generic Name
1 M001 25% Dextrose
2 M002 5-Amino Salicylic Acid (5-ASA)
3 M006 Acetyl Salicylic Acid
4 M007 Acyclovir
5 M008 Adrenaline Bitartrate
6 M009 Albendazole
7 M010 Allopurinol
8 M011 Alprazolam
9 M012 Aluminium Hydroxide+Magnesium Hydroxide
10 M013 Amikacin
11 M014 Amiodarone
12 M015 Amitriptyline
13 M016 Amlodipine
14 M017 Amlodipine+Losartan Potassium
15 M018 Amoxicillin
16 M019 Amoxicillin+Clavulinic Acid
17 M020 Ampicillin
18 M023 Atenolol
19 M024 Atorvastatin

Ministry of Health & Family Welfare | National Drug Survey 2014-16182
Survey Results and Analysis
S.No. Molecule ID Generic Name
20 M025 Atracurium Besylate
21 M027 Azathioprine
22 M028 Azithromycin
23 M029 Beclomethasone Dipropionate
24 M030 Benzathine Benzylpenicillin
25 M031 Bisacodyl
26 M034 Carbamazepine
27 M035 Carbidopa+Levodopa
28 M036 Carbimazole
29 M037 Cefixime
30 M038 Cefotaxime
31 M039 Ceftazidime
32 M040 Ceftriaxone
33 M041 Cephalexin
34 M042 Cetrizine
35 M044 Chloroquine Phosphate
36 M045 Chlorpheniramine Maleate
37 M046 Chlorpromazine Hydrochloride
38 M048 Ciprofloxacin Hydrochlorid
39 M051 Clindamycin
40 M052 Clofazimine
41 M053 Clomiphene Citrate
42 M054 Clopidogrel
43 M055 Clotrimazole
44 M056 Cloxacillin
45 M060 Compound Sodium Chloride+Dextrose Injection
46 M062 Concentrated Vitamin A+D Solution
47 M063 Cyclophosphamide
48 M064 Danazol
49 M067 Dexamethasone

Ministry of Health & Family Welfare | National Drug Survey 2014-16 183
National Institute of Biologicals
S.No. Molecule ID Generic Name
50 M068 Dexchlorpheniramine Maleate
51 M069 Dextromethorphan
52 M070 Dextrose Injection
53 M074 Dextrose+Sodium Chloride Injection
54 M073 Dextrose+Sodium Chloride Injection (5% and 0.9%)
55 M075 Diazepam
56 M076 Diclofenac
57 M077 Dicyclomine Hydrochloride
58 M079 Diethylcarbamazine Citrate
59 M080 Digoxin
60 M082 Diltiazem
61 M083 Dobutamine
62 M084 Domperidone
63 M085 Dopamine Hydrochloride
64 M086 Doxycycline
65 M087 Efavirenz
66 M091 Enalapril Maleate
67 M092 Erythromycin Estolate
68 M093 Ethambutol
69 M097 Ethinylestradiol
70 M098 Ethinylestradiol+Levonorgesterol
71 M100 Etophylline+Theophylline Prolonged-release
72 M102 Famotidine
73 M103 Fluconazole
74 M104 Fluoxetine Hydrochloride
75 M106 Folic Acid+Iron
76 M108 Furosemide
77 M109 Gentamicin
78 M110 Glibenclamide

Ministry of Health & Family Welfare | National Drug Survey 2014-16184
Survey Results and Analysis
S.No. Molecule ID Generic Name
79 M111 Glyceryl Trinitrate
80 M112 Griseofulvin
81 M113 Haloperidol
82 M115 Hydrochlorothiazide+Losartan Potassium
83 M116 Hydrochlorothiazide+Ramipril
84 M118 Hydrochlorthiazide
85 M120 Hydrocortisone Sodium Succinate
86 M122 Hyoscine Butyl Bromide
87 M123 Ibuprofen
88 M125 Imipramine
89 M127 Iodine
90 M128 Isoniazid
91 M132 Isosorbide Mononitrate/Dinitrate
92 M134 Lamivudine+Nevirapine+Stavudine
93 M135 Lamivudine+Nevirapine+Zidovudine
94 M136 Lamivudine+Stavudine
95 M138 Lamivudine+Zidovudine
96 M141 Lignocaine Hydrochloride
97 M140 Lignocaine+Adrenaline Injection
98 M142 Lithium Carbonate
99 M143 Lopinavir+Ritonavir
100 M144 Lorazepam
101 M145 Losartan Potassium
102 M146 Magnesium Sulphate
103 M147 Mannitol
104 M148 Medroxy Progesterone Acetate
105 M149 Mefloquine
106 M153 Metformin
107 M154 Methotrexate
108 M155 Methyl Prednisolone
Ministry of Health & Family Welfare | National Drug Survey 2014-16 185
National Institute of Biologicals
S.No. Molecule ID Generic Name
109 M156 Methyldopa
110 M157 Methylergometerin
111 M158 Metoclopramide
112 M159 Metoprolol
113 M160 Metronidazole
114 M161 Mifepristone
115 M162 Misoprostol
116 M164 Neostigmine
117 M166 Nifedipine
118 M167 Nitrofurantoin
119 M168 Norethisterone
120 M170 Ofloxacin
121 M171 Olanzapine
122 M172 Omeprazole
123 M173 Ondansetron
124 M174 Oral Rehydration Salts
125 M175 Oxytocin
126 M176 Pantoprazole
127 M177 Paracetamol
128 M179 Pheniramine Maleate
129 M180 Phenobarbitone
130 M181 Phenytoin Sodium
131 M182 Piperazine
132 M183 Potassium Chloride Injection
133 M185 Prednisolone
134 M186 Primaquine
135 M189 Promethazine
136 M190 Pyrazinamide
137 M193 Pyrimethamine+Sulfadoxine
138 M194 Quinine Sulphate
Ministry of Health & Family Welfare | National Drug Survey 2014-16186
Survey Results and Analysis
S.No. Molecule ID Generic Name
139 M196 Ranitidine
140 M197 Rifampicin
141 M198 Ringer Lactate Injection
142 M200 Salbutamol Sulphate
143 M203 Sodium Bicarbonate Injection
144 M204 Sodium Chloride Injection
145 M206 Sodium Valproate
146 M207 Spironolactone
147 M209 Streptomycin Sulphate
148 M210 Succinyl Choline Chloride
149 M211 Sulfasalazine
150 M212 Sulphadiazine
151 M213 Sulphamethoxazole+Trimethoprim
152 M214 Tamoxifen Citrate
153 M215 Terbutaline Sulphate
154 M217 Tramadol
155 M218 Vecuronium Bromide
156 M219 Verapamil
157 M222 Water for injection
158 M224 Zinc Sulfate

Ministry of Health & Family Welfare | National Drug Survey 2014-16 187
National Institute of Biologicals
Exhibit 10.28Molecule inclusion chances for Government sources
S.
No.
Molecule
ID
Generic
Name
Count Inclusion
Chances
S.
No.
Molecule
ID
Generic
Name
Count Inclusion
Chances
1 M177 Paracetamol 316 3.78 1 M134 Lamivudine
+
Nevirapine
+ Stavudine
1 0.01
2 M076 Diclofenac 266 3.18 2 M135 Lamivudine
+
Nevirapine
+
Zidovudine
1 0.01
3 M048 Ciprofloxacin
Hydrochlorid
252 3.01 3 M136 Lamivudine
+ Stavudine
1 0.01
4 M018 Amoxicillin 243 2.9 4 M138 Lamivudine
+
Zidovudine
1 0.01
5 M160 Metro-
nidazole
219 2.62 5 M143 Lopinavir +
Ritonavir
1 0.01
Dosage Forms
Like in retail outlets, majority of the samples drawn from Government sources were tablets. Exhibit 10.29 gives the break-up of dosage forms.

Ministry of Health & Family Welfare | National Drug Survey 2014-16188
Survey Results and Analysis
Exhibit 10.29Distribution of dosage forms in the sampled formulations
S.No. Dosage Forms Number of Samples
Percent
1 Tablets 5676 67.82
2 Injections Small Volume Parenterals (SVP) 851 10.17
3 Capsules 698 8.34
4 Injections Large Volume Parenterals (LVP) 260 3.11
5 Suspensions 210 2.51
6 Oral rehydration salts 198 2.37
7 Powder for Injections 160 1.91
8 Liquids 120 1.43
9 Cream (non-sterile) 68 0.81
10 Gel (non-sterile) 30 0.36
11 Eye drops 25 0.3
12 Ointment (Non-sterile) 22 0.26
13 Gel (sterile) 20 0.24
14 Powder for oral liquids 12 0.14
15 Suppositories 7 0.08
16 Cream (sterile) 3 0.04
17 Ear drops 3 0.04
18 Ointment (sterile) 3 0.04
19 Pessaries 2 0.02
20 Dispersible Tablets 1 0.01
Expired Formulations
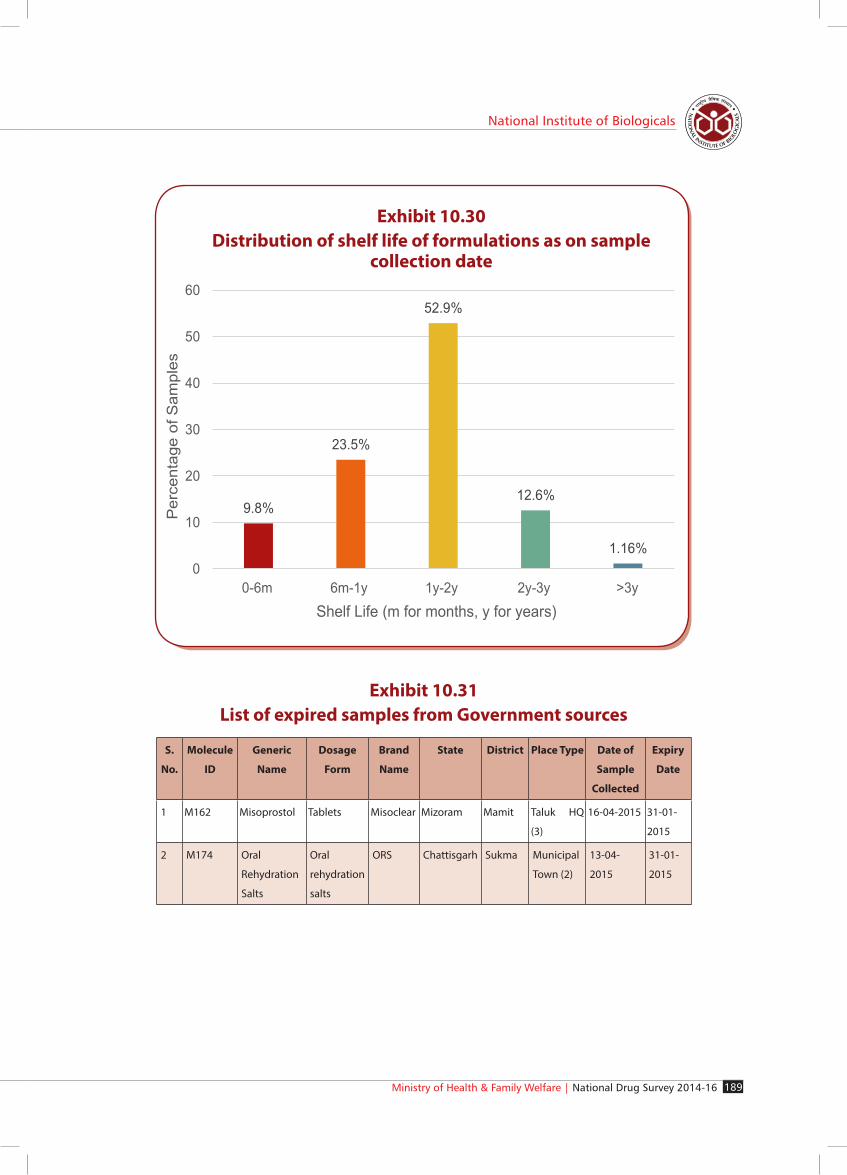
Among the 8,369 samples drawn from Government sources 90.16% of them had remaining shelf life of more than 6 months on the date of drawing of samples. The histogram of the remaining shelf life is shown Exhibit 10.30. Only two samples drawn under the survey were already date expired. The list of the 2 samples along with dates of manufacturing, date of expiry and date of drawing of samples are presented in Exhibit 10.31.
Ministry of Health & Family Welfare | National Drug Survey 2014-16 189
National Institute of Biologicals
Exhibit 10.30Distribution of shelf life of formulations as on sample
collection date
Exhibit 10.31List of expired samples from Government sources
S.
No.
Molecule
ID
Generic
Name
Dosage
Form
Brand
Name
State District Place Type Date of
Sample
Collected
Expiry
Date
1 M162 Misoprostol Tablets Misoclear Mizoram Mamit Taluk HQ
(3)
16-04-2015 31-01-
2015
2 M174 Oral
Rehydration
Salts
Oral
rehydration
salts
ORS Chattisgarh Sukma Municipal
Town (2)
13-04-
2015
31-01-
2015

Ministry of Health & Family Welfare | National Drug Survey 2014-16190
Survey Results and Analysis
Lab Test Results and NSQ Proportion
The samples drawn under survey were subjected to test/analysis at 10 Central/State Government Drug Testing Laboratories. The number of lab tests performed were 69. Not all the 69 tests were applicable to all formulations. Samples from Government sources failed in 27 out of these 69 tests. Out of the 8,369 samples tested from Government sources, 839 samples failed in one or more of the 27 tests and were declared as NSQ. The list of these 27 tests and the number of tests not complied are summarized in Exhibit 10.32 and 10.33.
Exhibit 10.32Contribution of tests to failure of samples from Government
source
S. No. Test performedNo. of test not
compliedPercentage non-
compliance
1 Assay 282 23.96
2 Dissolution 261 22.18
3 Related Substances 162 13.76
4 Description 109 9.26
5 Particulate matter 106 9.01
6 Uniformity Of Content 51 4.33
7 Clarity Of Solution 39 3.31
8 DisintegrationTest 35 2.97
9 Uniformity Of Dispersion 27 2.29
10 pH 24 2.04
11 Bacterial Endotoxin Test 18 1.53
12 Uniformity Of Filled Weight 10 0.85
13 Extractable Volume 10 0.85
14 Sterility 7 0.59
15 Uniformity Of Weight 6 0.51
16 Other test 6 0.51
17 Seal test 5 0.42
18 Identification HPLC 4 0.34

Ministry of Health & Family Welfare | National Drug Survey 2014-16 191
National Institute of Biologicals
S. No. Test performedNo. of test not
compliedPercentage non-
compliance
19 Loss on Drying 3 0.25
20 Particulate contamination 3 0.25
21 Free Salicylic Acid 2 0.17
22 Water 2 0.17
23 Identification by IR 1 0.08
24 Identification by TLC 1 0.08
25 Appearance of Solution 1 0.08
26 2-Chlorotritanol 1 0.08
27 Uniformity of dosage units 1 0.08
28 Total 1177 100.00
Exhibit 10.33Contribution of tests to failures of samples from
Government sources
Ministry of Health & Family Welfare | National Drug Survey 2014-16192
Survey Results and Analysis
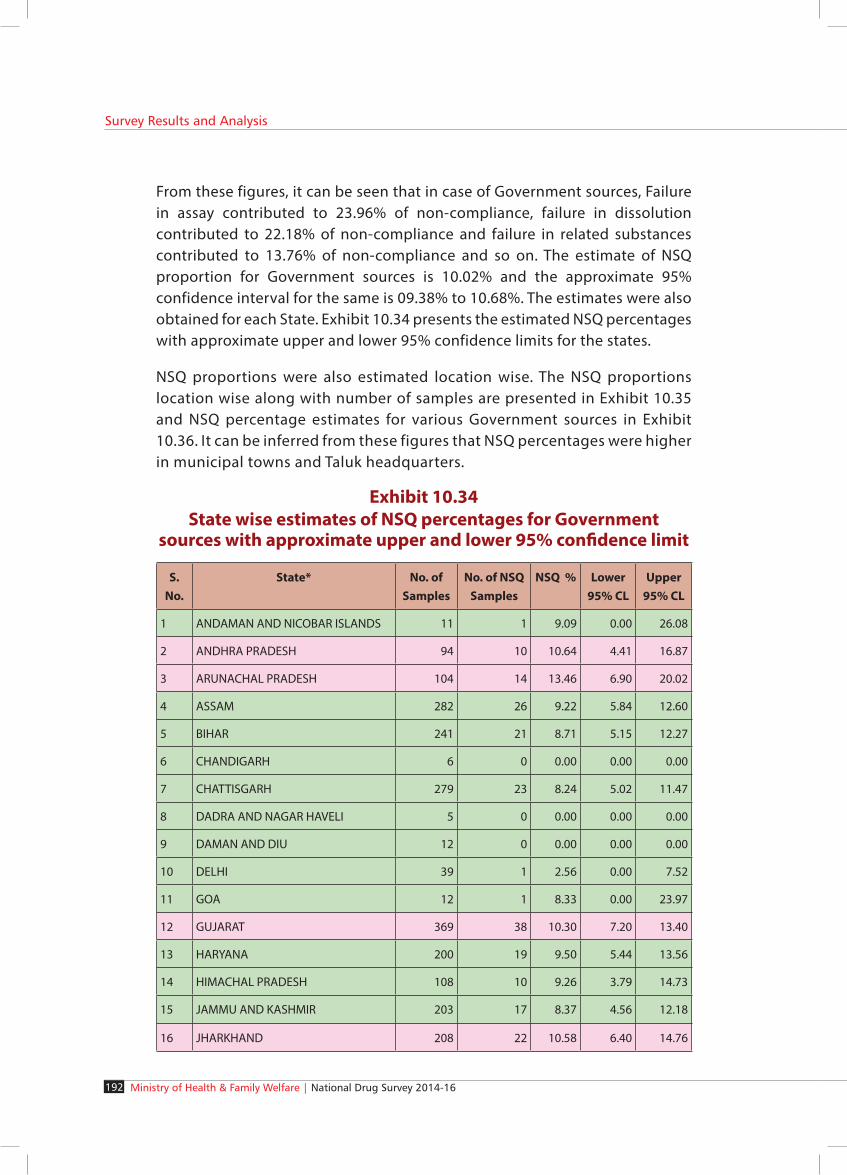
From these figures, it can be seen that in case of Government sources, Failure in assay contributed to 23.96% of non-compliance, failure in dissolution contributed to 22.18% of non-compliance and failure in related substances contributed to 13.76% of non-compliance and so on. The estimate of NSQ proportion for Government sources is 10.02% and the approximate 95% confidence interval for the same is 09.38% to 10.68%. The estimates were also obtained for each State. Exhibit 10.34 presents the estimated NSQ percentages with approximate upper and lower 95% confidence limits for the states.
NSQ proportions were also estimated location wise. The NSQ proportions location wise along with number of samples are presented in Exhibit 10.35 and NSQ percentage estimates for various Government sources in Exhibit 10.36. It can be inferred from these figures that NSQ percentages were higher in municipal towns and Taluk headquarters.
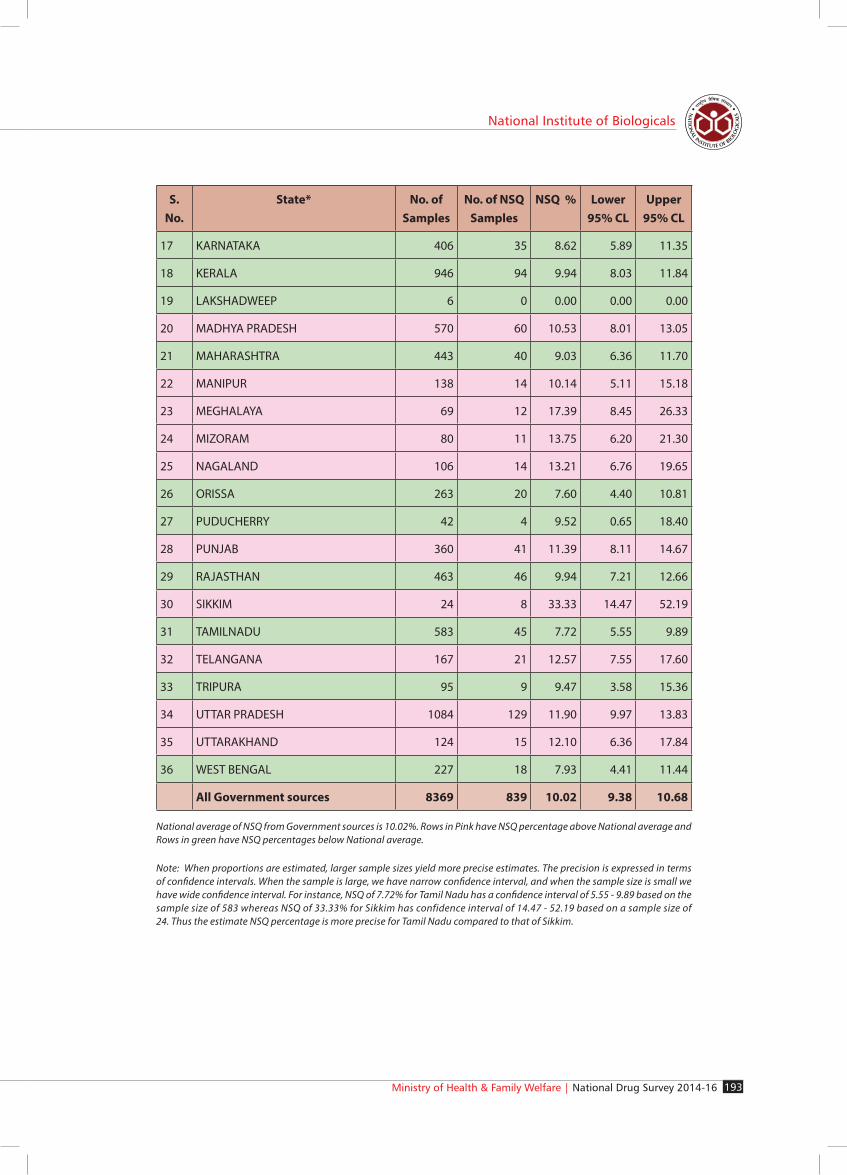
Exhibit 10.34State wise estimates of NSQ percentages for Government
sources with approximate upper and lower 95% confidence limit
S. No.
State* No. of Samples
No. of NSQ Samples
NSQ % Lower 95% CL
Upper 95% CL
1 ANDAMAN AND NICOBAR ISLANDS 11 1 9.09 0.00 26.08
2 ANDHRA PRADESH 94 10 10.64 4.41 16.87
3 ARUNACHAL PRADESH 104 14 13.46 6.90 20.02
4 ASSAM 282 26 9.22 5.84 12.60
5 BIHAR 241 21 8.71 5.15 12.27
6 CHANDIGARH 6 0 0.00 0.00 0.00
7 CHATTISGARH 279 23 8.24 5.02 11.47
8 DADRA AND NAGAR HAVELI 5 0 0.00 0.00 0.00
9 DAMAN AND DIU 12 0 0.00 0.00 0.00
10 DELHI 39 1 2.56 0.00 7.52
11 GOA 12 1 8.33 0.00 23.97
12 GUJARAT 369 38 10.30 7.20 13.40
13 HARYANA 200 19 9.50 5.44 13.56
14 HIMACHAL PRADESH 108 10 9.26 3.79 14.73
15 JAMMU AND KASHMIR 203 17 8.37 4.56 12.18
16 JHARKHAND 208 22 10.58 6.40 14.76
Ministry of Health & Family Welfare | National Drug Survey 2014-16 193
National Institute of Biologicals
S. No.
State* No. of Samples
No. of NSQ Samples
NSQ % Lower 95% CL
Upper 95% CL
17 KARNATAKA 406 35 8.62 5.89 11.35
18 KERALA 946 94 9.94 8.03 11.84
19 LAKSHADWEEP 6 0 0.00 0.00 0.00
20 MADHYA PRADESH 570 60 10.53 8.01 13.05
21 MAHARASHTRA 443 40 9.03 6.36 11.70
22 MANIPUR 138 14 10.14 5.11 15.18
23 MEGHALAYA 69 12 17.39 8.45 26.33
24 MIZORAM 80 11 13.75 6.20 21.30
25 NAGALAND 106 14 13.21 6.76 19.65
26 ORISSA 263 20 7.60 4.40 10.81
27 PUDUCHERRY 42 4 9.52 0.65 18.40
28 PUNJAB 360 41 11.39 8.11 14.67
29 RAJASTHAN 463 46 9.94 7.21 12.66
30 SIKKIM 24 8 33.33 14.47 52.19
31 TAMILNADU 583 45 7.72 5.55 9.89
32 TELANGANA 167 21 12.57 7.55 17.60
33 TRIPURA 95 9 9.47 3.58 15.36
34 UTTAR PRADESH 1084 129 11.90 9.97 13.83
35 UTTARAKHAND 124 15 12.10 6.36 17.84
36 WEST BENGAL 227 18 7.93 4.41 11.44
All Government sources 8369 839 10.02 9.38 10.68
National average of NSQ from Government sources is 10.02%. Rows in Pink have NSQ percentage above National average and Rows in green have NSQ percentages below National average.
Note: When proportions are estimated, larger sample sizes yield more precise estimates. The precision is expressed in terms of confidence intervals. When the sample is large, we have narrow confidence interval, and when the sample size is small we have wide confidence interval. For instance, NSQ of 7.72% for Tamil Nadu has a confidence interval of 5.55 - 9.89 based on the sample size of 583 whereas NSQ of 33.33% for Sikkim has confidence interval of 14.47 - 52.19 based on a sample size of 24. Thus the estimate NSQ percentage is more precise for Tamil Nadu compared to that of Sikkim.

Ministry of Health & Family Welfare | National Drug Survey 2014-16194
Survey Results and Analysis
Exhibit 10.35Location wise sample sizes and NSQ percentages from
Government sources
S.No. Location No. of sources
No. of samples NSQ%
1 Corporations 232 1366 8.57
2 Metropolitan Cities 52 299 7.36
3 Muncipial Towns 628 3695 10.96
4 Taluk Headquaters 246 1446 10.44
5 Villages 263 1563 9.21
Exhibit 10.36NSQ percentage estimates for Government sources
S.No. Government Sources No. of sources
Samples Collected
NSQ Samples
NSQ%
1 State Government Medical Store Depot
432 2557 267 10.44
2 CGHS Dispensary 74 438 18 4.11
3 Civil Hospital Store 587 3464 382 11.03
4 ESI Dispensary 328 1910 172 9.01
Total 1421 8369 839 10.02

Ministry of Health & Family Welfare | National Drug Survey 2014-16 195
National Institute of Biologicals
The NSQ percentages were also estimated for molecules with reasonable sample sizes from Government sources. These are shown in Exhibit 10.37. The figure shows that NSQ percentages were very high in Government sources. Few examples are hereunder:
l Bisacodyl: 44 (66.67%) out of 66 samples drawn from Government sources under the survey were declared NSQ upon laboratory testing.
l Zinc Sulphate: 38 (51.35%) out of 74 samples drawn from Government sources under the survey were declared NSQ upon laboratory testing.
l Amikacin: 26 (43.33%) out of 60 samples drawn from Government sources under the survey were declared NSQ upon laboratory testing.
l Oxytocin: 24 (41.38%) out of 58 samples drawn from Government sources under the survey were declared NSQ upon laboratory testing.
Exhibit 10.37Molecules with more than 10.02% NSQ samples
(total samples ≥ 50)
The NSQ percentages with respect to dosage forms (with at least 10 Government sources) are shown in Exhibit 10.38. Again it can be inferred that NSQ percentage for various dosage forms were generally very high as shown hereunder:

Ministry of Health & Family Welfare | National Drug Survey 2014-16196
Survey Results and Analysis
l Small Volume Parenterals: 171 (20.09%) out of 851 samples drawn from Government sources under the survey were declared NSQ upon laboratory testing.
l Powder for Injection: 24 (15%) out of 160 samples drawn from Government sources under the survey were declared NSQ upon laboratory testing.
l Tablets: 528 (9.30%) out of 5676 samples drawn from Government sources under the survey were declared NSQ upon laboratory testing.
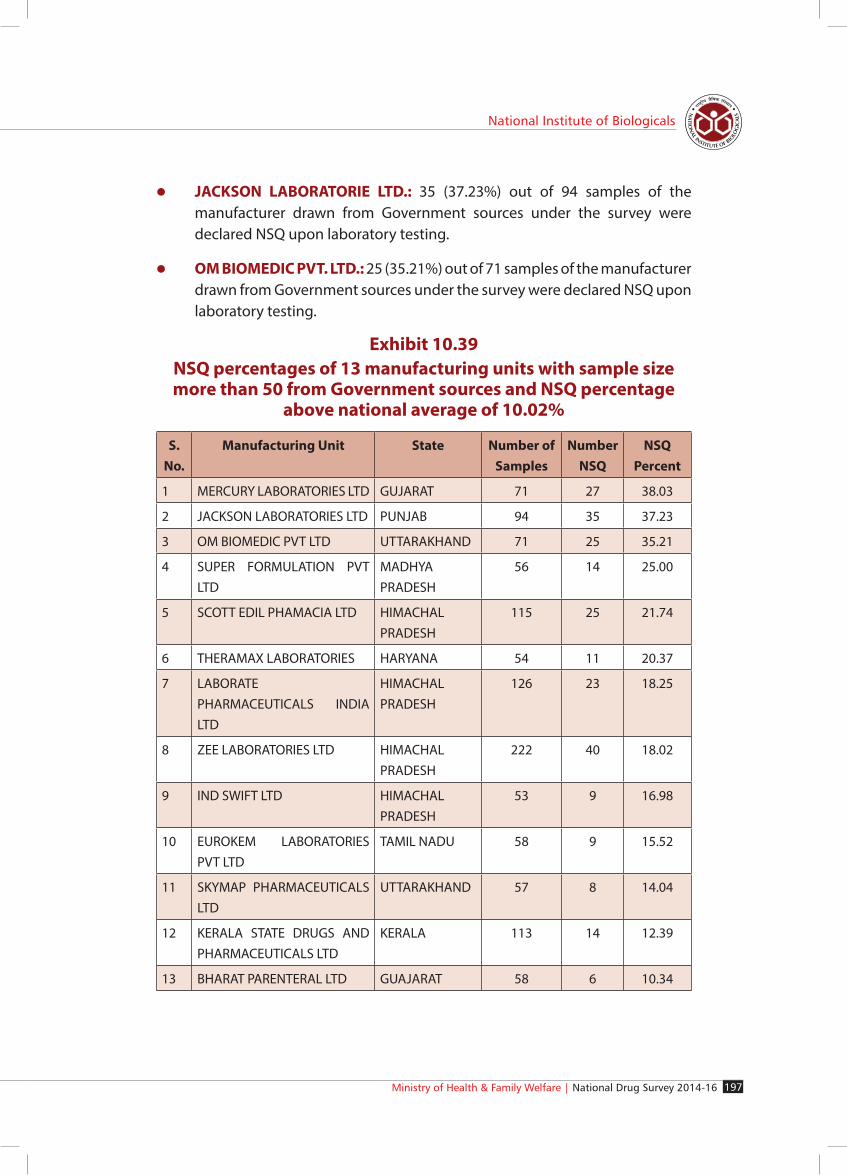
The 8369 samples drawn from Government sources were from 663 manufacturing units. Of these 14 manufacturing units contributed to 42.55% of the NSQ formulations from Government sources. NSQ percentages for manufacturing units are shown in Exhibit 10.39 and 10.40. It can also be inferred from data that drugs supplied by some of the manufacturing units had very high NSQ percentages as shown hereunder:
l MERCURY LABORATORIES LTD.: 27 (38.03%) out of 71 samples of the manufacturer drawn from Government sources under the survey were declared NSQ upon laboratory testing.
Exhibit 10.38NSQ percentages of dosage forms with at least 1 NSQ
sample
Ministry of Health & Family Welfare | National Drug Survey 2014-16 197
National Institute of Biologicals
l JACKSON LABORATORIE LTD.: 35 (37.23%) out of 94 samples of the manufacturer drawn from Government sources under the survey were declared NSQ upon laboratory testing.
l OM BIOMEDIC PVT. LTD.: 25 (35.21%) out of 71 samples of the manufacturer drawn from Government sources under the survey were declared NSQ upon laboratory testing.
Exhibit 10.39NSQ percentages of 13 manufacturing units with sample size more than 50 from Government sources and NSQ percentage
above national average of 10.02%
S. No.
Manufacturing Unit State Number of Samples
Number NSQ
NSQ Percent
1 MERCURY LABORATORIES LTD GUJARAT 71 27 38.03
2 JACKSON LABORATORIES LTD PUNJAB 94 35 37.23
3 OM BIOMEDIC PVT LTD UTTARAKHAND 71 25 35.21
4 SUPER FORMULATION PVT LTD
MADHYA PRADESH
56 14 25.00
5 SCOTT EDIL PHAMACIA LTD HIMACHAL PRADESH
115 25 21.74
6 THERAMAX LABORATORIES HARYANA 54 11 20.37
7 LABORATE PHARMACEUTICALS INDIA LTD
HIMACHAL PRADESH
126 23 18.25
8 ZEE LABORATORIES LTD HIMACHAL PRADESH
222 40 18.02
9 IND SWIFT LTD HIMACHAL PRADESH
53 9 16.98
10 EUROKEM LABORATORIES PVT LTD
TAMIL NADU 58 9 15.52
11 SKYMAP PHARMACEUTICALS LTD
UTTARAKHAND 57 8 14.04
12 KERALA STATE DRUGS AND PHARMACEUTICALS LTD
KERALA 113 14 12.39
13 BHARAT PARENTERAL LTD GUAJARAT 58 6 10.34

Ministry of Health & Family Welfare | National Drug Survey 2014-16198
Survey Results and Analysis
Exhibit 10.40Manufacturing units with sample size between 25-49 from Government sources and NSQ percentage above national
average of 10.02%
S. No.
Manufactuting Unit State No. of Samples
NSQ Samples
%NSQ
1 NORRIS MEDICINE LTD GUJARAT 31 14 45.16
2 NANDANI MEDICAL LABORATORIES PVT LTD
MADHYA PRADESH
42 12 28.57
3 MODERN LABORATORIES MADHYA PRADESH
47 13 27.66
4 C I LABORATORIES WEST BENGAL 43 8 18.60
5 RKG PHARMA PVT LTD HARYANA 48 8 16.67
6 ARVIND REMEDIES LTD TAMIL NADU 50 7 14.58
7 RHYDBURG PHARAMACUTICALS LTD
UTTARAKHAND 37 5 13.51
8 VITAL HEALTH CARE PVT LTD
MAHARASHTRA 43 5 11.63
9 DAFFODILLS PHARMACEUTICALS LTD
UTTAR PRADESH 38 4 10.53
Ports
For ports, it was decided to draw 3 samples from each consignment. In all, 4,987 samples were tested from 1,708 consignments. These samples were drawn from 57 molecules. The break-up of samples drawn from different ports is shown in Exhibit 10.41.

Ministry of Health & Family Welfare | National Drug Survey 2014-16 199
National Institute of Biologicals
Exhibit 10.41Number of samples from 8 Air/Sea Ports
S. No. Port Air Port Sea Port Total
1 Delhi 93 - 93
2 Ahmedabad 18 - 18
3 Mumbai 687 2682 3369
4 Chennai 68 1423 1491
5 Hyderabad 15 - 15
6 Kolkata 1 - 1
Total 882 4105 4987
Summary of the molecules sampled from Ports are given in Exhibit 10.42 and Exhibit 10.43.
Exhibit 10.42Molecules sampled from Ports

Ministry of Health & Family Welfare | National Drug Survey 2014-16200
Survey Results and Analysis
Exhibit 10.43Complete list of molecules sampled from Ports
S. No. Molecule ID Generic Name Frequency
1 M040 Ceftriaxone 1807
2 M028 Azithromycin 553
3 M170 Ofloxacin 274
4 M013 Amikacin 253
5 M197 Rifampicin 204
6 M209 Streptomycin Sulphate 186
7 M018 Amoxicillin 156
8 M160 Metronidazole 141
9 M185 Prednisolone 119
10 M147 Mannitol 116
11 M007 Acyclovir 102
12 M055 Clotrimazole 102
13 M019 Amoxicillin+Clavulinic acid 97
14 M048 Ciprofloxacin Hydrochlorid 75
15 M161 Mifepristone 70
16 M207 Spironolactone 64
17 M041 Cephalexin 55
18 M067 Dexamethasone 54
19 M086 Doxycycline 49
20 M155 Methyl Prednisolone 43
21 M148 Medroxy Progesterone Acetate 42
22 M132 Isosorbide Mononitrate/Dinitrate 36
23 M039 Ceftazidime 34
24 M051 Clindamycin 31
25 M162 Misoprostol 26
26 M030 Benzathine Benzylpenicillin 24
27 M177 Paracetamol 24
28 M123 Ibuprofen 21
29 M156 Methyldopa 21
30 M159 Metoprolol 21

Ministry of Health & Family Welfare | National Drug Survey 2014-16 201
National Institute of Biologicals
S. No. Molecule ID Generic Name Frequency
31 M212 Sulphadiazine 18
32 M169 Nystatin 16
33 M085 Dopamine Hydrochloride 15
34 M108 Furosemide 15
35 M112 Griseofulvin 12
36 M139 Levothyroxine 12
37 M206 Sodium Valproate 12
38 M101 Etoposide 11
39 M091 Enalapril Maleate 10
40 M025 Atracurium Besylate 9
41 M003 5-Fluorouracil 8
42 M152 Mesna 8
43 M120 Hydrocortisone Sodium Succinate
6
44 M133 Lamivudine 6
45 M014 Amiodarone 3
46 M031 Bisacodyl 3
47 M083 Dobutamine 3
48 M097 Ethinylestradiol 3
49 M124 Imatinib 3
50 M167 Nitrofurantoin 3
51 M066 Daunorubicin 2
52 M149 Mefloquine 2
53 M181 Phenytoin Sodium 2
54 M218 Vecuronium Bromide 2
55 M118 Hydrochlorthiazide 1
56 M122 Hyoscine Butyl Bromide 1
57 M143 Lopinavir+Ritonavir 1
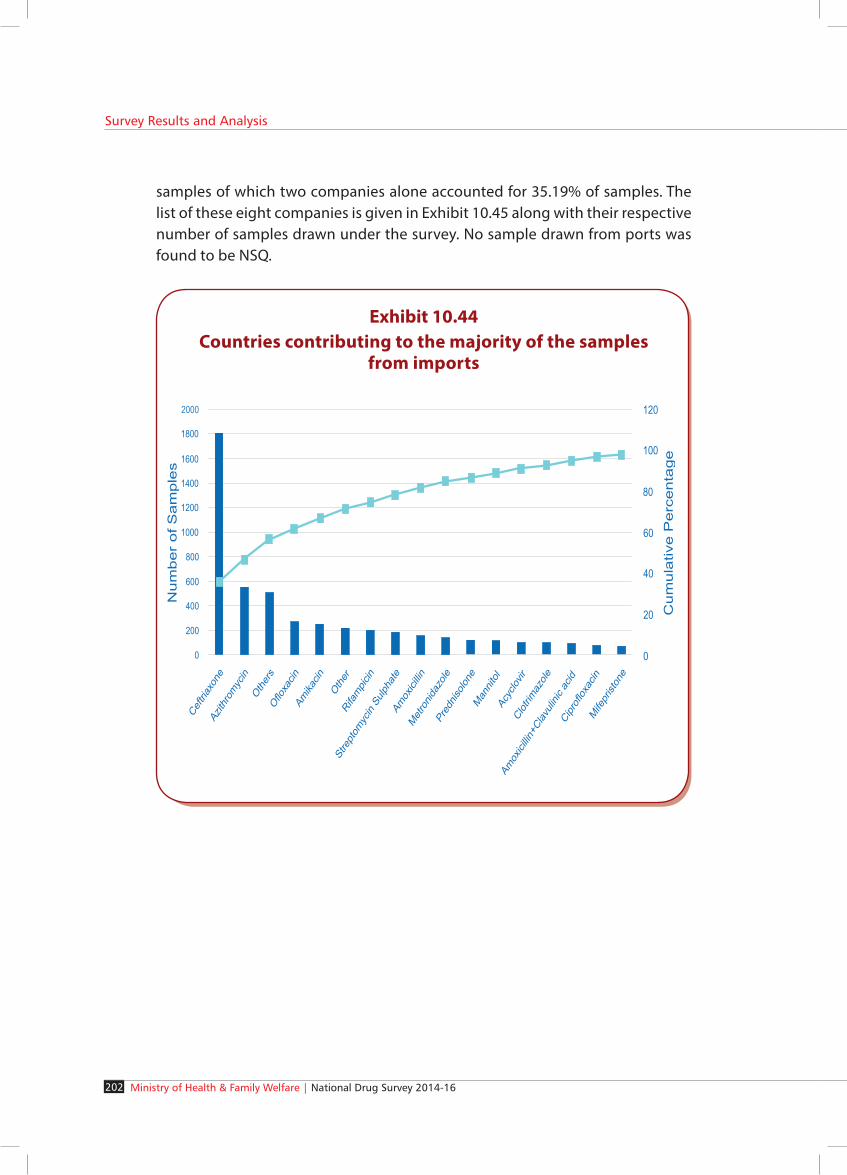
Among the drugs consignments sampled at ports 92% were from China and 2% each from Italy and France. This information is shown in Exhibit 10.44.
The consignments came from about 108 manufacturing companies overseas. It was observed that eight companies from China accounted for 57.7% of the
Ministry of Health & Family Welfare | National Drug Survey 2014-16202
Survey Results and Analysis
samples of which two companies alone accounted for 35.19% of samples. The list of these eight companies is given in Exhibit 10.45 along with their respective number of samples drawn under the survey. No sample drawn from ports was found to be NSQ.
Exhibit 10.44Countries contributing to the majority of the samples
from imports

Ministry of Health & Family Welfare | National Drug Survey 2014-16 203
National Institute of Biologicals
Exhibit 10.45Eight companies contributing to the majority of sampled
consignments at Ports
S. No. Manufacturer Name Country No. of Samples
1 Sinopharm Weiqida Pharmaceutical Co. Ltd. China 1318
2 Livzon Syntpharm Co. Ltd. China 437
3 Zhejiang Guobang Pharma Co. Ltd. China 260
4 Qilu Tianhe Pharma Co. Ltd. China 194
5 Zhejiang Apeloa Kangyu Pharma Co.Ltd. China 184
6 Shenyang Antibiotic Manufacturer China 177
7 Hebei Shengxue Dacheng Pharma Co.Ltd. China 168
8 Tianjin Tianyao Pharmaceuticals Co., Ltd. China 140
Analysis of Spurious Drugs
Of all samples from retail outlets and Government sources, 13 were found to be Spurious as per section 17B(d) of Drugs & Cosmetics Act, 1940 (Exhibit 10.46). Of these 8 were from retail outlets and 5 were from Government sources.

Ministry of Health & Family Welfare | National Drug Survey 2014-16204
Survey Results and Analysis
Exhi
bit 1
0.46
List
of s
amp
les
dec
lare
d S
pur
ious
und
er s
ecti
on 1
7B(d
) of D
rugs
& C
osm
etic
s A
ct (C
ontd
.)
S.
No.
Gen
eric
Nam
eBr
and
Nam
eD
osag
e Fo
rmN
ame
Man
ufac
ture
rSo
urce
Reas
on
1A
mox
icill
inV-
MO
X 50
0Ca
psul
esA
IMS
INTE
RNAT
ION
AL
Stat
e G
ovt.
Med
ical
St
ore
Dep
otId
entifi
catio
n N
egat
ive
2Pr
edni
solo
nePr
ed-1
0 Ta
bTa
blet
sCR
YSTA
L PH
ARM
ACEU
TICA
LSCi
vil H
ospi
tal S
tore
Iden
tifica
tion
Neg
ativ
e
3Ce
fixim
eN
ATa
blet
sZE
ST P
HA
RMA
Civi
l Hos
pita
l Sto
reId
entifi
catio
n N
egat
ive
4A
mox
icill
inPA
NTA
MO
X D
RY
SYRU
PSu
spen
sion
sKO
PRA
N
LABO
RATO
RIES
LI
MIT
EDSt
ate
Gov
t. M
edic
al
Stor
e D
epot
Iden
tifica
tion
Neg
ativ
e
5A
mox
icill
in
Susp
ensi
ons
ZEE
LABO
RATO
RIES
.St
ate
Gov
t. M
edic
al
Stor
e D
epot
Iden
tifica
tion
Neg
ativ
e
6Pr
edni
solo
nePR
ED-1
0Ta
blet
sCR
YSTA
L PH
ARM
ACEU
TICA
LSRe
tail
Out
let
Iden
tifica
tion
Neg
ativ
e
7M
ethy
l Pre
dnis
olon
eN
ELCO
RTIL
- 8
Tabl
ets
Fran
cies
Rem
edie
s In
dia
Pvt.
Ltd.
Reta
il O
utle
tId
entifi
catio
n N
egat
ive

Ministry of Health & Family Welfare | National Drug Survey 2014-16 205
National Institute of Biologicals
S.
No.
Gen
eric
Nam
eBr
and
Nam
eD
osag
e Fo
rmN
ame
Man
ufac
ture
rSo
urce
Reas
on
8 A
mox
icill
inKL
OKM
AX 2
50D
TTa
blet
sZE
E LA
BORA
TORI
ES
LIM
ITED
Reta
il O
utle
tId
entifi
catio
n N
egat
ive
9 Su
lpha
met
hoxa
zole
+
Trim
etho
prim
STA
RPRI
M D
STa
blet
sCR
YSTA
L PH
ARM
ACEU
TICA
LSRe
tail
Out
let
Iden
tifica
tion
Neg
ativ
e
10
Sulp
ham
etho
xazo
le +
Tr
imet
hopr
imCO
TRIM
OXA
ZOLE
Tabl
ets
CRYS
TAL,
PH
ARM
ACEU
TICA
LSRe
tail
Out
let
Iden
tifica
tion
Neg
ativ
e
11
Am
oxic
illin
+ C
lavu
linic
ac
idM
OCL
ATE
625
Tabl
ets
UN
ISO
N
PHA
RMAC
EUTI
CALS
Reta
il O
utle
tId
entifi
catio
n N
egat
ive
12
Am
oxic
illin
+ C
lavu
linic
ac
idM
OXW
AY-C
VPo
wde
r fo
r or
al li
quid
sM
SE
A
PHA
RMAC
EUTI
CALS
Reta
il O
utle
tId
entifi
catio
n N
egat
ive
13
Am
oxic
illin
+ C
lavu
linic
ac
idM
ax C
v 62
5Ta
blet
sU
nive
rsal
hea
lth C
are
Reta
il O
utle
tId
entifi
catio
n N
egat
ive
Exhi
bit 1
0.46
List
of s
amp
les
dec
lare
d S
pur
ious
und
er s
ecti
on 1
7B(d
) of D
rugs
& C
osm
etic
s A
ct

Ministry of Health & Family Welfare | National Drug Survey 2014-16206
Survey Results and Analysis
The break-up details of these 13 samples is given in Exhibit 10.47. Therefore, the estimates of Spurious drug percentages were: 0.0237% for retail outlets, and 0.0597% for Government sources.
Exhibit 10.47Dosage form and Source wise break-up of Spurious samples
S. No.
Dosage Form State Government
Medical Store Deport
Civil Hospital
Store
Retail Outlet
Grand Total
1 Capsules 1 1
2 Powder for oral liquids
1 1
3 Suspensions 2 2
4 Tablets 2 7 9
Grand Total 3 2 8 13
Summary
In this chapter, the survey results have been analysed from two different angles. One is about the conduct of the survey and the other is about results of Lab tests and Quality of drugs in terms of NSQ and Spurious drugs. Summary of survey aspects presents the analysis and results with regard to the first aspect, that is, about the conduct of the survey and sampling, and summary of lab test results and quality of drugs are presented in other section.
Summary of Survey Aspects
The survey was conducted to assess the quality of drugs pertaining to the formulations under 224 molecules selected from the National List of Essential Medicines-2011. As per the objectives, the survey was conducted for three sources, namely, Retail Outlets, Government sources and Ports. The results of the survey are summarized below:
a) 33,656 drug samples drawn from 5,717 Retail Outlets and 8,369 samples drawn from 1,421 Government sources were subjected to laboratory test/analysis. In the case of Ports, 4,987 samples drawn from 1708 consignments from 8 ports were subjected to laboratory test/analysis.
Ministry of Health & Family Welfare | National Drug Survey 2014-16 207
National Institute of Biologicals
b) The total number of samples drawn from 3 sources together was 47,012 from 183 different molecules of which 46 molecules accounted for nearly 80% of the samples. About 33% of the samples were drawn from Municipal Towns, 26% from Villages, 23% from Corporation Areas, 13% from Taluk headquarters and 5% from Metropolitan Cities.
c) For Retail Outlets and Government sources, the samples were selected based on the 3-stage survey design. One of the main hurdles in the selection of samples was in the first stage sampling where the sources were to be selected from the list of retail outlets and government sources. The major difficulty faced here was that the lists of sources with addresses were not readily available, and some States could only provide the number of sources. This was an important area where the State Drug Authorities need to improve their databases for future needs. Despite the problem of getting complete list of sources with their addresses, the selection of sources was tackled with reasonable satisfaction due to untiring efforts of NIB in obtaining the lists to the maximum extent possible.
d) In terms of obtaining samples from the randomly selected sources, the execution has been reasonably satisfactory. In about sixty percent of the cases, the samples were actually drawn from the specified locations. However, in case of five states (Manipur, Andhra Pradesh, West Bengal, Sikkim and Telangana), it was observed that there were problems in obtaining samples from assigned sources. The reasons for this may be investigated. The inclusion of representatives of Civil Society /Pharmacy Council of India in the sample collection teams was specifically designed to neutralize any biases that might arise due to aberrations of this kind.
e). The implementation of second stage sampling, the molecule selection at the sources, was taken care by the very design itself by providing the random lists of molecules for each Source independently. In the third stage one formulation was selected from each selected molecule using the prescribed method of random sampling.
Summary of Lab Test Results and Quality of Drugs
The total number of samples tested was 47,012 of which 33,656 were from Retail Outlets, 8,369 were from Government sources and 4,987 were from Ports. About 80% of the samples drawn From Retail Outlets and Government sources were Tablets. The total number of tests performed such as identification, dissolution, assay, etc., were 69. Of these, all tests were not applicable to all formulations. The main results of the analysis of lab tests are summarized below:
Ministry of Health & Family Welfare | National Drug Survey 2014-16208
Survey Results and Analysis
National Survey NSQ and Spurious Drugs Database
a) Out of the 47,012 samples tested, 13 samples were found to be Spurious and 1,850 samples were found to be NSQ. Therefore, The estimated percentage of NSQ Drugs in India is 3.16% and of Spurious drugs is 0.0245%.
Retail Outlets
a) Total 1,011 samples out of the 33,656 samples tested from Retail Outlets were found to be NSQ and 8 samples were found to be Spurious
b) The estimated percentage of NSQ formulations from Retail Outlets in India is 3% and is not expected to be more than 3.19% (the upper 95% confidence limit), and the estimated percentage of Spurious drugs from retail outlets is 0.0237%.
c) State wise, NSQ percentage estimates for Retail outlets varied from 0 to 8.82% percent (with the exception of Lakshadweep); Three States/UTs i.e. Andaman and Nicobar Islands, Dadra and Nagar Haveli, Goa had 0%NSQ. Fourteen States/UTs had NSQ percentage below the national average of 3% for Retail Outlets. Eighteen States had NSQ percentage above the national average of 3% for Retail Outlets.
d) The total number of non-compliance out of all tests of all samples from Retail Outlets was 1,251. Out of 69 tests performed on these samples, they failed in 28 tests, of which, Dissolution and Assay accounted for 56.4% of the non-compliance.
Government sources
a) Total 839 samples out of the 8,369 samples tested from Government sources were found to be NSQ and 5 samples were found to be Spurious.
b) The estimated percentage of NSQ formulations from Government sources in India is 10.02% and the 95% confidence interval for the same is 9.38% to 10.68% and the the estimated percentage of Spurious drugs from Government sources is 0.0597%. State wise, NSQ percentage estimates varied from 0 to 17.39% with the exception of Sikkim. Four UTs i.e. Chandigarh, Dadra and Nagar Haveli, Daman and Diu and Lakshadweep had 0%NSQ. Eighteen States/UTs had NSQ Percentage below national average of 10.02% for Government sources. Thirteen States had NSQ percentage above national average of 10.02% for Government sources.

Ministry of Health & Family Welfare | National Drug Survey 2014-16 209
National Institute of Biologicals
c) The total number of non-compliance out of all tests of all samples from Government sources was 1,177. Out of 69 tests performed on these samples, they failed in 27 tests, of which, Assay and Dissolution accounted for 46.1% of the non-compliance.
Ports
a) Samples were drawn from 8 Ports from 1708 consignments. 97% of the samples came from Mumbai and Chennai Ports.
b) None of the samples were found to be NSQ or Spurious.

Ministry of Health & Family Welfare | National Drug Survey 2014-16210
Survey Results and Analysis