National Climatic Data Center (NCDC) DATA … · IBM JCL: For ASCII variable specify: ... OPTCODE =...
23
National Climatic Data Center (NCDC) DATA DOCUMENTATION FOR TD 3220 DATA SET SUMMARY OF THE MONTH (SOM) COOPERATIVE 11 April 2000 National Climatic Data Center Federal Building 151 Patton Avenue Asheville NC 28801-5001 USA
Transcript of National Climatic Data Center (NCDC) DATA … · IBM JCL: For ASCII variable specify: ... OPTCODE =...
National Climatic Data Center(NCDC)
DATA DOCUMENTATION
FOR
TD 3220
DATA SET
SUMMARY OF THE MONTH (SOM)COOPERATIVE
11 April 2000
National Climatic Data CenterFederal Building151 Patton Avenue
Asheville NC 28801-5001 USA
Table of Contents
INTRODUCTIONData Set ID ............................................... 1Data Set Name ............................................. 1Data Set Aliases .......................................... 1
DESCRIPTIONAccess Method and Sort for Archived Data .................. 1Access Method and Sort for Supplied Data .................. 5Element Names and Definitions ............................. 5Start Date ............................................... 16Stop Date ................................................ 16Coverage ................................................. 16Location ................................................. 16Keywords ................................................. 16How to Order Data ........................................ 16
DATA CENTERArchiving Data Center .................................... 17Technical Contact ........................................ 17
DATA QUALITY .................................................. 17Known Uncorrected Problems ............................... 18Quality Statement ........................................ 18Revision Date ............................................ 18
OTHER DATA SETSSource Data Sets ......................................... 18Essential Companion Data Sets ............................ 18Derived Data Sets ........................................ 18
SUMMARIZATIONReferences ............................................... 18Summary .................................................. 18
GLOSSARY ........................................................ 18
1
1. Data Set ID:
3220
2. Data Set Name:
Summary of the Month (SOM) Cooperative
3. Data Set Aliases:
No information is available at this time.
4. Access Method and Sort for Archived Data:
Variable Length Records
SOM data are sorted by station in chronological order. Multiple records can exist for the same station for the sameyear. Such records must be combined to obtain a full year�sdata. Divisional data are sorted by state and division. The following ANSI Standard COBOL and FORTRAN 77 statementsare to be used only as guidelines in accessing the data.
FD INDATALABEL RECORDS ARE STANDARDRECORDING MODE DBLOCK CONTAINS 12,000 CHARACTERSDATA RECORD IS DATA-RECORD.
01 DATA-RECORD.02 RECORD-TYPE PIC X(3).02 STATION-ID PIC X(8).02 ELEMENT-TYPE PIC X(4).02 ELEMENT-UNITS PIC XX.02 YEAR PIC 9(4).02 AM-PM-SOIL PIC X.02 SUB-PLOT-SOIL PIC X.02 FILLER PIC X(4).02 NUMBER-VALUES PIC 9(3).02 MONTHLY-ENTRY OCCURS 1 TO 100 TIMES DEPENDING
ON NUMBER-VALUES.04 MONTH PIC 99.04 DAY PIC 99.04 DATA-VALUE PIC S9(5) SIGN LEADING
SEPARATE.04 FLAG-1 PIC X.04 FLAG-2 PIC X.
OPEN (10, FILE = 'filename', ACCESS = 'SEQUENTIAL', + STATUS = 'OLD', RFORM = 'VB', MRECL = 1230,
2
+ TYPE = 'ANSI', BLOCK = 12000)CHARACTER*3 RECTYPCHARACTER*8 STNIDCHARACTER*4 ELMTYP, IFILCHARACTER*2 EUNITSCHARACTER*1 FLAG1(100), FLAG2(100), AMPM, SBPLTDIMENSION IMON(100), IDAY(100), IVALUE(100)
READ(10, 20, END=99) RECTYP, STNID, ELMTYP, EUNITS, + IYEAR, AMPM, SBPLT, IFIL, NUMVAL, + (IMON(J), IDAY(J), IVALUE(J), + FLAG1(J), FLAG2(J), J=1, NUMVAL)
20 FORMAT(A3, A8, A4, A2, I4, 2A1, A4, I3, + 100(2I2, I6, 2A1))
IBM JCL: For ASCII variable specify:LRECL = 1234RECFM = DBOPTCODE = Q
For EBCDIC variable specify:LRECL = 1234RECFM = VB
Each logical record contains one year of one station'smonthly data values for a specific meteorological element. The record consists of a control word, an identificationportion, and a data portion. The control word is used bythe computer operating system for record lengthdetermination, while the identification portion identifiesthe observing station, year, and record element code. Thedata portion contains the meteorological observation for themonthly values and flags. The data portion is repeated foras many values as occur in the given time interval. Freezedata is an exception as it pertains to annual values anddoes not contain 12 monthly values.
Variable length tapes are structured as follows:
Record length: Variable with maximum of 1230 characters
Blocked : 12000 characters maximumMedia : ASCII 9 TrackDensity : 6250 BPIParity : OddLabel : ANSI standard labeledFile : 1 file per tape
3
VARIABLE(COBOL)(FORTRAN)
TYPE WIDTHSTARTCOLUMN
ENDCOLUMN
RECORD-TYPE RECTYP
Character 3 1 3
STATION-ID STNID
Character 8 4 11
ELEMENT-TYPE ELMTYP
Character 4 12 15
ELEMENT-UNITS EUNITS
Character 2 16 17
YEAR IYEAR
Integer 4 18 21
AM-PM-SOIL AMPM
Character 1 22 22
SUB-PLOT-SOIL SBPLT
Character 1 23 23
FILLER IFIL
Character 4 24 27
NUMBER-VALUES NUMVAL
Integer 3 28 30
MONTH IMON
Integer 2 31 32
DAY IDAY
Integer 2 33 34
DATA-VALUE IVALUE
Integer 6 35 40
FLAG-1 FLAG1
Character 1 41 41
FLAG-2 FLAG2
Character 1 42 42

4
Fixed Length Records
Data in this file are sorted by station in chronologicalorder.
The following ANSI Standard COBOL and FORTRAN 77 statementsare to be used only as guidelines in accessing the data.
FD INDATALABEL RECORDS ARE STANDARDRECORDING MODE FBLOCK CONTAINS 30 RECORDSDATA RECORD IS DATA-RECORD.
01 DATA RECORD.02 RECORD-TYPE PIC X(3).02 STATION-ID PIC X(8).02 ELEMENT-TYPE PIC X(4).02 ELEMENT-UNITS PIC XX.02 YEAR PIC 9(4).02 AM-PM-SOIL PIC X.02 SUB-PLOT-SOIL PIC X.02 FILLER PIC X(4).02 NUMBER-VALUES PIC 9(3).02 MONTHLY-ENTRY OCCURS 13 TIMES.
04 MONTH PIC 99.04 DAY PIC 99.04 DATA-VALUE PIC S9(5) SIGN LEADING
SEPARATE.04 FLAG-1 PIC X.04 FLAG-2 PIC X.
CHARACTER*3 RECTYPCHARACTER*8 STNIDCHARACTER*4 ELMTYP, IFILCHARACTER*2 EUNITSCHARACTER*1 FLAG1(13), FLAG2(13), AMPM, SBPLTDIMENSION IMON(13), IDAY(13), IVALUE(13)
OPEN(10, FILE=�filename�)READ(10, 20, END=99) RECTYP, STNID, ELMTYP, EUNITS,
+ IYEAR, AMPM, SBPLT, IFIL, NUMVAL, + (IMON(J), IDAY(J), IVALUE(J), + FLAG1(J), FLAG2(J), J=1, 13)
20 FORMAT(A3, A8, A4, A2, I4, 2A1, A4, I3, 13(2I2, I6, 2A1))

5
Each logical record contains one year of one station'smonthly data values for a specific meteorological element. The record consists of an identification portion and a dataportion, while the identification portion identifies theobserving station, year, and record element code. The dataportion contains the meteorological observation for themonthly data values and flags. The data portion is repeated13 times. If a data element is missing, the sign field isset to "-", the value field to �99999", the first flag to�M�, and the second flag to � � (-99999M/b). Freeze data isan exception as it pertains to annual values and does notcontain 12 monthly values.
Fixed length tapes are structured as follows:
Data Length: Fixed 186 charactersBlocked : 5580 charactersMedia : ASCII or EBCDIC modes - 9 TrackParity : OddLabel : ANSI standard labeled (ASCII only) or
unlabeledFile : 1 file per tapeDensity : 800, 1600, or 6250 BPI
The user may elect to receive fixed length data values inany of the following two forms:
1. data values as originally reported, or2. data values as originally reported with edited
replacement values substituted for the values that did not pass NCDC quality checks.
If no choice is made by the User, NCDC will supply theedited values.
5. Access Method and Sort for Supplied Data:
See Access Method and Sort for Archived Data.
6. Element Names and Definitions:
01-03 RECORD-TYPE The type of data stored in this record. Value is "MLY" (Monthly).
04-11 STATION-ID Station identifier assigned by the NCDC.04-05 State Code State code. Range = 01-96.
01 Alabama 43 Vermont
6
02 Arizona 44 Virginia03 Arkansas 45 Washington04 California 46 West Virginia05 Colorado 47 Wisconsin06 Connecticut 48 Wyoming07 Delaware 49 Not Used08 Florida 50 Alaska09 Georgia 51 Hawaii10 Idaho 60 Bahamas11 Illinois 61 Turks & Caicos Islands12 Indiana 62 Cuba13 Iowa 63 Jamaica14 Kansas 64 Haiti15 Kentucky 65 Dominican Republic16 Louisiana 66 Puerto Rico17 Maine 67 Virgin Islands18 Maryland 68 Netherlands Antilles, North19 Massachusetts 69 Antigua, Leeward Islands20 Michigan 70 Guadeloupe21 Minnesota 71 Martinique22 Mississippi 72 Grenada, Windward Islands23 Missouri 73 Tobago24 Montana 74 Trinidad25 Nebraska 75 Netherlands Antilles, South26 Nevada 76 British Guiana27 New Hampshire 77 Surinam28 New Jersey 78 Venezuela29 New Mexico 79 Colombia30 New York 80 French Guiana31 North Carolina 81 British Honduras32 North Dakota 82 Costa Rica33 Ohio 83 El Salvador34 Oklahoma 84 Guatemala35 Oregon 85 Honduras36 Pennsylvania 86 Nicaragua37 Rhode Island 87 Panama Canal Zone38 South Carolina 88 Mexico39 South Dakota 90 Barbados40 Tennessee 91 Pacific Islands41 Texas 96 Canada42 Utah
NOTE: STATE NUMBER PERIOD OF RECORD 60 1960-1967 61-65, 68-88 1960-1964 (overall)
06-09 Cooperative Number assigned by the NCDC. Range =Network Index 0000-9999. 0000 => Divisional Data.
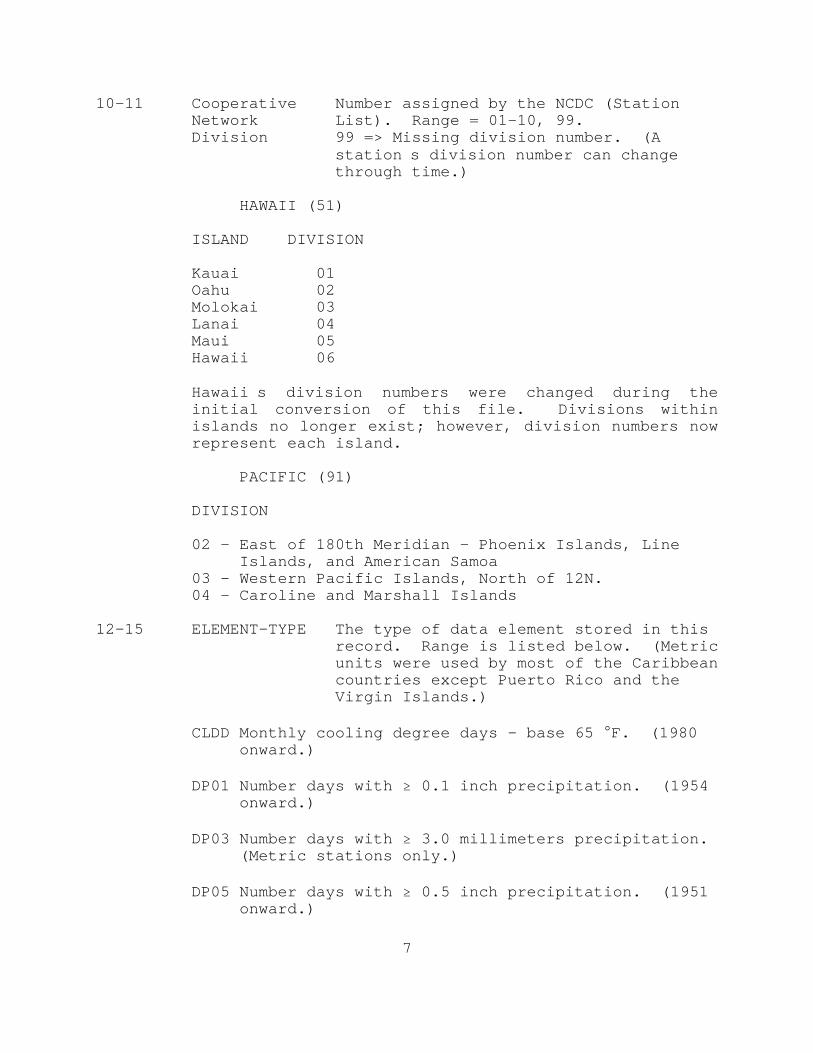
7
10-11 Cooperative Number assigned by the NCDC (StationNetwork List). Range = 01-10, 99.Division 99 => Missing division number. (A
station�s division number can changethrough time.)
HAWAII (51)
ISLAND DIVISION
Kauai 01Oahu 02Molokai 03Lanai 04Maui 05Hawaii 06
Hawaii�s division numbers were changed during theinitial conversion of this file. Divisions withinislands no longer exist; however, division numbers nowrepresent each island.
PACIFIC (91)
DIVISION
02 - East of 180th Meridian - Phoenix Islands, LineIslands, and American Samoa
03 - Western Pacific Islands, North of 12N.04 - Caroline and Marshall Islands
12-15 ELEMENT-TYPE The type of data element stored in thisrecord. Range is listed below. (Metricunits were used by most of the Caribbeancountries except Puerto Rico and theVirgin Islands.)
CLDD Monthly cooling degree days - base 65 EF. (1980onward.)
DP01 Number days with $ 0.1 inch precipitation. (1954onward.)
DP03 Number days with $ 3.0 millimeters precipitation.(Metric stations only.)
DP05 Number days with $ 0.5 inch precipitation. (1951onward.)
8
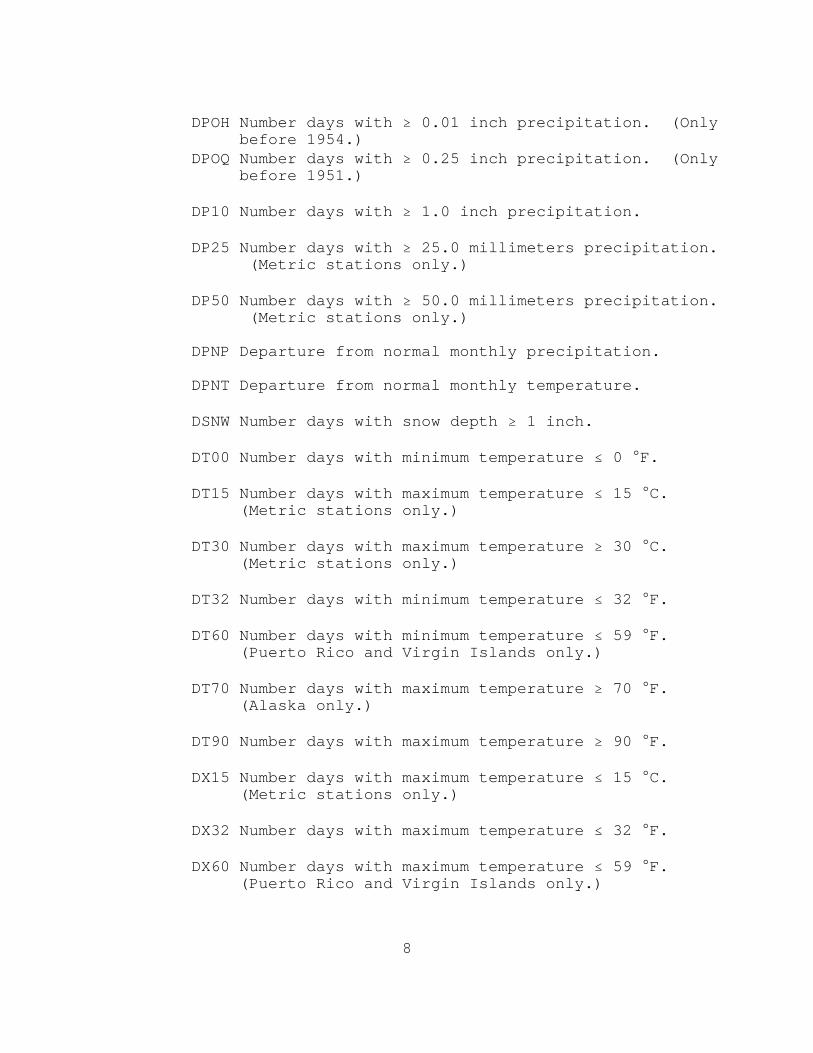
DPOH Number days with $ 0.01 inch precipitation. (Onlybefore 1954.)
DPOQ Number days with $ 0.25 inch precipitation. (Onlybefore 1951.)
DP10 Number days with $ 1.0 inch precipitation.
DP25 Number days with $ 25.0 millimeters precipitation. (Metric stations only.)
DP50 Number days with $ 50.0 millimeters precipitation. (Metric stations only.)
DPNP Departure from normal monthly precipitation.
DPNT Departure from normal monthly temperature.
DSNW Number days with snow depth $ 1 inch.
DT00 Number days with minimum temperature # 0 EF.
DT15 Number days with maximum temperature # 15 EC. (Metric stations only.)
DT30 Number days with maximum temperature $ 30 EC. (Metric stations only.)
DT32 Number days with minimum temperature # 32 EF.
DT60 Number days with minimum temperature # 59 EF.(Puerto Rico and Virgin Islands only.)
DT70 Number days with maximum temperature $ 70 EF. (Alaska only.)
DT90 Number days with maximum temperature $ 90 EF.
DX15 Number days with maximum temperature # 15 EC. (Metric stations only.)
DX32 Number days with maximum temperature # 32 EF.
DX60 Number days with maximum temperature # 59 EF. (Puerto Rico and Virgin Islands only.)

9
EMXP Extreme maximum daily precipitation in the month. (Contains the day of occurrence in the DAYfield.)
EMNT Extreme minimum temperature for the month. (Contains the day of occurrence in the DAY field.)
EMXT Extreme maximum temperature for the month. (Contains the day of occurrence in the DAY field.)
FRZD Freeze Data
FREEZE DATA TABLE
Freeze data contains the dates of the last spring (01January through 30 June) and the first fall occurrences( 01 July through 31 December) for five thresholds oftemperature (16, 20, 24, 28, and 32 EF). TheNUMBER-VALUES field indicates there are 10 data groups(threshold positions) to follow. The MONTH and DAYfields contain the date of occurrence. The DATA-VALUEfield contains the sign and actual temperature.
Example: The first threshold position that representsthe last occurrence of a temperature # 16 EFin the spring will appear as 0207/b00016/b/b(February 7th, temperature was 16 EF.)
Threshold MeaningPosition
1 Temp # 16 EF Last occurrence in the 2 Temp # 20 EF spring. 3 Temp # 24 EF 4 Temp # 28 EF 5 Temp # 32 EF 6 Temp # 16 EF First occurrence in the 7 Temp # 20 EF fall. 8 Temp # 24 EF 9 Temp # 28 EF 10 Temp # 32 EF
For no occurrences: MONTH = 99DAY = 99DATA-VALUE = -99999FLAG-1 = MFLAG-2 = +
10
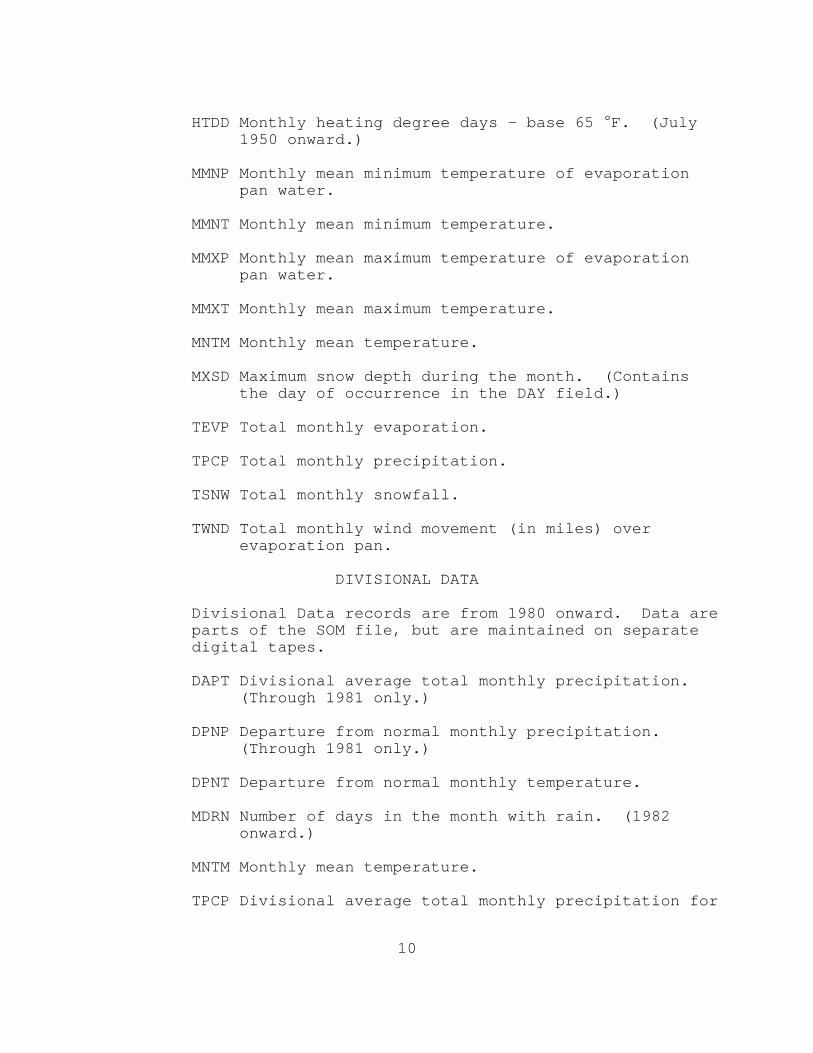
HTDD Monthly heating degree days - base 65 EF. (July1950 onward.)
MMNP Monthly mean minimum temperature of evaporationpan water.
MMNT Monthly mean minimum temperature.
MMXP Monthly mean maximum temperature of evaporationpan water.
MMXT Monthly mean maximum temperature.
MNTM Monthly mean temperature.
MXSD Maximum snow depth during the month. (Containsthe day of occurrence in the DAY field.)
TEVP Total monthly evaporation.
TPCP Total monthly precipitation.
TSNW Total monthly snowfall.
TWND Total monthly wind movement (in miles) overevaporation pan.
DIVISIONAL DATA
Divisional Data records are from 1980 onward. Data areparts of the SOM file, but are maintained on separatedigital tapes.
DAPT Divisional average total monthly precipitation.(Through 1981 only.)
DPNP Departure from normal monthly precipitation.(Through 1981 only.)
DPNT Departure from normal monthly temperature.
MDRN Number of days in the month with rain. (1982onward.)
MNTM Monthly mean temperature.
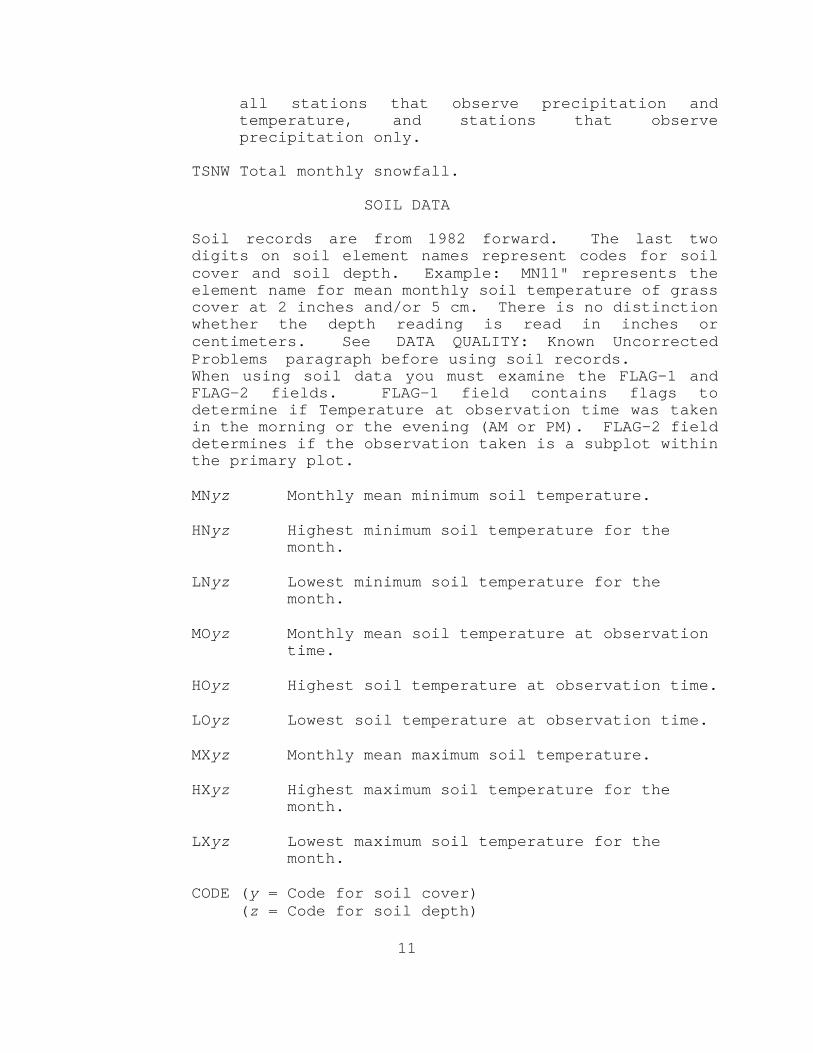
TPCP Divisional average total monthly precipitation for
11
all stations that observe precipitation andtemperature, and stations that observeprecipitation only.
TSNW Total monthly snowfall.
SOIL DATA
Soil records are from 1982 forward. The last twodigits on soil element names represent codes for soilcover and soil depth. Example: �MN11" represents theelement name for mean monthly soil temperature of grasscover at 2 inches and/or 5 cm. There is no distinctionwhether the depth reading is read in inches orcentimeters. See �DATA QUALITY: Known UncorrectedProblems� paragraph before using soil records. When using soil data you must examine the FLAG-1 andFLAG-2 fields. FLAG-1 field contains flags todetermine if Temperature at observation time was takenin the morning or the evening (AM or PM). FLAG-2 fielddetermines if the observation taken is a subplot withinthe primary plot.
MNyz Monthly mean minimum soil temperature.
HNyz Highest minimum soil temperature for themonth.
LNyz Lowest minimum soil temperature for themonth.
MOyz Monthly mean soil temperature at observationtime.
HOyz Highest soil temperature at observation time.
LOyz Lowest soil temperature at observation time.
MXyz Monthly mean maximum soil temperature.
HXyz Highest maximum soil temperature for themonth.
LXyz Lowest maximum soil temperature for themonth.
CODE (y = Code for soil cover)(z = Code for soil depth)
12
y = 1 Grass CODE Depth Depth 2 Fallow (z=) (inches) (cm) 3 Bare ground 4 Brome grass 1 2 5 5 Sod 2 4 10 6 Straw mulch 3 8 20 7 Grass muck 4 20 50 8 Bare muck 5 40 100 0 Unknown 0 unknown
Temperature Data: Mean monthly maximum, mean monthlyminimum, mean for month, departure from normal (ineffect at the time data were processed). Highest andlowest with dates, frequency of maximum and minimumwithin categories, heating and cooling degree days(base 65EF).
Precipitation Data: Total for month, departure fromnormal, (in effect at the time data were processed). Greatest observed daily amount and date, total snowfallfor month, greatest depth of snow and date, and thenumber of days of precipitation with specified limits. (Example: number days with $ 0.5 inch ofprecipitation.)
Evaporation Data: Total monthly wind mileage, totalmonthly evaporation, and mean maximum and minimum panwater temperature. (Began late 1960s.)
Freeze Data: Annual only. Lowest temperature and dateof occurrence. Date of last spring minimum freezingtemperatures and data of first fall minimum freezingtemperatures occurring within five categories (lessthan or equal 32E, 28E, 24E, 20E, 16E). Number of daysbetween freezing temperatures within the fivecategories.
Soil Temperature Data: Soil type, soil depth, andtemperature data for various soil types and depths(mean monthly minimum and maximum, mean monthly atobservation time, lowest and highest at observationtime, lowest monthly minimum, highest monthly maximum).
Divisional Average Data: Temperature and precipitationmonthly departures from normals (in effect at the timethe data were processed). Number of days with rain andmonthly means (temperature, precipitation, and

13
snowfall).
16-17 ELEMENT- The units and decimal position of the dataUNITS value for this record. Range of values are
listed below.
/bC Whole EC (right justified)/bD Whole Fahrenheit degree days (right justified)/bF Whole EF (right justified)HI Hundredths of inches/bI Whole inches (right justified)/bM Whole miles (right justified)MH Miles per hourMM MillimetersNA No units applicable (non-dimensional)TC Tenths of ECTF Tenths of EFTI Tenths of inchesTM Tenths of millimeters/b1 Soils - EF, soil depth in inches and 100ths/b2 Soils - EC, soil depth in whole centimeters/b3 Soils - EC, soil depth in inches and 100ths/b4 Soils - EF, soil depth in whole centimeters/b5 Soils - If the soil station closed during the
current month, the "5" indicates the station hasclosed. At the end of the current processingyear, the "5" will not appear in the annual TD3220file.
18-21 YEAR This is the year of record. Range = 1831-present.
22-22 AM-PM- (Soil temperatures only.) Indicator used SOIL to determine if the soil temperature at
observation time was taken in the morning orthe evening.
A = Temperature reading at AMP = Temperature reading at PM9 = Not applicable
23-23 SUB-PLOT- (Soil temperatures only.) Indicator usedSOIL to determine if the observation is for a
primary plot or a plot within a primary plot(subplot).
0 = Station plot only
14
1 = 1st subplot2 = 2nd subplot3 = 3rd subplot4 = 4th subplot8 = 8th subplot9 = Not applicable
24-27 FILLER Filler. Range = 9999.
28-30 NUMBER- Number of values reported. Range = 1-13.VALUES
(A record may contain fewer or more data values thanyou might expect. A yearly record of monthly valuesmay contain as few as 1 data value or as many as 13. This is primarily due to missing data. If a particulardata value was not taken or is unavailable, there is noentry for it. Freeze data will always contain 10 datavalues.)
31-32 MONTH Month of element value. Range = 1-13. 13 =>annual value.
33-34 DAY Day of element value, if applicable. Range =00-31. 00 => elements are monthly means ornumber of days of occurrences ofprecipitation and/or temperatures withinspecified limits as listed in theELEMENT-TYPE field.
35-40 DATA-VALUE Actual data value. The first position(35) of this field is the "sign" of themeteorological data value. Thisposition contains either a blank or aminus sign (never a plus sign). Theremaining positions of this fieldcontain a five-digit integer. Units anddecimal position are indicated by theELEMENT-UNITS field.
15
41-41 FLAG-1 Data Measurement Flag.
A Accumulated amount. This value is a total thatmay include data from a previous month or months(TPCP).
B Adjusted Total. Monthly value totals based onproportional available data across the entiremonth. (CLDD, HTDD, TEVP, TWND)
E An estimated monthly or annual total.
I Monthly means or totals based on incomplete timeseries. 1 to 9 days are missing. (DSNW, MMNT,MMXP, MMXT, MNTM, TCPC, TSNW)
M For variable length records, �M� is used only toindicate non-occurrence of a specified thresholdin the freeze data element (FRZD). For fixedlength records �M� stands for any data elementmissing.
S Precipitation for the amount is continuing to beaccumulated. Total will be included in asubsequent value (TPCP).
Example: Days 1-20 had 1.35 inches ofprecipitation, then a period of accumulationbegan. The element TPCP would then be 00135S andthe total accumulated amount value appears in asubsequent monthly value.
If TPCP = �99999" there was no precipitationmeasured during the month. Flag 1 is set to �S�and the total accumulated amount appears in asubsequent monthly value.
T Trace of precipitation, snowfall, or snowdepth. The precipitation data value will = �00000�. (EMXP, MXSD, TPCP, TSNW)
+ The phenomena in question occurred on severaldays. The date in the DAY field is the last dayof occurrence. This flag was used throughDecember 1983 only.
(blank) No report when data value = �99999".
16
42-42 FLAG-2 Data Quality FLAG. FLAG-2 is only used ifFLAG-1 contains �T�. Freeze data is the onlyexception. (See Freeze data table.)
A Accumulated amount.E Estimated value.+ Value occurred on more than 1 day - last date of
occurrence is used.
7. Start Date:
01 November 1831
8. Stop Date:
Present
9. Coverage (Latitude-Longitude Box):
No information is available at this time.Southernmost Latitude:Northernmost Latitude:Westernmost Longitude:Easternmost Longitude:
10. Location:
CanadaCaribbean IslandsCentral America (1960 - 1967 only)Pacific IslandsUSA
11. Keywords:
CooperativeDivisional AverageEvaporationFreezeMonthly PrecipitationMonthly TemperaturePrecipitationSnow DepthSnow FallSoilTemperature
12. How to Order Data:
17
Customer ServiceNational Climatic Data CenterFederal Building151 Patton AvenueAsheville NC 28801-5001
Phone: 828-271-4800Fax: 828-271-4876e-mail: [email protected]
13. Archiving Data Center:
National Climatic Data CenterFederal Building151 Patton AvenueAsheville NC 28801-5001
14. Technical Contact:
Thomas RossNational Climatic Data CenterFederal Building151 Patton AvenueAsheville NC 28801-5001
Phone: 828-271-4800Fax: 828-271-4876e-mail: [email protected]
15. Known Uncorrected Problems:
The historical data were converted from existing digitalfiles and structured into the element structure format. These data were processed through a gross value check andnot the current edit system. It is NCDC�s goal to bringthese historical files up to the same level of quality asthose from 1982 onward as resources become available. Thus,benign neglect, state of the art processing (circa 1952),and limited money/people resources have contributed towardless than optimum conditions in maintaining integrity of thedigital files before 1982.
Soil data were added in January 1982 with approximately 250stations reporting soil data. Soil data before 1982 areavailable in TD9639. In January 1987, the 1982 and 1983soil data were removed from the primary period of recorddata tapes. 1982-83 soil data processing problems resulted
18
in poor data quality of the monthly soils. These data areavailable on a separate magnetic tape containing just 1982-83 soil data.
There may be a few cases in which precipitation andtemperature are in metric units but are not labeled as suchin the �Element Units� field. This seems to be limited todata from the early 1960's from the U.S. Virgin Islands andPuerto Rico.
16. Quality Statement:
Beginning with the data for January 1982, Cooperative datawere processed through a completely revised system. Relyingheavily on new computer editing procedures, data have beensubjected to internal consistency checks, compared againstclimatological limits, checked serially, and evaluatedagainst surrounding station observations.
17. Revision Date:
08 July 1996
18. Source Data Sets:
TD3200 Summary of the Day (SOD) Cooperative
19. Essential Companion Data Sets:
No information is available at this time.
20. Derived Data Sets:
United States Historical Climatological Network (USHCN) Daily DataUSHCN Monthly Data
21. References:
22. Summary:
Information contained in this SOM data file is primarilythat from the cooperative network, augmented by observationsfrom principal climatological stations operated by theNational Weather Service and other sites having highlytrained observers.
The primary thrust of the cooperative observing program
19
today is the recording of 24-hour precipitation amounts, butabout 55% of the stations also record maximum and minimumtemperatures. Principal stations are usually fullyinstrumented and therefore record a complete range ofmeteorological parameters. Through the years, more than23,000 stations have recorded observations in this programbut seldom were there more than 12,000 in operation at anytime. Some 285 principal climatological stations reportmost of the elements. The remainder of the stations usuallyreport fewer elements.
The major effort toward automatic processing began in 1948when punched cards were first used to help summarizeclimatological data. Data from that time onward comprisethe bulk of the total file. Data for earlier periods wereplaced on punched cards because of cooperative agreementswith various State universities. Initially, not all thestates participated in this program so the number ofstations and the period of record are varied.
During the late 1960s the 136-character data set TD9924 wastransferred to magnetic tape to form the SOM digital database. This 136-character format remained in effect untilthe current element file structure was developed in 1982. At that time the historical files were converted to TD3220and processing of current data was completely revised.
Areal coverage includes the U.S., Alaska, Hawaii, somePacific and Caribbean Islands, and selected Central Americanstations. The digital file contains record type, stationidentification, units of measurement indicators, dataquality flags, and element types. Annual totals and meanswere derived at the end of each year. The values arepresent in the 13th value. The first 12 values representthe 12 months of the year.
Cooling Degree Day and Divisional Values are available onlyfrom 1980 forward. Divisional data before 1980 areavailable in TD9640 Divisional Averages Temperatures,Precipitation, and Normals.
20
GLOSSARY
Access Method and Sort for Archived Data -- How a digital dataset can be accessed in its archived condition. If the dataare sorted, how.
Access Method and Sort for Supplied Data -- How the user canaccess data in its most commonly supplied form. If the dataare sorted, how.
Archiving Data Center -- Name, organizational acronym, andaddress of institutions that archive and distribute thedata.
Coverage -- The smallest latitude-longitude "box" on the earth'ssurface that all data measurements occurred within.
Data Set Aliases -- Other names associated with the data set, nowor in the past.
Data Set ID -- A unique code number or acronym identifying thedata set. Normally, it is the code number used by the datacenter as the data set is archived.
Data Set Name -- A descriptive name for the data set thatprovides a thumbnail description.
Derived Data Sets -- Other data sets, if any, which originated,in whole or in part, from this data set.
Elements -- The basic units of data that need to be described. Usually, elements are simply data variables such as"station id", "precipitation", "ocean depth", and "dailymaximum temperature".
Essential Companion Data Sets -- Other data sets, if any, whichmust be obtained to use this data set.
How to Order Data -- Describes how to find the approximate costsassociated with obtaining the data set, or quotes the cost.
Keyword -- Words or short phrases that suggest the data set, oraspects of it. Actual element names should not be used askeywords.
Known Uncorrected Problems -- Known data difficulties, if any,for which no corrections have been made.
21
Location -- A collection of standard phrases that name the majorgeographic areas and atmospheric layers, which the datarefer to.
Quality Statement -- A brief generalization of how good the dataare.
Reference -- Any important bibliographic references about thedata set.
Revision Date -- The date that this documentation is created, orthe date of its latest revision.
Start Date -- The date of an earliest appearance.
Stop Date -- The date of a latest appearance.
Summary -- A concise abstract used to capture a few of the mostimportant facts about the data set, most of which shouldhave appeared in more detail under individual topicdiscussions.
Technical Contact -- The person who can be contacted to obtainand provide information about the data.


![EVA-PMDUP SIGNAL FUNCTIONS STUDY - DATA COLLECTION TOOL · q133_other q133_other: Specify other type of provider [Text] Section II: Hours of Operation Variable name Question Response](https://static.fdocuments.in/doc/165x107/602ccad4c992b4355d2109a0/eva-pmdup-signal-functions-study-data-collection-tool-q133other-q133other-specify.jpg)