National Center on Response to Intervention RTI in Middle ... in Middle Schools... · National...
20
National Center on Response to Intervention National Center on Response to Intervention http://www.rti4success.org Introduction As a field, we have a good idea what the implementaon of the essenal components of Response to Intervention (RTI) at the elementary school level looks like due to several evaluaons and studies (e.g., Tacke, Roberts, Baker, & Scammacca, 2009). However, as middle schools differ from elementary schools in terms of structure, teacher role, and learning expectations, considerably less is known about how and if the essenal components of RTI should be implemented in middle schools. Although scientific knowledge on the effecveness of RTI in secondary sengs is sll preliminary, we are learning more about the process, purpose, and outcomes as secondary schools across the naon move forward with RTI implementaon (e.g., Fuchs, Fuchs, & Compton, 2010; Shinn, 2008; Vaughn, Cirino, Wanzek, Wexler, Fletcher, et al., 2010). Empirical studies are underway, but in the meanme we can draw from descriptive studies of those who are attempting to implement aspects of RTI in a secondary context based on elementary knowledge. Using descripve informaon gathered from middle schools already implemenng RTI, this resource is designed to provide informaon to school, district, and state administrators and staff about how the essenal components of RTI may be implemented in middle schools. Naonal Center on Response to Intervenon (NCRTI) staff completed a multi-year descriptive investigation designed to idenfy and describe current RTI pracces in middle schools. From interviews with 42 middle school personnel at various stages of RTI implementaon, we describe how these schools have implemented the essenal components. (See Appendix A for details about the interview process.) We discuss how each essenal component (screening, progress monitoring, mul-level prevenon system, and data-based decision making) was implemented at the middle school level. We provide general details, specific examples, and praconer tesmony and point to promising pracces. DEFINITION: RTI is a multi-level prevention system designed to allow school staff to instruct all students in accordance with their level of educational need. Response to intervention integrates assessment and intervention within a multi-level prevention system to maximize student achievement and to reduce behavior problems. With RTI, schools identify students at risk for poor learning outcomes, monitor student progress, provide evidence-based interventions and adjust the intensity and nature of those interventions depending on a student’s responsiveness, and identify students with learning disabilities. (National Center on Response to Intervention, 2010, p. 2) RTI in Middle Schools: The Essential Components Content 1 Introduction 2 Essential Components 2 Screening 6 Progress Monitoring 9 Data-Based Decision Making 12 Multi-Level Prevention System 16 Conclusion 17 References 18 Appendix A
Transcript of National Center on Response to Intervention RTI in Middle ... in Middle Schools... · National...

National Center on Response to Intervention
National Center on Response to Interventionhttp://www.rti4success.org
Introduction
As a field, we have a good idea what the implementation of the essential components of Response to Intervention (RTI) at the elementary school level looks like due to several evaluations and studies (e.g., Tackett, Roberts, Baker, & Scammacca, 2009). However, as middle schools differ from elementary schools in terms of structure, teacher role, and learning expectations, considerably less is known about how and if the essential components of RTI should be implemented in middle schools.
Although scientific knowledge on the effectiveness of RTI in secondary settings is still preliminary, we are learning more about the process, purpose, and outcomes as secondary schools across the nation move forward with RTI implementation (e.g., Fuchs, Fuchs, & Compton, 2010; Shinn, 2008; Vaughn, Cirino, Wanzek, Wexler, Fletcher, et al., 2010). Empirical studies are underway, but in the meantime we can draw from descriptive studies of those who are attempting to implement aspects of RTI in a secondary context based on elementary knowledge. Using descriptive information gathered from middle schools already implementing RTI, this resource is designed to provide information to school, district, and state administrators and staff about how the essential components of RTI may be implemented in middle schools.
National Center on Response to Intervention (NCRTI) staff completed a multi-year descriptive investigation designed to identify and describe current RTI practices in middle schools. From interviews with 42 middle school personnel at various stages of RTI implementation, we describe how these schools have implemented the essential components. (See Appendix A for details about the interview process.) We discuss how each essential component (screening, progress monitoring, multi-level prevention system, and data-based decision making) was implemented at the middle school level. We provide general details, specific examples, and practitioner testimony and point to promising practices.
DEFINITION: RTI is a multi-level prevention
system designed to allow school staff to
instruct all students in accordance with their
level of educational need.
Response to intervention integrates assessment
and intervention within a multi-level prevention
system to maximize student achievement
and to reduce behavior problems. With RTI,
schools identify students at risk for poor learning
outcomes, monitor student progress, provide
evidence-based interventions and adjust the
intensity and nature of those interventions
depending on a student’s responsiveness,
and identify students with learning disabilities.
(National Center on Response to Intervention,
2010, p. 2)
RTI in Middle Schools: The Essential Components
Content1 Introduction
2 Essential Components
2 Screening
6 Progress Monitoring
9 Data-Based Decision Making
12 Multi-Level Prevention System
16 Conclusion
17 References
18 Appendix A

2RTI in Middle Schools: The Essential Components
Essential Components
RTI was designed as a preventative framework using student data from screening measures to identify students’ at-risk status for learning and behavioral difficulties and provide immediate instructional supports. The NCRTI framework emphasizes four essential components:
1. Screening
2. Progress monitoring
3. Multi-level instructional and behavioral system for preventing school failure
4. Data-based decision making for instruction, movement within the multi-level system, and disability identification in accordance with state law (National Center on Response to Intervention, 2010, p. 1)
For RTI to work effectively in a school, the essential components must work in conjunction with each other. In the graphic, each essential component is pivotal in the RTI process, and all are interconnected. Screening data are used to determine students’ initial risk status and evaluate the overall strength of a school, district, or grade level’s instructional program. Once staff members determine which level(s) of intervention students need within the multi-level prevention system, they use progress monitoring data to assess students’ response to instruction, allowing staff to quickly respond to students’ needs. At the heart of the graphic is data-based decision making.
Using both initial screening and on-going progress monitoring data, data-based decision making is a systematic methodology that staff uses to closely monitor and determine students’ instructional needs. Each RTI component depends upon the others to work effectively.
Screening
NCRTI defines screening as quick, efficient assessments administered two to three times each year to determine whether students are meeting the learning goals and benchmarks appropriate for their grade. When students fall below a preestablished cut point on the screening tool, more in-depth testing or short-term progress monitoring may be conducted to more accurately
Exhibit 1. Essential Components of RTI
Schools’ primary goal for RTI. All schools participating in the
interviews identified remediation as their primary goal for
implementing the essential components. School administrators
felt they had to quickly provide interventions to the students
who struggled with learning basic literacy and numeracy
skills. Once schools had basic reading and mathematics
intervention classes in place, the administrators began
focusing on providing content-area intervention for
courses such as science and social studies.
We have pockets around the country where people are doing [RTI] well at the middle school level. It’s not an elementary thing. It can be done, and done well, at the middle school. People need to talk to others and really communicate and collaborate with others who are doing it. We find that when we share ideas we are a lot stronger in our programs. But it clearly can be done well.
Middle School Principal

3RTI in Middle Schools: The Essential Components
predict which students are truly at risk for poor learning outcomes (National Center on Response to Intervention, 2010, p. 5).
In this section, we review how schools:
●● Chose screening assessments
●● Determined screening administration procedures
●● Identified struggling students with screening data
●● Analyzed school-wide screening data
●● Used elementary school feeder data
Choosing the screening assessments. Choosing and establishing procedures for the screening assessment(s) was often the first step school administrators and staff took when implementing an RTI framework. As one principal mentioned (see text box), screening was an essential part of their RTI framework because it helped them quickly identify which students needed additional assessment and support. Once team members decided the types of additional assessment tools they needed (e.g., reading comprehension, mathematics computation), they researched the tools available that best met their needs.
Practitioners used various techniques for choosing their assessments:
●● Collaboration with neighboring schools and districts
●● District- or state-provided assessments
●● Contacting state education agencies for resources and recommendations
●● Researching the free reference tools that are available, such as NCRTI’s Screening Tool Chart (http://rti4success.org/screeningTools), which summarizes currently available, scientifically research-based screening tools.
Screening administration. Fuchs et al. (2010) suggested that, since academic records are already well established and deficits are often well known by middle and high school, screening assessments may need to be conducted only once per academic year, if at all. However, most school administrators at interviewed schools emphasized the importance of multiple screening administrations per year, with most schools screening three times per year in order to have a record of the students’ academic performance, needs, and risk status. Given limited time and resources, however, middle schools may consider starting with one or two screening administrations per year to evaluate their administration needs. In the upper grades, if screening scores stay relatively steady, schools may determine that one or two administrations are sufficient.
Most of the visited schools screened for both reading and mathematics. A few schools added an additional content area such as writing, science, social studies, or behavior. The most commonly used screening tools were AIMSweb, the Measures of Academic Progress (MAP), state assessments, and state-, district-, and school-normed curriculum-based measures. Many schools used multiple assessment data sources (e.g., AIMSweb and the state assessment results).
“Screening is probably the most critical piece, because if we don’t screen, we have no way of knowing whether we have a class-wide problem or we have an individual student problem and the interventions are so different, so it’s really crucial for us to know which students need which intervention.”
Middle School Principal
“As the complexity of reading increases as you go from one grade to another, you still can’t forget about those universal screens that may scoop up some students you may have missed before.”
Middle School Principal

4RTI in Middle Schools: The Essential Components
Screening data to inform instructional decisions. The purpose of collecting screening data is to identify quickly students who are at risk for academic failure. Typically, data teams use predetermined cut scores to decide which students are at risk and require additional intervention.
Many of the middle school teams we interviewed used a screening measure as an initial indicator of risk. Most screening assessments, however, are not designed to provide diagnostic information. Thus, students scoring below a predetermined screening cut score were identified as potentially at risk, and staff then administered a diagnostic assessment to determine further instructional need. Many schools stated that they struggled to find appropriate diagnostic assessments for numeracy. Several noted that they used district-created common assessments, class performance, or grades to identify specific numeracy needs.
School staff also used screening data to determine the effectiveness of the general education program. For example, when one participating middle school received midyear screening assessment scores, the school’s data showed that the seventh- and eighth-
grade students were performing below the national target. The graphs provided a clear illustration that staff needed to focus attention on reading instruction for all students (see Figure 1). As a result, staff implemented a school-wide, primary level reading program to help ensure all students quickly caught up to the national reading target. In particular, the teachers provided more direct reading instruction within all content classes. Because of the primary level interventions, the end-of-the-year assessment scores showed that the students had nearly met the national target.
“If I was talking to someone starting off that hadn’t done this before, there are national cut scores, there is research out there. And that’s how we started, we looked at what was out there already and started with that. Over time then, you can develop your own local cut scores and we have done that too. But I think you can go out and look at the research and literature that’s there and give you a starting place.”
Middle School Principal
“Because we are screening so quickly [frequently], we see problems in real time, so we are catching kids before there is a major deficit and we are catching kids who are experiencing problems.”
Middle School Principal
RTI Score220219218217216215214213212211210
Fall Winter
Testing Window
7th Grade ReadingTarget: 219 Actual: 218.82
Spring
Reading Target Actual Reading Average
RTI Score222221220219218217216215214213212211
8th Grade ReadingTarget: 221 Actual: 220.89
Fall Winter
Testing Window
Spring
Reading Target Actual Reading Average
Figure 1. Seventh- and Eighth-Grade Scores Compared with National Averages

5RTI in Middle Schools: The Essential Components
Feeder data. Unlike early elementary school, students enter middle school with an academic performance history. Many middle school administrators in districts with multiple feeder elementary schools reported challenges receiving consistent and similar data from all elementary schools. A few middle schools worked with their elementary feeder schools to get incoming students’ data before the start of the school year, which allowed them to address the students’ instructional needs at the beginning of the school year. One school sent a staff team to the feeder elementary
schools in the spring to screen the incoming sixth graders. This team reported using the same process to assist the high school with transitioning eighth graders.
Another middle school principal and her staff created a form that the elementary school teachers completed for exiting fifth-grade students. The form (see Table 1) requested information about academic and behavioral concerns and was the first data that the middle school staff received on incoming students.
Table 1. Reporting Form for Exiting Fifth Graders
Academic and Behavioral Assessment:Ranking of 1 through 5 (5 = No concerns, 4 = Minor concern, 3 = Moderate concern, 2 = Significant concern, 1 = Can perform task but chooses not to engage) Organization skills Follows written
directionsFollows oral directions
Independence and problem solving
Homework completion
Test-taking skills
Attention span Attitude and motivation
Peer interaction skills
Parent responsiveness
Classroom participation
Appropriate student conduct
TOTAL SCORE (add above rankings): ___________
Does this student have an RTI plan? _______yes ______no
Interventions implemented for student in 6th grade:
Specific concerns from sixth-grade teacher:

6RTI in Middle Schools: The Essential Components
Progress Monitoring
Progress monitoring, as defined by NCRTI, is the regular and repeated assessment of students’ academic performance to inform instruction. It is conducted at least monthly to: (1) assess students’ performance over time, (2) quantify student rates of improvement or responsiveness to instruction, (3) evaluate instructional effectiveness, and (4) formulate effective individualized programs for students who do not respond to instruction (National Center on Response to Intervention, 2010, p. 5–6).
Purpose of progress monitoring. The purpose of progress monitoring is to determine instructional effectiveness and thereby allow for timely and appropriate adjustments to instruction when needed. Although progress monitoring may be used within the context of core instruction, NCRTI recommends emphasizing it at the secondary and tertiary intervention levels.
Middle school staff members reported that progress monitoring data provided them with multiple layers of information about intervention effectiveness for individual students and for entire intervention programs. These data provided immediate feedback about whether students were reaching their learning goals. Many staff members reported using a trend line with three to six data points to determine effectiveness and make instructional decisions. To boost student engagement in the process, most schools noted actively involving students in their own data collection and graphing.
In this section, we review how schools:
●● Chose progress monitoring tools
●● Determined the frequency with which to monitor progress
●● Used their progress monitoring data
Choosing tools. Progress monitoring assessments must accurately measure student learning, and data must be useful for instructional planning. School teams used a variety of tools and practices for monitoring the progress of students. Most participating schools monitored progress in literacy and mathematics, and more than half reported that they used multiple tools to do so. Schools noted using the same progress-monitoring tools for both secondary and tertiary interventions, unless the progress monitoring assessments were specific to the intervention program. At the same time, many schools noted that selecting tools was challenging because few have been validated for use with middle school students, or aligned to many state’s curriculum standards.
Administration. Before implementing progress monitoring, personnel determined the frequency with which they needed to collect data at each instructional level.
At the primary level of instruction, the majority of participating middle schools monitored progress only informally (and often infrequently), if at all. Staff from schools that reported informal or infrequent progress monitoring often did not differentiate between universal screening and progress monitoring at the primary level of instruction—they typically used the terms screening and progress monitoring interchangeably. The small number of schools that reported monitoring
“Students have to… be involved in their progress monitoring because…the student[s], especially at the middle school level where they are very savvy and very aware that they are not in the same place as their peers, [have] to know that they are making growth. They have to see their small gains or large gains and be able to celebrate.”
Middle School Principal
Commonly reported progress monitoring assessments for
reading and mathematics:
1. Nationally published assessments (e.g., AIMSweb)
2. School- or district-created curriculum-based measures
3. Assessments built into the intervention curricula

7RTI in Middle Schools: The Essential Components
student progress at the primary level of instruction did so every three to six weeks. Unlike staff at schools that did not monitor progress at the primary level, staff members from schools who reported regular, primary-level progress monitoring were able to articulate the differences between screening and progress monitoring. Screening was viewed as a criterion-based means of targeting students who may be at risk, and progress monitoring was viewed as a means of tracking student growth in the general curriculum over time.
At both the secondary and tertiary levels of instruction, most participating middle school staff regularly administered progress-monitoring assessments, and students were often involved in graphing their own data. At the secondary level, progress monitoring typically occurred on a weekly, biweekly, or monthly basis.
At the tertiary level of instruction, most schools reported monitoring progress weekly, although responses ranged from as infrequently as twice per month to as often as daily. Several schools reported that progress monitoring at the tertiary level of instruction varied based on individual student needs and the interventions implemented.
Using progress monitoring data. Common decisions made from the progress-monitoring data included: (1) continuing with an intervention if progress was being made toward the goal; (2) changing an intervention to better suit the needs of the student; (3) moving a student to a tertiary intervention if the student was not responsive to the secondary intervention; (4) returning students to core instruction alone. Schools reported using a range of publisher-provided, state-, district-, or school-normed predetermined cut scores to gauge student progress.
Progress monitoring data were also used by some middle schools to indicate whether an intervention program was meeting the needs of intervention groups. In one middle school, staff were perplexed to observe that students were not making expected gains in their reading scores. Furthermore, the most at-risk students who needed to make the largest gains were not progressing. After analyzing additional progress, screening, and state assessment data, the team decided to implement a new intervention program that was better aligned to their standards and benchmarks. The principal noted that, “This was painful and heartbreaking to know that all that hard work to put the reading intervention in place did not pay off, but we knew that the data were telling us loud and clear that we needed to change.” Because they were carefully tracking the screening and progress-monitoring data, they could make the instructional change necessary to promote students’ success.
“The [secondary level] students are progress-monitored every fifth day. So far, the data show that the students are making good progress, but it is slow progress.”
Middle School Teacher
Table 2. Decision-Making Framework
Process Question Implementation Considerations Based on Examples from Schools
Define the ProblemPresentation of problem
How does staff determine agenda? Which students’ data will be reviewed?
• Collect data on a standardized form and assign a responsible staff member from the data-based decision making team.
• Conduct a thorough review of the student’s record.• Arrange for the responsible staff member to meet with
the parent to discuss concerns.

8RTI in Middle Schools: The Essential Components
Develop a PlanEstablish guidelines and processes for data (decision rules)
Are there set decision rules for determining instructional needs from your screening and progress-monitoring data? What criteria do you have to determine adequate progress?
• Make decisions based on the data for behavior and academics—continually review the data in team meetings
• Use differentiation to meet students’ instructional needs across instructional levels.
Data collection Which data do you collect and analyze for students? (e.g., screening scores, progress monitoring data, grades, attendance)
• Use grades, past data, anecdotal information, screening scores, and progress-monitoring data
Cut scores What data (cut scores) indicate at-risk status for academic failure?
• Set reading and mathematics cut scores using standardized screening assessments
• Use state assessment scores to place students into instructional groups.
Measurable goals for screening
What percentage of students will meet a predetermined benchmark by a certain date?
• 80 percent of students meeting proficiency standards
Measureable goals for progress monitoring
What data are used to determine an individual student’s aim line for measuring progress in an intervention?
• Aim line: Use 3-8 progress-monitoring data points when making decisions about movement in and out of instructional levels or tiers.
Implement PlanInstructional strategies What research-based instructional strategies
best match students’ needs as indicated by assessment data (e.g., If a student scores below proficiency on reading, what reading strategy will be implemented?).
• Use a resource for researching instructional tools and programs to meet your needs such as the NCRTI Instruction Tools Chart: http://rti4success.org/instructionTools.
Student movement How do you use PM data to determine which students are in need of more intensive instruction?
• Use data from a variety of sources to help school personnel identify the students who needed intervention services.
• Get students involved in their instruction and progress monitoring data tracking to facilitate buy in and motivation.
• Track identification and exit patterns from special education. Anecdotal information from some schools indicated that fewer students were identified with learning disabilities, and more were exited from special education.
EvaluateMeasurable goals for screening
What percentage of students will meet a predetermined benchmark by a certain date?
• Look for approximately:• 80 percent of student meeting proficiency standards.• 15 percent of students finding success in secondary
level classes.• 5 percent of students needing tertiary level interventions.
Measureable goals for progress monitoring
What data are used to determine an individual student’s aim line for measuring progress in an intervention?
• Compare the student’s aim line to his/her trend line, and set decision rules for determining when growth is insufficient (e.g., 4 data points below the aim line).
• Track movement of students between instructional levels as an indicator of the success of the implementation of the decision-making process.
Fidelity of instructional practices
Are instructional strategies reviewed for fidelity to ensure student responsiveness?
• Consider adherence to instructional program, exposure to content, quality of instructional delivery, program differentiation, and student responsiveness (engagement) when evaluating fidelity.
• Conduct observations regularly.

9RTI in Middle Schools: The Essential Components
An example from one school. At the primary level of prevention general education teachers in mathematics, science and literacy administered common, validated assessments every three weeks. The teachers kept a common "data wall" for every student, which allowed teachers to monitor whether students were on track with their learning goals. Teachers entered the progress monitoring test results disaggregated by content area strand, which allowed them to determine which strands students had mastered and where they needed additional instruction. The staff and administration were also cautious about assessing the students too often, so they kept common assessments brief and administered them during flex time so they did not lose instructional hours.
At the secondary level of intervention, progress monitoring schedules were determined according to the intervention used. All interventions required progress monitoring on at least a bimonthly basis; however, some intervention programs established more frequent schedules, such as weekly or daily. For each of their interventions, the scores were indicative of a mastery level of performance, varied across content skills, and were program and intervention specific.
At the tertiary level of intervention, students’ progress was monitored daily. Students’ progress-monitoring scores were measured against grade-level reading and mathematics standards.
Data-Based Decision Making
Data-based decision making is pivotal to the success of RTI. Teams use screening and progress monitoring data to make decisions about instruction, movement within the multi-level prevention system, and disability identification (in accordance with state law). It provides school staff a set of established routines and procedures to follow when using screening and progress-monitoring data to make data-based instructional decisions. Data-based decision making can be conceptualized as a process that links screening and progress-monitoring data to instructional practices. In particular, analysis of screening and progress monitoring data may inform the following:
●● Level of instruction (primary, secondary, or tertiary)
●● When to change instruction
●● Student responsiveness to instruction
●● Movement between levels
As part of data-based decision making, teams should develop guidelines for collecting, analyzing, and making decisions based on student data. These procedures allow staff to respond to students’ instructional needs in a timely fashion.
In this section, we will review the two major themes that emerged from our interviews with middle schools when establishing data-based decision making: (1) team structure (the “who, what, when, and how”), and (2) decision-making framework (the guidelines for using data consistently and objectively to make instructional decisions).
Team structure. Staff reported establishing data teams to facilitate decision making and monitor students’ progress. The teams often consisted of the principals, general education teachers, special education teachers, RTI coordinators, reading and mathematics specialists, ESL teachers, and school psychologists.
Resources. A good source of information on progress
monitoring tools and resources is the National Center on
Student Progress Monitoring (http://www.studentprogress.org/)
and NCRTI’s progress monitoring tools chart
(http://rti4success.org/progressMonitoringTools).

10RTI in Middle Schools: The Essential Components
Most schools reported that their teams met weekly for at least an hour to discuss and analyze data and make timely and responsive data-based instructional decisions.
As the school year progressed, most teams noted that tweaks were made to their meetings as the team learned what they needed to make their data meetings more efficient and successful. For example, one team learned that they needed to use projectors so they could project information (the progress-monitoring graphs, screening scores, grades, attendance, etc.), allowing all staff to see the same data at the same time.
Another school discovered that the best method for gaining school-wide acceptance of data-based decision making was to have all staff take turns participating in the decision-making meetings. The school had a core team (administrators, counselors, special education teachers, intervention teachers), and the rest of the staff took turns participating each week. This method allowed all staff to have a deeper understanding of the process and a personal investment in the data-driven instructional decisions made by the team. In this school, too, they made changes to their process (such as meeting time, length, frequency, and presentation of data) whenever they saw it was necessary.
The decision-making framework. Each team had an established set of procedures to follow when analyzing students’ data. Many teams reported that establishing their procedures themselves was a process. They had
to establish their students’ goals, learn to implement a team framework to make decisions, learn about decision-making processes, and overcome obstacles such as suspicion or fear of data. Having a consistent decision-making framework in place allowed for higher accuracy, consistency, and equitable instructional decisions. Furthermore, once the process was established, it became economical for the schools in time and resources because the process became unambiguous and staff did need to spend a great amount of time discussing each student’s profile.
School teams also had to determine which data would be used to make decisions. Staff referred to the students’ screening scores and progress monitoring graphs (with the trend line, aim-line, and points-of-intervention changes) to determine whether students were making the appropriate learning gains. Many middle schools also included information such as grades, historical data, and behavior, and attendance records.
Many schools also noted using some version of the problem-solving process:
●● Define the problem. (What is the problem and why is it happening?)
●● Develop a plan. (What are we going to do?)
●● Implement the plan. (Carry out the intervention.)
●● Evaluate the plan. (Did our plan work?)
Define the problem. Schools often started data-based decision-making meetings with a presentation of the problem, which established the meeting goals and agenda, including the students and their data to be discussed. Each school had a process for determining which students’ data needed to be reviewed. This decision was often based on how frequently the school screened and progress monitored students, how much time could be devoted to meeting each week, and how frequently schools reviewed students’ data and their responsiveness to the instruction.
Example team meeting. For example, one school held their
meetings every Tuesday from 8 a.m. to 9 a.m. The two
counselors were responsible for leading the meeting as
well as creating and distributing the meeting agenda. The
district RTI coordinator gathered the data and displayed the
corresponding student data graphs and charts. Decisions
made by the team were noted by the counselors and shared
with the rest of the group following the meeting. Each time
a decision was made, a team member was designated to
ensure the decisions were executed.

11RTI in Middle Schools: The Essential Components
Develop and implement a plan. The data teams often relied on decision rules when developing plans to address identified problems. Interviewed teams noted that decision rules should be written down so that consistent decisions would be made across time and students. Decision rules also seemed to be critical when teams were using multiple sources of data (screening, progress monitoring, classroom grades, etc.); teams felt that if decision rules accounted for multiple data sources and possible inconsistencies between these data sources, decisions could still be made in a consistent fashion.
Establishing cut scores was essential for being able to designate clear decision rules. Screening cut scores were used to separate students into categories. When the team identified students who were at risk, preventative steps were then implemented to reduce the chance of failure. As noted above, minimum growth rates were established on each of the progress-monitoring measures to determine students’ progress.
Many of the screening assessments that middle schools used included preset cut scores based on national norms. For example, many of the schools used Northwest Evaluation Association’s MAP, a nationally normed test, as a screening assessment. One school stated that on the MAP, students who scored above the 75th percentile were considered
advanced, those who scored from the 26th to 75th percentile were at benchmark, those in the 11th to 25th percentile received secondary interventions, and those at or below the 10th percentile received tertiary interventions.
For the progress monitoring assessments, one school district created a computerized graphing program to establish their goal scores. The district staff calculated that students scoring a certain score on the progress-monitoring assessments typically also scored at the proficiency level on the state assessment; this score was used at the goal for students. The computerized program helped students and teachers plot the goal score in students’ individual graphs, and then they graphed their aim line by plotting their starting score (baseline) and drew the aim line to the goal score. The team from this school made data-based instructional decisions after four data points were plotted on the graphs. When a student was four points above the aim line, they were considered on track; if they were four points below the aim line, their cases were discussed at a data-based decision-making team meeting to review their progress in their intervention programs and to determine whether there was a need to make an instructional change.
The team’s established decision rules help drive the team’s ability to determine instructional decisions. Schools decided which research-based instructional strategies and programs best met the needs of their students on the basis of the data and goals. When students’ scores indicate they are at risk for failure, or that they are not making adequate progress, schools should have a readily available next step for instruction that matches the students’ needs as shown in the data.
Many of the schools had a “menu” of instructional programs and strategies that they used for each level of intervention. For example, the data team may choose to implement a reading comprehension strategy in a secondary level intervention to help the
Decision rules. One of the most important, and often miss-
ing, pieces of data-based decision making is establishing
clear, objective, and equitable decision rules. Decision rules
are the written rules by which the team compares students’
scores (data) against a criterion (target) value to determine
the course of action (instructional need). The decision rules
should be explicit, transparent, and shared knowledge. The
goal of decision rules is for every decision to be standard-
ized and consistent (e.g., IF a student scores between the
20th and 10th percentile in reading, THEN the student
receives X reading instructional intervention).

12RTI in Middle Schools: The Essential Components
student with the core curriculum. For the more intense tertiary level of instruction, some schools used programs that focused on the basics of literacy (e.g., decoding) or mathematics (e.g., computation).
Schools also have to plan for and track student movement among instructional levels. Teams should ask, “What data indicate that a student is ready to move from secondary to primary instructional levels?” In addition, teams should have clear rules for what data indicate that students need an instructional change (within the same level) or need to move into a more intensive level.
Evaluate the plan. The evaluation of the data team’s decision-making process allows the team to review student data and interventions to determine whether the instructional techniques are effective. The teams regularly reviewed their pre-established measurable goals for screening (e.g., that 80 percent of their students are meeting proficiency standards) and progress monitoring (e.g., that a student’s trend line is showing adequate progress toward their goal score).
Throughout the entire decision-making process, teams reviewed their own processes and decision rules to ensure that the decision making was accurate, consistent, objective, and standardized for all students. A small number of teams also noted reviewing the fidelity of instructional practices on a regular basis.
Multi-Level Prevention System
The multi-level prevention system includes three levels of intensity or prevention. The primary prevention level is high-quality core instruction. The secondary
level consists of evidence-based intervention(s) of moderate intensity. The tertiary level consists of individualized intervention(s) of increased intensity for students who show minimal response to secondary prevention (National Center on Response to Intervention, 2010, pp. 5–6).
In this section, we will review examples of how schools implemented:
●● Primary level of prevention
●● Secondary level of intervention
●● Tertiary level of intervention
Primary level of prevention. NCRTI defines primary prevention as “high quality core instruction that meets the needs of most students” (National Center on Response to Intervention, 2010, p. 5). Ideally, primary prevention, or core instruction, is the instruction that all students receive in the regular classroom, and it will be sufficient for at least 80 percent of students. Furthermore, primary level prevention should include both whole- and small-group instruction as well as differentiated instruction that is based on student needs. Fuchs et al. (2010) describe core instructional programs as “classroom routines that provide opportunities for instructional differentiation; accommodations that permit access to the primary prevention program for all students; and problem-solving strategies to address motivational problems that cause some students to fail to perform the academic skills they possess,” (p. 23).
Resources. Two useful resources for schools may be
Kovaleski, Roble, and Agne’s (2008) data-analysis team
script for team decision-making processes and Kovaleski
and Pedersen’s (2008) article on best practices in data-based
decision-making teams. They outline the procedures, prompts,
and records teams need when making data-based instructional
decisions in an RTI setting.
“RTI was designed to catch struggling students early and provide some interventions to get them back on track with their peers before they fall too far behind. But the reality is that when students get to middle or high school, RTI becomes more of a remediation program. As staff, we try to scoop them up and test them and provide instruction to get them back to their grade level.”
Middle School Principal

13RTI in Middle Schools: The Essential Components
When implementing RTI, schools we interviewed had implemented primary prevention techniques to ensure the success of their curricula and increase academic achievement for the majority of their students. Across the participating middle schools, many used similar instructional strategies: standardized, scientifically research-based general education curriculum, differentiated instruction, small group instruction, peer tutoring, and extended learning time.1 Because primary prevention was synonymous with general education, the majority of schools stated that general education and content teachers delivered instruction. In a few cases, general education classes used a co-teaching model in which two teachers shared the instructional delivery to enhance differentiated instruction.
An example from one school. Prior to RTI implementation, the majority of students at one school scored below proficient on both mathematics and reading, and the school knew they had to focus on boosting the general education curriculum. This middle school had support and resources from their district, which had already implemented RTI at their elementary schools. Furthermore, the principal of this middle school was the principal at one of the district elementary schools during RTI implementation.
Initially, the district implemented a district-wide curriculum, aligned to the state standards, that was “calendered,” meaning that every content-specific teacher in the district taught each unit at the same time. The school established a co-teaching model at the primary level; thus, students were in classrooms with two teachers: a general education teacher and a
special education teacher, who were equally qualified to provide interventions. When a student struggled academically, as indicated by screening scores, the primary level of prevention was the first line of defense, and teachers delivered strong, standards-based instruction, differentiated according to student need, and administered regular formative assessments to closely track progress. In addition, if an entire class struggled with a particular concept and did not achieve at least 70 percent mastery, the concept was retaught to the class using different instructional techniques, sometimes with different teachers.
At this school, fidelity checks were expected and welcomed. The principal walked through at least one teacher’s classroom each day and gave written feedback to her staff at least 12 times per week. The principal was also engaged with the students and spoke with them about their lessons, understanding of the content, unit objectives, and learning agendas. These student conversations were an important part of this school’s primary level of prevention. All teachers posted the day’s objectives along with all the essential objectives on the classroom board daily.
Secondary-level interventions. When screening scores indicate that a student is at risk, that student receives more intense instruction in secondary level interventions.
1 Some schools offered some type of extended learning time outside of normal school hours. Examples include before or after school, teacher or peer-led tutoring, Saturday school classes, or teacher-led study halls.
“We put our big bucks in tier 1 [primary prevention].”
Middle School Principal
“When we started RTI, our school was one of the lower performing in the state. Now, every single school in the district is excelling and it is because of the fidelity to tier 1 [primary level of prevention]. The curriculum department took a hard look at tier 1 to make sure it met the standards.”
Middle School Principal

14RTI in Middle Schools: The Essential Components
“Secondary prevention typically involves small-group instruction that relies on evidence-based interventions that specify the instructional procedures, duration (typically 10 to 15 weeks of 20- to 40-minute sessions), and frequency (three or four times per week) of instruction. Secondary prevention has at least three distinguishing characteristics: it is evidence-based…; it relies entirely on adult-led small-group instruction…; and it involves a clearly articulated, validated intervention, which should be adhered to with fidelity” (National Center on Response to Intervention, 2010, pp. 10–11).
In all participating middle schools, the secondary level of intervention was provided to students in addition to the general education curriculum. Students always received the core curriculum, and secondary level interventions were considered supplemental instruction to ensure academic proficiency and success. To guarantee that students received the core curriculum, most students received secondary level instruction in lieu of their elective classes.
The participating middle schools intensified secondary level instruction in several ways:
●● Smaller sizes for specialized classes (most schools had around a 1:10 teacher/student ratio)
●● Homogeneous classes of students with similar instructional needs
●● Expert teachers prepared to deliver instruction in the specific areas of concern
●● Greater frequency and duration of instruction
Instructional procedures. Many of the participating schools used standard protocols (e.g., evidence-based, validated, prepackaged, possibly scripted instructional programs) for reading and mathematics. Several schools used curricula they already had; others bought programs that best aligned with their needs and supplemented the core curriculum. For example, one school identified the need for reading classes that targeted fluency and reading comprehension.
Therefore, they researched programs that focused specifically on fluency and comprehension. Once teachers received professional development in the instructional programs, the school checked for fidelity of instruction and monitored progress frequently to ensure adequate student responsiveness. Most schools started with just a few instructional program options, which was more manageable for training teachers and scheduling classes than having a lot of choices for each academic component. As schools moved forward in implementation, they collected information on which instructional procedures worked best and which needed to change. Those schools implementing for the longest time had a menu of standard protocols from which to choose when determining students’ instructional needs.
Expert teachers. The teachers responsible for teaching these small-group, secondary level intervention classes were largely general education content-area teachers. For example, in one middle school, each of the three English teachers taught one secondary level reading class, and the mathematics teachers taught the secondary level mathematics classes. Prior to teaching the classes, the teachers received professional development on the specific instructional programs they would teach. A couple of the middle schools, usually with grant funds, were able to hire interventionists, whose sole job was to teach the more intensive classes. In a few cases, schools recruited other teaching-certified staff members, such as reading specialists or counselors, to teach the secondary level intervention classes. For example, one school used its counselors to teach the behavior-specific intervention classes. No matter the background of the instructor, all teachers of intervention classes were specifically prepared to teach the intensive instructional methods.
15RTI in Middle Schools: The Essential Components
Frequency and duration. In most of the middle schools, secondary level intervention classes were taught during elective class time for a full class period (e.g., 45 minutes), five days a week. Some schools offered classes in a block framework, where classes met every other day for a longer period of time (e.g., 90 minutes, every other day). All middle schools involved in the study reported that students received intervention until progress-monitoring data indicated that the students were ready to return to their classes.
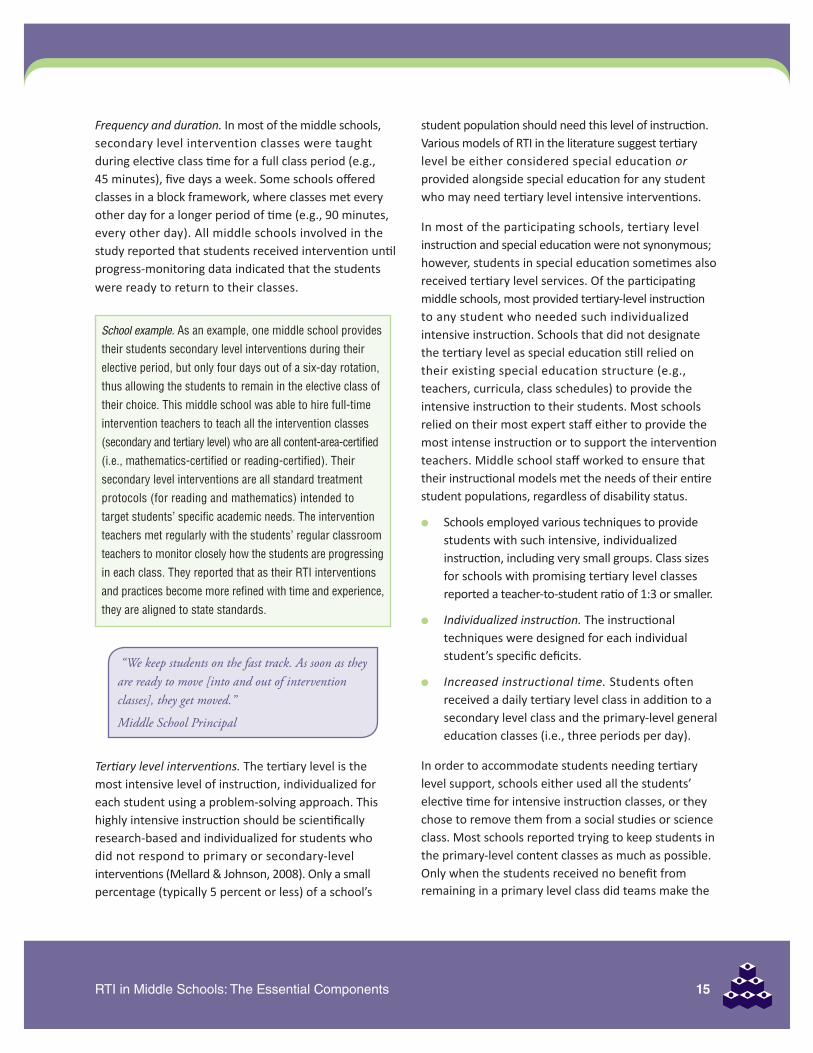
Tertiary level interventions. The tertiary level is the most intensive level of instruction, individualized for each student using a problem-solving approach. This highly intensive instruction should be scientifically research-based and individualized for students who did not respond to primary or secondary-level interventions (Mellard & Johnson, 2008). Only a small percentage (typically 5 percent or less) of a school’s
student population should need this level of instruction. Various models of RTI in the literature suggest tertiary level be either considered special education or provided alongside special education for any student who may need tertiary level intensive interventions.
In most of the participating schools, tertiary level instruction and special education were not synonymous; however, students in special education sometimes also received tertiary level services. Of the participating middle schools, most provided tertiary-level instruction to any student who needed such individualized intensive instruction. Schools that did not designate the tertiary level as special education still relied on their existing special education structure (e.g., teachers, curricula, class schedules) to provide the intensive instruction to their students. Most schools relied on their most expert staff either to provide the most intense instruction or to support the intervention teachers. Middle school staff worked to ensure that their instructional models met the needs of their entire student populations, regardless of disability status.
●● Schools employed various techniques to provide students with such intensive, individualized instruction, including very small groups. Class sizes for schools with promising tertiary level classes reported a teacher-to-student ratio of 1:3 or smaller.
●● Individualized instruction. The instructional techniques were designed for each individual student’s specific deficits.
●● Increased instructional time. Students often received a daily tertiary level class in addition to a secondary level class and the primary-level general education classes (i.e., three periods per day).
In order to accommodate students needing tertiary level support, schools either used all the students’ elective time for intensive instruction classes, or they chose to remove them from a social studies or science class. Most schools reported trying to keep students in the primary-level content classes as much as possible. Only when the students received no benefit from remaining in a primary level class did teams make the
School example. As an example, one middle school provides
their students secondary level interventions during their
elective period, but only four days out of a six-day rotation,
thus allowing the students to remain in the elective class of
their choice. This middle school was able to hire full-time
intervention teachers to teach all the intervention classes
(secondary and tertiary level) who are all content-area-certified
(i.e., mathematics-certified or reading-certified). Their
secondary level interventions are all standard treatment
protocols (for reading and mathematics) intended to
target students’ specific academic needs. The intervention
teachers met regularly with the students’ regular classroom
teachers to monitor closely how the students are progressing
in each class. They reported that as their RTI interventions
and practices become more refined with time and experience,
they are aligned to state standards.
“We keep students on the fast track. As soon as they are ready to move [into and out of intervention classes], they get moved.”
Middle School Principal
16RTI in Middle Schools: The Essential Components
decision to have tertiary level intervention replace primary level instruction (as opposed to supplementing it). When replacement instruction occurred, many schools provided the student with both secondary and tertiary level classes to ensure they received increased instructional intensity in the subject area. The goal for all schools was to move students back into the primary level class as soon as possible.
Many schools reported that as they focused on meeting students’ instructional needs in the primary and secondary levels, they had relatively few students requiring tertiary level interventions.
Most middle schools built their multi-level prevention system by implementing primary level strategies and instruction first, identifying and implementing secondary-level intervention classes second, then building their tertiary level intervention classes third. The goal was to provide such solid instruction at the primary and secondary levels that very few students need the individualized instruction at the tertiary level.
Conclusion
In the 42 middle schools interviewed, we observed that the essential components of RTI were implemented similarly to elementary school models, with adjustments made for logistical and structural differences in secondary school settings. Each essential component depends upon the others to form a successful RTI framework in the middle schools. Using decision rules for analyzing screening data, school staff can quickly identify students with at-risk status and in need of additional academic intervention. Data-based decision making is pivotal in informing staff which students need which level of interventions (e.g., peer tutoring in the language arts primary-level classes, or standard treatment protocol reading comprehension in secondary-level intervention classes). Throughout the intervention classes, student progress is monitored with assessments that measure their rate of progress toward an expected goal. The progress monitoring data collected provide school staff the critical information about whether a student is responsive to the provided interventions.
Implementing RTI is a process that requires planning, research, collaboration, and organizational change. At the same time, many of the interviewed schools observed positive results from their efforts. Several middle schools reported anecdotal data that, once the essential components were in place, they observed an increase in their high-stakes assessment scores. And, they believed their students were learning more efficiently when they received instruction that met their learning needs.
“We try to meet student needs in tier 2 [secondary level] and we have an average of 4 to 5 students in tier 3 [tertiary level] annually. Most of the students receive the help and support they need in tier 2.”
Middle School Principal
School examples. In one middle school, the staff set up the
tertiary level structure so that:
●● Students’ schedules are individualized (each student’s
day is arranged precisely to fit their academic and
behavioral needs).
●● Each instructional session is a class period in length.
●● The student teacher ratio is 4–5:1 for reading and
3–4:1 for mathematics.
●● Classes are taught by content-area-certified teachers
proficient in the intervention program.
●● Tertiary level classes are in lieu of science or social
studies classes; thus, the students remain in the
primary reading and mathematics courses. Numerous additional resources exist to help middle schools
plan out their RTI implementation processes, including RTI
Scheduling Processes and Practices at the Middle School Level
and RTI Implementation Processes for Middle Schools. These
and other secondary-school specific tools and products are
provided at www.rti4success.org.

17RTI in Middle Schools: The Essential Components
References
Batsche, G., Elliott, J., Graden, J. L., Grimes, J., Kovaleski, J. F., Prasse, D., et al. (2005). Response to intervention: Policy considerations and implementation. Alexandria, VA: National Association of State Directors of Special Education.
Fuchs, L. S., Fuchs, D., & Compton, D. L. (2010). Rethinking response to intervention at middle and high school. School Psychology Review, 39(1), 22–28.
Johnson, E., Mellard, D. F., Fuchs, D., & McKnight, M. A. (2006). Responsiveness to intervention (RTI): How to do it. Lawrence, KS: National Research Center on Learning Disabilities.
Kovaleski, J. F., Roble, M., & Agne, M. (2008). The RTI data analysis teaming process. Retrieved from www.rtinetwork.org/essential/assessment/data-based/teamprocess
Kovaleski, J. F., & Pedersen, J. A. (2008). Best practices in data analysis teaming. In A. Thomas & J. Grimes (Eds.), Best practices in school psychology V (pp. 115–130). Bethesda, MD: National Association of School Psychologists.
Mellard, D. F. & Johnson E. (2008). RTI: A practitioner’s guide to implementing response to intervention. Thousand Oaks, CA: Corwin Press.
National Center on Response to Intervention. (2010). Essential components of RTI¬—A closer look at Response to Intervention. Retrieved from http://www.rti4success.org/images/stories/pdfs/ rtiessentialcomponents_051310.pdf
Shinn, M. (2008). Implementation in secondary schools. In S. Fernley, S. D. LaRue, & J. Norlin (Eds.), What do I do when: Answer book on RTI (pp. 1–17). Arlington, VA: LRP.
Tackett, K. K., Roberts, G., Baker, S., & Scammacca, N. (2009). Implementing response to intervention: Practices and perspectives from five schools. Portsmouth, NH: Center on Instruction at RMC Research Corporation.
Vaughn, S., Cirino, P. T., Wanzek, J., Wexler, J., Fletcher, J. M., Denton, C. D., et al. (2010). Response to intervention for middle school students with reading difficulties: Effects of a primary and secondary intervention. School Psychology Review, 39(1), 3–21.
18RTI in Middle Schools: The Essential Components
Appendix A
Our Approach
Staff from the National Center on Response to Intervention (NCRTI) used a mixed-method evaluation model to collect descriptive data from middle schools that were implementing Response to Intervention (RTI). Staff conducted telephone interviews with school administrators, held onsite administrative and staff discussion groups, observed multi-level prevention classes, and observed meetings with district and middle school personnel about the conceptualization, implementation, essential components, outcomes, and current status of their RTI practices.
Staff from NCRTI used a snowball sampling method from such venues as school websites, RTI summits, conference presentations, self-nomination, peer nomination, and publications to initially identify potential middle school sites that exhibited some level of RTI planning and implementation. We contacted 82 principals and asked them to participate in this project. Forty-two agreed to participate and also met our initial selection criteria of implementing the four essential components of RTI. We conducted in-depth, two-hour phone interviews with administrative staff from these 42 schools.
The next stage of data collection involved telephone-based data-collection surveys. At minimum, we sought to include schools with the following criteria (based on Shinn, 2008):
●● One screening assessment at least once per year in one content area
●● Progress monitoring at least once per month for secondary level interventions
●● Progress monitoring at least twice per month for tertiary level interventions
●● At least three levels (or tiers) of prevention
●● A predetermined data-based decision-making process
We invited 20 schools that met all the above selection criteria to participate in the follow-up phone survey. Of the 20 invited, 17 schools participated in the follow-up data collection phone survey that included questions to obtain information about the following areas:
●● Data collection activities
●● School-wide screening scores
●● Progress-monitoring data collection
●● Student movement in the multi-level prevention system
●● Number of students at each instructional level
●● Fidelity of implementation practices
●● Professional development practices
When schools demonstrated positive student outcomes as indicated in their data, we asked to visit to observe RTI practices and identify implementation characteristics that were common among the middle schools. We visited 12

19RTI in Middle Schools: The Essential Components
middle schools. Most of these 12 schools served sixth, seventh, and eighth grades. The schools were rural, suburban, and urban, located in all regions of the United States: Northeast, South, Midwest, Southwest, and West. The schools’ populations ranged from a low of 172 to a high of 1,436 students, with the median population at 658 students.
The schools were also economically diverse. Measured by percentage of reported free or reduced-price lunch, the percentage of economically disadvantaged students ranged from a low of 7.9 percent to a high of 81.1 percent of the school population. The schools’ ethnic diversity also varied. The nonwhite population ranged from a low of 5.1 percent to a high of 82.6 percent across schools. The average nonwhite population was 30 percent.
The on-site visits had four components:
●● Three discussion groups with school faculty about implementation processes, staff roles, benefits for students and staff, challenges, and next steps
●● An interview with the principal about implementation activities, professional development, the leadership team, scheduling, structures, staffing, resources, and the role of parents
●● Observations of data team meetings to gather information about data-based decision making, discussion structure, agenda, staff involvement, frequency, and length
●● Observations of classes at each intervention level, focusing on class structure, length, numbers of students, instructional program/strategy, adherence, exposure, quality of delivery, program differentiation, and student engagement
The information presented in this document represents information from the 42 schools that participated in the initial phone interview with NCRTI staff.

20RTI in Middle Schools: The Essential Components
National Center on Response to Interventionhttp://www.rti4success.org
About the National Center on Response to Intervention
Through funding from the U.S. Department of Education’s Office of Special Education Programs, the American Institutes for Research and researchers from Vanderbilt University and the University of Kansas have established the National Center on Response to Intervention. The Center provides technical assistance to states and districts and
builds the capacity of states to assist districts in implementing proven response to intervention frameworks.
This document was produced under U.S. Department of Education, Office of Special Education Programs Grant No. H326E070004 to American Institutes for Research. Grace Zamora Durán and Tina Diamond served as the OSEP project officers. The views expressed herein do not necessarily represent the positions or policies of the Department of Education. No official endorsement by the U.S. Department of Education of any product, commodity, service or enterprise mentioned in this publication is intended or should be inferred. This product is public domain. Authorization to reproduce it in whole or in part is granted. While permission to reprint this publication is not necessary, the citation should be: National Center on Response to Intervention (January 2013). RTI in Middle Schools: The Essential Components. Washington, DC: U.S. Depart-ment of Education, Office of Special Education Programs, National Center on Response to Intervention. Publication Number 2313_10/12
National Center on Response to Intervention1000 Thomas Jefferson Street, NW
Washington, DC 20007 Phone: 877–784–4255
Fax: 202–403–6844Web: http://www.rti4success.org