National Center for Intermodal Transportation Economic ...
69
National Center for Intermodal Transportation & Economic Development Factors Affecting Recruitment Retention of Intermodal Transportation Workforce: Inclusion, Advancement, Vocational Interests & Selection NCITEC Project: 2012_21 Briana Hedman, Ph.D. Patton Garriott, Ph.D. National Center for Intermodal Transportation University of Denver Revised May 15, 2016
Transcript of National Center for Intermodal Transportation Economic ...

National Center for Intermodal Transportation &
Economic Development
Factors Affecting Recruitment Retention of Intermodal Transportation Workforce: Inclusion, Advancement,
Vocational Interests & Selection
NCITEC Project: 2012_21
Briana Hedman, Ph.D. Patton Garriott, Ph.D.
National Center for Intermodal Transportation University of Denver
Revised May 15, 2016

Hedman & Garriott
2
NCIT
Factors Affecting Recruitment Retention of Intermodal Transportation Workforce: Inclusion, Advancement,
Vocational Interests & Selection Briana Hedman, Ph.D. Patton Garriott, Ph.D.
National Center for Intermodal Transportation
University of Denver
2400 S. Gaylord
Denver, CO 80208

Hedman & Garriott
3
NCIT
Factors Affecting Recruitment Retention of Intermodal Transportation Workforce:
Inclusion, Advancement, Vocational Interests & Selection
Abstract
This report summarizes two projects that were intended to explore the factors related to retaining and recruiting transportation workers, specifically through perceptions of workplace climate and likelihood of choosing a career in transportation. Project #1 was designed to develop the Inclusiveness Inventory, a measure of inclusiveness that was based on the integration of prior research and theory. Test construction consisted of conceptual item development, expert review, and editing by members of the participating organization to improve clarity. Survey items were administered to employees at a large, mid-western transit agency as part of a larger study on workplace climate. This paper explored the structure of the Inclusiveness Inventory by factor analysis. The hypothesized factors of the Inclusiveness Inventory included the dimensions of diversity climate, fairness, belongingness, uniqueness, and discrimination. Secondly, this study evaluated the reliability and relationship of the Inclusiveness Inventory to employee job satisfaction and intention to quit. The results suggested a three-factor model and higher scores were related to greater job satisfaction and lower intention to quit. The results were considered in relationship to the implications and suggested directions for future research.
The purpose of Project #2 was to examine predictors of transportation career intentions across a sample of potential applications. A sample (N = 263) of students completed measures of: evaluative attitudes, social norms, anticipated sexism, perceived dissimilarity to individuals in the transportation field, and transportation career intentions. Results showed that males reported higher levels of perceived social norms and intentions for entering a transportation career compared to females. Conversely, females reported higher levels of anticipated sexism in transportation careers. A hierarchical regression analysis indicated that evaluative attitudes, social norms, and perceived dissimilarity to individuals in transportation predicted transportation career intentions. Mediation analyses revealed that social norms explained the relationship between gender and transportation career intentions. Results are discussed in terms of increasing and diversifying the transportation workforce pipeline.

Hedman & Garriott
4
NCIT
Table of Contents
Abstract .................................................................................................................................................... 3
Project #1: Development of an Inclusiveness Inventory ........................................................ 7 Introduction ........................................................................................................................................................ 7 Purpose of the Study ........................................................................................................................................ 9 Research Questions ....................................................................................................................................... 10 Hypotheses ....................................................................................................................................................... 10 Proposed Conceptual Model ...................................................................................................................... 10 Previous Research ......................................................................................................................................... 11
Theoretical Perspectives ............................................................................................................................................................ 9 Demographic Differences ......................................................................................................................................................... 11 Factors That Comprise the Construct of Inclusiveness .............................................................................................. 12
Diversity climate. ..................................................................................................................................................... 12 Fairness and justice ................................................................................................................................................ 15 Belongingness ............................................................................................................................................................ 16 Uniqueness .................................................................................................................................................................... 17 Discrimination ........................................................................................................................................................... 18
Current Measures of Diversity Climate and Inclusiveness ....................................................................................... 19 Inclusion-Exclusion Scale .................................................................................................................................... 19 Diversity Perceptions Scale ................................................................................................................................ 20 Workplace Exclusion Scale (WES) .................................................................................................................. 20 Workplace climate ................................................................................................................................................... 20 Need for a new measure ....................................................................................................................................... 21
Summary ......................................................................................................................................................................................... 22 Methodology .................................................................................................................................................... 23
Participants .................................................................................................................................................................................... 23 Procedure ........................................................................................................................................................................................ 24 Measures ......................................................................................................................................................................................... 25
Inclusiveness Inventory ....................................................................................................................................... 25 Demographic questionnaire .............................................................................................................................. 26 Job Satisfaction .......................................................................................................................................................... 26 Intention to Quit ....................................................................................................................................................... 26
Statistical Analysis ...................................................................................................................................................................... 26 Exploratory Factor Analysis ............................................................................................................................... 26 Confirmatory Factor Analysis............................................................................................................................ 27 Correlation and group differences ................................................................................................................. 27
Summary ......................................................................................................................................................................................... 27 Results ............................................................................................................................................................... 27
Exploratory Factor Analysis ................................................................................................................................................... 27 Correlations and Group Differences .................................................................................................................................... 33 Summary ......................................................................................................................................................................................... 34

Hedman & Garriott
5
NCIT
Discussion ......................................................................................................................................................... 34 Review of Results......................................................................................................................................................................... 35 Limitations ...................................................................................................................................................................................... 39 Implications ................................................................................................................................................................................... 41
References ............................................................................................................................................. 42
Project #2: The transportation career intentions of high school students .................... 47 Introduction ..................................................................................................................................................... 47
Theoretical Framework ............................................................................................................................................................ 47 Theory of Reasoned Action ..................................................................................................................................................... 48 Anticipated sexism. ..................................................................................................................................................................... 48 Perceived Dissimilarity ............................................................................................................................................................. 49
Purpose of the Study ..................................................................................................................................... 50 Method ............................................................................................................................................................... 51
Participants .................................................................................................................................................................................... 51 Instruments .................................................................................................................................................................................... 51
Procedure ......................................................................................................................................................... 53 Data Analysis ................................................................................................................................................................................. 53
Results ............................................................................................................................................................... 54 Preliminary Analyses ................................................................................................................................................................. 54 Primary Analyses ......................................................................................................................................................................... 54
Discussion ......................................................................................................................................................... 55 Implications. .................................................................................................................................................................................. 56 Limitations ...................................................................................................................................................................................... 57
References ............................................................................................................................................. 59
Appendix A – Inclusiveness Inventory Items ............................................................................ 62
Appendix B – Descriptive Statistics and Correlations ............................................................ 64
Appendix C – Figure of Mediation Relationship ....................................................................... 65
Hedman & Garriott
6
NCIT
List of Tables
Table 1. Employed persons by detailed industry, sex, race, and Hispanic or Latino ethnicity ...... 7 Table 2. Measures of Diversity Climate and Inclusiveness .......................................................... 21 Table 3. Participant Characteristics for Sample 1 and 2 (Total N = 869) ................................... 23 Table 4. Hypothesized Factors of Inclusiveness ........................................................................... 25 Table 5. Items, factors, means, and standard deviations for the three-factor model ................... 29 Table 6. EFA Factor Correlations ................................................................................................ 31 Table 7. Summary of Model Fit Indices ....................................................................................... 32 Table 8. CFA Scale Correlations and Reliability ......................................................................... 33
List of Figures
Figure 1. Mediating effect of social norms gender and career intentions. .................................... 65

Hedman & Garriott
7
NCIT
Project #1: Development of an Inclusiveness Inventory Introduction
In 2015 the Bureau of Labor statistics reported that approximately six and a half million people were employed in the transportation industry. Relatively speaking, a diverse population makes up the transportation workforce. Of those employed 22.7% were women, 19.7% were black, 4.9% were Asian and 18.9% were Latino. (See Table 1a). Inclusiveness is a concept that continues to gain popularity because there is a need to effectively manage a diverse workforce that is representative of the current population of the United States (Cox, 2001; Kossek & Lobel, 1996). Unfortunately, a singular definition of inclusivity in the context of businesses and organizations remains elusive in current literature and practice. Some authors favor a discrete definition, such as the conceptualization of a continuum of inclusion-exclusion from decision-making processes (Mor Barak, 2000; Mor Barak & Cherin, 1998; Mor Barak & Levin, 2002). Other authors suggest a more comprehensive definition that encompasses concepts of value in diversity, belongingness, and complete organizational cultural change (Miller, 1998; Shore et al., 2011). This disparity creates challenges for the implementation of inclusiveness as a concept for organizational improvement.
Table 1. Employed persons by detailed industry, sex, race, and Hispanic or Latino ethnicity
Industry
2015
Total employed
Percent of total employed
Women
Black or African American Asian
Hispanic or Latino
Transportation 6,459 22.7 19.7 4.9 18.8 Air transportation 539 33.7 13.7 4.4 14.6 Rail transportation 246 6.6 17.3 3.5 7.9
Water transportation 68 25.9 12.2 4.4 14.6 Truck transportation 2,018 11.4 14.2 2.9 21.2 Bus service and urban transit 481 39.3 30.5 5.3 19.7
Taxi and limousine service 337 12.6 29.0 18.5 14.2

Hedman & Garriott
8
NCIT
Note: Numbers in thousands The increased focus on inclusiveness in organizations is a current adaptation of how
diversity in the U.S. labor force is conceptualized. Organizations are responding to the fact that the demographics of the U.S. labor force are changing as the proportion of women and minorities continue to increase in comparison to White men (Toossi, 2009). Overt discrimination and exclusion of women and minorities from many job opportunities was commonplace until legislation passed in the 1960s and made such practices illegal. Changes continue as the U.S. evolves from a position of correcting past inequalities in employment (i.e., affirmative action) to embracing the value associated with employee differences.
A business case has been made that links effective diversity management to benefits such as a more productive and creative workforce, increased employee loyalty, and higher attractiveness to potential applicants (Cox, 2001; Lee, 2008; van Marrewijk, 2004; Wooten, 2008). Improved diversity management and the promotion of an inclusive work environment could be especially beneficial in the sector of transportation jobs. There is a projected staffing shortage due to the inability to attract new workers at the rate of retirement (Toole & Martin, 2004) and there is a need to hire and develop trained professionals to fill these positions. Women and minorities continue to be underrepresented in the transportation industry and are an untapped resource to fill transportation jobs at all levels. There is an abundance of literature linking perceptions of organizational climate to outcomes such as job satisfaction, intention to quit, psychological well-being, and general health (Carr, Schmidt, Ford, & DeShon, 2003; Parker et al., 2003). While some literature suggests that this might be especially true for employees who identify as belonging to minority groups (Mor Barak & Levin, 2002; Settles, Cortina, Stewart, & Malley, 2007), other literature suggests that diversity climate affects all employees, regardless of demographic differences (Ensher, Grant-Vallone, & Donaldson, 2001; Wessel & Ryan, 2012). Despite the lack of consistent findings linked to identity differences, both diversity management and inclusiveness have been identified as important components of organizational climate. There is also no clear agreement on exactly which factors contribute to effective diversity management or the creation of an inclusive organization. There is clearly a need to better understand the concept of inclusiveness, including the determinants and outcomes of an inclusive organizational climate (Roberson, 2006). The current lack of clarity may be contributing to the disconnect between the aspirational goals of organizations and the real-life implementation of methods designed to change organizational culture. The development of a theoretically-based model and measure of inclusiveness could be important for both the recruitment and retention of a diverse workforce. In their review of organizational impression management Avery and McKay (2006) indicated that organizations need to recognize that women and minorities place higher importance on issues of fairness and inclusion when seeking employment. In order to successfully recruit women and minorities organizations need to effectively communicate that they value diversity beyond a motive to

Hedman & Garriott
9
NCIT
“meet a quota.” Having and utilizing a measure of inclusiveness could potentially be an indicator that an organization values employee perceptions of climate beyond a simple head count. In addition, tracking only objective measures of diversity practices may be insufficient for improving organizational outcomes. For example, in one research study there was no connection found between the number of formal complaints about discrimination and perceptions of discrimination, however there was a strong negative relationship between perceptions of discrimination and job satisfaction, organizational commitment, and organizational citizenship behavior (Ensher et al., 2001). Another study purposefully chose to compare three organizations that each had a reputation for successful recruitment and retention of diverse workforces in order to demonstrate the differences in perceptions of diversity climate (Ely & Thomas, 2001). Their findings help to explain how underlying values about diversity can impact work group functioning so that diversity can have a positive or negative effect on interpersonal work relationships and outcomes, even in organizations that do employ a diverse workgroup. This is consistent with the lack of reliable empirical support for the benefits of diversity management and the suggestion to measure level of diversity acceptance and valuing of differences, rather than measuring proportional representation (Gilbert, Stead, & Ivancevich, 1999; Kochan et al., 2003). Another reason to measure perceptions of climate is that there may be inconsistencies between an organization’s formal and informal practices in regard to diversity. These kind of ambiguous climates may actually have additional negative consequences. If for example an organization has a “zero tolerance policy against discrimination” but employees actual experiences of discrimination are high, then the efforts to support diversity could be seen as hypocritical and make the situation worse (Triana, Garcia, & Colella, 2010). Some findings suggest that there is a connection between successful diversity initiatives and the use of measures of climate. In a report that evaluated the initiatives and outcomes at universities that received funding to increase the participation of women in the academic fields of science and engineering the authors determined that measuring the progress of initiatives with research, such as climate studies or tracking of other indicators, was related to more successful institutional transformation (Bilimoria, Joy, & Liang, 2008). The authors suggested that research and evaluation should be a critical element of any initiatives designed to increase the participation of women and minorities. All of these findings lend support to the need to develop a measure of employee perceptions of inclusiveness as a way to improve and track the impact of diversity initiatives at organization
Purpose of the Study The purpose of this study is the development of a measure of inclusion based on theory. The study has two main objectives: first, to develop an empirically supported and comprehensive measure of inclusiveness that will incorporate the factors of employee perceptions of diversity climate, fairness, belongingness, uniqueness, and discrimination. Additionally, the instrument
Hedman & Garriott
10
NCIT
will assess the extent to which those perceptions are related to individual employee outcomes such as job satisfaction and turnover intention.
Research Questions Using a measure developed with a public transit organization, the following research questions will be addressed: 1. What is the factor structure for the Inclusiveness Inventory? 2. Will scores on the Inclusiveness Inventory produce adequate reliability estimates? 3. Will the Inclusiveness Inventory be related to job satisfaction and turnover intention? 4. Will there be differences between men and women on the Inclusiveness Inventory? 5. Will there be differences between Whites and people who identify as racial or ethnic minorities on the Inclusiveness Inventory?
Hypotheses Based on the above research questions, the following are the research hypotheses: 1. Employees who have higher ratings of inclusiveness will have higher levels of job satisfaction and lower levels of turnover intention. 2. Women will have lower ratings of inclusiveness, lower levels of job satisfaction, and higher levels of turnover intention compared to men. 3. People who identify as racial or ethnic minorities will have lower ratings of inclusiveness, lower levels of job satisfaction, and higher levels of turnover intention compared to Whites.
Proposed Conceptual Model

Hedman & Garriott
11
NCIT
Previous Research
The proportion of women and minorities in the workforce continues to increase in the United States, creating opportunities and challenges for organizations. In a report by the New York Labor Market Information Service published by the City University of New York, in 2007, a total of 3% of NYC Transit employees were female, 41% were black and 20% were Hispanic (NYLMIS, 2007). According to the Department of Labor, the rate of growth of women in the workforce is projected to continue to increase faster than men (Toossi, 2009). At the same time, the proportion of White non-Hispanic workers is expected to continue to decline from the rate of 79% in 1988 to 64% in 2018 (Toossi, 2009). As a result of the country’s demographic changes organizations have recognized that they must make efforts to effectively manage a diverse workforce (Kossek & Lobel, 1996). Historically, women and minorities were excluded entirely from participation in many sectors of the labor market. The Civil Rights movement and corresponding legislation made overt exclusion illegal, however women and minorities continue to be underrepresented in certain fields and at higher levels of power as compared to White men (Federal Glass Ceiling Commission, 1995; Padavic & Reskin, 2002). There are also ongoing disparities regarding wage earnings as Hispanics and Blacks earn less than Whites and Asians, and women earn less than men (U.S. Department of Labor, 2011).
Factors of Inclusiveness Diversity Climate
Fairness Belongingness
Uniqueness Experiences of Discrimination
Job Satisfaction Intention to Quit

Hedman & Garriott
12
NCIT
Transportation is one such industry that continues to be dominated by men with only 15% women represented (U.S. Department of Labor, 2011). There has been concern about an upcoming shortage of workers in the transportation sector “as nearly half of thatworkforce will be eligible for retirement in the next ten years” (U.S. Department of Transportation, 2013). The U.S. Department of Labor has identified transportation as a high-growth industry but challenges to meeting that labor need include low public image, poor access to non-traditional labor pools (e.g. women), and loss of workers to the private sector (U.S. Department of Labor, 2007). The ability to recruit and retain diverse workers will be particularly critical for this industry if it is to meet the existing workforce challenges. Affirmative action has been used across industries as a strategy to correct for historical and ongoing discrimination in the employment of women and minorities, but the reactions to these types of policies have been mixed. Murrell and Jones (1996) reviewed reports on the effectiveness of such policies and determined that affirmative action has contributed to the increased participation and earnings of women and minorities in the workforce without evidence of decreased productivity or performance. However, despite the effectiveness of affirmative action it remains controversial (Mor Barak, 2011; Reskin, 1998), such as recent claims of “reverse discrimination” going all the way to the Supreme Court. Even the beneficiaries of antidiscrimination policies can have negative reactions because of the perception that they may have been hired based on their race or gender rather than merit (Heilman, 1996). The ongoing controversy surrounding affirmative action may have contributed to the embrace of “diversity management” programs starting in the 1990’s (Yakura, 1996). While equal rights legislation and affirmative action policies have the goal of eliminating discrimination and increasing diversity in the workplace, diversity management is seen as a voluntary strategy with the goal of improving the environment of the workplace in order to benefit from diversity (Cox, 2001; Gilbert et al., 1999; Kossek & Lobel, 1996; Mor Barak, 2011). For example, Yakura (1996) stated that, “managing diversity…is a business initiative that refers to the goal of having every individual within an organization achieve their potential” (p. 35). This ostensibly less controversial strategy continues to gain popularity among organizations. Highlighting the progress made, it is currently the case that the majority of large organizations in the U.S. have some sort of diversity initiative (Society for Human Resource Management [SHRM], 2010), whether it is a statement of Equal Employment Opportunity (EEO) practices, a diversity awareness training program, a diversity council, mentorship, or other program. Unfortunately, the empirical evidence of the effects of diversity management initiatives continues to be lacking or inconsistent (Kochan et al., 2003). For example, in the large-scale and multi-site project conducted over a period of five years by the Diversity Research Network the authors highlighted the challenges of obtaining objective data to test for the positive or negative effects of diversity. Over the course of two years and after discussing possible data collection with 20 interested companies to test the business case for diversity only four actually participated in the research. The authors found that few organizations had any method for assessing the impact of diversity efforts and in some cases there was even a reluctance to implement objective

Hedman & Garriott
9
NCIT
measures. Barriers to participation included legal counsel against it, time and resource concerns (i.e. employee time), and beliefs that there was already enough support for diversity efforts at the organization so data collection was unnecessary. In general, the organizational-level outcomes remain poorly studied but preliminary evidence suggests that there may be both positive and negative consequences to increased diversity depending on organizational context. However, companies may be reluctant to give up the vague ideal that diversity is important and that every employee can reach his or her potential and thus avoid the hard data that may reveal a more complex reality. (Kochan et al., 2003) The concept of creating an inclusive organizational culture is a relatively new development. However there is some debate as to whether this represents a substantive difference with existing diversity management practices or simply a change in terminology. Some authors use definitions of diversity management or inclusiveness that contain one or both terms. For example, Mor Barak (2011) combined the concepts by defining diversity management as, “the voluntary organizational actions that are designed to create greater inclusion [emphasis added] of employees from various backgrounds into the formal and informal organizational structures through deliberate policies” (p. 235). Part of the confusion seems to exist because there is a disconnect between practitioners and academics. In an article for Public Personnel Management the president and CEO of the Kaleel Jamison Consulting Group claimed that they “began using the concept of ‘inclusion’ in 1990…in part to differentiate between true culture change and a mere change in head-count” (Miller, 1998, p. 160). Miller (1998) went on to define the difference between diversity as the “make-up of a group,” while “inclusion describes which individuals are allowed to participate and are enabled to contribute fully in the group” (p. 151). Roberson (2006) explored the conceptual differences between diversity and inclusion by asking human resource representatives for their definitions. The findings indicated that although some distinctions were made, there was ultimately so much overlap in the factor analysis that the author concluded, “inclusive work practices and diversity-related outcomes may be characteristic of organizations that are diverse and/or inclusive,” and moreover, “the move from diversity to inclusion in organizations may primarily represent a change in language rather than a material change in diversity management practices” (p. 230). Although there is some cynicism regarding the changing terminology (Roberson, 2006; Yakura, 1996), it is clear that organizations have identified diversity and inclusiveness as critical to their success (Cox, 2001; Kossek & Lobel, 1996; Mor Barak, 2011). It is widely accepted as good business practice to consider workplace diversity issues from not just the legal and ethical perspectives (“the right thing to do”), but also from the “bottom line” perspective of being profitable (Cox, 1993; Frink et al., 2003; McKay, Avery, & Morris, 2009). Additionally, a large body of literature supports the connection between employee perceptions of climate and many organizational and individual outcomes, such as intention to quit, job satisfaction, productivity, and general health and well-being, which is discussed in further detail below.
Theoretical Perspectives

Hedman & Garriott
10
NCIT
Much of the literature regarding diversity and inclusiveness is grounded in social identity theory. Social identity theory was first developed by social psychologists Henri Tajfel and John Turner in the 1970s as a way to understand intergroup conflict and individual identity in social context. The central concepts are that (1) social identity is part of an individual’s self-concept that derives from belonging to a social group along with the emotional significance of that membership (Tajfel, 1981). This social identity is both long-lasting and contextually driven, such that in some situations group membership may be more or less important than personal identity (Tajfel, 1981; Turner, 1982). In addition, each individual has multiple group memberships and one may be more or less salient in a given context (Tajfel, 1981; Turner, 1982); (2) People are motivated to have a positive social identity and want to belong to positively viewed social groups (“positive distinctiveness”; Turner, 1982). (3) The desire to enhance self-esteem is one reason that people tend to favor in-group members over out-group members (Turner, 1985); (4) “Where the in-group lacks positive distinctiveness, members will be motivated either to leave that group physically or dissociate themselves from it psychologically and aspire to membership of a higher status group or to adopt creative and/or competitive strategies to restore its positive distinctiveness.” (Turner, 1982, p. 34). One of those strategies may be to devalue or exclude people who are thought to be different, thus enhancing one’s own social group (Tajfel & Turner, 1986). (See Mor Barak, 2011 for a detailed review.) Mor Barak and fellow researchers have provided one of the few theoretically-based and most often cited definitions of inclusion for organizations (Mor Barak, 2000; Mor Barak & Cherin, 1998; Mor Barak & Levin, 2002). Based on social identity theory and the importance of group membership, inclusion is conceptualized as falling along an inclusion-exclusion continuum reflecting the extent to which individuals, especially those from minority groups, “feel part of important organizational processes that affect their jobs and the extent to which they have access to the organizational decision-making process and to its information networks” (Mor Barak & Levin, 2002, p. 136). Some of the strengths of this model are that it is based on theory and has been empirically tested and found to be related to important outcomes, such as intention to quit. However, the utility of this model may be limited because it only includes one possible dimension of inclusiveness and does not address any other potentially related factors. More recently, Shore et al. (2011) suggested a model of inclusiveness that is multidimensional and attempts to integrate a large body of prior research. The authors review the literature on organizational inclusion and diversity from the perspective of the Brewer’s optimal distinctiveness theory (ODT) which suggests that people are motivated to balance the need for both belongingness and uniqueness (Shore et al., 2011). Based on this framework there can be different levels of belongingness and value in uniqueness that contribute to experiences of exclusion (low belongingness/low value in uniqueness), assimilation (high belongingness/low value in uniqueness), differentiation (low belongingness/high value in uniqueness), or inclusions (high belongingness/high value in uniqueness) (Shore et al., 2011). Unlike the model that considers only access to decision-making (Mor Barak & Levin, 2002), this model allows for multiple contextual factors that may contribute to perceptions of inclusiveness such as fairness, diversity climate, leadership styles, and various formal and informal practices at an organization

Hedman & Garriott
11
NCIT
(Shore et al., 2011). The limitation of this definition, however, is that it has not been empirically tested and the level of contribution of each unique factor remains unknown. The importance of balancing uniqueness and belongingness is expressed in the definition of inclusiveness provided by the transportation company that participated in the current research project. The organization used the following as a guideline: "The Inclusiveness Committee has defined inclusiveness as the general feeling of acceptance of one's unique individual characteristics and point-of-view by members of his or her immediate work group and the organization as a whole.” Considering a more robust model of inclusiveness is warranted at this time because of the lack of consensus that remains in the current literature.
Demographic Differences
The research related to how demographic differences may impact perceptions of work climate and associated outcomes is mixed. Much of the research has focused on the highly visible social categories of gender and racial or ethnic identity. In some studies different identities were linked to different perceptions of the workplace. For example, a study conducted with a large sample of employees from an electronics company found that women and racial and ethnic minorities (both men and women) viewed their organization as less fair and less inclusive than White men (Mor Barak, Cherin, & Berkman, 1998). Similar findings have been seen across settings, including universities (Bilimoria et al., 2008), factories (Gruber & Bjorn, 1982), policing (Gustafson, 2008), and other male-dominated occupations (Yoder, 2002). Moreover, there is a link between negative perceptions and negative outcomes, including low job satisfaction, high intention to quit, and low connection to the organization (Bilimoria et al., 2008; Findler, Wind, & Mor Barak, 2007). These different perceptions may partially account for the lagging participation of women and minorities in certain organizations and at higher levels of power. On the other hand, there is also research that suggests that all employees, regardless of social identity, are impacted by organizational climate. Several studies found no relationship between gender or race and perception of justice (Cohen-Charash & Spector, 2001), discrimination (Ensher et al., 2001), or organizational attachment (Gilbert & Ivancevich, 2001). In addition, the research supporting the existence of differences between groups has been critiqued. Wessel and Ryan (2012) point out that even in the study that did find that women valued diversity more than men (Mor Barak et al., 1998), the mean score for both was still above the midpoint, indicating that both groups valued diversity. In their own study the findings supported prior research that overall women perceived climate as being more sexist. However there was a significant negative relationship for both men and women between perceptions of a sexist climate and job satisfaction (Wessel & Ryan, 2012). This means that the men who did perceive a sexist climate for women had more negative affective reactions and had less job satisfaction than men who did not perceive sexism against women in the workplace. Some researchers have even suggested that men may be more sensitive to climate issues than women. Contrary to other studies, Hitlan, Cliffton, and DeSoto (2006) found that the

Hedman & Garriott
12
NCIT
perception of exclusionary behaviors at work were related to lower job satisfaction, lower psychological health, and higher self-esteem threat for men, but not for women. The researchers theorized that gender moderated the effect of exclusion because “men define themselves more in terms of their workplace performance than women” and thus the effect of exclusion was more directly related to negative outcomes (Hitlan et al., 2006, p. 221). Although this finding is limited to a single study, it does suggest that the issue is more complicated than simple categorizations may imply. Whether or not women and racial or ethnic minorities have different perceptions of organizational climate and if those perceptions impact outcomes differently remains to be determined. There have also been suggestions to consider a wider range of social identities when studying organizational climate, such as sexual orientation, immigration status, disability, and religion, however doing so is beyond the scope of the current study. One thing that is consistent across the literature is that negative perceptions of climate are linked to negative outcomes for employees and there is widespread agreement that measuring subjective perceptions is critical (Bilimoria et al., 2008; Cox 1993; Ensher et al., 2001; Hitlan et al., 2006; Mor Barak et al., 1998; Mor Barak & Levin, 2002; Wessel & Ryan, 2012). Based on this review, then, it seems that negative perceptions of diversity climate can have an impact for all employees, not just the targets of discrimination, but that it may still be important to look for potential differences across groups.
Factors That Comprise the Construct of Inclusiveness
The promotion of inclusiveness has developed as a way for organizations to acknowledge and benefit from the wide range of demographic and other differences that exist within the workforce. However, as a relatively new concept there are still different meanings and definitions of inclusiveness. Because inclusiveness is still a relatively new term in the literature, it is important to look at potentially related constructs of diversity climate, fairness, belongingness, uniqueness, and discrimination. Diversity climate. The research related to workplace diversity climate shares considerable theoretical and practical overlap with workplace inclusiveness. In fact, some authors use the terms interchangeably (Mor Barak, 2011) or question if there is any difference between the two concepts (Roberson, 2006). However, it is helpful to review the literature related to diversity climate because it has a longer history and has served as the foundation for more recent research about inclusiveness. Early work on diversity climate concentrated on the impact of relative numbers of employees who differed from the majority. Kanter’s “token theory” (1977) was a critical development in the literature as she explored the experiences of women in male-dominated corporations in her book Men and Women of the Corporation. Her theory suggested that it was system-level organizational structure, rather than individual characteristics, that best explained women’s experiences and lack of advancement (Gustafson, 2008; Kanter, 1977; Yoder, 2002). A “token” was defined as someone from a minority subgroup that made up 15 percent or less of the

Hedman & Garriott
13
NCIT
group. The consequences for women of being part of the proportional minority included greater visibility and performance pressure, isolation, and role encapsulation (Gustafson, 2008; Kanter, 1977; King, Hebl, George, & Matusik, 2010;). More recent research has supported the idea that relative representation is important and related to how employees perceive their organization. In the often cited study by Ely (1994) comparing the experiences of junior women in law firms with few or proportional number of women partners the findings showed that it was relative numbers of women in power, not the “intrinsic nature” of female relationships that was important. Women in male-dominated firms reported lower support from other women peers and superiors compared to women at balanced organizations. Women at balanced organizations reported that women superiors were a source of support, were seen as role models, and they had less distress related to competitive peer relationships with other women. This study demonstrated the importance of the demographic structure of organizations because the distribution of power may be one way that people from different identity groups make meaning of their situation and potential to advance (Ely, 1994). However, the experience of tokenism or being part of a minority in an organization must also be considered within the greater social context. For example, token men may be viewed more favorably and have less negative experiences than token women (King et al., 2010; Yoder, 2002). Tokenism intersects with social context such that token status is a negative experience for lower-status tokens, generally women and racial or ethnic minorities (Yoder, 2002). Importantly, “the negative outcomes associated with token numbers do not result from proportional scarcity alone but rather from underrepresentation combined with lower status” (Yoder, 2002, p. 5). In addition to social context, perceptions of an organization’s psychological climate may help to explain the relationship between token status and job-related outcomes. One study expanded on Yoder’s (2002) suggestion to consider social context and examined the relationship between a woman’s objective and subjective experience as a token and her perceptions of the gender climate at the organization (King et al., 2010). The objective measure of token status was measured by asking women to estimate the number of men and women at their organization. Subjective experiences of tokenism were measured by asking about experiences with increased visibility, social isolation, and gender role expectations. In two studies with women in the general population the authors found that women who reported both objective and subjective experiences of tokenism were more likely to perceive gender inequity in the organization. However, the subjective experience of tokenism mediated the relationship between objective token status and perceptions of climate. The findings support previous research (Ely, 1994; Kanter, 1977) demonstrating that while objective measures such as relative representation have an effect on individual’s perceptions and outcomes at an organization, it is the way in which an individual interprets the meaning of her token status that plays a role in shaping perceptions of organizational climate. Compared to research focused on objective measures of diversity the findings that link an individual’s perceptions of the diversity climate at an organization to outcomes has received more attention. The Interactional Model of Cultural Diversity (IMCD) developed by Cox (1993) was a turning point in the diversity literature. He argued that it was not only contextual factors, but perceptions of the climate that explained the connection between diversity and organizational

Hedman & Garriott
14
NCIT
performance. Diversity climate was understood to be the collective factors of individual identity, intergroup interactions, and organizational culture and structure. The climate of the organization, rather than the mere existence of diversity, could either have positive or negative impacts on individual career outcomes (i.e. commitment, turnover, satisfaction) and organizational outcomes (i.e. creativity, productivity) (Cox, 1993; Cox & Beale, 1997). With regard to the importance of perceptions Cox (1993) wrote, “What people believe about their opportunities in the work environment is of vital importance regardless of whether or not these beliefs are consistent with the facts” (p. 15) and strongly recommended the use of opinion data. A qualitative study conducted by Ely and Thomas (2001) was designed to develop a theory related to diversity perspectives at work. They identified three different organizational diversity perspectives based on the dimensions of employee perceptions of racial climate, level of value and respect, and the significance and meaning of racial identity at work. The most successful workgroup teams were in the organization that had an “integration-and-learning perspective,” which was characterized by high value of cultural identities and differences as a potential resource, as well as measuring progress by the degree to which traditionally underrepresented groups have power to change the organization. This was in contrast with the “access-and-legitimacy” perspective which valued workforce diversity for the purpose of access to minority markets and the “discrimination-and-fairness” perspective which used moral reasoning (“the right thing to do”) as the primary purpose for promoting diversity. These differences in diversity perspectives may help to explain the lack of success of some organizational policies designed to improve diversity climate and the discrepancy between objective and subjective measures of diversity climate. In fact, all of the organizations in the Ely and Thomas (2001) study had objectively successful diversity management programs and were able to recruit and retain minority workers at all levels, but the subjective experiences of those workers varied substantially. While this study has been important for the theoretical development of the concept of diversity climate, one of the major limitations is that it is difficult to gage the generalizability of the findings. The team that used the integration and learning perspective of diversity was relatively small (between 4 and 7 people) and a lot of time was spent discussing personal diversity issues, allowing for conflict and constructive conversations among coworkers. Translating the amount of time and energy spent on exploring misunderstandings, areas of improvement, and personal identity that made this perspective successful may be difficult in larger work groups and organizations. Research related to diversity climate is theoretically and practically related to inclusiveness. Relatively low numbers of minority representation has been linked to outcomes such as isolation, lack of advancement, and low satisfaction (Ely, 1994; Gustafson, 2008; Kanter, 1977; King et al., 2010). However, these proportional differences must be considered within the greater social context where some minority groups have lower status (typically women and racial and ethnic minorities) such that high-status tokens (i.e., White men) may not experience negative effects related to being part of a numerical minority at work (King et al., 2010). There is now a greater focus on the impact of psychological climate related to diversity rather than just focusing on proportional representation. An employee’s perceptions of how an organization views diversity, for example “tolerating” or embracing differences, have an impact on commitment,

Hedman & Garriott
15
NCIT
turnover, and satisfaction (Cox, 1993), even in organizations that are objectively diverse (Ely & Thomas, 2001). Fairness and justice. Organizational fairness and justice have been studied as related and interchangeable concepts that are linked to important organizational outcomes, such as intention to quit, organizational citizenship behavior, job satisfaction, and employee conflict (Cohen-Charash & Spector, 2001). There are two related but unique components of justice. Distributive justice is defined as the perceptions of fairness related to how resources are allocated, while procedural justice is related to the process of how decisions are made rather than the actual outcomes of those decisions (Cohen-Charash & Spector, 2001). The findings related to the importance of demographic differences in perceptions of justice are mixed. Some studies have found that women and minorities have lower perceptions of fairness as compared to White men (Mor Barak et al., 1998). The authors explained that White men may be more likely to look at a company’s formal policies and assess them to be fair, while women and minorities may have more experience with informal practices that are potentially discriminatory or otherwise unfair (Mor Barak et al., 1998). Supporting this connection, Triana and Garcia (2009) found that employees who had experienced workplace racial discrimination were more likely to perceive procedural injustice. It may be for these reasons that Shore et al. (2011) suggest that ensuring fair business practices for employees from underrepresented groups is particularly important because of past and current experiences of injustice. Despite evidence from some research that supports the claim that there are differences in perceptions across groups, a meta-analysis of 190 studies of justice in organizations found no relationship between employee age, gender, race, education, or tenure and perception of justice (Cohen-Charash & Spector, 2001). Due to the lack of a direct connection with demographic variables the authors suggest that it may be important for future research to look at the conditions under which group membership impacts perceptions of justice (Cohen-Charash & Spector, 2001). Despite the mixed evidence related to demographic differences, organizational practices and perceptions of fairness have been directly linked to definitions of inclusiveness. According to Shore et al. (2011), “a climate of inclusion is one in which policies, procedures, and actions of organizational agents are consistent with fair treatment of all social groups” (p. 1277, emphasis in original). Also, some of the concepts related to justice overlap with inclusiveness. For example, one element of procedural justice is voice, which has been defined, “as having input or influence in an organization in which one is a member” (Settles et al., 2007, p. 272). This is similar to the conceptualization of the inclusion-exclusion continuum as the extent to which employees feel they are part of organizational processes and decision-making (Mor Barak & Levin, 2002). It appears that justice and fairness are integral but not sufficient conditions for an inclusiveness workplace. In a qualitative study conducted by Ely and Thomas (2001) the authors described organizations with a “discrimination-and-fairness perspective” of diversity as being focused on “equal opportunities in hiring and promotion, suppressing prejudicial attitudes, and eliminating discrimination” and the belief that “a culturally diverse work group…is meant to be evidence of just and fair treatment of employees” (p. 245-246). While this may seemingly be a positive view, in practice it created a “color-blind” work environment where openly discussing

Hedman & Garriott
16
NCIT
issues related to diversity were discouraged because the measure of success (e.g. fairness in terms of numerical representation) had already been attained. Thomas and Plaut (2008) also make the case that the “mere existence” of formal organizational policies such as Equal Employment Opportunity (EEO) statements may contribute to subtle resistance to conversations about diversity because they are used as evidence that contributes to the myth that the organization does not have problems with discrimination (p. 17). In addition, the presence of formal policies or statements of fairness does not necessarily correspond to the informal practices and perceptions held by employees. The presence of organizational practices such having a “zero tolerance policy against discrimination” can actually have a negative impact if there are discrepancies between organizational statements and actual employee experiences. In the study by Triana et al. (2010) the authors found that for the predominantly African-American sample higher organizational support for diversity was associated with a more negative relationship between perceived racial discrimination and commitment to the organization. The authors suggest that the efforts to promote fairness with blanket statements could be seen as hypocritical and make the situation worse, especially when experiences of discrimination are high (Triana et al., 2010). Perceptions of organizational justice and fairness are related to how resources are allocated and how decisions are made (Cohen-Charash & Spector, 2001). It is unclear if membership in traditionally underrepresented groups is systematically related to different perceptions of fairness. Some authors have suggested that women and minorities may be more sensitive to issues of fairness, which may include a greater awareness of informal practices (Mor Barak et al., 1998; Shore et al., 2011). Others have found no connection of group membership and perceptions of fairness (Cohen-Charash & Spector, 2001). In general, formal organizational policies designed to ensure fairness and justice are only partially related to employee perceptions and outcomes (Thomas & Plaut, 2008; Triana et al., 2010). What is consistent across the literature is that the perceptions of justice and fairness, not the mere existence of policies, are related to employee satisfaction, commitment, and intention to quit (Cohen-Charash & Spector, 2001). Belongingness. Belongingness has been indentified as a fundamental human need (Baumeister & Leary, 1995). Research across disciplines shows that people are highly motivated to seek out and maintain social bonds and that lack of belongingness leads to negative effects, including depression, anxiety, increased stress, and poorer health (Baumeister & Leary, 1995). As such, belongingness is critical in how individuals experience social interactions, including being part of a work group or organization. Employee perceptions of belongingness to an organization and workgroup attachment are related to outcomes such as job satisfaction and commitment. In fact, the component of climate perception which included the interpersonal relations among workers was found to have the strongest relationship on job satisfaction and organizational commitment as compared to both the cognitive (e.g., opportunities for growth, autonomy) and instrumental (e.g. structure, extrinsic rewards) facets of climate (Carr et al., 2003). This suggests that the quality of relationships among workers is critical to employee satisfaction and may be more than or at least as important as other more objective job experiences, such as receiving incentives.
Hedman & Garriott
17
NCIT
Belongingness has been theoretically linked to diversity management and inclusiveness. In the Shore et al. (2011) model perceived belongingness is one of the dimensions that distinguishes inclusive work environments, which have high levels of belongingness, from either exclusion or differentiation, both of which are characterized by low levels of belongingness. Some suggest that one way of promoting belongingness may be through effective diversity management. Gilbert and Ivancevich (2001) were interested in how diversity management would impact organizational commitment and attachment. They compared an organization that made strong efforts to promote diversity with an organization that had no diversity goals other than compliance with affirmative action and measured the perceived work group attachment, organizational commitment, and self-reported employee absenteeism. Findings suggested that in the organization that had a high level of focus on diversity management all groups had greater perceptions of attachment and commitment compared to the second organization. In the organization that did not have a cohesive approach to diversity management women and minorities had lower perceptions of attachment compared to men and Whites, respectively. People are highly motivated to seek out and maintain connections with other people across many social experiences (Baumeister & Leary, 1995), including being part of a work group or organization. It is no surprise then that the affective experience of feeling a sense of belongingness and connection at work increases job satisfaction and commitment (Carr et al., 2003). A sense of belongingness may come from the individual connections one has with coworkers (Carr et al., 2003) and/or through the organization’s efforts to manage and value a diverse workforce (Gilbert & Ivancevich, 2001). Uniqueness. Feeling valued as a unique individual in the workplace is a theme that has garnered limited attention in the literature (Shore et al., 2011). The unique characteristics that an individual brings to the organization may or may not be related to diversity and social identity. Social identity theory predicts that part of one’s self-concept and self-esteem is defined by various group identities, so to that extent, “honoring differences which result from group memberships and equitably rewarding employees for dissimilar contributions is important” (Gilbert et al., 1999, p. 69). However, group membership is just one element that contributes to self-concept and factors beyond those related to social categorization must be valued as well. Along the same lines, an individual’s perception of being valued for his or her uniqueness is a distinct but related concept to the perception of diversity climate at the organization in general. For example, an individual’s experience of being valued or devalued by other employees can be measured independently from the perception of the organizational-level support of diversity (Triana & Garcia, 2009). This distinction may also explain why there is no consistent empirical support about how group membership contributes to perceptions of climate. As Yakura (1996) points out, managing diversity is related to the ideal of valuing the diversity and uniqueness of individuals and the “inclusion of all groups, legally protected or not” (p. 36). Valuing unique contributions from all employees, including those from groups who traditionally hold power, may be a way to prevent claims of reverse discrimination or reduce the sense of defensiveness that some employees may feel in response to the promotion of a “diversity agenda” (Thomas, 2008).

Hedman & Garriott
18
NCIT
The other side of the argument is that it can be detrimental to focus on uniqueness. From the perspective of tokenism theory, being part of a numerical minority increases stress through higher visibility and contrast within the “norm” of the organization (Gustafson, 2008). Tokens may feel a higher pressure to perform at a high level (“model minority”), to differentiate and be isolated from the majority, or to assimilate. Although some organizations may favor conformity, more take the perspective of Cox (1993) who has suggested that diverse organizations can benefit from new perspectives and improved access to a new markets that various employees bring. While this may demonstrate increased value of uniqueness over complete assimilation, it is still problematic. Ely and Thomas (2001) described this as the “access-and-legitimacy” perspective of diversity in which employees are valued for their unique contributions only in as much as it brings new business opportunities. Understanding how an individual’s perception of being valued at an organization connects to overall perceptions of climate and outcomes remains to be determined. Discrimination. One way of understanding inclusiveness is to look at the opposite, such as harassment, discrimination, and other forms of exclusion. Discrimination is understood to be the “behavioral bias toward a person based on the person’s group identity” (Cox, 1993) that can have an impact on access to jobs, promotions, and compensation regardless of ability (Mor Barak, 2011). It can occur at the individual, organizational, and/or institutional level (Ensher et al., 2001). Although it is now illegal to discriminate based on gender, race, or other legally protected characteristics, this kind of overt discrimination does still occur. In fact, in 2013 the U.S. Equal Employment Opportunity Commission (EEOC) received over 90,000 discrimination charges, two-thirds of which were related to discrimination based on race or gender (EEOC, 2013). Covert or subtle discrimination may include a preference to promote or hire people who are socially similar, what Kanter (1977) referred to as “homosocial reproduction.” Some people may also find limited access to informal social networks (Mor Barak & Cherin, 1998), which are often sources of important information for advancement. Both overt and covert forms of discrimination can have an impact on employee perceptions and outcomes. The negative effects of perceived discrimination include organizational outcomes such as low commitment (Triana & Garcia, 2009), decreased motivation (Cox, 1993), and decreased job satisfaction (Mor Barak & Levin, 2002), as well as general effects such as decreased life satisfaction, low self-esteem, and poorer health (Gruber & Bjorn, 1982). Organizations clearly have legal, moral, and bottom-line motivations to eliminate discriminatory practices. Like the other constructs related to inclusiveness, there has been a move to understand perceptions of discrimination rather than relying solely on objective measures. Ensher et al. (2001) found that perceptions of co-worker, supervisor, and organizational discrimination were all negatively related to job satisfaction, organizational commitment, and organizational citizen behavior. The results indicated that there were no differences in perceived discrimination between racial and ethnic groups, although it is important to note that a majority of the participants were minorities (22% White) and a majority were female (70%). The lack of significant differences between groups could possibly be related to the nature of the measure which asked about different levels of racism and sexism in general, and not necessarily

Hedman & Garriott
19
NCIT
discrimination directed at the individual, such as the statement, “My supervisor sometimes makes racist comments” (p. 61). However, it also suggests that the perception of a discriminatory climate at work can have negative effects for all employees, regardless of social identity (Ensher et al., 2001). In addition, the results did not find a link between perceptions of discrimination and number of grievances. The authors suggest that this might be related to the fact that the specific type of grievance was not indicated, thereby reducing the ability to detect a relationship (Ensher et al., 2001). However, this could also be an indication that measuring the number of formal complaints is not necessarily the best indicator for understanding the diversity climate at an organization. This is consistent with the finding that the majority of targets of sexual harassment, a form of sex discrimination, do not file an official charge (Gruber & Bjorn, 1982; Gutek, 2001). Employees may be reluctant to formally report discrimination for fear of either retaliation or inaction. This further supports the argument for measuring perceptions of climate in addition to objective measures.
Current Measures of Diversity Climate and Inclusiveness
Researchers and industry professionals agree that employee perceptions of workplace climate are important to measure, track, and understand because they are connected to both individual employee- and organizational-level outcomes. This call for better understanding has been especially strong in response to the growing demographic diversity of the workforce and the mixed results of various diversity initiatives. Despite the consensus about the importance of measurement, a cohesive model or measure does not exist that incorporates the potential dimensions of inclusiveness. Indeed the construct of inclusiveness remains elusive, with some researchers calling for a singular dimension (Hitlan et al., 2006; Mor Barak, 2011) and other calling for a more expansive conceptualization (Shore et al., 2011). This confusion and lack of agreement on the concept reduces the ability to study or implement inclusiveness in a meaningful way. There are also methodological problems with the current measurements available. In practice, the measurement tools may be unavailable because they are used by industry consultants on a case-by-case basis. In the research literature some of the problems with existing measurement tools are that they have little to no basis on past research or theory, inconsistent reporting of methods used to develop scales, and are lacking reported validity data. Similarly to the measures used in practice, the current measures used in research seem to be developed primarily for each study and specific research questions rather than attempting to develop a measure or test a model. The following section describes some of the current measures of diversity climate and inclusiveness. Inclusion-Exclusion Scale. The Mor Barak Inclusion-Exclusion Scale (Mor Barak, 2011) was designed to assess the extent to which employees feel that they are part of various organizational processes, including decision making and social or informational networks. It is a 15-item scale that measures perceptions of inclusion at various organizational levels, including

Hedman & Garriott
20
NCIT
the overall organization, workgroup, supervisor, higher management, and social or informal level. One of the strengths of this measure is that it was developed based on prior theory and research as a way to assess the potential consequences of being different from the majority at an organization. Another strength is that there is reported evidence of good reliability, as well as both convergent and divergent validity. However, the limitation of this measure is that inclusion is conceptualized as a one dimensional construct related to access to decision making. There are no domains that address other potentially important factors of inclusiveness, thus restricting a more comprehensive understanding of the construct. Diversity Perceptions Scale. The Diversity Perceptions scale was designed to measure employee perceptions of organizational diversity climate (Mor Barak et al., 1998). It is a 16-item measure that has two dimensions that are each comprised of two factors. Specifically, the organizational dimension consists of 1) Fairness and 2) Inclusion. The personal dimension consists of 1) Personal value of diversity and 2) Personal comfort with diversity. Like the Inclusion-Exclusion Scale (Mor Barak, 2011), the diversity perception scale was developed with a connection to theory. The method for item development and selection was described and included a review of literature, expert review, and editing after a pilot administration (Mor Barak, 2011). The scale demonstrates good internal reliability and there was evidence to support the four factor model structure (Mor Barak et al., 1998). There are several limitations with this scale. Although the four factor structure was empirically supported, it may not be appropriate to include an individual’s perceptions of his or her own personal comfort with and value of diversity in a measure of organizational perceptions of diversity. Also, the authors do not discuss how social desirability may impact responses to these items as people may want to appear more accepting of diversity in their own self-rating. The scale includes dimensions of fairness and perceptions of how diversity is valued at the organization but lacks other factors, such as an employee’s sense of value or belongingness at the organization. Workplace Exclusion Scale (WES). The Workplace Exclusion Scale (WES) is a 10-item measure that asks employees how often they have experienced various exclusionary behaviors from coworkers in the past year (Hitlan et al., 2006). The authors report good internal consistency, however, they only refer to discriminant validity without providing any data (Hitlan et al., 2006). Another weakness is that like the Inclusion-Exclusion Scale (Mor Barak, 2011) the WES looks at a very narrow definition of exclusion. In this case it is even more restricted because the questions are mostly related to exclusion from social networks, such as being excluded from conversations with coworkers. Therefore, the WES is not a comprehensive measure for assessing the overall perception of inclusion at the organizational level and is probably more related to relationships among workers. Workplace climate. The measure of workplace climate used in the Miner-Rubino et al. (2009) study serves as an example of the kind of tools that are developed for a singular research study. This three item measure purports to assess women’s perceptions of workplace climate by creating an index from the dimensions of 1) autonomy, 2) experience of sexual harassment, and 3) inclusion. The item related to autonomy asked how often, from 1 (never) to 5 (always), an employee was able to change something that she does not like at work. Both the sexual

Hedman & Garriott
21
NCIT
harassment and inclusion items were in a no/yes format. The inclusion item asked “Do you think you have missed opportunities because of not being informed, or being misinformed, about job openings?” (Miner-Rubino et al., 2009, p. 466), which is somewhat similar to the construct of inclusion to informational networks used by Mor Barak (2011) but also includes the issue of opportunity for advancement and possibly fairness. This kind of measure may be appropriate when ease of administration is a primary consideration. However, the weaknesses of this measure include the low number of items, the response format, and that it was designed for a single study with only women. Need for a new measure. This review of some of the available measures of diversity climate and inclusiveness demonstrates the methodological and theoretical problems and overall deficiency of current measures. Only the Inclusion-Exclusion Scale and Diversity Perceptions Scale have a basis in past literature and evidence of empirical development. However, these measures remain limited in the conceptualization of inclusiveness. A review of the measures can be found in Table 2.
Table 2. Measures of Diversity Climate and Inclusiveness
Measure Author Construct Evidence Weakness Inclusion-Exclusion Scale
Mor Barak (2011)
Feeling a part of organizational processes
= .81 to .90 Convergent validity: organizational satisfaction (r = 0.63, p < 0.05) Discriminant validity: work alienation (r = -0.32, p < 0.05)
Single dimension of inclusiveness
Diversity Perceptions Scale
Mor Barak, Cherin, & Berkman (1998)
Perceptions of organizational policies and procedures that affect minority groups and women
= .83 No validity data
Workplace Exclusion Scale
Hitlan et al. (2006)
How often employees experienced exclusionary behaviors from
= .82 1. No validity data reported 2. Single dimension of exclusion

Hedman & Garriott
22
NCIT
supervisors or coworkers
3. No theory
Workplace Climate
Miner-Rubino, Settles, & Stewart (2009)
Perception of autonomy, sexual harassment, and inclusion
Not reported 1. No reliability or validity data 2. Based on 3 items 3. Population was only women
The current project is designed to address the gaps in the literature and develop a measure that can lead to a greater understanding of the construct of inclusiveness. None of the available measures include domains that have been hypothesized to be related to inclusiveness. Using a more comprehensive measure is important at this time because there is no consensus about which factors contribute to inclusiveness. Considering past literature support was found for the utilization of the following domains in the proposed measure: perceptions of diversity climate, fairness and justice, belongingness, value of uniqueness, and experiences of discrimination. In order to contribute to the understanding of the construct of inclusiveness and the corresponding development of an empirically supported measure of inclusiveness these dimensions will be subjected to statistical tests of reliability and validity.
Summary
This chapter reviewed the historical perspective and literature related to the concept of organizational inclusiveness. The value of an inclusive workplace was discussed. The purposed factors related to inclusiveness based on past theory and research included perceptions of diversity climate, fairness and justice, belongingness, value of uniqueness, and experiences of discrimination. The available measures of diversity climate and inclusiveness were reviewed and the limitations were identified. This review of the current state of the literature supports the need for the development of a comprehensive measure of inclusiveness.

Hedman & Garriott
23
NCIT
Methodology
The purpose of the study was to identify factors that are related to employee perceptions of inclusiveness and to determine if those factors are related to the occurrence of job satisfaction and intention to quit. The first goal was to examine whether the hypothesized factors that were used to develop the items of the measure are empirically supported. The second goal was to assess the reliability of the measure of inclusiveness and its potential subscales. The third goal was to use the empirically derived and modified model to determine the relationship of employee perceptions of inclusiveness to employee job satisfaction and potential turnover.
Participants
The participants in the current study consisted of employees at a large, mid-western transit agency. A nonrandom sample was obtained by asking all employees to participate in the company-wide voluntary survey. The participants were purposely sampled to be representative of the entire organization with a cross section that included different employee level (staff, management, upper management), department (e.g. administration, facilities, operations), and employment type (e.g. salaried, union). A total of 869 employees completed the survey, including the first administration of the online survey (primarily office employees with access to email) and the second administration of the paper-and-pencil survey (primarily operations workers). Demographic information including age, gender, and race/ethnicity was collected. The overall sample that completed the survey consisted of 869 participants, 20.5% women and 73.8% men, and 5.8% chose not to respond to the question of gender. The sample was 59.1% Caucasian, 14.3% Hispanic or Latino/a, 11.6% African American, 1.8% Asian or Pacific Islander, 1.3% American Indian or Native Alaskan, 5.2% Bi- or Multi-racial, and 6.7% “other” or chose not to respond to the question of race. The average age of the sample was 49 years old with ages ranging from 20 to 85. See Table 3 for participant characteristics for each sample.
Table 3. Participant Characteristics for Sample 1 and 2 (Total N = 869)
Sample 1 (N = 270) Sample 2 (N = 599) Demographic Percent Frequency Percent Frequency Gender
Women Men No response
20.5 62.6 0
101 169 0
12.9 78.8 8.3
77 472 50
Ethnicity Caucasian Hispanic/Latino(a)
73.7 9.6
199 26
52.6 16.4
315 98
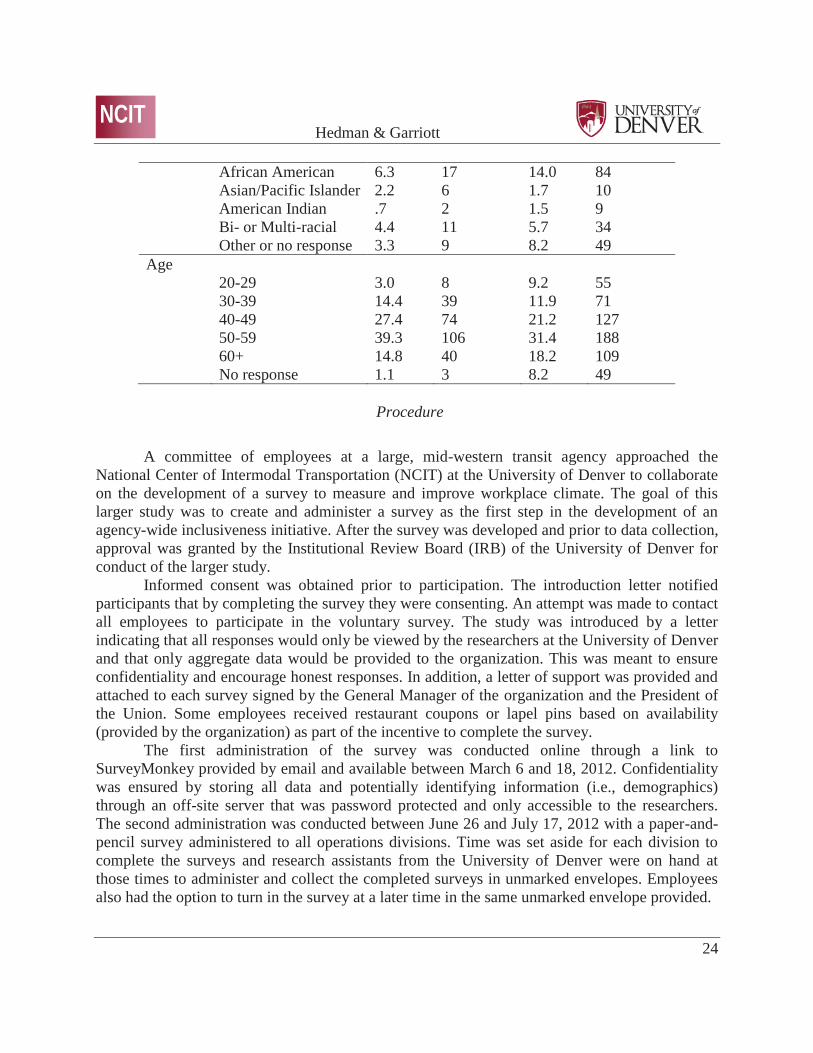
Hedman & Garriott
24
NCIT
African American Asian/Pacific Islander American Indian Bi- or Multi-racial Other or no response
6.3 2.2 .7 4.4 3.3
17 6 2 11 9
14.0 1.7 1.5 5.7 8.2
84 10 9 34 49
Age 20-29 30-39 40-49 50-59 60+ No response
3.0 14.4 27.4 39.3 14.8 1.1
8 39 74 106 40 3
9.2 11.9 21.2 31.4 18.2 8.2
55 71 127 188 109 49
Procedure
A committee of employees at a large, mid-western transit agency approached the National Center of Intermodal Transportation (NCIT) at the University of Denver to collaborate on the development of a survey to measure and improve workplace climate. The goal of this larger study was to create and administer a survey as the first step in the development of an agency-wide inclusiveness initiative. After the survey was developed and prior to data collection, approval was granted by the Institutional Review Board (IRB) of the University of Denver for conduct of the larger study. Informed consent was obtained prior to participation. The introduction letter notified participants that by completing the survey they were consenting. An attempt was made to contact all employees to participate in the voluntary survey. The study was introduced by a letter indicating that all responses would only be viewed by the researchers at the University of Denver and that only aggregate data would be provided to the organization. This was meant to ensure confidentiality and encourage honest responses. In addition, a letter of support was provided and attached to each survey signed by the General Manager of the organization and the President of the Union. Some employees received restaurant coupons or lapel pins based on availability (provided by the organization) as part of the incentive to complete the survey. The first administration of the survey was conducted online through a link to SurveyMonkey provided by email and available between March 6 and 18, 2012. Confidentiality was ensured by storing all data and potentially identifying information (i.e., demographics) through an off-site server that was password protected and only accessible to the researchers. The second administration was conducted between June 26 and July 17, 2012 with a paper-and-pencil survey administered to all operations divisions. Time was set aside for each division to complete the surveys and research assistants from the University of Denver were on hand at those times to administer and collect the completed surveys in unmarked envelopes. Employees also had the option to turn in the survey at a later time in the same unmarked envelope provided.
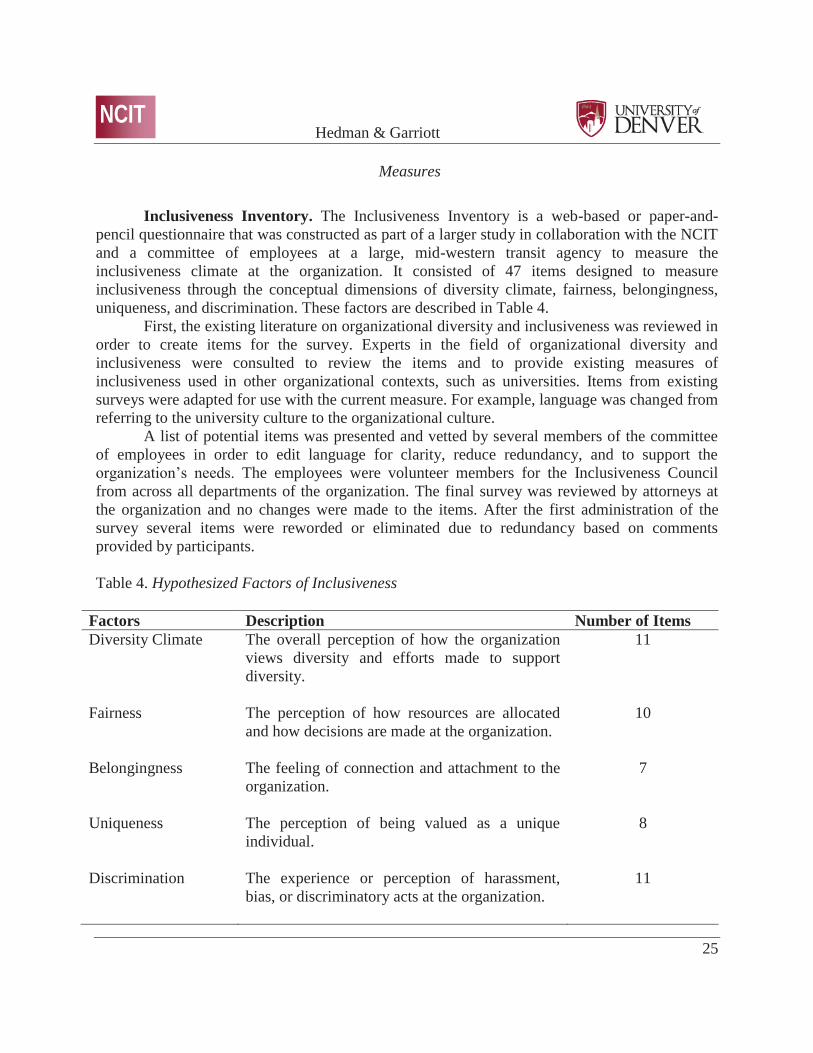
Hedman & Garriott
25
NCIT
Measures
Inclusiveness Inventory. The Inclusiveness Inventory is a web-based or paper-and-pencil questionnaire that was constructed as part of a larger study in collaboration with the NCIT and a committee of employees at a large, mid-western transit agency to measure the inclusiveness climate at the organization. It consisted of 47 items designed to measure inclusiveness through the conceptual dimensions of diversity climate, fairness, belongingness, uniqueness, and discrimination. These factors are described in Table 4.
First, the existing literature on organizational diversity and inclusiveness was reviewed in order to create items for the survey. Experts in the field of organizational diversity and inclusiveness were consulted to review the items and to provide existing measures of inclusiveness used in other organizational contexts, such as universities. Items from existing surveys were adapted for use with the current measure. For example, language was changed from referring to the university culture to the organizational culture.
A list of potential items was presented and vetted by several members of the committee of employees in order to edit language for clarity, reduce redundancy, and to support the organization’s needs. The employees were volunteer members for the Inclusiveness Council from across all departments of the organization. The final survey was reviewed by attorneys at the organization and no changes were made to the items. After the first administration of the survey several items were reworded or eliminated due to redundancy based on comments provided by participants.
Table 4. Hypothesized Factors of Inclusiveness
Factors Description Number of Items Diversity Climate The overall perception of how the organization
views diversity and efforts made to support diversity.
11
Fairness The perception of how resources are allocated and how decisions are made at the organization.
10
Belongingness The feeling of connection and attachment to the organization.
7
Uniqueness The perception of being valued as a unique individual.
8
Discrimination The experience or perception of harassment, bias, or discriminatory acts at the organization.
11

Hedman & Garriott
26
NCIT
Individuals were asked to respond to each item with respect to how much they agreed with each statement as it relates to their recent experiences (last 12 months) at the organization, especially considering the climate of their own division. Respondents to the online version rated their agreement on a six-point rating scale (1= Very Strongly Disagree to 6= Very Strongly Agree). This was adapted for the paper-and-pencil version to a five-point Likert scale in order to include the option of “Neither Agree nor Disagree” (1=Strongly Disagree to 5=Strongly Agree). Demographic questionnaire. A short demographic questionnaire was included. The demographic section asked each participant to indicate their age, gender, ethnicity, educational attainment, tenure at the organization, and the position and level at the organization. Job Satisfaction. This scale, developed for this study, comprised a single item that asked respondent if they feel satisfied with their job at the organization (“I am very satisfied with my job.”). Respondents to the online version rated their agreement on a six-point rating scale (1= Very Strongly Disagree to 6= Very Strongly Agree). This was adapted for the paper-and-pencil version to a five-point Likert scale in order to include the option of “Neither Agree nor Disagree” (1=Strongly Disagree to 5=Strongly Agree). Single-item measures of job satisfaction have demonstrated good reliability and concurrent validity with multiple-item measures and their use has been supported in organizational research literature (Dolbier et al., 2005; Wanous, Reichers, & Hudy, 1997). Intention to Quit. This scale, developed for this study, comprised a single item that asked the respondent if they often think about quitting their job (“I often think about quitting.”). Respondents to the online version rated their agreement on a six-point rating scale (1= Very Strongly Disagree to 6= Very Strongly Agree). This was adapted for the paper-and-pencil version to a five-point Likert scale in order to include the option of “Neither Agree nor Disagree” (1=Strongly Disagree to 5=Strongly Agree). Single item measures of intention to quit have been used in other studies and have demonstrated a relationship to organizational commitment and job satisfaction (Leong, Funham, & Cooper, 1996).
Statistical Analysis
Exploratory Factor Analysis. In order to determine the factor structure of the Inclusiveness Inventory, the data from the first administration of the survey was submitted to an exploratory factor analysis (EFA). The conditions of sample size, outliers, factorability of the correlation matrix, and linearity were tested. The identification of the empirical model in terms of number of factors were based on the assessment of communalities, eigenvalues, the scree plot, and parallel analysis. Principal factor analysis with oblique rotation was used because the intended factors are conceptually correlated and based on a theoretical model. A five-factor model was hypothesized and solutions from a one- to a five-factor model were assessed and the most interpretable model was retained. The researcher determined whether an item should be discarded by assessing the items that did not load on any factor, were loaded on multiple factors, or that did not conceptually fit a logical factor structure. Factors that contained fewer than two

Hedman & Garriott
27
NCIT
items were not retained. The internal consistency reliability of each identified factor-based subscale was estimated. Confirmatory Factor Analysis. Based on the results from the EFA, the data from the second administration of the study was submitted to a confirmatory factor analysis (CFA). The evaluation of the model fit was evaluated using the following fit indices: Chi-square, the root-mean-square error of approximation (RMSEA), and the standardized root mean square residual (SRMSR). A reliability analysis was conducted using Cronbach’s alpha as a measure of internal consistency reliability for both the overall measure, as well as for each factor-based subscale. Correlation and group differences. After identifying the factors, the sample from the second administration was analyzed for correlations between scores on the Inclusiveness Inventory and the measures of job satisfaction and intention to quit. It was expected that higher scores on the Inclusiveness Inventory would be related to greater job satisfaction and lower intention to quit. Mean differences between men and women, as well as between Whites and people who identify as racial or ethnic minorities, on the Inclusiveness Inventory, job satisfaction, and intention to quit were examined by using independent-samples t tests. Women and minorities were expected to have lower ratings of inclusiveness, lower levels of job satisfaction, and higher levels of turnover intention compared to men and Whites, respectively.
Summary
This chapter presented the methodology used in this study. Participants were employees of a large, mid-western transit agency that were part of a larger study on workplace climate. Test construction consisted of item development for conceptual dimensions based on literature review, expert review, and editing by members of the organization to improve clarity and support organizational needs. Upon Institutional Review Board approval, study participants were invited by University of Denver research assistants to complete a survey packet that included the Inclusiveness Inventory, job satisfaction, intention to quit, and demographic questionnaire items. The structure of the Inclusiveness Inventory was examined by factor analysis and data was analyzed using correlations and t tests.
Results This chapter presents the results of the exploratory and confirmatory factor analyses, followed by the results of the testing of primary hypotheses.
Exploratory Factor Analysis
Tests of Assumptions: Sample size, outliers, factorability of the correlation matrix, and linearity. According to a review of best practices for scale development research, sample sizes of 150 to 200 are generally sufficient for factor analysis if communalities are all above .5 (Worthington & Whittaker, 2006). This is consistent with the recommendation by Tabachnick

Hedman & Garriott
28
NCIT
and Fidell (2014) that smaller sample sizes (100—200) are acceptable in cases with high communalities. The assumption of sample size was met with 270 cases and the majority of communalities above .6. The data were screened for univariate outliers and none were found. Multivariate outliers were identified using Mahalanobis distance. Cases with Mahalanobis distance scores greater than the critical value of 82.72 (df = 47, p < .001) were deleted. In total, 29 cases were removed. The Kaiser-Meyer-Olkin (KMO) measure of sampling adequacy “indicates the extent to which a correlation matrix actually contains factors or simply chance correlations between a small subset of variables” (Worthington & Whittaker, 2006, p. 818). The KMO statistic approaches 0.0 if partial correlations are small and a value of .60 or higher is required for factor analysis (Tabachnick & Fidell, 2014). The appropriateness of conducting a factor analysis was supported by the KMO value of .96. Linearity of items was examined through inter-item correlations and visual inspection of scatterplots. All correlations that were significant were considered to have a linear relationship. Only two items indicated any potential issue with a non-linear relationship (Fairness 3 and Discrimination 6) based on poor correlations, but were not removed prior to analysis. An examination of scatterplots suggested that there was no violation of linearity. Principal Factor Analysis. A principal factor analysis with an oblique rotation was performed on 47 items for the sample of 241 cases. Determining the number of factors to retain was based on the combined assessment of (1) eigenvalues, (2) scree plot, and (3) parallel analysis. The unrestricted analysis produced six factors with eigenvalues greater than 1.00 with a total variance explained of 71.31%, however these general criteria may overestimate the number of factors to retain. A visual examination of the scree plot indicated three factors. Parallel analysis is another method used to help determine how many factors to retain. Using the syntax for SPSS created by O’Connor (2000), the first step is to generate random data sets with the same sample size and number of variables. The eigenvalues for the random data are calculated and compared to the eigenvalues from the original data set. A factor is retained if the original eigenvalue is greater than that from the random data (Tabachnick & Fidell, 2014; Worthington & Whittaker, 2006). Based on the parallel analysis, there were four factors with raw data eigenvalues that were greater than the eigenvalues from the random data, indicating a solution of up to four factors would be tenable. Based on these initial tests, four- and three-factor solutions were examined. The three-factor model was determined to have the most interpretable solution based on item loading with a total variance explained of 63.21%. This model was used to determine factor interpretation and item retention. The next step was to determine item retention. First, an examination of the communalities showed that three items had values less than .4 after extraction and they were eliminated:
Fairness 3: I have been treated fairly by my supervisor. Fairness 6: Certain people are treated more favorably than others at this organization. (R) Belongingness 1: Management and supervisors are protective of and generous to loyal
workers.

Hedman & Garriott
29
NCIT
Next the rotated pattern matrix was examined. Tabachnick and Fidell (2014) recommend that only items with factor loadings higher than .32 should be interpreted. There were no items that did not load on a factor at less than .32, six items that cross-loaded (>.32) on two factors, and no items that loaded on more than two factors. Worthington and Whittaker (2006) recommend caution when eliminating items that load on more than one factor, especially in the preliminary stages of scale development. Using this guideline, four items were deleted because there was a difference of less than .15 from the items’ highest loaded factor to the next highest loading:
Fairness 1: This organization supports the professional development of all employees. Belongingness 6: Employees are taken care of like members of a family. Diversity Climate 1: The organization promotes a climate of respect among its members. Diversity Climate 6: This organization is committed to creating a work environment that
values inclusiveness. One item was deleted because its’ factor loading was not conceptually consistent with the rest of the subscale:
Discrimination 6: I have witnessed a threat against another employee in the workplace. A total of 8 items were removed.
The three factors with the 39 remaining items, factor loadings, communalities, means and standard deviations are presented in Table 5. Table 5. Items, factors, means, and standard deviations for the three-factor model Item Hypothesized
Factor Factor Loading
h2 M SD
Factor 1: Fairness, Uniqueness, and Belongingness (19 items)
I feel there are no barriers to my being promoted within the organization.
Fairness2 .85 .55 3.66 1.25
I have been treated fairly by my fellow employees.
Fairness4 .77 .52 4.45 1.20
I am supported and encouraged to pursue activities related to career advancement.
Fairness5 .59 .58 4.27 1.07
Employees are treated fairly in my work unit. Fairness7 .69 .68 4.14 1.01 I have been treated fairly by management at this
organization. Fairness8 .86 .78 4.13 1.11
I feel that I have the same opportunities and chances as any other employee.
Fairness9 .89 .72 3.88 1.22
I feel I have equal access to information needed to move up the career ladder.
Fairness10 .60 .62 4.01 1.00
I feel like part of the organizational family. Belong2 .83 .75 4.11 1.23 I feel like I have a friend I can talk to at work. Belong3 .50 .41 4.20 1.04 Once someone is hired, the organization takes Belong4 .56 .67 3.85 1.06

Hedman & Garriott
30
NCIT
care of that person's overall welfare. I feel a sense of belonging at this organization. Belong5 .71 .76 4.16 1.09 This organization has a great deal of personal
meaning for me. Belong7 .50 .42 4.15 .98
I am comfortable expressing my ideas at work. Unique2 .63 .78 4.19 1.14 At work I feel accepted for who I am. Unique3 .72 .78 4.29 1.03 I feel like this organization values me as a
person. Unique4 .87 .80 4.04 1.07
I feel understood by others in the workplace. Unique5 .58 .61 4.01 .84 People are interested in getting to know me as a
person. Unique6 .48 .51 3.89 .86
I feel stereotyped in the workplace. (R) Unique7 .33 .44 4.02 1.09 I feel comfortable reporting to my supervisor an
act of discrimination towards a member of my unit.
Discrim1 .71 .58 4.26 1.21
Item Hypothesized Factor
Factor Loading
h2 M SD
Factor 2: Diversity Climate (11 items) The organization is welcoming to all members
of diverse groups. DivClim2 .55 .70 4.52 1.17
This organization actively recruits a diverse workforce.
DivClim3 .82 .72 4.31 1.09
There are opportunities for me to provide feedback on how inclusiveness and diversity are handled.
DivClim4 .46 .51 3.60 1.02
This organization is committed to increasing diversity in the workplace.
DivClim5 .68 .73 4.33 1.08
This organization reflects my vision of a diverse workplace.
DivClim7 .84 .79 4.13 1.02
This organization is able to retain a diverse workforce.
DivClim8 .87 .79 4.21 .97
My department reviews recruitment and retention data to ensure a diverse workforce.
DivClim9 .78 .52 3.68 .90
My department provides adequate support for employees from underrepresented communities to ensure a diverse workforce.
DivClim10 .76 .53 3.84 .91
I feel that this organization is welcoming to members of all groups.
DivClim11 .75 .81 4.29 .95
I feel comfortable requesting accommodations for my personal needs. (i.e. physical, medical, religious, family,…)
Unique1 .35 .48 4.23 1.03

Hedman & Garriott
31
NCIT
My cultural differences are respected. Unique8 .60 .63 4.12 .79 Item Hypothesized
Factor Factor Loading
h2 M SD
Factor 3: Discrimination (9 items) I have been the target of offensive drawings or
pictures. (R) Discrim2 .68 .59 5.13 .96
I have received offensive emails from other employees. (R)
Discrim3 .65 .46 4.80 1.14
I have been the target of offensive language. (R) Discrim4 .68 .60 4.62 1.14 I have received inappropriate and/or
unwelcomed physical contact. (R) Discrim5 .81 .65 5.14 1.01
I have witnessed an act of discrimination by one employee toward another. (R)
Discrim7 .49 .45 3.71 1.13
I have witnessed an act of discrimination in the workplace. (R)
Discrim8 .53 .57 4.31 1.39
I have been physically assaulted or injured by a coworker. (R)
Discrim9 .83 .68 5.27 .94
I have been physically threatened by other employees. (R)
Discrim10 .96 .77 5.12 1.00
I have received threats of physical violence from a co-worker. (R)
Discrim11 .94 .71 5.15 .96
Note. h2 = Estimated communality; M = Mean; SD = Standard Deviation. Factor 1 was named “Fairness, Belongingness, and Uniqueness” because it primarily contained items that were originally generated for those three themes. Factor 2 was named “Diversity Climate” because it contained a majority of items that were generated to measure the overall perception of the organizational climate. Factor 3 was named “Discrimination” because it contained items that were all related to an employee’s perception of harassment, bias, or discrimination. The correlations among the three subscales were all moderate to high. Each subscale and the full scale demonstrated strong reliability with all Cronbach’s alphas ranging from .92 to .97, as seen in Table 6.
Table 6. EFA Factor Correlations
Factor 1 2 3 Alpha 1 1.00 .82 .60 .97 2 1.00 .56 .95 3 1.00 .92
Full Scale .97
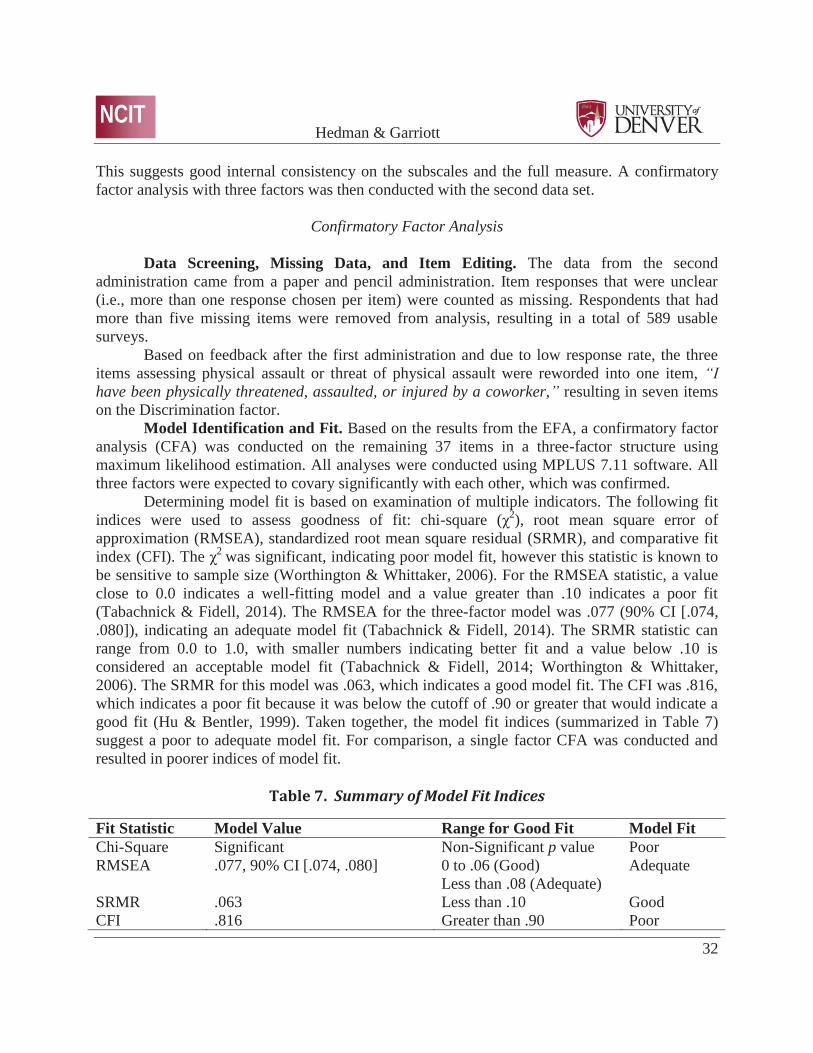
Hedman & Garriott
32
NCIT
This suggests good internal consistency on the subscales and the full measure. A confirmatory factor analysis with three factors was then conducted with the second data set.
Confirmatory Factor Analysis Data Screening, Missing Data, and Item Editing. The data from the second administration came from a paper and pencil administration. Item responses that were unclear (i.e., more than one response chosen per item) were counted as missing. Respondents that had more than five missing items were removed from analysis, resulting in a total of 589 usable surveys. Based on feedback after the first administration and due to low response rate, the three items assessing physical assault or threat of physical assault were reworded into one item, “I have been physically threatened, assaulted, or injured by a coworker,” resulting in seven items on the Discrimination factor. Model Identification and Fit. Based on the results from the EFA, a confirmatory factor analysis (CFA) was conducted on the remaining 37 items in a three-factor structure using maximum likelihood estimation. All analyses were conducted using MPLUS 7.11 software. All three factors were expected to covary significantly with each other, which was confirmed. Determining model fit is based on examination of multiple indicators. The following fit indices were used to assess goodness of fit: chi-square (χ2), root mean square error of approximation (RMSEA), standardized root mean square residual (SRMR), and comparative fit index (CFI). The χ2 was significant, indicating poor model fit, however this statistic is known to be sensitive to sample size (Worthington & Whittaker, 2006). For the RMSEA statistic, a value close to 0.0 indicates a well-fitting model and a value greater than .10 indicates a poor fit (Tabachnick & Fidell, 2014). The RMSEA for the three-factor model was .077 (90% CI [.074, .080]), indicating an adequate model fit (Tabachnick & Fidell, 2014). The SRMR statistic can range from 0.0 to 1.0, with smaller numbers indicating better fit and a value below .10 is considered an acceptable model fit (Tabachnick & Fidell, 2014; Worthington & Whittaker, 2006). The SRMR for this model was .063, which indicates a good model fit. The CFI was .816, which indicates a poor fit because it was below the cutoff of .90 or greater that would indicate a good fit (Hu & Bentler, 1999). Taken together, the model fit indices (summarized in Table 7) suggest a poor to adequate model fit. For comparison, a single factor CFA was conducted and resulted in poorer indices of model fit.
Table 7. Summary of Model Fit Indices
Fit Statistic Model Value Range for Good Fit Model Fit Chi-Square Significant Non-Significant p value Poor RMSEA .077, 90% CI [.074, .080] 0 to .06 (Good)
Less than .08 (Adequate) Adequate
SRMR .063 Less than .10 Good CFI .816 Greater than .90 Poor

Hedman & Garriott
33
NCIT
Note. RMSEA = Root mean square error of approximation; SRMR = Standardized root mean square residual; CFI = Comparative fit index. The correlations between the subscales suggest that there is adequate discriminate validity between the factors because they are not higher than or equal to .85 (Brown, 2015) and each of the factors and the overall scale demonstrated very good reliability with Cronbach’s alphas ranging from .83 to .94 (see Table 8).
Correlations and Group Differences
Correlations. It was hypothesized that ratings of inclusiveness would be related to job satisfaction and turnover intention such that employees who had higher ratings of inclusiveness would have greater job satisfaction and lower intention to quit. This hypothesis was supported because all correlations were significantly related to the outcomes in the expected direction, as seen in Table 8.
Table 8. CFA Scale Correlations and Reliability
Variable Factor 1
Factor 2
Factor 3
Full Scale
Intent to Quit
Job Satisfaction
Alpha
Factor 1 1.00 .80 .55 .96 -.58 .61 .94 Factor 2 1.00 .49 .89 -.43 .50 .88 Factor 3 1.00 .70 -.42 .27 .83 Full Scale 1.00 -.57 .57 .88 Intent to Quit
1.00 -.51 --
Job Satisfaction
1.00 --
Note. Factor 1 = Fairness, Belongingness, and Uniqueness; Factor 2 = Diversity Climate; Factor 3 = Discrimination. *All correlations are significant at the p < 0.01 level (2-tailed). Group Differences. It was hypothesized that women and racial minorities would have lower mean scores on the Inclusiveness Inventory and job satisfaction, and higher mean scores on intention to quit as compared to men and Whites, respectively. These hypotheses were partially supported. An independent samples t-test was conducted to compare ratings of inclusiveness for women and men. Women had significantly lower scores for the Fairness, Belongingness, and Uniqueness factor (M = 3.12, SD = .84) compared to men (M = 3.39, SD = .70); t(92.5) = 2.57, p = .012. Women also had significantly lower total scores (M = 3.32, SD = .71) compared to men (M = 3.52, SD = .59); t(88.75) = 2.29, p = .024. There were no significant differences between women and men on scores for Diversity Climate, Discrimination, job satisfaction, or intention to quit. An independent samples t-test indicated that people who identified as racial minorities had significantly lower ratings on the Discrimination factor (M =

Hedman & Garriott
34
NCIT
3.74, SD = .74) compared to Whites (M = 3.93, SD = .74); t(569) = -3.09, p = .002. This scale was reverse coded so that lower scores indicated more experiences with discrimination. There were no significant differences between racial minorities and Whites on any other factor, total score, job satisfaction, or intention to quit.
Summary
This chapter provided the detailed results of the statistical analyses for the current study. The considerations prior to data analysis were addressed. The structure of the Inclusiveness Inventory was explored and confirmed with factor analysis. Hypothesis one was supported and Hypothesis two and three were partially supported. The following chapter will discuss the meaning of the results, theoretical implications, limitation of the current study, and future directions.
Discussion Despite widespread acknowledgement of the importance of diversity and inclusiveness for organizations there is a significant lack of agreement in the literature and practice about how to best enact these ideals. Part of the reason for this discrepancy may be due to the absence of a conceptual model for understanding the components of inclusiveness. Developing a comprehensive model may be especially needed in fields that have difficulty recruiting and retaining non-traditional and underrepresented workers, such as women and racial or ethnic minorities. Much of the research has supported the importance of measuring perceptions of organizational climate beyond the objective, so-called “head count,” measures of diversity (Avery & McKay, 2006). In addition, findings from past studies suggest that the research and evaluation of the climate in and of itself is a critical component for the success of initiatives designed to increase inclusiveness (Bilimoria et al., 2008). In addition, there are many practical and methodological problems with the existing measures of inclusiveness and diversity climate that lend support to the need for a new measure. The purpose of this study was to design a measure of inclusiveness based on theory. The goal was to explore the factor structure of the measure and then test the relationship of employee perceptions to the outcomes of job satisfaction and intention to quit. Finally, this study tested potential differences in the relationship between perceptions of inclusiveness, diversity climate, and work-related outcomes for underrepresented employees compared to employees who identified as male or White.
Hedman & Garriott
35
NCIT
Review of Results
Methodology. The measure of inclusiveness was developed as part of larger study of workplace climate for a public transportation agency. Items for the Inclusiveness Inventory were generated with conceptual factors in mind and in collaboration with the organization, as well as with input from experts in the field of organizational diversity and inclusiveness. All employees in the organization were asked to participate in the voluntary survey. The first administration was conducted on-line with employees who had access to email. The second administration was conducted with a paper-and-pencil survey with operational workers in the field. Factor analysis. The exploratory factor analysis on the data from the first administration identified a three-factor structure for the Inclusiveness Inventory. There were no items that did not load on a factor and the majority of items were retained. It was notable that items tended to be grouped according to the hypothesized structure, suggesting that they were measuring the intended construct. Factor one contained items that were intended to measure the constructs related to perceptions of fairness, belongingness, and uniqueness; factor two contained items related to diversity climate; factor three contained items related to perceptions of discrimination. The overall measure demonstrated good reliability and there were strong correlations between the subscales. Based on the results of the exploratory factor analysis a confirmatory factor analysis was conducted on the data from the second administration. Overall, the indicators of model fit suggested a poor to adequate fit. A review of residuals showed that there were no individual items that were contributing to the lack of model fit. The correlations between the factors indicated that they were related and maintained good discriminant validity. In addition, a single factor model resulted in poorer model fit compared to the three-factor model. Ultimately, there were no indicators that suggested a clear solution to improve model fit. The measure of reliability and subscale correlations were good and it was determined to retain the model for the tests of the hypotheses. Hypotheses. All hypotheses were supported or partially supported. The first hypothesis was fully supported. The ratings of inclusiveness were related to job satisfaction and turnover intention such that employees who had higher ratings of inclusiveness endorsed greater job satisfaction and lower intention to quit. This finding is consistent with much of the literature that connects perceptions of organizational climate with meaningful outcomes (Carr et al., 2003; Ensher et al., 2001; Mor Barak & Levin, 2002; Parker et al., 2003; Settles et al., 2007; Wessel & Ryan, 2012) and it lends further support to the importance of measuring employee perceptions (Avery & McKay, 2006; Bilimoria et al., 2008). The extent to which an organization can effectively demonstrate positive inclusiveness practices to all employees, however, remains to be seen. In order to explore the issue of how employee perceptions may vary, it was additionally hypothesized that women and people who identify as racial or ethnic minorities would have lower ratings of inclusiveness and job satisfaction, and higher levels of intention to quit as compared to men and Whites, respectively. These hypotheses were partially supported. Women

Hedman & Garriott
36
NCIT
reported lower overall scores on the Inclusiveness Inventory, and specifically on the Fairness, Belongingness, and Uniqueness factor. People who identified as racial or ethnic minorities reported higher levels of perceived discrimination. There were no other significant differences found between the scores of women and men, or between racial and ethnic minorities and Whites. These results are consistent with the mixed findings in the literature, with some studies showing differences between groups (Mor Barak & Levin, 2002; Settles et al., 2007), while others do not (Ensher et al., 2001; Wessel & Ryan, 2012). Despite the mixed results, this study supports past research that people from traditionally underrepresented social groups endorse more negative perceptions of their work climate, at least to some degree. Because the measure has not been thoroughly validated at this point, it would not be recommended to make specific conclusions in regard to the factors that did and did not show differences. However, there are some interesting patterns to consider as they relate to prior research. For example, the women in this study tended to endorse items related to more subtle forms of exclusion, such as perceiving less fairness in the organization, rather than overt forms of discrimination. This finding could be understood in the context of women who work in traditionally male-dominated industries, such as transportation. It may be that women in nontraditional jobs have lower perceptions of harassment, a form of discrimination, compared to women who work in more gender-balanced occupations. In one study, after watching a video depicting sexual harassment in the workplace, women who worked in traditionally male-dominated jobs had the lowest ratings of perceived harassment compared to women who worked in either neutral or women’s traditional jobs (Maeder, Wiener, & Winter, 2007). The opposite pattern was true for men, where men who worked in traditionally male occupations perceived the most harassment. The authors suggest that women in male-dominated jobs are more likely to encounter sexual harassment and therefore, “women in men’s traditional jobs become tougher and less likely to sympathize with other women who claim to be victims of harassment” (Maeder et al., 2007, p. 804). Importantly, these results were based on the recognition of harassment to others, rather than to a woman’s perception of her own experiences. However, there may be overlap. Anecdotal data suggests that there are beliefs among some women in the transportation industry that the job requires a “tough skin” because discrimination or sexual harassment comes with the job (Sherry, Bondanza, Hedman, & Pinarowicz, 2011). Perhaps there is also an element of “self selection” for women who choose and remain in male-dominated work environments. It may be that women who are more attentive to discrimination or general lack of inclusion either do not choose these jobs or stay for less time. Unlike the women in this study, the participants who identified as racial or ethnic minorities endorsed experiencing more discrimination but did not have different ratings compared to Whites on other factors. This finding supports the research showing that non-White employees tend to experience higher levels of discrimination (Avery & McKay, 2006; Gruber & Bjorn, 1982; Mor Barak et al., 1998; Mor Barak & Levin, 2002; Triana & Garcia, 2009). Organizations should be concerned about these disparities. Simply having a policy and measuring objective data, such as reported incidents, is not sufficient for protecting employees or understanding problems within the organization. There are many potential reasons for an

Hedman & Garriott
37
NCIT
incongruence between what an organization aspires to, what they believe to be true, and the actual experience of employees. Therefore measuring perceptions is crucial. The lack of significant differences on other factors could be the result of the unfortunate need to collapse many racial/ethnic groups into one heterogeneous group, thereby eliminating the possibility of understanding distinct experiences. It may be the case that members of certain groups feel a high degree of belongingness because they are well represented within the organization. For example, people who identified as Hispanic/Latino(a) comprised over 16% of the study participants, while people who identified as Asian/Pacific Islander represented less than 2% of the participants, which was only 10 individuals. Clearly it is problematic to collapse across groups, but it was statistically necessary for this study. On the other hand, other studies have also failed to find a significant difference between groups. This suggests that perceptions of inclusiveness may not necessarily vary based on social identity. In addition, the current findings were similar to a study (Wessel & Ryan, 2012) that showed that perceptions of organizational climate were generally positive across groups, even when differences between those groups were found (all groups had mean scores above average). At this point, there is no consensus about how social identity impacts perceptions, but it is widely agreed that perceptions of climate are important. Despite substantial research supporting the need to measure perceptions of organizational climate, the reality of doing so in practice is less consistent than would be recommended. Notably, there are significant barriers to conducting large-scale surveys for organizations. One study highlighted the challenges, as the researchers found only 4 of 20 companies willing to participate, with lack of resources, legal counsel against it, and a general perception that data collection was unnecessary as reasons that organizations declined (Kochan et al., 2003). The organization that participated in this study had explicit goals and initiatives to improve climate and increase diversity in the workforce. Conducting this survey was seen as an important part of their overall strategy. A great deal of time and company resources were used to make this study possible, including multiple meetings with employees from the Inclusiveness Council, making accommodations for employees to take the survey during paid work hours, and providing a company-wide report. Clearly a great deal of interest and dedication was required. Therefore, given the resources needed, survey fatigue, cynicism about the implementation of change based on the results, and the lack of well-formulated measures, it should be no surprise that even though research supports the use of climate surveys, organizations continue to be hesitant. Theoretical implications. One of the primary purposes of this study was to test a model of inclusiveness based on theory. The proposed model included the factors of perceptions of fairness, belongingness, value of uniqueness, diversity climate, and discrimination. The factor analysis suggested that perceptions of fairness, belongingness, and value of uniqueness comprised a single factor, which was the strongest factor, followed by a factor related to diversity climate, and a third factor for experiences of discrimination. The overall number of factors were reduced from the original hypothesis, however the findings from this study support the multi-factor model suggested by Shore et al. (2011). It should be noted that despite the promising findings with the EFA, the model had only an adequate to poor fit with the CFA. There are possible conceptual and theoretical reasons for

Hedman & Garriott
38
NCIT
the lack of fit. It may be that other important factors were not included. For example, climate strength has been suggested as an important consideration (Ely & Thomas, 2001). Climate strength has been defined as, “a group- or organizational-level variable that represents the degree of consensus in climate perceptions” (Carr et al., 2003, p. 614). One study considered how perceptions of climate can vary based on position within the organization (manager or subordinate) and how consistency of those perceptions across levels impacted outcomes, specifically sales growth (McKay et al., 2009). The findings demonstrated that climate perceptions can vary depending on one’s level within the organization, but agreement or consistency across levels leads to even more impact on organizational outcomes. Specifically, teams where both mangers and subordinates reported positive perceptions of diversity climate had the highest levels of sales growth, while teams that reported consistently negative perceptions had the lowest levels of growth. Inconsistent teams where either the managers or subordinates reported negative diversity climate also had sales growth numbers that fell below the mean, indicating an overall negative impact of poor climate perceptions, regardless of consistency. While these findings connect climate strength perceptions to larger organizational-level outcomes, it may be the case that the consistency of employee perceptions also impacts individual-level outcomes and would therefore be an important factor to consider. On the other hand, it may be that there were too many factors in the current model and a simpler model would be better. Some researchers have conceptualized inclusiveness more restrictively. For example, Mor Barak and fellow researchers used a measure of inclusiveness that was designed to assess an employee’s perceptions of their access to decision-making within the organization (Brimhall, Lizano, & Mor Barak, 2014; Mor Barak et al., 1998; Mor Barak & Levin, 2002; Mor Barak, 2011). It is notable that these studies also included separate measures of diversity climate and perceptions of fairness and justice. All of these measures were found to have a relationship to employee satisfaction and retention in both cross-sectional (Mor Barak et al., 1998; Mor Barak & Levin, 2002) and longitudinal (Brimhall et al., 2014) studies. Therefore, it seems that there is sufficient support for further exploration of the multi-factor conceptualization of inclusiveness. One of the major criticisms of the movement toward understanding and implementing organizational inclusiveness is that it represents simply a “renaming” of existing policies related to managing the workforce (Roberson, 2006). It is true that inclusiveness shares significant overlap with diversity management, especially related to valuing diversity. Some have even suggested that inclusiveness has been a reaction to the complaints from those who are traditionally in positions of power (i.e. White men) who feel excluded or devalued from “diversity practices” (Oswick & Noon, 2014; Yakura, 1996). However, these assessments of inclusiveness do not have to be interpreted cynically. Rather, they can be seen as part of the evolution toward greater understanding of the complex ways that our social identities impact our work lives. In addition, the movement toward a focus on inclusiveness does not need to be at the exclusion of other diversity policies. It seems to be a pattern in human resource management, as in other fields, that “new” concepts are built up in relation to the disparagement of “old” models (Oswick & Noon, 2014). For example, diversity management was touted as an improvement to

Hedman & Garriott
39
NCIT
Affirmative Action, even in the face of evidence that Affirmative Action had a positive impact on reducing disparities (Heilman, 1996; Murrel & Jones, 1996). As Oswick and Noon (2014) suggest, “rather than seeing the rationales for equality, diversity and inclusion as mutually exclusive, it could be more constructive to focus upon the points of commonality, overlap and compatibility” (p. 36). Therefore, it is important to recognize that a multifactor model of inclusiveness does not have to be a replacement for existing practices. Instead, the move toward understanding and promoting inclusiveness can serve to build upon initiatives that already work. This study contributes to the theory that climate impacts all employees, regardless of identity. Within this organization there was a generally positive view of inclusiveness and limited differences between groups. One possible explanation is that there may be a general level of inclusiveness that has less differential impact across groups. For example, generally positive environments are better for everyone, while negative environments are bad for everyone, but more so for women and minorities. Findings from the study by Gilbert and Ivancevich (2001) support the idea that all employees are more satisfied at organizations that make exerted efforts to positively support diversity, while women and minorities are significantly less satisfied at organizations that merely try to avoid legal action (i.e. only meet minimum requirements). Despite decades of research, a recent review of the literature suggested that both researchers and practitioners continue to try to make a “business case” for diversity and struggle to find the best ways to manage diverse groups effectively (Nkomo & Hoobler, 2014). It is clear that practical and conceptual challenges remain. However, the consequences of inaction are too significant to let those barriers impede improvements.
Limitations
There are several limitations to the current study that may have impacted the results. The first is that there were differences between the administration method and population for the EFA and CFA. The measure used in the EFA was administered online without the option of skipping items and the CFA was administered with a pen-and-paper document which led to more missing or unusable data. There was also a change in the scaling of the items from a 6-point scale for the EFA to a 5-point scale for the CFA, as well as changes to the wording of several items. When conducting an EFA and subsequent CFA it is recommended to keep the measure as similar as possible for initial measure development (Brown, 2015). In addition, although both samples were drawn from the same organization, the populations were notably different. The EFA sample included primarily office workers who had access to computers, while the CFA sample consisted of operators, mechanics, and other employees who worked in decentralized locations without access to computers. Gathering data from the entire organization was beneficial for generalizability, but it may be the case that these two populations are fundamentally different and therefore the factors derived from one group may not serve as a good fit for the other group. However, the hope is that the model of inclusiveness would transcend the type of organization and employees, so it is important to validate the measure with different employees. Some of the challenges with the CFA may reflect
Hedman & Garriott
40
NCIT
that it was done too early in the process of developing the measure (Brown, 2015). For future studies it would be recommended to consider conducting another EFA or a CFA using the original measure from the first administration. A second limitation is related to the potential problems with method effects and the exclusive use of self-report measures. Podsakoff and fellow authors (P. Podsakoff, MacKenzie, Lee, & N. Podsakoff, 2003) have discussed the impact of a wide range of method effects, including the format of the measure itself, as well as the problems with using a single self-rater. For example, the use of the same scale format to measure the construct and the outcome (i.e. Likert-type scale items) can produce covariation that is based on the similarity of the items, rather than reflecting the true relationship between the constructs. (Podsakoff et al., 2003). Some researchers have tried to limit method bias through the use of reverse coded items, but this can also lead to errors in measurement. With measures that are designed to assess people’s attitudes and perceptions about sensitive topics, such as diversity, it is also important to recognize that there may be a desire to respond in a way that is socially desirable, rather than reflecting actual feelings (Podsakoff et al., 2003). Another factor to consider is that the data was collected at one point in time and is correlational in nature. Therefore, the causal influence of perceptions of inclusiveness on job satisfaction or intention to quite cannot be inferred based on results of this study. It may be that people who are unhappy with their job are more likely to notice negative climate issues or that people who want to stay in their job are more likely to see the climate in a positive light. Common method bias is complicated because it can result in either the overestimation or underestimation of the relationship between constructs (Podsakoff et al., 2003). Therefore, the relationship between perceptions of inclusiveness and outcomes could be further validated by using other sources of information, such as actual recruitment and retention numbers, rates of absenteeism, qualitative studies, or longitudinal data. There are also several limitations in regard to the group comparisons. First, there were very unequal sample sizes for comparing men and women. This problem is inherent to studying differences within imbalanced work environments and there may be methodological considerations for future research, such as using a random sample of surveys from men or limiting the number of surveys collected from men. It is also problematic to lump the heterogenous groups of racial and ethnic minorities into a single group. This is a perennial problem that has been noted in the literature (Delgado-Romero et al., 2005) and this study is yet another example. Unfortunately, the relatively small sample sizes for various groups made it statistically limiting to conduct more nuanced comparisons. It may be necessary to do more targeted sampling in order to include a greater number of people from underrepresented groups. For example, one study collaborated with an organization that intentionally hires people with disabilities and has a large number of refugees (Groggins & Ryan, 2013). Despite the limitations of the current study, the findings do lend support to the theory that all members of an organization may be impacted by climate issues, regardless of identity (Wessel & Ryan, 2012).

Hedman & Garriott
41
NCIT
Implications
There are several next steps to be followed for the use of this instrument. The first step would be to further validate the measure inclusiveness by comparing it with existing measures of diversity and inclusiveness. Worthington and Whittaker (2006) suggest that establishing convergent and divergent validity should occur later in the process of scale development, so it would not have been recommended to do so at this early stage. There are several additional factors that could be considered in future studies. There are mixed findings about how social identity is related to perceptions of climate and employee outcomes. Therefore, it may be important to understand how someone’s perception of the importance of inclusiveness, rather than just their social identity, impacts the relationship to outcomes. It is likely that people who regard inclusiveness as important will have more awareness of both overt and subtle indicators, and that this would have greater impact on their satisfaction and decisions about employment. Another consideration is how tenure impacts perceptions. It may be that people who have worked somewhere longer have developed coping strategies or have a higher status that protects them from a negative or non-inclusive climate (Sliter, Boyd, Sinclair, Cheung, & McFadden, 2014). In addition, it may be the case that people who perceive a less inclusive climate self-select out of the organization and do not stay as long. On the other hand, people who have been at an organization longer may have had more exposure to discrimination and/or have greater awareness of informal practices that differ from formal policy. One of the hopes of developing a measure of inclusiveness is that it could be used to look at the effectiveness of diversity policies over time. Although organizations may enact changes, there is often little understanding of how these policies are perceived by employees or if there are any significant changes in perceptions of climate. For example, if there are policies designed to increase fairness in promotions, it would be important to not only measure objective organizational changes, but also see if employees perceive the organization’s policies as more fair. Despite the importance, there is considerable risk for fatigue related to diversity and inclusiveness initiatives. There may be a desire to believe that we are past these problems, however it is clear that we are still trying to figure out how to best include a wide range of people and work together effectively (Nkomo & Hoobler, 2014). It is critical for researchers to continue working with organizations and their employees to develop meaningful ways to understand and demonstrate the importance of inclusiveness.

Hedman & Garriott
NCIT
42
References Avery, D. R,. & McKay, P. F. (2006). Target practice: An organizational impression management approach to attracting minority and female job applicants. Personnel Psychology, 59, 157-187. Baumeister, R. F., & Leary, M. R. (1995). The need to belong: Desire for interpersonal
attachments as a fundamental human motivation. Psychological Bulletin, 117(3), 497-529.
Bilimoria, D., Joy, S., & Liang, X. (2008). Breaking barriers and creating inclusiveness: Lessons of organizational transformation to advance women faculty in academic science and engineering. Human Resource Management, 47(3), 423-441.
Brimhall, K. C., Lizano, E. L., & Mor Barak, M. E. (2014). The mediating role of inclusion: A longitudinal study of the effects of leader-member exchange and diversity climate on job satisfaction and intention to leave among child welfare workers. Children and Youth Services Review, 40, 79-88.
Brown, T. (2015). Confirmatory factor analysis for applied research (2nd ed.). New York, NY: Guilford Press.
Cox, T. (1993). Cultural diversity in the organization: Theory, research and practice. San Francisco, CA: Berrett-Koehler.
Cox, T. (2001). Creating the multicultural organization: A strategy for capturing the power of diversity. San Francisco, CA: Jossey-Bass.
Cox, T., & Beale, R. L. (1997). Developing competency to manage diversity: Readings, cases, and activities. San Francisco, CA: Berrett-Koehler.
Carr, J. Z., Schmidt, A. M., Ford, J. K., & DeShon, R. P. (2003). Climate perceptions matter: A meta-analytic path analysis relating molar climate, cognitive and affective states, and individual level work outcomes. Journal of Applied Psychology, 88, 605-619.
Cohen-Charash, Y., & Spector, P. E. (2001). The role of justice in organizations: A meta- analysis. Organizational Behavior and Human Decision Processes, 86, 278-321. Delgado-Romero, E. A., Galvan, N., Maschino, P., & Rowland, M. (2005). Race and ethnicity in empirical counseling and counseling psychology research: A 10-year review. The Counseling Psychologist, 33(4), 419-448. Dolbier, C. L, Webster, J. A., McCalister, K. T., Mallon, M. W., & Steinhardt, M. A. (2005).
Reliability and validity of a single-item measure of job satisfaction. American Journal of Health Promotion, 19(3), 194-198.
Ely, R. J. (1994). The effects of organizational demography and social identity on relationships among professional women. Administrative Science Quarterly, 39, 203-238.
Ely, R. J., & Thomas, D. A. (2001). Cultural diversity at work: The effects of diversity perspectives on work group processes and outcomes. Administrative Science Quarterly, 46, 229-273. Ensher, E. A., Grant-Vallone, E. J., & Donaldson, S. I. (2001). Human Resource Development
Quarterly, 12(1), 53-72. Equal Employment Opportunity Commission. (2013) Charge statistics FY 1997 through FY
2013. Retrieved from http://eeoc.gov/eeoc/statistics/enforcement/charges.cfm.

Hedman & Garriott
NCIT
43
Federal Glass Ceiling Commission. (1995). Good for business: Making full use of the nation’s human capital. Washington, DC: Government Printing Office. Findler, L., Wind, L. H., & Mor Barak, M. E. (2007). The challenge of workforce management
in a global society: Modeling the relationship between diversity, inclusion, organizational culture, and employee well-being, job satisfaction and organizational commitment. Administration in Social Work, 31(3), 63-94.
Frink, D. D., Robinson, R. K., Reithel, B., Arthur, M. M., Ammeter, A. P., Ferris, G. R., Kaplan, D. M., & Morrisette, H. S. (2003). Gender demography and organizational performance. Group & Organization Management, 28(1), 127-147.
Gilbert, J. A., & Ivancevich, J. M. (2001). Effects of diversity management on attachment. Journal of Applied Social Psychology, 31(7), 1331-1349.
Gilbert, J. A., Stead, B. A., & Ivancevich, J. M (1999). Diversity management: A New organizational paradigm. Journal of Business Ethics, 21(1), 61-76. Groggins, A. & Ryan, A. M. (2013). Embracing uniqueness: The underpinnings of a positive climate for diversity. Journal of Occupational and Organizational Psychology, 86, 264-282. Gruber, J. E., & Bjorn, L. (1982). Blue-collar blues. Work and Occupations, 9(3), 271-298. Gustafson, J. L. (2008). Tokenism in policing: An empirical test of Kanter’s hypothesis. Journal of Criminal Justice, 36(1), 1-10. Gutek, B. A. (2001). Women and paid work. Psychology of Women Quarterly, 25, 379-393. Heilman, M. E. (1996). Affirmative action’s contradictory consequences. Journal of Social
Issues, 52(4), 105-109. Hitlan, R. T., Cliffton, R. J., & DeSoto, M. C. (2006). Perceived exclusion in the workplace: The
moderating effects of gender on work-related attitudes and psychological health. North American Journal of Psychology, 8(2), 217-236.
Hu, L., & Bentler, P. M. (1999). Cutoff criteria for fit indexes in covariance structure analysis: Conventional criteria versus new alternatives. Structural Equation Modeling: A Multidisciplinary Journal, 6(1), 1-55. Kanter, R. M. (1977). Men and Women of the Corporation. New York, NY: Basic Books. King, E. B., Hebl, M. R., George, J. M., & Matusik, S. F. (2009). Understanding tokenism:
Antecedents and consequences of a psychological climate of gender inequity. Journal of Management, 36(2), 482-510.
Kochan, T., Bezrukova, K., Ely, R., Jackson, S., Joshi, A., Jehn, K, Leonard, J., Levine, D., & Thomas, D. (2003). The effects of diversity on business performance: Report of the diversity research network. Human Resource Management, 42(1), 3-21.
Kossek, E. E., & Lobel, S. A., Eds. (1996). Managing diversity: Human resource strategies for transforming the workplace. Cambridge, MA: Blackwell.
Lee, A. M. D. (2008). The power of many. Incentive, 182, 16-21. Leong, C. S., Furnham, A., & Cooper, C. L. (1996). The moderating effect of organizational
commitment on the occupational stress outcome relationship. Human Relations, 49(10), 1345-1363.
Maeder, E. M., Wiener, R. L., & Winter, R. (2007). Does a truck driver see what a nurse sees? The effects of occupation on perceptions of sexual harassment. Sex Roles, 56, 801-810.

Hedman & Garriott
NCIT
44
McKay, P. F., Avery, D. R., & Morris, M. A. (2009). A tale of two climates: Diversity climate from subordinates’ and managers’ perspectives and their role in store unit sales performance. Personnel Psychology, 62, 767-791.
Miller, F. A. (1998). Strategic culture change: The door to achieving high performance and inclusion. Public Personnel Management, 27(2), 151-160.
Mor Barak, M. E. (2000). The inclusive workplace: An ecosystems approach to diversity management. Social Work, 45(4), 339-352. Mor Barak, M. E. (2011). Managing diversity: Toward a globally inclusive workplace. Thousand Oaks, CA: Sage. Mor Barak, M.E., & Cherin, D. A. (1998). A tool to expand organizational understanding of workforce diversity: Organizational and personal dimensions. Journal of Applied Behavioral Sciences, 34(1), 82-104. Mor Barak, M. E., Cherin, D. A., & Berkman, S. (1998). Organizational and personal dimensions in diversity climate: Ethnic and gender differences in employee perceptions. Journal of Applied Behavioral Science, 34(1), 82-104. Mor Barak, M. E., & Levin, A. (2002). Outside of the corporate mainstream and excluded from
the work community: A study of diversity, job satisfaction and well-being. Community, Work & Family, 5(2), 133-157.
Murrell, A. J., & Jones, R. (1996). Assessing affirmative action: Past, present and future. Journal of Social Issues, 52(4), 77-92. Nkomo, S., & Hoobler, J. M. (2014). A historical perspective on diversity ideologies in the
United States: Reflections on human resource management research and practice. Human Resource Management Review, 24, 245-257.
O’Connor, B. P. (2000). SPSS and SAS programs for determining the number of components using parallel analysis and Velicer’s MAP test. Behavior Research Methods, Instrumentation, and Computers, 32, 396-402.
Oswick, C., & Noon, M. (2014). Discourses of diversity, equality and inclusion: Trenchant formulations or transient fashions? British Journal of Management, 25, 23-39.
Padavic, I., & Reskin, B. (2002). Women and men at work (2nd ed.). Thousand Oaks, CA: Sage. Parker, C. P., Baltes, B. B., Young, S. A., Huff, J. W., Altmann, R. A., Lacost, H. A., & Roberts,
J. E. (2003). Relationships between psychological climate perceptions and work outcomes: A meta-analytic review. Journal of Organizational Behavior, 24, 389-416.
Podsakoff, P. M., MacKenzie, S. B., Lee, J. K., & Podsakoff, N. P. (2003). Common method biases in behavioral research: A critical review of the literature and recommended remedies. Journal of Applied Psychology, 88(5), 879-903.
Reskin, B. F. (1998). The Realities of Affirmative Action in Employment. Washington, DC: American Sociological Association.
Roberson, Q. M. (2006). Disentangling the meanings of diversity and inclusion in organizations. Group & Organization Management, 31(2), 212-236.
Settles, I. H., Cortina, L. M, Stewart, A. J., & Malley, J. (2007). Voice matters: Buffering the impact of a negative climate for women in science. Psychology of Women Quarterly, 31, 270-281. Sherry, P., Bondanza, A., Hedman, B., & Pinarowicz, J. (2011, March). The experience of being
female in the transportation industry. Poster presented at the annual Transportation Research Forum, Long Beach, CA.

Hedman & Garriott
NCIT
45
Shore, L. M., Randel, A. E., Chung, B. G., Dean, M. A., Ehrhart, K. H., & Singh, G. (2011). Inclusion and diversity in work groups: A review and model for future research. Journal of Management, 37(4), 1262-1289.
Sliter, M., Boyd, E., Sinclair, R., Cheung, J., & McFadden, A. (2014). Inching toward inclusiveness: Diversity climate, interpersonal conflict, and well-being in women nurses. Sex Roles, 71, 43-54.
Tabachnhick, B. G., & Fidell, L. S. (2014). Using multivariate statistics: Pearson new international edition (6th ed.). London: Pearson. Tajfel, H. (1981). Human groups and social categories: Studies in social psychology. New York,
NY: Cambridge University Press. Tajfel, H. (Ed.). (1982). Social identity and intergroup relations. New York, NY: Cambridge
University Press. Tajfel, H., & Turner, J. C. (1986). The social identity theory of intergroup behavior. In S.
Worchel & W. G. Austin (Eds.), Psychology of intergroup relations (pp. 7–24). Chicago, IL: Nelson-Hall.
Thomas, K. M., & Plaut, V. C. (2008). The many faces of diversity resistance in the workplace. In K. M. Thomas, (Ed.). Diversity resistance in organizations (pp. 1-22). New York, NY: Taylor & Francis Group.
Toole, J. S., & Martin, C. C. (2004). Developing tomorrow’s transportation workforce. Institute of Transportation Engineers Journal, March, 2004, 26-30. Toossi, M. (2009). Employment outlook: 2008-18. Monthly Labor Review, Retrieved from
http://www.bls.gov/opub/mlr/2009/11/art3full.pdf Triana, M. C. D., & Garcia, M. F. (2009). Valuing diversity: a group-value approach to understanding the importance of organizational efforts to support diversity. Journal of Organizational Behavior, 30, 941-962. Triana, M. C. D., Garcia, M. F., & Colella, A. (2010). Managing diversity: How organizational
efforts to support diversity moderate the effects of perceived racial discrimination on affective commitment. Personnel Psychology, 63, 817-843.
Turner, J. C. (1982). Toward a cognitive redefinition of the social group. In H. Tajfel, (Ed.). Social identity and intergroup relations (pp. 15-40). New York, NY: Cambridge University Press.
Turner, J. C. (1985). Social categorization and the self-concept: A social cognitive theory of group behavior. In E. J. Lawler (Ed.). Advances in group processes: Vol. 2. Theory and Research (pp. 77-122). Greenwich, CT: JAI Press.
U.S. Department of Labor. (2011). Labor force characteristics by race and ethnicity. Retrieved from http://www.bls.gov/cps/cpsrace2011.pdf U. S. Department of Labor. (2007). Identifying and addressing workforce challenges in America’s transportation industry. Retrieved from http://www.doleta.gov/BRG/pdf/Transportation%20Report_final.pdf U. S. Department of Transportation (2013). Women and skilled careers in transportation. Retrieved from http://www.dot.gov/womenandgirls/skilled-careers Van Marrewijk, M. (2004). The social dimensions of organizations: Recent experiences with
Great Place to Work assessment practices. Journal of Business Ethics, 55, 135-146. Wanous, J. P., Reichers, A. E., & Hudy, M. J. (1997). Overall job satisfaction: How good are single-item measures? Journal of Applied Psychology, 82(2), 247-252.

Hedman & Garriott
NCIT
46
Wessel, J. L., & Ryan, A. M. (2012). Support when not supported? Male responses to negative climates for women. Sex Roles, 66, 94-104. Wooten, L. P. (2008). Breaking barriers in organizations for the purpose of inclusiveness. Human Resources Management, 47, 191-197. Worthington, R. L., & Whittaker, T. A. (2006). Scale development research: A content analysis
and recommendations for best practices. The Counseling Psychologist, 34(6), 806-838. Yakura, E. K. (1996). EEO law and managing diversity. In E. E. Kossek & S. A. Lobel (Eds.),
Managing diversity: Human resource strategies for transforming the workplace (pp. 25-50). Cambridge, MA: Blackwell.
Yoder, J. D. (2002). 2001 Division 35 Presidential Address: Context matters: Understanding tokenism processes and their impact on women’s work. Psychology of Women Quarterly, 26, 1-8.

Hedman & Garriott
NCIT
47
Project #2: The transportation career intentions of high school students
Introduction
The field of transportation is estimated to employ 12,232,000 individuals in the United States (U.S.), and broadly encompasses work in the industries of ground passenger, pipeline, air, rail, water and truck transportation, and warehouse and storage (Bureau of Labor Statistics, 2010a). Positions in the field of transportation offer work in diverse arenas such as vehicle operation, equipment manufacturing, pipeline operation, infrastructure construction, and secondary support services (Bureau of Labor Statistics, 2010a). In 2012, representatives of the transportation industry expressed concern regarding the ability of the transportation workforce to keep up with the rising demand for transportation services and job turnover (U.S. Department of Transportation, 2012). In response, recent industry recruitment efforts have been specifically targeted toward younger individuals and women (U.S. Department of Transportation, 2013).
Women have been designated as a priority in transportation workforce recruitment, as they are noticeably underrepresented in the transportation industry. For example, current census data suggests that despite women’s near equal participation rate (49.6%) in the U.S. labor force, only 5% of employed women work in production, transportation, and material moving occupations. Within the field of transportation, women account for a mere 13% of employees (Bureau of Labor Statistics 2010b). Formal research into the origins of the exclusion of women in the transportation workforce has not yet been conducted, making it difficult to discern if the underrepresentation of women is the result of issues in recruitment, retention, or other contextual factors. Discrepancies in the workplace are important to consider, as they may echo larger inequities such as unequal distribution of power and influence, access to education, and opportunity to develop personal ambitions (United Nations Population Fund, 2008).
To better recruit and attract transportation employees, a better understanding of why women are underrepresented in the transportation industry is needed. Additionally, examining the formation of early interest in transportation careers could inform workforce development practices for targeted recruitment of younger individuals. Assessing adolescents’ transportation career intentions is also appropriate given jobs in the transportation industry require an array of entry-level education, ranging from a high school diploma to a graduate degree (Bureau of Labor Statistics, 2015). Therefore, the present study examined predictors of transportation career intentions in a sample of female and male high school students.
Theoretical Framework
This study used an integrated theoretical framework to examine predictors of transportation career intentions. Specifically, the theory of reasoned action (TRA; Ajzen, 1991) was used in conjunction with the concept of ambient belonging, and more specifically, perceived dissimilarity. An integrated theoretical framework was adopted for this study, as researchers have advocated for adding variables to the TRA that may function as barriers to behavioral intentions (Arnold et al., 2006). In prior research, perceived dissimilarity has been shown to be a relatively potent predictor of women’s career development in other male-dominated fields (Cheryan & Plaut, 2010), and thus might serve as a barrier to career intentions in transportation. Further, integrating theoretical constructs from the TRA with ratings of prototypes (i.e., one’s

Hedman & Garriott
NCIT
48
image of a “typical person” engaging in a specific behavior) to predict behavioral intentions has been shown to account for greater variance in outcomes compared to use of TRA constructs alone (Hammer & Vogel, 2013). Thus, an integrated framework seemed appropriate for the purpose of this study.
Theory of Reasoned Action
The TRA proposes a link between a person’s beliefs and their behavior, positing that the likelihood of an individual performing a given action is influenced by their attitude toward the behavior and subjective norms (Ajzen, 1991). Attitudes describe whether an individual has a favorable or unfavorable evaluation of a given behavior, and whether an individual believes the consequences of performing this behavior are desirable (Eagly & Chaiken, 1993). Subjective norms refer to perceived social pressure to perform a given behavior, based upon the individual’s normative beliefs of referent individuals who may approve or disapprove of performing the behavior in question (Ajzen, 1991). The TRA asserts that when attitudes are favorable, and subjective norms are positive, intentions to perform a given behavior will be stronger (Ajzen, 1991).
The TRA has been used in studies with a variety of populations, and has accumulated empirical support within the vocational psychology literature. For example, attitudes and social norms have been shown to predict intentions to work in specific vocational domains (Arnold et al., 2006) as well as job-seeking behavior (Jaidi, Van Hooft, and Arends, 2011; Van Hooft, Born, Taris, & Van der Flier, 2006). Evaluative attitudes and social norms may be salient for female and male high school students, as early to late adolescence includes the process of initially evaluating careers that may be of interest (Super, 1957). Further, peer influence and group norms have been shown to be important predictors of behavior among adolescents (Brechwald & Prinstein, 2011). Finally, perceived consequences of a given behavior (i.e., entering a transportation career) may relate to career intentions for adolescents—particularly females in male dominated fields. Specifically, the anticipated costs (e.g., sexism) of entering a male-dominated field could limit one’s desire to pursue a domain that is potentially viewed as exclusionary or discriminatory.
Anticipated sexism.
Gaining a better understanding of how women view the transportation industry work
environment as they begin the exploratory phase of career development as well as how this might inform their transportation career intentions could lead to interventions aimed at diversifying the transportation workforce pipeline. Given the transportation industry is a male-dominated field and workplace climate concerns have been raised by female transportation employees (U.S. Department of Transportation, 2011), women may anticipate experiencing sexism as a transportation employee. Anticipated workplace sexism was assessed in the present study and served as an indicator of the perceived consequences of pursuing a career in the transportation industry.
Perceptions of future career barriers, such as gender discrimination, have been shown to be higher among females than males (Luzzo & McWhirter, 2001; McWhirter, 1997). However, studies assessing perceptions of future career-related gender discrimination have failed to document a significant link between barriers and women’s or men’s career choice traditionality

Hedman & Garriott
NCIT
49
(Flores & O’Brien, 2002; Flores, Navarro, Smith, & Ploszaj, 2006). Additional research suggests that women are more likely than men to perceive that workplace sexism will affect their career, but that it is more likely to happen to other women (Sipe, Johnson, & Fisher, 2009b). A limitation of research examining the influence of anticipated sexism and gender discrimination on vocational outcomes is that these studies have typically focused on general academic and career planning rather than specific vocational domains. More research is needed to determine if anticipating career barriers, such as sexism, influence domain-specific career intentions, particularly among women in male-dominated fields such as the transportation industry.
Perceived Dissimilarity
Social psychological research has used the framework of ambient belonging to examine women’s interests in male-dominated fields. Ambient belonging refers to an individual’s sense of, “fit with the material (e.g., physical objects) and structural (e.g., layout) components of an environment along with a sense of fit with the people who are imagined to occupy that environment” (Cheryan, Plaut, Davies, & Steele, 2009, p. 1046). Theoretically, ambient belonging asserts that stereotypes of a field may drive participation within an academic or career area. Ambient belonging may also be distinguished from traditional vocational psychology theories, such as person-environment (P-E) fit. Whereas P-E fit is concerned with the fit between an individual’s values, abilities, and needs and an organization’s or job’s mission, demands, and offerings (Cable & DeRue, 2002), ambient belonging addresses how stereotypes of individuals within a field may drive participation within that domain (Cheryan et al., 2009). Further, while the P-E fit framework is often used to address career satisfaction and work adjustment, ambient belonging provides a viable framework from which to understand career interests and intentions.
For the purposes of the present study, we focused on one aspect of ambient belonging—perceived dissimilarity with individuals imagined to occupy transportation careers. It is posited that people are less likely to participate in a given career domain the less similarity they perceive with the people or things they observe or imagine occupy that domain (Cheryan et al., 2009). Applied to transportation careers, an individual who imagines a transportation employee to have similar traits and features when thinking about oneself will be more likely to endorse high transportation career intentions. Prior research supports the hypothesis that degree of perceived similarity between oneself and prototypical traits of those in a field predicts positive attitudes toward that field (Hannover & Kessels, 2004; Rommes, Overbeek, Scholte, Engels, & De Kemp, 2007).
In a series of studies, Cheryan and colleagues found evidence that perceived dissimilarity to individuals in computer science (Cheryan, Siy, Vichayapai, Drury, & Kim, 2011; Cheryan et al., 2009; Cheryan & Plaut, 2010) and English majors (Cheryan & Plaut, 2010) predicted self-reported confidence and interest in those fields. In one study, the authors found that out of several predictors—including social identity threats and expectations of success—perceived dissimilarity served as the most robust mediator of gender and academic interests (Cheryan & Plaut, 2010). Thus, research points to the importance of stereotypes of a field and an individual’s sense of perceived dissimilarity to others imagined to occupy a vocational domain as predictors of academic and career planning, particularly for females in male-dominated fields.
While this research has provided a promising theoretical perspective on academic and vocational behavior, all but one study (i.e., Cheryan & Plaut, 2010) investigating perceived dissimilarity has examined the domain of computer science and no studies have examined high

Hedman & Garriott
NCIT
50
school students. Research would benefit from further investigation of the role of perceived dissimilarity in male-dominated domains outside of computer science to determine if theoretical propositions extend to other fields. Similarly, extending the concept of perceived dissimilarity to populations other than college students would help clarify what role it may play at various developmental stages.
Purpose of the Study
The purpose of the present study was to examine the transportation career intentions of female and male high school students. Within this broader aim, we sought to determine if: (a) there were differences between females and males on measures of attitudes, social norms, perceived dissimilarity, and intentions, (b) attitudes and social norms would significantly predict intentions, (c) perceived dissimilarity would uniquely predict intentions after accounting for attitudes and social norms, and (d) variables in the present study would explain the relationship between gender and transportation career intentions. The theory of reasoned action and ambient belonging guided research questions and hypotheses. Specific hypotheses are included below:
Hypothesis 1: Females would score significantly higher than males on measures of anticipated sexism and perceived dissimilarity.
Hypothesis 2: Males would score higher than females on measures of evaluative attitudes, social norms, and intentions.
Hypothesis 3: Evaluative attitudes, anticipated sexism, and social norms would significantly predict transportation career intentions across males and females.
Hypothesis 4: Perceived dissimilarity would predict transportation career intentions for males and females after accounting for the predictive influences of evaluative attitudes, anticipated sexism, and social norms.
The fourth hypothesis was included, as researchers have advocated for adding variables to the TRA only when it can be demonstrated they account for unique variance in a criterion variable (Ajzen, 1991). We also conducted mediation analyses to determine which predictor variables might explain the relationship between gender and transportation career intentions. These analyses were conducted to determine variables that might explain the underrepresentation of females in transportation careers. Given results of prior research (e.g., Cheryan & Plaut, 2010), it was expected that perceived dissimilarity would mediate the relationship between gender and intentions (Hypothesis 5). Because no hypotheses are offered in the TRA regarding the relation of gender to attitudes and social norms, mediation analyses involving evaluative attitudes, anticipated sexism, and social norms were considered exploratory.

Hedman & Garriott
NCIT
51
Method
Participants
Participants were 263 high school students recruited from public high schools in the Rocky Mountain region of the United States (U.S.). Average age was 15.51 years (SD = 2.90). Approximately 45% (n = 118) of the sample was female. Participants identified as “Latina/o,” (42.0%, n = 113), “White (non-Hispanic)” (38.4%, n = 101), “African American/Black,” (9.1%, n = 24), “Asian/Asian American,” (6.0%, n = 16), “Multiracial” (3.8%, n = 10), and “Native American” (0.7%, n = 2). In terms of class rank, 18.3% (n = 48) were freshmen, 30.4% (n = 80) were sophomores, 26.6% (n = 70) were juniors, and 22.1% (n = 58) were seniors. Seven participants did not provide this information.
Instruments
Demographic questionnaire. Participants completed a brief demographic questionnaire that assessed their age, gender, race, ethnicity, and class rank.
Anticipated sexism. Perceptions of anticipated sexism in the transportation field were assessed with four Likert items rated on a scale ranging from 1 (strongly disagree) to 5 (strongly agree). Items were adapted from the Gender Issues Survey (GIS; Sipe, Johnson, & Fisher, 2009b), an instrument designed to assess workplace gender-based discrimination and sexual harassment. More specifically, the GIS assesses the subjective outcomes of gender discrimination and sexual harassment on perceptions of career advancement and satisfaction (Sipe et al., 2009b). Four items from the GIS were selected for use in the present study and included: “In my future job, I will probably be treated differently because of my gender;” “In my future job, I will probably experience sexist remarks or behavior because of my gender (such as insults, rude jokes, or sexual advances);” “In my future job, I will probably have a harder time getting hired than people of the opposite gender;” and “In my future job, I will probably experience discrimination because of my gender.” These four items were selected because they appeared to be most appropriate with regard to content and readability for high school participants. A prompt directed participants to answer questions about anticipated sexism under the assumption that they intended to enter a career in the transportation industry. In prior research with college students, scores on the GIS yielded a coefficient alpha of .89 and females reported higher scores on the measure compared to males (Sipe et al., 2009a). The four items selected for this study were subjected to exploratory (EFA) and confirmatory factor analyses (CFA) prior to main data analyses. Results of a principle axis factor analysis with varimax rotation indicated all items loaded onto a single factor. Structural equation modeling using AMOS 22.0 (Arbuckle, 2013) was conducted to confirm a single factor best represented items on the scale and that all items significantly loaded onto the single latent factor. Fit indices for the CFA suggested adequate model-to-data fit for a single-factor scale. Specifically, the comparative fit index (CFI) was equal to .99, the Tucker-Lewis index (TLI) was .97 and the root mean error approximation (RMSEA) was .08 (90% confidence interval, .01, .17). Fit indices of ≥ .95 for the CFI and TLI and ≤ .08 for the RMSEA have been recommended as cut-off for adequate model-to-data fit (Kline, 2005). All items significantly (p < .001) loaded onto the single latent factor. Coefficient alpha for the four items selected for the present study was .92.

Hedman & Garriott
NCIT
52
Evaluative attitudes. Evaluative attitudes regarding transportation careers were measured with items used in previous vocational research using the TRA (Arnold et al., 2006; Oren et al., 2013). Item stems were adapted to reflect attitudes regarding transportation careers. This measure included three items with the prompt, “Working in the transportation industry would be…” Items were rated on a Likert-type scale ranging from 1 to 7 and anchors consisting of the labels “enjoyable” and “unenjoyable,” “wise” and “unwise,” as well as, “good” and “bad.” Items were reverse scored such that high scores reflected favorable attitudes. Vocational research using these items yielded a Cronbach’s alpha of .78 and indicated that attitudes had significant positive correlations with social norms and behavioral intentions (Arnold et al., 2006). Coefficient alpha for scale scores on the attitude measure in the present study was .77. Intentions. Intentions to pursue a career in the transportation industry were measured by three items. The first item was consistent with prior research using the TRA (e.g., Oren et al., 2013) and asked that participants rate their intention to pursue a career in transportation on a scale ranging from 1 (very strongly disagree) to 6 (very strongly agree). Research using items to measure vocational intentions in this format found significant correlations among attitudes, social norms, and behavioral intentions (Oren et al., 2013). The second item asked participants to rate how seriously they would consider a career in transportation on a scale ranging from 0 (not very seriously) to 9 (very seriously). Research using items to measure career intentions using this format found significant correlations with self-efficacy and outcome expectations across Holland themes (Lent, Paixão, da Silva, & Leitão, 2010). The third item was based on prior research assessing college students’ transportation career intentions (Philbrick & Sherry, 2004). First, participants were provided with a list of eight Fortune 500 companies in the transportation industry that posted significant profit margins in the past fiscal year. Next, participants rated the likelihood they would work in the transportation industry assuming they could work at one of the listed companies. These responses were rated on a scale ranging from 1 (little or no degree) to 5 (very great degree). Prior research using this item to assess transportation career intentions found expected relationships between intentions and Holland typologies (Philbrick & Sherry, 2004). The three items were standardized and averaged to create a composite intentions variable, with high scores indicating high intentions to pursue a career in transportation.
Perceived dissimilarity. Measurement of perceived dissimilarity was modeled after research conducted by Cheryan et al. (2009). Participants were asked to list three characteristics they associated with a person who works in the transportation industry. They were then instructed to rate their perceived similarity with the person they described using a rating scale ranging from 0 (not at all) to 7 (very much). A similar method of rating perceived dissimilarity has been carried out in previous research on computer science and was found to predict interest in that field (Cheryan et al., 2009). Social norms. Social norms were assessed using a scale administered in prior vocational psychology research using the TRA (Arnold et al., 2006). Participants rated four items reflective of social pressure to obtain a career in transportation on a Likert scale ranging from 1 (strongly disagree) to 7 (strongly agree). A sample item is, “Most of my family probably think I should work in the transportation industry.” Items are averaged with high scores indicative of high levels of perceived social pressure and acceptability for engaging in a behavior. Previous research examining social norms and vocational behavior found a coefficient alpha of .79 for scale scores on the measure (Arnold et al., 2006). Validity evidence was found

Hedman & Garriott
NCIT
53
through significant positive correlations with attitudes and behavioral intentions (Arnold et al., 2006). Coefficient alpha for scale scores in the present study was .90.
Procedure Institutional Review Board approval was granted prior to conducting study procedures. Participants were recruited during class time at their respective schools and supplied with information about the aim and scope of the study. Implied consent was obtained from parents for the study. Informational letters about the study were provided to parents that detailed the purpose of the research and study activities. Parents were instructed to speak with their child about not participating if they did not wish for them to complete the study and were encouraged to contact the first author if they had questions or concerns about the research. Implied consent forms were distributed in English and Spanish due to the number of Spanish-speaking families present in the school districts serving as sites for data collection. A professional translation service translated all documents. Students who met eligibility criteria for the study and signed assent forms were administered surveys in the presence of trained research assistants. Surveys took approximately 20 minutes to complete and students were able to enter a raffle for one of ten $25 gift cards to a superstore.
Data Analysis
Differences between females and males on main study variables were examined using a multivariate analysis of variance (MANOVA). In addition to statistically significant mean differences, effect sizes were examined to evaluate the practical significance of differences between groups. Specifically, we used Cohen’s (1988) criteria for interpreting effect sizes (.01 = small, .06 = medium, .14 = large). Hierarchical multiple regression was used to determine which variables significantly predicted transportation career intentions as well as whether perceived dissimilarity added unique predictive value to the regression equation. Bias-corrected bootstrapping was used to conduct mediation tests. SPSS 22.0 was used to conduct all analyses and the PROCESS macro (Hayes, 2013) was used for mediation analyses. Power analysis. An a priori power analysis was conducted to determine an adequate sample size for primary data analyses. All power analyses included alpha level set at .05 and a desired power of .80. Power analyses for MANOVA and multiple regression analyses were conducted in G Power 3.2. For the MANOVA, a sample size of 602 was necessary to detect a small effect size and a sample of 86 was needed to detect a medium effect size. For the hierarchical regression, a sample size of 602 was needed to detect a small effect size and a sample of 85 was needed to detect a medium effect size. Power for mediation analyses has been shown to be dependent upon the statistical approach used for mediation used as well as the anticipated effect sizes for specific paths within mediation models (Fritz & MacKinnon, 2007). Using the bias-corrected bootstrap approach, necessary sample sizes for mediation analyses ranged from 462 (i.e., two small effect sizes) to 34 (i.e., two large effect sizes). The sample size necessary to detect two small-to-medium effect sizes was 148 (Fritz & MacKinnon, 2007). Efforts were made to secure a sample large enough to detect at least small-to-medium effect sizes in all analyses.

Hedman & Garriott
NCIT
54
Results
Preliminary Analyses
Data screening. A total of N = 297 students returned surveys. The Missing Values Analysis function of SPSS was used to examine missing data patterns. Little’s missing completely at random (MCAR) test was not statistically significant ( 2 = 78.59, p = .089), indicating data were MCAR. Examination of patterns of missing data revealed that there were 55 (2.31%) missing values on variables within the dataset. Percentages of missing data ranged from 2% on social norms to 13% on the dissimilarity index. Data were next screened for excessive (i.e., > 20% items missing on a scale, failure to respond to any of the single-item indicators, and those who did not report gender) missing data as well as univariate and multivariate normality. A total of 27 cases were deemed to have excessive missing data and were deleted. Following removal of these cases, there were no additional instances of missing data. Inspection of univariate and multivariate outliers resulted in the deletion of seven additional cases and a final sample of N = 263.
Primary Analyses
Correlations and descriptive statistics are presented in Table 1. No significant correlations were found between age, class rank, or race/ethnicity with the main study variables. Moderate to large correlations were observed between intentions and evaluative attitudes, social norms, and perceived dissimilarity. Contrary to expectations, anticipated sexism was not significantly correlated with intentions.
For the MANOVA, participant gender was entered as the independent variable and evaluative attitudes, anticipated sexism, perceived dissimilarity, and intentions were entered as dependent variables. Results showed a statistically significant multivariate main effect, Wilks’ Λ = .87, F(5, 258) = 7.06, p < .001, η2 = .125. Follow-up tests revealed significant univariate effects for social norms, F(1, 262) = 4.76, p = .030, η2 = .019, anticipated sexism, F(1, 262) = 16.89, p < .001, η2 = .063, and intentions, F(1, 262) = 13.42, p < .001, η2 = .051. Females endorsed lower (2.57) social norms compared to males (2.95) as well as lower (-.20) intentions compared to males (.19). Conversely, females reported higher (2.42) levels of anticipated sexism compared to males (1.92). A hierarchical regression was next conducted to examine predictors of transportation career intentions across female and male participants. Intentions were entered as the criterion variable; evaluative attitudes, anticipated sexism, and social norms were entered together as a block in step one; and perceived dissimilarity was entered in step two. Results showed that the first step of the regression was statistically significant, F(3, 259) = 62.26, p < .001, and accounted for 41% of the variance in intentions. The second step of the regression was also significant, F(1, 258) = 9.90, p = .002 and accounted for unique variance above and beyond the first step of the equation, ΔR2 = .02. In terms of individual relationships between predictor and criterion variables, evaluative attitudes (β = .31, t = 5.09, p < .001), social norms (β = .31, t = -5.04, p < .001, and perceived dissimilarity (β = .16, t = 3.14, p = .002) were all significant predictors of intentions. Anticipated sexism was not a significant predictor in the model (β = -.01, t = -.174, p = .862).

Hedman & Garriott
NCIT
55
Next, a mediation analysis was conducted to test whether the relationship between gender and intentions could be explained by TRA and perceived dissimilarity variables. Gender was included as a predictor variable, intentions were included as a criterion variable, and evaluative attitudes, social norms, anticipated sexism, and perceived dissimilarity were entered as mediators. A total of 10,000 bootstrap samples were requested to generate bias-corrected confidence intervals. Confidence intervals (CI) not including zero were deemed statistically significant at the p < .05 level (Shrout & Bolger, 2002). Results suggested that social norms were the only significant mediator within the model (β = -.06, CI = [-.169, -.013]; see Figure 1). Conversely, evaluative attitudes, (β = -.04, CI = [-.120, .017]), anticipated sexism (β = .02, CI = [-.011, .068]), and perceived dissimilarity (β = -.01, CI = [-.046, .0521]) did not mediate the relationship between gender and intentions.
Discussion
This is one of the few studies to examine transportation career intentions and the only study to do so with high school students. This is also the only study to date to explore differences between female and male adolescents on ratings of transportation career intentions. Hypothesis one—that females would report higher anticipated sexism and perceived dissimilarity to individuals in the transportation field—was partially supported. Females reported higher mean levels of anticipated sexism compared to males, but not perceived dissimilarity. The finding regarding anticipated sexism suggests that females may view the transportation industry as an unfriendly and exclusionary environment for women early in the career development process. It may be that females’ view of transportation as a male-dominated field drives these perceptions. It is also possible that the perceived tasks and demands of transportation careers inform females’ perceptions of anticipated sexism within the transportation industry. However, research demonstrating that females generally anticipate higher levels of gender-based discrimination in the workplace could also explain this finding. It is possible that the null finding related to gender differences on ratings of perceived dissimilarity reflects participants’ collective high mean ratings of perceived dissimilarity with individuals imagined to occupy transportation careers. That is, it could be that females and males hold equally negative perceptions of transportation employees. While responses varied, a sampling of open-ended answers provided by participants to the question regarding characteristics associated with transportation employees revealed perceptions of, “unhappy,” “poor,” and “unhealthy” individuals across female and male participants. Hypothesis two—that males would report higher levels of evaluative attitudes, social norms, and intentions—also received partial support. Specifically, males endorsed higher social norms and intentions than females. These results suggest that male high school students perceive entering the transportation field as more acceptable to family and friends and are also more likely to consider pursuing a transportation career than their female peers. Conversely, females may view transportation careers as less socially acceptable given the perceived tasks and demands of transportation jobs and would appear to be more likely to rule out a career in transportation in the earlier phases of career development. These results suggest challenges associated with recruitment of women to the transportation workforce may develop early in the school to work pipeline.
Hedman & Garriott
NCIT
56
Hypothesis three asserted that evaluative attitudes, social norms, and anticipated sexism would predict intentions and hypothesis four posited that perceived dissimilarity would predict intentions above and beyond the aforementioned variables. Of the TRA variables, only evaluative attitudes and social norms significantly predicted intentions. The failure of anticipated sexism to predict intentions is consistent with previous research indicating that perceptions of future gender-related barriers do not predict career choice traditionality (Flores & O’Brien, 2002). It is also possible that young women, who may not yet have developed a feminist identity orientation, do not yet draw connections between anticipated workplace sexism and intentions to pursue a particular career domain. Researchers have noted that perceptions of gender-based discrimination in the workplace often do not align with realities experienced by women. Specifically, research shows that male and female students may underestimate the frequency of workplace gender discrimination (Sipe et al., 2009). It is also possible that this bias in perceptions diminished the link between anticipated sexism and intentions in this study.
Regarding the finding for perceived dissimilarity, it should be noted that Ajzen (1991) has advocated for adding variables to the TRA only when it can be shown that a third variable adds significant predictive value beyond variables already included in the model. Results of the present study appeared to satisfy this specification, as perceived dissimilarity predicted intentions after accounting for TRA variables. Like previous research, results of this study highlight the strength of perceived dissimilarity as a predictor of career decision-making and extend literature in this area to the transportation industry. Studies in other occupational domains that are male-dominated or in which negative stereotypes of employees may preclude interest and participation are warranted. Mediation analyses revealed that of all the predictors examined, only social norms explained the relationship between gender and participants’ transportation career intentions. Hypothesis 5—that perceived dissimilarity would mediate the relationship between gender and intentions—was not supported. These results suggest that female high school students may perceive transportation careers to be less socially acceptable than their male counterparts and that this may lead to their lower relative intentions to pursue a transportation career. Thus, gender role socialization may affect the degree to which females view a career in transportation as “acceptable” to friends and family. This finding supports propositions offered by circumscription and compromise theories of career development (Gottfredson, 1996). It is also notable that a relatively large percentage of participants in this study identified as Latina/o. Research shows that Latinas/os may consider family approval as well as “fit” when evaluating potential careers (Risco & Duffy, 2011). Thus, the ethnic composition of our sample may also help explain these findings. Due to power limitations, we were unable to test the moderating effect of race/ethnicity on the relationship between predictors and intentions. Future research may explore how race/ethnicity influences relationships between variables examined in this study.
Implications.
Findings from this study have implications for the transportation industry’s workforce recruitment efforts. Specifically, while attitudes and social norms assume reasoned and intentional cognitive processes, perceived dissimilarity represents a less rational and planned pathway to behavioral intentions. Therefore, findings from this study indicate that in addition to evaluative ratings and perceptions of how others would view a decision to pursue a transportation career, high school students are also influenced by less conscious cognitive

Hedman & Garriott
NCIT
57
processes in their choice to enter the transportation industry. While there is a need to increase high school students’ understanding of available transportation industry jobs, as well as their familiarity with what kinds of professionals occupy transportation careers (Philbrick & Sherry, 2004), it also appears important for rebranding efforts to address the overall perception of the transportation industry. It may be that limited contact and understanding of transportation industry professionals leads high school students to draw biased conclusions regarding who works in the transportation industry and what transportation employees do. For example, it has been shown that familiarity with transportation employees is often restricted to occupational options such as driving a truck (Philbrick & Sherry, 2004). This narrow view may inform what and whom high school students draw upon when making implicit judgments pertaining to transportation careers. Broadening understanding of the array of jobs offered in transportation as well as drawing positive associations between work in the transportation industry and the characteristics of those who occupy jobs in transportation could enhance the reputation of the industry.
Our findings also point to the importance of engaging individuals in transportation workforce recruitment efforts early in the career development process. Industry rebranding efforts may introduce high school students to individuals in transportation careers through educational curricula and outreach, social media, field trips, summer programs, and internships. Programs may be modeled on current educational and exposure efforts such as the Summer Transportation Institute. Such programs could expand high school students’ narrow perceptions of transportation careers. Researching the efficacy of such programs on enhancing the overall image of the transportation workforce as well as variables included in the present study may be a focus of future research.
Findings regarding differences between males and females on ratings of social norms, anticipated sexism, and intentions indicate a need to rebrand the transportation industry while making it more appealing to females. Rebranding efforts could focus on improving the industry’s image by presenting it as inclusive, rather than male-dominated. However, rebranding may do little to change females’ perceptions of the transportation industry without accompanying efforts directed toward changing existing gender-based climate concerns within the transportation workforce (U.S. Department of Transportation, 2011). Addressing workplace climate issues through company policies and procedures may be one way to enhance the climate for women in transportation. Examples might include evaluating maternity leave and harassment policies as well as making concerted efforts to promote women to high-level positions across sectors of the transportation field. Research has shown that targeted promotion and inclusive organizational policies are effective recruitment tactics for female employees (Avery & McKay, 2006).
Future research should examine how current transportation professionals—particularly females—navigated their career path. These studies could further understanding of the unique facilitators and barriers women face on their career paths in the transportation industry. In particular, qualitative research with women in transportation could provide rich descriptions of experiences that may not be captured by existing vocational theory or research.
Limitations
Although results of this study provide valuable information on high school students’
transportation career intentions, several limitations should be noted. First, this study was cross-

Hedman & Garriott
NCIT
58
sectional and therefore did not capture causal or longitudinal effects of attitudes, social norms, and perceived dissimilarity on students’ transportation career intentions. Furthermore, while perceived dissimilarity with individuals thought to occupy transportation careers was assessed, participants’ sense of belonging with objects and the layout of prototypical transportation career environments were not fully captured in this study. Previous research on ambient belonging has made use of experimental designs to test effects of stereotypical objects and environments on participants’ desire to pursue a given academic domain. Future studies on ambient belonging and transportation careers may take this methodological approach. This study also assessed participants’ intentions to pursue transportation careers more broadly, rather than specific occupations within the transportation industry. While this method may have potentially obscured important differences between various careers within the transportation industry, it did allow for more meaningful data in terms of what adolescents may consider when they conjure images of a career in “transportation.” This study is also limited in nature by confining the outcome of interest to intentions rather than assessing other potentially relevant and more proximal outcome variables, such as interests. Developmentally, assessing interests in transportation careers could be a fruitful next step of inquiry with high school students. Instruments in the present study were also adapted for use with transportation careers. Employing more targeted measures may have strengthened relationships between some of the variables in this study, however to our knowledge, there are no instruments specifically designed to assess transportation career-related constructs. Despite these limitations, this study uniquely contributes to available literature on the development of transportation career intentions. Future research and intervention efforts can build upon the findings of this study to promote successful recruitment of new employees to the growing transportation industry and ensure a diverse future workforce in this field.

Hedman & Garriott
NCIT
59
References Ajzen, I. (1991). The theory of planned behavior. Organizational Behavior and Human Decision Processes, 50, 179–211. doi: 10.1016/0749-5978(91)90020-T Arbuckle, J. (2013). Amos (Version 22.0) [Computer Program]. Chicago: SPSS. Arnold, J., Loan-Clarke, J., Coombs, C., Wilkinson, A., Park, J., & Preston, D. (2006). How well can the theory of planned behavior account for occupational intentions? Journal of Vocational Behavior, 69, 374-390. doi: 10.1016/j.jvb.2006.07.006 Avery, D. R., & McKay, P. F. (2006). Target practice: An organizational impression management approach to attracting minority and female job applicants. Personnel Psychology, 59, 157-187. doi: 10.1111/j.1744-6570.2006.00807.x Brechwald, W. A., & Prinstein, M. J. (2011). Beyond homophily: A decade of advances in understanding peer influence processes. Journal of Research on Adolescence, 21, 166- 179. doi: 10.1111/j.1532-7795.2010.00721.x Bureau of Labor Statistics, U.S. Department of Labor (2015), Occupational Outlook Handbook, 2014-2015 Edition. Retrieved from http://www.bls.gov/ooh/ Bureau of Labor Statistics, U. S. Department of Labor (2010a). Employment and Earnings, January, 2010 Annual Averages. Retrieved from: http://www.bls.gov/opub/ee/empearn201101.pdf Bureau of Labor Statistics, U. S. Department of Labor (2010b). Women’s Bureau Publications: Women in the Labor Force 2010. Retrieved from: http://www.dol.gov/wb/factsheets/Qf-laborforce-10.htm Cable, D., & DeRue, D. S. (2002). The convergent and discriminant validity of subjective fit perceptions. Journal of Applied Psychology, 87, 875-884. doi: 10.1037/0021- 9010.87.5.875 Cheryan, S., & Plaut, V. C. (2010). Explaining underrepresentation: A theory of precluded interest. Sex Roles, 63, 475-488. doi: 10.1007/s11199-010-9835-x Cheryan, S., Plaut, V. C., Davies, P. G., & Steele, C. M. (2009). Ambient belonging: How stereotypical cues impact gender participation in computer science. Journal of Personality and Social Psychology, 97(6), 1045-1060. doi: 10.1037/a0016239 Cheryan, S., Siy, J. O., Vichayapai, M., Drury, B. J., & Kim, S. (2011). Do female and male role models who embody STEM stereotypes hinder women’s anticipated success in STEM? Social Psychological and Personality Science, 2, 656-664. doi: 10.1177/1948550611405218 Cohen, J. (1988). Statistical power analysis for the behavioral sciences. New York: Tyler & Francis. Eagly, A. H., & Chaiken, S. (1993). The psychology of attitudes. Fort Worth: Harcourt Brace Jovanovich College Publishers. Flores, L. Y., Navarro, R. L., Smith, J. L., & Ploszaj, A. M. (2006). Testing a model of nontraditional career choice goals with Mexican American adolescent men. Journal of Career Assessment, 14, 214-234. doi: 10.1177/1069072705283763 Flores, L. Y., & O'Brien, K. M. (2002). The career development of Mexican American adolescent women: A test of social cognitive career theory. Journal of Counseling Psychology, 49, 14. doi: 10.1037/0022-0167.49.1.14

Hedman & Garriott
NCIT
60
Fritz, M. S., & MacKinnon, D. P. (2007). Required sample size to detect the mediated effect. Psychological Science, 18, 233-239. doi: 10.1111/j.1467-9280.2007.01882.x
Gottfredson, L. S. (1996). A theory of circumscription and compromise. In D. Brown & L. Brooks (Eds.). Career choice and development: Applying contemporary theories to practice (3rd ed., pp. 179-232). San Francisco: Jossey-Bass. Hammer, J. H., & Vogel, D. L. (2013). Assessing the utility of the willingness/prototype model in predicting help-seeking decisions. Journal of Counseling Psychology, 60, 83-97. doi: 10.1037/a0030449 Hannover, B., & Kessels, U. (2004). Self-to-prototype matching as a strategy for making academic choices: Why high school students do not like math and science. Learning and Instruction, 14, 51–67. doi: 10.1016/j.learninstruc.2003.10.002 Hayes, A. F. (2013). Introduction to mediation, moderation, and conditional process analysis: A regression-based approach. New York: Guilford Press. Jaidi, Y., Van Hooft, E. J., and Arends, L. R. (2011). Recruiting highly educated graduates: A study on the relationship between recruitment information sources, the theory of planned behavior, and actual job pursuit. Human Performance, 24, 135-157. doi: 10.1080/08959285.2011.554468 Kline, R. B. (2005). Principles and practice of structural equation modeling (2nd ed.). New York: Guilford Press. Lent, R. W., Paixão, M. P., da Silva, J. T., & Leitão, L. M. (2010). Predicting occupational interests and choice aspirations in Portuguese high school students: A test of social cognitive career theory. Journal of Vocational Behavior, 76, 244-251. doi:10.1016/j.jvb.2009.10.001 Luzzo, D. A., & McWhirter, E. H. (2001). Sex and ethnic differences in the perception of educational and career-related barriers and levels of coping efficacy. Journal of Counseling and Development: JCD, 79, 61-67. doi: 10.1002/j.1556-6676.2001.tb01944.x McWhirter, E. H. (1997). Perceived barriers to education and career: Ethnic and gender differences. Journal of Vocational Behavior, 50, 124-140. doi: 10.1006/jvbe.1995.1536 Oren, L., Caduri, A., & Tziner, A. (2013). Intergenerational occupational transmission: Do offspring walk in the footsteps of mom or dad, or both? Journal of Vocational Behavior, 83, 551-560. doi: 10.1016/j.jvb.2013.08.003 Philbrick, K. E., & Sherry, P. (2004). Perceptions of the intermodal transportation industry related to recruitment and retention of human resources. Retrieved from: http://www.ncit.msstate.edu/PDF/Percep-of-the-Intermodal-Transp-Industry- PHILBRICK-Final-Report.pdf Risco, C. M., & Duffy, R. D. (2011). A career decision-making profile of Latina/o incoming
college students. Journal of Career Development, 38, 237-255. doi: 10.1177/089484531036585
Rommes, E., Overbeek, G., Scholte, R., Engels, R., & De Kemp, R. (2007). ‘I’m not interested in computers’: Gender-based occupational choices of adolescents. Information, Communication and Society, 10, 299–319. doi: 10.1080/13691180701409838 Sipe, S. R., Johnson, C. D., & Fisher, D. K. (2009a). University students’ perceptions of gender discrimination in the workplace: Reality versus fiction. The Journal of Education for Business, 84, 339-349. doi: 10.3200/JOEB.84.6.339-349

Hedman & Garriott
NCIT
61
Sipe, S. R., Johnson, C. D., & Fisher, D. K. (2009b). University students' perceptions of sexual harassment in the workplace: A view through rose-colored lenses. Equal Opportunities International, 28, 336-350. doi: 10.1108/02610150910954791 Super, D. E. (1957). The psychology of careers. New York: Harper. United Nations Population Fund (2008). Promoting Gender Equality. Retrieved from: http://www.unfpa.org/gender/resources_faq.htm#5 United States Department of Transportation (2013). U.S. DOT’s Women and Girls in Transportation Initiative (WITI). Retrieved from: http://www.dot.gov/osdbu/women-and- girls United States Department of Transportation (2012). Research and Innovative Technology Administration: National Transportation Workforce Development. Retrieved from: http://www.rita.dot.gov/ntwd/next/index.html#recruit United States Department of Transportation (2011, September). Dialogue for women in blue- collar transportation careers final report. Washington, DC. Van Hooft, E. A. J., Born, M. Ph., Taris, T. W. and Van der Flier, H. (2006). Ethnic and gender differences in applicants' decision-making processes: An application of the theory of reasoned action. International Journal of Selection and Assessment, 14, 156–166. doi: 10.1111/j.1468-2389.2006.00341.x

Hedman & Garriott
NCIT
62
Appendix A – Inclusiveness Inventory Items Diversity Climate (11 items)
1. The organization promotes a climate of respect among its members. 2. This organization is welcoming to all members of diverse groups. 3. This organization actively recruits a diverse workforce. 4. There are opportunities for me to provide feedback on how inclusiveness and diversity
are handled. 5. This organization is committed to increasing diversity in the workplace. 6. This organization is committed to creating a work environment that values inclusiveness. 7. This organization reflects my vision of a diverse workplace. 8. This organization is able to retain a diverse workforce. 9. My department reviews recruitment and retention data to ensure a diverse workforce. 10. My department provides adequate support for employees from underrepresented
communities to ensure a diverse workforce. 11. I feel that this organization is welcoming to members of all groups.
Fairness (10 items)
1. This organization supports the professional development of all employees. 2. I feel there are no barriers to my being promoted within the organization 3. I have been treated fairly by my supervisor. 4. I have been treated fairly by my fellow employees. 5. I am supported and encouraged to pursue activities related to career advancement. 6. Certain people are treated more favorably than others at this organization. (R) 7. Employees are treated fairly in my work unit. 8. I have been treated fairly by management at this organization. 9. I feel that I have the same opportunities and chances as any other employee. 10. I feel I have equal access to information needed to move up the career ladder.
Belongingness (7 items)
1. Management and supervisors are protective of and generous to loyal workers. 2. I feel like part of the organizational family. 3. I feel like I have a friend I can talk to at work. 4. Once someone is hired, the organization takes care of that person's overall welfare. 5. I feel a sense of belonging at this organization. 6. Employees are taken care of like members of a family. 7. This organization has a great deal of personal meaning for me.
Uniqueness (8 items)
1. I feel comfortable requesting accommodations for my personal needs. (i.e. physical, medical, religious, family, …).

Hedman & Garriott
NCIT
63
2. I am comfortable expressing my ideas at work. 3. At work I feel accepted for who I am. 4. I feel like this organization values me as a person. 5. I feel understood by others in the workplace. 6. People are interested in getting to know me as a person. 7. I feel stereotyped in the workplace. (R) 8. My cultural differences are respected.
Discrimination (11 items)
1. I feel comfortable reporting to my supervisor an act of discrimination towards a member of my unit.
2. I have been the target of offensive drawings or pictures. (R) 3. I have received offensive emails from other employees. (R) 4. I have been the target of offensive language. (R) 5. I have received inappropriate and/or unwelcomed physical contact. (R) 6. I have witnessed a threat against another employee in the workplace. (R) 7. I have witnessed an act of discrimination by one employee toward another. (R) 8. I have witnessed an act of discrimination in the workplace. (R) 9. I have been physically assaulted or injured by a coworker. (R) 10. I have been physically threatened by other employees. (R) 11. I have received threats of physical violence from a co-worker. (R)

Hedman & Garriott
NCIT
64
Appendix B – Descriptive Statistics and Correlations
Table 1 Descriptive Statistics and Correlations Among Observed Variables
Variable
Score Range
1
2
3
4
5
1. Anticipated Sexism 1-5 ___ -.07 -.04 .02 -.04 2. Evaluative Attitudes 1-7 ___ .58 .38 .64 3. Intentions -1.33-2.34 ___ .63 .41 4. Perceived Dissimilarity 0-7 ___ .42 5. Social Norms 1-7 ___ M 2.14 4.22 0.00 4.04 2.76 SD 0.99 1.55 0.87 2.44 1.42
Note. N = 263. All correlations of .38 and above are significant at the p < .001 level.

Hedman & Garriott
NCIT
65
Appendix C – Figure of Mediation Relationship
Figure 1. Mediating effect of social norms gender and career intentions.
Figure 1. Mediating effect of social norms on the relationship between gender and transportation
career intentions. Values represent unstandardized coefficients. Value in parentheses is the
unstandardized indirect effect from gender to intentions through social norms.
-.38, p = .03 .18, p < .001
-.29 (-.06), p < .001