NATIONAL CENTER FOR EDUCATION STATISTICSnces.ed.gov/pubs2002/2002012.pdf · The National Center for...
26
NATIONAL CENTER FOR EDUCATION STATISTICS U.S. Department of Education ■ Office of Educational Research and Improvement ■ NCES 2002–012
Transcript of NATIONAL CENTER FOR EDUCATION STATISTICSnces.ed.gov/pubs2002/2002012.pdf · The National Center for...

NATIONAL CENTER FOR EDUCATION STATISTICSU.S. Department of Education ■ Office of Educational Research and Improvement ■ NCES 2002–012

NATIONAL CENTER FOR EDUCATION STATISTICSU.S. Department of Education ■ Office of Educational Research and Improvement ■ NCES 2002–013
Susan Choy
MPR Associates, Inc.
NontraditionalUndergraduates
NATIONAL CENTER FOR EDUCATION STATISTICSU.S. Department of Education ■ Office of Educational Research and Improvement ■ NCES 2002–012

U.S. Department of EducationRod PaigeSecretary
Office of Educational Research and ImprovementGrover J. WhitehurstAssistant Secretary
National Center for Education StatisticsGary W. PhillipsDeputy Commissioner
The National Center for Education Statistics (NCES) is the primary federal entity for collect-ing, analyzing, and reporting data related to education in the United States and other nations.It fulfills a congressional mandate to collect, collate, analyze, and report full and completestatistics on the condition of education in the United States; conduct and publish reports andspecialized analyses of the meaning and significance of such statistics; assist state and localeducation agencies in improving their statistical systems; and review and report on educationactivities in other countries.
NCES activities are designed to address high priority education data needs; provide consistent,reliable, complete, and accurate indicators of education status and trends; and report timely,useful, and high quality data to the U.S. Department of Education, the Congress, the states,other education policymakers, practitioners, data users, and the general public.
We strive to make our products available in a variety of formats and in language that isappropriate to a variety of audiences. You, as our customer, are the best judge of our success incommunicating information effectively. If you have any comments or suggestions about this orany other U.S. Department of Education, National Center for Education Statistics product orreport, we would like to hear from you. Please direct your comments to:
National Center for Education StatisticsOffice of Educational Research and ImprovementU.S. Department of Education1990 K Street, NWWashington, DC 20006–5651
August 2002
The NCES World Wide Web Home Page is: http://nces.ed.govThe NCES World Wide Web Electronic Catalog is: http://nces.ed.gov/pubsearch/index.asp
Suggested Citation:
U.S. Department of Education, National Center for Education Statistics, Nontraditional Un-dergraduates, NCES 2002–012, by Susan Choy. Washington, DC: 2002.
For ordering information on this report, write:
U.S. Department of EducationED PubsP.O. Box 1398Jessup, MD 20794–1398
or call toll free 1–877–4ED–PUBS
Content Contact: John Wirt(202) 502–7478

Preface
The Condition of Education summarizes important developments and trends ineducation using the latest available data. The report, which is required by law,is an indicator report intended for a general audience of readers who are inter-ested in education. The indicators represent a consensus of professional judg-ment on the most significant national measures of the condition and progress ofeducation for which accurate data are available. The 2002 print edition in-cludes 44 indicators in six main areas: (1) enrollment trends and studentcharacteristics at all levels of the education system from early childhoodeducation to graduate and first-professional programs; (2) student achieve-ment and the longer-term, enduring effects of education; (3) student effortand rates of progress through the educational system among different popu-lation groups; (4) the contexts of elementary and secondary education interms of courses taken, teacher characteristics, and other factors; (5) thecontexts of postsecondary education; and (6) societal support for learning,parental and community support for learning, and public and private finan-cial support of education at all levels.
The 2002 edition also includes a special analysis that describes nontradi-tional undergraduates in terms of their demographic characteristics, enroll-ment patterns, ways of combining school and work, participation in distanceeducation, and persistence patterns. To make the special analysis availableto audiences interested in the enrollment of nontraditional students inpostsecondary education, the special analysis is reprinted here as a separatevolume.
Nontraditional Undergraduates | Page iii

THIS PAGE INTENTIONALLY LEFT BLANK

Today’s undergraduate population is different than it was a generation ago.In addition to being 72 percent larger in 1999 than in 1970 (with fall enroll-ment growing from 7.4 to 12.7 million), proportionately more students areenrolled part time (39 versus 28 percent) and at 2-year colleges (44 versus 31percent), and women have replaced men as the majority (representing 56percent of the total instead of 42 percent) (indicator 5, U.S. Department ofEducation 2002a). There are proportionately more older students on campusas well: 39 percent of all postsecondary students were 25 years or older in1999, compared with 28 percent in 1970 (U.S. Department of Education2002b).
The “traditional” undergraduate—characterized here as one who earns ahigh school diploma, enrolls full time immediately after finishing high school,depends on parents for financial support, and either does not work duringthe school year or works part time—is the exception rather than the rule. In1999–2000, just 27 percent of undergraduates met all of these criteria.1 Thus,73 percent of all undergraduates were in some way “nontraditional.”2 Com-parable data for a generation ago are not available, but the fact that muchof the change in demographic characteristics and enrollment patterns de-scribed above occurred in the 1970s (U.S. Department of Education 2002b)suggests that this is not a recent phenomenon.
While traditional undergraduates are generally able to direct most of theirenergy toward their studies, older students, parents (especially single par-ents), and students who work full time have family and work responsibilitiescompeting with school for their time, energy, and financial resources. Diffi-
Nontraditional Undergraduates
Nontraditional Undergraduates | Page 1

culties in obtaining child care and class schedules that do not mesh withwork schedules are just two of the barriers that nontraditional students mayencounter. In addition, some of the older students who did not pursue apostsecondary education when they were younger may have made this deci-sion because they were not prepared academically. Consequently, they maystruggle when they enroll later. Nontraditional students who enterpostsecondary education seeking a degree are, in fact, less likely than tradi-tional students to attain a degree or remain enrolled after 5 years (Horn1996). To design effective programs and services to help nontraditional stu-dents reach their degree goals, policymakers and postsecondary administra-tors need information on how many students are affected, the details of theirenrollment patterns, and the nature of their persistence problems.
The first part of this discussion of nontraditional students uses the NationalPostsecondary Student Aid Study (NPSAS:2000) to describe their demographiccharacteristics, enrollment patterns, how they combine school and work,and their participation in distance education. The second part examines therelationship between nontraditional status and persistence using the Begin-ning Postsecondary Students Longitudinal Studies (BPS), which followedcohorts of students enrolling in postsecondary education for the first time in1989–90 and in 1995–96. Unless a specific type of institution is specified, thedata refer to students at all types of postsecondary institutions (less-than-2-year, 2-year, and 4-year).
Definition of Nontraditional Status
The term “nontraditional student” is not a precise one, although age andpart-time status (which often go together) are common defining characteris-tics (Bean and Metzner 1985). An NCES study examining the relationshipbetween nontraditional status and persistence in postsecondary educationidentified nontraditional students using information on their enrollment pat-terns, financial dependency status, family situation, and high school gradu-ation status (Horn 1996). Specifically, in this study, a nontraditional studentis one who has any of the following characteristics:
• Delays enrollment (does not enter postsecondary educa-tion in the same calendar year that he or she finished highschool);
Page 2 | Nontraditional Undergraduates

• Attends part time for at least part of the academic year;
• Works full time (35 hours or more per week) whileenrolled;
• Is considered financially independent for purposes ofdetermining eligibility for financial aid;3
• Has dependents other than a spouse (usually children, butsometimes others);
• Is a single parent (either not married or married butseparated and has dependents); or
• Does not have a high school diploma (completed highschool with a GED or other high school completioncertificate or did not finish high school).
Horn (1996) defined “nontraditional” on a continuum based on the numberof these characteristics present. Students are considered to be “minimallynontraditional” if they have only one nontraditional characteristic, “moder-ately nontraditional” if they have two or three, and “highly nontraditional”if they have four or more.
! Almost three-quarters of undergraduates are in some way“nontraditional.”
As indicated earlier, 73 percent of all undergraduates in 1999–2000 had oneor more of these characteristics. Figure 1 shows the percentage of under-graduates with each nontraditional characteristic. In 1999–2000, financialindependence was the most common nontraditional characteristic (51 per-cent), followed by part-time attendance (48 percent), and then delayed en-rollment (46 percent).
! In the undergraduate population, there are about asmany highly nontraditional students as there aretraditional students.
In 1999–2000, 27 percent of all undergraduates were traditional, and 28percent were highly nontraditional (table 1). Another 28 percent were mod-erately nontraditional and 17 percent were minimally nontraditional. The
Nontraditional Undergraduates | Page 3

character of the undergraduate population varied markedly by type of insti-tution. Public 2-year and private for-profit institutions have much largerproportions of moderately and highly nontraditional students than 4-yearinstitutions, and much smaller proportions of traditional students. At bothpublic 2-year and private for-profit institutions, 89 percent of the studentswere at least minimally nontraditional, compared with 58 percent at public4-year institutions and 50 percent at private not-for-profit 4-year institutions.
Figure 1.—Percentage of undergraduates with nontraditional characteristics: 1992–93 and 1999–2000
SOURCE: U.S. Department of Education, NCES. National Postsecondary Student Aid Study (NPSAS:2000).
0 20 40 60 80 100
1992–93
1999–2000
Percent
7673
5251
5448
4346
3439
2227
813
67
Any nontraditionalcharacteristic
Financiallyindependent
Attended part time
Delayed enrollment
Worked full time
Had dependents
Single parent
No high schooldiploma
Table 1.—Percentage distribution of undergraduates according to their student status, by typeof institution: 1999–2000
NOTE: Total row includes students at types of institutions not shown here. Percentages may not add to 100.0 due to rounding.
SOURCE: U.S. Department of Education, NCES. National Postsecondary Student Aid Study (NPSAS:2000).
Minimally Moderately HighlyType of institution Traditional nontraditional nontraditional nontraditional
Total 27.4 16.6 28.3 27.7
Public 2-year 10.5 14.3 35.0 40.2
Public 4-year 42.5 20.0 23.1 14.4
Private not-for-profit 4-year 50.0 14.7 16.4 19.0
Private for-profit 11.3 14.7 38.5 35.4
Page 4 | Nontraditional Undergraduates

! The percentages of students with some nontraditionalcharacteristics have changed in recent years.
Between 1992–93 and 1999–2000, the percentages of students who delayedenrollment, worked full time, had dependents, and were single parents allincreased (figure 1). The percentage of undergraduates attending part timedecreased, a trend that is projected to continue.4 There were no measurablechanges between the 2 years in the percentages who were financially inde-pendent or did not have a high school diploma.
Interrelationships Among Nontraditional Characteristics
Table 2 shows the percentages of all undergraduates with each nontradi-tional characteristic by type of institution and how the characteristics identi-fied as nontraditional are interrelated. Some of the characteristics occurtogether by definition; for example, a single parent always has dependentsand, at least for purposes of assessing eligibility for financial aid, is alwaysconsidered to be financially independent. Therefore, a single parent willalways have at least three nontraditional characteristics. Other nontradi-tional characteristics, such as full-time employment and part-time enroll-ment, occur together frequently, but not always: among students who workedfull time, 73 percent attended part time.
Among students who were minimally nontraditional (had only one nontradi-tional characteristic), part-time attendance was the most common reason forbeing in this category (36 percent). Delayed enrollment (23 percent) andworking full time (23 percent) were next. Most of the minimally nontradi-tional students were 24 years or younger (otherwise they would be finan-cially independent, a characteristic of only 15 percent of minimallynontraditional students).
Among moderately nontraditional students (two or three nontraditional char-acteristics), 68 percent were financially independent, 64 percent attendedpart time, 52 percent worked full time, and 42 percent delayed enrollment.Relatively fewer had dependents (19 percent).
A large majority of highly nontraditional students (80 percent) had depen-dents. In addition, three-quarters or more were financially independent (asthey would be automatically if they had dependents), attended part time,worked full time, and had delayed enrollment in postsecondary education.
Nontraditional Undergraduates | Page 5

Enrollment Patterns
! Nontraditional students are particularly likely to choose2-year institutions.
Among traditional students, 52 percent enrolled in a public 4-year institu-tion, and another 27 percent enrolled in a private not-for-profit 4-year insti-tution (table 3). Relatively few (17 percent) chose a public 2-year institution.The enrollment pattern of nontraditional students is different. Students whowere even minimally nontraditional were much more likely than traditional
Table 2.—Percentage of all undergraduates with each nontraditional characteristic, by type of in-stitution, and percentage of nontraditional undergraduates with each nontraditional characteris-tic, by nontraditional characteristic and status: 1999–2000
*Student did not finish high school or completed with a GED or certificate of completion.
NOTE: Total row and nontraditional characteristic and status rows include students at types of institutions not shown here. Students mayappear in more than one column. Percentages in the “minimally nontraditional” row (only one nontraditional characteristic) do not addto 100.0 due to rounding.
SOURCE: U.S. Department of Education, NCES. National Postsecondary Student Aid Study (NPSAS:2000).
Type of institution, non- Delayed Had No high
traditional characteristic, Financially Attended enroll- Worked depen- Single schooland nontraditional status independent part time ment full time dents parent diploma*
All undergraduates
Total 50.9 47.9 45.5 39.3 26.9 13.3 6.5
Type of institution
Public 2-year 63.7 69.5 58.7 53.8 34.5 16.4 9.8
Public 4-year 37.6 33.3 31.5 25.5 17.6 9.2 2.4
Private not-for-profit 4-year 36.7 27.6 34.0 28.5 18.8 8.6 3.2
Private for-profit 72.9 21.5 67.8 40.8 44.3 26.6 15.6
Nontraditional undergraduates
Nontraditional characteristic
Any nontraditional characteristic 67.8 63.8 60.9 54.0 35.8 17.7 8.7
Financially independent 100 66.2 66.4 57.3 52.8 26.1 10.1
Attended part time 70.3 100 58.8 62.0 36.2 15.7 8.0
Delayed enrollment 74.1 61.7 100 52.0 39.7 19.6 9.2
Worked full time 72.0 73.3 48.4 100 40.7 16.6 7.1
Had dependents 100 64.5 67.6 58.2 100 49.4 11.6
Single parent 100 56.6 68.0 55.4 100 100 14.1
No high school diploma 78.7 58.6 76.1 46.2 47.6 28.7 100
Nontraditional status
Minimally nontraditional 15.2 36.2 22.8 22.8 0 0 2.2
Moderately nontraditional 68.0 63.8 42.2 51.5 18.7 3.8 5.2
Highly nontraditional 99.4 80.4 76.3 75.0 79.6 38.6 15.1
Page 6 | Nontraditional Undergraduates

students to attend a 2-year institution (39 percent), and the more nontradi-tional they were, the more likely they were to do so. Among highly nontra-ditional students, 64 percent attended a public 2-year institution.
Combining School and Work
! Two-thirds of highly nontraditional students considerthemselves primarily employees.
Among traditional students, 30 percent did not work while enrolled, andanother 67 percent worked but still considered themselves to be primarilystudents (figure 2). The remaining 3 percent considered themselves prima-rily employees who enrolled in school. In sharp contrast, 67 percent of highlynontraditional students and 37 percent of moderately nontraditional stu-dents considered themselves primarily employees. Even minimally nontra-ditional students were more likely than traditional students to considerthemselves primarily employees (10 versus 3 percent).
! Working while enrolled has both benefits andlimitations.
Working while enrolled can have benefits. Among employed undergraduateswho considered themselves primarily students, 26 percent thought that workinghelped them with their coursework, and 55 percent thought it helped preparethem for a career (table 4). There were generally no measurable differences
Table 3.—Percentage distribution of undergraduates according to the type of institution attended,by student status: 1999–2000
NOTE: Percentages may not add to 100.0 due to rounding.
SOURCE: U.S. Department of Education, NCES. National Postsecondary Student Aid Study (NPSAS:2000).
Private not- Private not-Public less- Public Public for-profit less- for-profit Private
Student status than-2-year 2-year 4-year than-4-year 4-year for-profit
Total 0.7 44.9 33.4 0.8 14.9 5.2
Traditional 0.2 17.3 52.1 1.0 27.3 2.2
Minimally nontraditional 0.5 39.3 41.0 0.9 13.5 4.7
Moderately nontraditional 0.9 55.5 27.2 0.6 8.6 7.1
Highly nontraditional 1.2 64.2 17.2 0.8 10.1 6.6
Nontraditional Undergraduates | Page 7

between traditional and nontraditional students, with the exception that highlynontraditional students were slightly more likely than traditional or mini-mally nontraditional students to find that working helped them with theircoursework.
Figure 2.—Percentage distribution of undergraduates according to their primary role, by studentstatus: 1999–2000
SOURCE: U.S. Department of Education, NCES. National Postsecondary Student Aid Study (NPSAS:2000).
0 20 40 60 80 100
Student who works Student who does not work Employee
Percent
Highly nontraditional
Moderately nontraditional
Minimally nontraditional
Traditional
All undergraduates 48 20 32
67 30 3
71 19 10
43 20 37
22 11 67
Table 4.—Percentage of undergraduates working while enrolled but considering themselves pri-marily students who reported various effects of working, by student status: 1999–2000
SOURCE: U.S. Department of Education, NCES. National Postsecondary Student Aid Study (NPSAS:2000).
HadCareer negative
prep- Class Number Class Access to effect onStudent status Coursework aration schedule of classes choices library grades
Total 25.7 54.8 46.1 38.6 32.9 30.1 34.6
Traditional 24.7 53.9 29.0 19.6 19.0 18.3 24.7
Minimally nontraditional 24.4 56.3 47.4 37.6 31.8 29.8 34.8
Moderately nontraditional 26.4 54.8 57.9 54.2 45.0 38.2 43.4
Highly nontraditional 29.7 54.1 72.0 67.5 53.5 50.4 47.1
Helped with Limited
Page 8 | Nontraditional Undergraduates
Working can interfere with school as well as provide benefits. Undergradu-ates who worked but considered themselves primarily students sometimesfound that working limited their class schedule (46 percent), the number ofclasses they could take (39 percent), their choice of classes (33 percent), ortheir access to the library (30 percent). Nontraditional students who workedwere more likely than their traditional counterparts to report each of theselimitations, and in each case, the more nontraditional they were, the morelikely they were to report these problems. Among highly nontraditional stu-dents, the proportions reporting these limitations ranged from about one-half to almost three-quarters.
Students sometimes report that working has a negative effect on their grades.Highly and moderately nontraditional students (47 and 43 percent, respec-tively) were more likely than minimally nontraditional students (35 percent)to report this effect, and traditional students (25 percent) were the least likelyto do so.
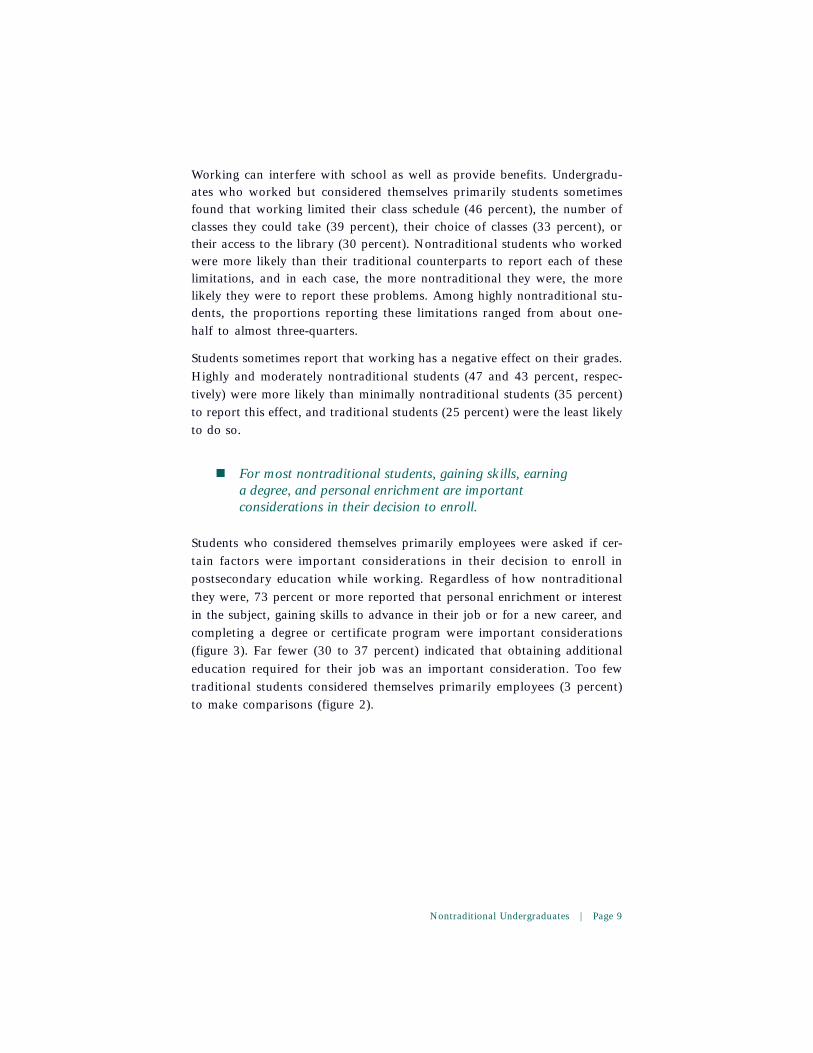
! For most nontraditional students, gaining skills, earninga degree, and personal enrichment are importantconsiderations in their decision to enroll.
Students who considered themselves primarily employees were asked if cer-tain factors were important considerations in their decision to enroll inpostsecondary education while working. Regardless of how nontraditionalthey were, 73 percent or more reported that personal enrichment or interestin the subject, gaining skills to advance in their job or for a new career, andcompleting a degree or certificate program were important considerations(figure 3). Far fewer (30 to 37 percent) indicated that obtaining additionaleducation required for their job was an important consideration. Too fewtraditional students considered themselves primarily employees (3 percent)to make comparisons (figure 2).
Nontraditional Undergraduates | Page 9

Distance Education
Participating in distance education may allow nontraditional students toovercome some of the difficulties they encounter in coordinating their workand school schedules or in obtaining the classes they want.
! Moderately and highly nontraditional students are morelikely than other students to participate in distanceeducation.
In 1999–2000, 8 percent of all undergraduates participated in distance educa-tion at the institution in which they were enrolled or at both the institution atwhich they were enrolled and somewhere else (table 5 and indicator 38, U.S.Department of Education 2002a). Among those who participated, 29 percentwere enrolled in programs available entirely through distance education. Mod-erately or highly nontraditional students were more likely than either tradi-tional students or minimally nontraditional students both to participate in distanceeducation and to be in programs available entirely through distance education.
Figure 3.—Among nontraditional undergraduates who considered themselves primarily employ-ees, percentage who reported each factor to be an important consideration in their decision to enroll,by factor and nontraditional status: 1999–2000
SOURCE: U.S. Department of Education, NCES. National Postsecondary Student Aid Study (NPSAS:2000).
Percent
0
20
31 30
37
73
79
87
79 76 8278
8689
40
60
80
100
Highly nontraditionalModerately nontraditionalMinimally nontraditional
Personal enrichment or interest
Earn degree or certificate
Gain skills
Considerations in enrolling
Required for job
Page 10 | Nontraditional Undergraduates

Among all students who participated in distance education, 60 percent par-ticipated via the Internet, 39 percent through prerecorded television or au-dio, and 37 percent through live television or audio. There were no statisticallysignificant differences between traditional and nontraditional students in themode they used to participate.
Persistence After 3 Years
The seven characteristics associated with nontraditional status—financialindependence, part-time attendance, delayed enrollment, full-time work,dependents, single parenthood, and lack of a high school diploma—havesometimes been called “risk factors” because they are related negatively topersistence (staying in school or earning a degree) (Horn 1996; Horn andPremo 1995). This section uses longitudinal data to examine the relationshipbetween nontraditional characteristics and persistence and attainment after3 years for students who enrolled in postsecondary education for the firsttime in 1995–96.5
Persistence is best studied in relation to students’ goals. Some students enrollfor a limited number of courses without intending to earn a degree or certifi-cate. Without knowing the students’ specific goals, it is impossible to knowwhether they were achieved. Therefore, only students with a degree or trans-fer goal are included in this discussion of persistence. However, 88 percentof the 1995–96 beginning postsecondary students were in this category
Table 5.—Percentage of undergraduates who participated in distance education and among thosewho did, percentage whose entire program was available through distance education and percent-age using each mode of participation, by student status: 1999–2000
SOURCE: U.S. Department of Education, NCES. National Postsecondary Student Aid Study (NPSAS:2000).
Entire programwas taught Participated
Participated through Participated via pre- Participatedin distance distance via live TV recorded TV via
Student status education education or audio or audio Internet
Total 7.6 29.0 37.3 39.3 60.1
Traditional 5.3 20.6 39.5 35.4 60.4
Minimally nontraditional 6.2 22.1 38.5 36.8 57.8
Moderately or
highly nontraditional 9.3 32.8 36.4 40.9 60.5
Among those who participated
Nontraditional Undergraduates | Page 11

(BPS:1996/1998). Students’ nontraditional status here refers to their statuswhen they first enrolled and does not take into account any subsequent changessuch as having children or shifting enrollment or employment status.
One would expect nontraditional students to take longer than traditionalstudents to complete their programs because enrolling part time is one of themost common nontraditional characteristics (table 2). Consequently, com-paring their degree attainment rates after only 3 years is not particularlyuseful. In contrast, comparing the percentages of traditional and nontradi-tional degree seekers who left postsecondary education without a degree andhad not returned (at least within 3 years) is both appropriate and useful.
! Nontraditional students are much more likely thantraditional students to leave postsecondary educationwithout a degree.
Among students seeking a bachelor’s degree, 50 percent of highly nontradi-tional students were no longer enrolled (for any degree) 3 years later, com-pared with 12 percent of traditional students (figure 4). Similarly, among
Figure 4.—Percentage of 1995–96 beginning postsecondary degree seekers who had not attainedany degree and were not enrolled in 1998, by initial degree objective and student status
SOURCE: Berkner, Horn, and Clune (2000), tables 5.1d, 5.2d, and 5.3d. Data from U.S. Department of Education, NCES. BeginningPostsecondary Students Longitudinal Study, “First Follow-up” (BPS:1996/1998).
Percent
0
20
26
3634
40
19
34
52
62
12
23
42
50
40
60
80
100
Bachelor’s degreeAssociate’s degreeCertificate
Degree objective when first enrolled
Moderately nontraditional Highly nontraditionalMinimally nontraditionalTraditional
Page 12 | Nontraditional Undergraduates

those seeking an associate’s degree, 62 percent of highly nontraditional stu-dents left without any degree, compared with 19 percent of traditional stu-dents. Even minimally nontraditional students seeking a bachelor’s orassociate’s degree were more likely than their traditional counterparts toleave. Apparent differences at the certificate level were not statistically sig-nificant.
In addition to being more likely than traditional students to leavepostsecondary education without any degree, nontraditional students whohad initially planned to earn a bachelor’s degree (including those who startedat a less-than-4-year institution) were less likely than their traditional coun-terparts to be still enrolled at a 4-year institution 3 years later (table 6).While 76 percent of traditional students were still enrolled in 4-year institu-tions, the percentage dropped to 51 percent for minimally nontraditionalstudents and even lower percentages for moderately and highly nontradi-tional students (28 and 26 percent, respectively).
Table 6.—Percentage distribution of 1995–96 beginning postsecondary students with a bachelor’sdegree objective when they first enrolled according to their status in 1998, by student status
#Estimate less than 0.05.
NOTE: Percentages may not add to 100.0 due to rounding.
SOURCE: Berkner, Horn, and Clune (2000), table 5.3d. Data from U.S. Department of Education, NCES. Beginning Postsecondary StudentsLongitudinal Study, “First Follow-up” (BPS:1996/1998).
Enrolledat a less- Enrolled
than-4-year at a 4-year NotStudent status Certificate Associate’s Bachelor’s institution institution enrolled
Total 1.5 2.7 0.7 12.5 63.2 19.4
Traditional 0.8 2.1 0.6 8.2 76.4 12.0
Minimally nontraditional 1.9 3.6 1.8 19.6 50.5 22.6
Moderately nontraditional 3.6 3.6 0.5 21.8 28.3 42.1
Highly nontraditional 4.8 3.9 (#) 15.4 25.6 50.4
No degreeHighest degree attained
Persistence and Attainment After 5 Years
While a 3-year follow-up is useful for examining persistence, a longer inter-val is needed to assess attainment. For this purpose, 1989–90 beginningpostsecondary students were studied using the 1994 follow-up, which oc-curred approximately 5 years after they had first enrolled.
Nontraditional Undergraduates | Page 13
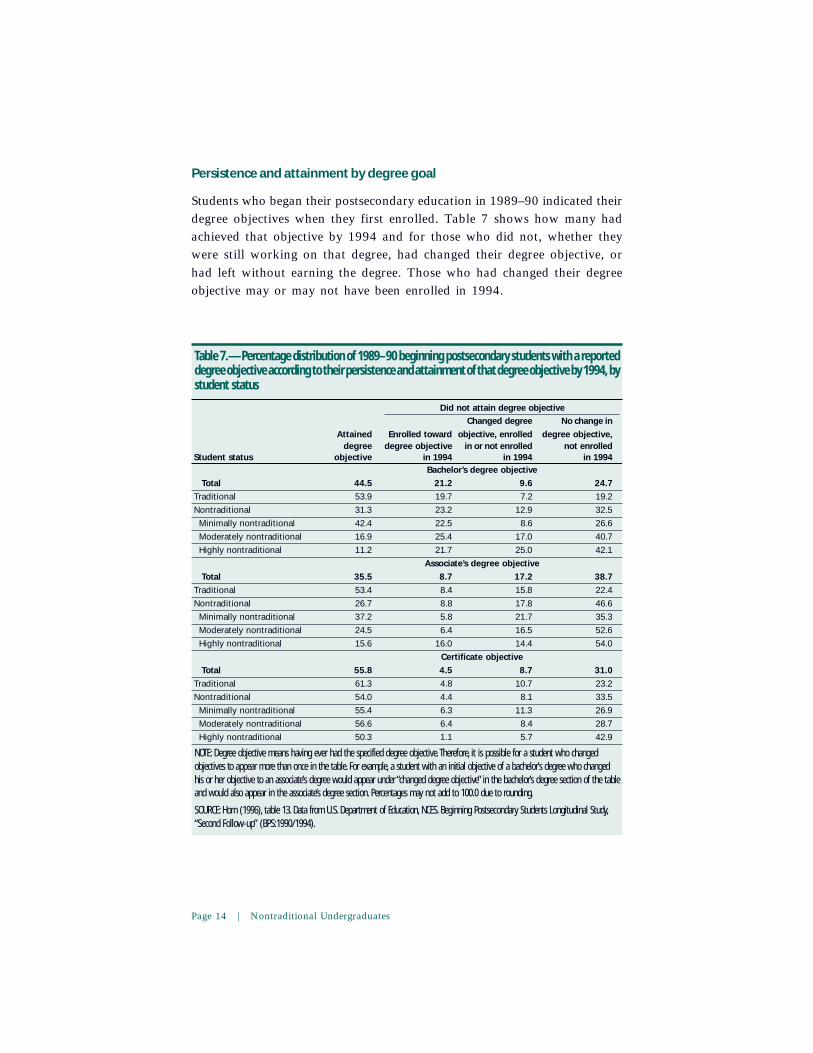
Persistence and attainment by degree goal
Students who began their postsecondary education in 1989–90 indicated theirdegree objectives when they first enrolled. Table 7 shows how many hadachieved that objective by 1994 and for those who did not, whether theywere still working on that degree, had changed their degree objective, orhad left without earning the degree. Those who had changed their degreeobjective may or may not have been enrolled in 1994.
Table 7.—Percentage distribution of 1989–90 beginning postsecondary students with a reporteddegree objective according to their persistence and attainment of that degree objective by 1994, bystudent status
NOTE: Degree objective means having ever had the specified degree objective. Therefore, it is possible for a student who changedobjectives to appear more than once in the table. For example, a student with an initial objective of a bachelor’s degree who changedhis or her objective to an associate’s degree would appear under “changed degree objective” in the bachelor’s degree section of the tableand would also appear in the associate’s degree section. Percentages may not add to 100.0 due to rounding.
SOURCE: Horn (1996), table 13. Data from U.S. Department of Education, NCES. Beginning Postsecondary Students Longitudinal Study,“Second Follow-up” (BPS:1990/1994).
Changed degree No change in
Attained Enrolled toward objective, enrolled degree objective,degree degree objective in or not enrolled not enrolled
Student status objective in 1994 in 1994 in 1994
Bachelor’s degree objective
Total 44.5 21.2 9.6 24.7
Traditional 53.9 19.7 7.2 19.2
Nontraditional 31.3 23.2 12.9 32.5
Minimally nontraditional 42.4 22.5 8.6 26.6
Moderately nontraditional 16.9 25.4 17.0 40.7
Highly nontraditional 11.2 21.7 25.0 42.1
Associate’s degree objective
Total 35.5 8.7 17.2 38.7
Traditional 53.4 8.4 15.8 22.4
Nontraditional 26.7 8.8 17.8 46.6
Minimally nontraditional 37.2 5.8 21.7 35.3
Moderately nontraditional 24.5 6.4 16.5 52.6
Highly nontraditional 15.6 16.0 14.4 54.0
Certificate objective
Total 55.8 4.5 8.7 31.0
Traditional 61.3 4.8 10.7 23.2
Nontraditional 54.0 4.4 8.1 33.5
Minimally nontraditional 55.4 6.3 11.3 26.9
Moderately nontraditional 56.6 6.4 8.4 28.7
Highly nontraditional 50.3 1.1 5.7 42.9
Did not attain degree objective
Page 14 | Nontraditional Undergraduates

! Compared with their traditional counterparts, nontradi-tional students seeking bachelor’s and associate’s degreesare less likely to attain their degree goal within 5 yearsand more likely to leave postsecondary education.
Among nontraditional students whose goal was to obtain a bachelor’s de-gree at any time, 31 percent had earned one by 1994, compared with 54percent of traditional students. The attainment rate for highly nontraditionalstudents was 11 percent. Because many nontraditional students enroll parttime, one would expect them to take longer than traditional students to com-plete a bachelor’s degree. If time-to-degree were the only issue, one wouldexpect to find more nontraditional than traditional students still enrolled,but there was no statistically significant difference in the percentages stillenrolled after 5 years (23 and 20 percent, respectively). Compared with tra-ditional students, nontraditional students were more likely to change theirdegree objective (13 versus 7 percent) or leave without a degree (33 versus19 percent).
Similarly, nontraditional students seeking an associate’s degree were lesslikely than their traditional peers to earn the degree (27 versus 53 percent)and more likely to leave without the degree (47 versus 22 percent). Amongnontraditional students, those seeking an associate’s degree were more likelythan those seeking a bachelor’s degree to leave without a degree (47 versus33 percent). The same was not true for traditional students, who left atapproximately the same rate regardless of their degree objective. (The differ-ence between 19 and 22 percent was not statistically significant.)
For certificate seekers, differences in persistence and attainment rates werenot statistically significant except for those of highly nontraditional students.These students were more likely to leave without a certificate (43 percent)than were other nontraditional students (27 to 29 percent) or traditionalstudents (23 percent).
Timing and type of departure
For postsecondary administrators designing programs to help keep nontradi-tional students in school, it is important to understand when students mostfrequently leave postsecondary education. Figure 5 shows the annual attri-tion rates of students who began their postsecondary education in 1989–90—that is, the percentage who left without returning, transferred downward,or stopped out for more than 4 months.
Nontraditional Undergraduates | Page 15

NOTE: Represents the percentage of students who interrupted their enrollment each year based on the number still enrolled at thebeginning of that year. An “interruption” means leaving without returning, transferring downward, or stopping out for more than 4 monthsand then returning to the same or higher level of institution.
SOURCE: Horn (1996), table 14. Data from U.S. Department of Education, NCES. Beginning Postsecondary Students Longitudinal Study,“Second Follow-up” (BPS:1990/1994).
0
10
20
30
40
50
Percent
0
10
20
30
40
50
Percent
0
10
20
30
40
50
Percent
Bachelor’s degree objective
NontraditionalTraditional
Fourth year or laterThird yearSecond yearFirst year
Third yearSecond yearFirst year
Third yearSecond yearFirst year
Associate’s degree objective
Certificate objective
Figure 5.—Annual attrition rates of 1989–90 beginning postsecondary students, by initial degreeobjective: 1994
Page 16 | Nontraditional Undergraduates

! Nontraditional students are most at risk for leavingduring their first year, regardless of their degree objective.
Among nontraditional students seeking bachelor’s degrees, 27 percent inter-rupted their enrollment in their first year, compared with 14 percent of tradi-tional students (figure 5). The annual attrition rate was lower in subsequentyears but remained higher than the rate for traditional students until thefourth year. Among those seeking an associate’s degree, 46 percent of non-traditional students left in their first year, compared with 23 percent of tradi-tional students. The gap closed somewhat in the second year, but not afterthat. Among certificate seekers, nontraditional students were more likelythan traditional students to leave in their first year (43 versus 23 percent).There was no difference thereafter, but many certificate programs do notrequire more than a year to complete.
! Nontraditional students who leave are as likely as theirtraditional peers to take a break in their enrollment.
Although one might expect students with family and work responsibilities tobe more likely than their traditional peers to take breaks in their enrollment,that was not the case. Among nontraditional and traditional students wholeft their first institution, the percentages who left but returned later weresimilar (26 and 28 percent, respectively) (figure 6). The rest of the leaverswere different, however. Traditional students who left their first institutionwere more likely than their nontraditional peers (40 versus 27 percent) totransfer downward (in part because more started at 4-year institutions). Incontrast, nontraditional leavers were more likely than traditional ones toleave without returning (47 versus 32 percent).
Influence of individual nontraditional characteristics on persistence andattainment
! With the exception of single parenthood, each of thenontraditional characteristics has a direct or indirectassociation with persistence and attainment.
Horn (1996) investigated the relationships between the various nontradi-tional characteristics and persistence and attainment, taking into account
Nontraditional Undergraduates | Page 17

the effect of other variables also likely to affect persistence, including sex,race/ethnicity, socioeconomic status, and the control and level of institution.This analysis showed that, controlling for the covariation of these otherfactors, the following nontraditional characteristics remained negatively as-sociated with persistence: delaying enrollment, enrolling part time, beingfinancially independent, and having a GED or other certificate of comple-tion.
The remaining three nontraditional characteristics—working full time in thefirst year of enrollment, having dependents, and being a single parent—didnot have an independent association with persistence. Further analysis dem-onstrated, however, that working full time and having dependents predictedpart-time and delayed enrollment and therefore indirectly affected persis-tence. Only single parenthood did not have a measurable independent director indirect effect.
Figure 6.—Percentage distribution of beginning postsecondary degree seekers who left their firstinstitution according to the type of leaving, by student status: 1994
1From a 4-year to 2-year institution, for example (with or without taking time off ).2Left school for a period of 4 or more months and then returned to the same level of institution.
SOURCE: Horn (1996), table 15. Data from U.S. Department of Education, NCES. Beginning Postsecondary Students Longitudinal Study,“Second Follow-up” (BPS:1990/1994).
0 20 40 60 80 100
Downward transfer1 Stopout2 Left without return
Percent
Traditional 28 32
Nontraditional 26 47 27
40
Page 18 | Nontraditional Undergraduates

Conclusion
The “traditional” student is not typical. Fully three-quarters of allpostsecondary students in 1999–2000 had at least one nontraditional char-acteristic. The most highly nontraditional students (those with four or morenontraditional characteristics) were concentrated in public 2-year institu-tions, with two-thirds enrolled in this type of institution.
Two-thirds of highly nontraditional students perceived their primary role tobe that of an employee, suggesting that school did not have first claim ontheir time and energy. Among highly nontraditional students who consid-ered themselves primarily students, many found that work limited their classand scheduling options.
Among beginning postsecondary students seeking bachelor’s and associate’sdegrees, nontraditional students were much more likely than traditional stu-dents to leave without earning any degree. They were most at risk of drop-ping out in their first year. Compared with their traditional counterparts,nontraditional beginning students who left their first institution were morelikely to leave postsecondary education altogether and less likely to transferdownward. The percentages who interrupted their enrollment were similarfor the two groups.
Notes
1This includes undergraduates at all types of postsecondary institutions (less-than-2-year, 2-year, and 4-year).
2U.S. Department of Education, NCES. National Postsecondary Student Aid Study (NPSAS:2000).
3Undergraduates are normally considered financially dependent unless they are 24 years or older, married, a veteran, have dependents oftheir own other than a spouse, or are an orphan or ward of the court.
4The numbers of both full- and part-time students are projected to increase over the next decade, but full-time enrollment is expected togrow at a faster rate (indicator 5, U.S. Department of Education 2002a).
5Among 1995–96 beginning postsecondary students, 45 percent were traditional students, 19 percent were minimally nontraditional, 19percent were moderately nontraditional, and 16 percent were highly nontraditional (NCES 2000–154).
Nontraditional Undergraduates | Page 19

References
Bean, J., and Metzner, M. (1985). A Conceptual Model of Nontraditional Undergraduate Student Attrition.Review of Educational Research, 55(4).
Berkner, L., Horn, L., and Clune, M. (2000). Descriptive Summary of 1995–96 Beginning PostsecondaryStudents: Three Years Later (NCES 2000–154). U.S. Department of Education, NCES. Washington, DC: U.S.Government Printing Office.
Horn, L. (1996). Nontraditional Undergraduates, Trends in Enrollment From 1986 to 1992 and Persistenceand Attainment Among 1989–90 Beginning Postsecondary Students (NCES 97–578). U.S. Department ofEducation, NCES. Washington, DC: U.S. Government Printing Office.
Horn, L.J., and Premo, M.D. (1995). Profile of Undergraduates in U.S. Postsecondary Education Institutions:1992–93, With an Essay on Undergraduates at Risk (NCES 96–237). U.S. Department of Education, NCES.Washington, DC: U.S. Government Printing Office.
U.S. Department of Education, NCES. (2002a). The Condition of Education 2002 (NCES 2002–025). Washing-ton, DC: U.S. Government Printing Office.
U.S. Department of Education, NCES. (2002b). Digest of Education Statistics 2001 (NCES 2002–130).Washington, DC: U.S. Government Printing Office.
Page 20 | Nontraditional Undergraduates

United StatesDepartment of Education
ED Pubs
8242–B Sandy Court
Jessup, MD 20794–1398
Official Business
Penalty for Private Use, $300
Postage and Fees PaidU.S. Department of Education
Permit No. Gñ17