
NATIONAL BANK OF CANADA - NBC
13
NATIONAL BANK OF CANADA CAUTION REGARDING FORWARD-LOOKING STATEMENTS From time to time, the Bank makes written and oral forward-looking statements, such as those contained in the Outlook for National Bank and the Major Economic Trends sections of this Annual Report, in other filings with Canadian securities regulators, and in other communications, for the purpose of describing the economic environment in which the Bank will operate during fiscal 2016 and the objectives it hopes to achieve for that period. These forward- looking statements are made in accordance with current securities legislation in Canada and the United States. They include, among others, statements with respect to the economy—particularly the Canadian and U.S. economies—market changes, observations regarding the Bank’s objectives and its strategies for achieving them, Bank-projected financial returns and certain risks faced by the Bank. These forward-looking statements are typically identified by future or conditional verbs or words such as “outlook,” “believe,” “anticipate,” “estimate,” “project,” “expect,” “intend,” “plan,” and similar terms and expressions. By their very nature, such forward-looking statements require assumptions to be made and involve inherent risks and uncertainties, both general and specific. Assumptions about the performance of the Canadian and U.S. economies in 2016 and how that will affect the Bank’s business are among the main factors considered in setting the Bank’s strategic priorities and objectives and in determining its financial targets, including provisions for credit losses. In determining its expectations for economic growth, both broadly and in the financial services sector in particular, the Bank primarily considers historical economic data provided by the Canadian and U.S. governments and their agencies. There is a strong possibility that express or implied projections contained in these forward-looking statements will not materialize or will not be accurate. The Bank recommends that readers not place undue reliance on these statements, as a number of factors, many of which are beyond the Bank’s control, could cause actual future results, conditions, actions or events to differ significantly from the targets, expectations, estimates or intentions expressed in the forward-looking statements. These factors include credit risk, market risk, liquidity and funding risk, operational risk, regulatory compliance risk, reputation risk, strategic risk and environmental risk, all of which are described in more detail in the Risk Management section beginning on page 55 of this Annual Report, general economic environment and financial market conditions in Canada, the United States and certain other countries in which the Bank conducts business, including regulatory changes affecting the Bank’s business, capital and liquidity; changes in the accounting polici es the Bank uses to report its financial condition, including uncertainties associated with assumptions and critical accounting estimates; tax laws in the countries in which the Bank operates, primarily Canada and the United States (including the U.S. Foreign Account Tax Compliance Act (FATCA)); changes to capital and liquidity guidelines and to the manner in which they are to be presented and interpreted; changes to the credit ratings assigned to the Bank; and potential disruptions to the Bank’s information technology systems, including evolving cyber attack risk. The foregoing list of risk factors is not exhaustive. Additional information about these factors can be found in the Risk Management section of this Annual Report. Investors and others who rely on the Bank’s forward-looking statements should carefully consider the above factors as well as the uncertainties they represent and the risk they entail. Except as required by law, the Bank does not undertake to update any forward-looking statements, whether written or oral, that may be made from time to time, by it or on its behalf. The forward-looking information contained in this document is presented for the purpose of interpreting the information contained herein and may not be appropriate for other purposes. Q1 2016 RESULTS CONFERENCE CALL – February 23, 2016 I 2
Transcript of NATIONAL BANK OF CANADA - NBC
NATIONAL BANK OF CANADA
CAUTION REGARDING FORWARD-LOOKING STATEMENTS
From time to time, the Bank makes written and oral forward-looking statements, such as those contained in the Outlook for National Bank and the Major Economic Trends sections of this Annual Report, in other filings with Canadian securities regulators, and in other communications, for the purpose of describing the economic environment in which the Bank will operate during fiscal 2016 and the objectives it hopes to achieve for that period. These forward-looking statements are made in accordance with current securities legislation in Canada and the United States. They include, among others, statements with respect to the economy—particularly the Canadian and U.S. economies—market changes, observations regarding the Bank’s objectives and its strategies for achieving them, Bank-projected financial returns and certain risks faced by the Bank. These forward-looking statements are typically identified by future or conditional verbs or words such as “outlook,” “believe,” “anticipate,” “estimate,” “project,” “expect,” “intend,” “plan,” and similar terms and expressions.
By their very nature, such forward-looking statements require assumptions to be made and involve inherent risks and uncertainties, both general and specific. Assumptions about the performance of the Canadian and U.S. economies in 2016 and how that will affect the Bank’s business are among the main factors considered in setting the Bank’s strategic priorities and objectives and in determining its financial targets, including provisions for credit losses. In determining its expectations for economic growth, both broadly and in the financial services sector in particular, the Bank primarily considers historical economic data provided by the Canadian and U.S. governments and their agencies.
There is a strong possibility that express or implied projections contained in these forward-looking statements will not materialize or will not be accurate. The Bank recommends that readers not place undue reliance on these statements, as a number of factors, many of which are beyond the Bank’s control, could cause actual future results, conditions, actions or events to differ significantly from the targets, expectations, estimates or intentions expressed in the forward-looking statements. These factors include credit risk, market risk, liquidity and funding risk, operational risk, regulatory compliance risk, reputation risk, strategic risk and environmental risk, all of which are described in more detail in the Risk Management section beginning on page 55 of this Annual Report, general economic environment and financial market conditions in Canada, the United States and certain other countries in which the Bank conducts business, including regulatory changes affecting the Bank’s business, capital and liquidity; changes in the accounting policies the Bank uses to report its financial condition, including uncertainties associated with assumptions and critical accounting estimates; tax laws in the countries in which the Bank operates, primarily Canada and the United States (including the U.S. Foreign Account Tax Compliance Act (FATCA)); changes to capital and liquidity guidelines and to the manner in which they are to be presented and interpreted; changes to the credit ratings assigned to the Bank; and potential disruptions to the Bank’s information technology systems, including evolving cyber attack risk.
The foregoing list of risk factors is not exhaustive. Additional information about these factors can be found in the Risk Management section of this Annual Report. Investors and others who rely on the Bank’s forward-looking statements should carefully consider the above factors as well as the uncertainties they represent and the risk they entail. Except as required by law, the Bank does not undertake to update any forward-looking statements, whether written or oral, that may be made from time to time, by it or on its behalf.
The forward-looking information contained in this document is presented for the purpose of interpreting the information contained herein and may not be appropriate for other purposes.
Q1 2016 RESULTS CONFERENCE CALL – February 23, 2016 I 2

HIGHLIGHTS
(1) Excluding specified items (see Appendix 1, page 22)(2) Net income before non-controlling interests(3) Trailing 4 quarters
Q1 2016 RESULTS CONFERENCE CALL – February 23, 2016 I 3
Net income up 4% YoY
CET1 at 9.7% after Maple write-off
ADJUSTED RESULTS (1) Q1 16 Q4 15 Q1 15 QoQ YoY
Net Income(2) 427 417 410 2% 4%
Diluted EPS $1.17 $1.16 $1.14 1% 3%
Provision for Credit Losses 63 61 54 3% 17%
Return on Equity 16.4% 16.6% 17.5%
Common Equity Tier 1 Ratio Under Basel III 9.7% 9.9% 9.3%
Leverage ratio 3.8% 3.7% 3.6%
Liquidity coverage ratio 135.0% 131.0%
Dividend Payout(3) 43.5% 42.9% 41.9%
Ghislain ParentChief Financial Officer and Executive Vice-President, Finance and Treasury
FINANCIAL REVIEW
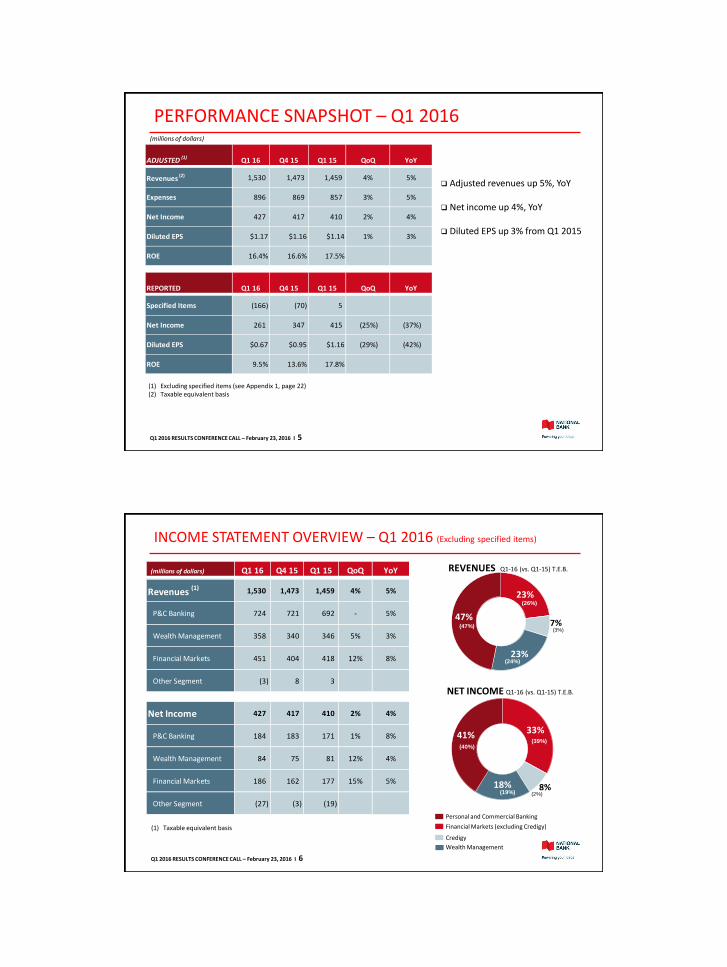
PERFORMANCE SNAPSHOT – Q1 2016
(1) Excluding specified items (see Appendix 1, page 22)(2) Taxable equivalent basis
(millions of dollars)
Q1 2016 RESULTS CONFERENCE CALL – February 23, 2016 I 5
Adjusted revenues up 5%, YoY
Net income up 4%, YoY
Diluted EPS up 3% from Q1 2015
ADJUSTED (1) Q1 16 Q4 15 Q1 15 QoQ YoY
Revenues (2) 1,530 1,473 1,459 4% 5%
Expenses 896 869 857 3% 5%
Net Income 427 417 410 2% 4%
Diluted EPS $1.17 $1.16 $1.14 1% 3%
ROE 16.4% 16.6% 17.5%
REPORTED Q1 16 Q4 15 Q1 15 QoQ YoY
Specified Items (166) (70) 5
Net Income 261 347 415 (25%) (37%)
Diluted EPS $0.67 $0.95 $1.16 (29%) (42%)
ROE 9.5% 13.6% 17.8%
INCOME STATEMENT OVERVIEW – Q1 2016 (Excluding specified items)
REVENUES Q1-16 (vs. Q1-15) T.E.B.
NET INCOME Q1-16 (vs. Q1-15) T.E.B.
Q1 2016 RESULTS CONFERENCE CALL – February 23, 2016 I 6
Personal and Commercial Banking
Financial Markets (excluding Credigy)
Credigy
Wealth Management
(1) Taxable equivalent basis
(millions of dollars) Q1 16 Q4 15 Q1 15 QoQ YoY
Revenues (1) 1,530 1,473 1,459 4% 5%
P&C Banking 724 721 692 - 5%
Wealth Management 358 340 346 5% 3%
Financial Markets 451 404 418 12% 8%
Other Segment (3) 8 3
Net Income 427 417 410 2% 4%
P&C Banking 184 183 171 1% 8%
Wealth Management 84 75 81 12% 4%
Financial Markets 186 162 177 15% 5%
Other Segment (27) (3) (19)
23%
7%
23%
47%(3%)
(24%)
(47%)
(26%)
33%
8%18%
41%
(2%)(19%)
(39%)(40%)

NON INTEREST EXPENSES (Excluding specified items)
Q1 2016 RESULTS CONFERENCE CALL – February 23, 2016 I 7
EFFICIENCY RATIO Higher expenses resulting from technology investments, servicing fees related to Credigy, higher tax on salaries and other fees, partly offset by lower compensation and employee benefits
Salaries and Staff Benefits: decrease mainly due to lower pension plan & other employee benefits
Expecting neutral to slightly positive operating leverage in FY 2016
(millions of dollars) Q1 16 Q4 15 Q1 15 QoQ YoY
Salaries and Staff Benefits 540 513 545 5% (1%)
Technology and Professional Fees 194 191 173 2% 12%
Other Expenses 162 165 139 (2%) 17%
Non Interest Expense 896 869 857 3% 5%
58.7% 58.7%
58.0%
59.0%58.6%
Q1 15 Q2 15 Q3 15 Q4 15 Q1 16
STRONG CAPITAL POSITION
COMMON EQUITY TIER 1 UNDER BASEL III EVOLUTION (QoQ)
Common Equity Tier 1 ratio at 9.7% after write-off of Maple Financial Group
AFS impact due to spread volatility on provincial bonds: 10 bps
Impact of weaker Canadian dollar on RWA: 8 bps
Risk-weighted assets increase by 1.3% during the first quarter due to business growth
Leverage ratio at 3.8%
TOTAL RISK-WEIGHTED ASSETS UNDER BASEL III
Q1 2016 RESULTS CONFERENCE CALL – February 23, 2016 I 8
54,533 55,594 56,398 55,743 56,684
8,853 8,929 9,098 9,127 9,278 2,878 2,548 3,121 3,965 3,779 66,264 67,071 68,617 68,835 69,741
Q1 15 Q2 15 Q3 15 Q4 15 Q1 16
Total Credit Risk Operational Risk Market Risk
9.88%9.88% 10.03% 9.93% 9.85% 9.67% 9.67%
0.28%
0.13%0.10% 0.08%
0.18%
Common Equity Tier 1
Q4 2015
Net Income (net of
dividends)
Maple Financial Group
AOCI AFS Impact of exchange rates
on RWA
RWA growth & Others
Common Equity Tier 1
Q1 2016

RISK MANAGEMENT
William BonnellExecutive Vice-President, Risk Management
LOAN PORTFOLIO OVERVIEW
Q1 2016 RESULTS CONFERENCE CALL – February 23, 2016 I 10
(1) Includes Mining, Utilities, Transportation, Financial, Prof. Services, Construction, Communication, Government, and Other Services
Oil & Gas(billions of dollars) Q1 16 % of total
O&G Corporate 0.9 0.7%
O&G Commercial 2.1 1.8%
O&G Services 0.2 0.2%
Total 3.2 2.7%
(billions of dollars) Q1 16 % of Total
Retail mortgages & HELOC 54.8 46%
Secured by non real estate 4.9 4%
Credit cards 1.9 2%
Other retail 6.9 6%
Total Retail 68.5 58%
(billions of dollars) Q1 16 % of Total
Real Estate 8.0 7%
Retail & Wholesale Trade 5.1 4%
Agriculture 4.5 4%
Manufacturing 4.0 3%
Oil & Gas 3.2 3%
Education & Health Care 2.9 2%
Other (1) 22.8 19%
Total Wholesale 50.5 42%
Total Gross Loans and Acceptances 119.0 100%

REGIONAL DISTRIBUTION OF CANADIAN LOANS
Q1 2016 RESULTS CONFERENCE CALL – February 23, 2016 I 11
As at January 31, 2016
Direct lending to Oil and Gas sector represents approximately 2.7% of total loans Limited small commercial or unsecured retail lending in the oil regions Loan portfolio concentrated in regions with stronger job growth
REGION RM + HELOC Other Retail
Other Wealth
Mgt
Oil & Gas
Sector Commercial Other TOTAL
QC / ON 39.2% 8.1% 2.5% 0.1% 22.4% 10.3% 82.6%
Oil Regions (AL/SK/NL) 2.9% 0.4% 0.4% 2.6% 0.8% 2.5% 9.6%
BC / MB 2.3% 0.3% 0.6% 0.0% 0.6% 1.3% 5.1%
Maritimes (NB/NS/PE) 1.0% 0.4% 0.1% 0.0% 0.5% 0.7% 2.7%
RETAIL WHOLESALE
41.7%
24.3%
34.0%
Insured Uninsured HELOC
(41.9%)
(24.1%)
(34.0%)
RETAIL MORTGAGE AND HELOC PORTFOLIO
Q1 2016 RESULTS CONFERENCE CALL – February 23, 2016 I 12
DISTRIBUTION BY PROVINCEAs at January 31, 2016
MORTGAGE PORTFOLIO COMPOSITIONAs at January 31, 2016
(vs. October 31, 2015)
The average Loan to Value on the HELOC and uninsured mortgage portfolio was approximately 59%
Less than $300 million of second lien mortgages
63%
23%
6% 5% 3%
QC ON AB BC Others

SPECIFIC PROVISION FOR CREDIT LOSSES(millions of dollars)
HIGHLIGHTS
Q1 2016: 21 bps of specific provisions
Strong performance from Central Canada portfolio
Expect PCLs from direct exposure to O&G producers to increase
PCL revised target of 25 – 35 bps for FY2016
Q1 2016 RESULTS CONFERENCE CALL – February 23, 2016 I 13
39 43
40 40 41
15 13 1520 21
Q1 15 Q2 15 Q3 15 Q4 15 Q1 16
Personal Banking Commercial Banking Wealth Management
63
5457 56
61
1 1
1 1
PCLs (in bps) Q1 16 Q4 15 Q3 15 Q2 15 Q1 15
Personal Banking 27 27 27 31 27
Commercial Banking 28 26 21 19 21
Wealth Management 5 3 5 4 -
Corporate Banking - - - - -
TOTAL 21 21 20 22 20
IMPAIRED LOANS AND BA’S AND FORMATION
(millions of dollars)
IMPAIRED LOANS AND BA’S IMPAIRED LOANS AND BA’S FORMATION(1)
(1) Formations include new accounts, disbursements, principal repayments,and exchange rate fluctuation and exclude write-offs.
Q1 2016 RESULTS CONFERENCE CALL – February 23, 2016 I 14
389
446 449 457 434
194
249 254 254 234
(172)
(117) (112) (112)(132)
0.36%0.41% 0.40% 0.39% 0.36%
Q1 15 Q2 15 Q3 15 Q4 15 Q1 16
Gross Impaired LoansImpaired Loans before collective allowance for unimpaired loansImpaired Loans, net of individual and collective allowancesGross Impaired Loans as a % of Loans and BA's
(millions of dollars) Q1 16 Q4 15 Q3 15 Q2 15 Q1 15
Retail 23 23 16 28 22
Commercial (5) 19 24 65 (37)
Corporate Banking - - - - -
Wealth Management 4 1 4 1 2
Total 22 43 44 94 (13)

DAILY TRADING and UNDERWRITING REVENUES vs VaR
Q1 2016 RESULTS CONFERENCE CALL – February 23, 2016 I 15
(15.0)
(10.0)
(5.0)
0.0
5.0
10.0
15.0
20.0
25.0
30.0
2-Nov 9-Nov 17-Nov 24-Nov 1-Dec 8-Dec 15-Dec 22-Dec 31-Dec 8-Jan 15-Jan 22-Jan 29-Jan
Mill
ion
s
Daily Trading and Underwriting Revenues vs Trading VaR - Q1 2016(CAD millions)
Trading and Underwriting Revenues Trading VaR
VaR TREND
Q1 2016 RESULTS CONFERENCE CALL – February 23, 2016 I 16
-5.8
-6.2-6.2
-6.4 -6.4
Q1 15 Q2 15 Q3 15 Q4 15 Q1 16
$ millions
Trading VaR Quarterly Average

Jean DagenaisSenior Vice-President, Finance
BUSINESS SEGMENT REVIEW
2.24% 2.24% 2.24% 2.25% 2.22%
1.65%1.71% 1.72%
1.78%1.73%
1.08%0.99% 0.95%
0.87% 0.90%
Q1 15 Q2 15 Q3 15 Q4 15 Q1 16
NIM Loans Deposits
PERSONAL AND COMMERCIAL BANKING(1)
P&C MARGINS EVOLUTION(2)
HIGHLIGHTS Revenues up 5% YoY due to strong volume
growth from loans and deposits
Net Interest Margin down 3 bps QoQ due to market conditions
Operating leverage ratio at 4% YoY
Efficiency ratio improved by 180 bps
(1) Excluding specified items(2) NIM is on Earning Assets
Q1 2016 RESULTS CONFERENCE CALL – February 23, 2016 I 18
(millions of dollars) Q1 16 Q4 15 Q1 15 QoQ YoY
Revenues 724 721 692 - 5%
Personal Banking 341 348 323 (2%) 6%
Commercial Banking 265 261 252 2% 5%
Credit Card 91 87 89 5% 2%
Insurance 27 25 28 8% (4%)
Operating Expenses 410 411 404 - 1%
Pre-provisions / Pre-tax 314 310 288 1% 9%
Provisions for Credit Losses 62 60 54 3% 15%
Net Income 184 183 171 1% 8%
Key Metrics (billions of dollars) Q1 16 Q4 15 Q1 15 QoQ YoY
Loans & BAs (avg vol.) 90.1 88.6 84.5 2% 7%
Deposits (avg vol.) 46.4 45.7 43.8 2% 6%
Efficiency Ratio (%) 56.6% 57.0% 58.4%
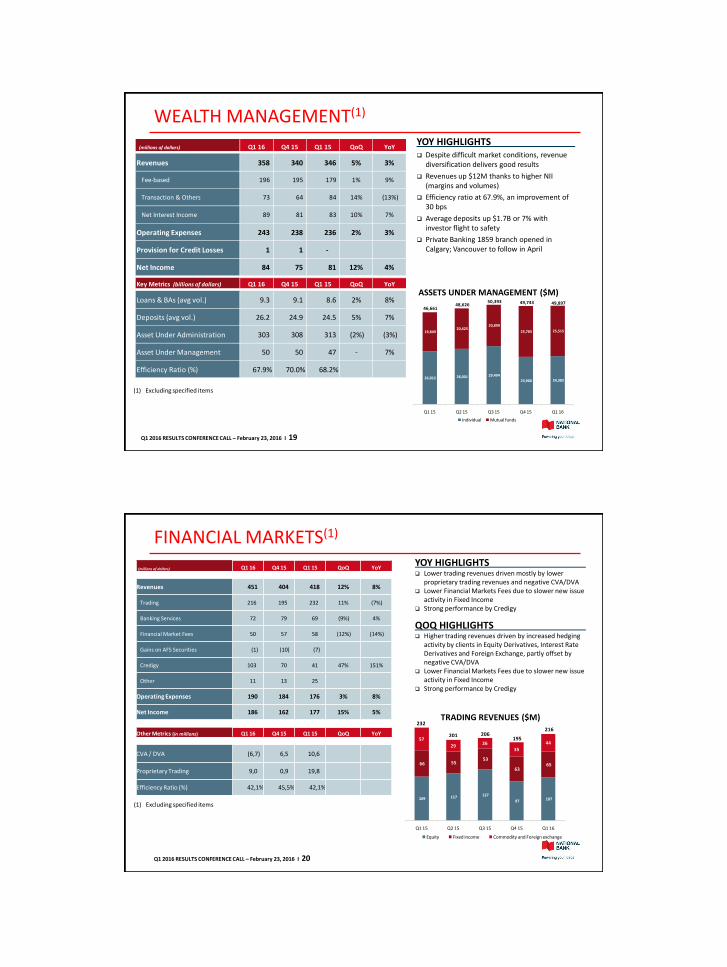
WEALTH MANAGEMENT(1)
(1) Excluding specified items
Q1 2016 RESULTS CONFERENCE CALL – February 23, 2016 I 19
ASSETS UNDER MANAGEMENT ($M)
YOY HIGHLIGHTS Despite difficult market conditions, revenue
diversification delivers good results
Revenues up $12M thanks to higher NII (margins and volumes)
Efficiency ratio at 67.9%, an improvement of 30 bps
Average deposits up $1.7B or 7% with investor flight to safety
Private Banking 1859 branch opened in Calgary; Vancouver to follow in April
(millions of dollars) Q1 16 Q4 15 Q1 15 QoQ YoY
Revenues 358 340 346 5% 3%
Fee-based 196 195 179 1% 9%
Transaction & Others 73 64 84 14% (13%)
Net Interest Income 89 81 83 10% 7%
Operating Expenses 243 238 236 2% 3%
Provision for Credit Losses 1 1 -
Net Income 84 75 81 12% 4%
Key Metrics (billions of dollars) Q1 16 Q4 15 Q1 15 QoQ YoY
Loans & BAs (avg vol.) 9.3 9.1 8.6 2% 8%
Deposits (avg vol.) 26.2 24.9 24.5 5% 7%
Asset Under Administration 303 308 313 (2%) (3%)
Asset Under Management 50 50 47 - 7%
Efficiency Ratio (%) 67.9% 70.0% 68.2%26,812 28,001 29,494
23,960 24,382
19,849 20,625
20,899
25,783 25,515
Q1 15 Q2 15 Q3 15 Q4 15 Q1 16
Individual Mutual funds
48,62646,661
50,393 49,89749,743
109 117 127
97 107
66 55 53
63 65
57
2926
35
44
Q1 15 Q2 15 Q3 15 Q4 15 Q1 16
Equity Fixed income Commodity and Foreign exchange
201
232
206216
195
YOY HIGHLIGHTS Lower trading revenues driven mostly by lower
proprietary trading revenues and negative CVA/DVA Lower Financial Markets Fees due to slower new issue
activity in Fixed Income Strong performance by Credigy
QOQ HIGHLIGHTS Higher trading revenues driven by increased hedging
activity by clients in Equity Derivatives, Interest Rate Derivatives and Foreign Exchange, partly offset by negative CVA/DVA
Lower Financial Markets Fees due to slower new issue activity in Fixed Income
Strong performance by Credigy
TRADING REVENUES ($M)
FINANCIAL MARKETS(1)
(1) Excluding specified items
Q1 2016 RESULTS CONFERENCE CALL – February 23, 2016 I 20
(millions of dollars) Q1 16 Q4 15 Q1 15 QoQ YoY
Revenues 451 404 418 12% 8%
Trading 216 195 232 11% (7%)
Banking Services 72 79 69 (9%) 4%
Financial Market Fees 50 57 58 (12%) (14%)
Gains on AFS Securities (1) (10) (7)
Credigy 103 70 41 47% 151%
Other 11 13 25
Operating Expenses 190 184 176 3% 8%
Net Income 186 162 177 15% 5%
Other Metrics (in millions) Q1 16 Q4 15 Q1 15 QoQ YoY
CVA / DVA (6,7) 6,5 10,6
Proprietary Trading 9,0 0,9 19,8
Efficiency Ratio (%) 42,1% 45,5% 42,1%

APPENDIX
APPENDIX 1 │ DETAIL OF SPECIFIED ITEMS
Q1 2016 RESULTS CONFERENCE CALL – February 23, 2016 I 22
(millions of dollars) Q1 15 Q2 15 Q3 15 Q4 15 Q1 16
Wealth Management acquisitions (9) (8) (7) (6) (9)
Items related to TMX (1) - (2) (1) (18)
Gain on disposal of equity interest in Fiera Capital - 29 - - -
Share of current tax asset write-down of an
associated company- (18) - - -
MAV and Other Notes 18 33 21 (2) (2)
Write-off of Intangible Assets - (46) - - -
Restructuring charge - - - (86) -
Write-off of an equity interest in an associate - - - - (164)
Income Before Income Taxes 8 (10) 12 (95) (193)
Income Taxes (3) 3 (3) 25 27
Net Income 5 (7) 9 (70) (166)
EPS Impact 0.02 (0.02) 0.03 (0.21) (0.50)

APPENDIX 2 │ BALANCE SHEET OVERVIEW (Banking Book & Other)
LENDING – LOANS AND BAs (MONTH END BALANCE) FUNDING – DEPOSITS AND BAs (MONTH END BALANCE)
(billions of dollars)
YoY growth:Personal and Wealth Management 6%Commercial and Corporate 17%
YoY growth:Personal and Wealth Management 8% Commercial and Corporate 8%Securitization 10%
Q1 2016 RESULTS CONFERENCE CALL – February 23, 2016 I 23
56.6 57.4 58.4 59.4 59.8
28.2 29.1 29.6 29.9 30.6
8.4 8.5
8.9 9.0 9.3
14.2 13.9
16.0 17.0
18.8
Q1 2015 Q2 2015 Q3 2015 Q4 2015 Q1 2016
Personal Commercial Wealth Management Corporate
118.5 115.2
112.8 108.8 107.3
49.2 48.8 49.5 50.1 53.2
24.2 24.8 25.6 25.8 24.7
19.5 21.1 23.0 23.9 22.3
26.4 27.0
28.1 29.0 29.0
Q1 2015 Q2 2015 Q3 2015 Q4 2015 Q1 2016
Personal and Wealth Management Commercial Corporate Securitization
121.7 119.3
126.2 129.2 128.7
APPENDIX 3 │ COMPARATIVE PERFORMANCE – Capital Ratios
CAPITAL RATIOS UNDER BASEL III
(1) Weighted average ratios of Royal Bank of Canada, Toronto-Dominion Bank, Bank of Nova Scotia, Bank of Montreal and Canadian Imperial Bank of Commerce
(1)
Q1 2016 RESULTS CONFERENCE CALL – February 23, 2016 I 24
Total
Tier 1
CET1
(1)
CET1
Tier 1
Total
9.7% 9.9% 10.4% 9.5% 10.3%
12.8% 12.5% 11.9% 12.3% 11.7%
14.2% 14.0% 14.1% 14.5% 13.8%
Q1 16
NBC
Q4 15
NBC
Q4 15
Canadian Peers
Q3 15
NBC
Q3 15
Canadian Peers
Common Equity Tier 1 (CET1) Tier 1 Total

0
1
2
3
4
5
6
7
8
9
10
(4) (3) (2) (1) - 1 2 3 4 5 6 7 8 9 10 11 12 13 14 15 16 17 18 19 20 21 22 23 24 25 26 27 28 29
# days
$ millions
Distribution of daily trading and underwriting revenues - Q1 2016
APPENDIX 4 │ TRADING P&L RESULTS
Q1 2016 RESULTS CONFERENCE CALL – February 23, 2016 I 25
INVESTOR RELATIONSFinancial analysts and investors who want to obtain financial information on the Bank are asked to contact the Investor Relations Department.
600 De La Gauchetière Street West, 7th Floor, Montreal, Quebec H3B 4L2Toll-free: 1-866-517-5455Fax: 514-394-6196E-mail: [email protected]: www.nbc.ca/investorrelations