Equality Impact Assessments Chris York (Policy and Projects Officer)

National Assessments on Gender Equality in the Knowledge Society
Country Results: India
The Gender Equality Knowledge Society (GEKS) indicator framework was developed in response to the situation that not only are many women — particularly those in the developing world —on the wrong side of the digital divide, they are on the wrong side of the knowledge divide: worldwide their capacity is grossly under-developed and under-utilized. They are at risk of becoming increasingly marginalized in the knowledge society and related science, technology and innovation systems. Not only do they have less access to information and technology, they are poorly represented in the educational, entrepreneurship and employment opportunities in science, technology and innovation (STI) that base a knowledge society.
Preliminary results of this study are presented here from a pilot assessment of six countries and one region: Brazil, India, Indonesia, the Republic of Korea, South Africa, the United States, and the European Union. National researchers have analysed data available from national and international sources. Preliminary results affirm that women have lower levels of access to the productive resources necessary to support active engagement in the knowledge society – property (land); financing; technology; and education. In turn their representation in employment, entrepreneurship and research is lower in key sectors of the knowledge society, while women in most of the most countries under study are experiencing inequality of opportunity. It is also clear that more consistent and systematic collection of sex-disaggregated data at the national and international levels is necessary to develop the policies that will allow countries to profit from the underutilized potential of their female population. The GEKS framework is organized into three sections – Inputs, Outcomes and Enabling Policies, each comprised of key data indicators:
Inputs Health, social status, economic status, access to resources, agency, opportunity and capability
Enabling Policy Environment
National knowledge society policies; childcare, equal pay, flexible work, infrastructure; CEDAW status; gender mainstreaming in government institutions
Outcomes Knowledge society decision making; knowledge economy; S&T decision making, STI participation
National Researcher: Sudha Nair, Gender Advisory Board, United Nations Commission on Science and Technology for Development Full paper available at http://www.wisat.org/programs/national-assessments-on-gender-sti/ Coordinators: Sophia Huyer, Executive Director, WISAT Nancy Hafkin, Senior Associate, WISAT shuyer at wisat dot org, www.wisat.org

India 2010-11 Key Indicators Population 1,241,492,000 Number of females per 100 males 94 Level of Human Development (HDR) / Rank Medium – 134 CEDAW signatory Yes Percentage of government spending on R&D1 0.85
India ranks lowest overall and in most categories, except in economic status; knowledge economy, enabling policy; and health. While its enabling policy environment is positive and has been in place for many years, implementation and funding needs to improve before its women can equally benefit. The lower status of women in the country may contribute to India's ranking as lowest of the BRIC countries in level of innovation, according to the Global Innovation Index 2012. The GII report notes that this is a result of "deficits in human capital and research; infrastructure and business sophistication, where it comes last among BRICs, and in knowledge and technology outputs, where it comes in ahead of Brazil only." Ensuring that women in the Indian population are enabled and supported to improve their health, access to resources and opportunities, and develop capacity to contribute to India's knowledge society is one obvious and immediate strategy for India to make up some of this gap. This can be achieved if national investment focuses on the key areas of health, education and skills development. Good quality employment and livelihood opportunities are also needed for youth, both males and females. There are definite signs of progress. It has achieved universal primary education enrollment for example and has a high rate of representation of females in the bio and life sciences. As well, with a labour force expected to increase by 32 per cent over the next twenty years, the country can improve its situation if it invests more in the key areas of health, education and skill development for better returns. In particular, it needs to ensure good quality employment and livelihood opportunities for youth – both females and males.
1 Battelle 2012 Global R&D Funding Forecast

3
By Dimension
Dimension 1: Health Status. Life expectancy for males and females is still quite low -- at 66 for females and 63 for males. However child mortality rates and maternal health have been improving and fertility rates have declined from 3.2 to 2.6 from 2000-2009. The sex ratio at birth shows a marked preference for boy children despite government policies and campaigns to restrict this practice. Access to health care has increased as a result of targeted government efforts and the use of ICT to bring health care to remote areas, although more needs to be done. Overall, rates of infectious disease such as malaria are declining, while the number of people living with HIV/AIDS is dropping. While the percentage of HIV-infected females is below 0.1 and falling, it is significant because of the size of the affected population – nearly one million women. Dimension 2: Social Status. While the male-female ratio overall is 1.063, at birth it is 112 in favour of males, due to the practice of sex-selective abortion. Autonomy in decision making is still an area based strongly in cultural systems, to the disadvantage of females. In the age group of 15-19 years, 46% of females are not involved in any kind of decision making relating to household purchases, health care or visits to friends and relatives. In the rural sector, 23.4% females are not, while, in the urban sector, 13.9% of urban resident women are not. It is found that 32.7% illiterate women and 21.6% employed women are not involved in making decisions in any of these areas. As of 2010, overall crimes against women are on the rise, with increases particuarly in rape, kidnapping, and molestation, with decreases in immoral traffic and indecent representation of women. Women work longer hours than men, and carry the major share of household and community work that is unpaid and invisible. While men work longer at paid work, they spend about 3.6 hours in household and care related activities compared to 34.6 hours for females – ten times more.

4
Dimension 3: Economic Status. Women’s participation in the formal labour force is much lower than men’s, at 28.96% compared to more than 80%. Female participation has in fact declined sharply. This is partly because of an improvement in other socio-economic indicators, such as increased educational enrollments of females at all levels. It could also be in part a result of the economic crisis. Agricultural labour force participation remains high, with substantially (nearly 20%) more women than men working in this sector (65.3% to 46.2%). The percentage of women working in agriculture is one of the world’s highest, although figures for both men and women are falling, reflecting global trends. Nevertheless, at 65.3%, self-employment and informal employment remain major sources of income for women. All of these trends likely contribute to the low ratio of female to male wages, with women earning 30.6% of the wages paid to men for equivalent work in 2010. Dimension 4: Access to resources. Indian legislation supports women's financial independence to a moderate degree. Several laws guarantee women’s access to land and property other than land, but these laws are often ignored, as are those pertaining to women’s access to bank loans. For example, although women have equal rights to independent bank accounts, only 15% overall exercise this right. As of June 2011, overall tele-density was at 73.97% and mobile tele-density to 71.11%. While there is no systematic collection of sex-disaggregated data on computer or cell phone use, some illustrative data indicate that 23% of internet users were women in 2000. The total number of female internet users was 115,000 of 500,000 total users, of which 20.5% were female professional and technical workers. 225 million women own mobiles, 60 million use internet, and 50 million use landline telephones. 11% of working women, 6% non-working women and 2% housewives use the Internet, indicating the socioeconomic factors which influence women’s access to ICT. Electricity for domestic use in 2008-9 increased to 75% from 64% in 2002, 96% in urban and 66% in rural. The total electrification rate was 64.5%, urban 93.1% and rural 52.5%. There are no sex-disaggregated data available, but according to the United Nations, in 2010 the proportion of households using solid fuels for cooking is 31% in urban areas and 90% in rural areas – indicating the need for concerted efforts to improve access to clean and affordable energy for household use.
5
Dimension 5: Women’s agency. Female representation in Parliament and ministerial positions has ranged from 10% or lower in the past 10 years. However, at the village (panchayat) level, women make up 36-37% at the three tiers of Panchayati Raj, providing leadership at that level for the empowerment of women and serving as role models for both young and older women in the rural areas. Women in India show a fairly high rate of contraceptive use, with 46.5% of couples using some form of contraceptive in 2007-8 showing a slight increase from 44.1 in 1990-91. Dimension 6: Opportunity and capability: The literacy rate improved by 64.8% in 2001 to 74% in 2011 with female literacy improving from 45.4 to 50.8% – 224 million to 334 million. Nevertheless, India still sees a very high rate of female illiteracy. Educational enrollments for girls and females have increased dramatically, particularly at the primary level, where India has recently achieved gender parity. However, the quality of education is still not consistent across the country. Despite almost universal enrolment and gender parity at the primary level, gross enrolment ratios for females and males drop to 60 and 66% respectively at the secondary level (2010), and to 15 and 21% at the tertiary level.
6
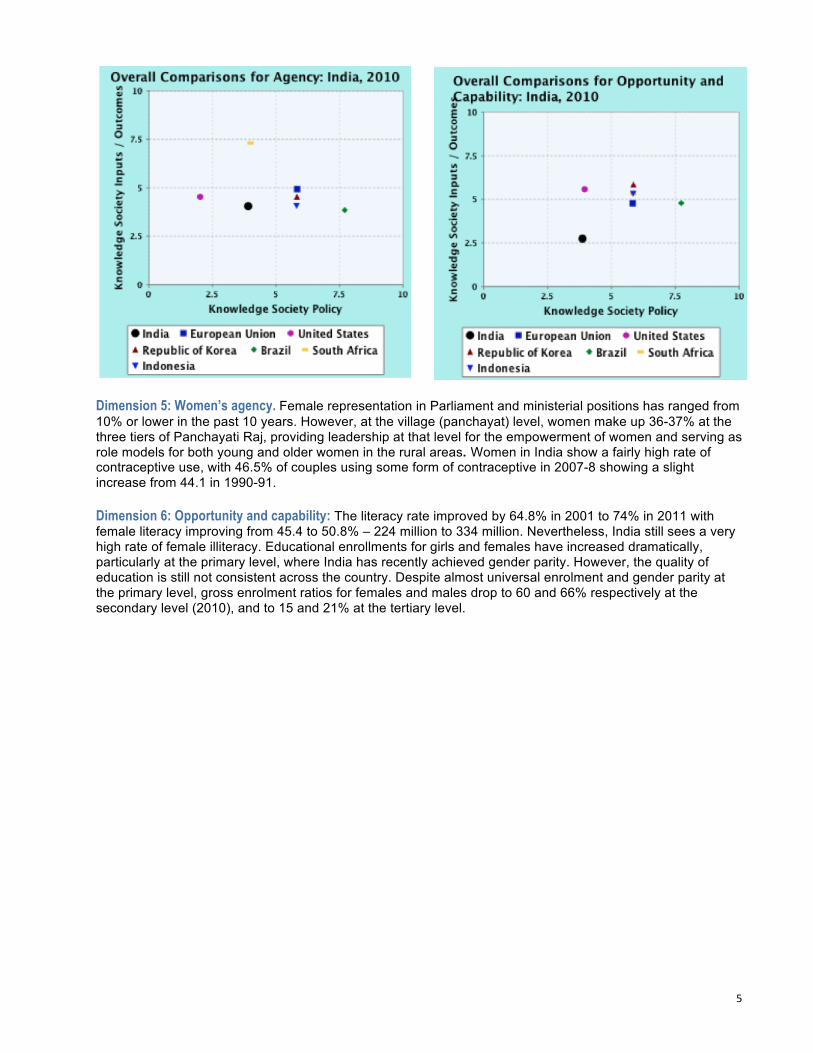
Dimension 7: Enabling Policy Environment. With the principle of gender equality enshrined in the Indian Constitution, India has signed and implemented a number of national and international conventions and laws relating to the rights of women, including CEDAW. In 1992 a National Commission for Women was estabished and in 2001 The National Policy for the Empowerment of Women was established. The National Mission for Empowerment of Women (NMEW) was launched by the Government of India on International Women’s Day in 2010 with the aim to strengthen overall processes that promote all-round development of women. It has the mandate to strengthen inter-sectoral cooperation and facilitate coordination of all women’s programmes across ministries and departments. Dimension 8: Women in Knowledge Society Decision Making. India has a low representation of females in knowledge society decision making: they make up 22% of legislators, senior officials and managers, with almost no change over the last five years. The low participation of females in these positions reflects the low participation of women in higher education. Participation on corporate boards is abysmally low at 4%. Government data indicates that only 26.1% of listed companies in India (392 of 1,500 firms) have appointed a woman to their Board. Out of the 278 directors on the BSE Sensex (Bombay Stock Exchange), there are only 10 women. This rate of representation is echoed in the national science academy, with a slight increase of 2.8% in 2000 to 4.95 in 2010.
7
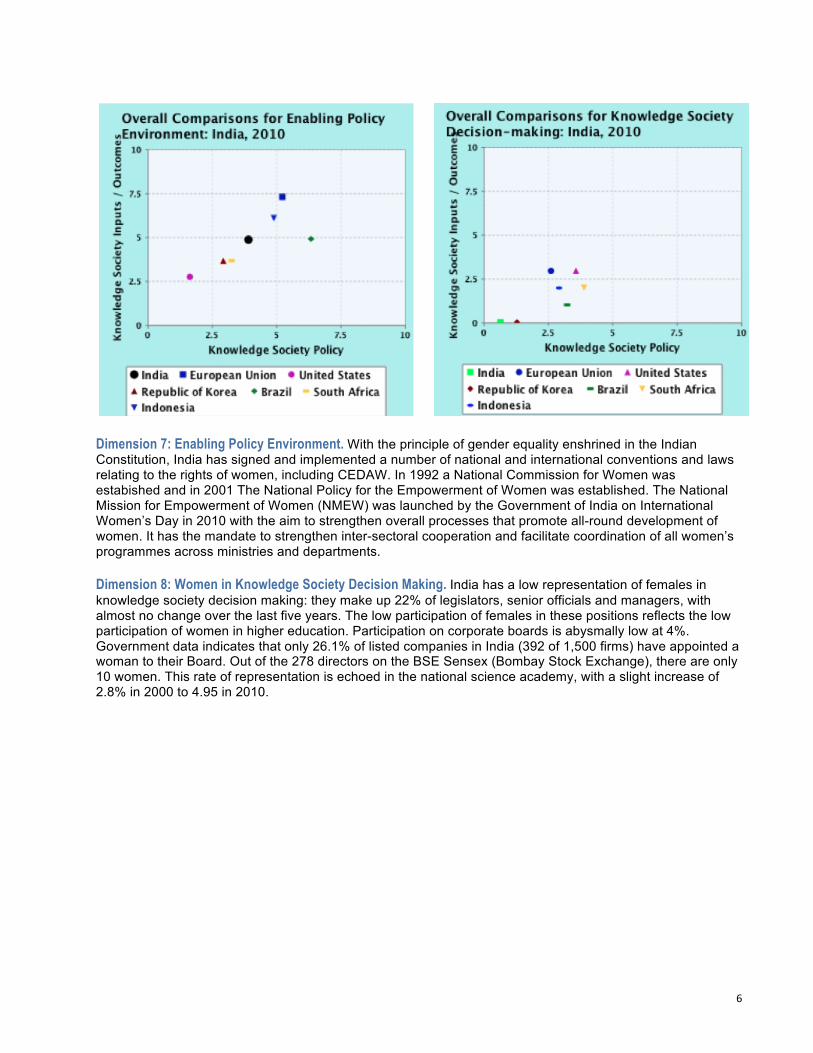
Dimension 9: Women in the knowledge economy. Despite its low ranking in knowledge society decision making and the low rate of females in higher education, India shows a relatively high representation of females, comparatively, in administrative and managerial positions at 28%. Additionally, 28% of the IT workforce is female -- again a comparatively high representation both in comparison to other sectors in the country, and in comparison to representation in the sector in other countries. Dimension 10: Women in S&T innovation systems. India also ranks highly in female representation in science and engineering enrollments, at around 65%, with numbers increasing to 80.4% in the bio, medical and life sciences (including nursing and ayurvedic professions). While female representation in engineering and physics drops to 32-35.8% in 2005 - 2007, this is still the highest rate of the countries studied. However, representation drops in the workforce, to 12.7% of the science and engineering workforce overall. This compares to the representation in Brazil at 17.7%, and South Korea, 14.6% in 2008, dropping to 12.3% (2010). The representation of females in the S&E workforce corresponds to the number of female researchers in all disciplines, 12.5% (2005). While there is little recent data available, the percentage of articles in refereed journals at the national level authored by women is slightly higher than their representation in the workforce, 14.5% (2004), indicating that those who are in the workforce are successful. The participation of females in the formal entrepreneurship sector in the country is very low, less than 10%. This figure fails to take into account the vast numbers of women engaged in small and micro enterprise and livelihoods activity, a sector that comprises a major portion of female employment – 65% – in Asia overall.

8
Detailed results by dimension HEALTH STATUS
SOCIAL STATUS
ECONOMIC STATUS

9
ACCESS TO RESOURCES
AGENCY
OPPORTUNITY AND CAPABILITY

10
KNOWLEDGE SOCIETY DECISION-MAKING
KNOWLEDGE ECONOMY

11
SCIENCE, TECHNOLOGY AND INNOVATION PARTICIPATION
Summary Data