National Assessment of Learning Achievement in...
227
i National Assessment of Learning Achievement in Basic Education in Nigeria JUNIOR SECONDARY TWO
Transcript of National Assessment of Learning Achievement in...

i
National Assessment of Learning
Achievement in Basic Education
in Nigeria
JUNIOR SECONDARY TWO
ii
NALABE 2017
Published by Universal Basic Education Commission (UBEC) UBEC Building, 7, Gwani Street, Wuse Zone 4, P.M.B. 5089, Post Code 900284, Abuja, Nigeria. E-mail: [email protected] Website: www.ubec.gov.ng www.ubeconline.com © Universal Basic Education Commission ISBN: 978-978-52091-4-3 All Rights Reserved
Except for the purposes of research, review or critique, no part of this publication may be reproduced, stored in
a retrieval system or transmitted in any form or by any means, electronic, mechanical, photocopying, recording
or otherwise, without the express permission of Universal Basic Education Commission (UBEC).

iii
Preface
In September 1999, the Federal Government of Nigeria (FGN) launched Universal Basic
Education Programme (UBEP) to support state and local governments in the provision of
quality basic education in the country. This was followed by an Act establishing Universal
Basic Education Commission in 2004. The goal was to ensure access, equity and quality in
the provision of basic education. This was in line with the World declaration on “Education for All” in Jomtien 1990 and Dakar 2000, the Millennium Development Goals (MDGs) now Sustainable Development Goals (SDGs). The declarations focused on the provision of free
and compulsory education to all children.
In 2001, under the UBE Programme, the first edition of National Assessment on Learning
Achievement in Basic Education was conducted on primary four learners, teachers, parents
and Headteachers. The findings from the study were used in furthering support to state and
local governments, particularly in the areas of teacher development, instructional materials
and infrastructure.
In 2003, the second edition of the study was carried out using Primary classes 4, 5, 6 and
junior secondary classes 1 and 2. The study was a follow-up to the first one. However, the
scope of the second edition was increased to include primary 5, 6, JSS 1 and 2. Findings from
this study were used in reviewing the entire strategy for support to state and local
governments in areas of inputs and processes. Arising from the result of the two studies, the
World Bank Supported Primary Education Project (PEP II) to conduct an Action Research on
improving teaching and learning with far-reaching recommendations on quality of teaching
and learning.
In 2006, the third edition of the study on National Assessment was conducted as a follow-up
to the earlier ones. This edition examined learners‟ performance in primary 6 and junior secondary classes 1 and 2, so as to gauge the progress made in basic education delivery. The
result was used to make some changes in the strategies for teacher development and provision
of instructional materials to schools.
The fourth edition of the Assessment was conducted in 2011. It took five years to be
conducted as against the traditional triennial period. The study focused on primary classes 4,
5 and 6 and junior secondary 1. Thus far, it is the only study available for use by the
stakeholders interested in basic education in the country. The acronym, NAUBEP was also
changed to National Assessment of Learning Achievement in Basic Education (NALABE),
because of the new status the programme assumed following the promulgation of Universal
Basic Education Act 2004.
The Commission began preparation for the fifth-edition in the series in 2014. The preparation
had series of activities, which involved generation of test items using curriculum experts,
specialists in Educational Measurement and Evaluation, and classroom teachers who taught
the core subjects at primary and junior secondary levels, trial-testing, and final selection of
the test items for test administration. The test administration was eventually conducted in
November 2017 while data entry and analysis were effected in March 2018 and the report
finalised in May, 2018.

iv
The National Assessment of Learning Achievement in Basic Education provides empirical
evidence on learning outcomes and their contexts. It is essential for determining strengths and
weaknesses of the subsystems as it offers useful recommendations for review of the existing
strategies for improvement and innovation.
I would like to acknowledge and appreciate the participation and immense contributions from
our partners who had provided time to be in some of our activities from the beginning to the
end of this study. To mention but just a few are the FME, NERDC, NECO, JAMB, UNICEF,
DFID, SUBEBs, LGEAs, Headteachers/Principals, Teachers, National and State Secretariat
of the NYSC for release of corps members who served as test administrators and various
security agencies for providing security during the test administration.
I wish to acknowledge the roles played by groups and individuals towards the realisation of
this study. Amongst them are members of the Technical Working Committee comprised Dr
Sharon Oriero-Oviemuno (Deputy Executive Secretary-Technical), Alh. Dauda Alhasan
(Former Ag. Director, Special Programme), Dr T. T. Onosode (Ag. Director, Planning,
Research and Statistics), Mal. Wadatau Madawaki (Ag. Director, Academic Services); the
subject specialists Ada Veronica Ogwuche, Aleshin Mayowa, Deborah Dajep, Aliyu Shaba
Imam, Ziporah Panguro, Vincent Egwuzoro and Nneka Okafor; the Report Writing Team;
Prof. Gidado Tahir (Chairman), Prof. C. O. Onocha (Vice Chairman), Prof. Tony Afemikhe,
Prof O. Oyedeji, Prof Abubakar Hamman-Tukur, Prof Ismaila Tsiga, Prof. Gbenga Adewale,
Dr I. E. Anyanwu, Dr C. C. Agomoh and Dr Ishaku Usman Gadzama; the Technical support
Team: Mal. Jibo Abdullahi (Former Director, Quality Assurance), Mr Sylvester Enyinnaya
(Ag. Director, Quality Assurance), Arit Akpan (Head, Assessment Unit), Julius Adedoja
(Desk Officer) and Abdulrasheed Ayangbayi; and finally the Secretariat staff Tina
Emuekpere, Patrick Agu, John Umoru and Yohana Wobin.
It is my strong belief that this report will provide our key stakeholders: State and Local
Governments, Civil Society Organisations, Community Based Organisations the Academia,
International Development Partners, the Private sector, philanthropists and individuals the
opportunity to appreciate the progress or otherwise being made in the achievement of the
objectives of basic education in Nigeria. Finally, I wish to urge all the stakeholders to be
more dedicated towards the improvement of basic education delivery in the country through
action research, technology-driven process and innovations that will uplift the programme to
higher level. Education for all is the responsibility of all.
v
Executive Summary
One of the major concerns in the provision of Basic Education in Nigeria has been quality
and Universal Basic Education (UBE) in Nigeria was established through an all-inclusive
right-based policy reform. The focus of UBE is to meet the Education For All (EFA),
Millennium Development Goals and the more contemporaneous Sustainable Development
Goals and targets. There has been an appreciable increase in government investment in Basic
Education lately with a corresponding increase in the same by the donor community.
However, this has not translated into any remarkable improvement in quality learning
outcomes in the nation‟s Basic Education sub-sector, this explains why NALABE was carried
out. This is the 4th study and the objectives were to: assess level of achievement of learners in
primary 6 in the four core subjects of English Studies, Mathematics, Basic Science and
Technology and Social Studies; synthesise basic information on primary and junior
secondary schools in Nigeria, and use same to explain learners‟ achievement, access to schools as well as school-community relationships; and assess contextual variables that might
be used as explanatory variables for the levels of competency acquired in the various skill
areas.
The samplings were done in four stages: six Local Government Education Authorities
(LGEAs) were randomly selected from each of the 35 States while three each were randomly
selected from Bayelsa and FCT. Secondly, five primary schools were randomly sampled in
each of the 35 States and three from FCT and Bayelsa. At the third stage, a class was
randomly selected from the number of streams in the primary six. At the fourth stage, random
sampling was undertaken to select 20 learners where there were more than 20 learners in the
selected classes. In all, 216 LGEAs, 1,080 primary schools, 21,600 primary 6 learners, 3,240
primary 6 teachers and 12,960 parents of primary 6 learners were used. The following were
done in the test development: a review and update of the frameworks of curriculum content
domains for the subjects: English studies, Social Studies, Basic Science and Technology and
Mathematics; developing items and scoring guides in accordance with the specifications of
content and cognitive domains in the frameworks; conducting trials of the items on
equivalent samples and conducting item analysis; and selection of items. The test items were
administered on equivalent samples of the respective populations in five schools and in four
states. In all, 1,199 Multiple Choice Test responses and 50 constructed response scripts were
obtained. The development of four context questionnaires for pupils/learners, teachers, head-
teachers /principals and parents was similar to the Tests. Previous National Assessments
conducted by the Commission were anchored on the Classical Test Theory (CTT) but the
Item Response Theory (IRT) was used in analysing 2017 NALABE. The results are presented
in the next paragraphs.
Learners' Home and Support The first training ground for a child is the home. For a child to adjust very well in school depends largely on the type of support the child receives from the home. The home and neighbourhoods are complex social environments which intricately interact and impact positively or otherwise on the growth, development and school achievement of learners.

vi
Therefore, the home plays a vital role in the overall achievement of a child. This sub-section illustrates the type of support learners receive from the home.
Majority (88.0 percent) of the learners lived with their parents; 73.5 percent of learners ate breakfast at home while the rest had other means of taking theirs. Learners ate between 1-4 times per day. Ownership of textbooks facilitated independent home study and work on learning tasks and assignments and directly impacted on academic performance. However, only about 50.0 percent of the learners owned English Studies and Mathematics textbooks. Only 8.70 percent of them spent up to three hours or more on homework per week. Learners obtained assistance in accomplishing homework from several sources within and outside the home. Other forms of home support included response to teachers‟ invitation for discussion or call by many parents, provision of learning resources, commuting the learners to school, etc. A majority of them were positive that their parents liked them.
Teachers in Schools
Apart from homes, teachers are significant component of the learners‟ education. The Nigerian National Policy on Education appreciates the fact that no education system rises above the quality of its teachers. It is therefore imperative that any national study on assessment should understand the teacher within the context of the school. Therefore, this subsection presents the teachers (including the head-teachers) in the study.
The head teacher, a primus inter pares occupies a unique position and plays an important role in a school. About 83.4 percent of the teachers have 0-20 years teaching experience; 87.0 percent of the head-teachers and 78.2 percent of the teachers were married, 50.1 percent of the head-teachers and 28.6 percent of teachers had degrees with teaching qualification. Generally, 84.0 percent of the head-teachers attended in-service training/workshops in the past five years. These included conferences/seminars/workshops and cluster training (53.20 percent). The class attendance register was marked twice daily by 93.80 percent of the teachers. Many of the teachers (57.40 percent) taught all subjects. Teachers prepared their lesson notes and their frequency varied. Learners received between 1-30 lessons per week. The average duration of lessons was between 21 and 40 minutes. The number of weeks spent on teaching in a year was between 21 and 40 weeks. About half of the teachers (49.30 percent) gave learners homework/assignment in English Studies, Mathematics and Science daily. Teachers (44.30 percent) spent between 1-10 hours per week correcting learners‟ homework, 7.30 percent spent more than 10 hours. The instructional materials used often by 80.30 percent of the teachers were published textbooks while 15.10 percent often used audio-visual materials. Teachers applied different teaching methods in their work and used a variety of techniques in assigning marks to the learners.
Teachers had average morale, high morale and low morale, respectively reason being self-motivation. Generally, About 98.00 percent of the teachers liked teaching, 13.10 percent of the headteachers liked their role in modeling the future generation/building the nation and 10.50 percent enjoyed the daily knowledge/skills acquisition. The headteachers did not like their poor salary/delay in salary, poor working environment, lack of societal recognition, attitude of some of the parents to the learners‟ discipline and lateness. The headteachers in public schools liked the UBE Programme for the provision of infrastructural facilities, learning/instructional materials/educational support and others. However, these were not provided in private schools.

vii
The School and the Community
The school does not exist in isolation; it is a sub-set of the community, therefore, it exerts some level of influence on the community and the community also plays a significant role in making school achieve its objectives. This sub-section describes the school and the community. The distance of home from school is important in the choice of schools for learners. Since boarding facilities were not available in most primary schools, learners commuted from home to school via walking, use of bicycle, taxi/bus, family car and motorcycle/tricycle. The average distance of the schools away from the homes of a majority of the learners was < 1 kilometer (55.50 percent). About 70.00 percent of the schools had well-demarcated compounds, secured from encroachment and large enough for buildings, playgrounds and gardens. Apart from the compound in terms of its size, 47.20 percent of the school compounds were free from erosion problems, 36.10 percent bore evidence of erosion problems and 9.90 percent of the school compounds had serious erosion problems. Teaching and learning processes are facilitated by a learner-friendly environment such as the availability of water, toilets, recreational facilities, disposal facilities, etc. The main source of water supply in the 850 sampled schools was the borehole (31.60 percent). However, there was no established source of water in 31.10 percent of the schools. Toilets were available in 60.80 percent of the schools. Components of school security were fencing and types of fencing and engagement of security personnel.
The community had many roles and responsibilities in supporting the school. These included rendering assistance to their schools in various other ways like security (24.70 percent), land (23.40 percent), money (12.40 percent), auxiliary teachers (10.40 percent), buildings (9.80 percent), and equipment (6.90 percent). The attitude of communities towards their schools was positive in school activities, solving problems relating to the learners and their conduct, etc. One major avenue through which the communities rendered assistance to their schools was the Parent-Teachers‟ Association (PTA), through the association, such school infrastructure and facilities such as the library, classrooms, furniture, ICT services, football fields, school garden/farms, weather stations, auditorium/halls and administrative blocks and were partly provided and maintained.
Attitude of Learners English Studies and Mathematics were the subjects most liked. Basic Science and Technology and Social Studies were those least liked. About 90.70 percent liked their teachers. Some learners liked schooling for other reasons. Learners’ Achievement: English Studies Learners‟ achievements in four subjects (English Studies; Mathematics; Basic Science and Technology; and Social Studies) were used. The national, zonal and state achievement scores showed no significant differences in performance between the levels of each variable (gender, location and type of school) for both tests in all the four subjects, although, there were variations from state to state. For English Studies, learners were good in the Multiple Choice test, whereas, they were only fair in the Essay test. State performance on content and cognitive domains showed that scores were higher in reading (59.59) than in grammar (53.66). Learners performed higher in Comprehension (63.43) than in Knowledge (56.65) and Higher Order objectives (53.41). The performance in the multiple-choice test was higher than that of the essay in urban locations in North-Central, South-East, South-West and South-South.

viii
The relational analysis showed that the performance at low level of engagement in non-learning activities was higher than that at moderate level which, in turn, was higher than high level of engagement. Learners, whose parents did farming/fishing had performed higher than other occupations. Learners whose parents were workers (private/public) performed best in 17 states. The performance of learners was in increasing order for mothers who were into working (Public/Private) (57.70), farming/fishing (57.50), business/trading (57.00) and „others‟ (55.40). The best performance at the national level was exhibited by learners who went to school by family car and with taxi/bus and okada/bicycle/tricycle.
Learners’ Achievement: Mathematics
In Mathematics, the learners were good in the Multiple Choice Test whereas but only fair in the Essay Test. Learners‟ performance in Mathematics by the content domains, the national mean scores was highest in Numbers and numeration (64.40), Algebraic process (59.11), Basic operations (51.04) and least in Everyday Mathematics (34.48). By cognitive domains, the national mean scores were Comprehension (60.47), Knowledge (59.54) and Higher Order (54.31).
The relational analysis showed that the national mean scores on assistance with homework were moderate level (59.70), low level (59.60) and high level (58.30); on the availability of facilities, were low level (58.40), moderate level (59.50) and high level (60.50). On moderate engagement in non-learning activities were high (60.00), low level (59.50) and high level (58.10). Learners whose fathers were into business/trading had the best performance (60.90), followed by „others‟ (60.50), farming/fishing (59.00), and workers (public/private) (59.00). Learners whose mothers did farming/fishing scored 59.60, followed by business/trading (58.80), etc. Learners who travelled > 3 kilometers had a high mean performance, 1 to 2 kilometers had least performance while the best-performing learners travelled between 2-3 kilometers to school daily. Learners with textbooks (60.50) scored higher than those without textbooks (57.70).
Learners’ Achievement: Basic Science and Technology In Basic Science and Technology, the learners were fair in both Multiple Choice and Essay Tests. By content domains, the learners‟ scores were: You and Environment (54.42 percent); Science and Development (51.34 percent); Living and Non-Living Things (40.86 percent); and You and Energy (42.45 percent). Learners‟ scores in the cognitive domains were Higher order (54.62 percent), Knowledge (51.48 percent) and Comprehension (42.20 percent). Learners‟ performances were decomposed by (gender, location and type of school) for both tests.
The relational analysis showed that the national mean for the three levels of assistance, (48.00), moderate (47.70) and high (47.3), tended to give a pattern that increased in relation to amount of assistance received. On moderate engagement in non-learning activities means for the three levels of engagement were high level (47.90), low level (47.80) and moderate level (47.50).
Learners whose fathers were into others had the best performance (48.00), followed by „others‟ business/trading (48.00), farming/fishing (47.70), and workers (public/private) (47.30). business/trading had the best performance (62.60) followed by children of mothers whose occupations were classified as „others‟ (62.20), the children of mothers who worked (public/private) and were into farming/fishing had the least performance (61.90). The national means of the performance of learners based on distance covered were as follows: < 1 kilometer (47.70), 1 to 2 kilometers (49.90) which had the best perfomance, > 2 to 3

ix
kilometers (49.60), > 3 kilometers (47.80). with textbooks(60.50) scored higher than those without textbooks(57.70).
Performance was highest with one or two meals a day (47.80) and thereafter diminished for 3 meals (47.20) and then four meals per day (46.60). Performance of learners without textbooks (47.90) was higher than that for learners with textbooks (47.40) though the difference was not significant. The performance of learners who liked their teachers (49.70) was higher than that of learners who did not (48.4) and the performance of learners who did not like school was 48.80 percent as against 49.70 percent for those who did not.
Learners’ Achievement: Social Studies In Social Studies, the learners performed fairly well both in the Multiple Choice and Essay Tests. There were no significant differences in performance between the levels of each variable (gender, location and type of school) for both tests. The national means for the different themes were as follows: Family (69.23), Culture (65.51), National Economy (50.31), Infrastructural Facilities/Services (66.89), Health Issues (67.02), People and their Environment (60.02) and Social Issues and Problems (62.45). The national means for the cognitive domains were Knowledge (62.75), Comprehension (61.80) and finally Higher Order (61.77). The national mean score for the multiple-choice test was 49.98 and that for the essay test was 49.35. Thus, the performance level of learners in the multiple-choice Test was higher than their performance in the essay test.
The means for levels of assistance with homework were high (62.50), low (62.20), and moderate (62.00). Availability of learning facilities resulted in low level (62.40), moderate level (62.30) and high level (61.60). Levels of engagement in after-school were low (62.1), moderate (62.00), and high (62.00). The national means scores based on fathers‟ occupations were business/trading (62.50), worker (public/private) (62.10) and farming/fishing (62.00) while the mothers‟ occupations were business/trading (62.60), „others‟ (62.20), worker (public/private) (61.90) and farming/fishing (61.90). The means for the modes of transportation to school were taxis/buses (46.90), family cars (45.50), Okada/Bicycle/Tricycle (43.90), walking (45.50) while their distances were < 1 kilometer (62.20), 1-2 kilometers (56.20), >2-3 kilometers (63.70) and > 3 kilometers (60.90); numbers of meals were once (62.00), twice (62.80), thrice (62.50) and four times (62.40). The mean score for learners without textbooks (62.60) was higher than that for learners with textbooks (61.90). The mean for learners who liked their teachers (46.20) was higher than that of learners who did not like their teachers (45.50). The mean of learners who did not like schooling was 45.90 and that for those who liked schooling was 45.50.

x
Content
Preface iii
Executive Summary v
List of Figures xii
List of Tables xvii
List of Acronyms and Abbreviations xix
Section One: Background and Methodology 1
Chapter One: Background of the Study 1
Introduction 1
National Assessment 1 The 2017 National Assessment of Basic Education (NALABE) 2
Chapter Two: Methods and Procedures 4
Project Design 4
Sample Design 4
Data Administration Plan 8
Data Analysis Procedures 10 Chapter Three: Learners’ Home and Support 13
Introduction 13 Background Information 13 Types of Support from Home 15 Observation and Challenges 19
Chapter Four: Teachers in Schools 20
Profile of Principals and Teachers 20 Staff Situation in Schools 23 Professional Development 24 School Discipline and Climate 26 Decision Making 26 Job Satisfaction and Morale 28 Teaching and Evaluation Practices 29 Teachers‟ Needs 31 Learners' Problems 35 Observation and Challenges 36
Chapter Five: The School and the Community 37
The School in Perspective 37 Parents Relationship with the School 38 Parental Support of the School 40 School Fence and Security Provision 41 School Compound and Buildings 42 Students‟ Enrolment, Dropouts and Repeaters 43 Classroom Spaces and Open Classrooms 46 Facilities in Schools 47
xi
The Child Friendly School Environment 49 Water Supply Sources 51 Availability of Useable Games/Sports Facilities in School 51 Curriculum Materials 53 Types of Instructional Materials 55 Observation and Challenges 56
Chapter Six: Attitude of Learners 57
Parents Liking for Learners 57 Attitude towards School Subjects 58 Attitude towards Teachers 60 Attitude to Schooling 61 Observation and Challenges 63
Chapter Seven: English Studies 65
National Achievement 65 Achievement across Geopolitical Zones 67 Relational Analysis 85 Observation and Challenges 101
Chapter Eight: Achievement in Mathematics 102
Introduction 102 National Achievement 102 Learners‟ Achievement at State Level 106 Achievement of Learners in Mathematics Based on Content Domain 112 Relation Analysis 121 Observation and Challenges 136
Chapter Nine: Achievement in Basic Science and Technology 137
National Achievement 137 Achievement at Zonal level 139 Achievement at State Level 142 Relational Analysis of Performance 150
Chapter Ten: Achievement in Social Studies 165
National Achievement 165 Achievement in Geopolitical Zonal 167 State Level Achievement for Test Forms 170 Relational Analysis 179 Observation and Challenges 194
Chapter Eleven: Major Findings, Implications for Policy and Recommendations 195
Contextual Variables 195 Implications for Policy 197 Socio-Demographic Characteristics of Parents 197 Support from Home 198
Learners‟ Contributions at Home through Co-Curricular Activities 199 Teachers in Schools 199 Professional Development 200

xii
School Discipline and Climate 201 Decision Making 201 Job satisfaction and Moral 202 Teaching and Evaluation Practices 202 Teachers‟ Needs 202 The School and the Community 203 Distance to School 203 Community Assistance to Schools 203 Relationship between the School and the Community 203 Space for School Buildings, Playgrounds and Gardens 204 Male and Female Enrolment 204 School Dropout Rate 204 Availability of Toilets in the Schools 205 Non-Availability of Curriculum Materials 205 Appropriateness of Classroom Facilities 205 Disparity among Schools in Classrooms and Spaces 205 Availability of Textbooks 206 Water Supply 206 Lack of Refuse Disposal Facilities 206 Attitude of the Learners 206 Parents like the Teachers 206 Subjects the Learners Disliked Most 206 The Learners like Their Teachers and Schooling 207
xiii
List of Figures
Figure 3.1: Distribution of Parents / Guardians Occupation 13 Figure 3.2: Types of Residence 13 Figure: 3.3: Number of Children in Schools 14 Figure 3.4: Children in the Immediate / Nuclear Family 14 Figure 3.5: Distance to School from Home 17 Figure 4.1: Age of Principals 20 Figure 4.2: Qualification of Principals 21 Figure 4.2.1: Age Distribution of Teachers 21 Figure 4.3: Highest Educational Qualification of Teachers 22 Figure 4.4: Teachers‟ Teaching Experience 22 Figure 4.3.1: Type of Training Attended in the Past Five Years 24 Figure 4.3.2: Workshop/Training Attended by Teachers in the Past Five Years 25 Figure 4.3.3: Training Courses Attended in the Past 3 Years by Teachers 25 Figure 4.4.1: Type of Disciplinary Cases 26 Figure 4.6.1: Things which Principals do not like about their Job 29 Figure 4.7.1: Use of Instructional Materials by Subject Teachers 30 Figure 4.7.2: Use of Evaluation Instruments by Subject Teachers 30 Figure 4.8.1 Help Needed by Subject Teachers in Instructional Activities 32 Figure 4.8.2: Help Needed by Subject Teachers in Management Practices 33 Figure 4.8.3: Help Needed by Subject Teachers in Co-curricular Activities 34 Figure 4.8.4:Help Needed by Subject Teachers in Instructional Materials and Evaluation Practices 34 Figure 5.1.1: Shift System Run in School 37 Figure 5.1.2: Distance of School from Home 38 Figure 5.2.1: How often PTA Meets 39 Figure 5.2.2: Chart of Attendance at PTA Meetings by Parents 39 Figure 5.2.3: Subject Teachers Visit to Parents 39 Figure 5.2.4: Chart of Parents‟ Visit to Schools 40 Figure 5.3.1: Level of Assistance Rendered by Parents to School 40 Figure 5.3.2: Chart of Levies and Other Charges Payment by Parents 41 Figure 5.3.3: Relationship between the School and the Community 41 Figure 5.4.1: Type of Fence 42 Figure 5.4.2: Type of Security Engaged by School 42 Figure 5.7.1: Chart of Repeaters and Dropouts across States 44 Figure 5.7.1: Reasons for Learners Dropping Out of School 45 Figure 5.8.1: Distribution of Classroom Spaces and Open Classrooms by States 46 Figure 5.9.1: Condition of Some Facilities in Schools 48 Figure 5.9.2: Distribution of Furniture 49 Figure 5.11.1: Sources of Water Supply 51 Figure 5.12.1: Available Useable Games/Sports Facilities 51 Figure 5.12.2: Availability of Refuse Disposal Facilities in School 52 Figure 5.12.3: Usability of Refuse Disposal Facilities in School 52 Figure 5.12.4: Availability of Usable Recreational Facilities in Schools 53 Figure 5.13.1: Availability of Curriculum Materials 54 Figure 5.13.2: Quality of Curriculum Materials 54 Figure 5.13.3: Adequacy of the Curriculum Materials 55 Figure 6.1.1: Percentage of Parents Liking the Learners 57

xiv
Figure 6.1.2: Reasons Parents Like Children 58 Figure 6.1.3: Reasons Parents do not like Children 58 Figure 6.2.1: Subjects Liked and not Liked by Learners 59 Figure 6.2.2: Reasons for not Liking the Subject 60 Figure 6.3.1: Percentage of Learners‟ Liking for the Teacher 60 Figure 6.3.2: Reasons for Liking Teacher 61 Figure 6.4.1: Reasons for Liking Schooling 62 Figure 7.2: Percentile of JS 2 Learners in Multiple Choice and Essay tests 65 Figure 7.3Learners‟ Achievement in Content Domains 66 Figure 7.4 Achievement in Cognitive Domains 67 Figure 7.5 Distribution of Mean Scores in Multiple Choice in Geopolitical Zones 67 Figure 7.6: Achievement Tests of Learners in Essay in Geopolitical Zones 67 Figure 7.7: Distribution of Mean Scores in Multiple Choice Test across Zones 68 Figure 7.8 Achievement in Content Domains across the Geopolitical Zones 70 Figure 7.9: Distribution of Mean Score by Geo-political Zone on the Level of Cognition of English Studies 71 Figure 7.10 : Distributions of Score in Multiple Choice across States Based on Gender 72 Figure 7.11: Learners' Achievement in Speech across States 77 Figure 7.12 Learners' Achievement in Writing across States 78 Figure 7.13: Learners' Achievement in Reading across States 79 Figure 7.14: Learners' Achievement in Grammatical Accuracy across States 80 Figure 7.15: Learners' Achievement in Literature across States 81 Figure 7.16: Learner Achievement in Knowledge across States 82 Figure 7.17: Learners' Achievement in Comprehension across States 83 Figure 7.18: Learner Achievement in Higher Order across States 84 Figure 7.19: Mother's Occupation 92 Figure 8.1: Achievement of Learners in the Multiple Choice and Essay Tests 102 Figure 8.2: Percentile Scores in Multiple Choice and Essay Tests 103 Figure 8.3: Mean Scores of Learners‟ Achievement
in Essay and Multiple Choice by Gender 103 Figure 8.4: Mean Scores of Learners‟ Achievement in Essay and Multiple Choice by School Location 104 Figure 8.5: Mean Scores in Multiple Choice Test across Geopolitical Zones 104 Figure 8.6: Distribution of Learners Average Scores in Essay Test across Geopolitical Zones 105 Figure 8.7: Mean Score of JSS 2 Learners in Mathematics 107 Figure 8.8: Achievement of Learners across States Based on Content
(Number and Numeration) 112 Figure 8.9: Achievement of Learners across States Based on Content (Basic Operation) 113 Figure 8.10: Achievement of Learners across States on Algebraic Process 114 Figure 8.11: Achievement of Learners across States on Geometric Mensuration 115 Figure 8.12: Achievement of Learners across States Based on Content
(Everyday Mathematics) 116 Figure 8.13: Distribution of Mean Score Learners across the States Based on Knowledge Objective 118 Figure 8.14: Distribution of Mean Score Learners across the States Based on Comprehension Objectives 119
xv
Figure 8.15: Distribution of Mean Score Learners across the States Based on Higher Order Objective 120 Figure 8.16: Achievement of Learners in Mathematics across States on
Homework Assistance 122 Figure 8.17: Achievement of Learners in Mathematics across States Based on Availability of Learning Materials 123 Figure 8.18: Achievement of Learners in Mathematics across states Based on Non-Learning Engagement 124 Figure 8.19: Achievement of Learners in Mathematics across the States Based on Occupation of Father 125 Figure 9.1: National Average Scores for Multiple Choice and Essay Tests 137 Figure 9.2: National Distribution of Score Ranges in Basic Science and Technology 137 Figure 9.3: Percentile for Essay and Multiple Choice Tests 138 Figure 9.2.1: Gender Achievement by Zone on Multiple Choice Test 139 Figure 9.2.3: Distribution of Mean Scores by Geo-Political Zone on the
Objectives Domains 141 Figure 9.3.1: Mean Score in Basic Science and Technology 143 Figure 10.1: National Average for Multiple Choice and Essay Type Tests 165 Fig. 10.2: Percentiles for Multiple Choice and Essay Tests at National Level 166 Figure 10.3: Mean in Multiple Choice test across Geo-Political Zones 166 Figure 10.4: Mean Essay Test across Geo- Political Zones 167 Figure 10.6: Achievement by Zone on Content across Geopolitical Zones 169 Figure 10.7: Mean Score by Zone on The Social Studies Cognitive Domains 170 Figure 10.8: Mean Score of JSS 2 Learners in Social Studies 171 Figure 10.8: Mean Scores in Multiple Choice Based on Gender across States 172

xvi
List of Tables
Table 2.1: Test Characteristics 7
Table 3.1: Number of Students with Textbooks in Core Subjects 15
Table 3.2:Assistance on Homework by Parents 15
Table 3.3: Educational Facilities Provided 15
Table 3.4: Average Time Spent Daily on Home Work 16
Table 3.5: Number of Meals Per Day 16
Table 3.6: Regular Collection of Pocket Money 17
Table 3.7: Number of Uniform Learners have 17
Table 3.8:Means of Going to School 17
Table 3.9: Attendance of PTA Meetings 18
Table 3.10: Parents Like for Learners 18
Table 3.11: Learners‟ Activities after School 18
Table 4.2.1: Qualification of Teachers (Excluding Religious Instructors) 23
Table 4.5.1: Principals‟ Freedom in Decision Making about School Activities 27
Table 4.5.2: Freedom of Teachers in Decision Making 28 Table 4.6.1: Things Principals Like about their Job 28 Table 4.7.1: Teachers‟ Use of Evaluation Techniques for Diagnosing Learners‟ Weakness 31 Table 4.9.1: Problems Encountered as Classroom Teacher 35 Table 4.9.2: Problems Teachers Encounter with Students 35
Table 5.1.1: Means of Going to School 38 Table 5.6.1: Description of School Compound 43 Table 5.10.1: Number of Toilets for Learners 50 Table 5.10.2: Toilets for Teachers 50 Table 5.14.1: Types of Instructional Materials Available in Schools 55 Table 6.1: Reasons for not Liking Schools 62 Table7.1: Distribution of Mean and Standard Error of Performance in Multiple Choice and Essay Tests by Location, School Type and Gender 66 Table 7.2: Distribution of Mean Scores in Essay Test across Geo-political Zones based on Gender 68 Table 7.3: Learners‟ Performance in Multiple and Essay Tests across Geo-political and School Location 69 Table 7.4: Achievement across the States based on Gender in Essay Test 73 Table 7.5: Achievement in Type of Test by Location 74 Table 7.6: Homework Support as Related to Achievement in JS2 English Studies 86 Table 7.7 Level of Availability of Learning Materials and Achievement in English Studies 88 Table 7.8: Out of School Non Learning Engagements as Related to Achievement 89 Table 7.9: Occupation of Father as Related to Achievement in JS2 English Studies 91 Table 7.10: Occupation of Mother as Related to Achievement in JS2 Mathematics 92
xvii
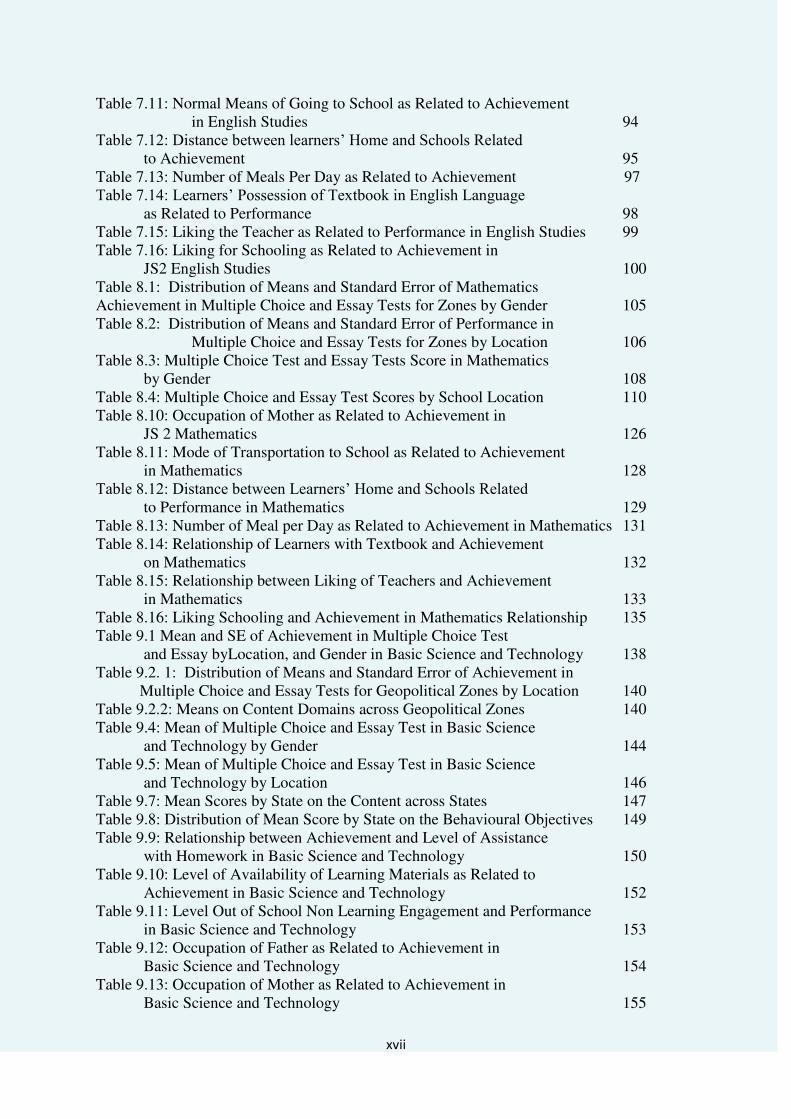
Table 7.11: Normal Means of Going to School as Related to Achievement in English Studies 94 Table 7.12: Distance between learners‟ Home and Schools Related to Achievement 95 Table 7.13: Number of Meals Per Day as Related to Achievement 97 Table 7.14: Learners‟ Possession of Textbook in English Language as Related to Performance 98 Table 7.15: Liking the Teacher as Related to Performance in English Studies 99 Table 7.16: Liking for Schooling as Related to Achievement in JS2 English Studies 100 Table 8.1: Distribution of Means and Standard Error of Mathematics Achievement in Multiple Choice and Essay Tests for Zones by Gender 105 Table 8.2: Distribution of Means and Standard Error of Performance in Multiple Choice and Essay Tests for Zones by Location 106 Table 8.3: Multiple Choice Test and Essay Tests Score in Mathematics by Gender 108 Table 8.4: Multiple Choice and Essay Test Scores by School Location 110 Table 8.10: Occupation of Mother as Related to Achievement in JS 2 Mathematics 126 Table 8.11: Mode of Transportation to School as Related to Achievement in Mathematics 128 Table 8.12: Distance between Learners‟ Home and Schools Related to Performance in Mathematics 129 Table 8.13: Number of Meal per Day as Related to Achievement in Mathematics 131 Table 8.14: Relationship of Learners with Textbook and Achievement on Mathematics 132 Table 8.15: Relationship between Liking of Teachers and Achievement in Mathematics 133 Table 8.16: Liking Schooling and Achievement in Mathematics Relationship 135 Table 9.1 Mean and SE of Achievement in Multiple Choice Test and Essay byLocation, and Gender in Basic Science and Technology 138 Table 9.2. 1: Distribution of Means and Standard Error of Achievement in Multiple Choice and Essay Tests for Geopolitical Zones by Location 140 Table 9.2.2: Means on Content Domains across Geopolitical Zones 140 Table 9.4: Mean of Multiple Choice and Essay Test in Basic Science and Technology by Gender 144 Table 9.5: Mean of Multiple Choice and Essay Test in Basic Science and Technology by Location 146 Table 9.7: Mean Scores by State on the Content across States 147 Table 9.8: Distribution of Mean Score by State on the Behavioural Objectives 149 Table 9.9: Relationship between Achievement and Level of Assistance with Homework in Basic Science and Technology 150 Table 9.10: Level of Availability of Learning Materials as Related to Achievement in Basic Science and Technology 152 Table 9.11: Level Out of School Non Learning Engagement and Performance in Basic Science and Technology 153 Table 9.12: Occupation of Father as Related to Achievement in
Basic Science and Technology 154 Table 9.13: Occupation of Mother as Related to Achievement in Basic Science and Technology 155

xviii
Table 9.14: Normal Means of Going to School as Related to Achievement in Basic Science and Technology 157 Table 9.15: Distance between Learners‟ Home and School as Related to Achievement in Basic Science and Technology 158 Table 9.16: Number of Meals Per Day as Related to Achievement in Basic Science and Technology 159 Table 9.17: Learners‟ Possession of Textbook on Basic Science and Technology as Related to Achievement 161 Table 9.18: Liking Teacher and Achievement in Basic Science and Technology 162 Table 9.19: Liking Schooling and Achievement in Basic Science and Technology 163 Table 10.1: Distribution of Mean and Standard Error of Achievement in Multiple Choice and Essay Tests by Location, Type of School and Gender Social Studies 166 Table 10.2: Distribution of Mean and Standard Error of Achievement in Multiple Choice and Essay Tests for Geopolitical Zones by Gender 167 Table 10.3: Distribution of Mean and Standard Error of Achievement in Multiple Choice and Essay Tests for Geopolitical Zones by Location 168 Table 10.4: Mean Scores in Essay Based on Gender across States 173 Table 10.5: Mean Scores in Multiple Choice and Essay Based on Location across States 175 Table 10.6: Distribution of Mean Scores by State on Content across States 176 Table 10.7: Distribution of Mean Score by State on the Behavioural Objectives 178 Table 10.4.1: Homework Assistance as Related to Achievement in Social Studies 179 Table 10.4.2: Level of Availability of Learning Materials and Achievement in Social Studies 181 Table 10.4.3: Out of School Non Learning Engagements as Related to Achievement in Social Studies 182 Table 10.4.4: Occupation of Father as Related to Achievement in Social Studies 183 Table 10.4.5: Occupation of Mother as Related to Achievement in Social Studies 185 Table 10.4.6: Normal Means of Going to School as Related to Performance in Social Studies 186 Table 10.4.7: Distance between Learners‟ Home and School as Related to Achievement in Social Studies 187 Table 10.4.8: Number of Meal Daily as Related to Achievement in Social Studies 189 Table 10.4.9: Learners‟ Possession of Textbook on Social Studies and Achievement of Learners 190 Table 10.4.10: Liking of Teacher as Related to Achievement in Social Studies 191 Table 10.4.11: Liking Schooling as Related to Achievement in Social Studies 193

xix
List of Acronyms and Abbreviations
ACE - Associate Certificate in Education
CCT - Classical Test Theory
DFID - Department for International Development
EFA - Education for All
FCT - Federal Capital Territory
FGN - Federal Government of Nigeria
FME - Federal Ministry of Education
FSLC - First School Leaving Certificate
GCE - General Certificate of Education
ICT - Information and Communication Technology
IRT - Item Response Theory
IRTPRO - Item Response Theory for Patient-Reported Outcomes
ISCED - International Standard Classification of Education
JAMB - Joint Admission and Matriculation Board
JSS - Junior Secondary School
LGEA - Local Government Education Authority
MDGs - Millennium Development Goals
NALABE - National Assessment of Learning Achievement in Basic Education
NAUBEP - National Assessment of Universal Basic Education Programme
NCCE - National Commission for Colleges of Education
NCE - Nigeria Certificate in Education
NECO - National Examinations Council
NERDC - Nigerian Educational Research and Development Council
NTI - National Teachers Institute
NYSC - National Youth Service Corp
PEP - Primary Education Project
PISA - Programme for International Student Assessment
PTA - Parent–Teachers Associations
SDGs - Sustainable Development Goals
SPSS - Statistical Package for Social Sciences
SSCE - Secondary School Certificate Examination
SUBEBs - State Universal Basic Education Boards
TIMSS - Trends in International Mathematics and Science Study
UBE - Universal Basic Education
UBEC - Universal Basic Education Commission
UBEP - Universal Basic Education Programme
UNESCO - United Nations Educational, Scientific and Cultural Organization
UNICEF - United Nations Children Education Fund
WAEC - West African Examination Council

1
Section One: Background and Methodology
Chapter One
Background of the Study
1.1 Introduction
Quality has been a major concern in the provision of Basic Education in Nigeria as far
back as the colonial period. However, it is one educational challenge that continues to
elude developing countries ostensibly because of the complexity that is involved in
ensuring that it is achieved. Universal Basic Education in Nigeria is an all-inclusive
right-based policy reform which had to contend with meeting the Education For All
(EFA), Millennium Development Goals and the more contemporaneous Sustainable
Development Goals and targets. It has been acknowledged that the access targets of the
first two global initiatives have been almost half-way realised in Nigeria, although a lot
more challenges remain elusive. Furthermore, it is on record that there has been
appreciable increase in government investment in Basic Education lately with a
corresponding increase in the same by the donor community. However, this has not
translated into any remarkable improvement in quality learning outcomes in the nation‟s Basic Education sub-sector.
Since the last National Assessment in 2011, a number of policy changes and fairly robust
financial investment have been witnessed in this sub-sector. It is only expedient therefore
to embark on yet another exercise with the view to appreciating the extent to which these
interventions have impacted on learning outcomes. In other words, do the Ministerial and
Commission‟s UBE related policies and increased funding have any positive impact on the classroom activities with consequential effect on improved quality of learning
outcomes on a more sustainable basis?
1.2 National Assessment
Conceptually, National Assessment is a procedure that is used to assess students‟ learning at the system level. It is variously referred to as learning assessment, system
assessment, assessment of learning outcomes, or national /international assessment. It is
applied to a survey of schools and students that is designed to provide evidence about
learners‟ achievements in identified curriculum areas, such as reading/literacy, mathematics/numeracy, science and other skills, for a clearly defined part of the
education system.
Assessment entails measurement of learning, analysis to diagnose problems, and use of
the findings to guide remedial action. An effective national assessment policy demands
real political commitment to action based on results, such as reallocation of resources,
curriculum reform and/or reorientation of teaching. The overriding goal is to learn more
about factors that influence learners‟ attitude and achievement which may be
2
manipulated to bring about improvement in attitudes and achievement, or efficiencies in
the education system. Large-scale assessments by themselves cannot result in quality
improvement, unless the system is ready to reflect on the findings and use them for
improving the quality of teaching and learning.
The typical outcome of most national surveys of educational progress are: i) a detailed
description of the knowledge and skills possessed by learners of a particular age or grade
level in a given domain, and ii) a further description of contextual variables believed to
be related to the former, and within each group of measures. The outcome as well as
further analysis of the data collected facilitates comparison of achievements with local
standards, monitoring of progress over time, comparison between various population
groups and delineation of possible correlates of achievement.
1.3 The 2017 National Assessment of Basic Education (NALABE)
1.3.1 Rationale
From its inception in 2001, when NALABE was conducted by the Universal Basic
Education Commission, it has officially been a triennial large-scale survey, which
attempts to evaluate the Basic Education sub-system in Nigeria. The Commission had
previously conducted four studies, in 2001, 2003, 2006 and 2011 respectively. Although
in the ensuing years, the triennial cycle was disrupted partly because of paucity of funds
and frequent changes in the Commission‟s leadership, nonetheless, the urge for
conducting a large scale system assessment has never veered.
Unlike the previous Basic Education assessments, the 2017 exercise assessed learners in
the two senior classes of the two levels of the programme in all of the four core subjects.
Thus, the 2017 NALABE assessed 43,200 learners in primary classes five and six;
17,280 learners in junior secondary school classes two and three; in Mathematics,
English Studies, Basic Science and Technology and Social Studies. In addition, 38,880
parents; 3,888 and 1,512 headteachers respectively in primary and junior secondary
schools participated in the exercise. However, like the previous assessments, the 2017
NALABE also assessed the impact of the characteristics of learners and their parents,
teachers and headteachers on Basic Education development, in addition to providing a
framework for systemic “health check” for policy implementation and school improvement.
1.3.2 Objectives
The aim of the NALABE 2017 is to assess the level of achievement of primary and junior secondary school learners in Nigeria in four core subjects, English Studies, Mathematics, Basic Science and Technology and Social Studies with a view to identifying gaps and diagnose aspects of policy and practice that need improvement. Specifically the objectives of the study are to:
i) assess level of achievement of learners in primary classes 5 and 6 and JSS classes 2 and 3 in the four core subjects of English Studies, Mathematics, Basic Science and Technology and Social Studies; and
3
ii.) assess contextual variables that might be used as explanatory variables for the levels of achievement attained acquired in the various areas of the core subjects.
1.3.3 Focus
The 2017 NALABE focused on both the aggregate performance of learners and item-
level data at each of the class levels. Data on aggregate performance were provided on
state and national levels, whereas data on item-level performance were provided on a
national level only. State level aggregate performance data provided reference data
(norms) which each state could use for planning purposes and monitoring
performance of learners in future assessments.
The 2017 assessment, like others before it, also focused on non-cognitive
characteristics of learners, teachers, head teachers and parents, as well as the influence
of some explanatory variables on the learners‟ aggregate performance (relational analyses).
1.3.4 Scope
This study covered the last two classes of primary and junior secondary levels of Basic Education in Nigeria. Learners were assessed on the aforementioned four content of subject areas. Furthermore, non-cognitive measures were also obtained using the questionnaires for the learners, teachers, head teachers and parents at both Basic Education in our country.

4
Chapter Two
Methods and Procedures
2.1 Project Design
This chapter provides technical details on methods and standard procedures undertaken to
ensure that results of the survey are reliable, comparable across States and reflect differences
in the achievement of learners measured within schools and across States.
NALABE 2017, as in previous studies and some international large scale assessments used a
variety of instruments to obtain measures of what learners know and can do in the
classrooms, after interactions with teachers and instructional materials. Large-scale
assessments are usually of the survey type research involving large and representative
samples that are not subjected to experimental manipulations but focusing on after the fact
observations and collection of measurements.
2.2 Sample Design
2.2.1 Populations Investigated
The target population used in the SURVEY was described as level 1 in accordance with
UNESCO‟s International Standard Classification of Education, ISCED 2011(ISCED, 2012) which describes the full range of schools from pre-primary (level 0) to doctoral level (level
8). Level 1 corresponds to the first stage of basic education in the Nigerian system “which coincides with the transition point in an educational system where systematic teaching and
learning in reading, writing and mathematics begin” (UNESCO, 2012, p.30). Specifically, the target population: Junior Secondary two i.e. all students enrolled in this class that represent 8
years of schooling counting from the first year of ISCED level 1;
All learners in this target population were exposed to the same National Curriculum and
instructional experiences, and were therefore eligible to participate in the survey. Box 1
provides National Education Statistics for the Primary subsystem. Also in Box 1, the statistics
of the population assessed were segregated from the national data.
Box 1: National Education Statistics.
Number of Junior Secondary schools: 12,570
Student Enrolment: 5,330,606
Male: 2,781,334 (52 percent)
Female: 2,549,272 (48 percent)
Teachers: 20,294
Males: 10,838 (53 percent)
Females: 9,456 (47 percent)
Sub- Populations
Junior school Two: 1,711,370
Males: 923,249 (53.4 percent)
Females: 803,135 (46.6 percent)

5
2.2.2 Sampling Procedures for Representativeness
A four stage sampling design was employed in the selection of schools‟ classrooms and
learners. The sampling frame of each population provided basis for selection. The
Commission has a robust quality assurance structure with offices in the 36 states and the
FCT. The states offices updated the sampling frame for the population prior to sampling.
In the first stage, six Local Government Education Authorities (LGEAs) were randomly
selected from each of 35 States while Bayelsa and the FCT had three each. The LGEAs were
stratified into urban and rural locations. In each of the 35 States, selection ensured equity
participation of urban and rural schools whereas participation in FCT and Bayelsa was in the
ratio 2:1 in favour of urban location. Stratification was to ensure the inclusion of all segments
of the populations. The decision to sample 50 percent of LGEAs in Bayelsa and the FCT was
one of numbers, since the two States have eight and six LGEAs respectively.
The second stage of sampling focused on the selection of schools. Two JS schools with at
least 20 learners in a class (this is to be sure there were no schools with less than 20 learners
in JS 2 especially in the rural schools) were randomly sampled in each of the 35 States and
one each from FCT and Bayelsa. Therefore, from each of the 216 LGEAs, two schools (one
urban and one rural) were randomly selected.
At the third stage, that is, school level sampling, a class was randomly selected from the
number of streams in the school six. At the fourth stage, random sampling was undertaken to
select 15 learners where there were more than 15 learners in the selected classes.
Box 2: Sampled Statistics from the Population of LGAs, Schools, Classes and Learners
LGEAs: 216
Junior Schools: 432
JS 2 Classrooms: 432
Students: 8,640
Parents: 6,480 (15 per class)
2.2.2.1 Sample Size Determination
Sample size determination and representativeness are central to the effective generalisation
and comparability of results across the populations surveyed in the country of study and out-
countries. After much deliberation by Technical team, the following standards were agreed
upon:
Box 3: Sampling Statistics
Margin error of estimate set at 0.031
Confidence interval = 95 percent
Standard Deviation for Primary = 2.289
Calculations
ME = t S/√n
Where
ME = Margin Error
t = t distribution score
Junior Secondary Class Sample
0.031 = 1.96 x 1.41/√n
0.031√n = (1.96 x 1.41) √n = (1.96 x 1.41)/0.031
= 7953.874

6
n = sample size Sample per State = 7953.874/36
= 220.941 = 240 (Approx.)
Samples in each of Bayelsa and FCT = 120
Sample in each of the remaining 35 State = 240
Responses on Mathematics were used because it is a high stake subject where large variance
is always observed.
The team decided to increase sample size in each of the 36 states to 240 from the estimated
220.94, which consequently increased the national sample to 8,640. Therefore, the
statistically representative sample was 8,640 for Junior secondary school populations.
Ensuring how a sample represents the population where it is drawn remains a challenge in
carrying out assessment surveys. However, NALABE 2017 adapted TIMSS 2015 sampling
approach to select participants to ensure the credibility of the results and findings. To obtain
estimates of learners‟ proficiency in Basic Science and Technology, English Language, Mathematics and Social Studies, simple random sampling technique was used to sample
learners from 36 states and Federal Capital Territory. To deal with envisaged uncertainty in
the reported statistics, such as the means and percentages computed to estimate population
parameters, sampling errors were also estimated. Each statistics, especially the mean in the
NALABE Reports is accompanied by an estimate of its standard error. For statistics reporting
learners‟ achievement, which are based on plausible values, standard errors play important roles. An approach that reflects the uncertainty due to generalising from learners samples to
the entire populations, referred to as sampling variance was used in this survey. The second
approach that reflects uncertainty due to inferring learners‟ achievement on the entire
assessment from achievement on the subset of items, known as imputation variance, was not
adapted because its methodology made provisions for every pupil/learner to take the entire
Test on every subject.
For parameter estimates of variables that are not plausible values, standard errors are based
entirely on sampling variance. For estimating sampling variance, NALABE 2017 made
extensive use of probability sampling to derive achievement results from national samples of
learners across States. The rationale behind this was that, many such samples are possible but
only one sample is drawn, some uncertainty about how well the sample represents the
population is to be expected. The uncertainty caused by sampling learners from a target
population, known as sampling variance, had been taken care of in reporting through the
estimation of standard errors. From the sampled results, the maximum average standard error
estimated across the four classes was 0.74, an indication of how close each sample was, in
representing its own population. It also authenticates the validity of the intended results.
2.2.3 Instruments Development
Achievement Tests Items: The following steps were undertaken:
1. a review and updating the frameworks of curriculum content domains for the subjects:
English studies, Social Studies, Basic Science and Technology and Mathematics;
2. a review of item bank from past assessment cycles;

7
3. developing items and scoring guides in accordance with the specifications of content and
cognitive domains in the frameworks;
4. conducting trials of the items on equivalent samples and conducting item analysis; and
5. selecting items from step 4 and a pool of existing items in the item bank.
These processes started in June 2014 and involved Assessment Unit staff in the Commission,
experienced measurement experts and subject specialists from the universities, which were
concluded in April 2017. Steps 1 and 2 were fairly straightforward since there were no
changes in the national curricula for the subjects tested. Also, the item bank was secured for
current use.
2.3.2 Developing Items and Scoring Guides
The item writing experts for the four subjects had three workshops during which extensive
examination of the content of previous tests, weight assigned to topics and cognitive
domains, percentage of weight assigned to topics, themes and domains for both Multiple
Choice tests and constructed response items. In addition, the Item Writing Guidelines
provided “streetwise” information for writing items and scoring in order to obtain good
measurements from the field. As has been the practice, twice the number of items required in
each test for the main assessment were developed for the trial testing version for each subject
and their corresponding populations. As a consequence, 1,280 items for the Multiple Choice
tests items and 256 items for the constructed response component were selected from the
pool. The item writing tasks generated a minimum of 250 items for each subject and target
populations. However, it is noteworthy that Tables of specifications developed for each test
are presented in Appendices 2.1 to 2.9.
2.3.2.1 Pilot Trial of the Items
Field test items, 80 for each subject and population, were administered on equivalent samples
of the population in five schools and in four states. In all, 1,018 Multiple Choice test
responses and 50 constructed response scripts were obtained for each Test.
Table 2.1 Test Characteristics
S/N Subject Number of
test forms
Number
of items KR 20
1 English Studies 5 259 From 0.698 to 0.725
2 Mathematics 4 204 From 0.681 to 0.771
3 Basic Science and Technology 3 169 From 0.687 to 0.792
4 Social Studies 7 386 From 0.782 to 0.827
The scripts for constructed response items were used for intensive training of practising
subject teachers for marking responsibilities by the subject specialists. Indeed, the majority of
the teachers have varied years of experience in marking responsibility with the West African
Examination Council (WAEC) and the National Examinations Council (NECO). Several
trials and moderations achieved a minimum inter marker reliability of .88.

8
The field test results were used by the Technical team to examine the item statistics. Several
items which had weak measurement properties were eliminated. For some subjects, surviving
items were less than 40 and as such the technical team revisited the reserved pool of items to
select items and compose a test booklet for each subject. Again, such versions were filtered
through the field testing and item analysis processes. On the whole, 16 text booklets were
developed for the four subjects.
Development of Context Questionnaires
The development of four context questionnaires for pupils/learners, teachers, head-teachers
/principals and parents was similar to the tests. Reliability estimates ranged from 0.78 – 0.89.
2.4 Data Administration Plan
The plan had three inclusive components:
1. The Technical Committee for the project meticulously selected 1,512 Test administrators
from the Commission, State Education Boards, Local Government Education Authorities
and the National Youth Service Corps
2. A comprehensive Test Administration Manual was developed on which test
administrators received intensive training in the mechanics of collecting data from the
participants. Several trial sessions were held to ensure high quality data collection
3. Each test administrator was assigned to a school with the responsibility of administering
the 16 test booklets and questionnaires for learners, teachers, head teachers/principals and
parents in five working days. The instruments were administered in four days. The fifth
day was for collation and follow up on outstanding response sheets and instruments.
2.4.1 Quality Assurance
The following actions and processes were undertaken to ensure technical objectivity and
reliability of the measurements obtained from the data collection, data management and
analysis:
2.4.1.1 Data Administration
Participation rates were determined prior to the field work as follows:
I. A minimum participation rate of 85 percent of the originally sampled schools,
II. A minimum class participation rate of 95 percent from the originally sampled
schools,
III. A minimum learners‟ participation rate of 85 percent from sampled schools or
IV. Minimum combined schools, classrooms and learners‟ participation rate of 75percent
based on originally sampled schools.

9
2.4.1.2: Data Administration Monitoring
Teams of experts from the academia, development partners and civil societies were engaged
in the quality monitoring processes. Each sampled school had unscheduled visits from the
monitoring teams and local education officers.
The extensive and robust test administration and monitoring procedures were designed to
ensure consistency across states and schools such that differences in achievement will not be
attributable to factors unrelated to achievement. Furthermore, precision in data collection and
submission from field staff were effectively managed to minimise both systematic and
random error sources. Specifically, test administrators and monitors ensured similar testing
environments. Increased precision improves the quality of results and the confidence placed
on the statistical analyses. Indeed, consistent administration procedures and precision of data
from a representative sample strengthened the power to generalise that the results accurately
reflect achievement levels of learners in the four target populations.
2.4.1.3: Data Management
The responsibility of data collation, sorting and entry was assigned to staff of the ICT unit of
the Commission. Although some key staff of the Unit have 12- 15 years experience in data
entry processes, a data management and analysis agency was contracted to work with the in-
house team to ensure parsimony of the database for objective analysis. Data entry plans of the
Commission and data analysis plan from the outside agency were harmonised and used to
scrutinise the data. The sessions resolved issues of missing files, inappropriate entry codes
and “out of the world” entries, thereby ensuring that only clean files were used for analysis.
Furthermore, the Commission‟s technical team spent two working days monitoring the data
analysis procedures of the contract agency. As expected in large scale data management,
several issues were observed and resolved. In few cases, the ICT Unit had to undertake a
review of field data for some schools.
The last phase of data management standards and Quality Assurance had in attendance
technical staff of the Commission, data management and analysis agency and the team
contracted to write the reports. At the two-day workshop, fresh issues were thrown up and
resolved to the satisfaction of all parties.
Computation of Achieved Sample
S/N Criteria (PISA, OECD
Standards 2015) Proposed Achieved
percent
Achieved
1 A minimum participation rate of 85 percent of the originally sampled school
432 428 99.07
2
A minimum class participation rate of 95 percent from the originally sampled schools
432 428 99.07
10
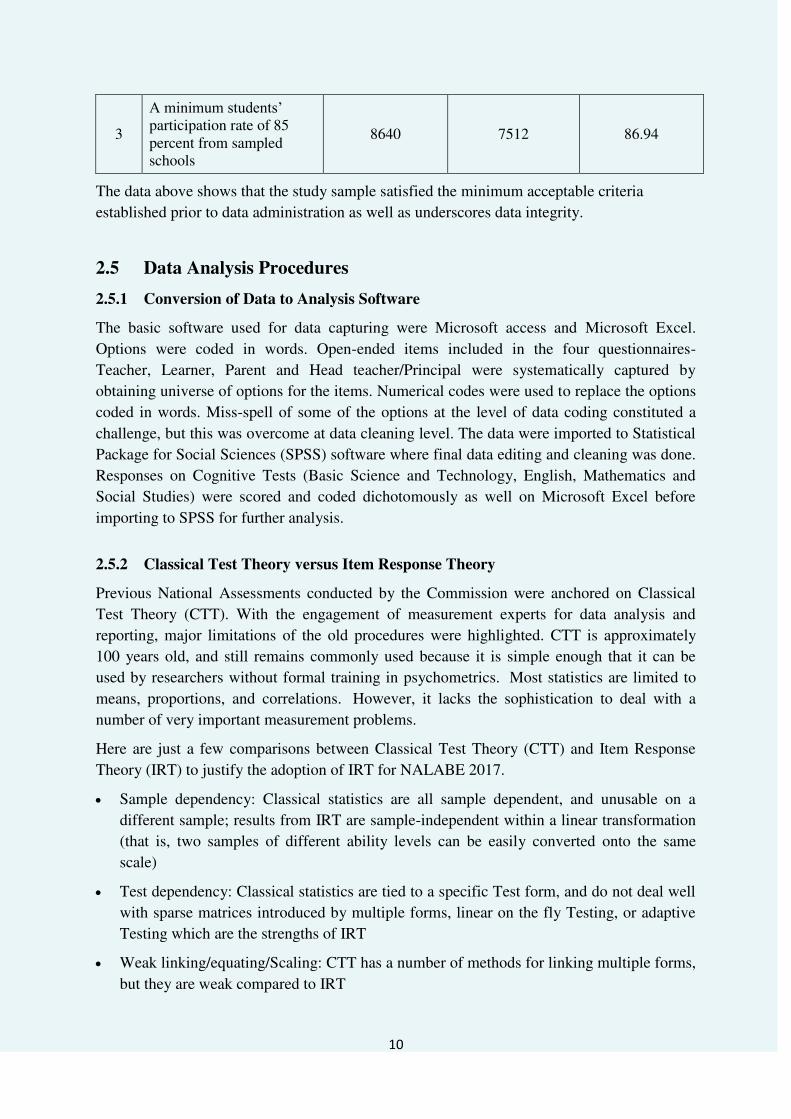
3
A minimum students‟ participation rate of 85 percent from sampled schools
8640 7512 86.94
The data above shows that the study sample satisfied the minimum acceptable criteria
established prior to data administration as well as underscores data integrity.
2.5 Data Analysis Procedures
2.5.1 Conversion of Data to Analysis Software
The basic software used for data capturing were Microsoft access and Microsoft Excel.
Options were coded in words. Open-ended items included in the four questionnaires-
Teacher, Learner, Parent and Head teacher/Principal were systematically captured by
obtaining universe of options for the items. Numerical codes were used to replace the options
coded in words. Miss-spell of some of the options at the level of data coding constituted a
challenge, but this was overcome at data cleaning level. The data were imported to Statistical
Package for Social Sciences (SPSS) software where final data editing and cleaning was done.
Responses on Cognitive Tests (Basic Science and Technology, English, Mathematics and
Social Studies) were scored and coded dichotomously as well on Microsoft Excel before
importing to SPSS for further analysis.
2.5.2 Classical Test Theory versus Item Response Theory
Previous National Assessments conducted by the Commission were anchored on Classical
Test Theory (CTT). With the engagement of measurement experts for data analysis and
reporting, major limitations of the old procedures were highlighted. CTT is approximately
100 years old, and still remains commonly used because it is simple enough that it can be
used by researchers without formal training in psychometrics. Most statistics are limited to
means, proportions, and correlations. However, it lacks the sophistication to deal with a
number of very important measurement problems.
Here are just a few comparisons between Classical Test Theory (CTT) and Item Response
Theory (IRT) to justify the adoption of IRT for NALABE 2017.
Sample dependency: Classical statistics are all sample dependent, and unusable on a
different sample; results from IRT are sample-independent within a linear transformation
(that is, two samples of different ability levels can be easily converted onto the same
scale)
Test dependency: Classical statistics are tied to a specific Test form, and do not deal well
with sparse matrices introduced by multiple forms, linear on the fly Testing, or adaptive
Testing which are the strengths of IRT
Weak linking/equating/Scaling: CTT has a number of methods for linking multiple forms,
but they are weak compared to IRT

11
Measuring the range of learners: Classical Tests are built for the average learner, and do
not measure high or low learners very well; conversely, statistics for very difficult or easy
items are suspect. IRT offers opportunity to extremely high and low ability Testees to
exhibit their proficiency.
Lack of accounting for guessing: CTT does not account for guessing on Multiple Choice
examinations whereas IRT does.
Scoring: Scoring in classical Test theory does not take into account item difficulty. Each
item is assumed to have equal difficulty whereas it is not so. IRT allows for estimating
the difficulty of each item and build the same into individual score.
Anchor Items: CTT is sample dependent, hence linking scores using anchor items is not
practicable but using Anchors item under IRT to allow for future prediction is feasible.
2.5.2.1 Adoption of Item Response Theory (IRT)
Item Response Theory (IRT) provides a score scale that is more useful for many purposes
(e.g., for the construction of developmental scales or for the calibration of tests comprising
different types of items or exercises). Its usage also extends to sum score, percentage correct,
or percentile scales. IRT family provides models for which the summed score is a sufficient
statistics for the characterisation of the latent variable (𝛉) (Masters & Wright, 1984; Rasch,
1960). In IRT models, each response pattern is usually associated with a unique estimate of 𝛉. These estimates of 𝛉 can be used as scaled response pattern scores; with the advantage of
extracting all information available in the item responses, especially if the model is
appropriate for the data. In addition, the IRT model produces estimates of the probability that
each response pattern will be observed in a sample from a specified population. However, it
is often desirable to consider the implications of IRT analysis for summed scores, rather than
response patterns in applied measurement contexts. For example, in a large-scale testing
program it may be desirable to tabulate the IRT scaled scores associated with each summed
score on operational forms, using item parameter estimates obtained from item data.
Measurement experts evaluated a good number of IRT software to estimate item parameters
and the scoring for each testee. Two IRT software were adopted: NOHAM to establish the
dimensionality of each test and IRTPRO 3 for estimations and scoring. The efficacy of IRT
over the normal Classical approach became obvious from the sample analysis.
For the two models, the same approach-percentile approach was used for the classifications
into Low (0 to 25th), moderate (Above 25th to 75th) and High (Above 75th to 100th). There
were 305 scores Classical Test Theory (CTT) categorised as low but IRT classified them as
moderate. Also 393 classified as moderate by CTT but High by IRT. IRT therefore generates
true scores than CTT.
The implication of this is that Item Response Theory method of scoring produced different
test scores for learners‟ who have the same raw scores under the classical test theory method. The differences observed in the test scores of the learners‟ under the item response theory
method of scoring emanates from the disparity in the discrimination and difficulty indices.

12
Item statistics are always taken into consideration in the process of estimating learners‟ Test scores under Item Response Theory scoring method.
2.5.2.2 Predicting Future Achievement Using IRT
NALABE 2017 has introduced a new dimension to assessment in Nigeria. Anchor items were
built into cognitive tests for the four populations sampled across the four core subjects (Basic
Science and Technology, English, Mathematics and Social Studies). Iyala (2009) proposed
two variants of the anchor-item non-equivalent groups design. This will allow for comparing
achievements for different years and also provides opportunity for future prediction of
achievement. The first variant, internal common items, includes the achievement on the
common items part of the observed score. In the second variant, external common items, the
individuals‟ achievement on the common items is not considered part of their observed scores. It is believed that when administering the external common items, achievement can be
influenced by fatigue, motivation, learning, practice and so on due to the fact that their
administration always come outside that time for actual form of the test. Considering the
appropriateness of internal common items in linking and predicting scores, NALABE 2017,
adopted internal approach. This will serve as a strong foundation for the next NALABE
survey and also enhance achievement comparison, progress tracking and future achievement
prediction.
2.5.3 Descriptive Statistics
Descriptive statistics were used to describe the basic features of the data in this study. They
provide simple summaries about the sample and the measures. Together with simple graphics
analysis, they form the basis of virtually every quantitative analysis of data. The basic
components of descriptive statistics used in this study were: mean, standard error of mean,
percentages and graphs.
2.5.3.1 Mean and Standard Error of Mean
The "mean" is the "average” where you add up all the numbers and then divide by the
number of numbers. A standard error is the standard deviation of the sampling distribution of
a statistic. Standard error is a statistical term that measures the accuracy with which a sample
represents a population. In statistics, if a sample mean deviates from the actual mean of a
population; this deviation is the standard error. With the systematic approach adopted, the
estimated mean for each of the State is likely to be close to the population mean on each of
the subjects investigated- Basic Science and Technology, English, Mathematics and Social
Studies. Standard errors of mean are expected to be minimal, as confirmation for sample
means being true representatives of population means.
13
Chapter Three
Learners’ Home and Support
3.1 Introduction
The home is the first place available for children to learn, it thus prepares the learners for
school and exerts great influences on their social development. The home and
neighbourhoods are complex social environments which intricately interact and impact
positively or otherwise on the growth, development and school performance of learners. The
learner inherits the genetic makeup of parents that is nature, while the various environments
that is nurture, have tremendous influences on inherited traits. The best genetic inheritance is
nurtured in sustainable environments where there is demonstrable parental love and care,
stable family life, social and educational support, sense of encouragement, safety and
security. A weak home without environmental support throws up a poorly prepared and
demotivated learner from home to school.
3.2 Background Information
This section describes the socio-demographic characteristics of the learners and the parents. Pieces of information were obtained from Parent, Learner and Teacher Questionnaires. The
pool of items consists of 16 items from Learner Questionnaire, 14 items from Parent Questionnaire, and three items from Teacher Questionnaire. The results set out in various graphs provide some salient observations on the homes of learners. The achieved sample for this class of learners was 7,512 and comprised 52.4 percent males and 46.1 percent females while
1.5 percent did not respond to the item. A majority (86 percent) of the learners were living with their parents while few (only 0.5 percent) were living alone. Parents‟ sample was 5,277, of which 63.3 percent were fathers or male guardians and 35.5 percent were mothers or female guardians. In respect of parental qualifications, 10.8 percent had no formal education; 45.5 percent had below NCE; 11.1 had either NCE or HND; while 9.3 percent had first degree and above. However, 20.3 percent did not respond on qualification. Information about the learners‟ home and support was obtained from 850 teachers (57.9 percent males and 42.1 percent females). Figure 3.1 shows that
0 10 20 30 40
No Response
Two Room Apartments
One Room Apartment
Flat
Duplex
0.5
28.6
35.7
13.5
19.5
2.2
Figure 3.2: Types of Residence
05
1015202530
27.2 22.3
25.5
12.1 11.4
1.5
Figure 3.1: Distribution of Parents / Guardians
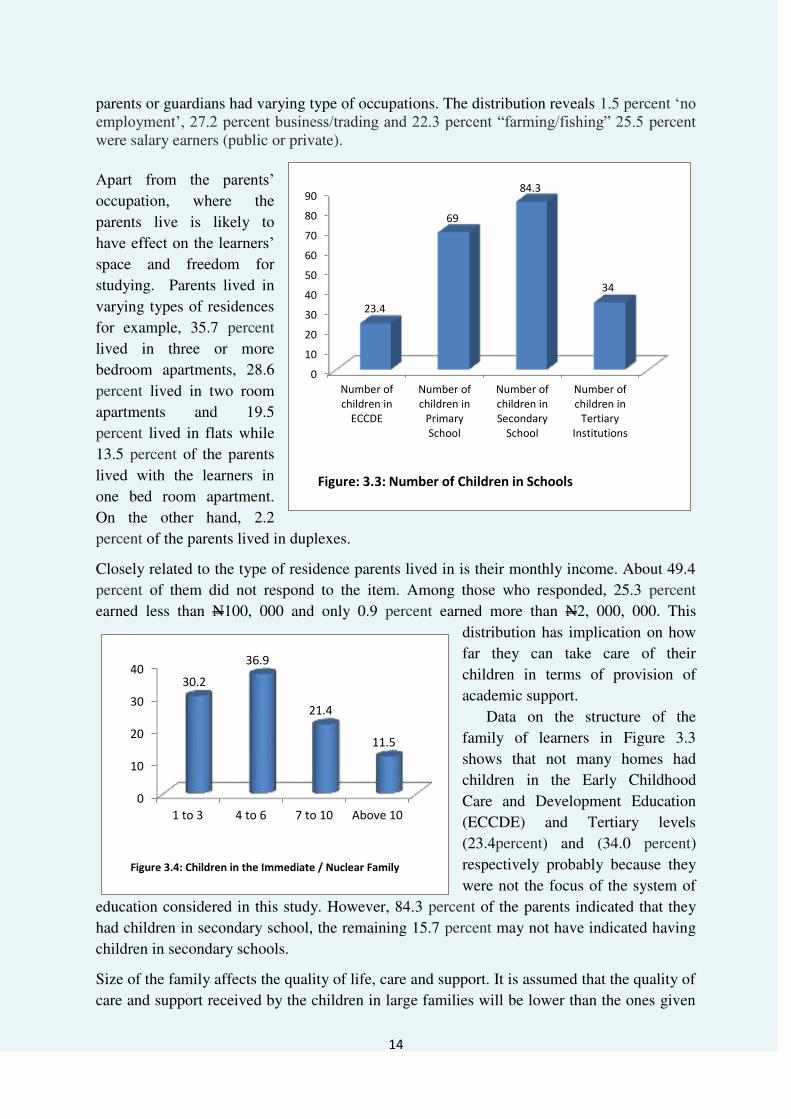
14
parents or guardians had varying type of occupations. The distribution reveals 1.5 percent „no employment‟, 27.2 percent business/trading and 22.3 percent “farming/fishing” 25.5 percent were salary earners (public or private).
Apart from the parents‟ occupation, where the
parents live is likely to
have effect on the learners‟ space and freedom for
studying. Parents lived in
varying types of residences
for example, 35.7 percent
lived in three or more
bedroom apartments, 28.6
percent lived in two room
apartments and 19.5
percent lived in flats while
13.5 percent of the parents
lived with the learners in
one bed room apartment.
On the other hand, 2.2
percent of the parents lived in duplexes. Closely related to the type of residence parents lived in is their monthly income. About 49.4
percent of them did not respond to the item. Among those who responded, 25.3 percent
earned less than N100, 000 and only 0.9 percent earned more than N2, 000, 000. This
distribution has implication on how
far they can take care of their
children in terms of provision of
academic support.
Data on the structure of the
family of learners in Figure 3.3
shows that not many homes had
children in the Early Childhood
Care and Development Education
(ECCDE) and Tertiary levels
(23.4percent) and (34.0 percent)
respectively probably because they
were not the focus of the system of
education considered in this study. However, 84.3 percent of the parents indicated that they
had children in secondary school, the remaining 15.7 percent may not have indicated having
children in secondary schools. Size of the family affects the quality of life, care and support. It is assumed that the quality of
care and support received by the children in large families will be lower than the ones given
0
10
20
30
40
50
60
70
80
90
Number of
children in
ECCDE
Number of
children in
Primary
School
Number of
children in
Secondary
School
Number of
children in
Tertiary
Institutions
23.4
69
84.3
34
Figure: 3.3: Number of Children in Schools
0
10
20
30
40
1 to 3 4 to 6 7 to 10 Above 10
30.2
36.9
21.4
11.5
Figure 3.4: Children in the Immediate / Nuclear Family

15
in a small family size. The responses in Figure 3.4 indicate that in some immediate / nuclear
families, 30.2 percent have between 1 and 3 children, 36.9 percent of some families with 4 to
6 children while as high as 21.4 percent of the respondents were from homes whose families
had 7 to 10 children. There were up to 11.5 percent families with more than 10 learner
children.
3.3 Types of Support from Home
Although, the provision of textbooks in the core subjects (English studies, Mathematics,
Basic Science and
Technology and
Social Studies) has
been taken over by
the Universal Basic
Commission (UBEC)
in order to reduce the
burden on the
parents, it is the
responsibility of the
parents and learners
to make sure the books are in good condition and not stolen or misplaced. This study shows
that 38.7 percent, 45.6 percent, 54.3 percent and 58.6 percent did not have textbooks in
English, Mathematics, Social studies
and Basic Science and Technology
respectively. It seems that learners who
used the books previously and were to
return them to their respective schools
failed to do so, thereby denying others
access to the books.
Apart from the textbook availability, the
parents also assisted the learners in their
homework. Homework enhances
teaching and learning and provides avenue through which the school works with the home in
opening new horizon for learning and reinforcing what has been learnt using the textbooks.
As can be seen in Table
3.2, 55.2 percent of the
learners received ‘very much’ assistance with
homework from their
parents, 14.4 percent
received ‘much’ assistance, 11.6 percent
received moderate
assistance while 9.5
Table 3.1 Number of Students with Textbooks in Core Subjects
English Mathematics Social
Studies
Basic science
and
technology
Freq.
perc
ent Freq.
perce
nt Freq.
perc
ent Freq. percent
No 2904 38.7 3423 45.6 4078 54.3 4400 58.6
Yes 4233 56.3 3494 46.5 2726 36.3 2222 29.6
No
Response 375 5 595 7.9 708 9.4 890 11.8
Table 3.2 Assistance on Homework by Parents
Frequency percent
Not at all 711 9.5
Moderate 871 11.6
Much 1084 14.4
Very Much 4143 55.2
No Response 703 9.4
Total 7512 100
Table 3.3 Educational Facilities Provided
Facilities
Provided Not Provided
f percent f percent
Computer 842 16 4435 84
TV 3127 59.3 2150 40.7
Radio 3227 61.2 2050 38.8
Video 1794 34 3483 66
Reading Room 3526 66.8 1751 33.2
Internet 392 7.4 4885 92.6
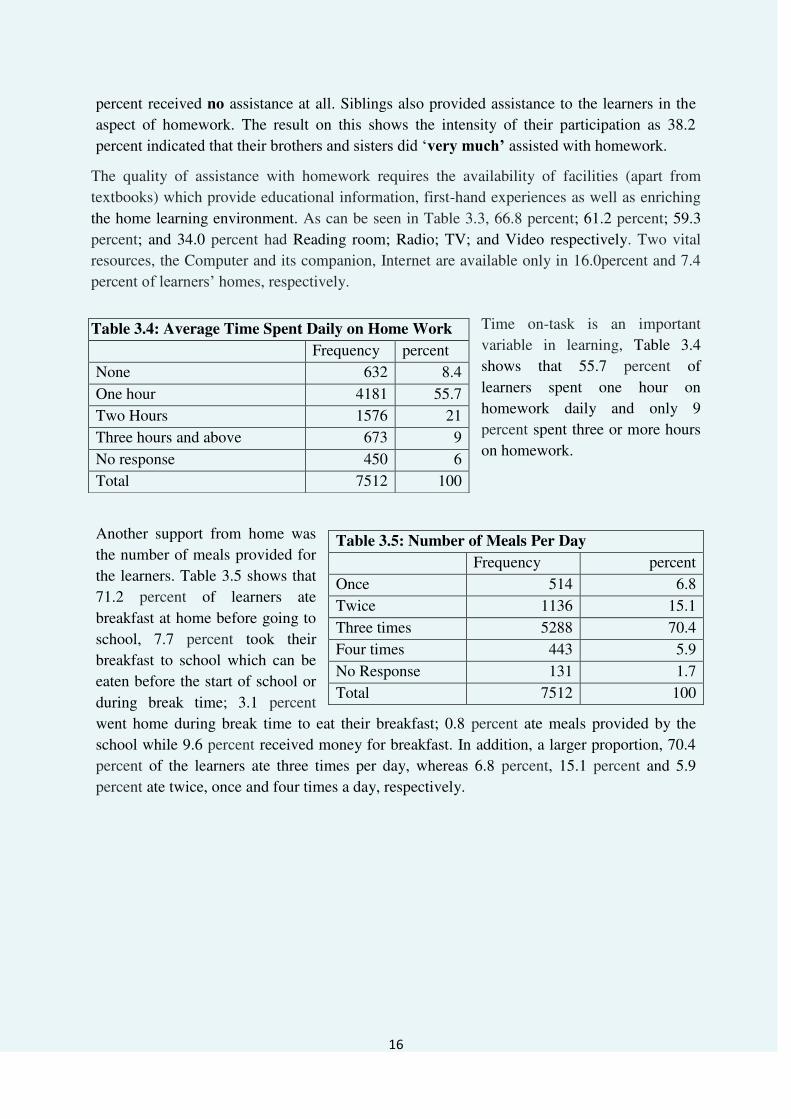
16
percent received no assistance at all. Siblings also provided assistance to the learners in the
aspect of homework. The result on this shows the intensity of their participation as 38.2
percent indicated that their brothers and sisters did „very much’ assisted with homework. The quality of assistance with homework requires the availability of facilities (apart from
textbooks) which provide educational information, first-hand experiences as well as enriching
the home learning environment. As can be seen in Table 3.3, 66.8 percent; 61.2 percent; 59.3
percent; and 34.0 percent had Reading room; Radio; TV; and Video respectively. Two vital
resources, the Computer and its companion, Internet are available only in 16.0percent and 7.4
percent of learners‟ homes, respectively.
Time on-task is an important
variable in learning, Table 3.4
shows that 55.7 percent of
learners spent one hour on
homework daily and only 9
percent spent three or more hours
on homework.
Another support from home was
the number of meals provided for
the learners. Table 3.5 shows that
71.2 percent of learners ate
breakfast at home before going to
school, 7.7 percent took their
breakfast to school which can be
eaten before the start of school or
during break time; 3.1 percent
went home during break time to eat their breakfast; 0.8 percent ate meals provided by the
school while 9.6 percent received money for breakfast. In addition, a larger proportion, 70.4
percent of the learners ate three times per day, whereas 6.8 percent, 15.1 percent and 5.9
percent ate twice, once and four times a day, respectively.
Table 3.4: Average Time Spent Daily on Home Work
Frequency percent
None 632 8.4
One hour 4181 55.7
Two Hours 1576 21
Three hours and above 673 9
No response 450 6
Total 7512 100
Table 3.5: Number of Meals Per Day
Frequency percent
Once 514 6.8
Twice 1136 15.1
Three times 5288 70.4
Four times 443 5.9
No Response 131 1.7
Total 7512 100
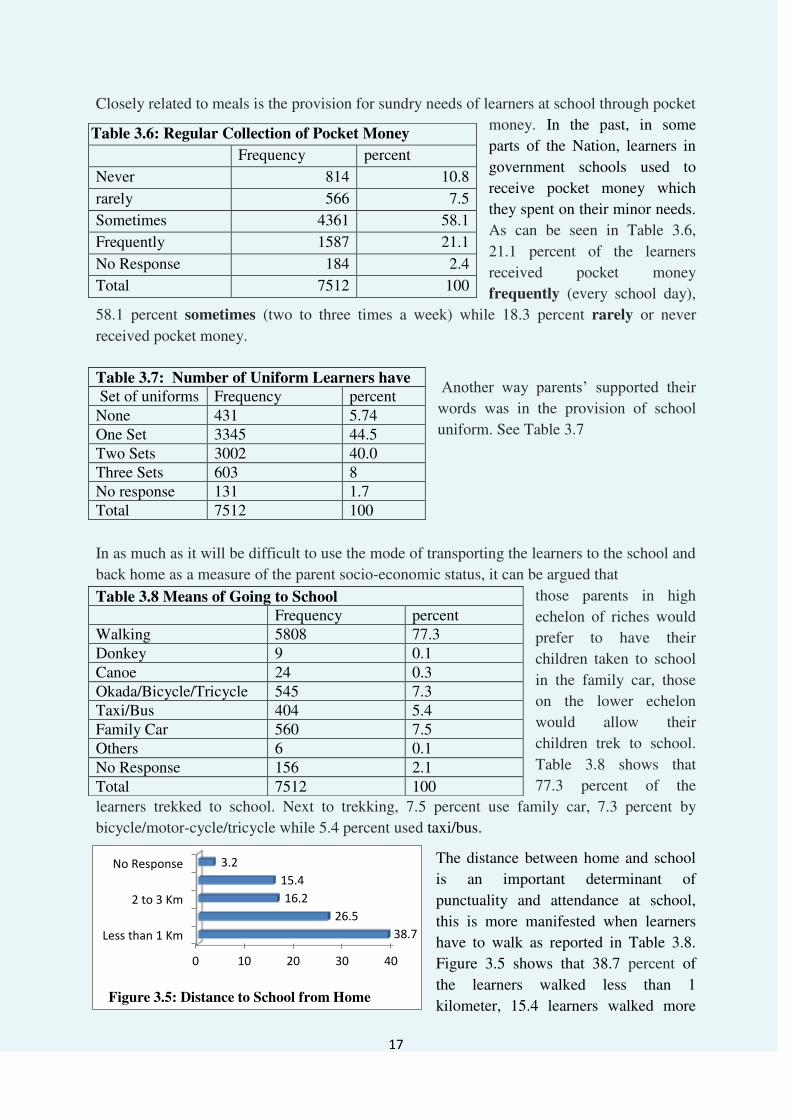
17
Closely related to meals is the provision for sundry needs of learners at school through pocket
money. In the past, in some
parts of the Nation, learners in
government schools used to
receive pocket money which
they spent on their minor needs.
As can be seen in Table 3.6,
21.1 percent of the learners
received pocket money
frequently (every school day),
58.1 percent sometimes (two to three times a week) while 18.3 percent rarely or never
received pocket money.
Another way parents‟ supported their
words was in the provision of school
uniform. See Table 3.7
In as much as it will be difficult to use the mode of transporting the learners to the school and
back home as a measure of the parent socio-economic status, it can be argued that
those parents in high
echelon of riches would
prefer to have their
children taken to school
in the family car, those
on the lower echelon
would allow their
children trek to school.
Table 3.8 shows that
77.3 percent of the
learners trekked to school. Next to trekking, 7.5 percent use family car, 7.3 percent by
bicycle/motor-cycle/tricycle while 5.4 percent used taxi/bus. The distance between home and school
is an important determinant of
punctuality and attendance at school,
this is more manifested when learners
have to walk as reported in Table 3.8.
Figure 3.5 shows that 38.7 percent of
the learners walked less than 1
kilometer, 15.4 learners walked more
Table 3.6: Regular Collection of Pocket Money
Frequency percent
Never 814 10.8
rarely 566 7.5
Sometimes 4361 58.1
Frequently 1587 21.1
No Response 184 2.4
Total 7512 100
Table 3.7: Number of Uniform Learners have
Set of uniforms Frequency percent None 431 5.74 One Set 3345 44.5 Two Sets 3002 40.0 Three Sets 603 8 No response 131 1.7 Total 7512 100
Table 3.8 Means of Going to School
Frequency percent Walking 5808 77.3 Donkey 9 0.1 Canoe 24 0.3 Okada/Bicycle/Tricycle 545 7.3 Taxi/Bus 404 5.4 Family Car 560 7.5 Others 6 0.1 No Response 156 2.1 Total 7512 100
0 10 20 30 40
Less than 1 Km
2 to 3 Km
No Response
38.7
26.5
16.2
15.4
3.2
Figure 3.5: Distance to School from Home

18
than three kilometers, 26.5 percent walked 1 to 2 kilometers and 16.2 percent walked 2 to 3
kilometers. Another support of parents to learners was their relationship with school in terms of
attendance at PTA meetings, visit to school,
payment of fees and relationship between school
and community. Whereas 7.6 percent of parents
never attended PTA meeting at all, 43.6 percent
attended PTA meeting very often and 35.1
percent attended often (Table 3.9). With respect
to visit to schools by parents, 7.6 percent never
visited school, 56.2 percent visited sometimes
and 31.8 percent visited very often. Given the tremendous support which parents provided to the learners, it was necessary to
probe whether learners think their parents
like them. The responses presented in Table
3.10 revealed that 1.3 percent of the learners
indicated that their parents did not like them
while a majority, 92.3 percent affirmatively
indicated that their parents liked them and
this is for various reasons which were: "I am
obedient" (32.1 percent); “they gave birth to me" (12.9 percent); "I am always passing my
examinations" (6.1 percent); “I keep and maintain my textbooks (1.3 percent); “I take care
of my younger ones” (0.8 percent); “I help them to sell things” (0.8 percent) and “I go to
farm with them” (0.8 percent).
3.4 Learners’ Extracurricular Activities Table 3.11: Learners’ Activities after School
Table 3.9 Attendance of PTA Meetings
Frequency percent
No response 49 0.9
Not at all 399 7.6
Often 1850 35.1
Rarely 680 12.9
Very often 2299 43.6
Table 3.10 Parents Like for Learners
Frequency percentage
No 101 1.3
Yes 6932 92.3
No Response 479 6.4
Total 7512 100
Activity Never Rarely Sometimes Always
No Response
Freq. perce
nt Freq.
percent
Freq. perce
nt Freq.
percent
Freq. percent
Participation in farming/rearing animals after school hours
2018 26.9 497 6.6 2643 35.2 1450 19.3 904 12
Participation in petty trading/hawking after school hours
2710 36.1 517 6. 9 1719 22.9 1191 15.9 1375 18.3
Participation in cooking after school hours
1158 15.4 529 7 2595 34.5 2281 30.4 949 12.6
Participation in games/sports after school hours
1023 13.6 581 7.7 2886 38.4 2043 27.2 979 13

19
The benefits of extracurricular activities are numerous but varied, ranging from physical
health and well-being, life and social skills development, a boost for academic performance,
promoting economic and labour skills to work habits and behaviours. Research has shown
that appropriate extracurricular activities help learners to develop time management skills,
build self-esteem, explore diverse interests and hobbies and set life goals as well as breaking
the boredom of regular classroom and homework assignments. The after school activities
engaged by the learners were farming/rearing animals; petty trading/hawking; cooking; and
games/sports. The extent to which learners participated in extracurricular activities was
assessed by means of the four activities. Table 3.11 shows that, generally, the learners were
engaged in Games and Sports, Cooking, Economic activity such as Trading/Hawking and a
variety of Farming activities. Learners who engaged in farming/rearing of animals and
trading/hawking were 19.3 percent and 15.9 percent respectively whereas only 13.6 percent
participated in games/sports.
Observations and Challenges
A combination of type of accommodation and number of learners in a family has implication on the following: the quality of human environment, the learner‟s social interactions and the utilisation of material resources. Where families are not well endowed with financial and material resources, learners from homes with smaller family size are likely to be less deprived than those from homes with larger number of children.
About one-eighth of the learners do not engage in games and sports and to a large extent miss out in the recreational benefits of participation.
Although only 34 percent were engaged in trading or hawking, this is very high. It is a common observation that learners engage in these activities as economic support to their parents after school and during weekends in markets, motor parks, along streets and within neighbourhoods. Such learners do not engage in games and sports neither do they engage in after school homework and independent study. Furthermore, there is the possibility that early involvement of some learners in economic activities like hawking/trades may expose them to several vices in the society. Policy against child labour and child abuse should be re-enforced. In the same vein, the aspect of UBEC law which addresses this challenge should be revived in order to serve as deterrent to both parents/guardians and children.
Although, UBEC provides textbooks in the four core subjects, it is surprising that less than half of the learners had textbooks in Mathematics, Basic Science and Technology and Social Studies while only 56.3 percent possessed English Studies textbook. The life span of a book should be determined such that UBEC could schedule replacement of the books.

20
Chapter Four
Teachers in Schools Learners are the primary reason for establishing schools. Even when all facilities and learners are available, without teachers the educational processes that lead to acquisition of knowledge, skills and acceptable behaviour within the school would be stunted. Among the teachers, is the manager of the school who is the principal with requisite training and teaching experience. The principal is the pivot on which all activities in the school radiate through creating an environment that fosters teaching and learning. The leadership role of the principal is important in actualising the goals and objectives of the school. This chapter examined the characteristics, professional and management skills of teachers and principals.
4.1: Profile of Principals and Teachers
This section presents the personal data such as gender, age, educational qualifications, and
teaching experience of Principals and teachers. A total of 533 principals participated in the
study. Among the principals, 378 (70.90 percent) aged between 50-59 years, while 111 (20.8
percent) were between 40-49 years and 8 (1.5 percent) did not respond as contained in Figure
4.1.
Figure 4.1: Age of Principals
Ninety percent of the Principals were married and 80.5 percent were graduates with teaching qualification. Only 9.9 percent were holders of the Nigerian Certificate in Education (NCE).
01020304050607080
1.5 5.3
20.8
70.9
1.5 percent

21
Figure 4.2: Qualification of Principals
Six hundred and eighty four teachers participated in the study out of which 57.9 percent were
males while 42 percent were females. The modal age of 30-39 years representing 41.1
percent was observed for the teachers and majority of the teachers (93.7 percent) were less
than 50 years old as in Figure 4.1.2
Figure 4.2.1: Age Distribution of Teachers
Data on teachers shows that 79.2 percent were married, 17.3 percent were never married, 1.3
percent widowed, 0.3 percent separated and 13 percent did not specify their marital status.
Also the teachers as presented in Figure 4.2, 44.9 percent were graduates with teaching
qualifications, 37.3 percent had NCE, 10.7percent graduated without teaching qualification,
3.1 percent had Masters or PhD qualifications, 0.9 percent had HSC/GCE „A‟/OND/ND/FTC qualifications, while 0.4 percent had Associate Certificate/Diploma in Education. However,
0.7 percent of teachers did not specify their qualifications. From the data, about 82.2 percent
of the teachers were professionally qualified to teach in junior secondary schools.
0 50 100
GRADUATE WITH…
GRADUATE…
NIGERIA…
ASSOCIATE…
GRADE ONE…
HSC/GCE…
TCII PASS/GRADE…
TCII REFERRED
80.5
6.4
9.9
1.1
0.8
0.2
0.8
0.4
Percent
9.2 19.7 41.1
23.7 5.4 0.9
Percent
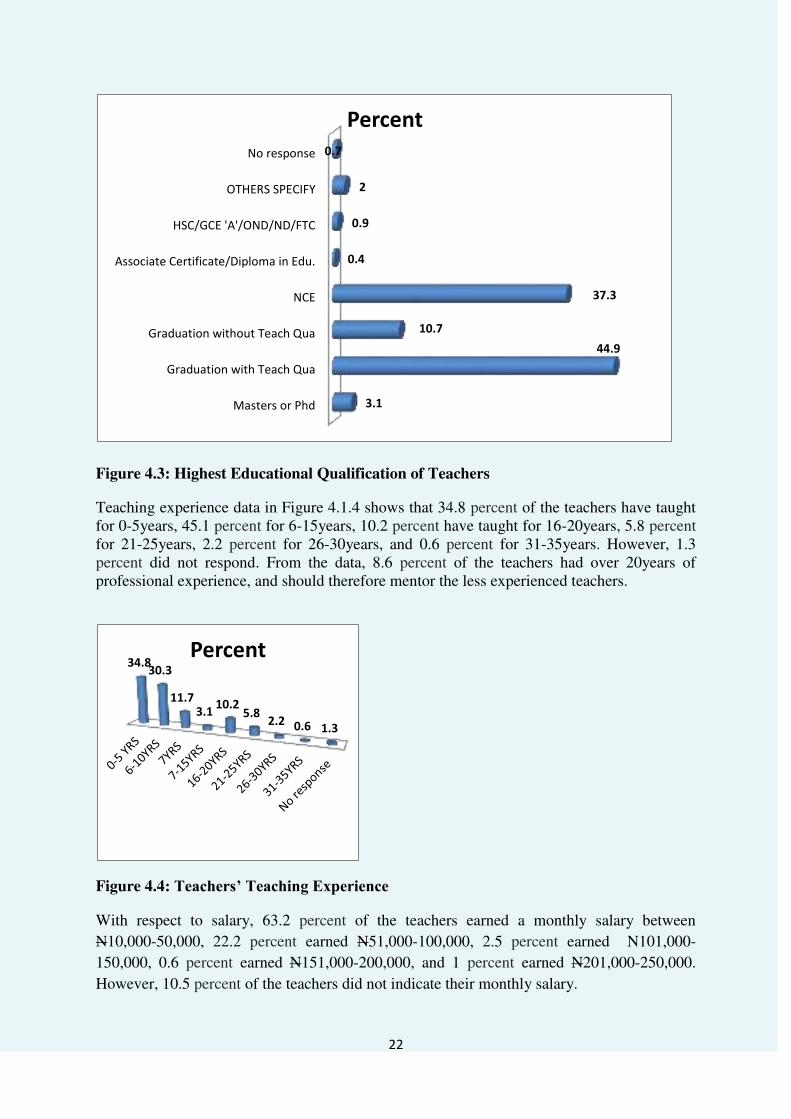
22
Figure 4.3: Highest Educational Qualification of Teachers
Teaching experience data in Figure 4.1.4 shows that 34.8 percent of the teachers have taught for 0-5years, 45.1 percent for 6-15years, 10.2 percent have taught for 16-20years, 5.8 percent for 21-25years, 2.2 percent for 26-30years, and 0.6 percent for 31-35years. However, 1.3 percent did not respond. From the data, 8.6 percent of the teachers had over 20years of professional experience, and should therefore mentor the less experienced teachers.
Figure 4.4: Teachers’ Teaching Experience
With respect to salary, 63.2 percent of the teachers earned a monthly salary between
N10,000-50,000, 22.2 percent earned N51,000-100,000, 2.5 percent earned N101,000-
150,000, 0.6 percent earned N151,000-200,000, and 1 percent earned N201,000-250,000.
However, 10.5 percent of the teachers did not indicate their monthly salary.
34.8 30.3
11.7 3.1
10.2 5.8
2.2 0.6 1.3
Percent
Masters or Phd
Graduation with Teach Qua
Graduation without Teach Qua
NCE
Associate Certificate/Diploma in Edu.
HSC/GCE 'A'/OND/ND/FTC
OTHERS SPECIFY
No response
3.1
44.9
10.7
37.3
0.4
0.9
2
0.7
Percent

23
4.2 Staff Situation in Schools
Human resources are a sine qua non in any organization as they drive whatever happens
within it. In schools, both teaching and non-teaching staffers are available and they work
together to ensure that the goals of the school are realised. There were 6583 non-teaching
staff made up of 52.39 percent males and 46.61 percent females in the sample schools. There
were 44,644 teaching staff. Table 4.2.1 shows the qualification of teachers by gender across
the 36 states and the FCT. As can be seen, 14,969 (33.53 percent) of the teachers had the
Nigeria Certificate in Education (NCE)/Associate Certificate in Education (ACE) of which
6,178 (13.84 percent) are males and 8,791 (19.69 percent) are females. Teachers with degree
certificates were 11,464 (25.68 percent), consisting of 6,195 (13.88 percent) males and 5,269
(11.80 percent) females, while 7,552 (16.92 percent) of the teachers had post graduate
degrees consisting of 3,414 (7.65 percent) males and 4,138 (9.27 percent) females. However,
considering that the minimum qualification for teaching at the basic education level is the
NCE, those with qualification below the minimum were about 18.82 percent.
Table 4.2.1: Qualification of Teachers (Excluding Religious Instructors)
STATE Below Grade II Male
Below Grade II Female
Grade II Male
NCE/ ACE Male
NCE/ACE Female
Degree Male
Degree Female
PG Male
PG Female
Total
ABIA 3 13 0 31 239 63 237 8 22 616
*ADAMAWA 253 107 52 281 200 101 44 3 5 1046
AKWA-IBOM 45 47 43 70 172 96 91 12 5 581
ANAMBRA 2 7 1 12 71 36 124 6 10 269
*BAUCHI 629 602 669 527 588 1435 805 1375 1802 8432
BAYELSA 5 4 0 30 70 24 34 2 0 169
BENUE 22 29 14 56 113 126 89 59 29 537
BORNO 11 11 37 269 397 56 55 9 5 850
CROSS-RIVER
0 3 8 77 295 130 266 3 2 784
*DELTA 643 654 34 94 343 55 160 17 23 2023
EBONYI 2 13 4 99 267 54 91 4 7 541
EDO 0 6 5 63 352 60 97 6 12 601
EKITI 25 20 32 67 68 93 86 61 49 501
ENUGU 22 29 14 56 113 126 89 59 29 537
FCT-ABUJA 0 2 0 232 225 88 105 18 7 677
*GOMBE 300 328 47 310 257 46 16 3 1 1308
IMO 1 2 7 16 165 54 257 3 4 509
JIGAWA 23 36 10 62 115 122 101 60 34 563
KADUNA 13 9 4 257 342 155 84 1 3 868
KANO 45 15 36 520 116 128 25 9 1 895
*KATSINA 337 299 7 272 255 73 30 13 6 1292
KEBBI 20 25 10 61 147 122 87 56 31 559
KOGI 21 28 5 163 269 46 44 5 11 592
KWARA 84 76 101 96 110 117 97 82 87 850
LAGOS 7 23 4 56 117 109 122 4 6 448
NASSARAWA 2 5 2 89 127 25 51 4 2 307
NIGER 1 15 2 104 178 130 53 5 1 489

24
OGUN 2 3 0 89 226 128 169 5 5 627
ONDO 24 27 12 51 121 113 86 57 27 518
OSUN 74 77 0 54 278 99 161 0 2 745
OYO 0 2 6 109 252 132 152 3 0 656
PLATEAU 0 10 6 237 256 72 90 4 3 678
*RIVERS 275 273 150 80 127 97 137 93 90 1322
SOKOTO 83 42 197 182 130 108 76 38 27 883
*TARABA 680 680 28 596 725 262 186 14 2 3173
YOBE 25 25 62 329 391 124 83 3 0 1042
*ZAMFARA 603 568 653 481 574 1390 789 1310 1788 8156
Total
Note: The data collected from the schools sampled in Bauchi, Delta, Adamawa, Rivers,
Taraba, Katsina, Gombe and Zamfara seemed outrageous. The data administrators possibly
obtained the total number of teachers in the state instead of collecting the number of teachers
in the schools sampled.
With respect to teaching experience, the aggregate revealed that of 17.65 percent of male
teachers and 16.86 percent of female teachers was 5-10 years, for 17.75 percent male and
11.71 percent female teachers, it was above 15 years. Furthermore, there were more female
teachers (13.66 percent) with less than 5 years teaching experience than males (11.14
percent).
4.3: Professional Development
Human resources development is one way to ensure that practitioners are abreast with
emerging issues in their areas of practice. Teachers as agents of change should be part of this
wind of change; consequently, they have to be exposed to professional development
programmes. Among the principals sampled, 81.80 percent participated in in-service training
in the past five years. The programmes that these principals attended as presented in Figure
4.3.1 included conferences/seminars/workshops/cluster training, (57.8 percent) and in-service
training. (23.8 percent).
Figure 4.3.1: Type of Training Attended in the Past Five Years
0 10 20 30 40 50 60
IN-SERVICE TRAINING (NCE,DEGREE,PG)
CONFERENCE/SEMINARS/WORKSHOP/C…
SHORT TERM COURSES
SCHOOL-BASED TEACHER…
OTHERS
NO RESPONSE
23.8
57.8
0.6
1.3
2.1
14.4
Percent
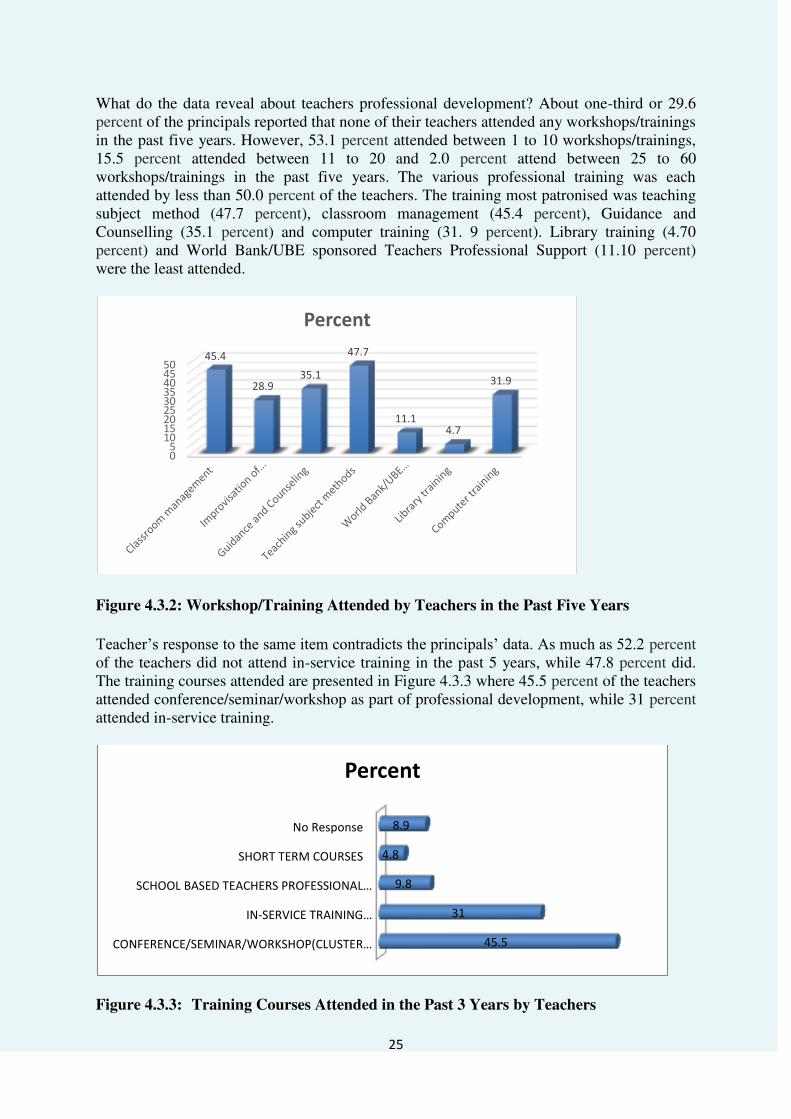
25
What do the data reveal about teachers professional development? About one-third or 29.6 percent of the principals reported that none of their teachers attended any workshops/trainings in the past five years. However, 53.1 percent attended between 1 to 10 workshops/trainings, 15.5 percent attended between 11 to 20 and 2.0 percent attend between 25 to 60 workshops/trainings in the past five years. The various professional training was each attended by less than 50.0 percent of the teachers. The training most patronised was teaching subject method (47.7 percent), classroom management (45.4 percent), Guidance and Counselling (35.1 percent) and computer training (31. 9 percent). Library training (4.70 percent) and World Bank/UBE sponsored Teachers Professional Support (11.10 percent) were the least attended.
Figure 4.3.2: Workshop/Training Attended by Teachers in the Past Five Years
Teacher‟s response to the same item contradicts the principals‟ data. As much as 52.2 percent of the teachers did not attend in-service training in the past 5 years, while 47.8 percent did. The training courses attended are presented in Figure 4.3.3 where 45.5 percent of the teachers attended conference/seminar/workshop as part of professional development, while 31 percent attended in-service training.
Figure 4.3.3: Training Courses Attended in the Past 3 Years by Teachers
05
101520253035404550
45.4
28.9 35.1
47.7
11.1 4.7
31.9
Percent
CONFERENCE/SEMINAR/WORKSHOP(CLUSTER…
IN-SERVICE TRAINING…
SCHOOL BASED TEACHERS PROFESSIONAL…
SHORT TERM COURSES
No Response
45.5
31
9.8
4.8
8.9
Percent

26
4.4: School Discipline and Climate
Effective discipline provides a conducive climate for teaching and learning. Principals, as the
managers in school are expected to implement disciplinary policies to minimise chaos in the
school. Among the schools sample 47.190 percent had disciplinary cases involving learners
during the session under consideration. The range of disciplinary cases was from one to
seven; 32.80 percent had seven cases. The predominant disciplinary cases as reported by the
teachers as in Figure 4.4.1 are quarrelling and stealing (6.0 percent).
Figure 4.4.1: Type of Disciplinary Cases
Good disciplinary practice demands proper documentation of disciplinary measures. About 50 percent of the principals did not document any disciplinary cases as part of the school records. However, 13.7 percent, 17.1 percent and 11.1 percent of the principals documented one, two and ten cases respectively. The resolutions of serious disciplinary should be discussed with the parents. The data showed that 50.1 percent discussed with the parents and 49.9 percent did not discuss with the parents. A breakdown of those who discussed with parents revealed that 11.60 percent discussed with one (1) parent, 13.50 percent discussed with three (3) parents and 11.30 percent discussed with ten (10) parents.
4.5 Decision Making
Principals and teachers take decisions as part of their responsibility. These decisions could be
instructional, learners‟ grouping, testing, and progression among others. In this section, the
freedom which principal/teachers have in decision making on some of these issues was
examined. Table 4.5.1 shows the extent to which principals were free to make decisions on
aspects of school activities. As can be seen from Table 4.5.1 „Selection of topics for
teaching‟ and „teachers transfer/retention‟ were two aspects in which 42.8 percent and 46
percent of the principals lack freedom in Decision making. Whereas at least 70 percent of the
principals take decisions either fully or to some extent in the nine activities captured in Table
4.5.1. About 80 percent of the principals freely take decisions on “Amount of home work to
be assigned to learner’s while 90 percent of the principals do so with respect to the “Extent
and type of reporting to parents and guardian.
0 10 20 30 40 50 60
QUARELLING
PILFERING
STEALING
BULLYING
LATENESS
ABSENTEEISM
OTHERS
NO RESPONSE
6
3
6
3.4
1.9
1.1
28
50.6
Percent

27
Table 4.5.1: Principals’ Freedom in Decision Making about School Activities
Issue Fully Some extent Not at all No response
f perce
nt f
percent
f percent
f percent
Selection of topics for teaching
125 23.5 139 26.1 228 42.8
41 7.7
Selection of instructional materials
166 31.1 227 42.6 110 20.6
30 5.6
Sequence of instructional materials
113 21.2 259 48.6 122 22.9
39 7.3
Type of class organisation, (e.g. small group, large group and all class)
154 28.9 244 45.8 94 17.6
41 7.7
Use of learners‟ achievement tests
263 49.3 158 29.6 82 15.4
30 5.6
Specification of Minimum requirements before Learners can progress to the next level
288 54 119 22.3 99 18.6
27 5.1
Amount of home work to be assigned to learners
209 39.2 217 40.7 82 15.4
25 4.7
Extent and type of reporting to parents/guardians
172 32.3 309 58 23 4.3 29 5.4
Taking disciplinary measure towards correcting learners
230 43.2 201 37.7 75 14.1
27 5.1
Developing or modifying infrastructural facilities
94 17.6 336 63 71 13.3
32 6
Teachers‟ transfers/retention
87 16.3 163 30.6 245 46 38 7.1
How free is the Teacher in Decision making? Teacher‟s response to the 10 activities were analysed in other to assess the extent of freedom. Data in Table 4.5.2 shows that at least 65 percent of the teachers demonstrate their freedom (fairly freely or very free) in Decision making on the 10 activities assessed. Indeed, 90 percent had freedom on the “Amount of home work to be assigned”. However, 31.9 percent expressed a complete lack of freedom in “selection of topics for teaching”.
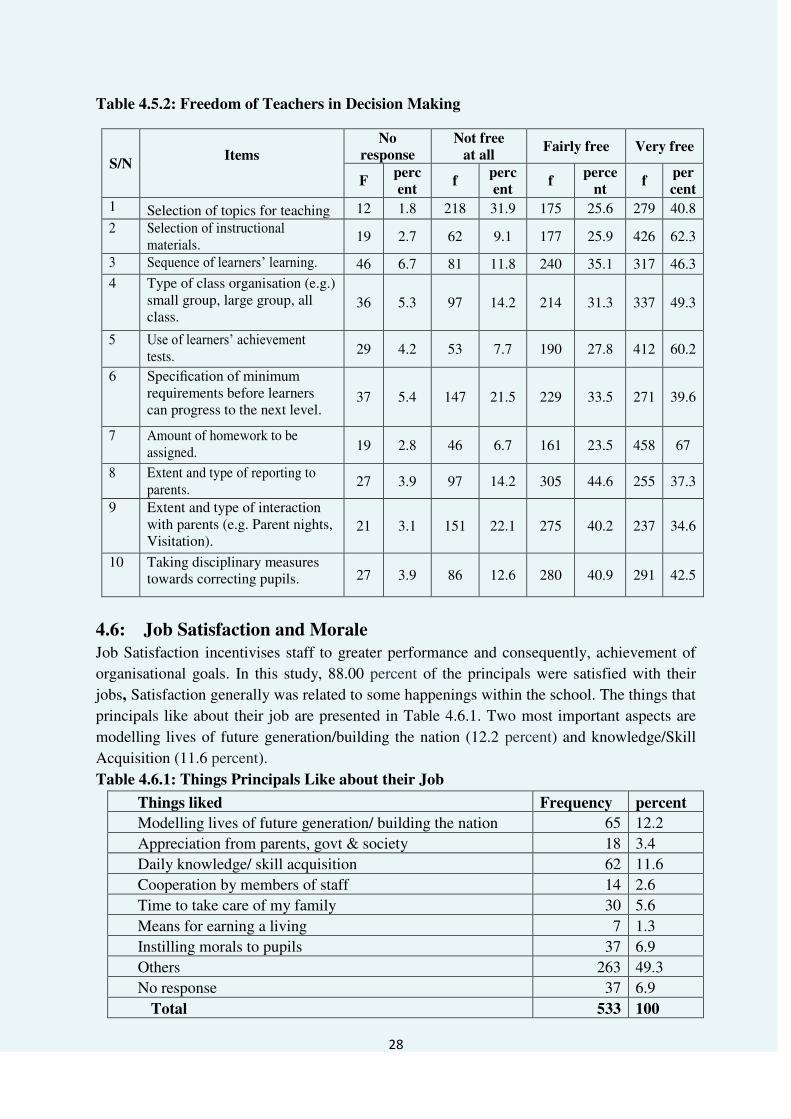
28
Table 4.5.2: Freedom of Teachers in Decision Making
S/N Items
No
response
Not free
at all Fairly free Very free
F perc
ent f
perc
ent f
perce
nt f
per
cent
1 Selection of topics for teaching 12 1.8 218 31.9 175 25.6 279 40.8
2 Selection of instructional materials.
19 2.7 62 9.1 177 25.9 426 62.3
3 Sequence of learners‟ learning. 46 6.7 81 11.8 240 35.1 317 46.3
4 Type of class organisation (e.g.) small group, large group, all class.
36 5.3 97 14.2 214 31.3 337 49.3
5 Use of learners‟ achievement tests.
29 4.2 53 7.7 190 27.8 412 60.2
6 Specification of minimum requirements before learners can progress to the next level.
37 5.4 147 21.5 229 33.5 271 39.6
7 Amount of homework to be assigned. 19 2.8 46 6.7 161 23.5 458 67
8 Extent and type of reporting to parents.
27 3.9 97 14.2 305 44.6 255 37.3
9 Extent and type of interaction with parents (e.g. Parent nights, Visitation).
21 3.1 151 22.1 275 40.2 237 34.6
10 Taking disciplinary measures towards correcting pupils. 27 3.9 86 12.6 280 40.9 291 42.5
4.6: Job Satisfaction and Morale
Job Satisfaction incentivises staff to greater performance and consequently, achievement of
organisational goals. In this study, 88.00 percent of the principals were satisfied with their
jobs, Satisfaction generally was related to some happenings within the school. The things that
principals like about their job are presented in Table 4.6.1. Two most important aspects are
modelling lives of future generation/building the nation (12.2 percent) and knowledge/Skill
Acquisition (11.6 percent).
Table 4.6.1: Things Principals Like about their Job
Things liked Frequency percent
Modelling lives of future generation/ building the nation 65 12.2
Appreciation from parents, govt & society 18 3.4
Daily knowledge/ skill acquisition 62 11.6
Cooperation by members of staff 14 2.6
Time to take care of my family 30 5.6
Means for earning a living 7 1.3
Instilling morals to pupils 37 6.9
Others 263 49.3
No response 37 6.9
Total 533 100
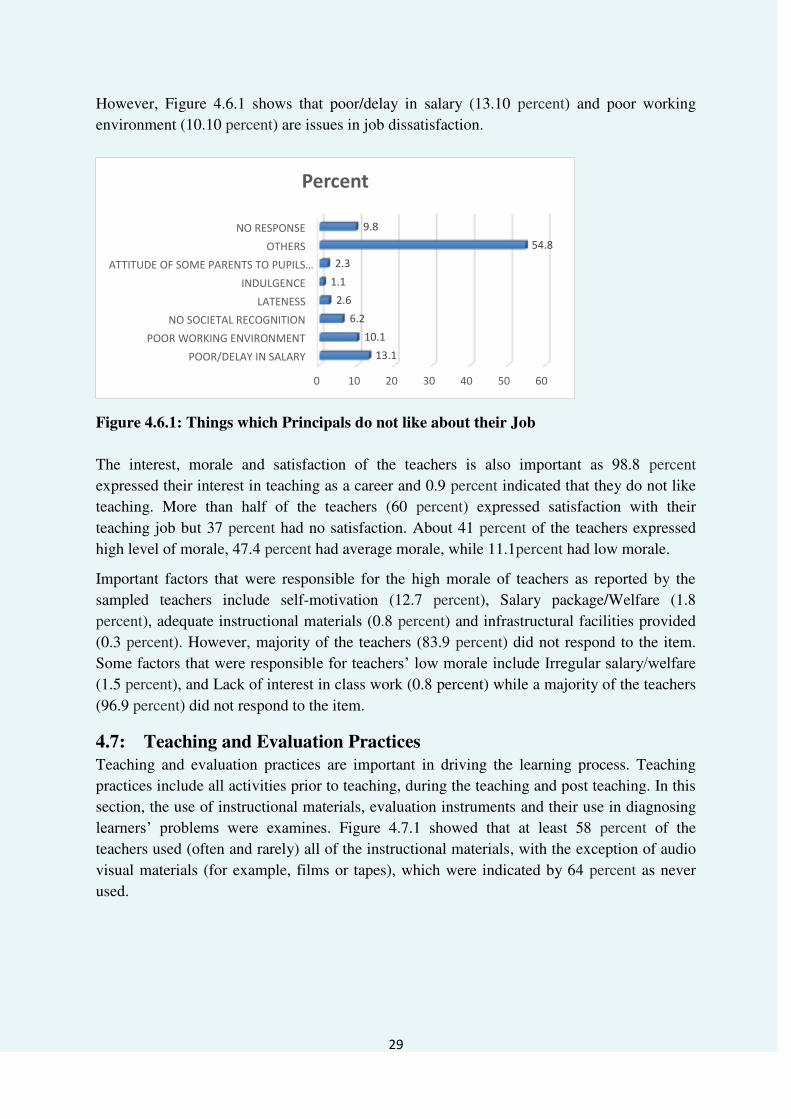
29
However, Figure 4.6.1 shows that poor/delay in salary (13.10 percent) and poor working
environment (10.10 percent) are issues in job dissatisfaction.
Figure 4.6.1: Things which Principals do not like about their Job
The interest, morale and satisfaction of the teachers is also important as 98.8 percent
expressed their interest in teaching as a career and 0.9 percent indicated that they do not like
teaching. More than half of the teachers (60 percent) expressed satisfaction with their
teaching job but 37 percent had no satisfaction. About 41 percent of the teachers expressed
high level of morale, 47.4 percent had average morale, while 11.1percent had low morale.
Important factors that were responsible for the high morale of teachers as reported by the
sampled teachers include self-motivation (12.7 percent), Salary package/Welfare (1.8
percent), adequate instructional materials (0.8 percent) and infrastructural facilities provided
(0.3 percent). However, majority of the teachers (83.9 percent) did not respond to the item.
Some factors that were responsible for teachers‟ low morale include Irregular salary/welfare (1.5 percent), and Lack of interest in class work (0.8 percent) while a majority of the teachers
(96.9 percent) did not respond to the item.
4.7: Teaching and Evaluation Practices
Teaching and evaluation practices are important in driving the learning process. Teaching
practices include all activities prior to teaching, during the teaching and post teaching. In this
section, the use of instructional materials, evaluation instruments and their use in diagnosing
learners‟ problems were examines. Figure 4.7.1 showed that at least 58 percent of the
teachers used (often and rarely) all of the instructional materials, with the exception of audio
visual materials (for example, films or tapes), which were indicated by 64 percent as never
used.
0 10 20 30 40 50 60
POOR/DELAY IN SALARY
POOR WORKING ENVIRONMENT
NO SOCIETAL RECOGNITION
LATENESS
INDULGENCE
ATTITUDE OF SOME PARENTS TO PUPILS…OTHERS
NO RESPONSE
13.1
10.1
6.2
2.6
1.1
2.3
54.8
9.8
Percent

30
Figure 4.7.1: Use of Instructional Materials by Subject Teachers
Furthermore, Figure 4.7.2 shows that 63.9 percent, 45.8 percent, 64.3 percent and 64.8
percent, used Objective test, Open-ended or Essay type questions, Oral tests, and Project
work during teaching respectively. Also, 71.6 percent used, Homework handed in and 62
percent used Regular written work during lessons. However, the teachers rarely used, Tests
with both Objective and Open-ended questions (44.3 percent), and Short quizzes (44.2
percent).
Figure 4.7.2: Use of Evaluation Instruments by Subject Teachers
Published textbooks
Published workbooks
Individualized Instruction (e.g. programmed…
Commercially produced kits or objects
Worksheets or set of materials you have written…
Audio visual materials (e.g. Films or tapes)
Others (Specify)
1
3.5
3.5
3.4
2.3
3.5
6.3
2
19.3
25.6
37.7
30.4
64.9
4.2
18
34.5
38.3
36.8
31.1
19.9
23.8
78.9
42.7
32.6
22.1
36.1
11.7
65.6
Percent
OFTEN RARELY NEVER No response
0 20 40 60 80
Objective tests
Open ended or essay type…
Oral tests
Tests with both objective…
Short quizzes
Project work or pupils…
Homework handed in
Regular written work during…
4.4
13.6
4.8
9.9
25.3
6
4.2
6.9
30
38.2
29.1
44.3
44.2
27.3
23
29.5
63.9
45.8
64.3
43.1
26.5
64.8
71.6
62
SOMETIMES
RARELY
NEVER
NO RESPONSE

31
One important issue assessed was learners‟ weakness in the classroom. As can be seen in
Table 4.7.1 at least 58 percent of the teachers used objective and oral tests, project work or
pupils written reports and homework handed in, to diagnose learners‟ weaknesses.
Table 4.7.1: Teachers’ Use of Evaluation Techniques for Diagnosing Learners’ Weakness
TYPE OF TEST
NO
RESPONSE
NEVER RARELY OFTEN
f percent f percent f percent f percent Objective Tests 15 2.2 37 5.4 203 29.7 429 62.7 Open ended or essay type questions
22 3.2 1 0 2 14.9 243 35.5 313 45.8
Oral tests 22 3.2 54 7.9 214 31.3 394 57.6 Tests with both objective and open ended question(s)
28 4.1 116 17 282 41.2 258 37.7
Short quizzes 28 4.1 174 25.4 279 40.8 203 29.7 Project work or pupils written reports
23 3.4 57 8.3 179 26.2 425 62.1
Homework handed in 76 11.1 61 8.9 135 19.7 412 60.2 Regular written work during lessons
21 3.1 401 58.6 171 2 5 9 1 13.3
4.8 Teachers’ Needs
Initial profession training equips teachers with knowledge and skills for effective interaction
with learners. However, after several years of teaching and with new developments in the
profession, previous competencies become inadequate for current practice. Thus, this section
assessed teachers‟ needs for improved instructional activities and management practices, co-
curricular activities and instructional materials and evaluation practices.
Responses to instructional activities in Figure 4.8.1 showed that teachers needed in
overcoming “difficulties encountered in providing excursions outside the classroom” (69
percent), developing techniques for teaching large classes (71.9 percent) and identifying
appropriate evaluation techniques (61 percent).

32
Figure 4.8.1 Help Needed by Subject Teachers in Instructional Activities
Figure 4.8.2, provides a picture of teachers who need some help or much help in four areas:
(i) Managing parents of children with disciplinary cases (55.6 percent) (ii) Managing learners
with health problems (53.7 percent) (iii) Controlling personal behaviours which could distract
learners‟ attention (69.5 percent) and (iv) Making constructive use of time (63.3 percent).
0 10 20 30 40 50 60 70 80
Writing performance objective.
Determining what to teach i.e. content.
Identify appropriate teaching activities.
Securing or improvising appropriate teaching/learning
materials.
Carrying out Continuous Assessment .
Identify appropriate evaluation techniques.
Organising resources and materials for more effective teaching.
Presenting lessons at the level of learner’s understanding.
Demonstrating principles by performing simple
experiments/demonstrations.
Developing daily lesson notes.
Teaching learners how to observe, record, organise,
generalise, predict, etc.
Obtaining learners feedback for the purpose of improving
instructions.
Presenting lessons so that learners could discover facts
themselves.
Developing in learners a mastery of content and skills.
Developing in learners effective study habits.
Developing in learners the ability to relate content of learning
to everyday life.
Developing techniques for teaching in large classes.
Overcoming Difficulties encountered in provideing excursions
outside the classroom
Obtaining information on where to get help for teaching and
learning.
Making learning meaningful and interesting to learners.
67.1
60.4
36.8
65.5
58.5
36.3
62
55.8
70
56.4
58.9
61.3
53.8
48.2
49.1
42.5
25.4
29.2
51.5
73
21.3
25.4
36.8
22.2
27.5
34.8
22.5
30.8
17.5
28.8
28.5
25.7
31.4
35.4
33.3
35.1
38.9
42.4
25.9
16.8
9.8
12.6
24.1
11
11.8
26.9
13.3
11.7
11.1
13
11
11
12.9
14.5
15.4
20.6
33
26.6
16.7
8.8
MUCH HELP SOME HELP NO HELP NO RESPONSE

33
Figure 4.8.2: Help Needed by Subject Teachers in Management Practices
Teachers‟ responses (81.2 percent) to aspect of Co-curricula activities in Figure 4.8.3 show
that teachers need help in organising out-of-school activities.
0 10 20 30 40 50 60 70 80
Controlling the class effectively.
Managing learners distractive behaviours.
Maintaining discipline in the class.
Planning a schedule of activities on
Planning a schedule of activities on
Setting and ordering priorities.
Making constructive use of time.
Controlling your personal behaviours , which could
distract learners attention.
Managing learners with health problems.
Managing parents of children with disciplinary cases.
64.3
71.8
64.6
59.8
69.2
72.7
35.5
28.9
44.9
43.4
26.2
18.3
25.9
29.5
20.5
17
39.2
46.1
39.5
41.8
8.3
8.9
8.3
8.9
8.3
9.5
24.1
23.4
14.2
13.3
MUCH HELP SOME HELP NO HELP NO RESPONSE

34
Figure 4.8.3: Help Needed by Subject Teachers in Co-curricular Activities
The pattern of need for Instructional Materials and Evaluation Practices in Figure 4.8.4 shows
that teachers need help (some or much) in: (i) Preparing Materials for testing learners abilities
(60 percent), (ii) Increasing learners‟ abilities to utilise the library (77.4 percent), Utilising the
library (59.5 percent), Utilising textual materials (59 percent) and Procuring supplementary
books for learners in appropriate classes (58.1 percent).
Figure 4.8.4: Help Needed by Subject Teachers in Instructional Materials and Evaluation
Practices
0 10 20 30 40 50 60
Developing in learners an appreciation
of co-curricula activities.
Encouraging learners to participate in
activities.
Organising out-of-school activities on
the basis of learners interests
Organising out-of-school activities on
the basis of learners abilities
55.1
29.5
24.9
17.3
31.9
42.7
45
36.3
11.8
26.5
28.8
44.9
MUCH HELP SOME HELP NO HELP NO RESPONSE
0 10 20 30 40 50 60 70 80 90
Utilising the library.
Preparing materials for testing learners’ abilities.
Interpreting the result of standardized test.
Evaluating learners’ progress as a group.
Reporting learners’ progress to administrators
40.4
39.5
38.6
21.3
42.1
47.5
38.2
49.1
55.1
57.9
63
55.1
59.4
51.5
55.8
57.5
83.3
32.7
28.2
32.9
35.7
31.7
30.8
36.8
32
30.4
27.6
24
26.2
26.9
29.5
27.3
26.6
11.5
25.4
31
27
41.7
24.6
20.3
23.2
16.8
12.7
12.6
11.7
12.7
11.5
17
14.9
14.2
4.7
MUCH HELP SOME HELP NO HELP NO RESPONSE

35
4.9: Learners' Problems
The problems identified by the teachers as common in schools are presented in Table
4.9.1.The five most important problems frequently encountered were lack of instructional
materials (21.4 percent), learners‟ lack of interest in class/school (14.7 percent), lack of basic
infrastructure (14.6 percent), stealing learners (9.1 percent), and truancy/absenteeism (6.3
percent).
Table 4.9.1: Problems Encountered as Classroom Teacher
Problems percentage Lack of basic infrastructure, classroom, laboratory, toilet)
14.6
Lack of furniture 4.4 Lack of instructional materials 21.4 Bullying 1.7 Dirtiness/untidiness 3 Lateness 5.2 Truancy/absenteeism 6.3 Fighting 4.9 Lack of interest in class work 14.7 Lack of co-operation from parents 2.5 Poor salary structure/welfare 9 Stealing 9.1 No response 3.2
From Table 4.9.2, the three most important pressing problems which teachers encountered
with learners were; Lateness to school (39.5 percent), Truancy/Absenteeism (33.5 percent),
and Learners‟ lack of interest in class/school (12.4 percent).
Table 4.9.2: Problems Teachers Encounter with Students
Problems percentage Lateness 39.5 Truancy/absenteeism 33.5 Bullying 4.8 Lack of interest in class work
12.4
Dirtiness/untidiness 2.9 Fighting 1.6 Stealing 0.3 Others 1.6 No response 3.4

36
Observations and Challenges
A large proportion of the principals are ageing and getting close to retirement, prompting the need for eventual replacement.
A majority of the teachers are professionally qualified; others need training.
The few experienced teachers in schools should be motivated.
The participation of principals in development programmes was high, possibly because of the mandatory training rendered by the All Nigeria Confederation of Secondary School Principals which ensures that principals are kept abreast of developments that enhance good management practices.
Quarrelling and stealing were two major social disciplinary problems among pupils in this study. Principals and parents need to tackle these through discussion.
Principals and teachers had limited freedom in selecting what to teach. But should be the ones implementing the curriculum in schools.
Most principals were satisfied with their job of moulding children but are not happy with the delay in salaries and the poor working environment, both of which are motivational factors.
The fact that most teachers indicated a positive disposition towards teaching can improve learning.
Teachers‟ need the techniques of handling large classes and of organising excursions outside the classroom. They also need in-service training in time management and classroom control.
The major problem encountered by classroom teachers is related to the provision of working materials. This calls for judicious utilisation of funds budgeted for education.
Lateness and truancy require proper supervision of learners and greater cooperation with parents.
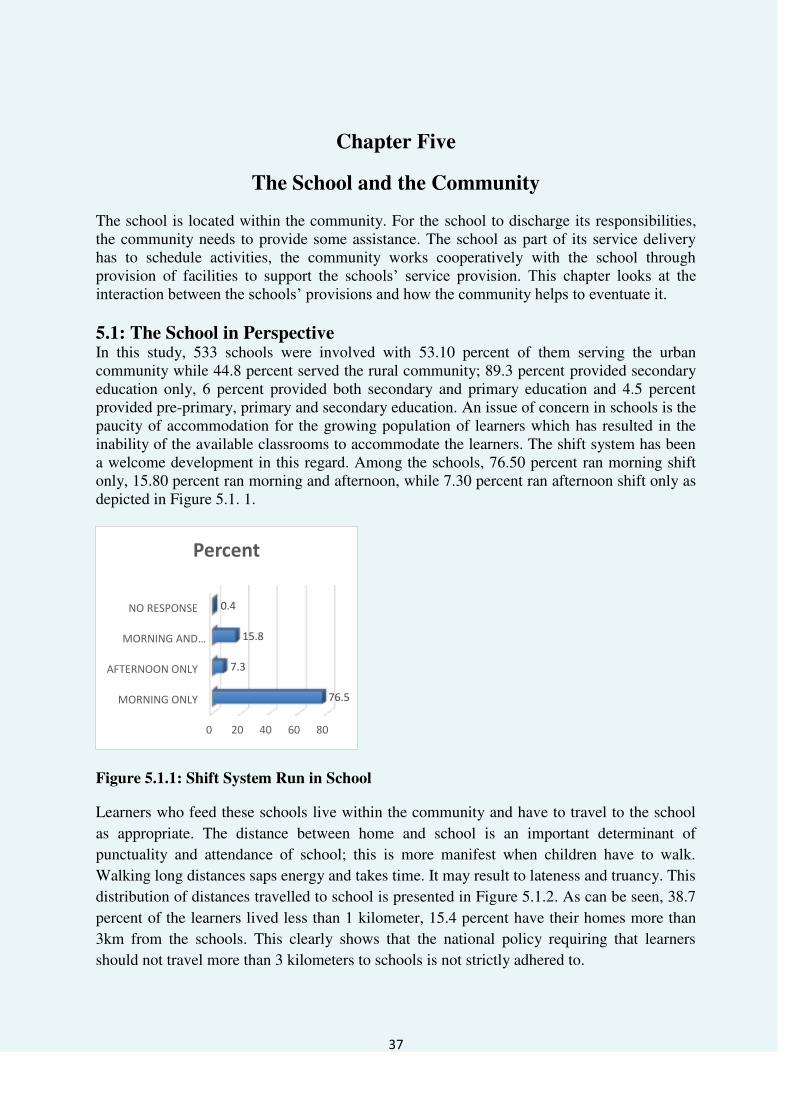
37
Chapter Five
The School and the Community
The school is located within the community. For the school to discharge its responsibilities, the community needs to provide some assistance. The school as part of its service delivery has to schedule activities, the community works cooperatively with the school through provision of facilities to support the schools‟ service provision. This chapter looks at the interaction between the schools‟ provisions and how the community helps to eventuate it.
5.1: The School in Perspective In this study, 533 schools were involved with 53.10 percent of them serving the urban community while 44.8 percent served the rural community; 89.3 percent provided secondary education only, 6 percent provided both secondary and primary education and 4.5 percent provided pre-primary, primary and secondary education. An issue of concern in schools is the paucity of accommodation for the growing population of learners which has resulted in the inability of the available classrooms to accommodate the learners. The shift system has been a welcome development in this regard. Among the schools, 76.50 percent ran morning shift only, 15.80 percent ran morning and afternoon, while 7.30 percent ran afternoon shift only as depicted in Figure 5.1. 1.
Figure 5.1.1: Shift System Run in School
Learners who feed these schools live within the community and have to travel to the school
as appropriate. The distance between home and school is an important determinant of
punctuality and attendance of school; this is more manifest when children have to walk.
Walking long distances saps energy and takes time. It may result to lateness and truancy. This
distribution of distances travelled to school is presented in Figure 5.1.2. As can be seen, 38.7
percent of the learners lived less than 1 kilometer, 15.4 percent have their homes more than
3km from the schools. This clearly shows that the national policy requiring that learners
should not travel more than 3 kilometers to schools is not strictly adhered to.
0 20 40 60 80
MORNING ONLY
AFTERNOON ONLY
MORNING AND…
NO RESPONSE
76.5
7.3
15.8
0.4
Percent

38
Figure 5.1.2: Distance of School from Home
Most learners 77.3 percent walked to school. Family car is used by 7.5 percent of the learners; other means used are presented in Table 5.1.1. Table 5.1.1: Means of Going to School
Means of going to
school Frequency percent
Walking 5808 77.3 Donkey 9 0.1 Canoe 24 0.3 Okada/Bicycle/Tricycle 545 7.3 Taxi/Bus 404 5.4 Family Car 560 7.5 Others 6 0.1 No Response 156 2.1 Total 7512 100
5.2 Parents Relationship with the School
A good relationship between the home and the school provided great cooperation for
realising the goals of the school and the home. One way in which this cooperation has
fostered is through the PTA; exemplified in attendance at the meetings as issues bothering on
discipline and support of the school are usually discussed. The participation of parents in
these meetings encourage further visit to schools for conferences with the class teachers of
their children, discipline problems and support for the school. As it is expected that all
schools should have one; 93.1 percent of the schools actually have PTAs, 2.6 percent do not
have and 4.3 percent of principals did not respond to this item. The regularity of meetings of
the PTA as shown in Figure 5.2.1 indicates that PTA meets as the need arises in 46.90
percent of the schools, while it meets in 32.30 percent of the schools termly. The PTA also
meets monthly, quarterly and yearly in less than 5 percent of the schools.
0
5
10
15
20
25
30
35
40 38.7
26.5
16.2 15.4
3.2

39
Figure 5.2.1: How often PTA Meets
Figure 5.2.2, shows that 7.6 percent of parents have never attended PTA meeting, 43.6
percent have attended very often and 35.1 percent attended often.
Figure 5.2.2: Chart of Attendance at PTA Meetings by Parents
In Figure 5.2.3, about 46 percent of the subject teachers sometimes invited parents to discuss
learners‟ progress, while about 34 percent of the teachers often invited the parents for the
same purpose. Thus the needed home-school interaction is not ignored by these teachers.
Figure 5.2.3: Subject Teachers Visit to Parents
0 10 20 30 40 50
AS THE NEED ARISES
MONTHLY
QUARTERLY
TERMLY
TWICE A YEAR
ONCE A YEAR
NO RESPONSE
46.9
3.2
5.8
32.3
5.4
2.4
3.9
Percent
020
4060 43.6
35.1
12.9 7.6 0.9
Pe
rce
nt
Attendance at PTA meetings
1.6 15.9 18.6
48.1
15.8
percent
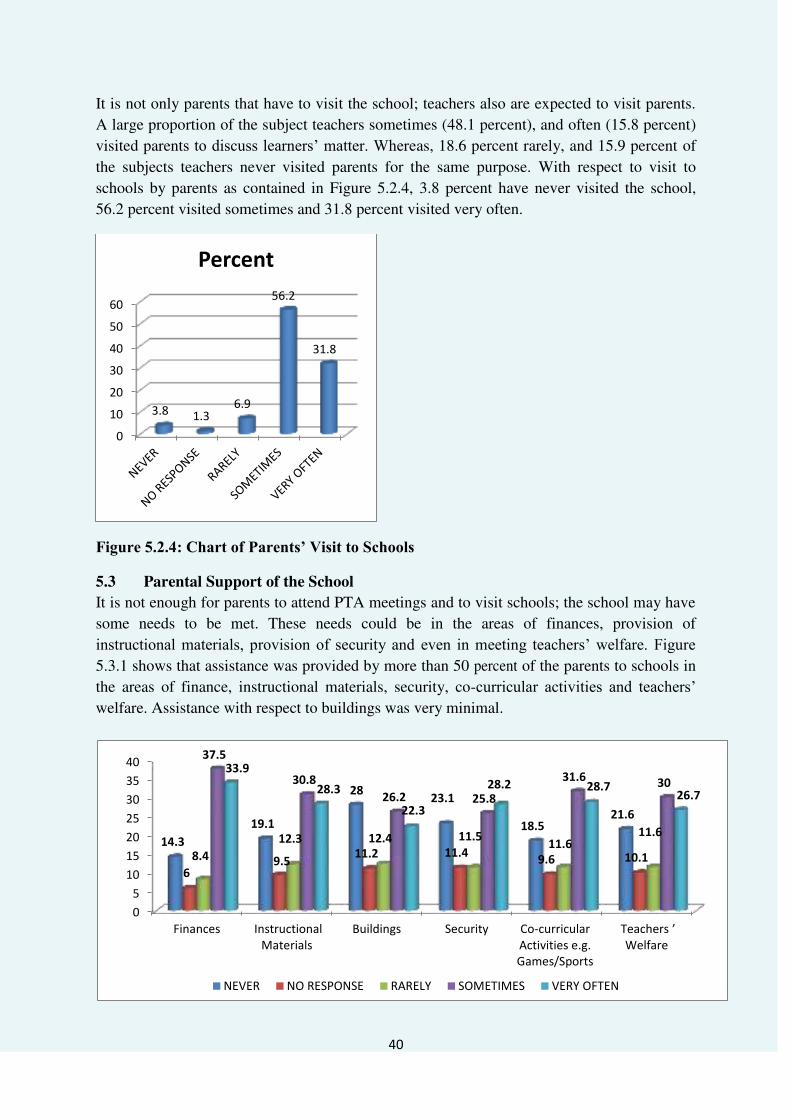
40
It is not only parents that have to visit the school; teachers also are expected to visit parents.
A large proportion of the subject teachers sometimes (48.1 percent), and often (15.8 percent)
visited parents to discuss learners‟ matter. Whereas, 18.6 percent rarely, and 15.9 percent of
the subjects teachers never visited parents for the same purpose. With respect to visit to
schools by parents as contained in Figure 5.2.4, 3.8 percent have never visited the school,
56.2 percent visited sometimes and 31.8 percent visited very often.
Figure 5.2.4: Chart of Parents’ Visit to Schools
5.3 Parental Support of the School
It is not enough for parents to attend PTA meetings and to visit schools; the school may have
some needs to be met. These needs could be in the areas of finances, provision of
instructional materials, provision of security and even in meeting teachers‟ welfare. Figure 5.3.1 shows that assistance was provided by more than 50 percent of the parents to schools in
the areas of finance, instructional materials, security, co-curricular activities and teachers‟ welfare. Assistance with respect to buildings was very minimal.
0
10
20
30
40
50
60
3.8 1.3 6.9
56.2
31.8
Percent
0
5
10
15
20
25
30
35
40
Finances Instructional
Materials
Buildings Security Co-curricular
Activities e.g.
Games/Sports
Teachers ’ Welfare
14.3
19.1
28 23.1
18.5 21.6
6 9.5
11.2 11.4 9.6 10.1 8.4
12.3 12.4 11.5 11.6
11.6
37.5
30.8
26.2 25.8
31.6 30
33.9
28.3
22.3
28.2 28.7 26.7
NEVER NO RESPONSE RARELY SOMETIMES VERY OFTEN

41
Figure 5.3.1: Level of Assistance Rendered by Parents to School
One way the school sustains itself is through collection of Fees/Levies. Figure 5.3.2 shows
that about 78 percent parents regularly paid fees or levies while 4 percent never paid fees or
levies at all.
Figure 5.3.2: Chart of Levies and Other Charges Payment by Parents
How did the parents perceive the school-community relationship be seen in Figure 5.3.3, 33.1 percent indicated excellent, 31.9 percent and 12.5 percent were very good and good respectively while only 1.3 percent perceived the relationship as poor. One way to facilitate this is through mutual living within the community. In this study, 45 percent of principals lived within the community as against 52.9 percent who do not. Among the teachers only 16.9 percent lived within the community.
Figure 5.3.3: Relationship between the School and the Community
5.4: School Fence and Security Provision
The responses show that, 26.6 percent were fenced and 70.40 percent were not. The type of fence used across the schools presented in Figure 5.4.1 shows that Cement block fence was mostly used in 22.70 percent of the school.
0102030405060
53.1
12.5 1.2 1.3
31.9
Percent
77.6
14.3 2.9 4 1.1
Pe
rce
nt
Payment of fees and levies

42
Figure 5.4.1: Type of Fence
The principals‟ responses showed that 75.4 percent of the schools engaged security personnel. Local persons employed by the school/PTA were the security personnel engaged by 34.90 percent of the schools, 32.50 percent engaged private security outfit employed by the school/PTA/Government as presented in Figure 5.4.2.
Figure 5.4.2: Type of Security Engaged by School
5.6: School Compound and Buildings A good school compound should be inviting and friendly, and motivates the learner.
Table 5.61 provides a description of the school compounds, with 71.3 percent of principals indicating „well defined, compounds secured from encroachment and large enough for buildings, playgrounds, and gardens‟. Only 23.6 percent of the schools were small, without room for expansion and lacked play fields and gardens. With respect to the buildings, 19 percent of the schools had no issues with cracks, roofs were secured in position and doors/window shutters were available and securely fitted. Few cracks were noticed in 46 percent but heavy cracks in 28.1 percent of the schools. The compounds of 40.90 percent of schools were free from erosion problems and 46.20 percent had evidence of erosion problems, 8.10 percent had serious erosion problems.
0 10 20 30 40
FLOWER FENCE
WOOD FENCE
MUD FENCE
THATCHED FENCE
IRON WIRE FENCE
IRON SHEET FENCE
CEMENT BLOCK FENCE
OTHERS
NO RESPONSE
0.8
3.2
1.7
0.6
0.6
0.9
22.7
40
29.6
Percent
0 10 20 30 40
LOCAL PERSONS…
COMMUNITY…
POLICE
PRIVATE SECURITY…
PEACE CORPS
OTHERS
NO RESPONSE
34.9
5.4
1.5
32.5
0.2
8.8
16.7
Percent

43
Table 5.6.1: Description of School Compound
Frequency percent
Well defined, secured from encroachment and large enough for buildings, playgrounds and gardens 380 71.3
Small school compound, little or no extra land for expansion 105 19.7
Extremely small compound with no defined play field or gardens 21 3.9
No Response 27 5.1
Total 533 100
5.7 Students’ Enrolment, Dropouts and Repeaters
The data indicated that at the national level, female learners‟ enrolment (52.71 percent) was
higher than that of males (47.29), with near parity between them in five states: Akwa-Ibom,
Borno, Kaduna, Osun, and Plateau and the FCT. Female learners had higher enrolment in ten
states: Abia, Anambra, Bauchi, Bayelsa, Ebonyi, Kogi, Kwara, Lagos, Nasarawa, and Oyo,
while, male learners had higher enrolment in the remaining 21 states. More male learners 5.4
percent dropped out of school than the female learners with 2.7 percent dropout rate. The
variation in dropout and repeating rates are presented in Figure 5.7.1 with Zamfara and
Rivers states showing exceptionally high dropout rates of 52.37 and 35.02 percent
respectively.

44
Figure 5.7.1: Chart of Repeaters and Dropouts across States
0.00 10.00 20.00 30.00 40.00 50.00 60.00
ABIA
ADAMAWA
AKWA-IBOM
ANAMBRA
BAUCHI
BAYELSA
BENUE
BORNO
CROSS-RIVER
DELTA
EBONYI
EDO
EKITI
ENUGU
FCT-ABUJA
GOMBE
IMO
JIGAWA
KADUNA
KANO
KATSINA
KEBBI
KOGI
KWARA
LAGOS
NASSARAWA
NIGER
OGUN
ONDO
OSUN
OYO
PLATEAU
RIVERS
SOKOTO
TARABA
YOBE
ZAMFARA
5.89
5.30
8.19
2.76
13.17
2.59
1.85
11.12
4.54
11.24
5.22
2.87
5.42
1.85
2.28
1.84
2.86
1.86
2.22
1.72
3.22
2.28
2.93
5.58
3.62
4.57
0.53
0.85
1.74
8.08
4.56
5.48
35.02
3.96
5.12
1.46
52.37
2.34
6.13
7.36
3.73
0.54
6.00
5.56
1.73
5.23
2.49
3.86
4.08
5.07
5.56
2.63
2.83
1.89
4.69
3.12
2.22
3.03
5.42
3.89
4.46
10.14
3.46
5.35
2.70
5.96
2.79
7.09
5.12
4.47
2.89
6.68
2.01
1.77
% repeaters % dropout

45
The reasons for dropping out of school in Figure 5.7.2 were poverty (15.20 percent), lack of parental care (12.40 percent), change of accommodation (4.60 percent), lack of interest in School (3.70 percent) and transfer of parents (3.70 percent).
Figure 5.7.1: Reasons for Learners Dropping Out of School
12.4
3.5
15.2
2
3.7
1.2
0.9
1.4
0.2
4.6
0.4
3.7
0.2
0.1
0.1
0.4
1.3
12.7
36.2
0 10 20 30 40
LACK OF PARENTAL CARE
LACK OF INSTRUCTIONAL…
POVERTY
PUPIL POOR ACADEMIC…
LACK OF INTEREST
EARLY MARRIAGE
LACK OF MOTIVATION/…
POOR ORIENTATION ABOUT…
INAPPROPRIATE SCHOOL…
CHANGE OF…
FARMING
TRANSFER OF PARENTS
ISLAMIYYA SCHOOL
HEALTH PROBLEM
PARENTAL DEATH
BROKEN HOME
TEACHER SHORTAGE
OTHERS
NO RESPONSE
Percent

46
5.8: Classroom Spaces and Open Classrooms Data revealed that the proportion of classrooms built up was 82.5 percent, while open classrooms were 17.5 percent. The variation across states is shown in Figure 5.8.1 In Edo, Kogi, Osun and Bayelsa they were no open spaces. All states, with the exception of Bauchi and Ekiti, had more than 70 percent of classrooms.
Figure 5.8.1: Distribution of Classroom Spaces and Open Classrooms by States
0 20 40 60 80 100
ABIA
AKWA-IBOM
BAUCHI
BENUE
CROSS-RIVER
EBONYI
EKITI
FCT-ABUJA
IMO
KADUNA
KATSINA
KOGI
LAGOS
NIGER
ONDO
OYO
RIVERS
TARABA
ZAMFARA
90.6
70.4
92.5
88.9
61.8
100
75
86.7
91.9
86.8
86.2
100
68.3
75
92.6
88.2
88.9
73.3
92.9
83.7
90.5
75
100
70.9
94.2
77.8
96.3
84.1
76.5
100
97.6
81.7
76.8
82
86.2
80
70.9
9.4
29.6
7.5
11.1
38.2
0
25
13.3
8.1
13.2
13.8
0
31.7
25
7.4
11.8
11.1
26.7
7.1
16.3
9.5
25
0
29.1
5.8
22.2
3.7
15.9
23.5
0
2.4
18.3
23.2
18
13.8
20
29.1
% of Open Spaces
% classroom space

47
5.9: Facilities in Schools Apart from human resources, facilities are used by schools to eventuate effective teaching and learning. These facilities are varied and their number and appropriateness are germane to teaching effectiveness. For example, science teaching does require laboratories, Sports facilities are useful for recreational purposes and the library provides books and reference materials which the learner may not possess. This section takes a look at the facilities which are available in schools with respect to numbers and their condition. Facilities such as laboratories sports equipment among others were in short supply. The Science laboratory in 16.90 percent of the schools were appropriate, but not in 34.00 percent dilapidated infrastructure in (12.90 percent), inadequate funding (2.40 percent) were indicated as responsible for the state of the facilities. However, only 3.8 percent, probably among those who indicated that the science laboratory was adequate, expressed the view that the facilities are utilised in their schools. The condition of the Mathematics laboratory was seen as appropriate in 16.10 percent of the schools, not appropriate in 18.40 percent, while 65.50 percent did not respond. The main reasons for the state of the mathematics laboratory were inadequate/equipment (6.60 percent), lack of infrastructure (0.8 percent), inadequate funding (0.8 percent), while 91.40 percent did not respond. The condition of the libraries in 28.10 percent of the schools was appropriate, 29.60 percent not appropriate and 42.2 percent did not respond to this item. Reasons given for the conditions of the library include inadequate facilities (17.8 percent), dilapidated infrastructure (2.1 percent), inadequate funding (0.8 percent), and non-completion of the project (0.6 percent). The ICT facilities were described as appropriate in 25.70 percent of the schools and not appropriate by 24.00 percent, while 50 percent of the principals did not respond. With respect to the reasons why this facility was assessed this way, 54.00 percent of the schools did not respond. However, 15.00 percent, 12.90 percent, 11.80percent, 2.30percent and 1.70 percent of the schools indicated inadequate facilities/equipment, inadequate use, dilapidated infrastructure, poor maintenance and lack of infrastructure as reason for inappropriate ICT facility. The football field in 35.10percent of the schools was described as appropriate and not appropriate in 24.60 percent of the schools while 40 percent of the schools did not respond to this item.
Other facilities considered were lockable storage space, school garden/farm, weather station and staff room. The responses with respect to their appropriateness are presented in Figure 5.9.1, it was observed that the no response was highest for weather station (68.5 percent) and lowest for staff room (7.9 percent). Staff room, weather station, school garden/farm and lockable storage space were indicated as appropriate by 26.8 percent, 13.7 percent, 28.1 percent and 20.1 percent respectively. Principals who indicated their inappropriateness were 35.3 percent, 17.8 percent, 22.5 percent and 22.5 percent for staff room, weather station, school garden/farm and lockable storage space respectively.

48
Figure 5.9.1: Condition of Some Facilities in Schools
The reasons for the condition of the lockable storage space were, non-availability of materials (9.80 percent), inadequate facilities/equipment (9.80 percent) and not in good use (3.20 percent), while 66.80 percent did not respond. Reasons adduced by the schools for the conditions of their gardens/farms were inadequate facilities/equipment (13.9 percent), inadequate funding (9.6 percent), not in good use (4.90 percent) and security (1.1 percent), while 70.0 percent of the schools did not respond. Among the principals, 90.8 percent did not respond to the item on reasons for condition of the weather station. However, 8.60 percent of the Schools indicated inadequate facilities/equipment as reason for the condition of the weather station. With respect to the condition of the staff room, inadequate facilities/equipment (22.5 percent), not in good use (2.6 percent), dilapidated infrastructure (0.2 percent) were the reasons given by the Principal while 74.7 percent did not respond. The distribution of teachers‟ furniture as presented in Figure 5.9.2, shows that 42.6 percent of the schools had no furniture; 36.4 percent had 1 to 10 furniture, 3.9 percent had 20-30 and 4.7 percent had 31 furniture and above. It is instructive to note that a principal indicated that the school had 228 and two Principals indicated schools had 139 furniture items for teachers.
0 20 40 60 80
Lockable storage space
School garden/farm
Weather station
Staff room
20.1
28.1
13.7
26.8
22.5
22.5
17.8
35.3
57.4
49.3
68.5
37.9
No response (%) Not appropriate (%)
Appropriate (%)

49
Figure 5.9.2: Distribution of Furniture
The condition of the teachers‟ furniture was described by 34.10 percent of the principals as appropriate, but 40.30 percent as not appropriate, while 25.50 percent did not respond. Inadequate facilities/equipment was the reason given by 26.6percent of the principals for the condition of the teachers‟ furniture, 11.1 percent and 11.6percent gave dilapidated infrastructure and not in good use respectively as reason. The condition of the learners‟ furniture was reported by 22.90 percent of the principals as appropriate while 49.90 percent describe them as not appropriate; 27.2 percent however did not respond. Reasons for the poor condition of learners‟ furniture were: 28.1 percent inadequate facilities/equipment, 10.9 percent as not in good use, while 60.6 percent did not respond. With respect to available Auditorium or hall, 55.2 percent of the schools had no auditorium/halls, 31.3 percent had one auditorium/hall, while 13.6 percent had more than one auditorium/hall. The condition of the auditorium/hall was described by 19.7 percent of the principals as appropriate, 28.7 percent not appropriate, while 51.6 percent did not respond. The number of classrooms (at 40 learners per class) in the schools was such that 53.5 percent of the principals reported that they had none, 34.8 percent had between 1-10 such classrooms, 7.8 percent between 11-20, while 4.6 percent had more than 20 classrooms. On the condition of the classrooms 12.6 percent were appropriate, 47.10 percent not appropriate, while 40.30 percent did not respond.
Administrative blocks were not available in the 61.2 percent of the schools, 34.0 percent had one (1) while 4.9 percent had more than one block. The condition of the administrative blocks was described by 23.50 percent of the principals as appropriate, by 40.00 percent not appropriate, while 36.50 percent did not respond.
5.10 : The Child Friendly School Environment
Learning and the acquisition of acceptable social and life skills are facilitated in a child-
friendly-school-environment, it is expected that such environment should be safe and
secured, free from violence, has provision for safe water and sanitation, and Toilet facilities
from learners and teachers. Availability of these facilities is examined in this section. With
0 10 20 30 40 50
0
1 to 10
11 to 20
21 to 30
31 and above
42.6
36.4
12.9
3.9
4.7
percent
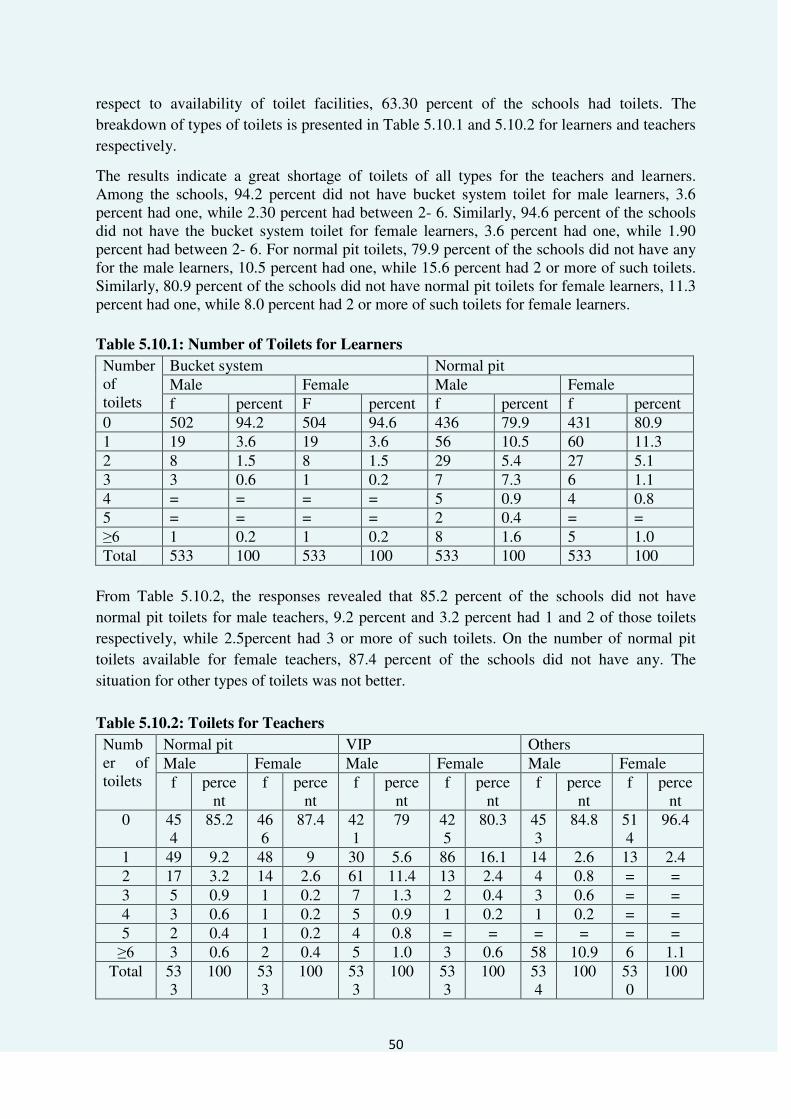
50
respect to availability of toilet facilities, 63.30 percent of the schools had toilets. The
breakdown of types of toilets is presented in Table 5.10.1 and 5.10.2 for learners and teachers
respectively.
The results indicate a great shortage of toilets of all types for the teachers and learners. Among the schools, 94.2 percent did not have bucket system toilet for male learners, 3.6 percent had one, while 2.30 percent had between 2- 6. Similarly, 94.6 percent of the schools did not have the bucket system toilet for female learners, 3.6 percent had one, while 1.90 percent had between 2- 6. For normal pit toilets, 79.9 percent of the schools did not have any for the male learners, 10.5 percent had one, while 15.6 percent had 2 or more of such toilets. Similarly, 80.9 percent of the schools did not have normal pit toilets for female learners, 11.3 percent had one, while 8.0 percent had 2 or more of such toilets for female learners.
Table 5.10.1: Number of Toilets for Learners
Number of toilets
Bucket system Normal pit Male Female Male Female f percent F percent f percent f percent
0 502 94.2 504 94.6 436 79.9 431 80.9 1 19 3.6 19 3.6 56 10.5 60 11.3 2 8 1.5 8 1.5 29 5.4 27 5.1 3 3 0.6 1 0.2 7 7.3 6 1.1 4 = = = = 5 0.9 4 0.8 5 = = = = 2 0.4 = = ≥6 1 0.2 1 0.2 8 1.6 5 1.0 Total 533 100 533 100 533 100 533 100
From Table 5.10.2, the responses revealed that 85.2 percent of the schools did not have
normal pit toilets for male teachers, 9.2 percent and 3.2 percent had 1 and 2 of those toilets
respectively, while 2.5percent had 3 or more of such toilets. On the number of normal pit
toilets available for female teachers, 87.4 percent of the schools did not have any. The
situation for other types of toilets was not better.
Table 5.10.2: Toilets for Teachers
Number of toilets
Normal pit VIP Others Male Female Male Female Male Female f perce
nt f perce
nt f perce
nt f perce
nt f perce
nt f perce
nt 0 45
4 85.2 46
6 87.4 42
1 79 42
5 80.3 45
3 84.8 51
4 96.4
1 49 9.2 48 9 30 5.6 86 16.1 14 2.6 13 2.4 2 17 3.2 14 2.6 61 11.4 13 2.4 4 0.8 = = 3 5 0.9 1 0.2 7 1.3 2 0.4 3 0.6 = = 4 3 0.6 1 0.2 5 0.9 1 0.2 1 0.2 = = 5 2 0.4 1 0.2 4 0.8 = = = = = =
≥6 3 0.6 2 0.4 5 1.0 3 0.6 58 10.9 6 1.1 Total 53
3 100 53
3 100 53
3 100 53
3 100 53
4 100 53
0 100

51
5.11: Water Supply Sources
The main sources of water supply as shown in Figure 5.11.1 are Rain water (4.7 percent)
stream/river (5.1 percent), well water (28.9 percent), borehole water (37.0 percent), pipe-
borne water (3.0 percent) and tanker water (1.5 percent). However, 19.80 percent of the
schools had no sources of water.
Figure 5.11.1: Sources of Water Supply
5.12: Availability of Useable Games/Sports Facilities in School The responses in Figure 5.12.1 showed that 62.1 percent of the schools had facilities for
football, 43.2 percent handball, 37.1 percent athletics, 39.3 percent volleyball and less than
20.0 percent of the schools had facilities for each of basketball, Table tennis and lawn tennis.
Figure 5.12.1: Available Useable Games/Sports Facilities
0 10 20 30 40
RAIN
STREAM/RIVER
WELL
BOREHOLE
PIPE BORNE WATER
TANKER
NONE
4.7
5.1
28.9
37
3
1.5
19.8
Percent
0 20 40 60 80 100
Athletics
Football
Handball
Lawn Tennis
Table Tennis
Basketball/netball
Volley ball
37.1
62.1
43.2
4.7
10.1
17.8
29.3
49.7
36
52.9
90.2
83.9
77.3
65.5
13.1
1.9
3.9
5.1
6
4.9
5.3
No response No Yes
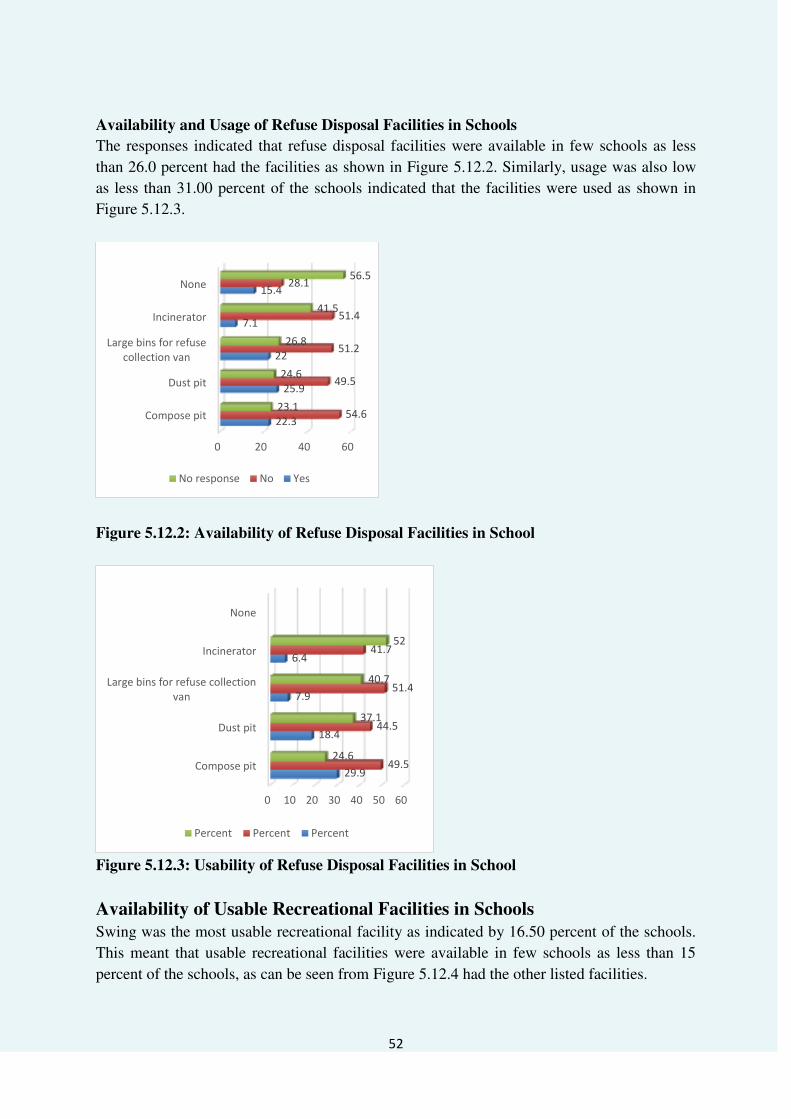
52
Availability and Usage of Refuse Disposal Facilities in Schools
The responses indicated that refuse disposal facilities were available in few schools as less
than 26.0 percent had the facilities as shown in Figure 5.12.2. Similarly, usage was also low
as less than 31.00 percent of the schools indicated that the facilities were used as shown in
Figure 5.12.3.
Figure 5.12.2: Availability of Refuse Disposal Facilities in School
Figure 5.12.3: Usability of Refuse Disposal Facilities in School
Availability of Usable Recreational Facilities in Schools
Swing was the most usable recreational facility as indicated by 16.50 percent of the schools.
This meant that usable recreational facilities were available in few schools as less than 15
percent of the schools, as can be seen from Figure 5.12.4 had the other listed facilities.
0 20 40 60
Compose pit
Dust pit
Large bins for refuse
collection van
Incinerator
None
22.3
25.9
22
7.1
15.4
54.6
49.5
51.2
51.4
28.1
23.1
24.6
26.8
41.5
56.5
No response No Yes
0 10 20 30 40 50 60
Compose pit
Dust pit
Large bins for refuse collection
van
Incinerator
None
29.9
18.4
7.9
6.4
49.5
44.5
51.4
41.7
24.6
37.1
40.7
52
Percent Percent Percent
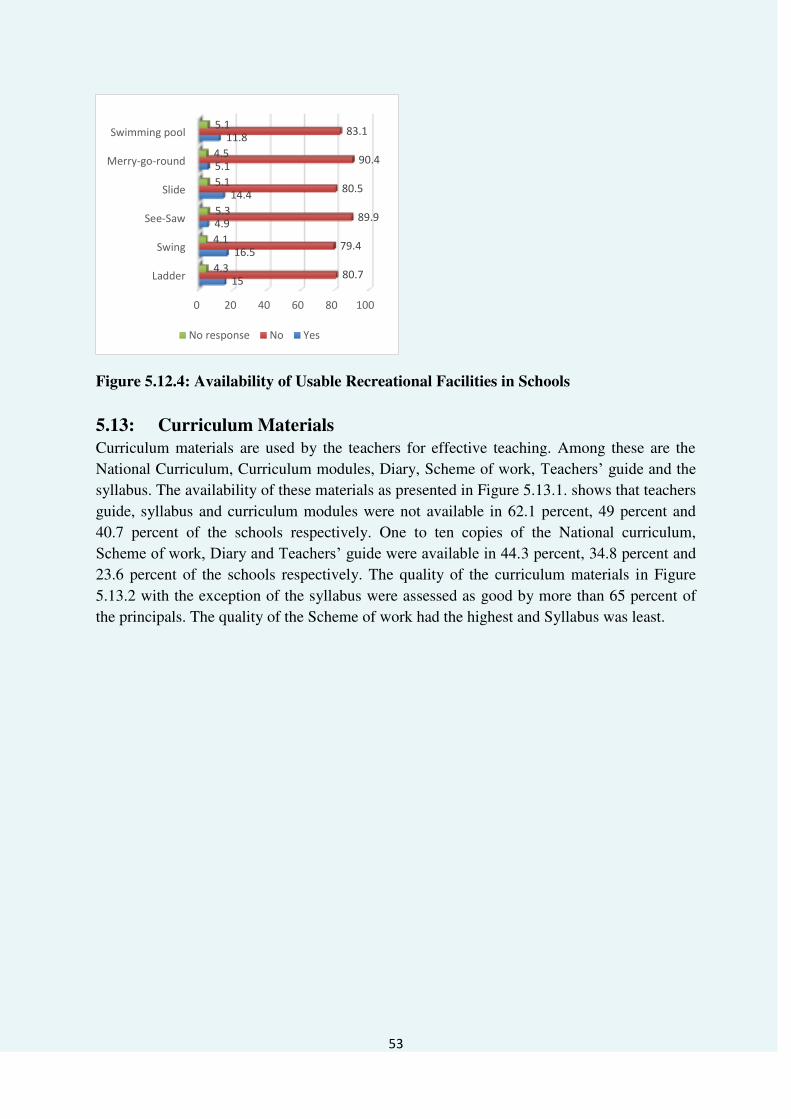
53
Figure 5.12.4: Availability of Usable Recreational Facilities in Schools
5.13: Curriculum Materials
Curriculum materials are used by the teachers for effective teaching. Among these are the
National Curriculum, Curriculum modules, Diary, Scheme of work, Teachers‟ guide and the syllabus. The availability of these materials as presented in Figure 5.13.1. shows that teachers
guide, syllabus and curriculum modules were not available in 62.1 percent, 49 percent and
40.7 percent of the schools respectively. One to ten copies of the National curriculum,
Scheme of work, Diary and Teachers‟ guide were available in 44.3 percent, 34.8 percent and
23.6 percent of the schools respectively. The quality of the curriculum materials in Figure
5.13.2 with the exception of the syllabus were assessed as good by more than 65 percent of
the principals. The quality of the Scheme of work had the highest and Syllabus was least.
0 20 40 60 80 100
Ladder
Swing
See-Saw
Slide
Merry-go-round
Swimming pool
15
16.5
4.9
14.4
5.1
11.8
80.7
79.4
89.9
80.5
90.4
83.1
4.3
4.1
5.3
5.1
4.5
5.1
No response No Yes

54
Figure 5.13.1: Availability of Curriculum Materials
Figure 5.13.2: Quality of Curriculum Materials
0 10 20 30 40 50 60 70
National curriculum (%)
Curriculum modules (%)
Diary (%)
Scheme of work (%)
Teachers’ guide (%)
Syllabus (%)
28.5
40.7
37.3
25.9
62.1
49
44.3
27.9
34.8
44.3
23.6
39.2
9.7
9.2
22.3
24.6
10
8.4
3.8
1.2
3
3.3
3.2
1.8
10.7
21.2
3.1
2.1
1.4
2.1
Number
≥41 21 to 40 11 to 20 1 to 10 0
0 20 40 60 80 100
National curriculum (%)
Curriculum modules (%)
Diary (%)
Scheme of work (%)
Teachers’ guide (%)
Syllabus (%)
76.4
65.7
78
80.7
72.8
59.3
3.9
5.8
4.9
4.7
4.7
14.6
19.7
28.5
17.1
14.6
22.5
26.1
Quality
No response Bad Good

55
Adequacy of the curriculum materials as presented in Figure 5.13.3 was least for national
curriculum (28.9 percent) and highest for scheme of work (43.9 percent). It is observed that
all of the curriculum materials were assessed as adequate by less than 50 percent of the
principals.
Percent
Figure 5.13.3: Adequacy of the Curriculum Materials
5.14: Types of Instructional Materials
The instructional materials used by the teachers as contained in Table 5.14.1, shows a preponderance of textbooks as indicated by 78 percent of the principals; 7.5 percent indicated charts/flipcharts and cardboard by 1.4 percent. On the other hand, only 0.2 percent of the principals indicated that the teachers used graphs, novels, curriculum and textbooks.
Table 5.14.1: Types of Instructional Materials Available in Schools
Frequency percent
Textbooks 1307 78
Blackboard/chalkboard/markboard 60 3.6
Charts/flipcharts 126 7.5
Cardboard 24 1.4
Chalk 15 0.9
Graph 4 0.2
Map 16 1
Novels 3 0.2
Pictures (teaching aid) 38 2.3
Computer 29 1.7
Curriculum 4 0.2
Notebook 4 0.2 Projector 9 0.5
0 10 20 30 40 50
National curriculum (%)
Curriculum modules (%)
Diary (%)
Scheme of work (%)
Teachers’ guide (%)
Syllabus (%)
28.9
32.8
40.5
43.9
34.3
35.6
46
33
33.6
31.7
36.4
31.5
25.1
34.1
25.9
24.4
29.3
32.8
No response Not adequate Adequate

56
Mearsuring tape (measurements) 6 0.4 Science kit 19 1.1 Globe 11 0.7
TOTAL 1,675 100
An assessment of the quality of the instructional materials showed that 34.50 percent of the
principals reported that the instructional materials were of good quality, 3.20 percent said
they were of bad quality, while 62.30 percent of the principals did not respond. On the
appropriateness of the instructional materials, 29.30 percent of the principals reported that
they were appropriate, 8.60 percent considered the instructional materials not appropriate,
while 62.10 percent of the principals did not respond.
Observations and Challenges
School accommodation is a major problem in 75 percent of schools
More than 80 percent of learners lived less than 2km from the schools and more than 70 percent walked to school.
Almost all schools have PTA and they meet as the need arises. This is good as incessant meeting can lead to waste of time if there are no serious issues to discuss. Meeting on a termly basis is equally good as it affords the home and school an opportunity to review developments within the term and therefore enhance the cooperation between the home and school for the benefit of the learners.
Assistance provided to schools was satisfactory in most areas with the exception of buildings. This may not be unconnected with the capital intensive nature of putting up buildings.
Parents paid fees/levies regularly to meet schools operating expenses.
Few schools were fenced but with materials which may not be durable or ensure safety of life and property. But there were security personnel.
Some schools did not have enough space for buildings, playgrounds, and gardens due to location in urban areas.
This situation is further compounded by the few refuse disposal facilities not being put to proper use.
The poor condition of toilet for use by both learners and teachers is unfortunate. It brings to question the Health and Safety standard, necessary for the approval and location of such within communities.
The non-availability or paucity of curriculum materials is of great concern as these are expected to serve as guide to effective teaching and learning. The qualities of these materials were however well rated.
The observation that the adequacy of the national curriculum was the lowest is worrisome as this supposed to be the document from which other curriculum-related materials are to be derived.
Textbooks are the only instructional materials that were really available. Considering the sample under consideration, the number available is far from expectation. Other instructional materials were more or less not available. Thus for teaching to realise its objectives, procurement of more teaching materials is expected.

57
Chapter Six
Attitude of Learners
Attitude is a predisposition to something. Within the school the attitude of the learners is
important as it generally would influence substantially how learning takes place. The learner
has to like the school, the subjects taught in school, the teacher and even school itself.
Attitude is more than liking as it has three main dimensions. These dimensions have been
variously described. It could be seen as strength, accessibility and ambience. Strength, as the
power to influence is very important when attitudes of learners are being considered. To this
extent, this study examined attitude with respect to school, teachers, and subjects taught in
school and schooling itself. It is thought that the results could be helpful in explaining what
happens in the school. In exploring the attitude towards the different attitude objects
cognisance was also taken of the reasons for the positive and negative dispositions.
6.1: Parents Liking for Learners
Parents are the first humans the child comes in contact with; they are involved in the
socialisation of the child and that builds a type of bond which could be positive or negative.
When children like their parents, there is every likelihood they would behave responsibly.
Thus, if sent to school, the child would as a mark of respect endeavour to make the parents
happy by performing well. In this section, two items examined the attitude of parents
towards the learners. Figure 6.1.1 shows that 92.3 percent are liked by their parents while
only 1.3 percent did not feel so liked by the parents.
Figure 6.1.1: Percentage of Parents Liking the Learners
A parent cannot like a child all the time; the child can fall out of favour with the parents.
Thus, it was necessary to find out from parents reasons for liking or not liking their children.
0
10
20
30
40
50
60
70
80
90
100
No Yes No Response
1.3
92.3
6.4
Series1

58
As can be seen in Figure 6.1.2 the most prominent reasons are “obedience” „parents gave
birth to the learners‟ (12.9 percent) and “Passing examinations” (6.1 percent).
Figure 6.1.2: Reasons Parents Like Children
Why do Parents not like children? Responses were expected from the 101 (1.3 percent) who indicate dislike in figure 6.1.1. Reasons provided by 64 learners in Figure 6.1.3. were „I fight always‟ (16.8 percent) „I disobey my parents‟ (13.9 percent) and „I do not go to farm with them‟ 12.9 percent .
Figure 6.1.3: Reasons Parents do not like Children
6.2: Attitude towards School Subjects
Liking subject is seen as a proxy of attitude towards the subject in this study. Learners who
like the subject could be motivated to learn and if all things work well, excel in the subject.
Dislike for the subject can create hatred towards the teacher. In this section, subjects liked,
those not liked and reasons for these were explored. Figure 6.2.1 shows that English (33.6
0 5 10 15 20 25 30 35
I am always passing my exams
I am obedient
I go to farm with them
I help them to sell things
I keep and maintain my textbooks
I take care of my younger ones
They gave birth to me
Others
Invalid Response
No Response
6.1
32.1
0.8
0.8
1.3
0.8
12.9
22.8
4.9
17.6
0 10 20 30 40
I fight always
I disobey my parent
I do not go to farm with them
I do not help them to sell things
I play too much
Others
No response
16.8
13.9
12.9
4
1
14.9
36.6
Percent
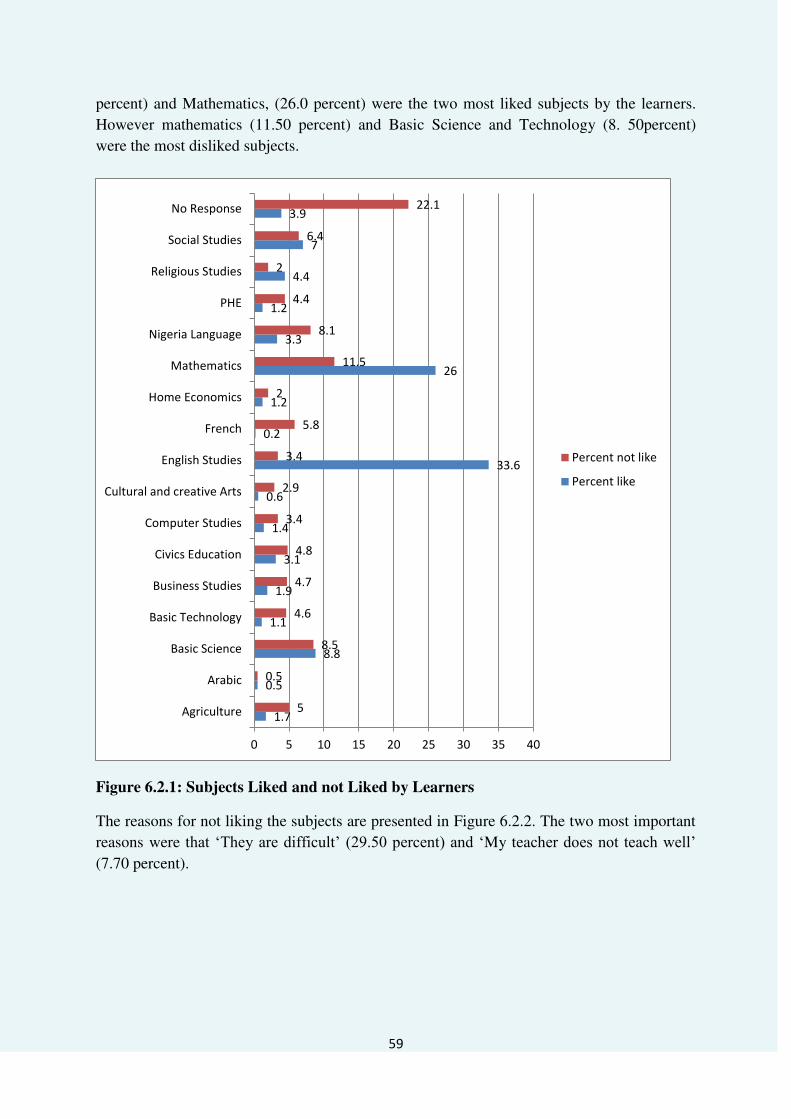
59
percent) and Mathematics, (26.0 percent) were the two most liked subjects by the learners.
However mathematics (11.50 percent) and Basic Science and Technology (8. 50percent)
were the most disliked subjects.
Figure 6.2.1: Subjects Liked and not Liked by Learners
The reasons for not liking the subjects are presented in Figure 6.2.2. The two most important
reasons were that „They are difficult‟ (29.50 percent) and „My teacher does not teach well‟ (7.70 percent).
1.7
0.5
8.8
1.1
1.9
3.1
1.4
0.6
33.6
0.2
1.2
26
3.3
1.2
4.4
7
3.9
5
0.5
8.5
4.6
4.7
4.8
3.4
2.9
3.4
5.8
2
11.5
8.1
4.4
2
6.4
22.1
0 5 10 15 20 25 30 35 40
Agriculture
Arabic
Basic Science
Basic Technology
Business Studies
Civics Education
Computer Studies
Cultural and creative Arts
English Studies
French
Home Economics
Mathematics
Nigeria Language
PHE
Religious Studies
Social Studies
No Response
Percent not like
Percent like
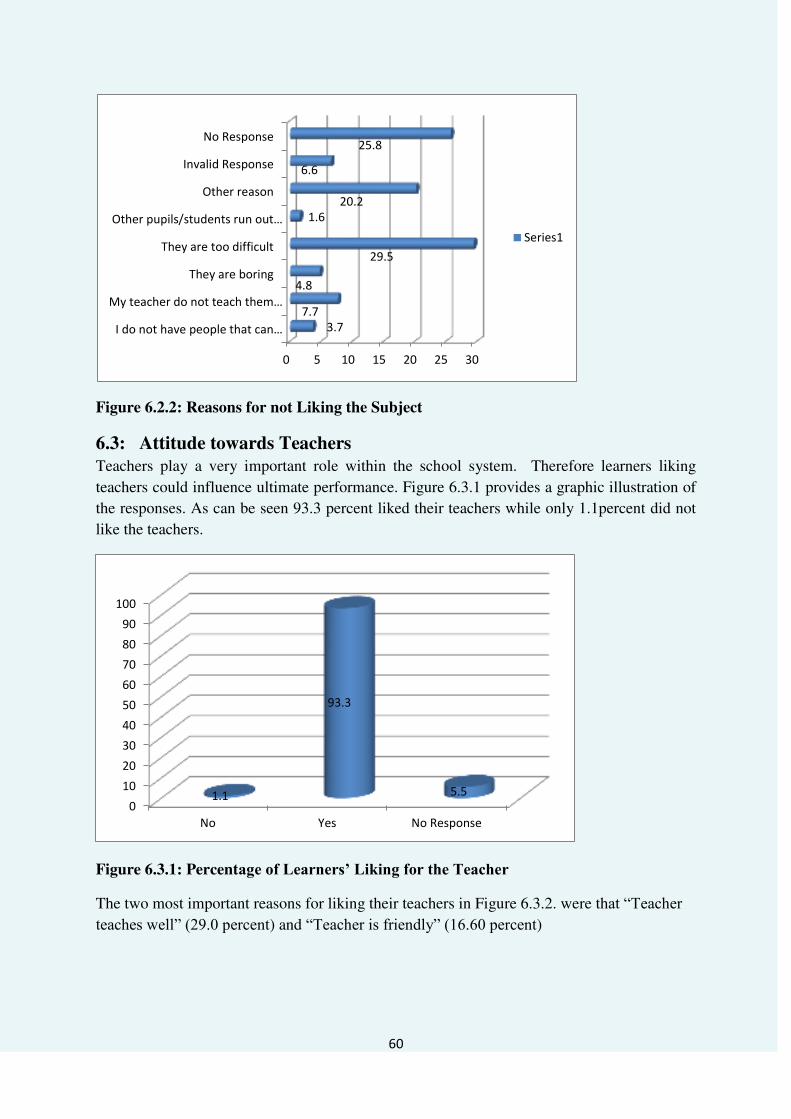
60
Figure 6.2.2: Reasons for not Liking the Subject
6.3: Attitude towards Teachers
Teachers play a very important role within the school system. Therefore learners liking
teachers could influence ultimate performance. Figure 6.3.1 provides a graphic illustration of
the responses. As can be seen 93.3 percent liked their teachers while only 1.1percent did not
like the teachers.
Figure 6.3.1: Percentage of Learners’ Liking for the Teacher
The two most important reasons for liking their teachers in Figure 6.3.2. were that “Teacher teaches well” (29.0 percent) and “Teacher is friendly” (16.60 percent)
0 5 10 15 20 25 30
I do not have people that can…
My teacher do not teach them…
They are boring
They are too difficult
Other pupils/students run out…
Other reason
Invalid Response
No Response
3.7
7.7
4.8
29.5
1.6
20.2
6.6
25.8
Series1
0
10
20
30
40
50
60
70
80
90
100
No Yes No Response
1.1
93.3
5.5
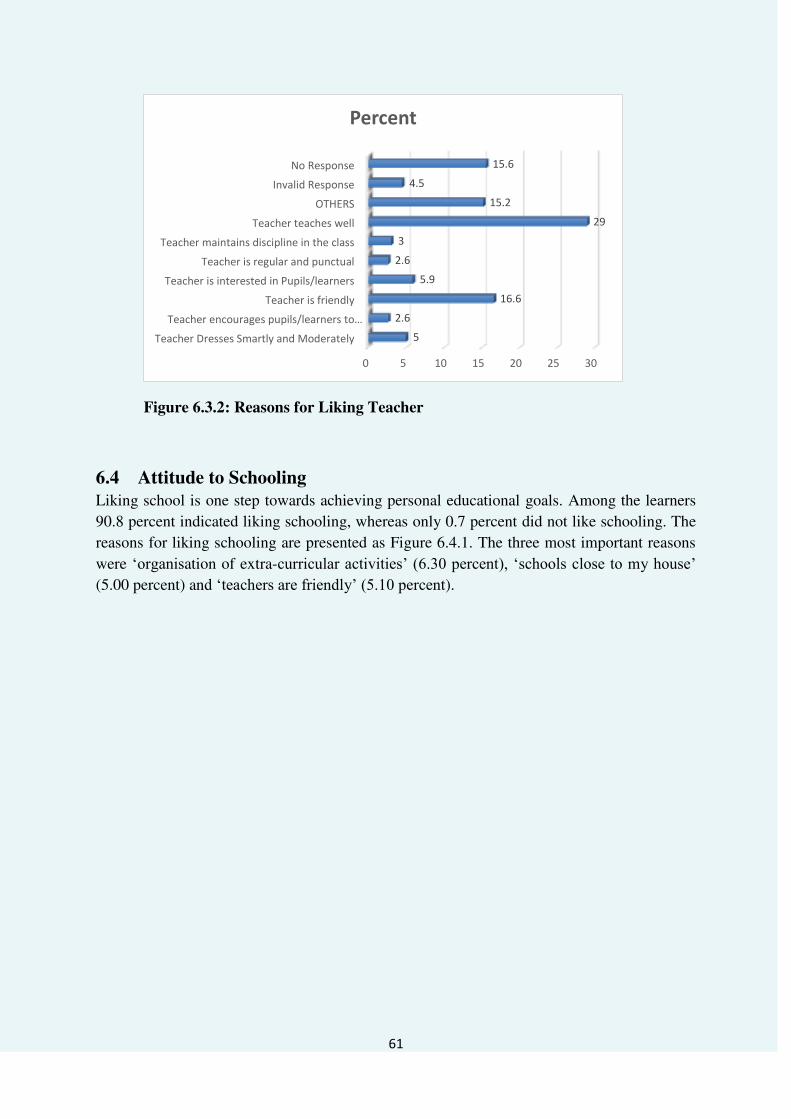
61
Figure 6.3.2: Reasons for Liking Teacher
6.4 Attitude to Schooling
Liking school is one step towards achieving personal educational goals. Among the learners
90.8 percent indicated liking schooling, whereas only 0.7 percent did not like schooling. The
reasons for liking schooling are presented as Figure 6.4.1. The three most important reasons
were „organisation of extra-curricular activities‟ (6.30 percent), „schools close to my house‟ (5.00 percent) and „teachers are friendly‟ (5.10 percent).
0 5 10 15 20 25 30
Teacher Dresses Smartly and Moderately
Teacher encourages pupils/learners to…Teacher is friendly
Teacher is interested in Pupils/learners
Teacher is regular and punctual
Teacher maintains discipline in the class
Teacher teaches well
OTHERS
Invalid Response
No Response
5
2.6
16.6
5.9
2.6
3
29
15.2
4.5
15.6
Percent

62
Figure 6.4.1: Reasons for Liking Schooling
The reasons for not liking schooling in Table 6.1 included „inadequate classroom‟ (0.10 percent), „no motivation from the teachers‟ (0.10 percent) and „teachers do not teach well‟ (0.10 percent). However, it is alarming that 99.40 percent did not respond to the item.
Table 6.1: Reasons for not Liking Schools
N percent
Bullying by other pupils/learners 7 0.00
Interference from other teachers and pupils/learners 1 0.00
Inadequate classroom 9 0.10
Poor management of parents of pupils/learners‟ disciplinary cases 2 0.00
Poor management of pupils/learners with health problem 3 0.00
No support or motivation from the teachers 9 0.10
Poor organisation of co-curricular activities 1 0.00
Teachers do not attend school regularly 4 0.00
Teachers do not teach well 20 0.10
Invalid Response 34 0.20
No Response 14934 99.40
15024 100.00percent
0 5 10 15 20 25 30 35 40
Adequate classroom and Furniture
Beautiful compound with flowers
Organization of Extra curricular
School is close to my house
School maintains discipline
Teachers are friendly
Teachers encourage pupils/learners to
participate
Availability of textbooks and instructional
materials
Others
Invalid Response
No Response
3.3
4.4
6.3
5
4.6
5.1
4.5
1
40
7.7
18.1
Percent

63
Observations and Conclusions
I. The liking of the learners by parents indicated by a very substantial number of the learners is good as parents are role models and seen in this way can be beneficial to the learners. They would work hard to impress the parents which can serve as a pull to
enhance achievement
II. The subjects most liked were mathematics and English studies; this is not unexpected because of their role in the learners‟ future progress.
III. The fact that mathematics is the most hated is of concern as it is the bed rock of science and technology. On the other hand, not liking Nigerian language may lead to their future extinction.
IV. Liking schools and teachers as observed are commendable as these may likely lead to greater performance in schools.
V. Assistance by the community was high and this goes to substantiate the fact made earlier that security personnel are engaged by the school. The use of auxiliary teachers provided by the community is indicative of shortage of teachers that are formally engaged to teach in schools.
VI. The community‟s attitude towards teaching/learning and learners‟ problems and concerns is indicative of good community-school relationship. The attitude towards teachers can further motivate teachers to excel and the community in turn benefits through improved learners achievement.
VII. Schools require enough space for buildings, playgrounds and gardens. The fact that only a few of the schools did not have these available could be due to locational issues particularly in urban areas where land is in short supply and expensive to acquire.
VIII. The existence of cracks can expose learners to hazards and therefore there would be need to fix them. Allowing such situations to persist can make the learning environment uninviting as learners can be scared and consequently begin to dislike schools.
Observations and Challenges
One worrisome issue in this chapter is the preponderance of no response. This probably may have arisen as many items here required free response from the learners. Nonetheless it is hoped that the little information gleaned have partially illumed the situation.
The liking of the learners by parents indicated by a very substantial number of the learners is good as parents are role models and seen in this way can be beneficial to the learners. They would work hard to impress the parents which can serve as a pull to enhance achievement
The subjects most liked were mathematics and English studies; this is not unexpected because of their role in the learners‟ future progress.
The fact that mathematics is the most hated is of concern as it is the bed rock of science and technology. On the other hand, not liking Nigerian language may lead to their future extinction.
Liking school and teachers as observed is commendable as these likely to lead to greater performance in schools.

64
Assistance by the community was high and this goes to substantiate the fact made earlier that security personnel are engaged by the school. The use of auxiliary teachers provided by the community is indicative of shortage of teachers that are formally engaged to teach in schools.
The community‟s attitude towards teaching/learning and learners‟ problems and concerns is indicative of good community-school relationship. The attitude towards teachers can further motivate teachers to excel and the community in turn benefits through improved learners achievement.
Schools require enough space for buildings, playgrounds and gardens. The fact that only a few of the schools did not have these available could be due to location issues particularly in urban areas where land is in short supply and expensive to acquire.
The existence of cracks can expose learners to hazards. Hence, the need to fix them. Allowing such situations to persist can make the learning environment uninviting as learners can be scared and consequently begin to dislike schools.
The fact that there were more females enrolled in this class nationally is indicative that education of females is now being taken seriously. When we, however, consider the distribution across states, this beautiful picture is eroded. Thus, female education should be given greater impetus.
The dropouts rate in Bayelsa and Zamfara States are of great concern.

65
Chapter Seven
English Studies
Achievement in English Studies and relational analyses are presented in this chapter. In particular, the chapter focuses on achievement at national, geo-political zones and at state levels and concludes with relational analysis of contextual variables and achievement.
7.1: National Achievement This sub-section provided results of Multiple choice and Essay Tests, Range and percentile; achievement for gender (male and female) and school location (urban and rural); and achievement in content and cognitive domains.
7.1.1: National Averages
At the national level, the average achievement of learners in Multiple Choice test was 50.28 and in Essay test was 49.94.
7.1.2: Range and Percentile
The distribution in the Multiple and Essay tests shows that more learners concentrated around the lowest score ranging from 0 to 39 percent with Essay test having the higher percentage of
learners. The performance in multiple choice test was better in the score range of 50 and 74 percent. However, more learners performed at the level of 75 percent and above then in Multiple Choice test. Figure 7.1. shows the distribution range in achievement in accordance with the National Grade cluster. As can be seen, the largest proportion of learners, that is, 30.6 percent scored 50-59 percent correct options on the Multiple Choice test while 44.8 percent provided 40-49 percent correct responses in the Essay test. In both test forms, only 1.3 percent and 5.1 percent scored in the range of 70-100 percent. Indeed, achievement was generally Good on the Multiple Choice Test but only Fair in the Essay test.
50.28
49.94
Multiple Choice
Test
Essay Test

66
In Figure 7.2, achievement of the learners was homogeneous at the 10th, 25th and 90th percentile. More learners performed at the 50th and 75th percentile in the Multiple Choice test and the Essay test.
7.1.3: Group Achievement
Table 1 shows the score ranges in the Multiple Choice Test and Essay test based on gender and location. There were little variations between the grouping variables and achievements in both test types. Indeed, the variations were not significant.
7.1.4: Achievement in
Content Domains
There were five themes (content domain) in the curriculum of Junior Secondary Schools English Studies (Speech, Reading, Grammatical accuracy and Literature). Items were generated from each of the five themes. The content domain in this chapter was limited to only Multiple Choice test.
Learners had the highest mean score of 56.7 per cent in items relating to Speech than in the other content domains. Achievement in Reading related issue ( ̅ 47.2 percent) ranked second whereas learners found the items on writing skills relatively difficult ( ̅ 38.56 percent).
Table7.1: Distribution of Mean and Standard Error of
Performance in Multiple Choice and Essay
Tests by Location, School Type and Gender
Variables Sources of variation
Multiple Choice Essay Mean SE Mean SE
Sex Male 49.99 0.16 49.98 0.16 Female 50.60 0.17 49.90 0.17
Location Urban 50.14 0.16 49.87 0.16 Rural 50.44 0.17 50.03 0.17
0 20 40 60
SPEECH
READING
GRAM ACCURACY
WRITING
LITERATURE
56.7
47.2
43.41
38.56
45.02
Figure 7.3 Learners’ Achievement in Content Domains
0
50
100
10th 25th 75th 10th 50th 90th
Multiple Choice Essay
29
.22
36
.1
53
.88
0.8
1 21
.82
61
.97
Figure 7.2 Percentile of JS 2 Learners in Multiple Choice and Essay tests

67
Achievement in Cognitive Domains Learners answered correctly the least items in English Studies that measured knowledge ( ̅ 39.87 percent), more items in comprehension ( ̅ 45.65 percent) and most in items related to higher order.
7.2: Achievement across
Geopolitical Zones Fig 7.5 shows the distribution of mean scores of learners across the geo-political Zones, with large difference between the North East zone (44.85) and South East zone (54.64). Scores of learners in the North East, North West, and North Central Zones were below the National average. South South ( ̅ 52.67), South West ( ̅ 53.11), and South East ( ̅ 54.64) scored above the national average. Learners from the South East obtained the highest mean score of 54.64 while learners in North East had the least mean score of 44.85.
Figure 7.6 shows the distribution of means scores of learners in Essay test across the Geo-political zones. North Central had the least mean score of ̅ 49.23, and North West with a mean of 50.36 as the highest. Learners in South East, South South and North West scored above the National average of 49.94.
0.00
10.00
20.00
30.00
40.00
50.00
60.00
44
.85
47
.44
49
.19
50
.28
52
.67
53
.11
54
.64
Figure 7.5: Distribution of Mean Scores in Multiple
48.6048.8049.0049.2049.4049.6049.8050.0050.2050.40
49.23
49.58
49.81 49.94
50.16 50.35 50.36
Figure 7.6: Achievement Tests of Learners in Essay
in Geopolitical Zones
39.87 45.65
54.81
0
10
20
30
40
50
60
KNOWLEDGE COMPREHENSION HIGHER ORDER
Figure 7.4 Achievement in Cognitive Domains

68
10.2.2 Group Achievement across the Geo-Political Zones Figure 7.7 shows that there are no large differences in the male and female learners‟ achievement across the geo-political zones in the Multiple Choice test. Both groups of learners in South East, South South and South West scored above the National average. Female learners in the South East zone had the highest mean score of 54.77 for male and female samples. The least scores of 44.53 and 45.27 were obtained by male and female learners respectively in the North East zone. As can be seen in Table 7.2, there was little variation in the mean scores by gender in the six geo-political
zones in the Essay Test. Male learners in North West with a mean of 50.67 and South East 50.19 scored above the National average for males while female learners in South East, with a mean of 50.13 and South-South 50.75 scored above the National average. Table 7.2: Distribution of Mean Scores in Essay Test across Geo-political Zones based
on Gender
T_SCORE _ESSAY Male Female
Mean SE Mean SE
North Central 49.12 0.40 49.35 0.45 North East 49.77 0.38 49.34 0.43 North West 50.67 0.35 49.86 0.42 South East 50.19 0.42 50.13 0.42 South South 49.94 0.41 50.75 0.45 South West 49.82 0.39 49.80 0.39 National 49.98 0.16 49.90 0.17
Table 7.3 shows the achievement of learners across the Geopolitical zones based on school location in the Multiple choice test, achievement was more homogeneous, that is, concentration in a narrow range between urban and rural learners in the north Central (Urban 48.03, Rural 44.63) South East (Urban 54.61, Rural 55.61) and South-South (Urban 52.72, Rural 51.51). Whereas, scores of learners were more heterogeneous in North East (Urban 44.75, Rural 49.17) North West (urban 47.24, Rural 55.56) and South West (Urban 52.99, Rural 56.78) and the differences were statistically significant.
Also, learners in urban and rural schools in South East, South-South and South West, and those in rural schools in North West obtained mean scores higher than the National averages.
0.00 20.00 40.00 60.00
NORTH CENTRAL
NORTH EAST
NORTH WEST
SOUTH EAST
SOUTH SOUTH
SOUTH WEST
NATIONAL
48.95
44.53
47.79
54.48
52.86
53.14
49.99
49.45
45.27
46.91
54.77
52.48
53.07
50.60
Female
Male
Figure 7.7: Distribution of Mean Scores in Multiple Choice Test across Zones

69
In respect of Essay Test, achievement scores were more homogeneous within and between zones. However, learners in both locations in North West and South East zone, urban learners in South-South and rural learners in South West had mean scores above their respective National averages. Overall, learners in rural school learners seem to have out-performed their counterparts in urban schools.
Table 7.3: Learners’ Performance in Multiple and Essay Tests across Geo-political and
School Location
GEOPOLITICAL ZONES
School Location
Multiple Choice
Essay
Mean SE Mean SE NORTH CENTRAL
Urban 48.03 0.35 49.34 0.34 Rural 48.63 1.61 50.49 1.39
NORTH EAST Urban 44.75 0.25 49.59 0.29 Rural 49.17 1.84 48.53 2.08
NORTH WEST Urban 47.20 0.27 50.35 0.27 Rural 55.48 4.63 50.79 5.23
SOUTH EAST Urban 54.61 0.27 50.16 0.30 Rural 55.56 0.71 51.65 0.80
SOUTH SOUTH Urban 52.72 0.27 50.34 0.31 Rural 51.51 1.78 48.88 2.13
SOUTH WEST Urban 52.99 0.26 49.84 0.29
Rural 56.78 1.31 50.07 1.36
NATIONAL Urban 50.14 1.11 99.87 1.28 Rural 50.44 1.03 50.3 1.11

70
0.00 20.00 40.00 60.00 80.00
NORTH
CENTRAL
NORTH EAST
NORTH WEST
SOUTH EAST
SOUTH
SOUTH
SOUTH WEST
NATIONAL
54.91
46.46
49.86
65.43
62.12
62.17
56.70
46.06
38.93
42.12
53.95
51.08
51.59
47.20
41.79
38.31
41.16
47.68
44.62
46.82
43.41
37.67
32.92
36.45
42.55
40.85
41.06
38.56
43.18
36.20
40.68
51.99
49.40
49.05
45.02
LITERATURE
WRITING
GRAMMATICAL_ACCU
READING
SPEECH
Figure 7.8 Achievement in Content Domains across the Geopolitical
Content Domain At the National level, the highest mean score of 56.70 was on items that examined speech
Reading with a mean of 47.20.
Generally, achievement was with the cluster 40-49 percent, representing Fair. Further observation of the results revealed similar trends across the zones. Learners from North East had the least scores in all the content domain while those from South |East obtained the highest mean scores in the five content domains. Also, learners from the South East, South South and South West zones scored above the National averages on the five content domains. In spite of this observation, learners, both at the National and Zonal levels obtained the least scores on
items which measured Writing skills (National 38.56 percent, North East 32.92, North West 36.45, North Central 37.92, South South 40.85, South East 41.06 and South East 42.55). The top three scores of 62.12, 62.17 and 65.43 were on speech domain. These observations seem to suggest that learners had more difficulties in Writing skills and least on speech domain.

71
0.00 20.00 40.00 60.00 80.00
NORTH CENTRAL
NORTH EAST
NORTH WEST
SOUTH EAST
SOUTH SOUTH
SOUTH WEST
NATIONAL
38.46
33.62
37.35
44.93
41.98
42.96
39.87
44.56
38.04
42.38
51.06
48.94
49.19
45.65
52.70
45.90
47.95
62.78
59.90
60.25
54.81
HIGHER order
COMPREHENSION
KNOWLEDGE
Figure 7.9: Distribution of Mean Score by Geo-political Zone on the Level
of Cognition of English Studies
Cognitive Domain
As can be seen in figure 7.9
Achievement at the National level and
Geopolitical Zones revealed a consistent Pattern of increase in mean scores on
Knowledge, through
comprehension to Higher order on the cognitive level. Three zones, South East, South South and South West scored above the
National average of each Cognitive
domain. Learners in South East zone had the
highest mean scores of 62.78, 51.06 and 44.93 on Higher order from comprehension and knowledge domain respectively. While their counterparts obtained the least mean scores of 45.90, 38.04 and 33.62 on Higher Order, Comprehension and Knowledge domains respectively.
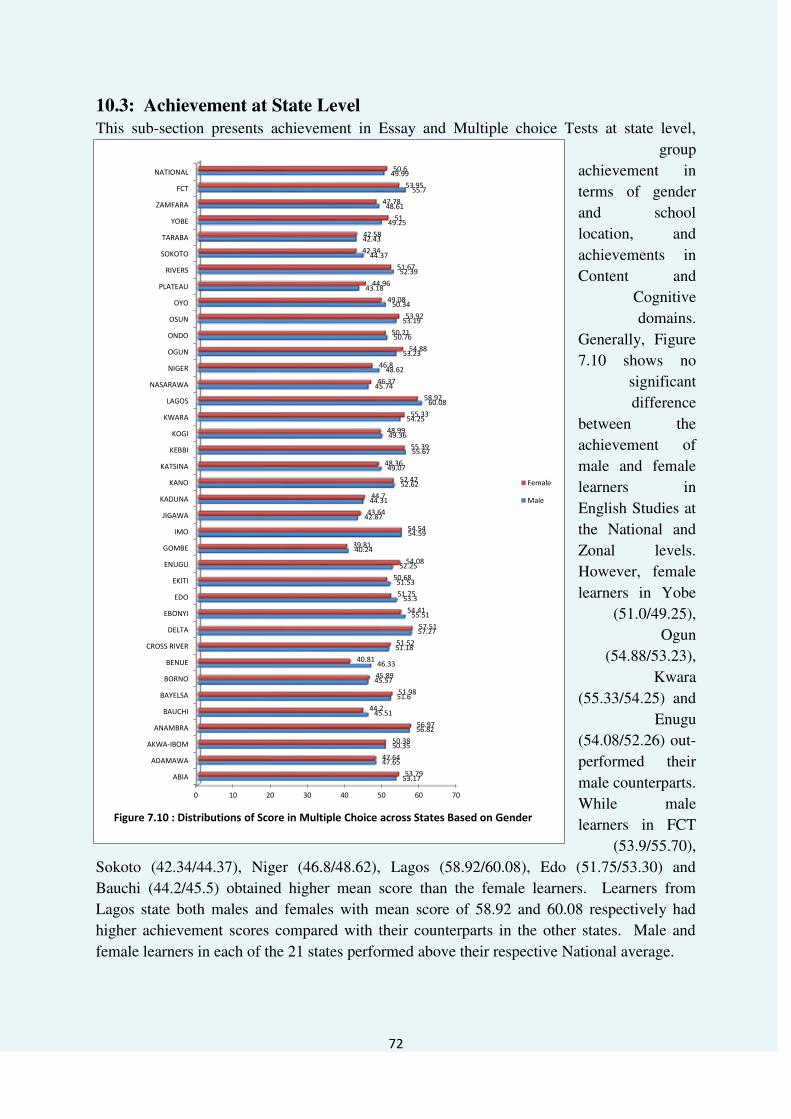
72
10.3: Achievement at State Level
This sub-section presents achievement in Essay and Multiple choice Tests at state level,
group
achievement in
terms of gender
and school
location, and
achievements in
Content and
Cognitive
domains.
Generally, Figure
7.10 shows no
significant
difference
between the
achievement of
male and female
learners in
English Studies at
the National and
Zonal levels.
However, female
learners in Yobe
(51.0/49.25),
Ogun
(54.88/53.23),
Kwara
(55.33/54.25) and
Enugu
(54.08/52.26) out-
performed their
male counterparts.
While male
learners in FCT
(53.9/55.70),
Sokoto (42.34/44.37), Niger (46.8/48.62), Lagos (58.92/60.08), Edo (51.75/53.30) and
Bauchi (44.2/45.5) obtained higher mean score than the female learners. Learners from
Lagos state both males and females with mean score of 58.92 and 60.08 respectively had
higher achievement scores compared with their counterparts in the other states. Male and
female learners in each of the 21 states performed above their respective National average.
0 10 20 30 40 50 60 70
ABIA
ADAMAWA
AKWA-IBOM
ANAMBRA
BAUCHI
BAYELSA
BORNO
BENUE
CROSS RIVER
DELTA
EBONYI
EDO
EKITI
ENUGU
GOMBE
IMO
JIGAWA
KADUNA
KANO
KATSINA
KEBBI
KOGI
KWARA
LAGOS
NASARAWA
NIGER
OGUN
ONDO
OSUN
OYO
PLATEAU
RIVERS
SOKOTO
TARABA
YOBE
ZAMFARA
FCT
NATIONAL
53.17
47.65
50.35
56.82
45.51
51.6
45.57
46.33
51.18
57.27
55.51
53.3
51.53
52.25
40.24
54.59
42.87
44.31
52.62
49.07
55.67
49.36
54.25
60.08
45.74
48.62
53.23
50.76
53.19
50.34
43.18
52.39
44.37
42.43
49.25
48.61
55.7
49.99
53.79
47.64
50.38
56.97
44.2
51.98
45.89
40.81
51.52
57.51
54.41
51.75
50.68
54.08
39.81
54.54
43.64
44.7
52.42
48.36
55.39
48.99
55.33
58.92
46.37
46.8
54.88
50.21
53.92
49.08
44.96
51.67
42.34
42.58
51
47.78
53.95
50.6
Female
Male
Figure 7.10 : Distributions of Score in Multiple Choice across States Based on Gender

73
Performance across the States Achievement in Essay Test as can be seen in Table 7.4 was homogeneous at the National level with mean values of 49.98 for male learners and 49.90 for female learners. State level analysis shows a similar pattern except in Bayelsa, (54.0), Kebbi (52.9), Ogun (51.37) and Plateau (51.43) where male learners had two point difference above the female learners. In Akwa Ibom (53.33), Edo (50.09) and Abia (50.79), the female learners obtained higher scores than the male learners. However these differences were not significant. Further observation of Table 7.4 revealled that female learners from 17 states had mean scores above the National average while in only 19 states, the male learners scored above their National average.
Table7.4: Achievement across the States based on Gender in
Essay Test
STATE Male Female
Mean SE Mean SE ABIA 49.55 1.11 50.79 1 ADAMAWA 49.92 1.01 51.25 1.14 AKWA-IBOM 51.4 1.04 53.33 0.98 ANAMBRA 49.46 0.88 49.29 0.89 BAUCHI 50.82 1.01 47.47 0.92 BAYELSA 54 1.49 51.81 1.77 BORNO 49.53 0.89 48.75 0.97 BENUE 45.4 1.31 48.01 2.43 CROSS RIVER 48.2 0.88 49.21 1.1 DELTA 49.7 0.88 50.04 1.06 EBONYI 51.07 0.83 50.08 0.93 EDO 48.46 0.97 50.69 1.11 EKITI 50.52 0.99 48.94 1.1 ENUGU 49 0.84 49.58 0.88 GOMBE 49.46 0.84 51.15 1.21 IMO 51.79 1.03 50.93 0.95 JIGAWA 50.56 0.98 50.14 1.01 KADUNA 50.73 0.93 50.84 0.95 KANO 49.75 1.06 50 1.34 KATSINA 53 1.1 51.59 1.62 KEBBI 52.9 0.94 50.89 1.14 KOGI 48.1 0.93 48.03 1.36 KWARA 48.07 0.86 49.27 0.86 LAGOS 50.8 0.98 49.86 0.96 NASARAWA 50.12 1.29 49.32 1.28 NIGER 49.03 0.85 50.81 1.27 OGUN 48.63 1 49.16 0.89 ONDO 48.56 0.85 50.43 1.09 OSUN 51.37 0.96 49.04 0.83 OYO 49.18 1.02 51.31 0.91 PLATEAU 51.43 0.99 49.42 0.87 RIVERS 49.55 0.92 49.53 0.94 SOKOTO 49.76 0.81 48.15 0.87 TARABA 49.44 0.86 48.45 0.97 YOBE 49.77 1 49.64 1.09 ZAMFARA 48.88 0.76 47.63 1.09 FCT 48.7 1.38 49.72 1.3 NATIONAL 49.98 0.16 49.9 0.17

74
Achievement by School Location
Table 7.5 provides the National averages of 50.14 and 50.44 for urban and rural learners respectively on the Multiple Choice test, and the Essay Test, National average for urban
learners was 49.87 and 50.03 for rural learners. Mean scores at the State level are
generally concentrated
within a narrow range and therefore
homogeneous as in the
National averages.
However, the mean scores for rural learners in Kogi (50.04) and Lagos (60.77) showed some variation from their
urban counterparts on the Multiple Choice test while mean score of urban learners in Ondo (50.75) showed at least a two points
difference between the urban learners. In the Essay
Test, achievement of urban learners in Adamawa (51.01), Akwa
Ibom (53.99) was higher than the rural learners. While rural learners in Bayelsa out-performed their counterparts in urban schools.
Table 7.5 Achievement in Type of Test by Location Multiple Choice Essay URBAN RURAL URBAN RURAL Mean SE Mean SE Mean SE Mean SE
ABIA 53.94 0.79 52.96 0.97 49.7 0.99 51.01 1.12
ADAMAWA 48.09 0.93 47.23 0.93 51.76 1.19 49.45 0.94
AKWA-IBOM 50.19 0.79 50.49 0.66 53.99 1.14 51.32 0.91
ANAMBRA 56.5 0.83 57.29 0.8 49.04 0.88 49.7 0.9
BAUCHI 44.98 0.79 44.75 0.75 48.21 0.87 50.1 1.06
BAYELSA 51.39 0.8 53.11 1.8 52.28 1.25 55.29 2.73
BORNO 45.39 0.76 46.19 1.08 49.48 0.83 48.8 1.1
BENUE 43.57 1.32 46.7 1.38
CROSS RIVER 52.19 0.91 50.38 0.96 48.13 0.99 49.28 0.97
DELTA 57.58 0.84 57.2 0.78 50.72 1 49.05 0.93
EBONYI 54.24 0.92 55.61 0.87 50.61 0.89 50.58 0.87
EDO 51.75 0.99 53.32 1.11 50.39 0.99 48.78 1.13
EKITI 51.49 0.78 50.77 0.82 49.79 1.06 49.73 1.03
ENUGU 53.56 0.87 52.84 0.84 49.44 0.9 49.16 0.83
GOMBE 40.31 0.6 39.9 0.45 51.05 0.98 49.02 0.98
IMO 54.43 0.73 54.69 0.81 51.09 0.91 51.58 1.06
JIGAWA 43.23 0.66 43.19 0.73 51.21 0.93 49.08 1.06
KADUNA 45.11 0.97 44.2 0.66 50.18 1.1 51.08 0.83
KANO 52.85 1.34 52.15 1.53 50.22 1.14 49.32 1.2
KATSINA 47.9 1.3 49.35 0.91 53.24 1.56 52.21 1.13
KEBBI 55.78 1.2 55.39 1.07 51.79 1.17 52.27 0.93
KOGI 48.24 1.06 50.04 1.06 47.54 1.1 48.55 1.13
KWARA 55.66 0.83 53.98 0.8 47.93 0.79 49.44 0.92
LAGOS 58.54 0.83 60.77 0.89 48.84 0.84 52.38 1.13
NASARAWA 45.71 1.25 46.42 1.4 50.14 1.27 49.29 1.31
NIGER 47.71 1.12 47.93 1.12 49.2 1.07 50.43 1.01
OGUN 53.65 0.9 54.58 0.91 49.37 1 48.46 0.88
ONDO 50.75 0.61 48.4 1.66 49.36 0.71 49.08 2.15
OSUN 53.46 0.74 53.73 0.66 50.51 1 49.65 0.82
OYO 49.21 0.81 50 0.84 49.78 0.95 51.02 0.98
PLATEAU 43.55 0.68 44.56 0.82 50.99 0.91 49.9 1.01
RIVERS 52.47 0.79 51.53 0.88 48.94 0.9 50.15 0.97
SOKOTO 43.85 0.87 43.23 0.8 49 0.89 49.2 0.82
TARABA 42.3 0.59 42.89 0.96 48.9 0.77 49.24 1.17
YOBE 49.21 0.82 51.93 1.17 50.17 0.93 48.8 1.21
ZAMFARA 48.87 0.77 47.51 1.02 48.43 0.8 48.66 1.01
FCT 54.06 1.18 55.45 1.52 48.98 1.14 49.79 1.66
NATIONAL 50.14 0.16 50.44 0.17 49.87 0.16 50.03 0.17
75
It is also notable that urban learners in 20 states and rural learners in 19 states obtained scores above their national averages for the Multiple Choice test. Whereas in the Essay test, urban learners in 17 states and rural learners in 13 states had mean scores higher than their National averages.
Figure 7 provides the distribution of achievement scores on both test forms on state basis. Score on the Essay test are in parentheses with a National average of 50.0. Also the National average on the Multiple Choice Test is 50.0. Further observation shows the following:
Score range on the Multiple Choice Test was 40.0 (Gombe) to 59.0 (Lagos) and on the Essay Test 47.0 (Benue) to 53.0 (Katsina). Achievement on the Multiple Choice Test was more homogeneous than in the Essay Test.
Learners in four states, namely Kebbi (56.52), Imo (55.51), Ebonyi (55.51) and Bayelsa (52/53) scored above the National averages for the Multiple Choice and Essay Test forms.
On the Multiple Choice Test, the highest and lowest scores were obtained by learners from Lagos (59.0) and Gombe (40.2) respectively while on the Essay Test, the highest score was from Katsina (53.0) and the least from Benue (47.0).

76
Mean Score of JSS 2 Learners in English
Note:
i. Learners‟ score in multiple choice are out of the parentheses
ii. Learners‟ score in essay are in the parentheses
56(52)
44(49)
49(53)
48(50)
55(49)
50(50)
54(49)
59(50)
48(49)
55(49)
53(50
44(51)
43(50
50(50)
45(49)
40(50)
42(49) 49(48
52(50)
51(49)
55(51)
52(50)
52(53) 50(52)
46(50)
46(49)
48(51
44(51
52(50)
57(49) 55(51)
54(50)
53(49)
51(50)
54(50)
51(49) 44(47)
Average National Score=
50(50)

77
0 20 40 60 80
GOMBE
JIGAWA
TARABA
SOKOTO
BENUE
PLATEAU
KADUNA
BAUCHI
NASARAWA
BORNO
ZAMFARA
KATSINA
ADAMAWA
NIGER
KOGI
YOBE
OYO
NATIONAL
AKWA-IBOM
KANO
EKITI
ONDO
CROSS RIVER
BAYELSA
RIVERS
EDO
ENUGU
OSUN
FCT
ABIA
KEBBI
OGUN
EBONYI
KWARA
IMO
ANAMBRA
DELTA
LAGOS
36.97
41.48
41.71
42.9
44.91
45.19
45.53
45.78
47.76
48.91
52.04
52.71
52.77
53.33
55.65
56.27
56.49
56.7
57.06
57.06
57.53
57.89
59.59
60.88
61.09
61.6
62.52
62.95
62.98
64.03
64.61
64.61
64.99
65.66
66.71
68.82
71.47
73.27
SPEECH
Figure 7.11: Learners' Achievement in Speech across States
Achievement on Content Domains
Figure 7.11 shows that the National average achievement on Speech was 56.70. Learners in
20 states performed above
the national average on
speech. While 17 states
performed below. States that
are above the national
average include: Lagos
(73.27), Delta (71.42), Imo
(66.71), Ebonyi (64.99) and
Kebbi (64.61). States that
had below the national
average includes: Gombe
(36.97), Taraba (41.71) and
Benue (44.91). Achievement
is wide spread from 36.97 in
Gombe to 73.27 in Lagos. In
relation to the National
average, 56.7 percent of the
learners at the National level
and 73.27 percent in Lagos
and 36.97 percent in Gombe
respectively provided the
correct options to the items
which measured Speech
skills.

78
0 10 20 30 40 50
GOMBE
SOKOTO
JIGAWA
BAUCHI
KADUNA
NIGER
KOGI
AKWA-IBOM
OYO
NATIONAL
EKITI
CROSS RIVER
ENUGU
EDO
OGUN
KANO
FCT
ANAMBRA
DELTA
27.84
30.53
31.68
31.89
31.93
31.94
32.68
32.85
33.37
34.14
36.51
36.74
36.88
37.19
37.67
37.73
37.99
38.15
38.56
38.81
39.43
39.44
39.51
39.61
40.93
41.47
41.6
41.62
41.8
42.34
43.02
43.41
43.47
44.21
44.63
44.77
46.6
47.6
Writing Skills
Figure 7.12 Learners' Achievement in Writing across States
Cognitive Domains
Figure 7.12 indicates the achievement of learners across the state in writing. As can be seen the achievement of learners was generally poor, such that the highest mean is less than 50, Lagos (47.6), Delta (46.6), and Kebbi (44.77) while Sokoto (31.68), Taraba (30.53) and Gombe (27.84) had the least mean scores. Nineteen states had mean scores greater than the National average of 38.56.

79
Reading Figure 7.13 shows the achievement of learners in Reading across the states. Learners in 21 states performed above the national average. The score range of 31.18 in Gombe to 60.83 in Lagos shows that achievement was Fair in 13 states and Good in 14 other states. Learners in Lagos state (60.83), Delta (58.87) and Anambra (57.05) had the top three mean scores. While Gombe (31.18), Taraba (34.95) and Jigawa (35.72) were the least.
0 10 20 30 40 50 60 70
GOMBE
TARABA
JIGAWA
SOKOTO
BENUE
PLATEAU
KADUNA
BAUCHI
BORNO
NASARAWA
ADAMAWA
NIGER
ZAMFARA
KATSINA
AKWA-IBOM
KOGI
NATIONAL
OYO
ONDO
YOBE
EKITI
KANO
CROSS RIVER
RIVERS
BAYELSA
EDO
ENUGU
FCT
OSUN
ABIA
OGUN
KEBBI
EBONYI
IMO
KWARA
ANAMBRA
DELTA
LAGOS
31.18
34.95
35.72
35.91
36.79
37.6
37.75
38.74
39.85
40.34
43.81
44.74
44.8
44.96
46.78
46.83
47.2
47.24
47.39
48.08
48.13
48.48
48.88
50.16
50.2
50.88
51.26
52.17
52.47
53.14
53.17
53.53
53.6
54.67
55.51
57.05
58.87
60.83
READING
Figure 7.13: Learners' Achievement in Reading across States
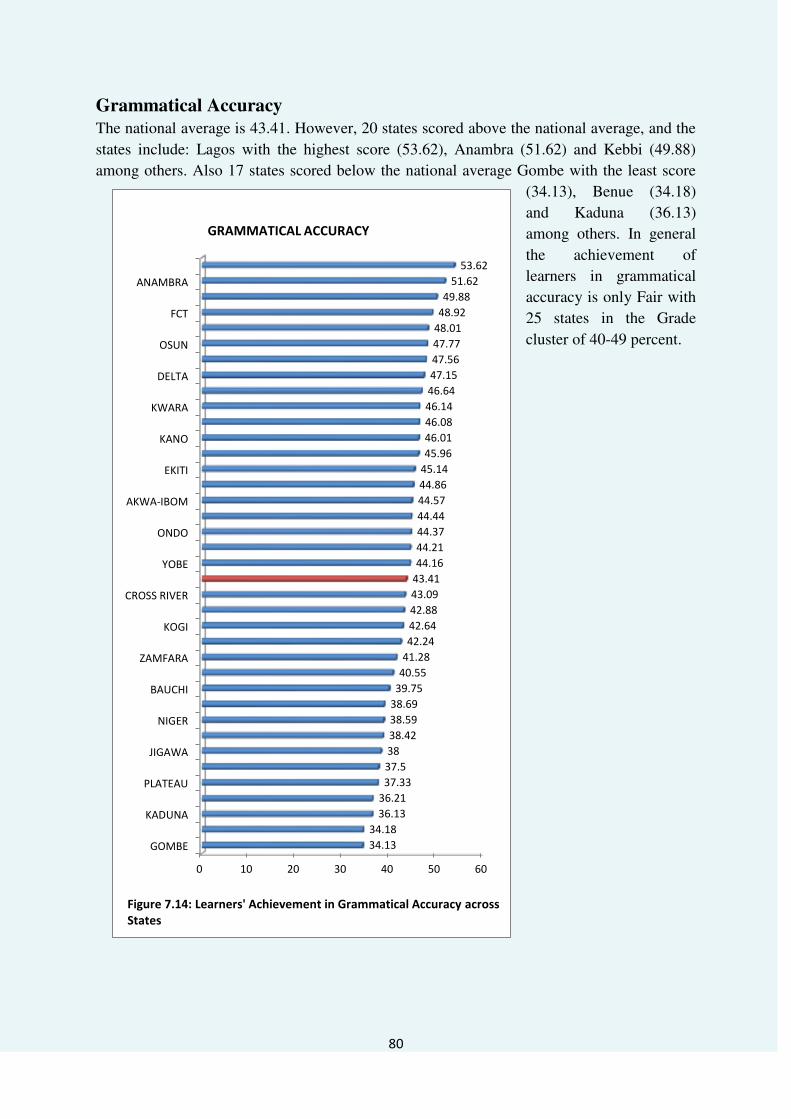
80
Grammatical Accuracy
The national average is 43.41. However, 20 states scored above the national average, and the
states include: Lagos with the highest score (53.62), Anambra (51.62) and Kebbi (49.88)
among others. Also 17 states scored below the national average Gombe with the least score
(34.13), Benue (34.18)
and Kaduna (36.13)
among others. In general
the achievement of
learners in grammatical
accuracy is only Fair with
25 states in the Grade
cluster of 40-49 percent.
0 10 20 30 40 50 60
GOMBE
KADUNA
PLATEAU
JIGAWA
NIGER
BAUCHI
ZAMFARA
KOGI
CROSS RIVER
YOBE
ONDO
AKWA-IBOM
EKITI
KANO
KWARA
DELTA
OSUN
FCT
ANAMBRA
34.13
34.18
36.13
36.21
37.33
37.5
38
38.42
38.59
38.69
39.75
40.55
41.28
42.24
42.64
42.88
43.09
43.41
44.16
44.21
44.37
44.44
44.57
44.86
45.14
45.96
46.01
46.08
46.14
46.64
47.15
47.56
47.77
48.01
48.92
49.88
51.62
53.62
GRAMMATICAL ACCURACY
Figure 7.14: Learners' Achievement in Grammatical Accuracy across
States

81
Figure 7.15 shows a National average score of 45.02 on Literature content domain. Learners
in 20 states performed
above the national
average. Achievement
scores ranged from as
low as 28.98 in Gombe
to 59.40 in Lagos.
Overall achievement
was poor in 10 states,
Fair (0-39) in 17 states
(40-49) and Good in
10 states (50-59).
Lagos (59.46), Delta
(57.63) and Anambra
(54.78) had the highest
mean scores. Also, 17
states scored below the
national average with
Gombe (28.98), and
Taraba (32.62) and
Jigawa (33.34) at the
bottom.
0 10 20 30 40 50 60
GOMBE
TARABA
JIGAWA
PLATEAU
SOKOTO
BAUCHI
BENUE
KADUNA
NASARAWA
BORNO
KATSINA
ZAMFARA
ADAMAWA
NIGER
KOGI
YOBE
OYO
NATIONAL
AKWA-…ONDO
EKITI
BAYELSA
CROSS…RIVERS
OSUN
ABIA
ENUGU
EDO
KANO
OGUN
KWARA
IMO
FCT
EBONYI
KEBBI
ANAMBRA
DELTA
LAGOS
28.98
32.62
33.34
34.79
34.85
35.51
36.49
37.39
37.94
38.49
40.96
41.24
41.44
41.58
42.05
42.88
43.01
45.02
45.09
45.25
46.13
47.36
47.63
47.68
49.42
49.81
49.85
49.93
50.33
50.78
52.03
52.12
52.57
53.37
53.74
54.78
57.63
59.46
LITERATURE
Figure 7.15: Learners' Achievement in Literature across

82
Cognitive Domain Knowledge Achievement of learners on items which assessed knowledge in figure 7.16 shows a National average of 39.87. Across the states, the national average of learners performance across the states in knowledge is less than 50 percent, however 21 states scored above the national average, these states includes: lagos with the highest Lagos has the highest score of 51.05, next is Anambra (48.37) and then Kebbi (47.95) among 21 states that scored above the National average. Also, 16 states scored below the national average with Gombe (28.36), Benue (30.88) and Taraba (30.94) at the bottom. The score of 28.36 in Gombe to 51.05 in Lagos shows a more homogeneous or normal spread of scores. Achievement of learners on items which assessed knowledge was poor nationally and in 16 states, Fair in 20 states and Good only in one state.
0 10 20 30 40 50 60
GOMBE
BENUE
TARABA
JIGAWA
PLATEAU
SOKOTO
KADUNA
BORNO
BAUCHI
ADAMAWA
NASARAWA
NIGER
ZAMFARA
OYO
KOGI
AKWA-…NATIONAL
ONDO
YOBE
KATSINA
CROSS…BAYELSA
EKITI
EDO
RIVERS
ABIA
OSUN
ENUGU
KANO
OGUN
IMO
KWARA
FCT
EBONYI
DELTA
KEBBI
ANAMBRA
LAGOS
28.36
30.88
30.94
32.26
32.57
32.69
32.92
34.3
34.37
35.54
36.12
36.21
37.57
38.26
38.43
39.8
39.87
40.07
40.15
40.35
40.62
40.67
40.96
41.25
41.67
43.14
43.41
43.49
43.78
43.79
43.87
44.5
45.7
45.73
46.76
47.95
48.37
51.05
Knowledge (Percent)
Figure 7.16: Learner Achievement in Knowledge across States

83
Comprehension As can be seen in Figure 7.17, National average on items which assessed Comprehension objective level were 45.65. Nineteen states scored above the National average while 18 states scored below. Lagos (57.53), Delta (56.83) and Kwara (53.66) had the top three scores while Gombe (31.01), Taraba (34.46) and Sokoto (36.00) had the least scores. On the whole, achievement on Comprehension sub-test was only Fair as 16 states were with the cluster 40-49 percent. Poor in 10 states (31.01-39.32 percent) but Good in 11 states (51-59 percent).
0 20 40 60 80
GOMBE
TARABA
BENUE
BAUCHI
NASARAWA
ZAMFARA
ADAMAWA
YOBE
KOGI
NATIONAL
AKWA-IBOM
CROSS RIVER
BAYELSA
KEBBI
ABIA
KWARA
EBONYI
IMO
DELTA
38.21
41.95
42.31
42.99
44.62
44.73
44.87
45.05
46.5
48.84
48.86
48.98
51
51.15
52.92
52.97
53.45
54.36
54.81
55.97
56.62
56.71
57.45
58.85
59.36
59.39
60.1
60.44
60.95
60.97
61.07
61.23
62.35
62.93
63.99
66.09
67.04
70.1
Comprehension
Figure 7.17: Learners' Achievement in Comprehension across
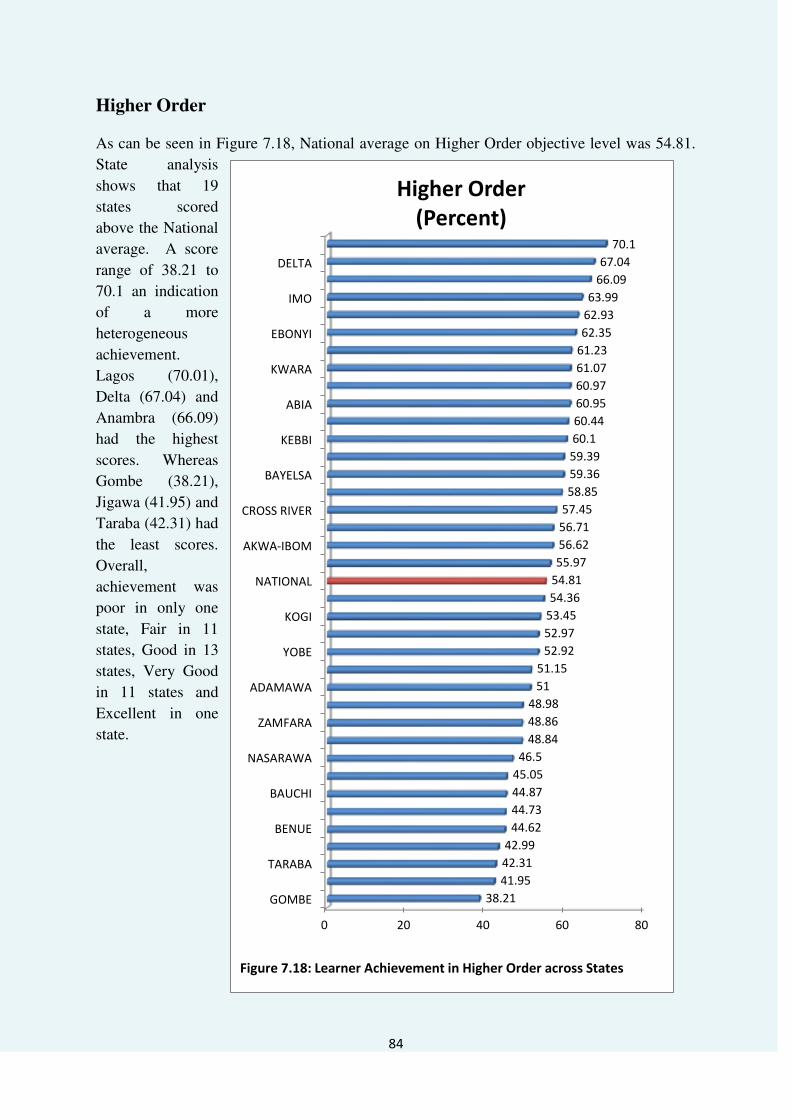
84
Higher Order As can be seen in Figure 7.18, National average on Higher Order objective level was 54.81.
State analysis
shows that 19
states scored
above the National
average. A score
range of 38.21 to
70.1 an indication
of a more
heterogeneous
achievement.
Lagos (70.01),
Delta (67.04) and
Anambra (66.09)
had the highest
scores. Whereas
Gombe (38.21),
Jigawa (41.95) and
Taraba (42.31) had
the least scores.
Overall,
achievement was
poor in only one
state, Fair in 11
states, Good in 13
states, Very Good
in 11 states and
Excellent in one
state.
0 20 40 60 80
GOMBE
TARABA
BENUE
BAUCHI
NASARAWA
ZAMFARA
ADAMAWA
YOBE
KOGI
NATIONAL
AKWA-IBOM
CROSS RIVER
BAYELSA
KEBBI
ABIA
KWARA
EBONYI
IMO
DELTA
38.21
41.95
42.31
42.99
44.62
44.73
44.87
45.05
46.5
48.84
48.86
48.98
51
51.15
52.92
52.97
53.45
54.36
54.81
55.97
56.62
56.71
57.45
58.85
59.36
59.39
60.1
60.44
60.95
60.97
61.07
61.23
62.35
62.93
63.99
66.09
67.04
70.1
Higher Order
(Percent)
Figure 7.18: Learner Achievement in Higher Order across States

85
7.4: Relational Analysis
This section explores the relationship between some salient variables and achievement. There
is ample research evidence that some variables could be manipulated or altered to enhance
achievement of learners. The belief is that if these variables which can be manipulated for the
good of the learners are identified, something could be done to enhance achievement.
Therefore, some home and teacher learner-related variables were examined.
7.4.1: Homework Support
The national averages for learners‟ achievement across the different categories of home support were 50.3, 50.1 and 49.7 for low, moderate and high level of Homework support
respectively.
Table 7.6 provides the State level analysis. For low level of assistance with homework, the
state wide results show that learners from 16 states, for example, Lagos (54.2), Kwara (53.9),
FCT (53.6), etc. scored above the national average and learners from 21 states scored below
the national average with Gombe having the lowest score. In respect of moderate assistance
with homework, 17 states scored above the national average and 20 states scored below. The
achievement of learners who received high assistance with homework was such that 18 states
scored above the national average and 19 states scored below the national average.

86
Table 7.6: Homework Support as Related to Achievement in JS2 English Studies
Low Moderate High
State Mean SE Mean SE Mean SE
ABIA 50.4 0.8 50.0 0.8 49.1 0.8
ADAMAWA 47.8 0.9 48.7 0.9 50.3 1.1
AKWA-IBOM 50.2 0.6 50.9 0.8 50.0 1.0
ANAMBRA 50.3 0.7 51.9 0.7 51.3 0.9
BAUCHI 50.1 0.9 50.5 0.7 50.7 1.0
BAYELSA 48.6 1.0 48.0 1.1 48.3 1.2
BORNO 45.8 0.8 46.9 0.7 46.1 0.9 BENUE 47.8 8.5 44.7 1.0 44.0 1.5 CROSS RIVER 47.2 0.8 48.4 0.7 48.2 0.8
DELTA 51.7 0.7 53.6 0.7 52.7 1.1
EBONYI 50.5 0.8 51.2 0.6 51.2 1.1
EDO 50.9 1.1 49.3 0.8 48.5 1.1
EKITI 51.6 1.2 51.9 0.5 50.7 0.9
ENUGU 49.8 0.9 50.4 0.7 49.1 0.7
GOMBE 44.7 0.7 45.0 0.5 48.2 1.3
IMO 52.9 0.6 52.4 0.6 51.4 1.2
JIGAWA 48.6 1.6 47.0 0.5 48.9 1.7
KADUNA 47.1 1.0 47.1 0.6 47.7 0.6
KANO 49.9 1.3 48.4 0.9 48.5 1.1
KATSINA 49.9 1.3 49.4 1.0 48.4 1.3
KEBBI 54.7 0.9 56.6 0.7 56.0 1.0
KOGI 48.8 1.1 49.2 0.8 45.8 1.2
KWARA 53.9 0.8 54.7 0.6 53.8 0.8
LAGOS 54.2 0.9 54.2 0.6 53.1 0.8
NASARAWA 46.4 1.0 44.0 0.7 44.5 0.8 NIGER 49.2 1.2 48.6 0.7 50.5 2.6 OGUN 52.1 0.9 51.9 0.8 52.2 0.7 ONDO 52.5 0.9 50.9 0.6 53.9 1.3 OSUN 53.3 0.7 53.6 0.5 52.2 1.0 OYO 52.4 1.0 52.4 0.6 49.9 2.3 PLATEAU 46.5 0.8 47.1 0.6 46.3 1.1 RIVERS 49.0 0.6 49.7 0.6 49.6 1.0 SOKOTO 48.9 1.0 47.5 0.6 48.7 0.8 TARABA 46.0 1.0 44.8 0.6 45.6 0.7 YOBE 52.5 0.9 52.9 0.7 49.6 0.9 ZAMFARA 50.4 1.1 50.0 0.8 51.3 1.0 FCT 53.6 1.8 51.8 1.0 53.0 1.2 National 50.3 0.2 50.1 0.1 49.7 0.2

87
7.4.2 Level of Available Materials
The national averages for learners‟ achievement across the different categories of available
materials were 49.6, 50.2 and 50.13 for low, moderate and high levels.
Variation in achievement with available learning facilities across States is presented in Table
7.7. The same trend in achievement in the national averages, was also observed in Borno,
Niger, Plateau, Yobe and Kwara states. In Benue, Delta, Kogi, Nasarawa and Ondo states, as
level of available resources increase, achievement decreased. With respect to some of the
states no particular trend was observed. When achievement above the National averages were
considered, there were 20, 17 and 16 states for low, moderate and high level of availability
respectively. There were no significant differences within states.

88
Table 7.7 Level of Availability of Learning Materials and Achievement in English
Studies
State Low Moderate High
Mean SE Mean SE Mean SE
ABIA 50.8 1.0 49.8 0.6 48.9 1.0
ADAMAWA 50.1 1.0 47.9 0.7 51.2 2.3
AKWA-IBOM 49.9 0.8 50.6 0.6 50.6 1.2
ANAMBRA 50.8 1.3 51.3 0.5 50.9 0.9
BAUCHI 50.6 0.6 50.3 0.8 50.6 1.2
BAYELSA 48.1 1.0 48.7 0.9 47.8 1.7
BORNO 46.0 0.9 46.5 0.5 47.4 4.0
BENUE 45.1 1.1 44.6 2.1 42.1 1.2
CROSS RIVER 48.2 0.8 47.8 0.6 48.3 1.1
DELTA 53.3 1.1 52.7 0.5 51.9 1.5
EBONYI 51.5 0.9 50.9 0.6 50.5 0.9
EDO 49.9 1.4 49.4 0.7 50.1 1.2
EKITI 52.9 0.9 50.9 0.6 51.4 1.1
ENUGU 49.3 0.9 49.9 0.6 48.8 1.0
GOMBE 45.8 0.6 45.2 0.5 44.0 1.5
IMO 52.8 1.2 52.4 0.5 52.2 1.6
JIGAWA 47.6 0.8 46.9 0.6 48.6 2.0
KADUNA 47.7 0.7 47.4 0.6 45.6 1.1
KANO 49.4 0.9 48.8 1.0 46.5 1.5
KATSINA 49.2 1.2 49.7 0.9 47.0 2.6
KEBBI 55.4 0.9 56.3 0.6 56.0 1.1
KOGI 50.5 1.2 47.9 0.7 47.8 1.5
KWARA 53.1 1.0 54.4 0.5 55.1 1.5
LAGOS 52.5 1.2 54.4 0.6 53.3 0.9
NASARAWA 45.6 0.8 44.3 0.6 43.2 2.7
NIGER 48.5 0.7 49.3 1.0 * *
OGUN 52.0 1.8 52.2 0.5 51.4 1.5
ONDO 52.6 0.8 51.7 0.6 49.8 1.4
OSUN 53.5 0.8 53.1 0.4 55.3 2.6
OYO 51.8 0.8 52.8 0.7 51.2 1.8
PLATEAU 45.8 0.6 47.2 0.6 50.3 1.5
RIVERS 47.7 0.8 50.0 0.5 48.9 1.0
SOKOTO 48.6 0.8 48.1 0.6 47.6 1.1
TARABA 45.4 0.7 45.0 0.5 49.0 2.7
YOBE 51.4 0.7 52.3 0.8 54.1 1.2
ZAMFARA 49.6 0.8 52.0 0.8 49.0 1.4
FCT 51.7 4.3 52.6 1.1 52.7 1.0
National 49.6 0.2 50.2 0.1 50.3 0.2

89
Out of School Non Learning Engagements
At the national level, the mean score of 50.6 (low) 50.0 (moderate) and 49.6 (high) shows that achievement decreased with increase in learners‟ engagement in non-learning activities, although the values were not significant. The number of states performing above the national average for each level of involvement in Table 7.8 shows that learners with moderate and high levels of involvement in non-learning activities were from 18 states each with 18 states and 16 states for low level.
Table 7.8: Out of School Non Learning Engagements as Related to
Achievement
State Low Moderate High
Mean SE Mean SE Mean SE
ABIA 49.9 0.8 50.2 0.7 48.9 0.9
ADAMAWA 48.1 1.1 49.4 1.0 49.1 0.9
AKWA-IBOM 49.9 0.9 50.1 0.6 51.8 1.2
ANAMBRA 50.4 0.7 51.5 0.7 51.4 0.8
BAUCHI 50.8 0.8 49.4 0.8 51.6 0.8
BAYELSA 49.1 1.7 47.9 0.8 48.7 1.1
BORNO 47.0 1.6 46.5 0.6 45.9 1.0
BENUE 44.6 2.7 42.7 2.6 44.8 1.0
CROSS RIVER 49.1 0.9 46.2 0.6 49.0 0.8
DELTA 52.5 0.9 53.1 0.6 51.0 1.1
EBONYI 51.1 0.9 50.7 0.6 51.4 1.0
EDO 47.6 1.4 50.2 0.7 49.1 1.1
EKITI 51.9 0.9 51.6 0.5 51.1 1.5
ENUGU 49.6 1.0 50.1 0.7 49.1 0.7
GOMBE** 44.9 1.0 45.2 0.5 46.1 0.9
IMO 51.9 1.3 52.5 0.5 52.4 0.9
JIGAWA 49.7 1.2 47.4 0.6 44.2 0.8
KADUNA 47.3 0.8 47.3 0.7 47.5 0.7
KANO 50.8 1.4 48.4 1.1 48.0 0.9
KATSINA 49.1 1.2 49.6 1.1 48.9 1.3
KEBBI** 56.8 0.8 55.2 0.7 56.6 1.3
KOGI 46.4 1.4 48.1 0.6 50.3 1.4
KWARA 54.4 0.8 53.7 0.6 55.6 1.0
LAGOS 54.0 0.6 53.9 0.8 53.8 0.9
NASARAWA 44.5 1.1 44.9 0.6 44.8 1.0
NIGER 50.8 2.7 48.6 0.6 47.7 3.3
OGUN 52.2 0.8 52.1 0.7 51.8 1.1
ONDO 50.8 0.8 52.1 0.7 52.2 0.9
OSUN 53.5 0.8 53.2 0.5 52.7 1.0
OYO 54.5 1.1 51.9 0.6 51.4 1.2 PLATEAU 48.3 1.1 46.8 0.6 45.9 0.8 RIVERS 49.0 0.7 49.6 0.6 49.6 1.0 SOKOTO 46.5 0.7 49.1 0.8 48.6 0.8 TARABA 44.5 1.0 44.9 0.6 46.6 0.8
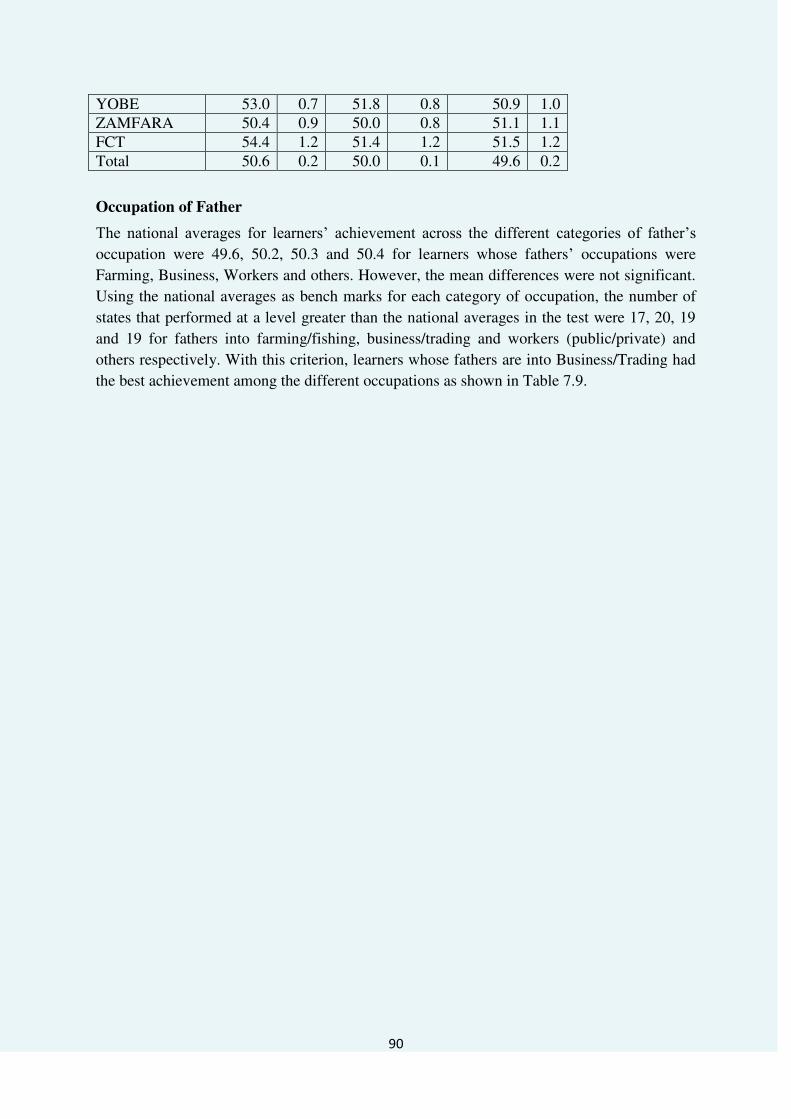
90
YOBE 53.0 0.7 51.8 0.8 50.9 1.0 ZAMFARA 50.4 0.9 50.0 0.8 51.1 1.1 FCT 54.4 1.2 51.4 1.2 51.5 1.2 Total 50.6 0.2 50.0 0.1 49.6 0.2
Occupation of Father
The national averages for learners‟ achievement across the different categories of father‟s occupation were 49.6, 50.2, 50.3 and 50.4 for learners whose fathers‟ occupations were
Farming, Business, Workers and others. However, the mean differences were not significant.
Using the national averages as bench marks for each category of occupation, the number of
states that performed at a level greater than the national averages in the test were 17, 20, 19
and 19 for fathers into farming/fishing, business/trading and workers (public/private) and
others respectively. With this criterion, learners whose fathers are into Business/Trading had
the best achievement among the different occupations as shown in Table 7.9.

91
Table 7.9: Occupation of Father as Related to Achievement in JS2 English Studies
Farming /Fishing
Business/ Trading
Worker (Public/Private) Others
State Mean SE Mean SE Mean SE Mean SE ABIA 49.2 1.2 50.5 0.9 50.3 1.0 50.3 0.9 ADAMAWA 48.7 1.2 50.1 1.3 48.2 1.1 51.0 3.5 AKWA-IBOM 49.9 1.1 50.5 0.9 50.3 0.9 50.7 1.5 ANAMBRA 50.7 1.2 50.8 0.6 52.1 1.2 52.6 1.1 BAUCHI 49.4 0.7 50.0 1.1 51.5 0.9 53.0 2.5 BAYELSA 48.7 1.7 49.3 1.6 48.5 1.1 48.4 2.7 BORNO 46.0 0.6 45.9 1.3 47.1 1.0 43.1 4.0 BENUE 60.9 * 43.9 0.9 44.6 2.3 * * CROSS RIVER 48.2 1.1 48.6 1.0 47.2 1.1 47.8 0.8 DELTA 53.4 0.9 50.2 1.0 53.5 0.7 52.0 1.2 EBONYI 50.7 1.0 51.9 1.1 50.8 0.8 50.9 1.1 EDO 50.3 0.9 50.7 1.6 49.8 1.0 49.0 2.0 EKITI 50.9 0.8 51.4 1.0 52.4 0.8 49.6 1.1 ENUGU 49.4 1.1 50.6 1.1 49.3 1.0 48.8 1.0 GOMBE 45.0 0.7 44.9 0.8 45.1 0.6 45.1 1.3 IMO 51.9 1.2 53.1 0.7 51.8 0.7 49.1 1.4 JIGAWA 47.5 1.0 48.1 1.1 47.2 0.7 45.6 1.0 KADUNA 48.1 0.7 47.3 0.9 47.0 0.9 45.8 1.5 KANO 49.2 1.1 48.8 1.1 48.4 1.3 47.4 2.1 KATSINA 49.5 1.6 49.1 1.2 48.5 1.2 52.3 4.0 KEBBI 55.5 0.9 54.8 1.0 56.7 0.8 57.7 1.6 KOGI 48.2 0.8 48.6 1.8 47.5 0.9 46.9 2.6 KWARA 54.0 0.8 56.0 1.0 54.4 0.8 53.0 1.0 LAGOS 54.5 1.4 53.1 0.8 54.3 0.8 53.6 1.0 NASARAWA 45.4 1.0 44.4 1.2 44.7 0.9 42.0 0.9 NIGER 48.4 0.7 48.0 1.3 50.2 1.4 57.6 0.9 OGUN 51.2 1.0 53.1 0.9 52.5 1.0 51.1 1.3 ONDO 51.5 0.8 49.2 1.5 52.5 0.7 52.3 1.3 OSUN 53.3 0.6 53.5 0.9 53.4 1.0 52.4 0.9 OYO 51.5 1.0 52.3 0.9 52.6 1.2 52.9 0.9 PLATEAU 47.6 0.8 47.7 1.1 46.1 0.7 46.3 1.2 RIVERS 49.8 1.8 49.0 0.8 50.0 0.8 49.7 0.9 SOKOTO 49.2 0.9 48.2 0.7 47.6 0.9 51.1 3.6 TARABA 44.7 0.6 45.3 0.9 45.9 1.0 45.1 3.1 YOBE 53.1 1.1 51.1 1.0 51.8 0.7 49.8 1.2 ZAMFARA 50.5 0.9 51.4 1.2 49.9 1.1 50.0 2.2 FCT 52.2 2.0 54.1 1.9 52.1 0.9 51.5 5.7 National 49.6 0.2 50.2 0.2 50.3 0.2 50.4 0.3
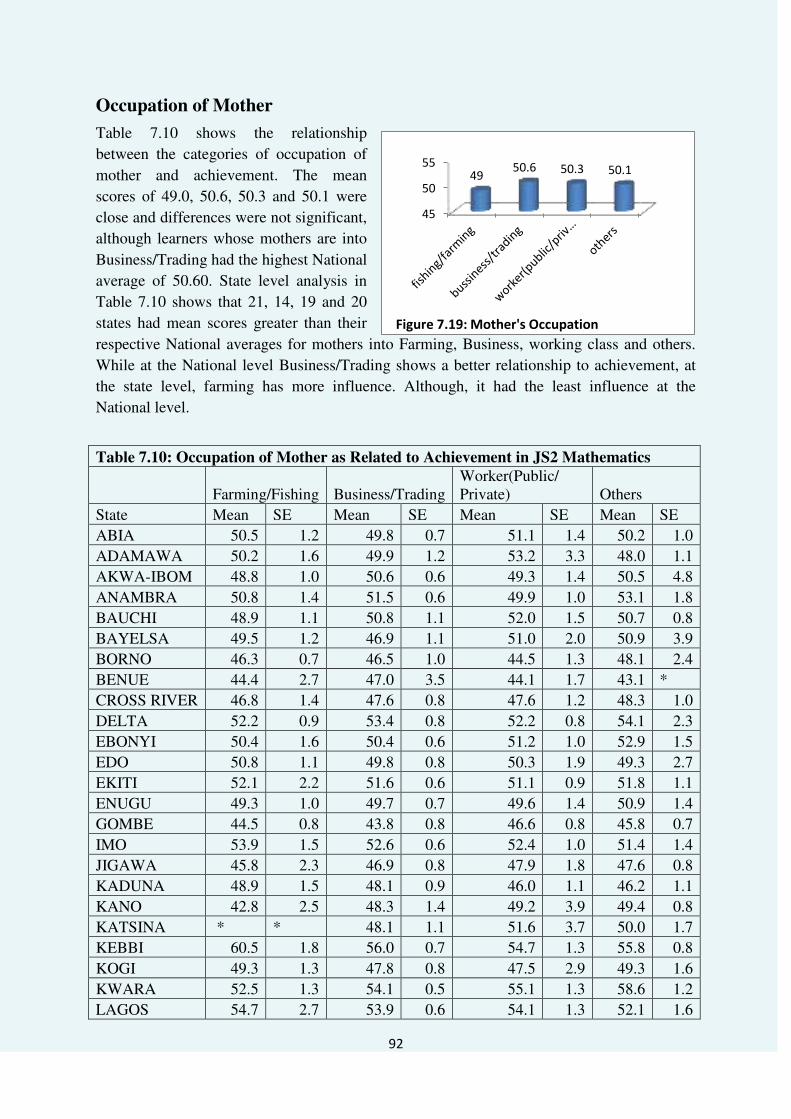
92
Occupation of Mother
Table 7.10 shows the relationship
between the categories of occupation of
mother and achievement. The mean
scores of 49.0, 50.6, 50.3 and 50.1 were
close and differences were not significant,
although learners whose mothers are into
Business/Trading had the highest National
average of 50.60. State level analysis in
Table 7.10 shows that 21, 14, 19 and 20
states had mean scores greater than their
respective National averages for mothers into Farming, Business, working class and others.
While at the National level Business/Trading shows a better relationship to achievement, at
the state level, farming has more influence. Although, it had the least influence at the
National level.
Table 7.10: Occupation of Mother as Related to Achievement in JS2 Mathematics
Farming/Fishing Business/Trading Worker(Public/ Private) Others
State Mean SE Mean SE Mean SE Mean SE
ABIA 50.5 1.2 49.8 0.7 51.1 1.4 50.2 1.0
ADAMAWA 50.2 1.6 49.9 1.2 53.2 3.3 48.0 1.1
AKWA-IBOM 48.8 1.0 50.6 0.6 49.3 1.4 50.5 4.8
ANAMBRA 50.8 1.4 51.5 0.6 49.9 1.0 53.1 1.8
BAUCHI 48.9 1.1 50.8 1.1 52.0 1.5 50.7 0.8
BAYELSA 49.5 1.2 46.9 1.1 51.0 2.0 50.9 3.9
BORNO 46.3 0.7 46.5 1.0 44.5 1.3 48.1 2.4
BENUE 44.4 2.7 47.0 3.5 44.1 1.7 43.1 *
CROSS RIVER 46.8 1.4 47.6 0.8 47.6 1.2 48.3 1.0
DELTA 52.2 0.9 53.4 0.8 52.2 0.8 54.1 2.3
EBONYI 50.4 1.6 50.4 0.6 51.2 1.0 52.9 1.5
EDO 50.8 1.1 49.8 0.8 50.3 1.9 49.3 2.7
EKITI 52.1 2.2 51.6 0.6 51.1 0.9 51.8 1.1
ENUGU 49.3 1.0 49.7 0.7 49.6 1.4 50.9 1.4
GOMBE 44.5 0.8 43.8 0.8 46.6 0.8 45.8 0.7
IMO 53.9 1.5 52.6 0.6 52.4 1.0 51.4 1.4
JIGAWA 45.8 2.3 46.9 0.8 47.9 1.8 47.6 0.8
KADUNA 48.9 1.5 48.1 0.9 46.0 1.1 46.2 1.1
KANO 42.8 2.5 48.3 1.4 49.2 3.9 49.4 0.8
KATSINA * * 48.1 1.1 51.6 3.7 50.0 1.7
KEBBI 60.5 1.8 56.0 0.7 54.7 1.3 55.8 0.8
KOGI 49.3 1.3 47.8 0.8 47.5 2.9 49.3 1.6
KWARA 52.5 1.3 54.1 0.5 55.1 1.3 58.6 1.2
LAGOS 54.7 2.7 53.9 0.6 54.1 1.3 52.1 1.6
45
50
5549
50.6 50.3 50.1
Figure 7.19: Mother's Occupation

93
NASARAWA 44.4 1.0 45.9 1.0 43.3 1.0 42.9 1.1
NIGER 51.9 1.7 47.4 0.7 48.3 1.1 49.0 2.3
OGUN 51.8 1.5 52.0 0.6 52.9 1.3 51.9 2.7
ONDO 51.2 1.0 52.1 0.8 51.0 0.8 54.3 1.7
OSUN 51.3 1.7 53.4 0.4 55.3 1.8 53.7 1.4
OYO 51.6 1.2 52.8 0.8 51.6 1.2 52.3 0.9
PLATEAU 46.4 0.9 47.1 0.8 46.3 1.0 46.6 1.8
RIVERS 49.5 1.4 50.2 0.6 48.7 1.0 47.6 1.2
SOKOTO 45.1 3.8 47.7 0.8 50.7 2.2 48.0 0.7
TARABA 45.6 0.8 46.1 0.9 45.9 1.4 41.8 1.9
YOBE 48.5 2.1 52.1 1.0 55.1 1.6 53.5 1.1
ZAMFARA 51.4 1.9 49.5 1.3 49.1 2.1 50.7 0.8
FCT 47.5 2.7 53.7 1.1 51.9 1.2 53.1 4.8 National 49.0 0.2 50.6 0.1 50.3 0.2 50.1 0.2
Mode of transportation
In Table 7.11, the number of learners who go to school by donkey and canoe were quite small
and are therefore ignored in the discussion presented here. From the results, the best
achievement at the national level was by learners who go to school with Taxi/bus next are
those who take Okada/Bicycle/Tricycle. Using national averages for different modes of
transportation as the bench mark, the number of states in Table 7.11 that performed at a level
greater than the national averages in the test were 17, 15, 14 and 18 states for those who
walked, took Okada/bicycle/tricycle, taxi/bus and family car respectively. Learners who went
to school in family car exhibited the best achievement.

94
Table 7.11: Normal Means of Going to School as Related to Achievement in English
Studies
State Walking Donkey Canoe
Okada/Bicycle
/Tricycle Taxi/Bus Family Car
Mean SE Mean SE Mean SE Mean SE Mean SE Mean SE
ABIA 49.7 0.5 * * * * 49.4 1.5 51.9 2.2 53.0 3.2
ADAMAWA 48.9 0.6 40.4 1.4 * * 47.5 1.5 * * 49.4 3.7
AKWA-IBOM 50.5 0.5 47.5 * * * 49.0 1.7 52.5 3.5 50.7 3.5
ANAMBRA 51.1 0.5 * * * * 51.3 1.4 52.3 1.5 49.1 2.7
BAUCHI 50.3 0.5 * * * * 50.2 1.6 50.8 3.4 53.5 2.0
BAYELSA 48.2 0.7 * * * * 47.0 2.5 47.2 1.4 56.4 3.0
BORNO 46.4 0.5 * * 55.4 * 43.8 * 43.4 2.2 47.8 1.3
BENUE 45.4 1.8 * * * * 41.8 * 44.7 1.4 44.3 1.5 CROSS RIVER 47.6 0.5 * * 56.1 7.3 51.1 3.5 50.5 2.3 46.4 2.0
DELTA 52.5 0.5 * * * * 53.5 2.1 54.5 3.0 52.9 1.3
EBONYI 50.9 0.5 * * * * 49.2 1.6 51.9 3.0 52.3 1.7
EDO 49.5 0.6 * * * * 51.2 3.5 46.0 . 49.6 2.4
EKITI 51.4 0.5 * * * * 50.4 1.7 50.6 1.8 53.7 1.3
ENUGU 49.9 0.5 * * * * 47.3 1.9 48.9 1.9 49.7 2.1
GOMBE 45.0 0.4 53.7 1.6 39.8 1.7 47.7 2.5 46.9 1.8 46.0 1.3
IMO 52.4 0.5 * * * * 52.0 1.7 50.3 2.0 54.9 1.9
JIGAWA 47.3 0.5 * * 47.6 . 49.0 3.3 44.6 1.1 45.3 2.2
KADUNA 47.2 0.5 * * * * 47.1 1.2 47.7 2.9 50.2 1.4
KANO 48.7 0.7 * * 46.5 * 50.0 2.1 49.5 2.4 * *
KATSINA 49.3 0.7 * * * * 50.3 2.3 42.6 1.0 49.4 4.1
KEBBI 55.7 0.6 * * * * 57.3 1.1 57.6 2.8 56.1 1.7
KOGI 48.6 0.6 42.2 * * * 40.7 1.7 46.0 3.1 50.2 1.4
KWARA 54.5 0.5 * * 57.7 * 52.3 1.4 55.7 1.7 53.6 2.5
LAGOS 53.8 0.6 * * 54.5 4.5 54.2 1.4 54.3 1.0 53.3 1.4
NASARAWA 44.6 0.6 * * 41.0 1.1 47.0 1.7 42.9 1.7 47.9 1.5
NIGER 49.2 0.7 50.5 * 46.4 * 46.8 2.2 45.7 1.6 49.8 1.3
OGUN 51.4 0.6 * * 60.1 * 54.0 1.2 53.4 1.9 50.6 1.1
ONDO 51.0 0.5 * * * * 54.4 1.8 54.2 1.8 52.5 1.6
OSUN 53.0 0.4 * * * * 53.5 0.8 53.7 1.6 55.3 2.9
OYO 53.0 0.7 52.2 3.2 43.3 2.0 51.5 1.6 53.9 1.5 50.9 0.9
PLATEAU 46.9 0.5 * * 46.7 * 45.9 0.5 46.1 2.0 46.7 1.4
RIVERS 49.7 0.5 * * * * 46.4 1.3 49.5 1.0 51.2 1.4
SOKOTO 48.3 0.5 * * * * 53.6 1.7 46.6 5.1 45.4 1.1
TARABA 45.3 0.4 * * * * 43.9 1.8 43.8 2.8 45.3 1.7
YOBE 52.1 0.5 * * * * 51.2 1.7 51.3 2.3 51.3 2.2
ZAMFARA 50.5 0.6 * * 54.5 2.6 50.5 1.4 50.5 1.9 48.5 2.5
FCT 52.9 1.0 * * * * 51.2 1.8 55.0 3.1 51.9 1.6
National 49.9 0.1 48.1 2.0 49.8 1.7 50.8 0.3 51.0 0.4 50.37 0.3
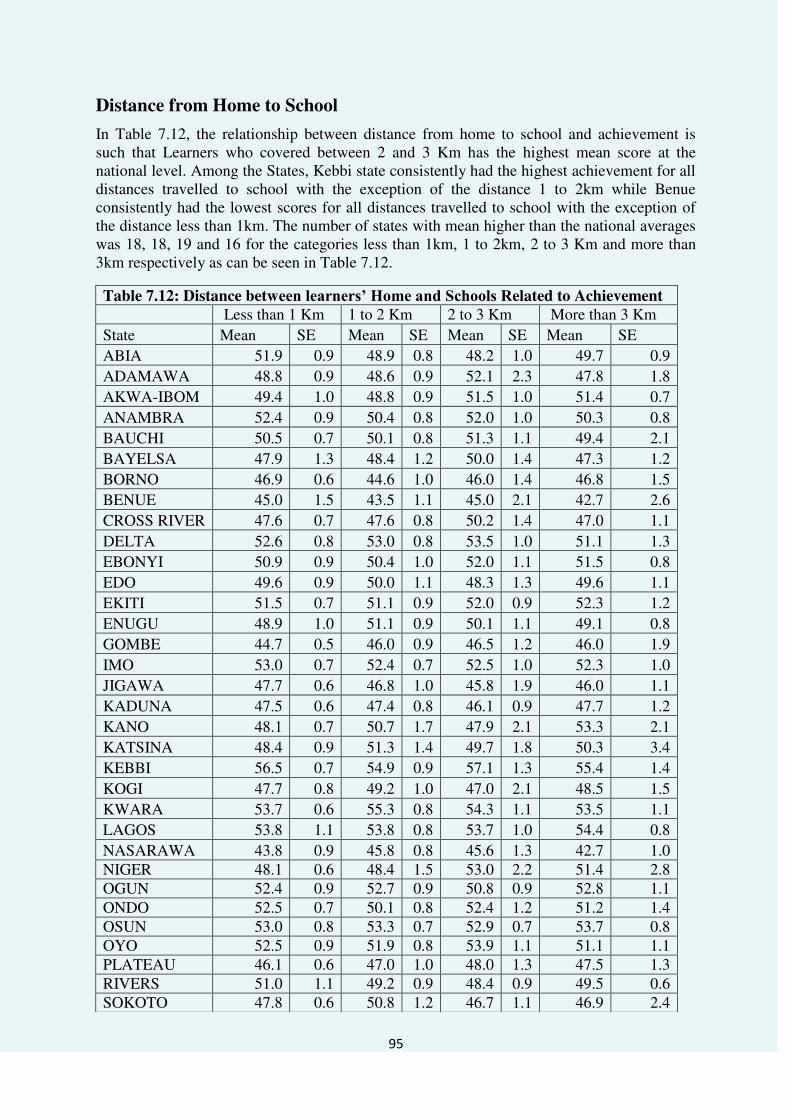
95
Distance from Home to School In Table 7.12, the relationship between distance from home to school and achievement is such that Learners who covered between 2 and 3 Km has the highest mean score at the national level. Among the States, Kebbi state consistently had the highest achievement for all distances travelled to school with the exception of the distance 1 to 2km while Benue consistently had the lowest scores for all distances travelled to school with the exception of the distance less than 1km. The number of states with mean higher than the national averages was 18, 18, 19 and 16 for the categories less than 1km, 1 to 2km, 2 to 3 Km and more than 3km respectively as can be seen in Table 7.12.
Table 7.12: Distance between learners’ Home and Schools Related to Achievement
Less than 1 Km 1 to 2 Km 2 to 3 Km More than 3 Km
State Mean SE Mean SE Mean SE Mean SE
ABIA 51.9 0.9 48.9 0.8 48.2 1.0 49.7 0.9
ADAMAWA 48.8 0.9 48.6 0.9 52.1 2.3 47.8 1.8
AKWA-IBOM 49.4 1.0 48.8 0.9 51.5 1.0 51.4 0.7
ANAMBRA 52.4 0.9 50.4 0.8 52.0 1.0 50.3 0.8
BAUCHI 50.5 0.7 50.1 0.8 51.3 1.1 49.4 2.1
BAYELSA 47.9 1.3 48.4 1.2 50.0 1.4 47.3 1.2
BORNO 46.9 0.6 44.6 1.0 46.0 1.4 46.8 1.5
BENUE 45.0 1.5 43.5 1.1 45.0 2.1 42.7 2.6
CROSS RIVER 47.6 0.7 47.6 0.8 50.2 1.4 47.0 1.1
DELTA 52.6 0.8 53.0 0.8 53.5 1.0 51.1 1.3
EBONYI 50.9 0.9 50.4 1.0 52.0 1.1 51.5 0.8
EDO 49.6 0.9 50.0 1.1 48.3 1.3 49.6 1.1
EKITI 51.5 0.7 51.1 0.9 52.0 0.9 52.3 1.2
ENUGU 48.9 1.0 51.1 0.9 50.1 1.1 49.1 0.8
GOMBE 44.7 0.5 46.0 0.9 46.5 1.2 46.0 1.9
IMO 53.0 0.7 52.4 0.7 52.5 1.0 52.3 1.0
JIGAWA 47.7 0.6 46.8 1.0 45.8 1.9 46.0 1.1
KADUNA 47.5 0.6 47.4 0.8 46.1 0.9 47.7 1.2
KANO 48.1 0.7 50.7 1.7 47.9 2.1 53.3 2.1
KATSINA 48.4 0.9 51.3 1.4 49.7 1.8 50.3 3.4
KEBBI 56.5 0.7 54.9 0.9 57.1 1.3 55.4 1.4
KOGI 47.7 0.8 49.2 1.0 47.0 2.1 48.5 1.5
KWARA 53.7 0.6 55.3 0.8 54.3 1.1 53.5 1.1
LAGOS 53.8 1.1 53.8 0.8 53.7 1.0 54.4 0.8
NASARAWA 43.8 0.9 45.8 0.8 45.6 1.3 42.7 1.0 NIGER 48.1 0.6 48.4 1.5 53.0 2.2 51.4 2.8 OGUN 52.4 0.9 52.7 0.9 50.8 0.9 52.8 1.1 ONDO 52.5 0.7 50.1 0.8 52.4 1.2 51.2 1.4 OSUN 53.0 0.8 53.3 0.7 52.9 0.7 53.7 0.8 OYO 52.5 0.9 51.9 0.8 53.9 1.1 51.1 1.1 PLATEAU 46.1 0.6 47.0 1.0 48.0 1.3 47.5 1.3 RIVERS 51.0 1.1 49.2 0.9 48.4 0.9 49.5 0.6 SOKOTO 47.8 0.6 50.8 1.2 46.7 1.1 46.9 2.4
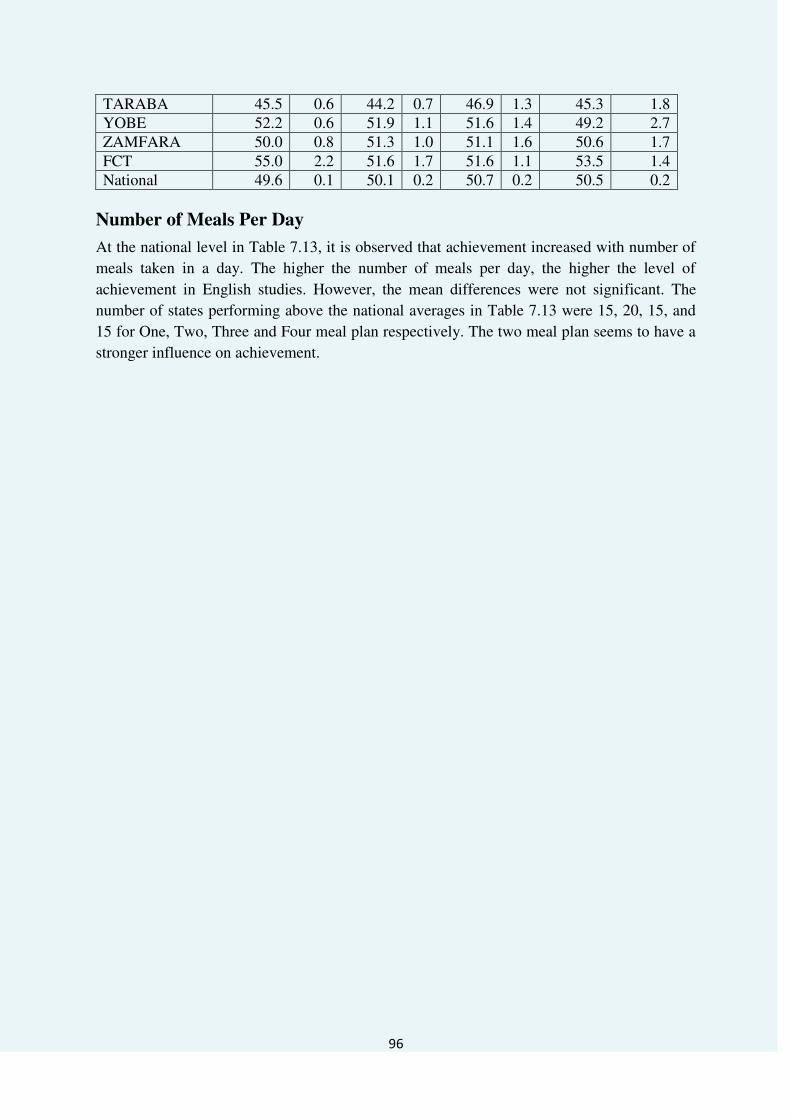
96
Number of Meals Per Day
At the national level in Table 7.13, it is observed that achievement increased with number of
meals taken in a day. The higher the number of meals per day, the higher the level of
achievement in English studies. However, the mean differences were not significant. The
number of states performing above the national averages in Table 7.13 were 15, 20, 15, and
15 for One, Two, Three and Four meal plan respectively. The two meal plan seems to have a
stronger influence on achievement.
TARABA 45.5 0.6 44.2 0.7 46.9 1.3 45.3 1.8 YOBE 52.2 0.6 51.9 1.1 51.6 1.4 49.2 2.7 ZAMFARA 50.0 0.8 51.3 1.0 51.1 1.6 50.6 1.7 FCT 55.0 2.2 51.6 1.7 51.6 1.1 53.5 1.4 National 49.6 0.1 50.1 0.2 50.7 0.2 50.5 0.2
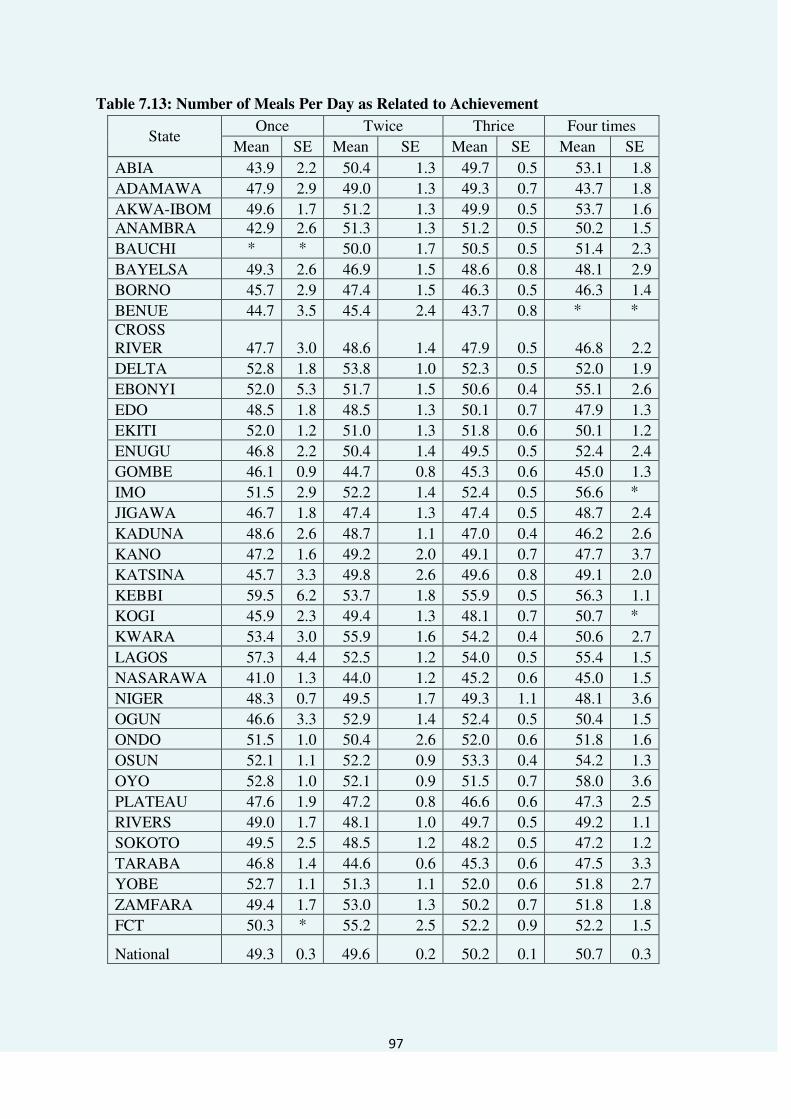
97
Table 7.13: Number of Meals Per Day as Related to Achievement
State Once Twice Thrice Four times
Mean SE Mean SE Mean SE Mean SE
ABIA 43.9 2.2 50.4 1.3 49.7 0.5 53.1 1.8
ADAMAWA 47.9 2.9 49.0 1.3 49.3 0.7 43.7 1.8
AKWA-IBOM 49.6 1.7 51.2 1.3 49.9 0.5 53.7 1.6 ANAMBRA 42.9 2.6 51.3 1.3 51.2 0.5 50.2 1.5
BAUCHI * * 50.0 1.7 50.5 0.5 51.4 2.3
BAYELSA 49.3 2.6 46.9 1.5 48.6 0.8 48.1 2.9
BORNO 45.7 2.9 47.4 1.5 46.3 0.5 46.3 1.4
BENUE 44.7 3.5 45.4 2.4 43.7 0.8 * * CROSS RIVER 47.7 3.0 48.6 1.4 47.9 0.5 46.8 2.2
DELTA 52.8 1.8 53.8 1.0 52.3 0.5 52.0 1.9
EBONYI 52.0 5.3 51.7 1.5 50.6 0.4 55.1 2.6
EDO 48.5 1.8 48.5 1.3 50.1 0.7 47.9 1.3
EKITI 52.0 1.2 51.0 1.3 51.8 0.6 50.1 1.2
ENUGU 46.8 2.2 50.4 1.4 49.5 0.5 52.4 2.4
GOMBE 46.1 0.9 44.7 0.8 45.3 0.6 45.0 1.3
IMO 51.5 2.9 52.2 1.4 52.4 0.5 56.6 *
JIGAWA 46.7 1.8 47.4 1.3 47.4 0.5 48.7 2.4
KADUNA 48.6 2.6 48.7 1.1 47.0 0.4 46.2 2.6
KANO 47.2 1.6 49.2 2.0 49.1 0.7 47.7 3.7
KATSINA 45.7 3.3 49.8 2.6 49.6 0.8 49.1 2.0
KEBBI 59.5 6.2 53.7 1.8 55.9 0.5 56.3 1.1
KOGI 45.9 2.3 49.4 1.3 48.1 0.7 50.7 *
KWARA 53.4 3.0 55.9 1.6 54.2 0.4 50.6 2.7
LAGOS 57.3 4.4 52.5 1.2 54.0 0.5 55.4 1.5
NASARAWA 41.0 1.3 44.0 1.2 45.2 0.6 45.0 1.5
NIGER 48.3 0.7 49.5 1.7 49.3 1.1 48.1 3.6
OGUN 46.6 3.3 52.9 1.4 52.4 0.5 50.4 1.5
ONDO 51.5 1.0 50.4 2.6 52.0 0.6 51.8 1.6
OSUN 52.1 1.1 52.2 0.9 53.3 0.4 54.2 1.3
OYO 52.8 1.0 52.1 0.9 51.5 0.7 58.0 3.6
PLATEAU 47.6 1.9 47.2 0.8 46.6 0.6 47.3 2.5
RIVERS 49.0 1.7 48.1 1.0 49.7 0.5 49.2 1.1
SOKOTO 49.5 2.5 48.5 1.2 48.2 0.5 47.2 1.2
TARABA 46.8 1.4 44.6 0.6 45.3 0.6 47.5 3.3
YOBE 52.7 1.1 51.3 1.1 52.0 0.6 51.8 2.7
ZAMFARA 49.4 1.7 53.0 1.3 50.2 0.7 51.8 1.8
FCT 50.3 * 55.2 2.5 52.2 0.9 52.2 1.5
National 49.3 0.3 49.6 0.2 50.2 0.1 50.7 0.3

98
Possession of Textbook in English Studies Nationally, achievement of learners without textbooks (49.7) was lower than that of learners
with textbooks (50.3). At the state level, 18 states had mean scores higher than the National
average for learners who do not possess Textbooks. While only 16 states had mean score
above the National average for Possession of Textbooks. Table 7.14: Learners’ Possession of Textbook in English Language as Related to
Performance
State No Yes
Mean SE Mean SE ABIA 50.0 0.8 49.7 0.6 ADAMAWA 48.8 0.8 49.3 0.9 AKWA-IBOM 50.1 0.6 51.0 0.7 ANAMBRA 50.9 0.8 51.2 0.6 BAUCHI 49.7 0.7 51.1 0.7 BAYELSA 48.4 1.1 48.3 0.8 BORNO 45.9 0.6 46.6 0.7 BENUE 43.2 1.7 45.6 1.0 CROSS RIVER 47.8 0.8 47.9 0.6 DELTA 52.6 0.8 52.9 0.6 EBONYI 50.8 0.8 51.0 0.5 EDO 48.8 0.9 50.0 0.7 EKITI 51.0 0.8 51.5 0.5 ENUGU 49.9 0.7 49.5 0.6 GOMBE 45.5 0.6 45.4 0.6 IMO 52.3 0.9 52.6 0.5 JIGAWA 47.1 0.7 47.5 0.7 KADUNA 47.3 0.5 47.4 0.7 KANO 49.7 1.2 48.5 0.8 KATSINA 49.4 1.0 49.2 0.9 KEBBI 57.1 1.0 55.5 0.6 KOGI 49.7 1.3 47.9 0.6 KWARA 53.6 0.6 54.4 0.6 LAGOS 54.2 0.9 53.9 0.5 NASARAWA 44.2 0.7 45.1 0.8 NIGER 48.8 0.7 48.8 0.9 OGUN 52.3 0.8 51.8 0.6 ONDO 52.4 1.2 51.6 0.5 OSUN 53.1 0.6 53.6 0.5 OYO 51.8 0.6 52.9 0.8 PLATEAU 47.8 0.7 46.3 0.5 RIVERS 49.6 0.8 49.5 0.5 SOKOTO 48.5 0.6 47.8 0.6 TARABA 45.0 0.7 45.5 0.6 YOBE 51.6 0.7 52.2 0.7 ZAMFARA 50.6 0.8 50.2 0.8 FCT 52.0 1.1 52.9 0.9 National 49.7 0.1 50.3 0.1
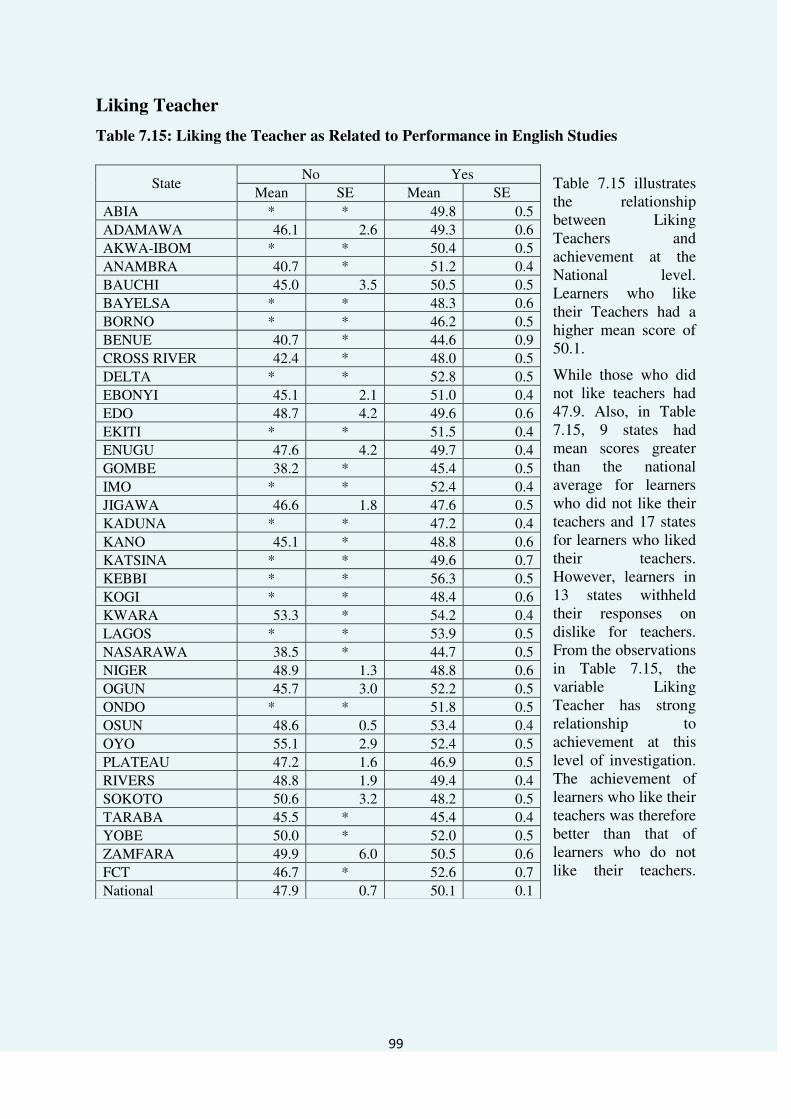
99
Liking Teacher
Table 7.15: Liking the Teacher as Related to Performance in English Studies
Table 7.15 illustrates the relationship between Liking Teachers and achievement at the National level. Learners who like their Teachers had a higher mean score of 50.1.
While those who did not like teachers had 47.9. Also, in Table 7.15, 9 states had mean scores greater than the national average for learners who did not like their teachers and 17 states for learners who liked their teachers. However, learners in 13 states withheld their responses on dislike for teachers. From the observations in Table 7.15, the variable Liking Teacher has strong relationship to achievement at this level of investigation. The achievement of learners who like their teachers was therefore better than that of learners who do not like their teachers.
State No Yes
Mean SE Mean SE
ABIA * * 49.8 0.5
ADAMAWA 46.1 2.6 49.3 0.6
AKWA-IBOM * * 50.4 0.5
ANAMBRA 40.7 * 51.2 0.4
BAUCHI 45.0 3.5 50.5 0.5
BAYELSA * * 48.3 0.6
BORNO * * 46.2 0.5
BENUE 40.7 * 44.6 0.9
CROSS RIVER 42.4 * 48.0 0.5
DELTA * * 52.8 0.5
EBONYI 45.1 2.1 51.0 0.4
EDO 48.7 4.2 49.6 0.6
EKITI * * 51.5 0.4
ENUGU 47.6 4.2 49.7 0.4
GOMBE 38.2 * 45.4 0.5
IMO * * 52.4 0.4
JIGAWA 46.6 1.8 47.6 0.5
KADUNA * * 47.2 0.4
KANO 45.1 * 48.8 0.6
KATSINA * * 49.6 0.7
KEBBI * * 56.3 0.5
KOGI * * 48.4 0.6
KWARA 53.3 * 54.2 0.4
LAGOS * * 53.9 0.5
NASARAWA 38.5 * 44.7 0.5
NIGER 48.9 1.3 48.8 0.6
OGUN 45.7 3.0 52.2 0.5
ONDO * * 51.8 0.5
OSUN 48.6 0.5 53.4 0.4
OYO 55.1 2.9 52.4 0.5
PLATEAU 47.2 1.6 46.9 0.5
RIVERS 48.8 1.9 49.4 0.4
SOKOTO 50.6 3.2 48.2 0.5
TARABA 45.5 * 45.4 0.4
YOBE 50.0 * 52.0 0.5
ZAMFARA 49.9 6.0 50.5 0.6
FCT 46.7 * 52.6 0.7
National 47.9 0.7 50.1 0.1

100
Liking for Schooling
At the National level, average achievement of learners who like schooling is 50.01. Unlike
their counterparts, theirs was smaller than those that did not like schooling (49.9) in Table
7.16. Among the states, eight had mean scores greater than the national average for learners
who do not like schooling and 17 states had mean greater than for learners who like
schooling. The achievement of learners who like schooling was therefore better than that of
learners who do not like schooling as shown in Table 7.16. The results indicate a strong
relationship between Liking for schooling and achievement in English studies at the Junior
Secondary two level.
Table 7.16: Liking for Schooling as Related to Achievement in JS2 English Studies
State No Yes
Mean Std. Error Mean Std. Error
ABIA 47.3 4.5 49.9 0.5
ADAMAWA * * 49.1 0.6
AKWA-IBOM * * 50.4 0.5
ANAMBRA 55.8 8.8 51.1 0.4
BAUCHI 49.8 2.3 50.7 0.5
BAYELSA 46.4 * 48.4 0.6
BORNO * * 46.0 0.5
BENUE 45.1 0.8 44.5 0.9
CROSS RIVER 43.0 6.3 48.0 0.4
DELTA 54.8 7.7 52.7 0.5
EBONYI * * 51.0 0.4
EDO * * 49.9 0.6
EKITI * * 51.5 0.5
ENUGU * * 49.7 0.5
GOMBE 54.5 * 44.9 0.5
IMO * * 52.4 0.4
JIGAWA 49.3 3.5 47.4 0.5
KADUNA * * 47.1 0.4
KANO * * 48.9 0.6
KATSINA 56.7 * 49.4 0.7
KEBBI 46.8 * 56.1 0.5
KOGI 51.2 * 48.4 0.6
KWARA 55.0 * 54.3 0.4
LAGOS 49.2 * 54.0 0.6
NASARAWA * * 44.6 0.5
NIGER 52.2 2.9 48.6 0.6
OGUN 66.0 * 52.0 0.5
ONDO 48.3 2.7 51.7 0.5
OSUN * * 53.3 0.4
OYO 46.4 * 52.4 0.6
PLATEAU 39.3 * 47.0 0.5

101
RIVERS * * 49.4 0.4
SOKOTO 47.1 4.0 48.2 0.5
TARABA * * 45.4 0.4
YOBE * * 52.0 0.5
ZAMFARA 47.7 4.7 50.5 0.6
FCT * * 52.6 0.7
National 49.9 1.0 50.1 0.1
Observation and Challenges
Lagos state consistently performed best among all the states while Gombe State performed
least. This could require finding out what Lagos state is doing well and what Gombe State is
not doing well to chart a good course for educational development

102
Chapter Eight
Achievement in Mathematics
Introduction The achievement related results and relational analysis are presented in this chapter. In particular, the chapter focuses on achievement at national, geo-political zone and state levels then concludes with relational analysis of non-cognitive variables with achievement.
8.1 National Achievement This sub-section presents results of essay and multiple choice tests; range and percentile; group achievement along gender (male and female), school location (urban and rural); school type (public and private); and finally achievement in content and cognitive domains. 8.1.1 National Average
Figure 8.1 shows the National mean score of 50.01 and standard error of 0.12 for Multiple
choice test and mean 49.92 and standard error of 0.12 for Essay test. These values show little variation that is statistically not significant.
8.1.2 Range and percentile
The range shows the spread or cluster of scores while the percentile indicates the relative
standing of learner‟s score vis-a-vis scores of other learners. The scores were categorised into
five clusters: 0-39, 40-49, 50-59 and 60-69 and above in arroding with the National Grading
cluster for Basic Schools. From Figure 8.2 it was observed that for the Multiple choice test
the score cluster within which the largest number of scores fell was 50-59 (33.5 percent of
learners) and for the Essay Test it was 40-49 (62.2 percent of learners). Furthermore, 164
percent failed the Multiple Choice test unlike the Essay test no learner fell within the Cluster
0-39 percent. At the upper cluster, 2 percent has excellent scores on the Multiple Choice test
while 6 percent obtained excellent scores on the Essay Test. On the whole, achievement on
the Multiple Choice test was Good for a larger population of the learners but only Fair on the
Essay Test.
49.8
50
50.2
MULTIPLE
CHOICE
ESSAY
50.01 49.92
Figure 8.1: Achievement of Learners in
the Multiple Choice and Essay Tests

103
Figure 8.3 presents the percentile for
the Multiple Choice and Essay tests
for Mathematics achievement.
Learners who scored 36.81, 41.77,
49.88, 58.02 and 63.77 achieved
higher than 10 percent, 25 percent,
50 percent, 75 percent and 90
percent of learners who took the
Multiple Choice test. Learners who
scored 40.52, 40.52, 45.89, 56.63
and 64.69 performed better than 10
percent, 25 percent,
Figure 8.2: percentile Scores in Multiple Choice and Essay Tests 50 percent, 7 5 percent and 90 percent of learners who took the Essay test. It was observed that at the 10th and 90th percentiles achievement in the Essay test was higher than that of the multiple choice test; while other percentiles of the multiple choice was better than that of the Essay test achievement. 8.1.3 Group Performances
Three groups were used, these are gender (male and female); school location (urban and rural) and school type (urban and rural).
Figure 8.3: Mean Scores of Learners’ Achievement
in Essay and Multiple Choice by Gender
8.1.4: Performance by School Gender
Figure 8.4 shows that on the average, female learners had higher mean scores than the male learners in both test forms, however, the differences were not significant. The achievement of female in Multiple Choice test was 50.52 while that of male learners was 49.84. Male learners had a mean of 49.95 and the female learners a mean score of 49.88 in Essay test.
10 25 50 75 90
Multiple Choice 36.81 41.77 49.88 58.02 63.77
Essay 40.52 40.52 45.89 56.63 64.69
0
10
20
30
40
50
60
70A
xis
Tit
le
49.84 49.95
50.52
49.88
49.4
49.6
49.8
50
50.2
50.4
50.6
Mltiple Choice Essay
Male Female
Multiple Choice
Multiple Choice

104
8.1.5: Performance by School Location
Figure 8.5 shows that learners in urban and rural schools obtained mean scores with little variations in the two tests forms. The achievement of learners from urban schools in Essay test was 49.95 while that of rural schools was 49.8. Similarly, the achievement of learners in urban schools was 50.11 and learners in rural schools 50.0 in multiple choice test.
Figure 8.4: Mean Scores of Learners’ Achievement in Essay and Multiple Choice by School Location
8.2.1: Achievement of Geo-political Zone
Figure 8.6 and 8.7 provide details of achievement level of learners on the Test Forms
Figure 8.5: Mean Scores in Multiple Choice Test across Geopolitical Zones
45.85
49.00 49.24 49.28 50.16
52.55
54.47
40
42
44
46
48
50
52
54
56
Multiple Choice test
National average scores 50.16
The South East and South
West achieved higher than
national averages
Highest mean score of 54.47
was by learners in South East.
While the lowest mean score
of 45.85 was for learners in
North East
Mltiple Choice Essay
50.11 49.95 50
49.8
URBAN RURAL
Multiple Choice
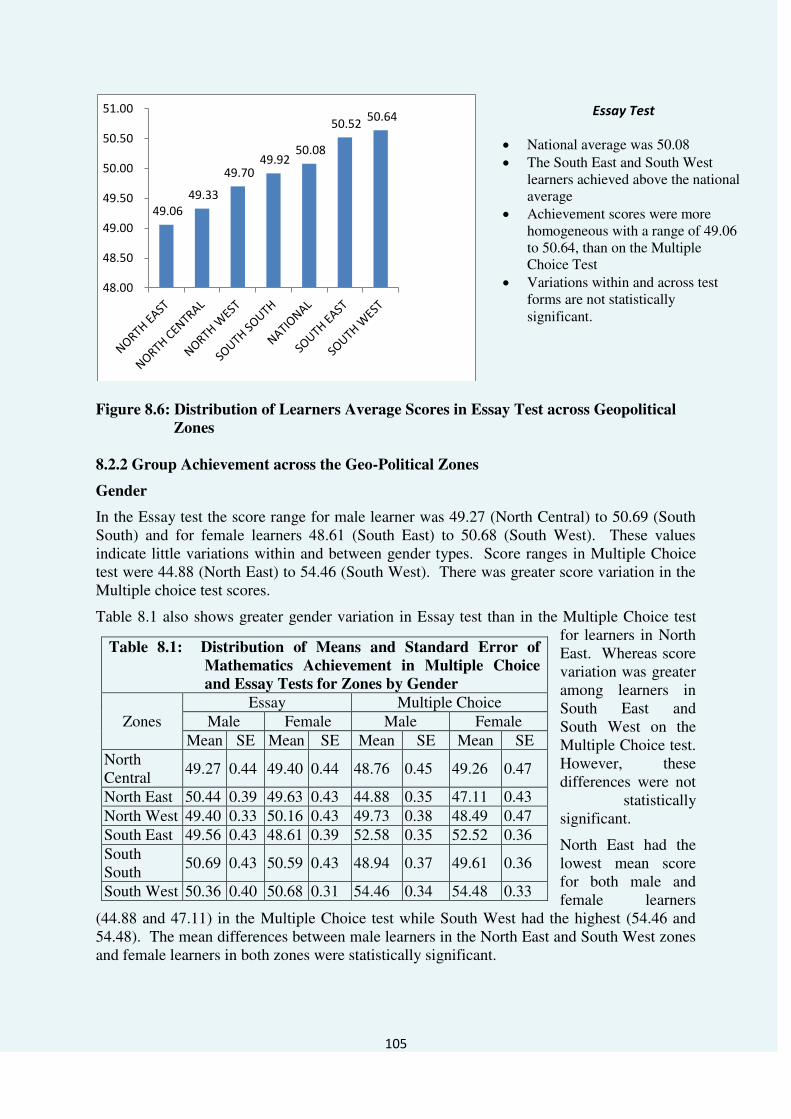
105
Figure 8.6: Distribution of Learners Average Scores in Essay Test across Geopolitical
Zones
8.2.2 Group Achievement across the Geo-Political Zones
Gender
In the Essay test the score range for male learner was 49.27 (North Central) to 50.69 (South South) and for female learners 48.61 (South East) to 50.68 (South West). These values indicate little variations within and between gender types. Score ranges in Multiple Choice test were 44.88 (North East) to 54.46 (South West). There was greater score variation in the Multiple choice test scores.
Table 8.1 also shows greater gender variation in Essay test than in the Multiple Choice test for learners in North East. Whereas score variation was greater among learners in South East and South West on the Multiple Choice test. However, these differences were not
statistically significant.
North East had the lowest mean score for both male and female learners
(44.88 and 47.11) in the Multiple Choice test while South West had the highest (54.46 and 54.48). The mean differences between male learners in the North East and South West zones and female learners in both zones were statistically significant.
49.06
49.33
49.70 49.92
50.08
50.52 50.64
48.00
48.50
49.00
49.50
50.00
50.50
51.00
Table 8.1: Distribution of Means and Standard Error of
Mathematics Achievement in Multiple Choice
and Essay Tests for Zones by Gender
Zones Essay Multiple Choice
Male Female Male Female Mean SE Mean SE Mean SE Mean SE
North Central
49.27 0.44 49.40 0.44 48.76 0.45 49.26 0.47
North East 50.44 0.39 49.63 0.43 44.88 0.35 47.11 0.43 North West 49.40 0.33 50.16 0.43 49.73 0.38 48.49 0.47 South East 49.56 0.43 48.61 0.39 52.58 0.35 52.52 0.36 South South
50.69 0.43 50.59 0.43 48.94 0.37 49.61 0.36
South West 50.36 0.40 50.68 0.31 54.46 0.34 54.48 0.33
Essay Test
National average was 50.08 The South East and South West
learners achieved above the national average
Achievement scores were more homogeneous with a range of 49.06 to 50.64, than on the Multiple Choice Test
Variations within and across test forms are not statistically significant.

106
School Location
Achievements in Mathematics by location for the six zones are given in Table 8.2.
As can be seen in Table 8.2, achievement scores in the Essay test for urban and rural learners hang together, with a range of 48.93 (North Central) to 50.76 (South West) for urban and 48.92 (South East) to 50.64 (South South). Achievement in the multiple choice test shows greater variations than in the Essay test scores. The scores ranged from 45.58 (North East) to 54.45 (South West) for urban learners and 45.50 (North East) to 54.56 (South West) for rural learners.
Similar to the observations for gender, North East learners had the lowest mean scores for both locations (urban = 45.88, Rural = 45.80) in the Multiple choice test. Whereas, South West had the highest (Urban = 54.55, rural = 54.56). The mean differences between scores for urban learners in North East and South West or rural learners in both zones are statistically significant.
8.3: Learners’ Achievement at State Level This section presents learners‟ achievement in Essay and Multiple Choice test at state level as well as group-based achievement in terms of gender (male and female), school location (urban and rural) and in Content and Cognitive domains.
Figure 8.8 displays achievement mean scores on Multiple Choice and Essay test forms. Test scores on Essay test are given in parentheses with a National average of 50.0 while in Multiple Choice test is also 50.0. Learners in 15 States scored above the National average for Multiple Choice test and only 12 states were above National average for Essay test.
A detailed examination of state level achievement shows the following:
Score range on Multiple choice test was 40.0 (Gombe) to 61.0 (Kebbi), and on the Essay test 49.0 (Abia and 15 other states) to 52 (in Akwa Ibom and Oyo), indicating a greater variation in learners‟ achievement in the Multiple Multiple Choice.
Learners in six states scored above the National averages for the Multiple Choice and Essay test forms: Kebbi (61 and 51), Lagos (57, 51) Oyo (53, 52) Ondo (53, 51), Ogun (53, 51) and Yobe (53, 51).
Table 8.2: Distribution of Means and Standard Error of Performance in Multiple
Choice and Essay Tests for Zones by Location
Zone ESSAY MULTIPLE CHOICE
URBAN RURAL URBAN RURAL Mean SE Mean SE Mean SE Mean SE
North Central 48.93 0.42 49.83 0.48 48.46 0.45 48.77 0.49
North East 50.56 0.40 49.39 0.42 45.88 0.36 45.80 0.41
North West 49.34 0.37 49.80 0.38 49.42 0.43 49.34 0.37
South East 49.12 0.41 48.92 0.41 52.78 0.35 52.26 0.36
South South 50.52 0.42 50.64 0.45 49.02 0.35 49.72 0.39
South West 50.76 0.37 50.22 0.41 54.45 0.32 54.56 0.35
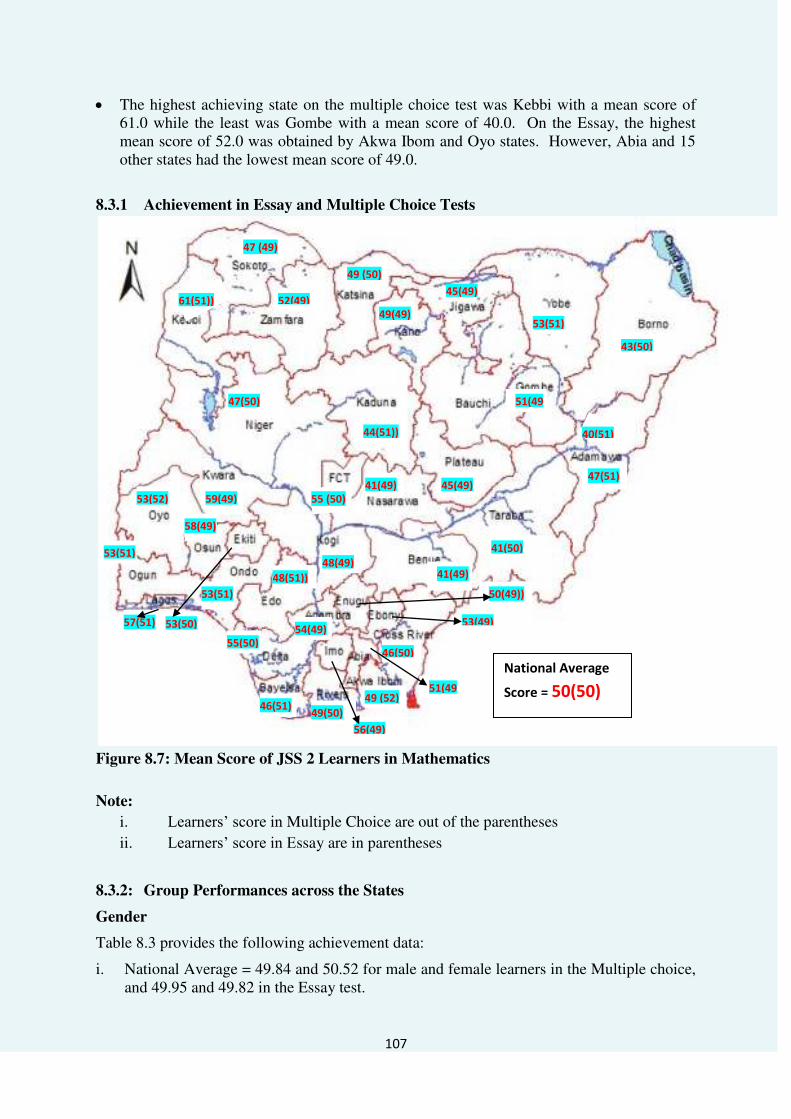
107
The highest achieving state on the multiple choice test was Kebbi with a mean score of 61.0 while the least was Gombe with a mean score of 40.0. On the Essay, the highest mean score of 52.0 was obtained by Akwa Ibom and Oyo states. However, Abia and 15 other states had the lowest mean score of 49.0.
8.3.1 Achievement in Essay and Multiple Choice Tests
Figure 8.7: Mean Score of JSS 2 Learners in Mathematics
Note:
i. Learners‟ score in Multiple Choice are out of the parentheses
ii. Learners‟ score in Essay are in parentheses
8.3.2: Group Performances across the States
Gender
Table 8.3 provides the following achievement data:
i. National Average = 49.84 and 50.52 for male and female learners in the Multiple choice, and 49.95 and 49.82 in the Essay test.
48(49) 41(49)
61(51))
47 (49)
49 (50)
47(50)
59(49) 53(52)
53(51)
57(51)
52(49)
55 (50)
49(49)
44(51))
45(49)
53(51)
51(49
40(51)
41(50)
48(51))
46(50)
56(49) 49(50) 46(51)
49 (52)
41(49)
43(50)
47(51) 45(49)
55(50) 54(49)
53(49)
51(49
50(49))
53(50)
58(49)
53(51)
National Average
Score = 50(50)

108
ii. Score range males 40.00 (Gombe) to 61.01 (Kebbi) and females 37.48 (Benue) to 61.52 (Kebbi) on the Multiple choice test. Whereas, on the Essay test, males 45.76 (Benue) to 51.7 (Akwa Ibom) and females 47.70 (Plateau) to 52.84 (Bayelsa).
iii. Differences in score range in Multiple Choice test: 20.6 for males and 24.04 for females, and on the Essay test 5.95 and 5.14 for male and female learners respectively. These values show wider variation in achievement on the test forms in favour of Multiple Choice test. Within test forms achievement is more homogeneous between the sexes in the Essay test than in the Multiple Test.
iv. State level analysis shows that in comparison with the National Average males in 19 States and females in 17 states scored above the National averages for Multiple Choice test. On the Essay test, male learners in 21 states and female learners in 18 states obtained scores above their respective National Averages.
v. Learners in the following states; Kebbi Lagos, Ogun, Ondo, Oyo, Yobe and FCT scored above the National Averages in both tests.
vi. The highest achievement was from female learners in Kebbi state (61.52) and the lowest also was the female learners in Benue State (37.48).
Table 8.3: Multiple Choice Test and Essay Tests Score in Mathematics by Gender
State
Multiple Choice Essay
Male Female Male Female
Mean SE Mean SE Mean SE Mean SE ABIA 50.19 0.88 51.74 0.78 48.92 0.92 48.33 0.84
ADAMAWA 45.70 0.96 49.34 1.14 50.77 1.05 50.28 1.21
AKWA-IBOM 48.94 0.96 49.32 0.71 51.71 1.05 51.68 0.95
ANAMBRA 53.47 0.74 53.75 0.77 49.22 1.01 48.32 0.86
BAUCHI 51.02 1.01 51.98 0.80 50.23 0.99 48.58 0.95
BAYELSA 44.29 0.84 46.97 0.81 49.58 1.29 52.84 1.78
BORNO 43.45 0.73 42.29 0.76 49.11 0.94 50.97 1.15
BENUE 43.69 1.12 37.48 0.53 45.76 1.61 51.26 2.66
CROSS RIVER 46.36 0.76 45.05 0.86 50.62 0.98 49.75 1.01
DELTA 54.73 0.76 55.80 0.82 49.97 0.96 50.57 1.00
EBONYI 53.02 0.72 51.99 0.79 50.17 0.97 48.60 0.92
EDO 47.74 0.79 48.82 0.82 51.48 1.21 50.25 1.13
EKITI 53.14 0.71 53.34 0.89 49.79 0.90 50.03 0.92
ENUGU 50.44 0.70 49.64 0.79 48.83 0.89 49.81 0.89
GOMBE 40.14 0.43 40.49 0.77 51.37 0.88 48.69 1.05
IMO 55.75 0.71 55.53 0.74 50.64 1.04 47.99 0.82
JIGAWA 46.26 0.83 44.13 0.83 49.79 0.89 48.68 0.95
KADUNA 43.72 0.70 43.48 0.71 50.92 0.93 51.43 0.96
KANO 50.05 1.26 47.06 1.47 48.13 0.87 49.66 1.39
KATSINA 49.38 1.23 46.84 1.72 48.97 0.95 52.14 1.40
KEBBI 61.01 0.77 61.52 0.91 50.74 0.96 50.94 1.21
KOGI 48.61 0.97 46.37 1.03 49.24 1.07 49.07 1.02
KWARA 58.82 0.88 60.10 0.71 48.44 0.92 49.46 0.94
LAGOS 56.59 0.90 56.78 0.74 50.52 1.04 51.60 0.91

109
State
Multiple Choice Essay
Male Female Male Female
Mean SE Mean SE Mean SE Mean SE NASARAWA 40.84 0.68 41.19 0.72 47.85 1.22 49.32 1.22
NIGER 46.75 1.07 47.90 0.99 50.10 1.14 50.51 1.24
OGUN 52.87 0.85 53.84 0.79 50.74 1.15 50.75 1.07
ONDO 52.91 0.85 52.58 0.96 50.95 0.87 50.35 1.04
OSUN 57.97 0.75 57.48 0.59 48.44 0.93 49.08 0.77
OYO 53.70 0.84 51.88 0.83 51.70 1.07 52.18 0.92
PLATEAU 44.49 0.68 44.85 0.76 50.26 0.98 47.70 0.89
RIVERS 47.95 0.76 49.45 0.74 50.61 0.97 49.58 0.85
SOKOTO 47.20 0.61 47.52 0.80 48.88 0.81 49.13 0.97
TARABA 41.18 0.56 40.74 0.60 50.39 0.90 48.79 1.02
YOBE 51.79 0.94 55.01 0.91 50.51 1.07 50.58 0.96
ZAMFARA 51.82 0.98 52.74 1.60 48.42 0.71 49.79 1.37
FCT 55.66 1.35 54.00 1.27 50.70 1.71 50.35 1.28
NATIONAL 49.84 0.16 50.52 0.17 49.95 0.16 49.88 0.17
Location
As can be seen in Table 8.4:
i. National average scores in the Multiple choice test were 50.11 (urban) and 50.0 (rural). While in the Essay test, the values are 49.95 (urban) and 49.90 (Rural).
ii. Score ranges: Multiple choice test were 40.39 (Nasarawa) to 60.87 (Kebbi) for urban learners and 39.94 (Gombe) to 61.43 (Kebbi) among rural learners. In the Essay test, score range for urban learners was 47.73 (Nasarawa) to 52.69 (Akwa Ibom) and for rural learners the values were 47.63 (Kano) to 52.82 (Oyo).
Further examination of the results reveal differences in the score range of 20.48 (urban) and 21.09 (rural) in the Multiple choice test and 4.96 (urban) and 5.19 (rural) in the Essay test. These were internal homogeneity in achievement by location and test forms, but male variations between test forms. The learners irrespective of location demonstrated significantly higher achievement in the Multiple choice test than Essay test.
iii. Learners in 17 states each scored above their respective National average on the Multiple choice test. While learners in 17 and 15 states scored above their respective National averages on the Essay test learners in Lagos, Ogun, Ondo, Oyo, Yobe and FCT scored above the respective National averages for type of location and test forms.
iv. Learners in rural schools in Kebbi state had the highest mean score of 61.43 while their counterparts in Gombe state had the lowest mean score of 39.94.

110
Table 8.4: Multiple Choice and Essay Test Scores by School Location
State
Multiple Choice Essay
Urban Rural Urban Rural
Mean SE Mean SE Mean SE Mean SE
ABIA 51.45 0.78 50.56 0.88 48.58 0.82 48.60 0.94
ADAMAWA 47.20 1.07 47.69 1.06 50.95 1.17 50.15 1.10
AKWA-IBOM
49.55 0.91 48.85 0.76 52.69 1.14 50.97 0.88
ANAMBRA 53.93 0.77 53.31 0.76 49.45 0.99 48.04 0.87
BAUCHI 51.44 0.96 51.51 0.88 50.62 1.10 47.92 0.76
BAYELSA 45.48 0.69 * * 51.08 1.29 * *
BORNO 42.82 0.66 43.26 0.91 50.84 0.96 48.27 1.08
BENUE 40.59 0.79 * * 48.51 1.60 * *
CROSS RIVER
44.62 0.77 47.03 0.84 49.81 0.95 50.67 1.05
DELTA 55.15 0.78 55.31 0.79 49.37 0.88 51.08 1.05
EBONYI 52.73 0.76 52.09 0.83 49.14 1.04 49.32 0.92
EDO 49.38 0.72 47.08 0.90 51.67 1.17 49.85 1.15
EKITI 53.01 0.83 53.75 0.77 50.25 0.95 49.57 0.90
ENUGU 50.11 0.75 49.93 0.75 49.95 0.90 48.73 0.88
GOMBE 40.59 0.55 39.94 0.52 50.52 0.99 50.52 0.97
IMO 56.00 0.75 55.27 0.70 48.53 0.87 49.98 0.99
JIGAWA 45.30 0.72 45.31 1.02 49.37 0.83 49.17 1.06
KADUNA 44.56 0.95 43.13 0.58 50.99 1.14 51.25 0.82
KANO 48.55 1.29 49.56 1.48 49.47 1.08 47.63 0.99
KATSINA 48.28 1.66 48.76 1.27 49.94 1.38 49.95 0.98
KEBBI 60.87 0.96 61.43 0.89 49.23 1.12 50.66 1.23
KOGI 47.20 1.06 47.99 0.96 47.90 0.97 50.28 1.10
KWARA 59.24 0.85 59.37 0.90 48.55 0.94 49.38 1.12
LAGOS 57.13 0.74 56.08 0.90 51.90 0.94 49.97 0.98
NASARAWA 40.39 0.62 41.68 0.78 47.73 1.04 49.47 1.39
NIGER 47.85 1.02 46.67 1.07 50.66 1.31 49.90 1.05
OGUN 53.43 0.84 53.34 0.79 51.48 1.10 50.00 1.11
ONDO 52.95 0.67 51.06 1.90 50.70 0.69 50.75 2.45
OSUN 58.42 0.70 57.15 0.62 48.82 0.89 48.81 0.79
OYO 52.62 0.81 52.68 0.88 51.10 1.02 52.82 0.95
PLATEAU 44.74 0.67 44.54 0.76 48.75 0.91 49.56 1.01
RIVERS 48.77 0.75 48.75 0.79 49.83 0.87 50.26 0.97
SOKOTO 47.20 0.71 47.46 0.67 48.46 0.85 49.49 0.91
TARABA 40.54 0.48 41.92 0.78 50.06 0.86 48.93 1.08
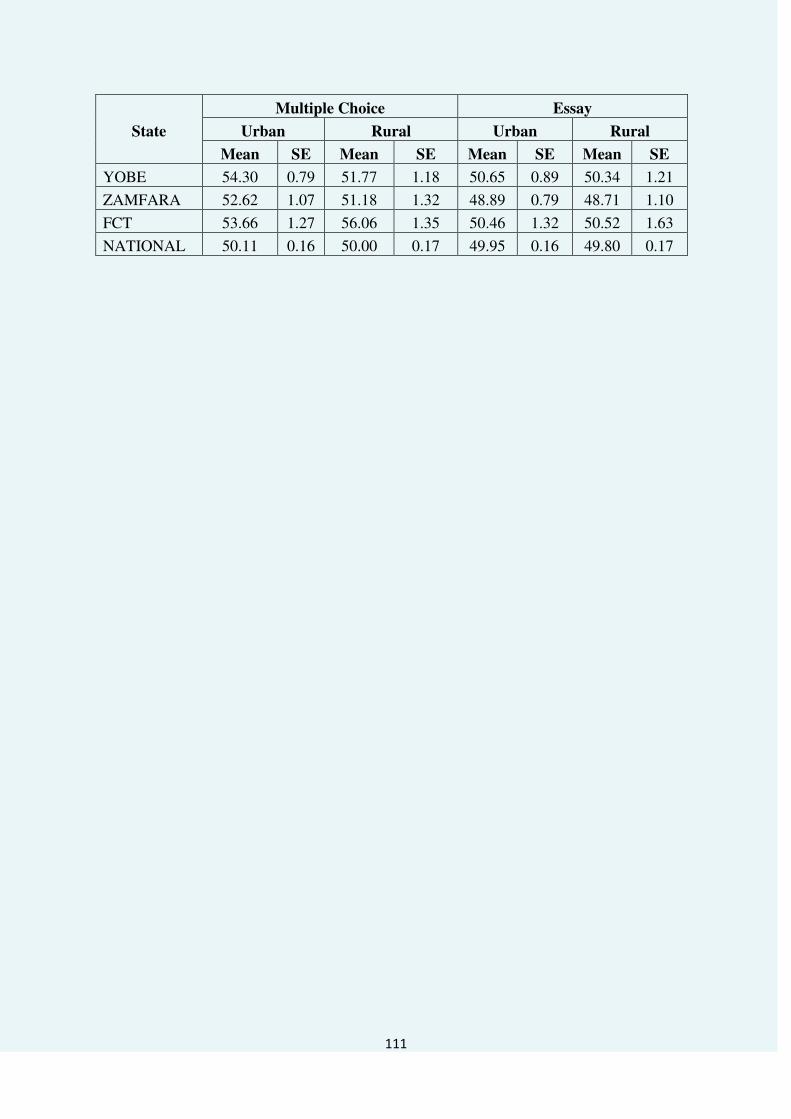
111
State
Multiple Choice Essay
Urban Rural Urban Rural
Mean SE Mean SE Mean SE Mean SE
YOBE 54.30 0.79 51.77 1.18 50.65 0.89 50.34 1.21
ZAMFARA 52.62 1.07 51.18 1.32 48.89 0.79 48.71 1.10
FCT 53.66 1.27 56.06 1.35 50.46 1.32 50.52 1.63
NATIONAL 50.11 0.16 50.00 0.17 49.95 0.16 49.80 0.17

112
8.4: Achievement of Learners in Mathematics Based on Content Domain
Number and Numeration
Figure 8.8 shows a National achievement of 58.59 in the Content Number and Numeration with a range of 37.82 (Gombe) and 80.32 (Kebbi). Seventeen states and the FCT scored above the National Average. The three top achieving states were Kebbi (80.32), Kwara (78.05) and Osun (75.68). While the lowest achievers were Taraba (37.82), Nasarawa (38.82) and Gombe (37.82). The results indicate excellent achievement in the Content Number and Numeration.
Fig 8.8: Achievement of Learners across States Based on Content (Number and
Numeration)
0 20 40 60 80 100
GOMBE
NASARAWA
TARABA
BENUE
BORNO
KADUNA
PLATEAU
BAYELSA
CROSS RIVER
JIGAWA
SOKOTO
NIGER
KATSINA
ADAMAWA
KOGI
KANO
EDO
RIVERS
AKWA-IBOM
NATIONAL
ENUGU
ZAMFARA
ABIA
BAUCHI
YOBE
EBONYI
OGUN
OYO
EKITI
ONDO
ANAMBRA
FCT
DELTA
IMO
LAGOS
OSUN
KWARA
KEBBI
37.82
38.82
39.75
39.86
43.84
44.81
47.33
48.78
49.26
49.43
50.2
51.74
53.11
53.35
53.79
55.11
55.26
55.88
56.23
58.59
60.05
60.11
60.37
61.89
63.26
64.7
64.93
64.97
65.03
65.03
66.27
68.59
69.25
70.47
72.79
75.68
78.05
80.32
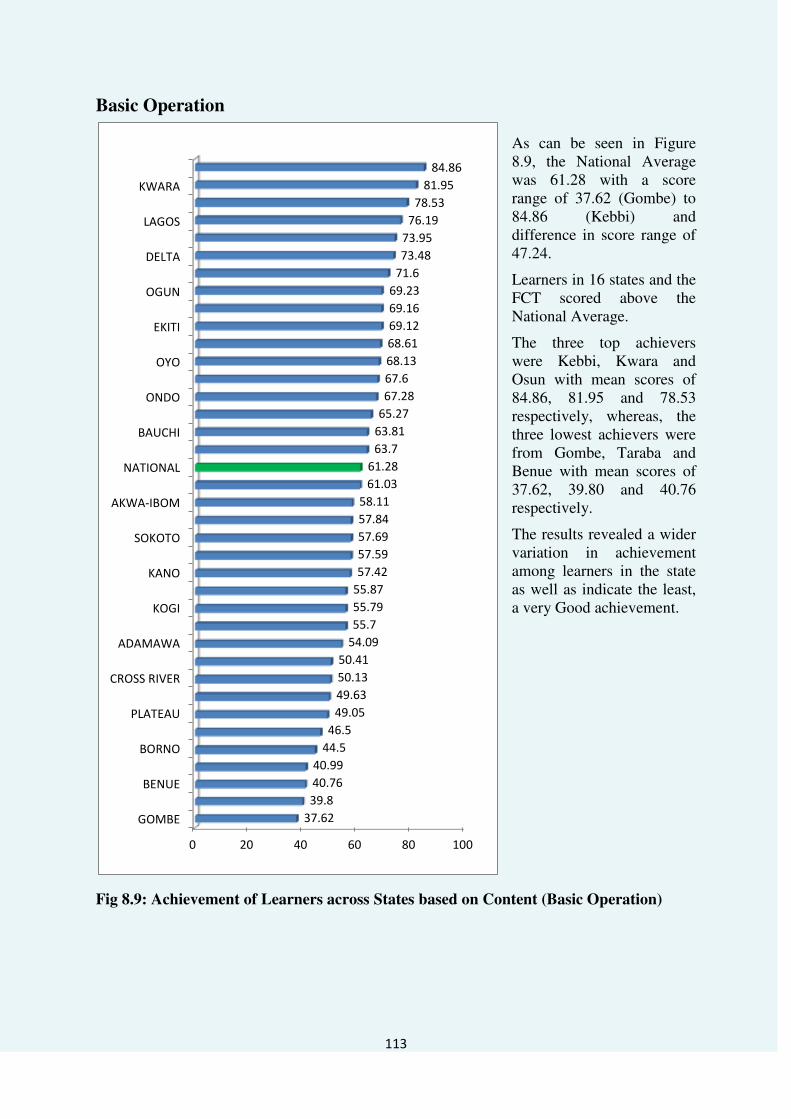
113
Basic Operation As can be seen in Figure 8.9, the National Average was 61.28 with a score range of 37.62 (Gombe) to 84.86 (Kebbi) and difference in score range of 47.24.
Learners in 16 states and the FCT scored above the National Average.
The three top achievers were Kebbi, Kwara and Osun with mean scores of 84.86, 81.95 and 78.53 respectively, whereas, the three lowest achievers were from Gombe, Taraba and Benue with mean scores of 37.62, 39.80 and 40.76 respectively.
The results revealed a wider variation in achievement among learners in the state as well as indicate the least, a very Good achievement.
Fig 8.9: Achievement of Learners across States based on Content (Basic Operation)
0 20 40 60 80 100
GOMBE
BENUE
BORNO
PLATEAU
CROSS RIVER
ADAMAWA
KOGI
KANO
SOKOTO
AKWA-IBOM
NATIONAL
BAUCHI
ONDO
OYO
EKITI
OGUN
DELTA
LAGOS
KWARA
37.62
39.8
40.76
40.99
44.5
46.5
49.05
49.63
50.13
50.41
54.09
55.7
55.79
55.87
57.42
57.59
57.69
57.84
58.11
61.03
61.28
63.7
63.81
65.27
67.28
67.6
68.13
68.61
69.12
69.16
69.23
71.6
73.48
73.95
76.19
78.53
81.95
84.86

114
Algebraic Process
In Figure 8.10, achievement at the National level in Algebraic Process was a mean of 56.35 percent. Score distribution for the state shows a range of 39.2 (Gombe) to 74.66 (Kebbi) a difference of 36.46. Apart from Gombe, all other states scored about 40.0 percent while 18 states had mean scores above the National Average. Learners in the three top achieving states were Kebbi with a mean score of 74.66, Kwara 73.49 and Osun 69.90. The least achievers were from Gombe with a mean score of 39.2. Nasarawa 40.4 and Taraba 40.72 since the National pass mark is 40 percent, achievement at the National level was Good. While achievement ranged from Fair in a few nine states, Good in 13 states, Very Good in 12 states and Excellent in Kebbi and Kwara states.
Fig 8.10: Achievement of Learners across States on Algebraic Process
0 20 40 60 80
GOMBE
NASARAWA
TARABA
BENUE
BORNO
KADUNA
PLATEAU
JIGAWA
CROSS RIVER
BAYELSA
NIGER
SOKOTO
KOGI
ADAMAWA
KATSINA
EDO
KANO
RIVERS
AKWA-IBOM
NATIONAL
ENUGU
ABIA
BAUCHI
ZAMFARA
YOBE
EBONYI
ONDO
OYO
EKITI
OGUN
ANAMBRA
FCT
DELTA
IMO
LAGOS
OSUN
KWARA
KEBBI
39.2
40.4
40.72
41.72
44.48
44.88
47.1
48.39
48.7
48.73
50.39
50.51
51.5
51.81
52.97
54.02
54.23
54.24
54.8
56.35
56.79
58.18
58.49
58.59
60.66
60.75
61.08
61.34
61.53
61.56
62.41
64.1
64.5
65.41
67.92
69.9
73.49
74.66

115
Geometric Mensuration
Achievement details on Geometric Mensuration are provided in Figure 8.11. As can be seen the National average was 51.17. State analysis shows that 18 states had mean scores above the National average, with score range of 34.26 (Benue) to 71.41 (Kebbi) and a difference of 37.15. There was wide variation in achievement across the states with five states: Borno, Nasarawa, Taraba, Gombe and Benue scored below that National pass mark. The top three achievers were from Kebbi with a mean score of 71.41, Kwara 65.6 and Osun 62.40. While the three lowest achievers were learner from Taraba, 36.35, Gombe 35.75 and Benue 34.26.
General achievement on this content was Fair in 13 states and Good in 15 States.
Fig 8.11: Achievement of Learners across States on Geometric Mensuration
0 20 40 60 80
BENUE
GOMBE
TARABA
NASARAWA
BORNO
KADUNA
PLATEAU
JIGAWA
BAYELSA
CROSS RIVER
EDO
NIGER
ADAMAWA
KOGI
SOKOTO
RIVERS
ENUGU
AKWA-IBOM
KANO
NATIONAL
KATSINA
ABIA
BAUCHI
EBONYI
OYO
ONDO
ANAMBRA
EKITI
OGUN
ZAMFARA
FCT
YOBE
DELTA
IMO
LAGOS
OSUN
KWARA
KEBBI
34.26
35.75
36.35
36.65
39.35
40.71
42.19
43.02
43.36
44.21
46.66
47.1
47.15
47.25
47.59
48.2
49.48
49.6
50.34
51.17
51.21
51.91
53.52
53.77
54.37
54.48
55.84
55.96
56.14
56.87
58.05
58.73
59.45
59.61
61.01
62.4
65.6
71.41

116
Everyday Mathematics
Figure 8.12 shows achievement data on Everyday Mathematics content. National average was 55.7 and only 18 states scored above the value. State analysis presents a range of 33.74 (Benue) to 75.14 (Kwara) and a difference of 41.4, an indication of wider variation among the states. Learners in the top three achieving states were from Kwara with a mean score of 75.14, Kebbi 75.14 and Osun 70.39 while the least achievers were learners in Taraba 36.96, Gombe 35.13 and Benue 32.74. On the strength of the National pass mark, achievement on this content was generally satisfactory for failures and a few tending towards very good to the realm of excellent ranged from Fair in 51 through Good to Very Good in 10 States each.
Fig 8.12: Achievement of Learners across States based on Content (Everyday
Mathematics)
0 20 40 60 80
BENUE
GOMBE
TARABA
NASARAWA
BORNO
KADUNA
PLATEAU
JIGAWA
CROSS RIVER
BAYELSA
ADAMAWA
SOKOTO
KOGI
NIGER
KATSINA
KANO
EDO
AKWA-IBOM
RIVERS
NATIONAL
ENUGU
ZAMFARA
BAUCHI
OYO
ABIA
YOBE
EBONYI
EKITI
ONDO
OGUN
FCT
ANAMBRA
DELTA
IMO
LAGOS
OSUN
KEBBI
KWARA
33.74
35.13
36.96
37.16
41.09
42.22
43.54
45.02
47.81
47.91
49.11
49.18
49.56
49.69
50.62
52.82
54.22
54.4
54.75
55.7
56.21
57.12
57.65
58.63
59.31
60.89
61.08
61.65
62.04
63.87
64.9
65.03
66.01
68
69.84
70.39
75.14
75.14

117
Summary
What does data tell us about learners‟ achievement on the Content Domains?
1. At the National level, achievement in the Content Domain was in the decreasing order.
Basic Operation (61.28), Number and Numeration (58.59), Algebraic Process (56.35),
Everyday Mathematics (55.70) and Geometric Mensuration (51.17).
2. Variations in score distribution decreases from Basic Operation (47.24) Number and
Numeration (42.50), Everyday Mathematics (41.40), Geometric Mensuration (37.15) and
Algebraic Process (35.46).
3. Observations on 1 and 2 above suggest that the learners had more difficulties responding
to test items on Algebraic Process and Geometric Mensuration.

118
Cognitive Domain
Knowledge
Figure 8.13 shows an average National achievement of 50.16 percent with a score range of
33.81 percent (Benue) to
68.22 percent (Kebbi).
The three top achievers were
Kebbi (68.22 percent) Kwara
(64.10 percent) and Osun
(61.68 percent). While the
lowest achievers were from
Benue (33.81 percent),
Gombe (35.17 percent) and
Nasarawa (36.04 percent).
Further examination of the
results shows that 18 states
scored above the National
average. However,
application of the National
pass mark revealed that six
states were below the pass
mark, 13 states Fair, 14 states
Good and 4 states Very
Good.
Fig 8.13: Distribution of Mean Score Learners across the States based on Knowledge
Objective
0 20 40 60 80
BENUE
NASARAWA
BORNO
PLATEAU
BAYELSA
CROSS RIVER
KOGI
EDO
KANO
AKWA-IBOM
ENUGU
BAUCHI
ZAMFARA
ONDO
OGUN
ANAMBRA
DELTA
LAGOS
KWARA
33.81
35.17
36.04
36.3
39.14
39.69
41.28
42.39
44.05
44.1
44.14
44.31
45.36
45.87
47.59
48.5
48.64
48.65
49.33
50.12
50.16
51.71
51.94
52.42
53.28
53.35
54.58
54.7
55.15
55.38
55.86
56.91
58.2
58.43
60.52
61.68
64
68.22

119
Achievement data on Comprehension Domain are given in Figure 8.14.
Comprehension As can be seen, the
National average was
53.82 percent, with
score range at 35.56
percent (Gombe) to
74.27 percent (Kebbi).
Seventeen states
achieved above the
National average. The
top three achievers
were from Kebbi
(74.27 percent), Kwara
(71.59 percent) and
Osun (67.82 percent)
while the bottom three
were Gombe (35.56
percent), Benue (36.28
percent) and Taraba
(36.84 percent).
Generally, achievement
pattern was such that
four states scored
below the National
pass mark, 10 were
Fair, 14 states Good, 8
states Very Good and 2
in the realm of
excellent.
.
Fig 8.14: Distribution of Mean Score Learners across the States based on
Comprehension Objectives
0 20 40 60 80
GOMBE
BENUE
TARABA
NASARAWA
BORNO
KADUNA
PLATEAU
BAYELSA
JIGAWA
CROSS RIVER
SOKOTO
NIGER
ADAMAWA
KOGI
EDO
KATSINA
RIVERS
AKWA-IBOM
KANO
ENUGU
NATIONAL
ABIA
BAUCHI
ZAMFARA
EBONYI
ONDO
OYO
EKITI
OGUN
YOBE
ANAMBRA
FCT
DELTA
IMO
LAGOS
OSUN
KWARA
KEBBI
35.56
36.28
36.84
36.89
40.52
41.78
43.68
44.83
44.97
45.44
48.76
48.81
48.9
49.27
50.08
50.84
50.88
51.64
51.7
53.36
53.82
55.35
56.5
57.44
58.16
58.52
58.78
59.46
59.68
60.03
60.1
62.27
63.05
64.05
65.83
67.82
71.59
74.27

120
Higher Order
Figure 8.15 shows average National achievement of 71.21 percent with a score range of 48.09 percent (Gombe) to 94.62 percent (Kebbi). Learners in 18 states scored above the
National average. The top three achievers were from Kebbi (94.62 percent), Kwara (89.90 percent) and Osun (87.66 percent). Whereas the bottom three were learners from Gombe (48.09 percent), Taraba (50.27 percent) and Nasarawa (50.72 percent).
A more detailed observation of the result with respect to National standard revealed that all learners that participated in the study achieved above the minimum, with only one state at the level of Fair, seven states Good, 11 states Very good and 18 states in the band of excellent achievers.
Fig 8.15: Distribution of Mean Score Learners across the States based on Higher Order
Objective
0 20 40 60 80 100
GOMBE
NASARAWA
BORNO
PLATEAU
CROSS RIVER
NIGER
KOGI
KATSINA
EDO
AKWA-IBOM
ENUGU
ABIA
OYO
EBONYI
EKITI
ANAMBRA
DELTA
LAGOS
KWARA
48.09
50.27
50.72
50.94
55.13
56.4
59.13
59.82
61.36
62.07
64.52
64.69
65.78
66.25
67.07
67.83
68.46
69.06
69.52
71.21
71.7
73.33
73.75
74.93
76.96
77.2
77.31
77.58
78.54
79.02
79.07
80.72
83.13
83.13
85.92
87.66
89.9
94.62

121
Summary
What can we learn from the achievement data on Cognitive Domain?
1. the order of achievement increased from Knowledge (50.12 percent), Comprehensive (52.82 percent) to Higher Order (71.21 percent)
2. Variations in achievement scores were in the order: Knowledge (different 34.11 percent), Comprehension (38.71 percent) and Higher Order (46.45 percent).
3. Observations in respect of Knowledge and Higher order were contrary to the theory on cognitive achievement and the trend in research findings. It would seem the learners had mastery of items in Higher order domain than knowledge.
8.7 Relational Analysis
8.7.1: Introduction
This subsection deals with the relationship between the learners contextual variables that influenced their achievement in Mathematics. Specifically, the sub-section highlights how assistance in homework, availability of learning facilities; after-school non-learning engagement; occupation of father and mother; means of going to school; distance between learners‟ home and school; number of meal per day; learners‟ possession of Mathematics textbooks and liking teacher and school, affected learners‟ achievement in Mathematics.

122
8.7.2: Assistance in Homework and Assignment
1. National averages were 50.30 percent, 50.10 percent and 49.70 percent for low, moderate and high level assistance respectively. State level analysis shows score range of 44.7 percent (Gombe) to 54.7 percent (Kebbi) for low assistance, 44.0 percent (Nasarawa) to 56.6 percent (Kebbi) for moderate assistance and 44.0 percent (Benue) to 56.0 percent (Kebbi) for High Assistance.
2. Fig. 8.17 also reveals that learners in 16, 17 and 18 states scored above the National averages of the three categories and learners in 12 states scored above the respective National averages for the three categories of assistance.
3. The top three scores was Kebbi, Lagos and Kwara for low Assistance, Kebbi, Kwara and Lagos for Moderate Assistance and Kebbi, Ondo and Kwara for High Assitance. While the bottom three were Gombe, Borno and Taraba for low assistance, Nasarawa, Benue and Taraba for moderate Aassistance and Benue, Nasarawa and Taraba for High Assistance.
*No significant differences
within states
**Examples of significant
differences between states
Fig 8.16: Achievement of Learners in Mathematics across States on Homework
Assistance
0 100 200
NASARAWA
TARABA
BORNO
KADUNA
SOKOTO
CROSS RIVER
NIGER
KOGI
KATSINA
ABIA
National
BAUCHI
ONDO
FCT
EKITI
IMO
YOBE
OSUN
KWARA
46.4
47.8
46
44.7
45.8
48.6
47.1
46.5
48.9
48.6
47.2
49.9
49.2
47.8
48.8
50.9
49.9
49
50.4
50.4
50.3
49.8
50.1
50.2
52.5
50.5
53.6
50.3
51.6
52.1
52.9
52.4
52.5
51.7
53.3
54.2
53.9
54.7
44
44.7
44.8
45
46.9
47
47.1
47.1
47.5
48
48.4
48.4
48.6
48.7
49.2
49.3
49.4
49.7
50
50
50.1
50.4
50.5
50.9
50.9
51.2
51.8
51.9
51.9
51.9
52.4
52.4
52.9
53.6
53.6
54.2
54.7
56.6
44.5
44
45.6
48.2
46.1
48.9
47.7
46.3
48.7
48.3
48.2
48.5
50.5
50.3
45.8
48.5
48.4
49.6
49.1
51.3
49.7
49.1
50.7
50
53.9
51.2
53
51.3
50.7
52.2
51.4
49.9
49.6
52.7
52.2
53.1
53.8
56
Low level of
Homework
Assistance
Moderate level of
Homework
Assistance
High level
ofHomework
Assistance
**
**
**
**
**
**
**
**
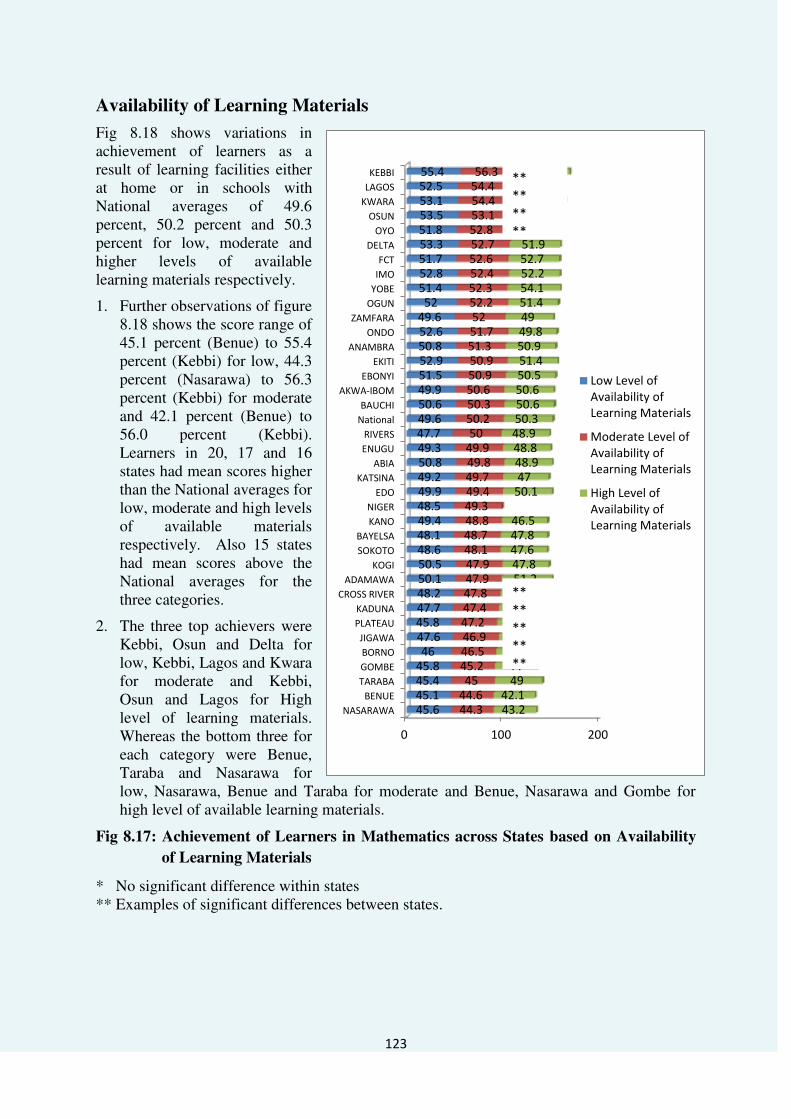
123
Availability of Learning Materials
Fig 8.18 shows variations in achievement of learners as a result of learning facilities either at home or in schools with National averages of 49.6 percent, 50.2 percent and 50.3 percent for low, moderate and higher levels of available learning materials respectively.
1. Further observations of figure 8.18 shows the score range of 45.1 percent (Benue) to 55.4 percent (Kebbi) for low, 44.3 percent (Nasarawa) to 56.3 percent (Kebbi) for moderate and 42.1 percent (Benue) to 56.0 percent (Kebbi). Learners in 20, 17 and 16 states had mean scores higher than the National averages for low, moderate and high levels of available materials respectively. Also 15 states had mean scores above the National averages for the three categories.
2. The three top achievers were Kebbi, Osun and Delta for low, Kebbi, Lagos and Kwara for moderate and Kebbi, Osun and Lagos for High level of learning materials. Whereas the bottom three for each category were Benue, Taraba and Nasarawa for low, Nasarawa, Benue and Taraba for moderate and Benue, Nasarawa and Gombe for high level of available learning materials.
Fig 8.17: Achievement of Learners in Mathematics across States based on Availability
of Learning Materials
* No significant difference within states ** Examples of significant differences between states.
0 100 200
NASARAWA
BENUE
TARABA
GOMBE
BORNO
JIGAWA
PLATEAU
KADUNA
CROSS RIVER
ADAMAWA
KOGI
SOKOTO
BAYELSA
KANO
NIGER
EDO
KATSINA
ABIA
ENUGU
RIVERS
National
BAUCHI
AKWA-IBOM
EBONYI
EKITI
ANAMBRA
ONDO
ZAMFARA
OGUN
YOBE
IMO
FCT
DELTA
OYO
OSUN
KWARA
LAGOS
KEBBI
45.6 45.1 45.4 45.8 46
47.6 45.8 47.7 48.2 50.1 50.5 48.6 48.1 49.4 48.5 49.9 49.2 50.8 49.3 47.7 49.6 50.6 49.9 51.5 52.9 50.8 52.6 49.6
52 51.4 52.8 51.7 53.3 51.8 53.5 53.1 52.5 55.4
44.3 44.6 45
45.2 46.5 46.9 47.2 47.4 47.8 47.9 47.9 48.1 48.7 48.8 49.3 49.4 49.7 49.8 49.9 50
50.2 50.3 50.6 50.9 50.9 51.3 51.7 52 52.2 52.3 52.4 52.6 52.7 52.8 53.1 54.4 54.4 56.3
43.2 42.1
49 44 47.4 48.6 50.3 45.6 48.3 51.2 47.8 47.6 47.8 46.5
50.1 47 48.9 48.8 48.9 50.3 50.6 50.6 50.5 51.4 50.9 49.8 49 51.4 54.1 52.2 52.7 51.9 51.2 55.3 55.1 53.3
56
Low Level of
Availability of
Learning Materials
Moderate Level of
Availability of
Learning Materials
High Level of
Availability of
Learning Materials
**
**
**
**
**
**
**
**
**

124
Non-Learning Engagement
Achievement data on the three levels of non-learning engagements are provided in figure 8.20, with National averages of 50.6 percent (Low), 50.0, moderate and 49.6 (High). Analysis at state level shows a score range of 44.5 percent (Taraba) to 56.8 percent (Kebbi) for low, 42.7 percent (Benue) to 55.2 percent (Kebbi) moderate, and 44.8 (Benue) to 55.6 (Kebbi) for High level of non-learning engagement.
Learners in 16 and 18 states scored above the National averages for low, moderate and high levels of non-learning achievement respectively. While learners in 15 states scored higher than National averages for the three categories investigated.
The top three achievers were from Kebbi, Oyo and FCT (Kwara) for low, Kebbi, Lagos and Kwara for moderate and Kebbi, Kwara and Lagos for high while the bottom three were Nasarawa, Taraba and Benue for low Benue, Nasarawa and Taraba for moderate and Jigawa, Nasarawa and Benue for High level of non-learning activities.
Fig 8.18: Achievement of Learners in Mathematics across states based on Non-Learning
Engagement
*No significant difference within states ** Examples of significant differences between States.
0 50 100 150 200
BENUE
TARABA
CROSS RIVER
PLATEAU
JIGAWA
KOGI
NIGER
ADAMAWA
KATSINA
ZAMFARA
AKWA-IBOM
ABIA
EBONYI
ANAMBRA
YOBE
OGUN
IMO
OSUN
LAGOS
44.6
44.5
44.5
44.9
49.1
47
48.3
47.3
49.7
49.1
46.4
50.8
50.8
46.5
48.1
50.8
49.1
49
50.4
50.6
49.9
49.6
49.9
47.6
51.1
54.4
50.4
51.9
53
54.5
52.2
50.8
51.9
52.5
53.5
54.4
54
56.8
42.7
44.9
44.9
45.2
46.2
46.5
46.8
47.3
47.4
47.9
48.1
48.4
48.6
49.1
49.4
49.4
49.6
49.6
50
50
50.1
50.1
50.2
50.2
50.7
51.4
51.5
51.6
51.8
51.9
52.1
52.1
52.5
53.1
53.2
53.7
53.9
55.2
44.8
44.8
46.6
46.1
49
45.9
45.9
47.5
44.2
48.7
50.3
48
47.7
48.6
49.1
51.6
48.9
49.6
51.1
49.6
51.8
49.1
48.9
49.1
51.4
51.5
51.4
51.1
50.9
51.4
51.8
52.2
52.4
51
52.7
55.6
53.8
56.6
Low Level of Non
Learning Engagement
Moderate Level of
Non Learning
Engagement
High Level of Non-
Learning
Enagagement
**
**
**
**
**
**
**
**

125
Occupation of Fathers
Figure 8.20 provides achievement data on the four categories of occupation of Father; (i) Farming/Fishing; (ii) Business/Trading; (iii) Workers (Public/Private sectors) and others (Artisans etc.). The National average 49.6 percent, 50.2 percent, 50.3 percent and 50.4 percent do not indicate significant variation.
State level analysis shows score range of (Taraba) to 60.9 percent (Benue) for Farmers, 43.9 percent (Benue) to 56.0 percent (Kwara) for Business, 44.6 percent (Benue) to 56.7 percent (Kebbi) for other occupations.
Learners in 19, 17, 15 and 17 states scored above the National averages for Farmers, Business, Workers and other occupations respectively. While learners in nine states (*) scored above the respective National averages for the four categories of occupation of fathers.
The top three achievers were from Kebbi, Lagos and Kwara and Lagos for workers and Kebbi, Niger and Lagos for other occupations. The bottom three were Taraba, Gombe and Nasarawa for farming, Benue, Nasarawa and Gombe for Business, Benue, Nasarawa and Gombe for Workers and Nasarawa, Borno and Gombe for other occupations.
Fig 8.19: Achievement of Learners in Mathematics across the States based On
Occupation of Father
*No significant difference within states. ** Examples of significant differences between states.
0 100 200 300
BENUE
NASARAWA
GOMBE
TARABA
BORNO
KADUNA
PLATEAU
NIGER
JIGAWA
SOKOTO
CROSS RIVER
KOGI
KANO
RIVERS
KATSINA
ONDO
BAYELSA
BAUCHI
ADAMAWA
DELTA
National
ABIA
AKWA-IBOM
ENUGU
EDO
ANAMBRA
YOBE
EKITI
ZAMFARA
EBONYI
OYO
IMO
LAGOS
OGUN
OSUN
FCT
KEBBI
KWARA
60.9
45.4
45
44.7
46
48.1
47.6
48.4
47.5
49.2
48.2
48.2
49.2
49.8
49.5
51.5
48.7
49.4
48.7
53.4
49.6
49.2
49.9
49.4
50.3
50.7
53.1
50.9
50.5
50.7
51.5
51.9
54.5
51.2
53.3
52.2
55.5
54
43.9
44.4
44.9
45.3
45.9
47.3
47.7
48
48.1
48.2
48.6
48.6
48.8
49
49.1
49.2
49.3
50
50.1
50.2
50.2
50.5
50.5
50.6
50.7
50.8
51.1
51.4
51.4
51.9
52.3
53.1
53.1
53.1
53.5
54.1
54.8
56
44.6
44.7
45.1
45.9
47.1
47
46.1
50.2
47.2
47.6
47.2
47.5
48.4
50
48.5
52.5
48.5
51.5
48.2
53.5
50.3
50.3
50.3
49.3
49.8
52.1
51.8
52.4
49.9
50.8
52.6
51.8
54.3
52.5
53.4
52.1
56.7
54.4
42
45.1
45.1
43.1
45.8
46.3
57.6
45.6
51.1
47.8
46.9
47.4
49.7
52.3
52.3
48.4
53
51
52
50.4
50.3
50.7
48.8
49
52.6
49.8
49.6
50
50.9
52.9
49.1
53.6
51.1
52.4
51.5
57.7
53
Farming/fishing
Business/trading
Worker(Public/private
)
Others
**
**
**
**

126
Occupation of Mothers As can be seen in Table 8.21, National achievement of learners whose mothers are in Business, working class and other occupations were 49.0 percent, 50.6 percent, 50.3 percent and 50.1 percent respectively. In respect of achievement at state level, the scores ranged from 42.8 percent (Kano) to 60.5 percent (Kebbi) for farming, 43.8 percent (Gombe) to 56.0 percent (Kebbi) for Business, 43.3 percent (Nasarawa) to 55.3 percent (Osun) for worker and 41.8 percent (Taraba) to 58.6 percent (Kwara) for other occupations.
Learners in 21, 15, 18 and 20 states had scores higher than the respective National averages for the categories of occupation investigated.
The three top achievers were Kebbi, Lagos and Imo for farming mothers, Kebbi, Kwara and Lagos for Business mothers, Osun, Kwara and Yobe for working class mothers and Kwara, kebbi and Ondo for mothers in other occupations. Whereas the bottom three were from Kano, Nasarawa and Gombe for farming mothers, Gombe, Nasarawa and Taraba for Business mothers, Nasarawa, Benue and Borno for working class mothers and Taraba, Nasarawa and Benue for mothers in other occupations.
Table 8.10: Occupation of Mother as Related to Achievement in JS 2 Mathematics
State Farming/Fishing Business/Trading Worker(Public/Private) Others
Mean SE Mean SE Mean SE Mean SE
ABIA 50.5 1.2 49.8 0.7 51.1 1.4 50.2 1.0
ADAMAWA 50.2 1.6 49.9 1.2 53.2 3.3 48.0 1.1
AKWA-IBOM 48.8 1.0 50.6 0.6 49.3 1.4 50.5 4.8
ANAMBRA 50.8 1.4 51.5 0.6 49.9 1.0 53.1 1.8
BAUCHI 48.9 1.1 50.8 1.1 52.0 1.5 50.7 0.8
BAYELSA 49.5 1.2 46.9 1.1 51.0 2.0 50.9 3.9
BORNO 46.3 0.7 46.5 1.0 44.5 1.3 48.1 2.4
BENUE 44.4 2.7 47.0 3.5 44.1 1.7 43.1 *
CROSS RIVER 46.8 1.4 47.6 0.8 47.6 1.2 48.3 1.0
DELTA 52.2 0.9 53.4 0.8 52.2 0.8 54.1 2.3
EBONYI 50.4 1.6 50.4 0.6 51.2 1.0 52.9 1.5
EDO 50.8 1.1 49.8 0.8 50.3 1.9 49.3 2.7
EKITI 52.1 2.2 51.6 0.6 51.1 0.9 51.8 1.1
ENUGU 49.3 1.0 49.7 0.7 49.6 1.4 50.9 1.4
GOMBE 44.5 0.8 43.8 0.8 46.6 0.8 45.8 0.7
IMO 53.9 1.5 52.6 0.6 52.4 1.0 51.4 1.4
JIGAWA 45.8 2.3 46.9 0.8 47.9 1.8 47.6 0.8
KADUNA 48.9 1.5 48.1 0.9 46.0 1.1 46.2 1.1
KANO 42.8 2.5 48.3 1.4 49.2 3.9 49.4 0.8
KATSINA * * 48.1 1.1 51.6 3.7 50.0 1.7
KEBBI 60.5 1.8 56.0 0.7 54.7 1.3 55.8 0.8
KOGI 49.3 1.3 47.8 0.8 47.5 2.9 49.3 1.6
KWARA 52.5 1.3 54.1 0.5 55.1 1.3 58.6 1.2
LAGOS 54.7 2.7 53.9 0.6 54.1 1.3 52.1 1.6
NASARAWA 44.4 1.0 45.9 1.0 43.3 1.0 42.9 1.1
NIGER 51.9 1.7 47.4 0.7 48.3 1.1 49.0 2.3
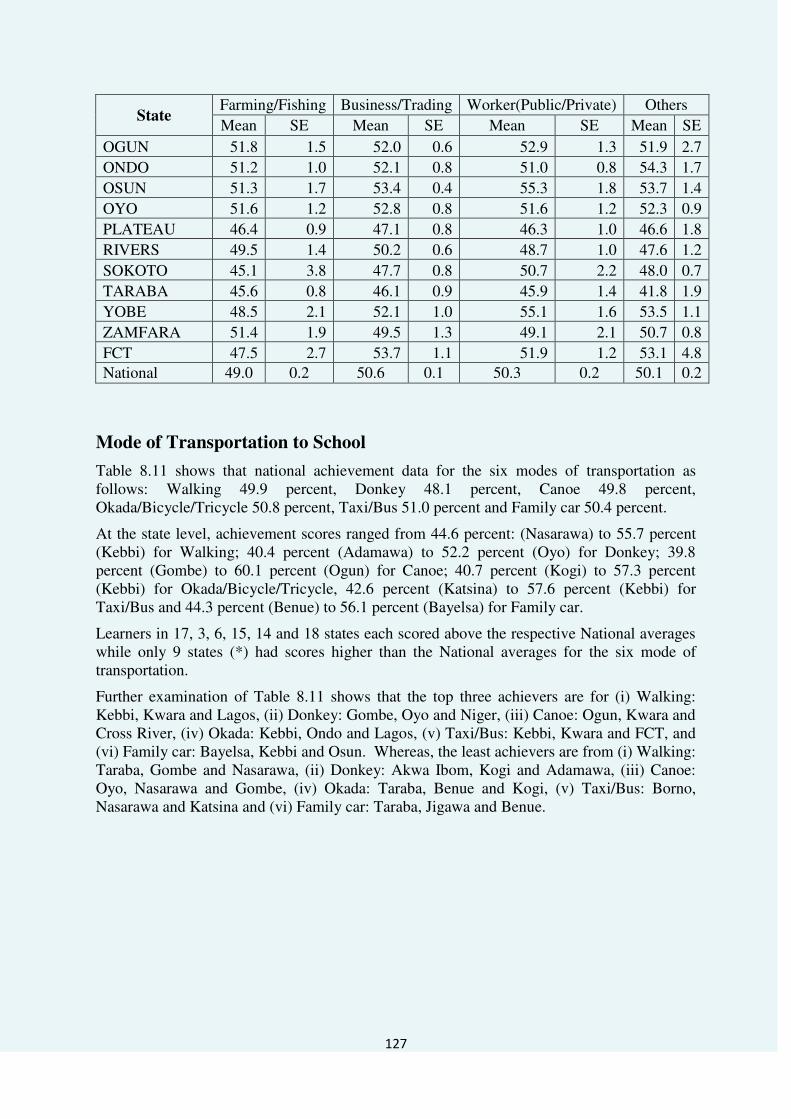
127
State Farming/Fishing Business/Trading Worker(Public/Private) Others
Mean SE Mean SE Mean SE Mean SE
OGUN 51.8 1.5 52.0 0.6 52.9 1.3 51.9 2.7
ONDO 51.2 1.0 52.1 0.8 51.0 0.8 54.3 1.7
OSUN 51.3 1.7 53.4 0.4 55.3 1.8 53.7 1.4
OYO 51.6 1.2 52.8 0.8 51.6 1.2 52.3 0.9
PLATEAU 46.4 0.9 47.1 0.8 46.3 1.0 46.6 1.8
RIVERS 49.5 1.4 50.2 0.6 48.7 1.0 47.6 1.2
SOKOTO 45.1 3.8 47.7 0.8 50.7 2.2 48.0 0.7
TARABA 45.6 0.8 46.1 0.9 45.9 1.4 41.8 1.9
YOBE 48.5 2.1 52.1 1.0 55.1 1.6 53.5 1.1
ZAMFARA 51.4 1.9 49.5 1.3 49.1 2.1 50.7 0.8
FCT 47.5 2.7 53.7 1.1 51.9 1.2 53.1 4.8 National 49.0 0.2 50.6 0.1 50.3 0.2 50.1 0.2
Mode of Transportation to School Table 8.11 shows that national achievement data for the six modes of transportation as follows: Walking 49.9 percent, Donkey 48.1 percent, Canoe 49.8 percent, Okada/Bicycle/Tricycle 50.8 percent, Taxi/Bus 51.0 percent and Family car 50.4 percent.
At the state level, achievement scores ranged from 44.6 percent: (Nasarawa) to 55.7 percent (Kebbi) for Walking; 40.4 percent (Adamawa) to 52.2 percent (Oyo) for Donkey; 39.8 percent (Gombe) to 60.1 percent (Ogun) for Canoe; 40.7 percent (Kogi) to 57.3 percent (Kebbi) for Okada/Bicycle/Tricycle, 42.6 percent (Katsina) to 57.6 percent (Kebbi) for Taxi/Bus and 44.3 percent (Benue) to 56.1 percent (Bayelsa) for Family car.
Learners in 17, 3, 6, 15, 14 and 18 states each scored above the respective National averages while only 9 states (*) had scores higher than the National averages for the six mode of transportation.
Further examination of Table 8.11 shows that the top three achievers are for (i) Walking: Kebbi, Kwara and Lagos, (ii) Donkey: Gombe, Oyo and Niger, (iii) Canoe: Ogun, Kwara and Cross River, (iv) Okada: Kebbi, Ondo and Lagos, (v) Taxi/Bus: Kebbi, Kwara and FCT, and (vi) Family car: Bayelsa, Kebbi and Osun. Whereas, the least achievers are from (i) Walking: Taraba, Gombe and Nasarawa, (ii) Donkey: Akwa Ibom, Kogi and Adamawa, (iii) Canoe: Oyo, Nasarawa and Gombe, (iv) Okada: Taraba, Benue and Kogi, (v) Taxi/Bus: Borno, Nasarawa and Katsina and (vi) Family car: Taraba, Jigawa and Benue.

128
Table 8.11: Mode of Transportation to School as Related to Achievement in
Mathematics
State Walking Donkey Canoe
Okada/ Bicycle/ Tricycle
Taxi/Bus Family Car
Mean SE Mean SE Mean SE Mean SE Mean SE Mean SE
ABIA 49.7 0.5 * * * * 49.4 1.5 51.9 2.2 53.0 3.2
ADAMAWA 48.9 0.6 40.4 1.4 * * 47.5 1.5 * * 49.4 3.7 AKWA-IBOM
50.5 0.5 47.5 * * * 49.0 1.7 52.5 3.5 50.7 3.5
ANAMBRA 51.1 0.5 * * * * 51.3 1.4 52.3 1.5 49.1 2.7
BAUCHI 50.3 0.5 * * * * 50.2 1.6 50.8 3.4 53.5 2.0
BAYELSA 48.2 0.7 * * * * 47.0 2.5 47.2 1.4 56.4 3.0
BORNO 46.4 0.5 * * 55.4 * 43.8 * 43.4 2.2 47.8 1.3
BENUE 45.4 1.8 * * * * 41.8 * 44.7 1.4 44.3 1.5 CROSS RIVER
47.6 0.5 * * 56.1 7.3 51.1 3.5 50.5 2.3 46.4 2.0
DELTA 52.5 0.5 * * * * 53.5 2.1 54.5 3.0 52.9 1.3
EBONYI 50.9 0.5 * * * * 49.2 1.6 51.9 3.0 52.3 1.7
EDO 49.5 0.6 * * * * 51.2 3.5 46.0 . 49.6 2.4
EKITI 51.4 0.5 * * * * 50.4 1.7 50.6 1.8 53.7 1.3
ENUGU 49.9 0.5 * * * * 47.3 1.9 48.9 1.9 49.7 2.1
GOMBE 45.0 0.4 53.7 1.6 39.8 1.7 47.7 2.5 46.9 1.8 46.0 1.3
IMO 52.4 0.5 * * * * 52.0 1.7 50.3 2.0 54.9 1.9
JIGAWA 47.3 0.5 * * 47.6 * 49.0 3.3 44.6 1.1 45.3 2.2
KADUNA 47.2 0.5 * * * * 47.1 1.2 47.7 2.9 50.2 1.4
KANO 48.7 0.7 * * 46.5 * 50.0 2.1 49.5 2.4 * *
KATSINA 49.3 0.7 * * * * 50.3 2.3 42.6 1.0 49.4 4.1
KEBBI 55.7 0.6 * * * * 57.3 1.1 57.6 2.8 56.1 1.7
KOGI 48.6 0.6 42.2 * * * 40.7 1.7 46.0 3.1 50.2 1.4
KWARA 54.5 0.5 * * 57.7 * 52.3 1.4 55.7 1.7 53.6 2.5
LAGOS 53.8 0.6 * * 54.5 4.5 54.2 1.4 54.3 1.0 53.3 1.4
NASARAWA 44.6 0.6 * * 41.0 1.1 47.0 1.7 42.9 1.7 47.9 1.5
NIGER 49.2 0.7 50.5 . 46.4 * 46.8 2.2 45.7 1.6 49.8 1.3
OGUN 51.4 0.6 * * 60.1 * 54.0 1.2 53.4 1.9 50.6 1.1
ONDO 51.0 0.5 * * * * 54.4 1.8 54.2 1.8 52.5 1.6
OSUN 53.0 0.4 * * * * 53.5 0.8 53.7 1.6 55.3 2.9
OYO 53.0 0.7 52.2 3.2 43.3 2.0 51.5 1.6 53.9 1.5 50.9 0.9 PLATEAU 46.9 0.5 * * 46.7 . 45.9 0.5 46.1 2.0 46.7 1.4 RIVERS 49.7 0.5 * * * * 46.4 1.3 49.5 1.0 51.2 1.4 SOKOTO 48.3 0.5 * * * * 53.6 1.7 46.6 5.1 45.4 1.1 TARABA 45.3 0.4 * * * * 43.9 1.8 43.8 2.8 45.3 1.7 YOBE 52.1 0.5 * * * * 51.2 1.7 51.3 2.3 51.3 2.2 ZAMFARA 50.5 0.6 * * 54.5 2.6 50.5 1.4 50.5 1.9 48.5 2.5 FCT 52.9 1.0 * * * * 51.2 1.8 55.0 3.1 51.9 1.6 National 49.9 0.1 48.1 2.0 49.8 1.7 50.8 0.3 51.0 0.4 50.37 0.3
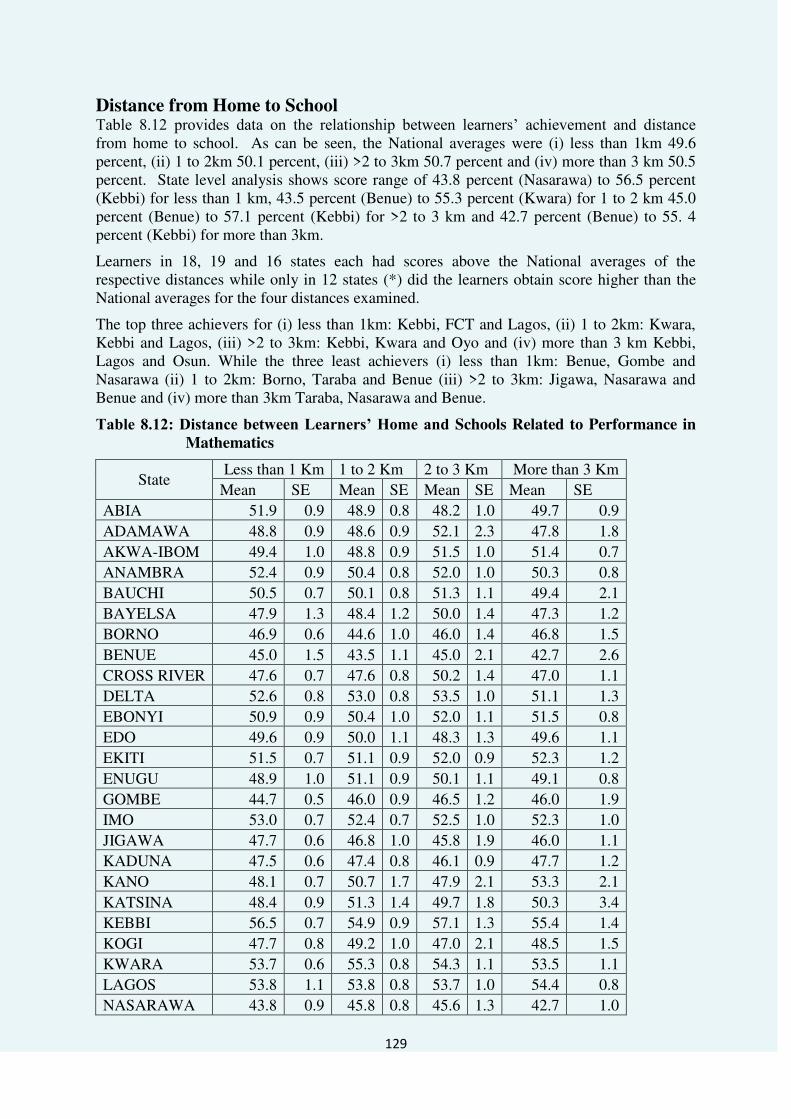
129
Distance from Home to School Table 8.12 provides data on the relationship between learners‟ achievement and distance from home to school. As can be seen, the National averages were (i) less than 1km 49.6 percent, (ii) 1 to 2km 50.1 percent, (iii) >2 to 3km 50.7 percent and (iv) more than 3 km 50.5 percent. State level analysis shows score range of 43.8 percent (Nasarawa) to 56.5 percent (Kebbi) for less than 1 km, 43.5 percent (Benue) to 55.3 percent (Kwara) for 1 to 2 km 45.0 percent (Benue) to 57.1 percent (Kebbi) for >2 to 3 km and 42.7 percent (Benue) to 55. 4 percent (Kebbi) for more than 3km.
Learners in 18, 19 and 16 states each had scores above the National averages of the respective distances while only in 12 states (*) did the learners obtain score higher than the National averages for the four distances examined.
The top three achievers for (i) less than 1km: Kebbi, FCT and Lagos, (ii) 1 to 2km: Kwara, Kebbi and Lagos, (iii) >2 to 3km: Kebbi, Kwara and Oyo and (iv) more than 3 km Kebbi, Lagos and Osun. While the three least achievers (i) less than 1km: Benue, Gombe and Nasarawa (ii) 1 to 2km: Borno, Taraba and Benue (iii) >2 to 3km: Jigawa, Nasarawa and Benue and (iv) more than 3km Taraba, Nasarawa and Benue.
Table 8.12: Distance between Learners’ Home and Schools Related to Performance in
Mathematics
State Less than 1 Km 1 to 2 Km 2 to 3 Km More than 3 Km
Mean SE Mean SE Mean SE Mean SE
ABIA 51.9 0.9 48.9 0.8 48.2 1.0 49.7 0.9
ADAMAWA 48.8 0.9 48.6 0.9 52.1 2.3 47.8 1.8
AKWA-IBOM 49.4 1.0 48.8 0.9 51.5 1.0 51.4 0.7
ANAMBRA 52.4 0.9 50.4 0.8 52.0 1.0 50.3 0.8
BAUCHI 50.5 0.7 50.1 0.8 51.3 1.1 49.4 2.1
BAYELSA 47.9 1.3 48.4 1.2 50.0 1.4 47.3 1.2
BORNO 46.9 0.6 44.6 1.0 46.0 1.4 46.8 1.5
BENUE 45.0 1.5 43.5 1.1 45.0 2.1 42.7 2.6
CROSS RIVER 47.6 0.7 47.6 0.8 50.2 1.4 47.0 1.1
DELTA 52.6 0.8 53.0 0.8 53.5 1.0 51.1 1.3
EBONYI 50.9 0.9 50.4 1.0 52.0 1.1 51.5 0.8
EDO 49.6 0.9 50.0 1.1 48.3 1.3 49.6 1.1
EKITI 51.5 0.7 51.1 0.9 52.0 0.9 52.3 1.2
ENUGU 48.9 1.0 51.1 0.9 50.1 1.1 49.1 0.8
GOMBE 44.7 0.5 46.0 0.9 46.5 1.2 46.0 1.9
IMO 53.0 0.7 52.4 0.7 52.5 1.0 52.3 1.0
JIGAWA 47.7 0.6 46.8 1.0 45.8 1.9 46.0 1.1
KADUNA 47.5 0.6 47.4 0.8 46.1 0.9 47.7 1.2
KANO 48.1 0.7 50.7 1.7 47.9 2.1 53.3 2.1
KATSINA 48.4 0.9 51.3 1.4 49.7 1.8 50.3 3.4
KEBBI 56.5 0.7 54.9 0.9 57.1 1.3 55.4 1.4
KOGI 47.7 0.8 49.2 1.0 47.0 2.1 48.5 1.5
KWARA 53.7 0.6 55.3 0.8 54.3 1.1 53.5 1.1
LAGOS 53.8 1.1 53.8 0.8 53.7 1.0 54.4 0.8
NASARAWA 43.8 0.9 45.8 0.8 45.6 1.3 42.7 1.0

130
State Less than 1 Km 1 to 2 Km 2 to 3 Km More than 3 Km
Mean SE Mean SE Mean SE Mean SE
NIGER 48.1 0.6 48.4 1.5 53.0 2.2 51.4 2.8
OGUN 52.4 0.9 52.7 0.9 50.8 0.9 52.8 1.1
ONDO 52.5 0.7 50.1 0.8 52.4 1.2 51.2 1.4
OSUN 53.0 0.8 53.3 0.7 52.9 0.7 53.7 0.8
OYO 52.5 0.9 51.9 0.8 53.9 1.1 51.1 1.1
PLATEAU 46.1 0.6 47.0 1.0 48.0 1.3 47.5 1.3
RIVERS 51.0 1.1 49.2 0.9 48.4 0.9 49.5 0.6
SOKOTO 47.8 0.6 50.8 1.2 46.7 1.1 46.9 2.4
TARABA 45.5 0.6 44.2 0.7 46.9 1.3 45.3 1.8
YOBE 52.2 0.6 51.9 1.1 51.6 1.4 49.2 2.7
ZAMFARA 50.0 0.8 51.3 1.0 51.1 1.6 50.6 1.7
FCT 55.0 2.2 51.6 1.7 51.6 1.1 53.5 1.4
National 49.6 0.1 50.1 0.2 50.7 0.2 50.5 0.2
Daily Meal Plan
Table 8.13 shows the relational data between achievement and the four meal plans of learners. National average of 49.3 percent, 49.6 percent, 50.2 percent, 50.7 percent were obtained by learners whose meal plan were once, twice, three times and four times respectively.
State level analysis indicated a score range of 41.0 percent (Nasarawa) to 59.5 percent (Kebbi) for one meal a day, 44.0 percent (Nasarawa) to 55.0 percent (Kwara) for two meals a day, 43.7 percent (Benue) to 55.9 percent (Kebbi) for three meals a day and 43.7 percent (Adamawa) to 58.0 percent (Oyo) for four meals a day.
Learners in each of 15, 20, 15 and 15 states had scores higher than the National averages for one, two, three and four meal plans respectively. However, it was only in 11 states (*) learners scored higher than the National average of the four meal plans.
The top three achieving states are (i) One meal plan: Kebbi, Lagos and Kwara, (ii) Two meals plan: Kwara, FCT and Delta (iii) Three meals plan: Kebbi, Kwara and Lagos and (iv) Four meals plan: Oyo, Imo and Kebbi. While bottom three are (i) one meal plan; Abia, Anambra and Nasarawa (ii) Two meals plan: Gombe, Taraba and Nasaawa, (iii) Three meals plan: Gombe, Nasarawa and Benue and (iv) Four meals plan: Gombe, Nasarawa and Adamawa.
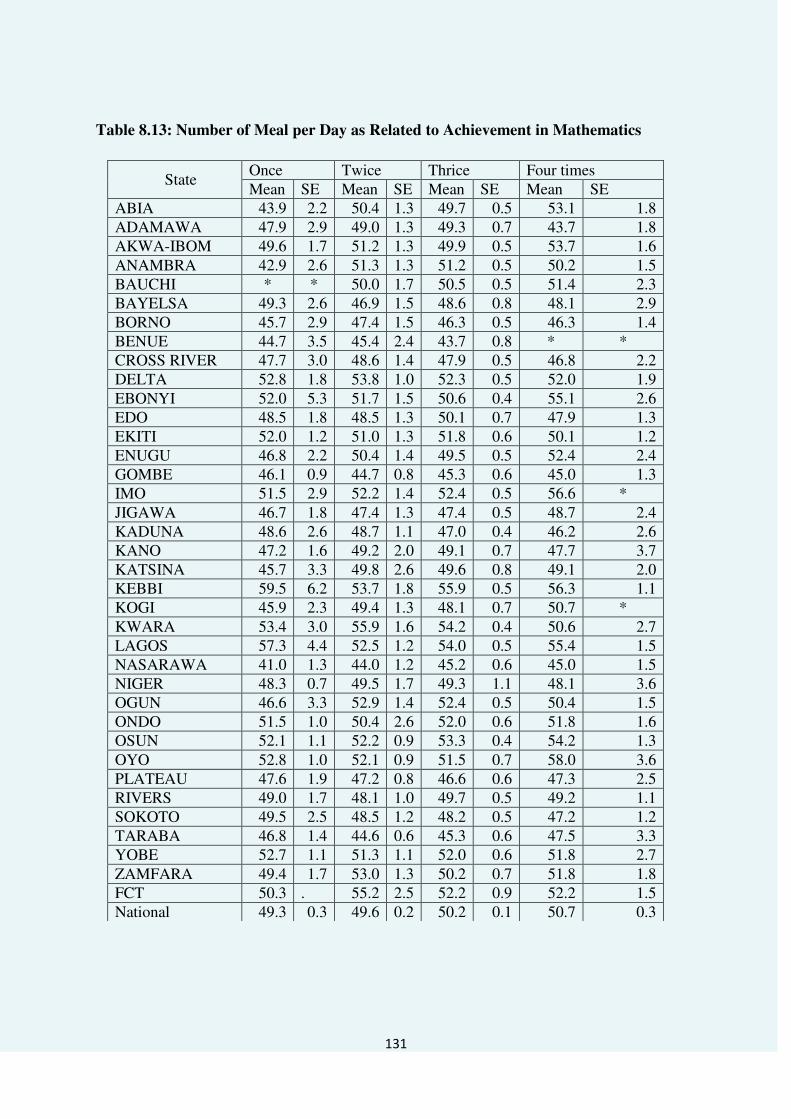
131
Table 8.13: Number of Meal per Day as Related to Achievement in Mathematics
State Once Twice Thrice Four times Mean SE Mean SE Mean SE Mean SE
ABIA 43.9 2.2 50.4 1.3 49.7 0.5 53.1 1.8 ADAMAWA 47.9 2.9 49.0 1.3 49.3 0.7 43.7 1.8 AKWA-IBOM 49.6 1.7 51.2 1.3 49.9 0.5 53.7 1.6 ANAMBRA 42.9 2.6 51.3 1.3 51.2 0.5 50.2 1.5 BAUCHI * * 50.0 1.7 50.5 0.5 51.4 2.3 BAYELSA 49.3 2.6 46.9 1.5 48.6 0.8 48.1 2.9 BORNO 45.7 2.9 47.4 1.5 46.3 0.5 46.3 1.4 BENUE 44.7 3.5 45.4 2.4 43.7 0.8 * * CROSS RIVER 47.7 3.0 48.6 1.4 47.9 0.5 46.8 2.2 DELTA 52.8 1.8 53.8 1.0 52.3 0.5 52.0 1.9 EBONYI 52.0 5.3 51.7 1.5 50.6 0.4 55.1 2.6 EDO 48.5 1.8 48.5 1.3 50.1 0.7 47.9 1.3 EKITI 52.0 1.2 51.0 1.3 51.8 0.6 50.1 1.2 ENUGU 46.8 2.2 50.4 1.4 49.5 0.5 52.4 2.4 GOMBE 46.1 0.9 44.7 0.8 45.3 0.6 45.0 1.3 IMO 51.5 2.9 52.2 1.4 52.4 0.5 56.6 * JIGAWA 46.7 1.8 47.4 1.3 47.4 0.5 48.7 2.4 KADUNA 48.6 2.6 48.7 1.1 47.0 0.4 46.2 2.6 KANO 47.2 1.6 49.2 2.0 49.1 0.7 47.7 3.7 KATSINA 45.7 3.3 49.8 2.6 49.6 0.8 49.1 2.0 KEBBI 59.5 6.2 53.7 1.8 55.9 0.5 56.3 1.1 KOGI 45.9 2.3 49.4 1.3 48.1 0.7 50.7 * KWARA 53.4 3.0 55.9 1.6 54.2 0.4 50.6 2.7 LAGOS 57.3 4.4 52.5 1.2 54.0 0.5 55.4 1.5 NASARAWA 41.0 1.3 44.0 1.2 45.2 0.6 45.0 1.5 NIGER 48.3 0.7 49.5 1.7 49.3 1.1 48.1 3.6 OGUN 46.6 3.3 52.9 1.4 52.4 0.5 50.4 1.5 ONDO 51.5 1.0 50.4 2.6 52.0 0.6 51.8 1.6 OSUN 52.1 1.1 52.2 0.9 53.3 0.4 54.2 1.3 OYO 52.8 1.0 52.1 0.9 51.5 0.7 58.0 3.6 PLATEAU 47.6 1.9 47.2 0.8 46.6 0.6 47.3 2.5 RIVERS 49.0 1.7 48.1 1.0 49.7 0.5 49.2 1.1 SOKOTO 49.5 2.5 48.5 1.2 48.2 0.5 47.2 1.2 TARABA 46.8 1.4 44.6 0.6 45.3 0.6 47.5 3.3 YOBE 52.7 1.1 51.3 1.1 52.0 0.6 51.8 2.7 ZAMFARA 49.4 1.7 53.0 1.3 50.2 0.7 51.8 1.8 FCT 50.3 . 55.2 2.5 52.2 0.9 52.2 1.5 National 49.3 0.3 49.6 0.2 50.2 0.1 50.7 0.3

132
Availability of Textbooks
Learners‟ achievements in relation to availability of textbooks at the National and State level are provided in Table 8.14.
As can be seen in Table 8.14, the National averages were 49.8 percent and 50.4 percent for non-availability and availability of Textbooks respectively. Achievement at State level shows a range of 42.9 percent (Benue) to 56.4 percent (Kebbi) for non-availability and 45.1 percent (Nasarawa) to 55.7 percent (Kebbi) for availability of Textbooks. Also learners in 17 states had scores higher than the National average for non-availability of Textbooks while their counterparts in 16 states scored above the National average for availability of Textbooks. Only in 14 states did learners score above the National averages for non-availability and availability of Textbooks.
The three top achieving states for non-availability of Textbooks are: Kebbi, Lagos and Kwara and for availability Kebbi, Kwara and Osun. While bottom three states are Gombe, Nasarawa and Benue for non-availability and Gombe, Taraba and Nasarawa for availability of Textbooks.
Table 8.14: Relationship of Learners with Textbook and Achievement on Mathematics
State No Yes
Mean SE Mean SE
ABIA 50.7 0.7 49.6 0.6
ADAMAWA 48.5 0.8 49.5 0.9
AKWA-IBOM 50.6 0.6 49.8 0.8
ANAMBRA 49.8 0.7 51.9 0.6
BAUCHI 49.6 0.7 51.2 0.7
BAYELSA 48.7 0.9 48.2 0.9
BORNO 45.4 0.6 48.3 0.8
BENUE 42.9 1.3 46.2 1.1
CROSS RIVER 47.7 0.7 47.8 0.6
DELTA 52.5 0.7 52.9 0.6
EBONYI 51.3 0.7 50.6 0.6
EDO 48.9 0.8 50.2 0.8
EKITI 52.0 0.7 50.9 0.6
ENUGU 49.3 0.7 49.9 0.6
GOMBE 45.0 0.6 45.6 0.6
IMO 52.6 0.6 52.5 0.6
JIGAWA 47.0 0.6 47.9 0.8
KADUNA 47.2 0.5 47.5 0.8
KANO 49.2 0.9 48.6 1.0
KATSINA 49.9 0.9 48.6 1.1
KEBBI 56.4 0.9 55.7 0.6
KOGI 49.6 1.0 47.7 0.7
KWARA 53.6 0.5 54.6 0.7
LAGOS 54.0 0.7 53.7 0.6
NASARAWA 44.4 0.6 45.1 0.9
NIGER 49.0 0.7 48.9 1.0
OGUN 52.2 0.7 52.1 0.7
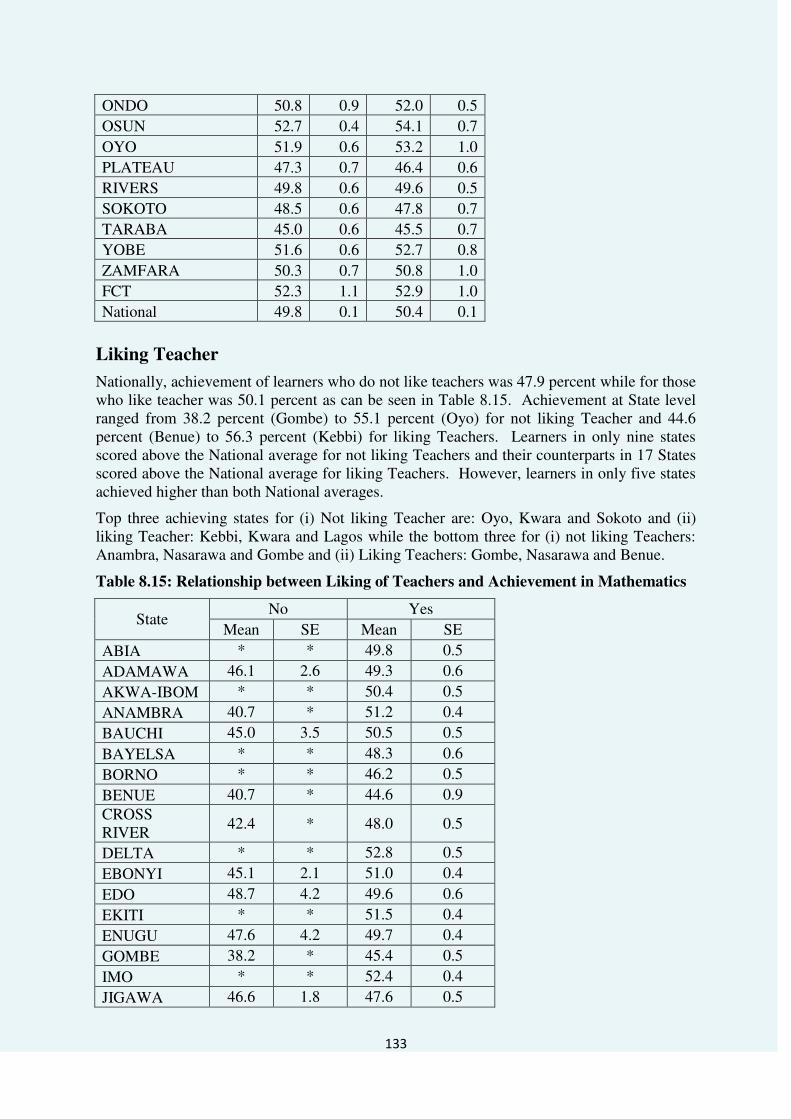
133
ONDO 50.8 0.9 52.0 0.5
OSUN 52.7 0.4 54.1 0.7
OYO 51.9 0.6 53.2 1.0
PLATEAU 47.3 0.7 46.4 0.6
RIVERS 49.8 0.6 49.6 0.5
SOKOTO 48.5 0.6 47.8 0.7
TARABA 45.0 0.6 45.5 0.7
YOBE 51.6 0.6 52.7 0.8
ZAMFARA 50.3 0.7 50.8 1.0
FCT 52.3 1.1 52.9 1.0
National 49.8 0.1 50.4 0.1
Liking Teacher
Nationally, achievement of learners who do not like teachers was 47.9 percent while for those who like teacher was 50.1 percent as can be seen in Table 8.15. Achievement at State level ranged from 38.2 percent (Gombe) to 55.1 percent (Oyo) for not liking Teacher and 44.6 percent (Benue) to 56.3 percent (Kebbi) for liking Teachers. Learners in only nine states scored above the National average for not liking Teachers and their counterparts in 17 States scored above the National average for liking Teachers. However, learners in only five states achieved higher than both National averages.
Top three achieving states for (i) Not liking Teacher are: Oyo, Kwara and Sokoto and (ii) liking Teacher: Kebbi, Kwara and Lagos while the bottom three for (i) not liking Teachers: Anambra, Nasarawa and Gombe and (ii) Liking Teachers: Gombe, Nasarawa and Benue.
Table 8.15: Relationship between Liking of Teachers and Achievement in Mathematics
State No Yes
Mean SE Mean SE
ABIA * * 49.8 0.5
ADAMAWA 46.1 2.6 49.3 0.6
AKWA-IBOM * * 50.4 0.5
ANAMBRA 40.7 * 51.2 0.4
BAUCHI 45.0 3.5 50.5 0.5
BAYELSA * * 48.3 0.6
BORNO * * 46.2 0.5
BENUE 40.7 * 44.6 0.9 CROSS RIVER
42.4 * 48.0 0.5
DELTA * * 52.8 0.5
EBONYI 45.1 2.1 51.0 0.4
EDO 48.7 4.2 49.6 0.6
EKITI * * 51.5 0.4
ENUGU 47.6 4.2 49.7 0.4
GOMBE 38.2 * 45.4 0.5
IMO * * 52.4 0.4
JIGAWA 46.6 1.8 47.6 0.5

134
State No Yes
Mean SE Mean SE
KADUNA * * 47.2 0.4
KANO 45.1 * 48.8 0.6
KATSINA * * 49.6 0.7
KEBBI * * 56.3 0.5
KOGI * * 48.4 0.6
KWARA 53.3 * 54.2 0.4
LAGOS * * 53.9 0.5
NASARAWA 38.5 * 44.7 0.5
NIGER 48.9 1.3 48.8 0.6
OGUN 45.7 3.0 52.2 0.5
ONDO * * 51.8 0.5
OSUN 48.6 0.5 53.4 0.4
OYO 55.1 2.9 52.4 0.5
PLATEAU 47.2 1.6 46.9 0.5
RIVERS 48.8 1.9 49.4 0.4
SOKOTO 50.6 3.2 48.2 0.5
TARABA 45.5 * 45.4 0.4
YOBE 50.0 * 52.0 0.5
ZAMFARA 49.9 6.0 50.5 0.6
FCT 46.7 * 52.6 0.7
National 47.9 0.7 50.1 0.1
Liking Schooling
As can be seen in Table 8.16 National average for learners who like schooling was 49.9 percent and 50.1 percent for those who do not like schooling. Achievement at state level ranged from 39.3 percent (Plateau) to 66.0 percent (Ogun) for not liking schooling and 44.5 percent (Benue) to 56.1 percent (Kebbi) for liking schooling. Learners in eight states scored above the National average for not liking schooling while those in 17 states scored above the National average for liking schooling. However, learners in four states had scores higher than both National averages.
The top three achieving states for (i) Not liking schooling: Ogun, Katsina and Anambra and (ii) Liking Schooling: Kebbi, Kwara and Lagos. The bottom three states are (i) not liking schooling: Benue, Cross River and Plateau and (ii) Liking schooling: Gombe, Nasarawa and Benue.

135
Table 8.16: Liking Schooling and Achievement in Mathematics Relationship
State No Yes
Mean SE Mean SE
ABIA 47.3 4.5 49.9 0.5
ADAMAWA * * 49.1 0.6
AKWA-IBOM * * 50.4 0.5
ANAMBRA 55.8 8.8 51.1 0.4
BAUCHI 49.8 2.3 50.7 0.5
BAYELSA 46.4 * 48.4 0.6
BORNO * * 46.0 0.5
BENUE 45.1 0.8 44.5 0.9
CROSS RIVER 43.0 6.3 48.0 0.4
DELTA 54.8 7.7 52.7 0.5
EBONYI * * 51.0 0.4
EDO * * 49.9 0.6
EKITI * * 51.5 0.5
ENUGU * * 49.7 0.5
GOMBE 54.5 * 44.9 0.5
IMO * * 52.4 0.4
JIGAWA 49.3 3.5 47.4 0.5
KADUNA * * 47.1 0.4
KANO * * 48.9 0.6
KATSINA 56.7 * 49.4 0.7 KEBBI 46.8 * 56.1 0.5
KOGI 51.2 * 48.4 0.6
KWARA 55.0 * 54.3 0.4
LAGOS 49.2 * 54.0 0.6
NASARAWA * * 44.6 0.5
NIGER 52.2 2.9 48.6 0.6
OGUN 66.0 * 52.0 0.5
ONDO 48.3 2.7 51.7 0.5
OSUN * * 53.3 0.4 OYO 46.4 * 52.4 0.6 PLATEAU 39.3 * 47.0 0.5 RIVERS * * 49.4 0.4 SOKOTO 47.1 4.0 48.2 0.5
TARABA * * 45.4 0.4 YOBE * * 52.0 0.5 ZAMFARA 47.7 4.7 50.5 0.6 FCT * * 52.6 0.7
National 49.9 1.0 50.1 0.1

136
Observations and Challenges
Seventeen states and FCT performed above the national average; with such states as Kebbi, Imo, Yobe and Oyo performing well.
Nineteen states performed below the national average with such states as Borno, Niger, Nasarawa and Gombe performing lower.
Kebbi, Kwara and Osun state consistently performed better than the other states in all the objectives and content areas. This could imply a situation where teaching is being done very well and is to be emulated by other states. While the achievement of Benue, Nasarawa and Taraba state was least in all the behavioural and content areas of mathematics.
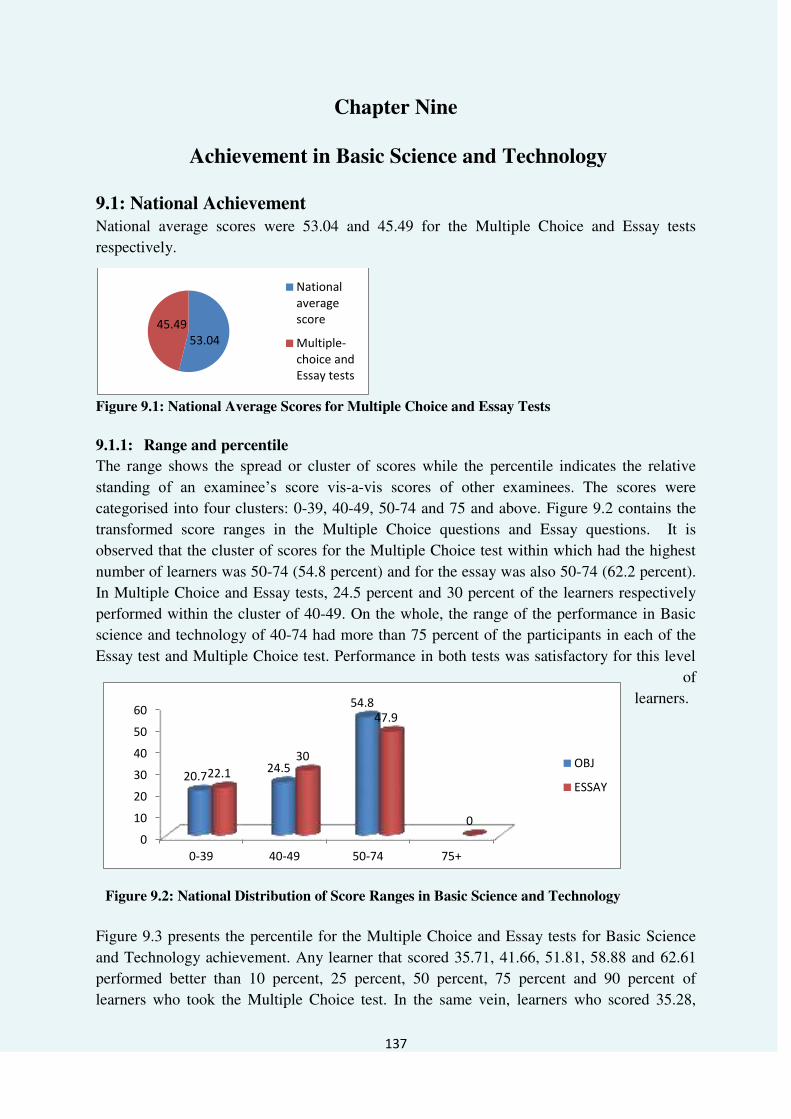
137
Chapter Nine
Achievement in Basic Science and Technology
9.1: National Achievement
National average scores were 53.04 and 45.49 for the Multiple Choice and Essay tests
respectively.
Figure 9.1: National Average Scores for Multiple Choice and Essay Tests
9.1.1: Range and percentile
The range shows the spread or cluster of scores while the percentile indicates the relative
standing of an examinee‟s score vis-a-vis scores of other examinees. The scores were
categorised into four clusters: 0-39, 40-49, 50-74 and 75 and above. Figure 9.2 contains the
transformed score ranges in the Multiple Choice questions and Essay questions. It is
observed that the cluster of scores for the Multiple Choice test within which had the highest
number of learners was 50-74 (54.8 percent) and for the essay was also 50-74 (62.2 percent).
In Multiple Choice and Essay tests, 24.5 percent and 30 percent of the learners respectively
performed within the cluster of 40-49. On the whole, the range of the performance in Basic
science and technology of 40-74 had more than 75 percent of the participants in each of the
Essay test and Multiple Choice test. Performance in both tests was satisfactory for this level
of
learners.
Figure 9.3 presents the percentile for the Multiple Choice and Essay tests for Basic Science
and Technology achievement. Any learner that scored 35.71, 41.66, 51.81, 58.88 and 62.61
performed better than 10 percent, 25 percent, 50 percent, 75 percent and 90 percent of
learners who took the Multiple Choice test. In the same vein, learners who scored 35.28,
53.04
45.49
National
average
score
Multiple-
choice and
Essay tests
Figure 9.2: National Distribution of Score Ranges in Basic Science and Technology
0
10
20
30
40
50
60
0-39 40-49 50-74 75+
20.7 24.5
54.8
22.1
30
47.9
0
OBJ
ESSAY
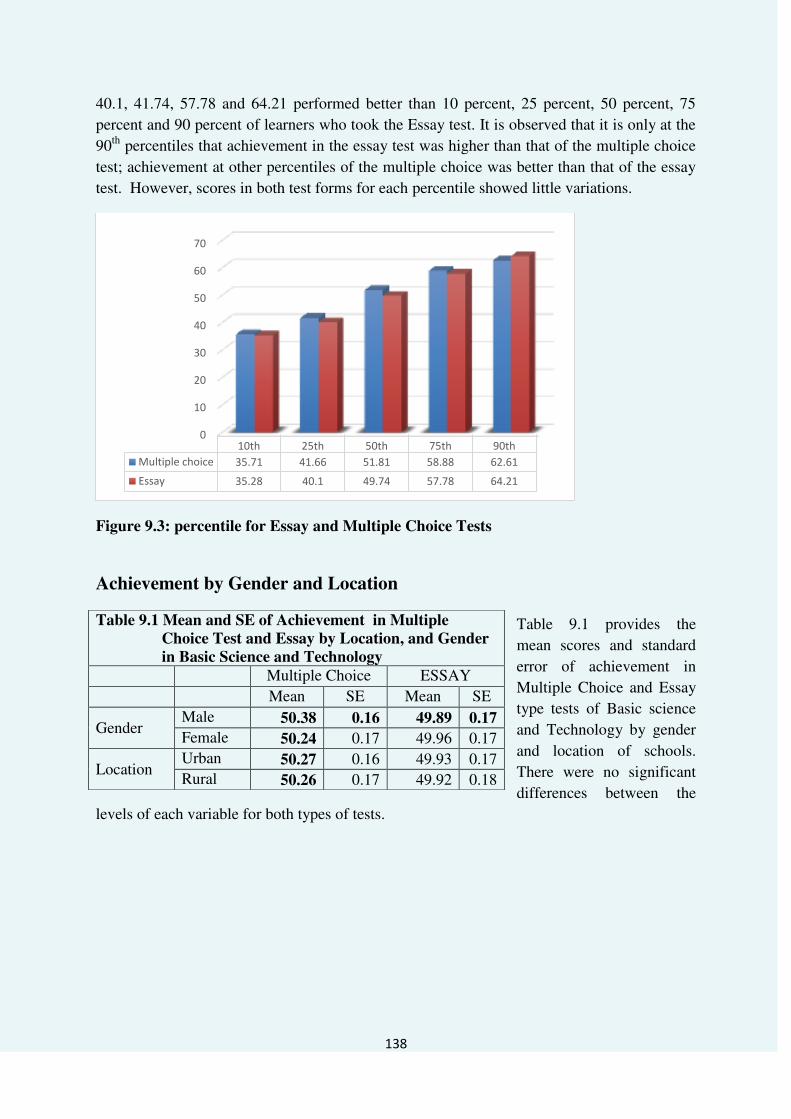
138
40.1, 41.74, 57.78 and 64.21 performed better than 10 percent, 25 percent, 50 percent, 75
percent and 90 percent of learners who took the Essay test. It is observed that it is only at the
90th percentiles that achievement in the essay test was higher than that of the multiple choice
test; achievement at other percentiles of the multiple choice was better than that of the essay
test. However, scores in both test forms for each percentile showed little variations.
Figure 9.3: percentile for Essay and Multiple Choice Tests
Achievement by Gender and Location
Table 9.1 provides the
mean scores and standard
error of achievement in
Multiple Choice and Essay
type tests of Basic science
and Technology by gender
and location of schools.
There were no significant
differences between the
levels of each variable for both types of tests.
0
10
20
30
40
50
60
70
10th 25th 50th 75th 90th
Multiple choice 35.71 41.66 51.81 58.88 62.61
Essay 35.28 40.1 49.74 57.78 64.21
Table 9.1 Mean and SE of Achievement in Multiple
Choice Test and Essay by Location, and Gender
in Basic Science and Technology
Multiple Choice ESSAY
Mean SE Mean SE
Gender Male 50.38 0.16 49.89 0.17
Female 50.24 0.17 49.96 0.17
Location Urban 50.27 0.16 49.93 0.17 Rural 50.26 0.17 49.92 0.18
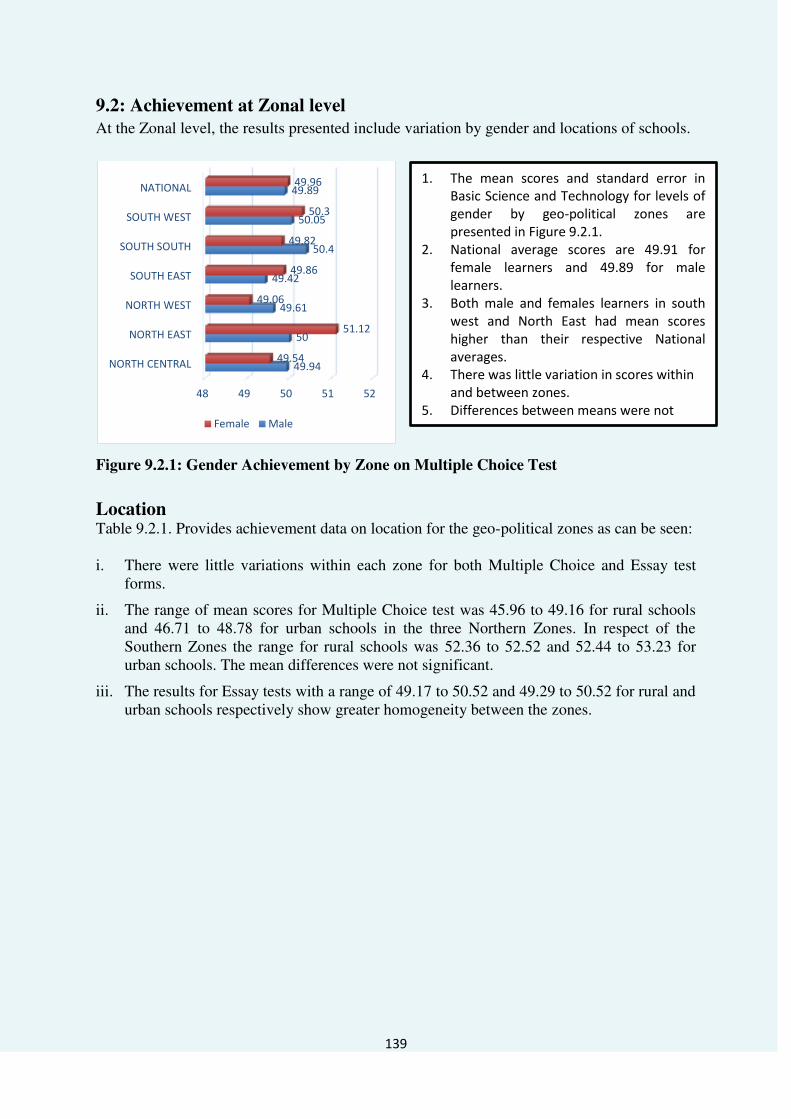
139
9.2: Achievement at Zonal level
At the Zonal level, the results presented include variation by gender and locations of schools.
Figure 9.2.1: Gender Achievement by Zone on Multiple Choice Test
Location Table 9.2.1. Provides achievement data on location for the geo-political zones as can be seen: i. There were little variations within each zone for both Multiple Choice and Essay test
forms.
ii. The range of mean scores for Multiple Choice test was 45.96 to 49.16 for rural schools and 46.71 to 48.78 for urban schools in the three Northern Zones. In respect of the Southern Zones the range for rural schools was 52.36 to 52.52 and 52.44 to 53.23 for urban schools. The mean differences were not significant.
iii. The results for Essay tests with a range of 49.17 to 50.52 and 49.29 to 50.52 for rural and urban schools respectively show greater homogeneity between the zones.
48 49 50 51 52
NORTH CENTRAL
NORTH EAST
NORTH WEST
SOUTH EAST
SOUTH SOUTH
SOUTH WEST
NATIONAL
49.94
50
49.61
49.42
50.4
50.05
49.89
49.54
51.12
49.06
49.86
49.82
50.3
49.96
Female Male
1. The mean scores and standard error in
Basic Science and Technology for levels of
gender by geo-political zones are
presented in Figure 9.2.1.
2. National average scores are 49.91 for
female learners and 49.89 for male
learners.
3. Both male and females learners in south
west and North East had mean scores
higher than their respective National
averages.
4. There was little variation in scores within
and between zones.
5. Differences between means were not
significant

140
Table 9.2. 1: Distribution of Means and Standard Error of Achievement in Multiple
Choice and Essay Tests for Geopolitical Zones by Location
Content Domain
Achievement data on content domains in Table 9.2.2 shows some interesting observations:
i. The highest National average of 57.84 was obtained on the content Living and Non-Living things. Each zone had the highest mean score on this theme with a range of 50.76 (North East) to 63.42 (South East). Three Southern Zones: South East (63.42) South South (62.77) and South West (61.94) scored above the National average.
ii. The theme „You and Technology‟ seemed to have presented some difficulty to the learners in North Central, north east and North West in which the learners had the lowest mean values of 47.77, 42.08 and 44.47 respectively. Whereas, for learners in south East, South South and South West lowest achievement was in the Theme You and your environment, with mean scores of 55.05, 54.52 and 53.45 respectively.
iii. Achievement for all zones on You and energy was the second best. South east zone had the highest mean scores in the four themes (55.05, 63.42, 56.01 and 60.09) while North East (43.25, 50.76, 42.08 and 49.12) had the lowest.
Table 9.2.2: Means on Content Domains across Geopolitical Zones
GEOPOLITICAL
ZONES
You and
environment
Living and non-
living things
You and technology
You and energy
Mean Std.
Error Mean
Std.
Error Mean Std. Error Mean Std. Error
NORTH CENTRAL 48.10 0.53 55.19 0.65 47.77 0.61 53.29 0.54
NORTH EAST 43.25 0.46 50.76 0.55 42.08 0.49 49.12 0.45
NORTH WEST 45.51 0.44 53.24 0.54 44.47 0.48 51.38 0.44
SOUTH EAST 55.05 0.41 63.42 0.50 56.01 0.49 60.09 0.42
SOUTH SOUTH 54.52 0.42 62.77 0.51 55.37 0.50 59.58 0.43
SOUTH WEST 53.45 0.39 61.94 0.47 54.01 0.46 58.74 0.39
NATIONAL 49.91 0.19 57.84 0.23 49.87 0.21 55.32 0.19
Zone location MULTIPLE CHOICE ESSAY
Mean SE Mean SE
NORTH CENTRAL URBAN 48.78 0.50 49.64 0.47
RURAL 49.16 0.46 49.79 0.45
NORTH EAST URBAN 46.71 0.37 50.52 0.39
RURAL 45.96 0.43 50.52 0.45
NORTH WEST URBAN 47.93 0.37 49.58 0.39
RURAL 47.46 0.40 49.17 0.40
SOUTH EAST URBAN 53.23 0.36 49.39 0.42
RURAL 53.38 0.38 50.01 0.45
SOUTH SOUTH URBAN 52.63 0.37 49.69 0.42
RURAL 53.52 0.38 50.52 0.43
SOUTH WEST URBAN 52.44 0.32 50.50 0.37
RURAL 52.36 0.38 49.67 0.42

141
Figure 9.2.3: Distribution of Mean Scores by Geo-Political Zone on the Objectives
Domains
Cognitive Domains
Figure 9.2.3 shows achievement mean scores at cognitive levels for National and Zonal
levels. National average was 57.84, 45.13 and 53.32 for knowledge, Comprehension and
Higher order domains respectively. Achievement is highest on knowledge domain items.
Further examination of results shows that:
i. Learners in North East Zone obtained the highest mean scores of 59.71 on the Higher order subtest.
ii. Learners in each Zone had their highest mean scores on knowledge domain items with a range of 50.83 (North East) and 63.35 (South East).
iii. Three Zones, namely North East (59.76), South East (56.71) and South South (53.75) obtained means score higher than the National average for Higher order subtest.
iv. North Central and North West had mean scores below the National averages for the three subtest while South West had mean scores above those of Knowledge and Comprehension.
55.44
50.83
53.02
63.35
62.73
61.78
57.80
43.54
39.01
41.40
49.70
49.24
48.25
45.13
48.95
59.76
49.81
56.71
53.75
51.30
53.32
0.00 20.00 40.00 60.00 80.00
NORTH CENTRAL
NORTH EAST
NORTH WEST
SOUTH EAST
SOUTH SOUTH
SOUTH WEST
NATIONAL
HIGHER ORDER
COMPREHENSION
KNOWLEDEGE

142
9.3: Achievement at State Level
Figure 9.3.1, the National map displays achievement scores on multiple choice and Essay
tests for state and FCT. The national average was 54.0 for Multiple Choice test and 49.0 for
Essay test. State distribution shows score range of 41.0 (Gombe) to 59.0 (Kebbi). Three states
namely Kebbi (59.0). Osun (57.0) and Imo (55.0) scored above the National average while
four states namely Ebonyi, Anambra, Yobe and FCT had the same score as the National
average. The other 30 states obtained mean scores below the National average.
In respect of the Essay test, score range was 48.0 (Niger) to 51.0 (Lagos, Ondo, Ekiti, Yobe,
Bauchi, Borno, Benue and Gombe), 26 states scored above the National average while
achievement of learners in 10 states was same as the National average.
In seven states, namely: Kebbi, Sokoto, Osun, Imo, Borno, Yobe, Gombe, Taraba and FCT,
there was variation of at least 6 points in achievement scores between both test forms.
Generally, more variation is observed in the mean scores on the Multiple Choice than the
Essay.
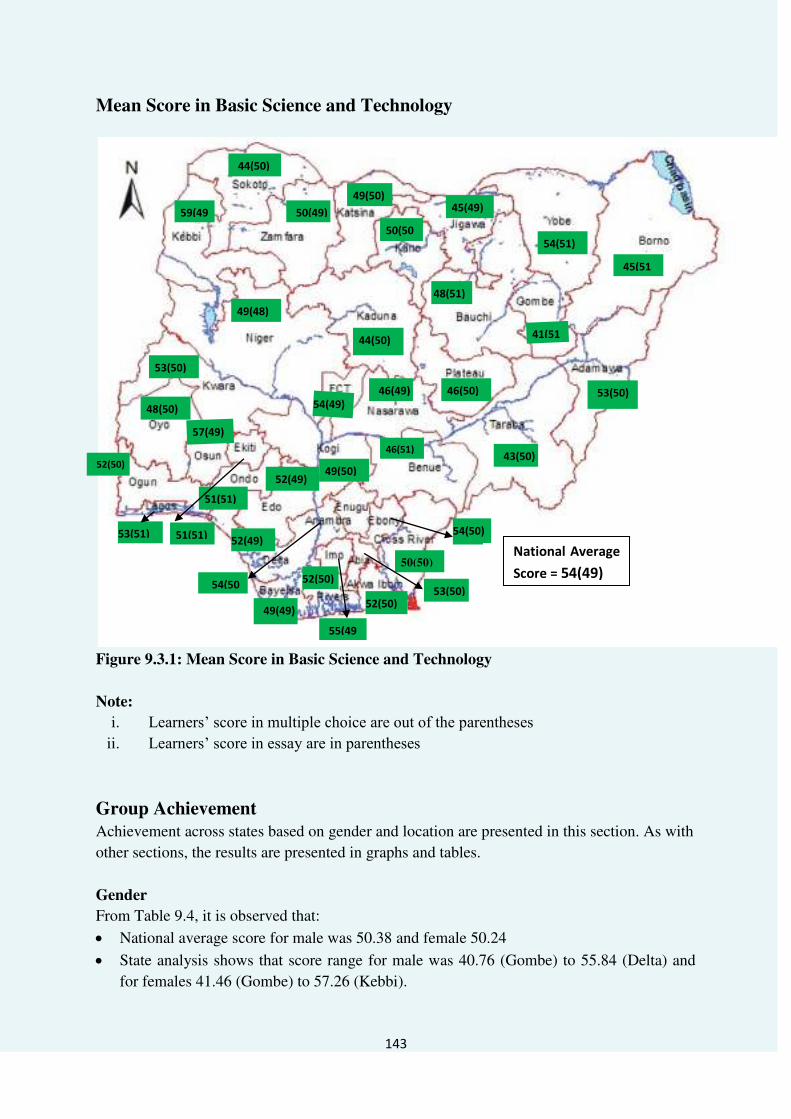
143
Mean Score in Basic Science and Technology
Figure 9.3.1: Mean Score in Basic Science and Technology
Note:
i. Learners‟ score in multiple choice are out of the parentheses ii. Learners‟ score in essay are in parentheses
Group Achievement
Achievement across states based on gender and location are presented in this section. As with
other sections, the results are presented in graphs and tables.
Gender
From Table 9.4, it is observed that:
National average score for male was 50.38 and female 50.24
State analysis shows that score range for male was 40.76 (Gombe) to 55.84 (Delta) and
for females 41.46 (Gombe) to 57.26 (Kebbi).
59(49
44(50)
49(50)
49(48)
53(50)
48(50)
52(50)
53(51)
50(49)
54(49)
50(50
44(50)
45(49)
54(51)
48(51)
41(51
43(50) 49(50)
50(50)
55(49
52(50)
49(49) 52(50)
46(49)
45(51
53(50) 46(50)
52(49)
54(50
54(50)
53(50)
52(49)
51(51)
57(49)
51(51)
46(51)
National Average
Score = 54(49)

144
Twenty one states performed above the national averages for male and female learners on
the test.
For the Essay test: National average scores were 49.89 and 49.96 for male and female learners respectively,
score range for males 47.25 (Nasarawa) to 55.26 (Benue) and for female 47.83 (Abia) to 54.05 (Taraba)
Achievement was homogeneous within each state, that is, there was no large gender
difference in each state. Learners in 17 states each scored above the National average for
males and females in the Essay test.
Score variations of at least 6 points were observed between both test forms in the
following states: Delta, Gombe, Kebbi, Sokoto, Taraba and FCT.
Table 9.4: Mean of Multiple Choice and Essay Test in Basic Science and Technology by
Gender
State Multiple Choice Essay
Male Female Male Female Mean SE Mean SE Mean SE Mean SE
ABIA 52.58 0.81 52.26 0.83 49.384 1.026 47.833 0.908
ADAMAWA 50.19 1.21 51.22 1.20 50.803 1.110 50.769 1.089
AKWA-IBOM
53.05 0.73 51.84 0.88 50.390 0.893 49.792 1.022
ANAMBRA 55.25 0.75 54.00 0.95 49.784 0.917 51.467 1.021 BAUCHI 46.51 0.91 46.59 0.91 48.633 0.969 49.940 0.981 BAYELSA 51.39 1.15 51.51 1.09 51.284 1.432 48.906 1.503 BORNO 47.52 1.11 48.07 0.88 52.582 1.212 50.680 1.036 BENUE 45.27 1.80 46.98 2.38 55.263 2.317 51.161 2.593
CROSS RIVER
51.15 0.93 51.13 0.96 50.579 1.060 48.876 1.002
DELTA 55.84 0.80 56.18 0.86 50.340 0.976 50.445 0.919 EBONYI 54.05 0.80 54.21 0.86 49.186 0.886 51.316 1.020 EDO 51.01 1.22 53.16 0.92 50.260 1.203 50.459 1.043 EKITI 53.66 0.70 52.74 0.85 50.304 0.895 51.042 1.102 ENUGU 51.89 0.78 52.62 0.83 49.679 0.906 48.505 0.966
GOMBE 40.76 0.65 41.46 0.68 49.455 0.986 51.205 0.937 IMO 53.79 0.73 53.50 0.77 49.072 0.969 50.895 1.001 JIGAWA 44.89 0.80 45.23 0.83 50.184 0.929 49.424 0.891 KADUNA 46.04 0.86 45.99 1.10 50.607 0.921 48.568 1.060 KANO 54.10 1.07 52.38 1.26 49.697 1.399 52.620 1.372 KATSINA 45.10 0.94 45.71 0.97 47.781 0.979 47.881 1.250
KEBBI 55.83 0.90 57.26 0.81 49.636 1.132 48.115 1.045 KOGI 52.37 1.07 49.08 1.30 50.043 1.008 50.651 1.196 KWARA 51.80 0.84 52.41 1.09 50.421 0.863 47.930 1.139 LAGOS 54.94 0.82 56.57 0.80 49.383 0.878 50.742 0.957 NASARAWA 44.65 1.21 44.90 1.15 47.259 1.433 48.732 1.257
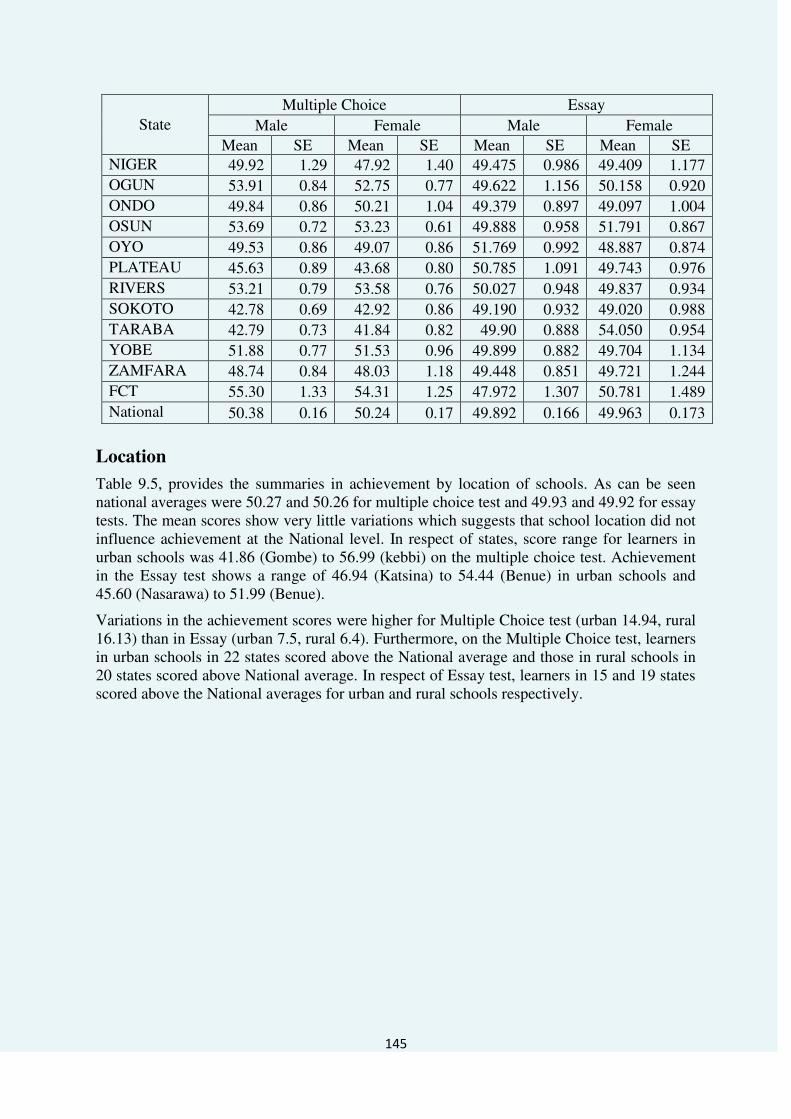
145
State Multiple Choice Essay
Male Female Male Female
Mean SE Mean SE Mean SE Mean SE NIGER 49.92 1.29 47.92 1.40 49.475 0.986 49.409 1.177 OGUN 53.91 0.84 52.75 0.77 49.622 1.156 50.158 0.920 ONDO 49.84 0.86 50.21 1.04 49.379 0.897 49.097 1.004 OSUN 53.69 0.72 53.23 0.61 49.888 0.958 51.791 0.867 OYO 49.53 0.86 49.07 0.86 51.769 0.992 48.887 0.874 PLATEAU 45.63 0.89 43.68 0.80 50.785 1.091 49.743 0.976
RIVERS 53.21 0.79 53.58 0.76 50.027 0.948 49.837 0.934 SOKOTO 42.78 0.69 42.92 0.86 49.190 0.932 49.020 0.988 TARABA 42.79 0.73 41.84 0.82 49.90 0.888 54.050 0.954 YOBE 51.88 0.77 51.53 0.96 49.899 0.882 49.704 1.134 ZAMFARA 48.74 0.84 48.03 1.18 49.448 0.851 49.721 1.244 FCT 55.30 1.33 54.31 1.25 47.972 1.307 50.781 1.489
National 50.38 0.16 50.24 0.17 49.892 0.166 49.963 0.173
Location
Table 9.5, provides the summaries in achievement by location of schools. As can be seen national averages were 50.27 and 50.26 for multiple choice test and 49.93 and 49.92 for essay tests. The mean scores show very little variations which suggests that school location did not influence achievement at the National level. In respect of states, score range for learners in urban schools was 41.86 (Gombe) to 56.99 (kebbi) on the multiple choice test. Achievement in the Essay test shows a range of 46.94 (Katsina) to 54.44 (Benue) in urban schools and 45.60 (Nasarawa) to 51.99 (Benue).
Variations in the achievement scores were higher for Multiple Choice test (urban 14.94, rural 16.13) than in Essay (urban 7.5, rural 6.4). Furthermore, on the Multiple Choice test, learners in urban schools in 22 states scored above the National average and those in rural schools in 20 states scored above National average. In respect of Essay test, learners in 15 and 19 states scored above the National averages for urban and rural schools respectively.
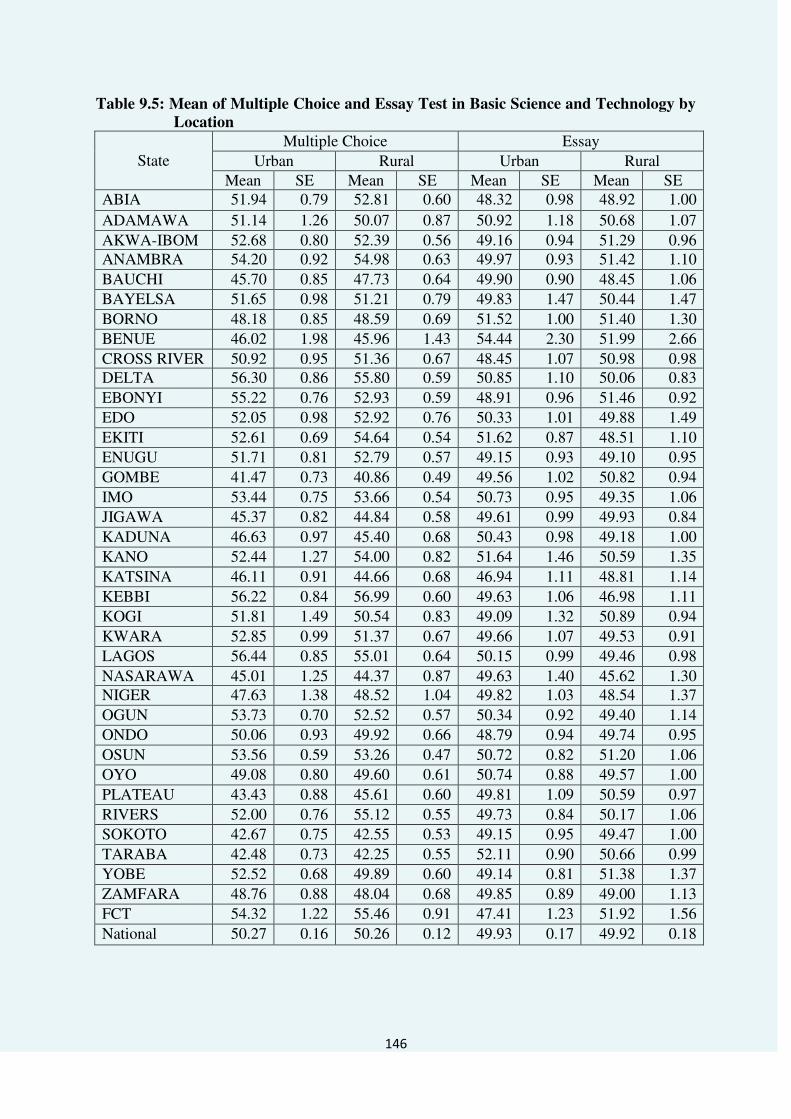
146
Table 9.5: Mean of Multiple Choice and Essay Test in Basic Science and Technology by
Location
State Multiple Choice Essay
Urban Rural Urban Rural Mean SE Mean SE Mean SE Mean SE
ABIA 51.94 0.79 52.81 0.60 48.32 0.98 48.92 1.00
ADAMAWA 51.14 1.26 50.07 0.87 50.92 1.18 50.68 1.07
AKWA-IBOM 52.68 0.80 52.39 0.56 49.16 0.94 51.29 0.96 ANAMBRA 54.20 0.92 54.98 0.63 49.97 0.93 51.42 1.10
BAUCHI 45.70 0.85 47.73 0.64 49.90 0.90 48.45 1.06 BAYELSA 51.65 0.98 51.21 0.79 49.83 1.47 50.44 1.47
BORNO 48.18 0.85 48.59 0.69 51.52 1.00 51.40 1.30 BENUE 46.02 1.98 45.96 1.43 54.44 2.30 51.99 2.66
CROSS RIVER 50.92 0.95 51.36 0.67 48.45 1.07 50.98 0.98 DELTA 56.30 0.86 55.80 0.59 50.85 1.10 50.06 0.83
EBONYI 55.22 0.76 52.93 0.59 48.91 0.96 51.46 0.92 EDO 52.05 0.98 52.92 0.76 50.33 1.01 49.88 1.49
EKITI 52.61 0.69 54.64 0.54 51.62 0.87 48.51 1.10 ENUGU 51.71 0.81 52.79 0.57 49.15 0.93 49.10 0.95
GOMBE 41.47 0.73 40.86 0.49 49.56 1.02 50.82 0.94
IMO 53.44 0.75 53.66 0.54 50.73 0.95 49.35 1.06 JIGAWA 45.37 0.82 44.84 0.58 49.61 0.99 49.93 0.84
KADUNA 46.63 0.97 45.40 0.68 50.43 0.98 49.18 1.00 KANO 52.44 1.27 54.00 0.82 51.64 1.46 50.59 1.35
KATSINA 46.11 0.91 44.66 0.68 46.94 1.11 48.81 1.14
KEBBI 56.22 0.84 56.99 0.60 49.63 1.06 46.98 1.11 KOGI 51.81 1.49 50.54 0.83 49.09 1.32 50.89 0.94
KWARA 52.85 0.99 51.37 0.67 49.66 1.07 49.53 0.91 LAGOS 56.44 0.85 55.01 0.64 50.15 0.99 49.46 0.98
NASARAWA 45.01 1.25 44.37 0.87 49.63 1.40 45.62 1.30 NIGER 47.63 1.38 48.52 1.04 49.82 1.03 48.54 1.37
OGUN 53.73 0.70 52.52 0.57 50.34 0.92 49.40 1.14 ONDO 50.06 0.93 49.92 0.66 48.79 0.94 49.74 0.95
OSUN 53.56 0.59 53.26 0.47 50.72 0.82 51.20 1.06 OYO 49.08 0.80 49.60 0.61 50.74 0.88 49.57 1.00
PLATEAU 43.43 0.88 45.61 0.60 49.81 1.09 50.59 0.97
RIVERS 52.00 0.76 55.12 0.55 49.73 0.84 50.17 1.06 SOKOTO 42.67 0.75 42.55 0.53 49.15 0.95 49.47 1.00
TARABA 42.48 0.73 42.25 0.55 52.11 0.90 50.66 0.99 YOBE 52.52 0.68 49.89 0.60 49.14 0.81 51.38 1.37
ZAMFARA 48.76 0.88 48.04 0.68 49.85 0.89 49.00 1.13 FCT 54.32 1.22 55.46 0.91 47.41 1.23 51.92 1.56
National 50.27 0.16 50.26 0.12 49.93 0.17 49.92 0.18

147
Achievement in Content Domains (Themes)
Table 9.6 shows the National average scores on the four content domains: (i) You and
Environment 49.91; (ii) Living and Non-Living things 57.84; and (iii) You and technology
49.87 and You and Energy 55.32. The mean values suggest that the learners had difficulties
with test items on the Environment and Technology than Living and non-living things and
energy.
State analysis reveals a score range for: (i) You and Envornment 34.84 (Gombe) to 59.76
(Kebbi); (ii) Living and non-living things 40.41 (Gombe) to 70.38 (Kebbi); (iii) You and
technology 32.89 (Gombe) to 61.17 (Delta); and (iv) You and Energy 40.66 (Gombe) to
65.67 (Kebbi). There were higher variations in the mean scores on content domain 2 (living
and non-living things) than the three others (differences: 24.92, 29.97.24.28 and 25.4), an
indication that test items in living and non-living things were relatively easy while those on
You and Technology were somewhat difficult. However, learners in each 22 states scored
above the National average for the four content domains.
Gombe state had the least achievement score in the four themes while Kebbi state had the
highest on Themes 1, 2 and 4. Delta state had the highest mean on Theme 3, You and
Technology.
Table 9.7: Mean Scores by State on the Content across States
State You and
environment Living and non-
living things You and
technology You and Energy
Mean SE Mean SE Mean SE Mean SE ABIA 53.43 0.94 61.66 1.12 54.11 1.11 58.60 0.95 ADAMAWA 50.24 1.38 58.92 1.67 50.11 1.54 56.16 1.39 AKWA-IBOM 53.71 0.90 61.91 1.11 54.20 1.05 58.70 0.92 ANAMBRA 57.26 0.95 65.72 1.17 58.73 1.13 62.16 0.99 BAUCHI 42.93 1.01 52.17 1.32 41.58 1.08 49.82 1.04 BAYELSA 52.18 1.28 59.45 1.54 52.41 1.50 56.71 1.28 BORNO 46.08 1.14 52.97 1.34 44.99 1.23 51.23 1.11 BENUE 43.79 2.17 48.21 3.11 42.08 2.57 48.09 2.39 CROSS RIVER
51.52 1.08 59.10 1.30 51.62 1.23 56.35 1.09
DELTA 59.17 0.94 68.39 1.13 61.17 1.16 64.72 0.97 EBONYI 56.18 0.94 64.81 1.15 57.79 1.13 61.34 0.97 EDO 53.14 1.18 61.92 1.45 53.87 1.36 58.57 1.21 EKITI 54.08 0.90 64.43 1.02 55.14 1.04 60.30 0.87 ENUGU 53.27 0.92 61.16 1.10 53.88 1.07 58.13 0.93 GOMBE 34.84 0.78 40.41 0.94 32.89 0.79 40.66 0.77 IMO 55.45 0.86 64.15 1.04 55.93 1.01 60.58 0.86 JIGAWA 41.02 0.92 48.44 1.18 39.49 0.98 47.14 0.94 KADUNA 42.93 1.09 49.54 1.33 42.16 1.23 48.48 1.12 KANO 54.47 1.36 64.07 1.59 54.33 1.53 60.47 1.32
KATSINA 41.43 1.06 49.35 1.42 39.85 1.15 47.96 1.10
KEBBI 59.76 1.00 70.38 1.14 60.56 1.15 65.67 0.98
KOGI 51.21 1.33 58.53 1.64 51.50 1.55 56.29 1.37

148
KWARA 52.68 1.07 61.04 1.30 52.83 1.23 58.09 1.09
LAGOS 58.68 0.93 67.57 1.13 60.72 1.12 63.93 0.97
NASARAWA 40.79 1.35 47.47 1.64 39.68 1.47 46.47 1.33
NIGER 48.17 1.51 54.49 1.87 47.88 1.71 52.90 1.58
OGUN 54.85 0.93 63.07 1.10 55.46 1.10 59.81 0.92
ONDO 49.48 1.06 57.02 1.29 49.68 1.24 54.74 1.08
OSUN 55.01 0.77 64.02 0.90 55.36 0.89 60.23 0.76
OYO 48.61 0.99 55.51 1.19 47.72 1.09 53.40 0.99
PLATEAU 40.87 0.99 46.54 1.19 39.23 1.05 45.99 0.96
RIVERS 55.23 0.88 63.20 1.06 56.31 1.06 60.04 0.90
SOKOTO 37.23 0.86 44.35 1.11 35.86 0.94 43.67 0.90
TARABA 36.76 0.88 42.98 1.08 35.48 0.97 42.65 0.89
YOBE 52.08 1.00 61.15 1.19 51.09 1.07 57.58 0.98
ZAMFARA 47.53 1.09 53.78 1.40 45.42 1.16 52.29 1.12
FCT 57.08 1.47 66.51 1.74 58.73 1.73 62.63 1.48
NATIONAL 49.91 0.19 57.84 0.23 49.87 0.21 55.32 0.19
Achievement on Cognitive Domains
The achievements in the three objective levels are contained in Table 9.8. Kebbi state
consistently performed better than the other states. The achievement of learners in Gombe
state was the least among the states in the three objectives level.
As can be seen in Table 9.7, National average scores for the three domains were: (i)
Knowledge 57.8; (ii) comprehension 45.13; and (iii) higher order 45.13. Achievement at state
level shows a range of 41.77 (Gombe) to 68.16 (Kebbi) on Knowledge. 30.66 (Gombe) to
55.67 (Kebbi) on comprehension and higher order Gombe state had the lowest achievement
scores on the three cognitive domains and Kebbi state had the highest. While 22 states each
scored above the National averages for the three cognitive domains. The differences in the
range scores 26.39, 25.01 show little variations and indeed the observed scores on
comprehension and higher order is worrisome.

149
Table 9.8: Distribution of Mean Score by State on the Behavioural Objectives
State KNOWLEDEGE COMPREHENSION HIGHER order Mean SE Mean SE Mean SE
ABIA 61.77 0.98 48.04 0.96 48.04 0.96 ADAMAWA 57.93 1.47 46.33 1.38 46.33 1.38 AKWA-IBOM
61.93 0.96 48.36 0.91 48.36 0.91
ANAMBRA 65.37 1.03 52.09 0.96 52.09 0.96 BAUCHI 51.20 1.14 39.17 1.00 39.17 1.00 BAYELSA 60.47 1.35 46.07 1.30 46.07 1.30 BORNO 53.55 1.20 41.24 1.13 41.24 1.13 BENUE 50.03 2.64 38.82 2.07 38.82 2.07 CROSS RIVER
59.38 1.16 46.29 1.07 46.29 1.07
DELTA 67.34 0.99 54.59 0.97 54.59 0.97 EBONYI 64.62 1.01 50.84 0.95 50.84 0.95 EDO 61.65 1.26 47.92 1.20 47.92 1.20 EKITI 63.41 0.91 49.00 0.92 49.00 0.92 ENUGU 61.51 0.97 47.70 0.93 47.70 0.93 GOMBE 41.77 0.87 30.66 0.71 30.66 0.71 IMO 63.83 0.88 50.15 0.90 50.15 0.90 JIGAWA 48.61 1.04 36.89 0.87 36.89 0.87 KADUNA 50.13 1.20 38.61 1.06 38.61 1.06 KANO 62.57 1.38 50.40 1.38 50.40 1.38 KATSINA 49.17 1.23 37.52 1.01 37.52 1.01 KEBBI 68.16 1.00 55.67 1.04 55.67 1.04 KOGI 58.64 1.46 46.53 1.31 46.53 1.31 KWARA 60.42 1.15 48.24 1.07 48.24 1.07 LAGOS 66.86 0.99 53.79 0.96 53.79 0.96 NASARAWA 48.38 1.50 36.10 1.26 36.10 1.26 NIGER 54.62 1.68 44.16 1.47 44.16 1.47 OGUN 63.09 0.97 49.45 0.94 49.45 0.94 ONDO 57.54 1.15 44.23 1.06 44.23 1.06 OSUN 63.76 0.76 49.44 0.82 49.44 0.82 OYO 56.04 1.06 43.59 0.98 43.59 0.98 PLATEAU 47.89 1.09 36.11 0.90 36.11 0.90 RIVERS 63.52 0.92 49.58 0.91 49.58 0.91 SOKOTO 44.94 0.98 33.06 0.83 33.06 0.83 TARABA 44.05 1.01 32.46 0.80 32.46 0.80 YOBE 60.09 1.05 47.67 0.98 47.67 0.98 ZAMFARA 53.83 1.19 43.57 1.09 43.57 1.09 FCT 65.56 1.55 52.25 1.48 52.25 1.48 NATIONAL 57.80 0.20 45.13 0.19 45.13 0.19

150
9.4: Relational Analysis of Performance
In this section, relationship between some salient variables and achievement are explored. It
is realised that some variables could be manipulated or altered to enhance achievement of
learners. Some of these are home-related while others are learner-related. For example,
provision by parents, feeding, modes of transportation to school are some home-related
variables. Liking of school and teacher are learner-related. The central issue in this section is
how these variables affect achievement.
9.4.1: Assistance with Homework
Table 9.9 shows the variation in achievement with assistance on homework given to the
learners. Nationally, there was no significant difference in the achievement in relation to
assistance with homework within mean scores of 50.0, 50.1 and 50.1 for low, medium and
high levels of assistance respectively. When states were considered no consistency was
actually observed. In the case of Benue, Cross River, Jigawa, Katsina and Ogun states,
achievement increased with increase in level of assistance though not significantly different.
In Bauchi and Niger states, as assistance increased achievement decreased. The number of
states scoring above the national average were 17, 22 and 20 for low, moderate and high
levels of assistance respectively. Using number of states having mean score above the
national average, moderate level of assistance showed highest level of achievement. Thus, the
moderate level of assistance seems to have stronger relationship to achievement.
Table 9.9: Relationship between Achievement and Level of Assistance with Homework
in Basic Science and Technology
State Low Moderate High
Mean SE Mean SE Mean SE
ABIA 49.9 0.8 50.4 0.8 48.7 0.8
ADAMAWA 50.6 1 51.4 1 50.3 0.9
AKWA-IBOM 52.4 0.7 53 0.8 52.7 0.9
ANAMBRA 54 0.8 51.7 0.7 51.2 0.8
BAUCHI 52.4 1.1 52 0.6 51.3 1.1
BAYELSA 49.4 1 51.4 1 50.3 1.5
BENUE 50.9 1 51 0.7 52.2 1
BORNO 58.3 7 51.9 1.1 52.3 1.5
CROSS-RIVER 49.4 0.9 50.8 0.7 52.6 0.8
DELTA 49.5 0.7 49.2 0.7 50.4 1.2
EBONYI 47.9 1 47 0.7 47.9 1.1
EDO 52 1.1 50.5 0.7 47.6 1.3
EKITI 47.8 1.4 50.1 0.6 49.5 1
ENUGU 48.1 1 48.5 0.8 47.4 0.7
FCT-ABUJA 50.5 1.4 52 0.8 51.3 1.2
GOMBE 50.5 1.2 51.5 0.7 50.2 1.4
IMO 49.2 0.7 50.2 0.7 47.1 1.2
JIGAWA 48.9 1.5 50.1 0.5 50.9 1.2

151
KADUNA 51.9 1.1 50.4 0.7 51.8 0.7
KANO 51.3 1.2 51.2 0.9 51.5 1.2
KATSINA 49.8 1.3 50 0.7 51 1
KEBBI 53.1 0.9 52.2 0.7 54.4 1
KOGI 49.9 1.1 49.6 0.9 51.1 1.5
KWARA 48.5 1.2 50.4 0.7 49.4 0.9
LAGOS 52.2 0.8 51.1 0.7 51.6 1
NASSARAWA 48.5 1.5 50.5 1 48.9 1.1
NIGER 51.4 1.4 49.8 0.6 49.4 3.7
OGUN 51 0.9 51.6 0.8 52 0.9
ONDO 51 0.9 50.9 0.6 50.3 1.4
OSUN 48.8 0.9 48.6 0.6 49.1 0.9
OYO 49.1 0.8 48.8 0.5 45.8 2.7
PLATEAU 51.1 1.2 50.9 0.6 49.6 1.1
RIVERS 46.8 0.7 48.1 0.8 46.4 0.8
SOKOTO 47.2 0.8 47.1 0.7 48.8 0.8
TARABA 49 0.9 49 0.7 49.7 0.6
YOBE 49.9 1 49.4 0.7 49.3 1
ZAMFARA 48.7 1.3 49.9 0.6 49.9 0.9
National 50 0.2 50.1 0.1 50.1 0.2
Availability of Learning Materials
At the national level in Table 9.10, as level of availability of learning materials increased, achievement also increased in Basic Science and Technology. The same trend was observed for Bauchi, Bayelsa, Benue, Enugu and Gombe states among others. In Anambra, Kaduna, Kogi and Nasarawa states among others, as level of available facilities increased, achievement decreased. When achievement above the national averages were considered, there was 24, 20 and 18 states for low, moderate and high level of availability respectively. With this criterion, it seems that achievement is highest at low level of availability of learning facilities though the mean scores were not significantly different.

152
Table 9.10: Level of Availability of Learning Materials as Related to Achievement in
Basic Science and Technology
State Low Moderate High
Mean SE Mean SE Mean SE
ABIA 47.6 1.2 50.2 0.5 49.3 1.3
ADAMAWA 50.8 0.9 51.1 0.8 48.5 1.6
AKWA-IBOM 51.2 0.8 53.5 0.6 51.9 1.2
ANAMBRA 53.1 1.4 52.3 0.6 52.2 0.9
BAUCHI 51.3 0.7 52.5 0.8 53.1 1.4
BAYELSA 50.1 0.9 50.5 1 50.6 2.2
BENUE 50.5 1.1 51.4 0.6 54 3.1
BORNO 51.9 1.3 53.7 1.7 52 2.3
CROSS-RIVER 51.6 0.8 51.3 0.6 49.1 1.3
DELTA 48.2 1 50.3 0.5 46.7 1.5
EBONYI 47.7 1 47.2 0.7 47.9 1.3
EDO 51.7 1.4 49.8 0.7 50.7 1.4
EKITI 50.1 0.8 49.4 0.6 49.9 1.2
ENUGU 47.2 1.3 47.5 0.5 49.1 1.2
FCT-ABUJA 56.7 1.8 50.8 0.9 51.4 0.9
GOMBE 50.5 0.9 51.5 0.7 51.9 2.6
IMO 47.7 1.2 49.7 0.5 48.8 1.8
JIGAWA 50.1 0.7 49.9 0.6 51.3 1.6
KADUNA 51.3 0.7 51.2 0.6 50 1.6
KANO 51.9 0.9 50.2 1 53.5 1.4
KATSINA 51 0.9 49.7 0.7 49.9 2.1
KEBBI 53.3 0.9 52.8 0.7 52.9 1.3
KOGI 52.4 1.4 49.5 0.8 48.9 1.6
KWARA 50 1.1 49.6 0.6 50.2 1.4
LAGOS 51.6 1.4 51.3 0.6 52.2 0.9
NASSARAWA 50.3 1 48.9 1 47.7 1.8
NIGER 49.5 0.7 51.3 1 * *
OGUN 52.6 1.6 51.4 0.6 51.5 1.6
ONDO 50.1 0.8 51.5 0.6 49.9 1.5
OSUN 49.5 1.2 48.5 0.5 51.4 1.6
OYO 48.8 0.8 48.5 0.5 50.9 1.8
PLATEAU 50.5 0.7 51 0.6 50.3 2
RIVERS 46 1 47.2 0.5 46.7 1.2
SOKOTO 46.9 0.8 47.9 0.6 47.7 1
TARABA 49 0.7 49.7 0.5 47.7 2.2
YOBE 49.3 0.7 49.7 0.7 50.2 2.5
ZAMFARA 49.3 0.6 49.8 0.8 51.3 1.4
National 50 0.2 50.1 0.1 50.3 0.2 * Not Applicable

153
Out of School Non-Learning Engagement
At the national level, engagement in non-learning activities as in Table 9.11 showed that achievement increased slightly with increase in involvement in non-learning engagements. Although, the difference was not statistically significant. The number of states performing above the national average for each level of involvement showed that low, moderate and high levels had 20, 17 and 17 states respectively. As expected, low levels of engagement in non learning activities relates more to highest achievement in the states.
Table 9.11: Level Out of School Non Learning Engagement and Performance in Basic
Science and Technology
State Low Moderate High
Mean SE Mean SE Mean SE
ABIA 48.7 0.8 49.8 0.7 49.8 0.9
ADAMAWA 49.3 1.1 51.7 1 50.4 0.9
AKWA-IBOM 50.9 1.1 53.1 0.6 53 0.9
ANAMBRA 53.4 0.8 51.7 0.7 52.2 0.9
BAUCHI 52 0.8 52.1 0.8 51.6 1
BAYELSA 49.6 1.9 50 0.8 51.3 1.3
BENUE 48.8 1.8 51.5 0.6 51.4 1.3
BORNO 52.8 2.8 52.8 4.2 52.3 1
CROSS-RIVER 51 0.9 50.1 0.7 52.5 0.9
DELTA 49.8 0.9 49.4 0.6 49.6 1.3
EBONYI 47.5 1.1 46.9 0.6 48.8 1.1
EDO 51.4 1.5 50 0.7 50.2 1.2
EKITI 48.6 1.1 50.2 0.6 49.4 1.2
ENUGU 47.5 0.9 47.9 0.7 47.6 0.8
FCT-ABUJA 51.7 1 52.9 1.1 50.4 1.1
GOMBE 48.1 1.9 51.5 0.7 52 1
IMO 49.8 1.5 49.4 0.6 48.9 1.1
JIGAWA 50.3 1 50 0.6 49.7 1
KADUNA 50.9 0.9 51.3 0.8 50.9 0.7
KANO 50.6 1.2 52.2 1.1 51.1 1
KATSINA 49.8 0.9 50.8 0.8 49.7 1.2
KEBBI 53.1 0.9 52.7 0.7 53 1.1
KOGI 50.9 1.7 49.3 0.8 51.4 1.2
KWARA 50.5 1 49.5 0.7 49.4 1.1
LAGOS 51.3 0.7 52.2 0.8 50.6 1.1
NASSARAWA 50.5 1.9 48.7 0.9 50 1.2
NIGER 51.7 1.9 50 0.6 49.3 2.5
OGUN 51.5 0.9 52.5 0.7 49.3 1.1
ONDO 51.9 1 50.6 0.7 50.3 0.9
OSUN 48 0.8 48.8 0.6 49.7 0.8
OYO 50.4 0.8 48.4 0.6 47.9 1.1
PLATEAU 51.9 0.9 50.9 0.6 49.4 0.9

154
RIVERS 45.4 0.7 47.7 0.7 47.8 0.9
SOKOTO 48.1 0.8 47.9 0.7 47.8 0.9
TARABA 49.8 0.9 49.4 0.6 48.9 0.8
YOBE 49.1 0.8 50.1 0.9 48.6 0.9
ZAMFARA 49.9 0.8 49.3 0.8 49.2 1
National 50 0.2 50.1 0.1 50.1 0.2
Occupation of Fathers
As can be seen in Table 9.12, nationally the achievement of learners whose fathers are into Farming (50.4) was the best, next were learners whose fathers‟ occupation is Business (50.3), the learners whose fathers are into „Other‟ occupations had the lowest achievement. The use of the criterion of mean greater than national average gives 20 for farming/fishing, and 18 for business/trading. Although, learners whose parents are workers had a national average of 49.9, 19 states had mean score above the National average. It seems none of the occupations had a stronger relationship with achievement. Table 9.12: Occupation of Father as Related to Achievement in Basic Science and
Technology
State Farming/fishing Business/trading
Worker(Public/ private)
Others
Mean SE Mean SE Mean SE Mean SE
ABIA 48.3 1 50.1 1 51.2 1.2 48.7 0.9
ADAMAWA 51.4 1.1 49.9 1.3 49.1 1 52 2.6
AKWA-IBOM 53.5 1.2 52.7 0.9 53.3 0.9 52.8 1.1
ANAMBRA 53 1.4 53.9 0.7 49.1 1.2 50.6 1.2
BAUCHI 51.9 0.9 52.6 1.1 51.2 0.8 50.8 2.4
BAYELSA 49.1 1.5 52.6 2.1 49.5 1.2 49.1 2.1
BENUE 51.8 0.7 52 1.6 50.1 1 48.6 2.2
BORNO 52.8 . * 53.2 1.1 50.2 2.4 * *
CROSS-
RIVER
50.6 1 51.3 1.1 50.7 1.1 50.1 0.9
DELTA 49.6 0.9 47.4 1.1 50.6 0.7 46.3 0.7
EBONYI 49.7 1 46.9 1.2 46.7 0.9 46.8 1.2
EDO 51 0.9 48.8 1.5 50.2 1 50.5 2.4
EKITI 49.5 0.9 51.5 0.8 49.2 0.9 48.1 1.5
ENUGU 48.8 1 47.9 1.2 46.7 0.9 47.9 1.1
FCT-ABUJA 50.8 1.4 51.7 2 51.5 0.7 51.1 5.5
GOMBE 48.9 1.1 53.5 1.3 51.4 0.8 51.5 1.7
IMO 51.2 1.3 48.5 0.7 48.8 0.8 55.3 2.1
JIGAWA 51.5 0.8 50.3 0.9 49.7 0.8 48.7 1.3
KADUNA 52.1 0.7 50.6 1.2 50.8 0.9 52 2
KANO 52 1.1 49.7 1.2 50.9 1.2 55.2 1.4
KATSINA 51.3 1.5 50.5 0.9 49.8 1 47.1 2.1
KEBBI 52.2 1 52.3 1.1 52.7 0.9 55.7 1.4
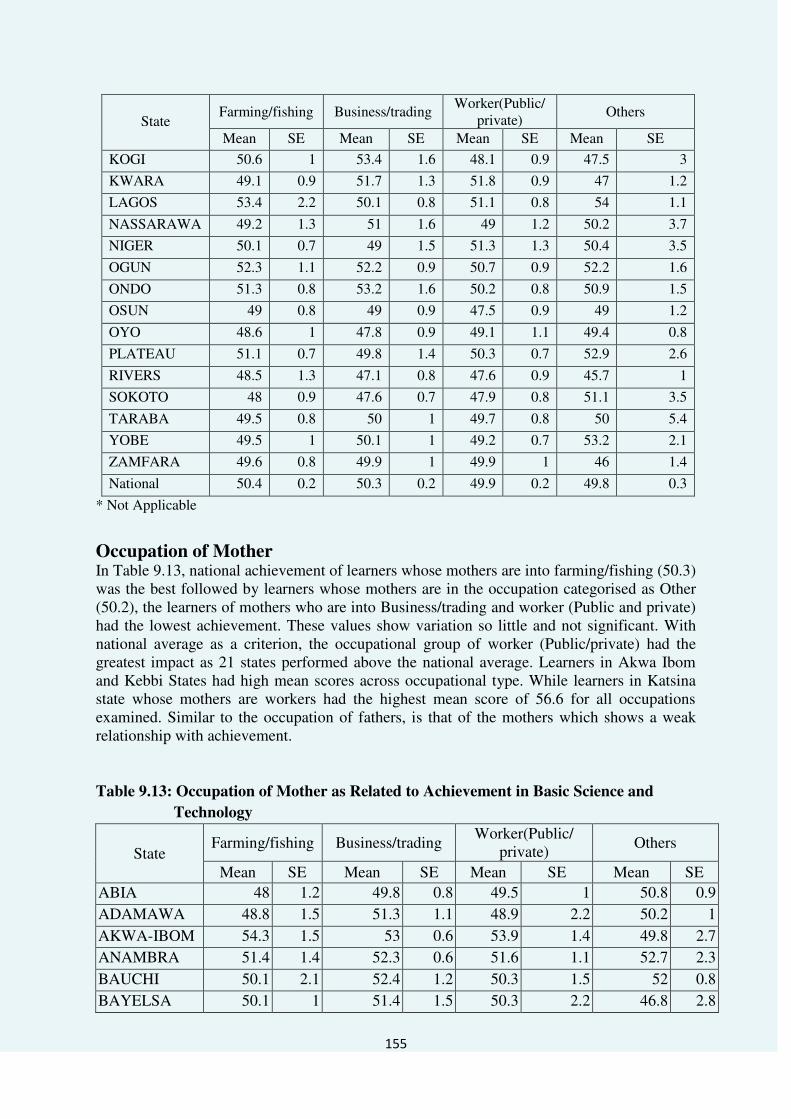
155
State Farming/fishing Business/trading
Worker(Public/ private)
Others
Mean SE Mean SE Mean SE Mean SE
KOGI 50.6 1 53.4 1.6 48.1 0.9 47.5 3
KWARA 49.1 0.9 51.7 1.3 51.8 0.9 47 1.2
LAGOS 53.4 2.2 50.1 0.8 51.1 0.8 54 1.1
NASSARAWA 49.2 1.3 51 1.6 49 1.2 50.2 3.7
NIGER 50.1 0.7 49 1.5 51.3 1.3 50.4 3.5
OGUN 52.3 1.1 52.2 0.9 50.7 0.9 52.2 1.6
ONDO 51.3 0.8 53.2 1.6 50.2 0.8 50.9 1.5
OSUN 49 0.8 49 0.9 47.5 0.9 49 1.2
OYO 48.6 1 47.8 0.9 49.1 1.1 49.4 0.8
PLATEAU 51.1 0.7 49.8 1.4 50.3 0.7 52.9 2.6
RIVERS 48.5 1.3 47.1 0.8 47.6 0.9 45.7 1
SOKOTO 48 0.9 47.6 0.7 47.9 0.8 51.1 3.5
TARABA 49.5 0.8 50 1 49.7 0.8 50 5.4
YOBE 49.5 1 50.1 1 49.2 0.7 53.2 2.1
ZAMFARA 49.6 0.8 49.9 1 49.9 1 46 1.4
National 50.4 0.2 50.3 0.2 49.9 0.2 49.8 0.3
* Not Applicable
Occupation of Mother In Table 9.13, national achievement of learners whose mothers are into farming/fishing (50.3) was the best followed by learners whose mothers are in the occupation categorised as Other (50.2), the learners of mothers who are into Business/trading and worker (Public and private) had the lowest achievement. These values show variation so little and not significant. With national average as a criterion, the occupational group of worker (Public/private) had the greatest impact as 21 states performed above the national average. Learners in Akwa Ibom and Kebbi States had high mean scores across occupational type. While learners in Katsina state whose mothers are workers had the highest mean score of 56.6 for all occupations examined. Similar to the occupation of fathers, is that of the mothers which shows a weak relationship with achievement. Table 9.13: Occupation of Mother as Related to Achievement in Basic Science and
Technology
State Farming/fishing Business/trading
Worker(Public/ private)
Others
Mean SE Mean SE Mean SE Mean SE
ABIA 48 1.2 49.8 0.8 49.5 1 50.8 0.9
ADAMAWA 48.8 1.5 51.3 1.1 48.9 2.2 50.2 1
AKWA-IBOM 54.3 1.5 53 0.6 53.9 1.4 49.8 2.7
ANAMBRA 51.4 1.4 52.3 0.6 51.6 1.1 52.7 2.3
BAUCHI 50.1 2.1 52.4 1.2 50.3 1.5 52 0.8
BAYELSA 50.1 1 51.4 1.5 50.3 2.2 46.8 2.8

156
BENUE 51.5 0.8 50.6 1 51.1 1.8 50.1 2
BORNO 52.6 1.8 50.4 1.9 54 2.4 55.8 *
CROSS-RIVER
50.8 1.1 49.8 0.8 49.7 1.3 52 1.4
DELTA 50.1 1 49.5 0.7 49.2 1 46.5 0.6
EBONYI 49.5 1.8 47.9 0.8 46.9 1 45.5 1.3
EDO 53.3 1.3 49.2 0.8 51 1.6 50 3.2
EKITI 49.1 1.3 49.3 0.6 50.8 0.8 50.8 3.2
ENUGU 48.9 1.2 47.5 0.7 46.8 1.5 49 1.4
FCT-ABUJA 52.7 1.8 51.8 0.8 50.8 1.2 42.2 6.6
GOMBE 51.7 1.3 49.7 1.2 52.1 1 51.1 1.3
IMO 47.5 1.2 49.6 0.7 48.6 1.1 53.5 1.7
JIGAWA 52.1 1.1 50.4 0.8 51.1 1.6 50 0.8
KADUNA 51.3 1.2 51 0.9 50.9 1.3 52.2 1.3
KANO 54.4 5.5 50.1 1.5 46 2.6 51.5 0.8
KATSINA * * 50.7 1.1 56.6 3.4 50.3 1.2
KEBBI 55.4 0.9 52.2 0.8 53.4 1.6 53.5 1
KOGI 48.6 1.4 49.8 0.9 52.2 2.9 47.1 1.7
KWARA 49.3 1.3 49.6 0.7 53.3 1.5 49.6 1.9
LAGOS 52.6 2.6 51.5 0.6 50.8 1.3 53.1 1.6
NASSARAWA 46.9 1.2 50.2 1.3 50.1 1.4 50 2.8
NIGER 49.1 1.8 50.6 0.8 49.8 1.5 49.7 2
OGUN 50.6 2.3 52 0.6 51.9 1.3 48.4 3
ONDO 51.4 1 50.2 0.8 50.5 0.9 52.7 2.1
OSUN 49.3 2.6 49.1 0.5 45.4 1.4 46.8 1.4
OYO 48 1.2 49.1 0.7 48.7 1.3 48.8 0.8
PLATEAU 50.9 0.8 50.3 0.9 51.5 1.2 52 1.7
RIVERS 52.1 2.3 47.2 0.6 46.3 1 43.8 2.2
SOKOTO 49.2 2.4 48 0.9 47.1 1.2 47.7 0.8
TARABA 49.2 0.9 49.7 0.8 48.7 1.2 48.7 1.9
YOBE 48.7 2.6 49.8 0.9 50.1 1.7 49.5 1
ZAMFARA 52.5 2.2 49.2 1.2 50.8 3 49.9 0.7
National 50.3 0.2 50.1 0.1 50.1 0.2 50.2 0.2
*Not applicable
Means of Going to School
In Table 9.14, the number of learners who go to school by donkey and canoe was quite small
and was therefore set aside in this presentation. From the results, the best achievement at the
National level was exhibited by learners who go to school with taxi/bus (50.2) and
Okada/Bicycle/tricycle (50.2) and by those who walk (50.1) while those who go to school
with family car trailed behind. There was strictly no significant difference in achievement at
the National level. At state level, learners in 20 states who walked to school and those in
family cars had mean scores higher than the national average. While those who used
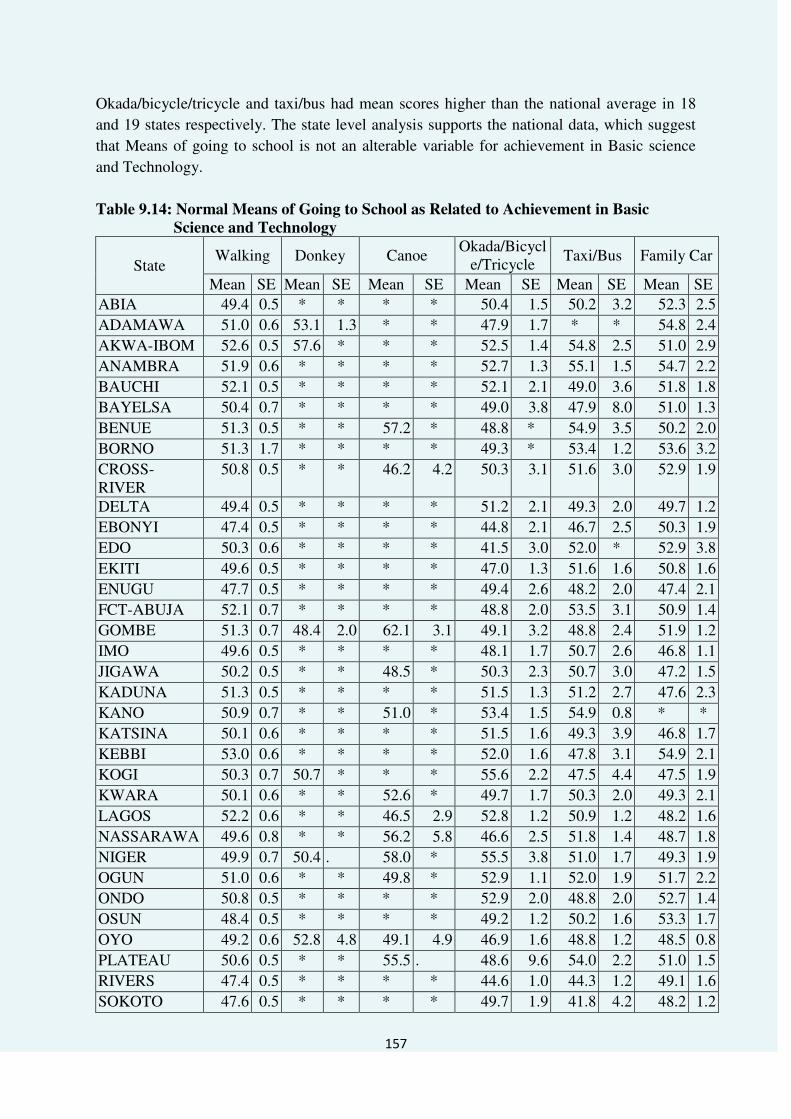
157
Okada/bicycle/tricycle and taxi/bus had mean scores higher than the national average in 18
and 19 states respectively. The state level analysis supports the national data, which suggest
that Means of going to school is not an alterable variable for achievement in Basic science
and Technology.
Table 9.14: Normal Means of Going to School as Related to Achievement in Basic
Science and Technology
State Walking Donkey Canoe
Okada/Bicycle/Tricycle
Taxi/Bus Family Car
Mean SE Mean SE Mean SE Mean SE Mean SE Mean SE
ABIA 49.4 0.5 * * * * 50.4 1.5 50.2 3.2 52.3 2.5
ADAMAWA 51.0 0.6 53.1 1.3 * * 47.9 1.7 * * 54.8 2.4
AKWA-IBOM 52.6 0.5 57.6 * * * 52.5 1.4 54.8 2.5 51.0 2.9
ANAMBRA 51.9 0.6 * * * * 52.7 1.3 55.1 1.5 54.7 2.2
BAUCHI 52.1 0.5 * * * * 52.1 2.1 49.0 3.6 51.8 1.8
BAYELSA 50.4 0.7 * * * * 49.0 3.8 47.9 8.0 51.0 1.3
BENUE 51.3 0.5 * * 57.2 * 48.8 * 54.9 3.5 50.2 2.0
BORNO 51.3 1.7 * * * * 49.3 * 53.4 1.2 53.6 3.2
CROSS-RIVER
50.8 0.5 * * 46.2 4.2 50.3 3.1 51.6 3.0 52.9 1.9
DELTA 49.4 0.5 * * * * 51.2 2.1 49.3 2.0 49.7 1.2
EBONYI 47.4 0.5 * * * * 44.8 2.1 46.7 2.5 50.3 1.9
EDO 50.3 0.6 * * * * 41.5 3.0 52.0 * 52.9 3.8
EKITI 49.6 0.5 * * * * 47.0 1.3 51.6 1.6 50.8 1.6
ENUGU 47.7 0.5 * * * * 49.4 2.6 48.2 2.0 47.4 2.1
FCT-ABUJA 52.1 0.7 * * * * 48.8 2.0 53.5 3.1 50.9 1.4
GOMBE 51.3 0.7 48.4 2.0 62.1 3.1 49.1 3.2 48.8 2.4 51.9 1.2
IMO 49.6 0.5 * * * * 48.1 1.7 50.7 2.6 46.8 1.1
JIGAWA 50.2 0.5 * * 48.5 * 50.3 2.3 50.7 3.0 47.2 1.5
KADUNA 51.3 0.5 * * * * 51.5 1.3 51.2 2.7 47.6 2.3
KANO 50.9 0.7 * * 51.0 * 53.4 1.5 54.9 0.8 * *
KATSINA 50.1 0.6 * * * * 51.5 1.6 49.3 3.9 46.8 1.7
KEBBI 53.0 0.6 * * * * 52.0 1.6 47.8 3.1 54.9 2.1
KOGI 50.3 0.7 50.7 * * * 55.6 2.2 47.5 4.4 47.5 1.9
KWARA 50.1 0.6 * * 52.6 * 49.7 1.7 50.3 2.0 49.3 2.1
LAGOS 52.2 0.6 * * 46.5 2.9 52.8 1.2 50.9 1.2 48.2 1.6
NASSARAWA 49.6 0.8 * * 56.2 5.8 46.6 2.5 51.8 1.4 48.7 1.8
NIGER 49.9 0.7 50.4 . 58.0 * 55.5 3.8 51.0 1.7 49.3 1.9
OGUN 51.0 0.6 * * 49.8 * 52.9 1.1 52.0 1.9 51.7 2.2
ONDO 50.8 0.5 * * * * 52.9 2.0 48.8 2.0 52.7 1.4
OSUN 48.4 0.5 * * * * 49.2 1.2 50.2 1.6 53.3 1.7
OYO 49.2 0.6 52.8 4.8 49.1 4.9 46.9 1.6 48.8 1.2 48.5 0.8
PLATEAU 50.6 0.5 * * 55.5 . 48.6 9.6 54.0 2.2 51.0 1.5
RIVERS 47.4 0.5 * * * * 44.6 1.0 44.3 1.2 49.1 1.6
SOKOTO 47.6 0.5 * * * * 49.7 1.9 41.8 4.2 48.2 1.2
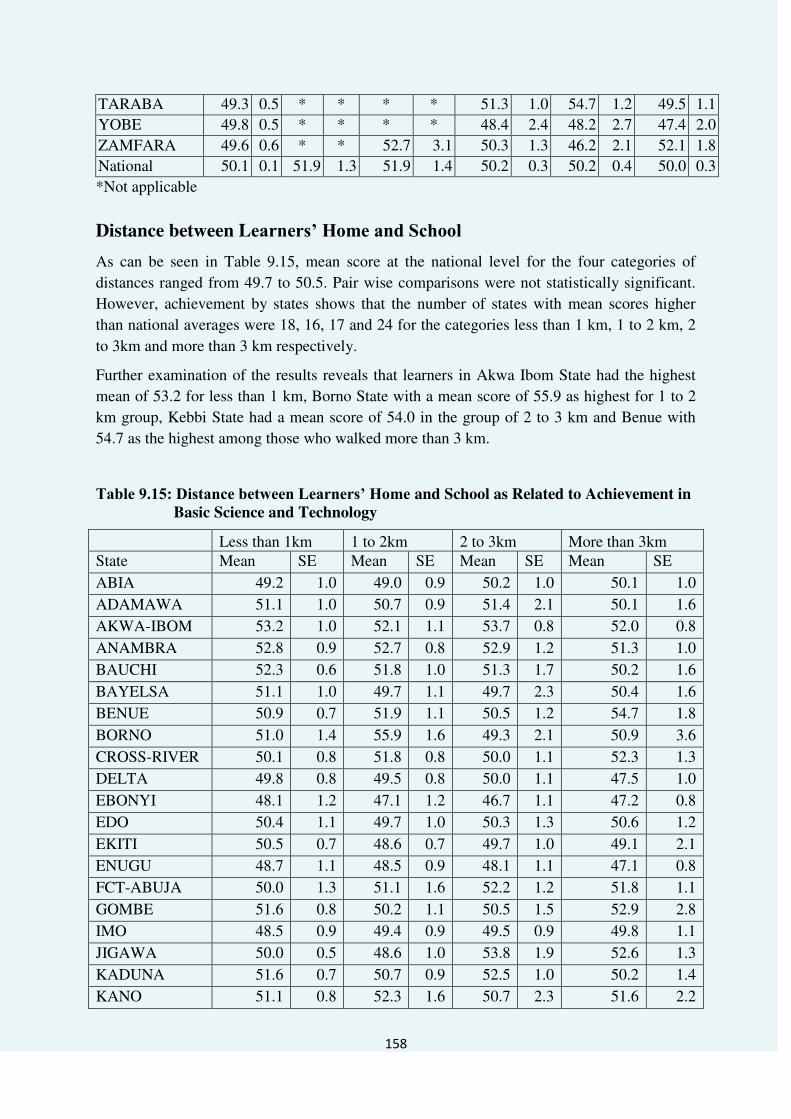
158
TARABA 49.3 0.5 * * * * 51.3 1.0 54.7 1.2 49.5 1.1
YOBE 49.8 0.5 * * * * 48.4 2.4 48.2 2.7 47.4 2.0
ZAMFARA 49.6 0.6 * * 52.7 3.1 50.3 1.3 46.2 2.1 52.1 1.8
National 50.1 0.1 51.9 1.3 51.9 1.4 50.2 0.3 50.2 0.4 50.0 0.3
*Not applicable
Distance between Learners’ Home and School As can be seen in Table 9.15, mean score at the national level for the four categories of
distances ranged from 49.7 to 50.5. Pair wise comparisons were not statistically significant.
However, achievement by states shows that the number of states with mean scores higher
than national averages were 18, 16, 17 and 24 for the categories less than 1 km, 1 to 2 km, 2
to 3km and more than 3 km respectively.
Further examination of the results reveals that learners in Akwa Ibom State had the highest
mean of 53.2 for less than 1 km, Borno State with a mean score of 55.9 as highest for 1 to 2
km group, Kebbi State had a mean score of 54.0 in the group of 2 to 3 km and Benue with
54.7 as the highest among those who walked more than 3 km.
Table 9.15: Distance between Learners’ Home and School as Related to Achievement in
Basic Science and Technology
Less than 1km 1 to 2km 2 to 3km More than 3km State Mean SE Mean SE Mean SE Mean SE
ABIA 49.2 1.0 49.0 0.9 50.2 1.0 50.1 1.0
ADAMAWA 51.1 1.0 50.7 0.9 51.4 2.1 50.1 1.6
AKWA-IBOM 53.2 1.0 52.1 1.1 53.7 0.8 52.0 0.8
ANAMBRA 52.8 0.9 52.7 0.8 52.9 1.2 51.3 1.0
BAUCHI 52.3 0.6 51.8 1.0 51.3 1.7 50.2 1.6
BAYELSA 51.1 1.0 49.7 1.1 49.7 2.3 50.4 1.6
BENUE 50.9 0.7 51.9 1.1 50.5 1.2 54.7 1.8
BORNO 51.0 1.4 55.9 1.6 49.3 2.1 50.9 3.6
CROSS-RIVER 50.1 0.8 51.8 0.8 50.0 1.1 52.3 1.3
DELTA 49.8 0.8 49.5 0.8 50.0 1.1 47.5 1.0
EBONYI 48.1 1.2 47.1 1.2 46.7 1.1 47.2 0.8
EDO 50.4 1.1 49.7 1.0 50.3 1.3 50.6 1.2
EKITI 50.5 0.7 48.6 0.7 49.7 1.0 49.1 2.1
ENUGU 48.7 1.1 48.5 0.9 48.1 1.1 47.1 0.8
FCT-ABUJA 50.0 1.3 51.1 1.6 52.2 1.2 51.8 1.1
GOMBE 51.6 0.8 50.2 1.1 50.5 1.5 52.9 2.8
IMO 48.5 0.9 49.4 0.9 49.5 0.9 49.8 1.1
JIGAWA 50.0 0.5 48.6 1.0 53.8 1.9 52.6 1.3
KADUNA 51.6 0.7 50.7 0.9 52.5 1.0 50.2 1.4
KANO 51.1 0.8 52.3 1.6 50.7 2.3 51.6 2.2

159
KATSINA 50.2 0.7 49.0 1.1 50.8 1.4 51.3 2.2
KEBBI 52.0 0.7 53.5 1.0 54.0 1.4 53.6 1.3
KOGI 50.7 1.1 49.1 1.0 53.3 1.5 48.2 1.7
KWARA 49.0 0.8 50.1 0.9 51.2 1.3 49.9 1.2
LAGOS 51.2 1.1 52.5 0.8 51.4 1.0 50.5 0.9
NASSARAWA 49.0 1.2 49.7 0.9 48.1 2.1 50.2 2.0
NIGER 49.9 0.7 49.4 1.3 52.1 2.5 51.2 2.1
OGUN 51.4 0.9 51.5 1.0 52.3 0.9 50.5 1.4
ONDO 50.4 0.8 51.3 0.9 51.5 1.0 50.5 1.2
OSUN 47.4 1.0 49.7 0.8 48.5 0.8 49.4 0.9
OYO 48.4 0.9 48.8 0.7 49.3 1.0 48.6 1.2
PLATEAU 51.4 0.7 49.7 0.8 52.7 1.3 49.7 1.4
RIVERS 46.8 0.8 46.6 1.0 48.1 1.0 46.9 0.8
SOKOTO 47.7 0.6 47.6 1.1 47.7 1.4 46.4 2.5
TARABA 49.9 0.6 48.1 0.8 49.6 1.4 49.3 0.9
YOBE 49.8 0.6 48.4 1.2 49.9 1.7 49.4 3.5
ZAMFARA 49.8 0.7 49.1 1.0 50.2 1.3 50.0 1.4
National 50.3 0.1 50.0 0.2 50.5 0.2 49.7 0.2
Number of Meals Per Day
At the national level in Table 9.16, it was observed that the trend in achievement with
variation in number of meals eaten in a day is not predictable. With respect to achievement
above the national average, Table 9.16 shows that 22, 22, 18 and 17 states were for one, two,
three and four meals respectively. Top performing states for each meal plan were FCT (63.9)
one meal plan, Kebbi (55.1) Two meals plan, Borno (53.2) three meals plan and Kaduna
(55.8) four meals plan. Although, the Meal plan had more states above the national average,
the school feeding policy supports a minimum of two meals a day.
Table 9.16: Number of Meals Per Day as Related to Achievement in Basic Science and
Technology
State Once Twice Three times Four times
Mean SE Mean SE Mean SE Mean SE
ABIA 51.1 3.9 49.4 1.0 49.7 0.5 49.6 1.3
ADAMAWA 56.9 1.6 51.0 1.4 50.1 0.7 54.5 2.4
AKWA-IBOM 51.1 2.7 52.0 1.1 53.1 0.5 50.4 1.6
ANAMBRA 56.4 7.6 52.0 1.8 52.4 0.5 51.3 2.4
BAUCHI * * 53.9 1.8 51.8 0.5 52.0 2.0
BAYELSA 53.6 2.3 52.2 2.0 49.5 0.7 49.3 2.2
BENUE 54.7 3.0 50.3 1.5 51.4 0.6 51.4 1.6
BORNO 45.5 3.0 51.5 1.1 53.2 1.1 * *
CROSS-RIVER 49.9 1.9 52.3 1.3 50.6 0.5 54.6 2.4
DELTA 48.7 2.3 48.4 0.8 49.9 0.6 50.0 2.0

160
EBONYI 49.2 3.0 48.0 1.3 47.5 0.6 45.4 2.6
EDO 50.8 2.3 46.7 1.7 51.1 0.6 48.6 1.7
EKITI 52.0 1.0 48.3 1.1 49.5 0.6 49.6 1.4
ENUGU 49.6 3.7 46.3 1.2 48.1 0.5 48.1 2.6
FCT-ABUJA 63.9 * 52.3 1.9 51.5 0.7 49.5 1.5
GOMBE 51.7 1.0 51.9 1.1 50.0 0.9 53.0 2.9
IMO 51.4 2.6 48.8 1.3 49.4 0.5 46.0 *
JIGAWA 51.7 2.0 50.8 1.1 49.7 0.5 51.9 2.0
KADUNA 53.2 2.2 48.7 0.9 51.1 0.5 55.8 1.6
KANO 55.2 2.4 51.9 2.2 50.6 0.7 54.0 6.8
KATSINA 53.4 2.7 52.6 2.8 50.2 0.6 48.9 1.5
KEBBI 53.2 1.7 55.1 3.2 53.1 0.5 51.2 1.7
KOGI 54.0 3.3 49.1 1.3 50.1 0.7 44.6 *
KWARA 47.5 3.7 50.7 2.2 49.8 0.5 48.0 2.3
LAGOS 52.8 4.9 52.4 1.3 51.1 0.6 52.1 1.4
NASSARAWA 43.7 4.6 50.5 1.5 49.3 0.8 51.4 2.8
NIGER 49.4 0.8 51.4 1.7 50.8 1.0 45.7 3.5
OGUN 53.8 6.8 49.8 1.6 51.6 0.6 52.2 1.2
ONDO 50.8 1.1 51.0 1.9 50.6 0.6 53.2 1.8
OSUN 41.4 1.6 47.5 1.4 49.1 0.5 48.4 1.6
OYO 48.9 0.9 48.0 0.9 49.3 0.7 45.6 1.4
PLATEAU 51.0 1.8 50.6 0.8 50.5 0.6 55.2 1.9
RIVERS 44.5 1.4 46.2 1.2 47.4 0.5 46.5 1.3
SOKOTO 47.6 2.7 46.0 0.8 47.7 0.5 49.8 1.8
TARABA 48.1 1.5 50.1 0.7 49.2 0.6 48.6 2.5
YOBE 51.8 3.0 49.3 1.0 49.2 0.6 53.6 1.6
ZAMFARA 49.4 1.5 49.3 1.7 49.7 0.6 51.6 1.9
National 50.4 0.3 49.8 0.2 50.1 0.1 50.5 0.3
*Not applicable
Possession of Textbook
As can be seen in Table 9.17, National average for learners without textbooks was 50.0 and for learners with textbooks 50.2. Among the states, 17 had mean scores greater than the national average for learners without textbooks and 20 states for those with textbooks. Borno (53.2) and Kebbi (53.3) States had the highest mean score for learners without textbooks, whereas learners in Akwa Ibom had the highest mean score for possession of textbooks (53.0).

161
Table 9.17: Learners’ Possession of Textbook on Basic Science and Technology as
Related to Achievement
State No Yes
Mean SE Mean SE ABIA 49.3 0.6 51.1 0.9
ADAMAWA 50.0 0.7 50.7 1.2
AKWA-IBOM 52.2 0.6 53.0 0.8
ANAMBRA 52.3 0.7 52.5 0.8
BAUCHI 51.7 0.6 51.8 0.9
BAYELSA 51.9 1.0 49.4 0.9
BENUE 51.0 0.6 51.3 1.1
BORNO 53.2 2.0 52.5 1.2
CROSS-RIVER 50.2 0.6 51.3 0.9
DELTA 49.6 0.5 49.2 1.0
EBONYI 47.8 0.7 46.9 0.7
EDO 49.9 0.7 52.3 1.1
EKITI 49.6 0.6 50.0 0.9
ENUGU 48.1 0.6 47.2 0.8
FCT-ABUJA 51.9 0.7 50.2 1.5
GOMBE 50.0 0.7 52.7 1.1
IMO 49.7 0.7 49.5 0.7
JIGAWA 50.4 0.5 49.1 0.8
KADUNA 51.1 0.6 50.5 1.0
KANO 51.2 0.8 50.6 1.1
KATSINA 50.0 0.7 51.5 1.2
KEBBI 53.3 0.8 52.8 0.8
KOGI 49.2 0.9 50.3 1.0
KWARA 49.7 0.6 49.4 0.9
LAGOS 51.5 0.7 51.5 0.8
NASSARAWA 50.2 0.8 48.7 1.5
NIGER 50.0 0.7 50.3 1.3
OGUN 51.9 0.6 51.2 1.0
ONDO 50.7 0.7 50.6 0.7
OSUN 48.7 0.5 50.0 1.1
OYO 48.9 0.5 48.5 1.1
PLATEAU 50.2 0.6 51.9 0.8
RIVERS 46.5 0.6 46.9 0.7
SOKOTO 46.8 0.5 48.0 0.9
TARABA 48.8 0.5 50.2 0.9
YOBE 49.1 0.6 50.2 0.8
ZAMFARA 49.9 0.7 49.3 0.9
National 50.0 0.1 50.2 0.2
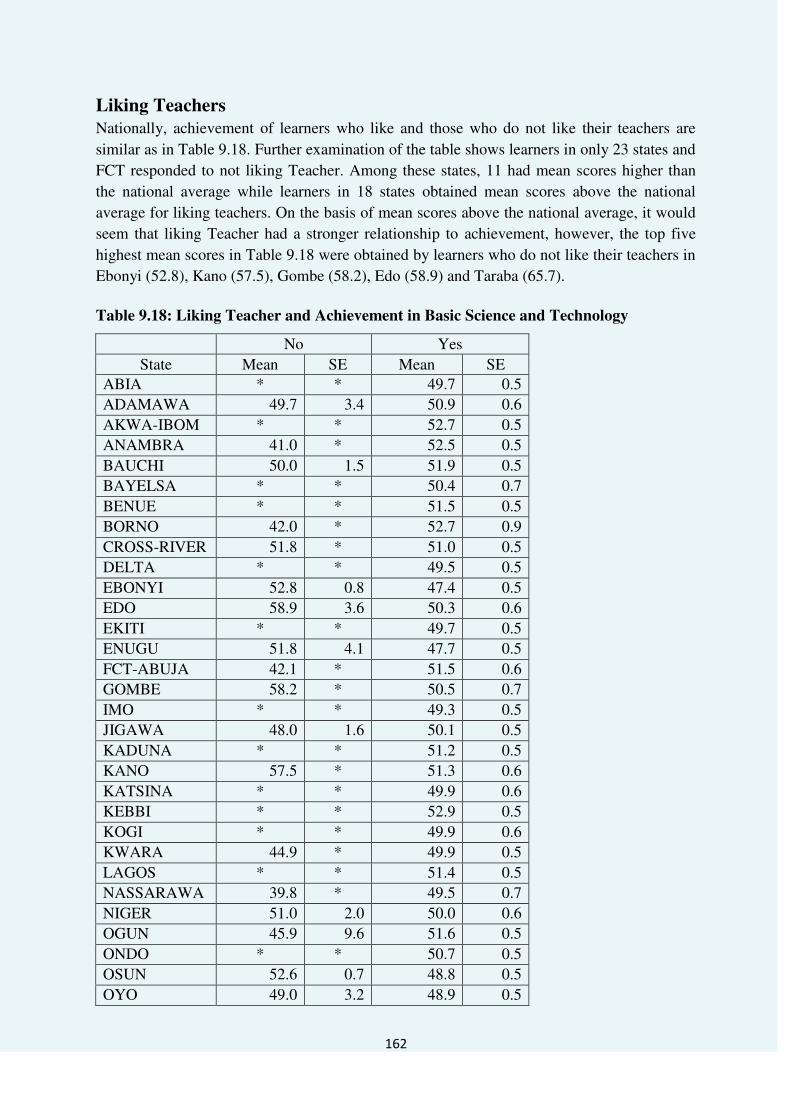
162
Liking Teachers
Nationally, achievement of learners who like and those who do not like their teachers are
similar as in Table 9.18. Further examination of the table shows learners in only 23 states and
FCT responded to not liking Teacher. Among these states, 11 had mean scores higher than
the national average while learners in 18 states obtained mean scores above the national
average for liking teachers. On the basis of mean scores above the national average, it would
seem that liking Teacher had a stronger relationship to achievement, however, the top five
highest mean scores in Table 9.18 were obtained by learners who do not like their teachers in
Ebonyi (52.8), Kano (57.5), Gombe (58.2), Edo (58.9) and Taraba (65.7).
Table 9.18: Liking Teacher and Achievement in Basic Science and Technology
No Yes
State Mean SE Mean SE ABIA * * 49.7 0.5
ADAMAWA 49.7 3.4 50.9 0.6
AKWA-IBOM * * 52.7 0.5
ANAMBRA 41.0 * 52.5 0.5
BAUCHI 50.0 1.5 51.9 0.5
BAYELSA * * 50.4 0.7
BENUE * * 51.5 0.5
BORNO 42.0 * 52.7 0.9
CROSS-RIVER 51.8 * 51.0 0.5
DELTA * * 49.5 0.5
EBONYI 52.8 0.8 47.4 0.5
EDO 58.9 3.6 50.3 0.6
EKITI * * 49.7 0.5
ENUGU 51.8 4.1 47.7 0.5
FCT-ABUJA 42.1 * 51.5 0.6
GOMBE 58.2 * 50.5 0.7
IMO * * 49.3 0.5
JIGAWA 48.0 1.6 50.1 0.5
KADUNA * * 51.2 0.5
KANO 57.5 * 51.3 0.6
KATSINA * * 49.9 0.6
KEBBI * * 52.9 0.5
KOGI * * 49.9 0.6
KWARA 44.9 * 49.9 0.5
LAGOS * * 51.4 0.5
NASSARAWA 39.8 * 49.5 0.7
NIGER 51.0 2.0 50.0 0.6
OGUN 45.9 9.6 51.6 0.5
ONDO * * 50.7 0.5
OSUN 52.6 0.7 48.8 0.5
OYO 49.0 3.2 48.9 0.5

163
PLATEAU 50.0 2.0 50.7 0.5
RIVERS 47.7 1.4 46.9 0.5
SOKOTO 51.0 3.0 48.1 0.5
TARABA 65.7 * 49.2 0.4
YOBE 51.6 * 49.5 0.5
ZAMFARA 49.5 4.8 49.8 0.5
National 50.1 0.8 50.1 0.1
*Not applicable
Liking Schooling
As can be seen in Table 9.19, the national picture is such that learners who like schooling had
a mean score of 50.1 and those who did not obtained a mean score of 49.2. State analysis
shows that learners in only 21 states indicated they do not like Schooling. Among those
states, nine had mean scores higher than the national average while learners in 20 states had
mean score higher than the national average for liking schooling. Similar to the observation
in the last section, the top five mean scores in Table 9.19 were for not liking Schooling for
learners in Zamfara (54.1), Ogun (55.5), Niger (56.7) Anambra (60.4) and Kebbi (61.2). The
lowest mean scores can also be gleaned from the results of learners not liking Schooling.
Table 9.19: Liking Schooling and Achievement in Basic Science and Technology
State No Yes
Mean SE Mean SE ABIA 46.8 0.9 49.7 0.5 ADAMAWA * * 50.5 0.6 AKWA-IBOM * * 52.7 0.5 ANAMBRA 60.4 * 52.3 0.5 BAUCHI 44.2 3.0 52.1 0.5 BAYELSA 40.7 * 50.4 0.7 BENUE * * 51.4 0.6 BORNO 51.8 6.6 52.4 0.9 CROSS-RIVER 52.2 4.1 51.0 0.5 DELTA 46.8 1.3 49.5 0.5 EBONYI * * 47.4 0.5 EDO * * 50.4 0.6 EKITI * * 49.7 0.5 ENUGU * * 47.7 0.5 FCT-ABUJA * * 51.4 0.6 GOMBE 51.8 * 50.5 0.7 IMO * * 49.3 0.5 JIGAWA 46.7 2.5 50.3 0.5 KADUNA * * 51.1 0.5 KANO * * 51.2 0.6 KATSINA 45.0 * 50.2 0.6 KEBBI 61.2 * 52.8 0.5 KOGI 45.3 * 49.9 0.6

164
*Not applicable
KWARA 39.0 * 49.8 0.5 LAGOS 42.6 * 51.6 0.6 NASSARAWA * * 49.6 0.7 NIGER 56.7 2.9 49.7 0.6 OGUN 55.5 * 51.5 0.5 ONDO 50.3 4.3 50.8 0.5 OSUN * * 48.8 0.5 OYO 33.7 * 49.1 0.5 PLATEAU 45.7 * 50.9 0.5 RIVERS * * 47.0 0.5 SOKOTO 45.6 2.7 47.5 0.5 TARABA * * 49.2 0.4 YOBE * * 49.5 0.5 ZAMFARA 54.1 4.9 50.0 0.5 National 49.2 1.1 50.1 0.1
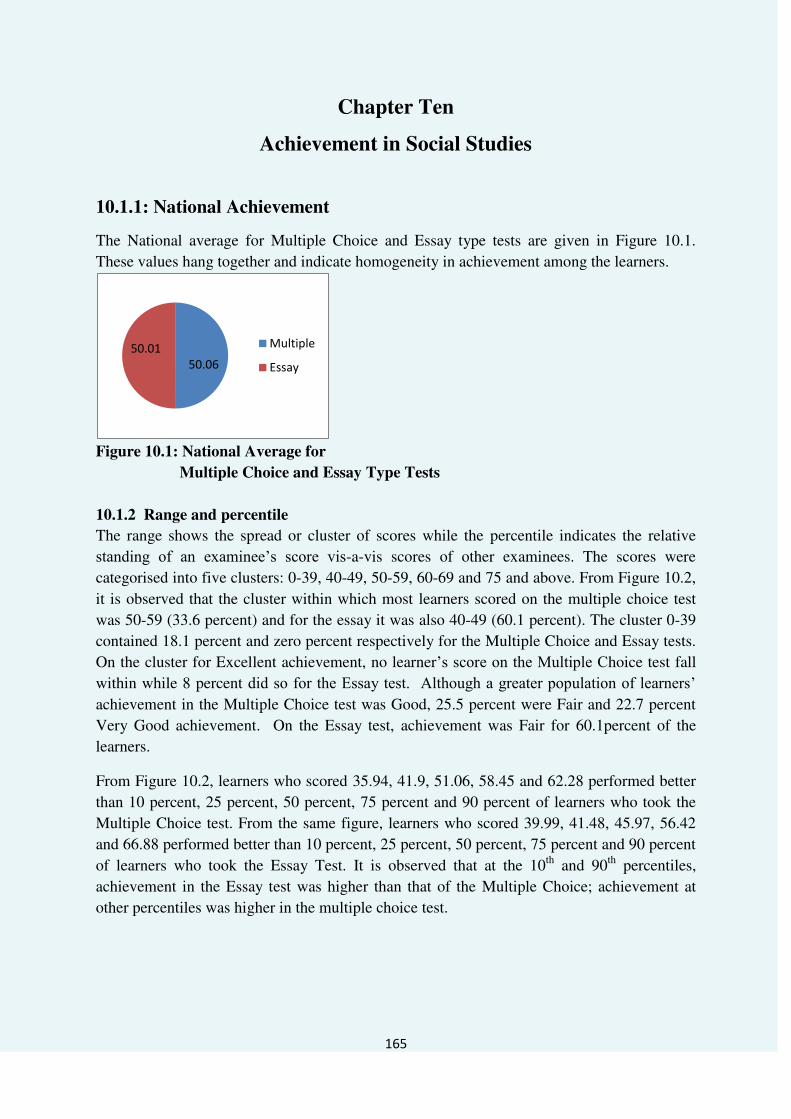
165
Chapter Ten
Achievement in Social Studies
10.1.1: National Achievement The National average for Multiple Choice and Essay type tests are given in Figure 10.1.
These values hang together and indicate homogeneity in achievement among the learners.
Figure 10.1: National Average for
Multiple Choice and Essay Type Tests
10.1.2 Range and percentile
The range shows the spread or cluster of scores while the percentile indicates the relative
standing of an examinee‟s score vis-a-vis scores of other examinees. The scores were
categorised into five clusters: 0-39, 40-49, 50-59, 60-69 and 75 and above. From Figure 10.2,
it is observed that the cluster within which most learners scored on the multiple choice test
was 50-59 (33.6 percent) and for the essay it was also 40-49 (60.1 percent). The cluster 0-39
contained 18.1 percent and zero percent respectively for the Multiple Choice and Essay tests.
On the cluster for Excellent achievement, no learner‟s score on the Multiple Choice test fall
within while 8 percent did so for the Essay test. Although a greater population of learners‟ achievement in the Multiple Choice test was Good, 25.5 percent were Fair and 22.7 percent
Very Good achievement. On the Essay test, achievement was Fair for 60.1percent of the
learners.
From Figure 10.2, learners who scored 35.94, 41.9, 51.06, 58.45 and 62.28 performed better
than 10 percent, 25 percent, 50 percent, 75 percent and 90 percent of learners who took the
Multiple Choice test. From the same figure, learners who scored 39.99, 41.48, 45.97, 56.42
and 66.88 performed better than 10 percent, 25 percent, 50 percent, 75 percent and 90 percent
of learners who took the Essay Test. It is observed that at the 10th and 90th percentiles,
achievement in the Essay test was higher than that of the Multiple Choice; achievement at
other percentiles was higher in the multiple choice test.
50.06
50.01 Multiple
Essay

166
Fig. 10.2: Percentiles for Multiple Choice and Essay Tests at National Level
10.1.3 Group Achievement
Table 10.1 contains the mean score and standard error of achievement in Multiple Choice and
Essay type tests in Social studies
classified by gender of the learners
and location of schools. There were
no significant differences in
achievement between the levels of
each variable for both types of tests.
Nonetheless, it can be seen that
female learners had higher mean
score in both Multiple Choice and
Essay tests. The learners in urban
schools had higher mean score in
the Multiple Choice tests while
their counterparts in rural schools obtained higher scores in the Essay.
Achievement on Content
Cognitive Domains
Achievement on the different
Content domains (Themes) were not
scaled but expressed as percentages
and indicated mean values of 9.34,
44.34, 32.16, 25.69, 26.85 and 17.55
for the Themes: Introduction to
Social Studies; People and their
environment; Socialization: Its
agents and process; Culture; Social
issues and problems; and National unity and integration respectively. With respect to
achievement in the three levels of cognition, the mean scores were 24.83, 26.94 and 46.06 for
0
20
40
60
80
Fail (0 -
39 %)
Fair (40 -
49 %)
Good (50
- 59 %)
Very
Good (60
- 69 %)
Excellent
(70 - 100
%)
18
.1
25
.5
33
.6
22
.7
0
0
60
.1
17
.8
14
8
Multiple Choice Test
Essay Test
Table 10.1: Distribution of Mean and Standard
Error of Achievement in Multiple
Choice and Essay Tests by Location,
Type of School and Gender Social
Studies
Variable level Multiple choice ESSAY
Mean SE Mean SE
Gender Male 49.69 0.16 49.94 0.16
Female 50.46 0.16 50.08 0.17
location Urban 50.40 0.15 49.98 0.16
Rural 49.56 0.17 50.06 0.18
40.00
60.00
46
.20
48
.08
49
.37
50
.06
51
.49
51
.78
53
.64
Figure 10.3: Mean in Multiple Choice test across
Geo-Political Zones

167
Knowledge, Comprehension and Higher order respectively. Achievement in Higher order
cognitive domain is significantly higher than in Knowledge and comprehension.
10.2 Achievement in Geopolitical Zone At this level, the results include variations by gender and location of schools. In Figures 10.3
and 10.4, achievement in the Essay test was
higher than that of the Multiple choice test
for the North Central, North East and North
West zones. The range on the Essay test was
from 49.41 (North Central) to 50.87 (North
East) while that of the Multiple choice test
was from 46.20 (North East) to 53.64 (South
East). Learners in the South South, South
West and South East performed above the
national average on the Multiple choice test.
While learners in the North East and South
West performed above the national average
on the Essay test. It is notable that apart
from the mean scores for North East and
South East on the Multiple choice East, achievement within and between test forms in the
Zones show little variation In Table 10.2, the mean scores and standard error for levels of gender by geo-political zones
show very little variations. Apart from the North Central Zone where mean difference
between female and male learners is 1.01 points, in Multiple choice Test, all other values are
in the direction of equity achievement. Table 10.2: Distribution of Mean and Standard Error of Achievement in Multiple
Choice and Essay Tests for Geopolitical Zones by Gender
Geopolitical Zone Gender Multiple Choice Essay
Mean SE Mean SE
NORTH CENTRAL Male 48.89 0.42 49.75 0.43
Female 49.90 0.44 49.04 0.44
NORTH EAST Male 46.15 0.37 51.01 0.41
Female 46.27 0.42 50.69 0.44
NORTH WEST Male 47.90 0.36 49.50 0.34
Female 48.36 0.44 49.42 0.41
SOUTH EAST Male 53.57 0.36 49.60 0.43
Female 53.71 0.33 50.23 0.42
SOUTH SOUTH Male 51.32 0.37 49.75 0.41
Female 51.66 0.35 50.13 0.41
SOUTH WEST Male 51.66 0.33 50.03 0.39
Female 51.89 0.32 50.70 0.38
48.00
50.00
52.00
49
.41
49
.47
49
.93
49
.94
50
.01
50
.38
50
.87
Figure 10.4: Mean Essay Test across Geo-
Political Zones
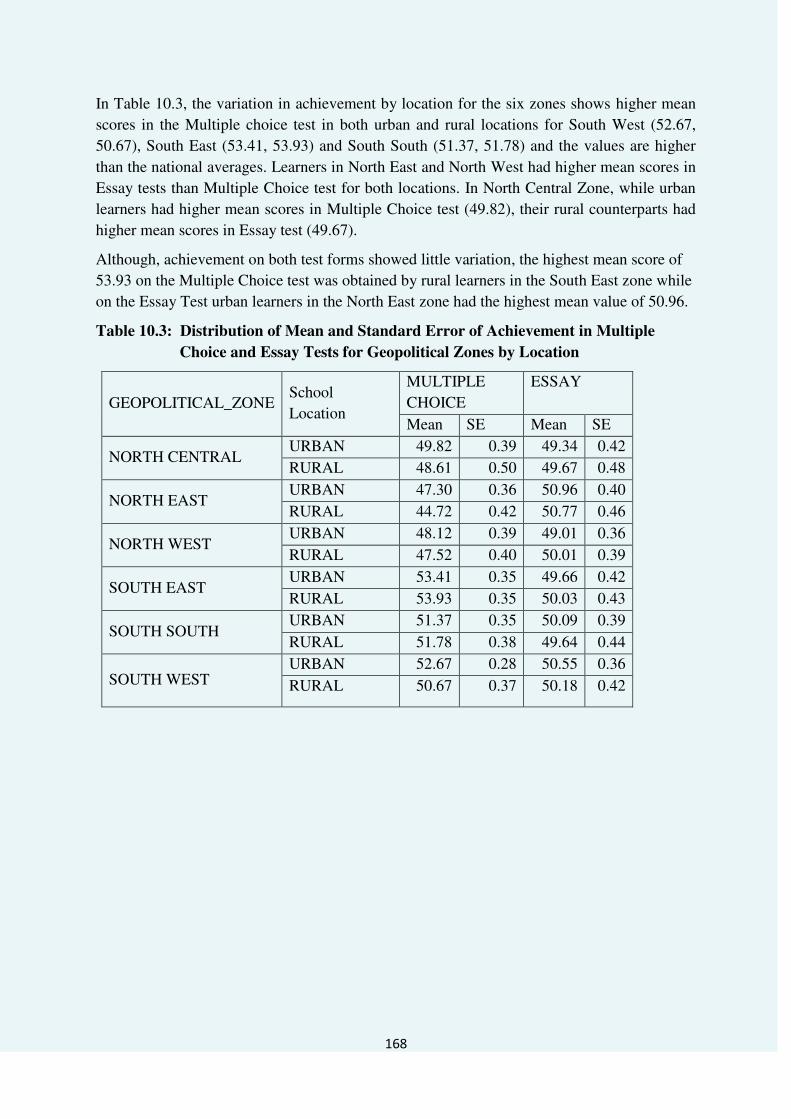
168
In Table 10.3, the variation in achievement by location for the six zones shows higher mean
scores in the Multiple choice test in both urban and rural locations for South West (52.67,
50.67), South East (53.41, 53.93) and South South (51.37, 51.78) and the values are higher
than the national averages. Learners in North East and North West had higher mean scores in
Essay tests than Multiple Choice test for both locations. In North Central Zone, while urban
learners had higher mean scores in Multiple Choice test (49.82), their rural counterparts had
higher mean scores in Essay test (49.67).
Although, achievement on both test forms showed little variation, the highest mean score of
53.93 on the Multiple Choice test was obtained by rural learners in the South East zone while
on the Essay Test urban learners in the North East zone had the highest mean value of 50.96.
Table 10.3: Distribution of Mean and Standard Error of Achievement in Multiple
Choice and Essay Tests for Geopolitical Zones by Location
GEOPOLITICAL_ZONE School
Location
MULTIPLE
CHOICE
ESSAY
Mean SE Mean SE
NORTH CENTRAL URBAN 49.82 0.39 49.34 0.42
RURAL 48.61 0.50 49.67 0.48
NORTH EAST URBAN 47.30 0.36 50.96 0.40
RURAL 44.72 0.42 50.77 0.46
NORTH WEST URBAN 48.12 0.39 49.01 0.36
RURAL 47.52 0.40 50.01 0.39
SOUTH EAST URBAN 53.41 0.35 49.66 0.42
RURAL 53.93 0.35 50.03 0.43
SOUTH SOUTH URBAN 51.37 0.35 50.09 0.39
RURAL 51.78 0.38 49.64 0.44
SOUTH WEST URBAN 52.67 0.28 50.55 0.36
RURAL 50.67 0.37 50.18 0.42

169
Content Domains
Figure 10.6 provides the following observations:
Achievement in theme 1: Introduction to Social Studies was generally low across the Zones with a range of 9.33 to 9.35
Achievement on theme 2: People and their environment was the highest The achievement of learners in North East Zone was consistently the lowest on the six
Themes. Whereas learners in South East and South West demonstrated superior knowledge of the Themes than their counterparts in other Zones.
There were little variations among the zones in five Themes except Theme 2: People and their environment with about 7 point difference between North East (40.74) and South East (47.67).
0.00 50.00
NORTH CENTRAL
NORTH EAST
NORTH WEST
SOUTH EAST
SOUTH SOUTH
SOUTH WEST
9.33
9.33
9.34
9.34
9.33
9.35
43.71
40.74
42.39
47.67
45.75
46.04
25.38
23.94
24.94
27.37
26.26
26.36
26.39
24.34
25.71
29.23
27.69
27.86
17.29
15.94
16.67
19.01
18.18
18.29
T6_PERCENT
T5_PERCENT
T4_PERCENT
T3_PERCENT
T2_PERCENT
T1_PERCENT
Figure 10.6: Achievement by Zone on Content across
Geopolitical Zones
T1: Introduction to people Social
Studies
T2: People and their Environment
T3: Socialisation: its agent and process.
T4: Culture
T5: Social issues and problem
T6: National Unity and integration

170
Cognitive Domains
10.3: State Level Achievement for Test Forms
From Table 10.4, achievement in the Multiple Choice test for twenty one states is higher than
that of the Essay test. The mean for the multiple choice test ranges from 40.91 (Gombe State)
to 59.23 (Kebbi State) and nineteen states performed above the national average for the test.
In the Essay test, the range was 47.9 (Niger state) to 51.55 (Oyo State). The range of score on
the essay test (3.65) was smaller than that of the multiple choice test (8.32). While 20 States
obtained mean scores above the national average.
Further observations show that learners in 14 States, namely: Adamawa, Bayelsa, Borno,
Benue, Gombe, Jigawa, Kaduna, Katsina, Kogi, Nasarawa, Plateau, Sokoto and Taraba had
higher scores on the Essay Test than the Multiple Choice Test. There were significant
difference in achievement on both test forms in states such as Kebbi, Gombe, Borno and
Taraba.
0.00 20.00 40.00 60.00
NORTH
CENTRAL
NORTH EAST
NORTH WEST
SOUTH EAST
SOUTH SOUTH
SOUTH WEST
national
24.55
23.22
23.99
26.32
25.44
25.56
24.83
26.55
24.82
25.86
28.91
27.72
27.91
26.94
45.07
40.29
43.13
51.46
48.21
48.56
46.06
HIGHER ORDER
COMPREHENSION
KNOWLEDGE
Figure 10.7: Mean Score by Zone on The Social
Studies Cognitive Domains
The National averages for the three
objective domains were highest for
Higher order domain and decreased
progressively through
Comprehension and to Knowledge
domain. This pattern is reflected in
the six zones. The differences
between the mean scores for Higher
order domain and each of the two
other domains are statistically
significant.
South East displayed the highest
level of achievement on all three
types of objectives. The North East
displayed the least achievement on
the three levels of Objectives.
Mean scores for each of the
Objective domains in the South East,
South West and South South are
higher than their respective national
averages
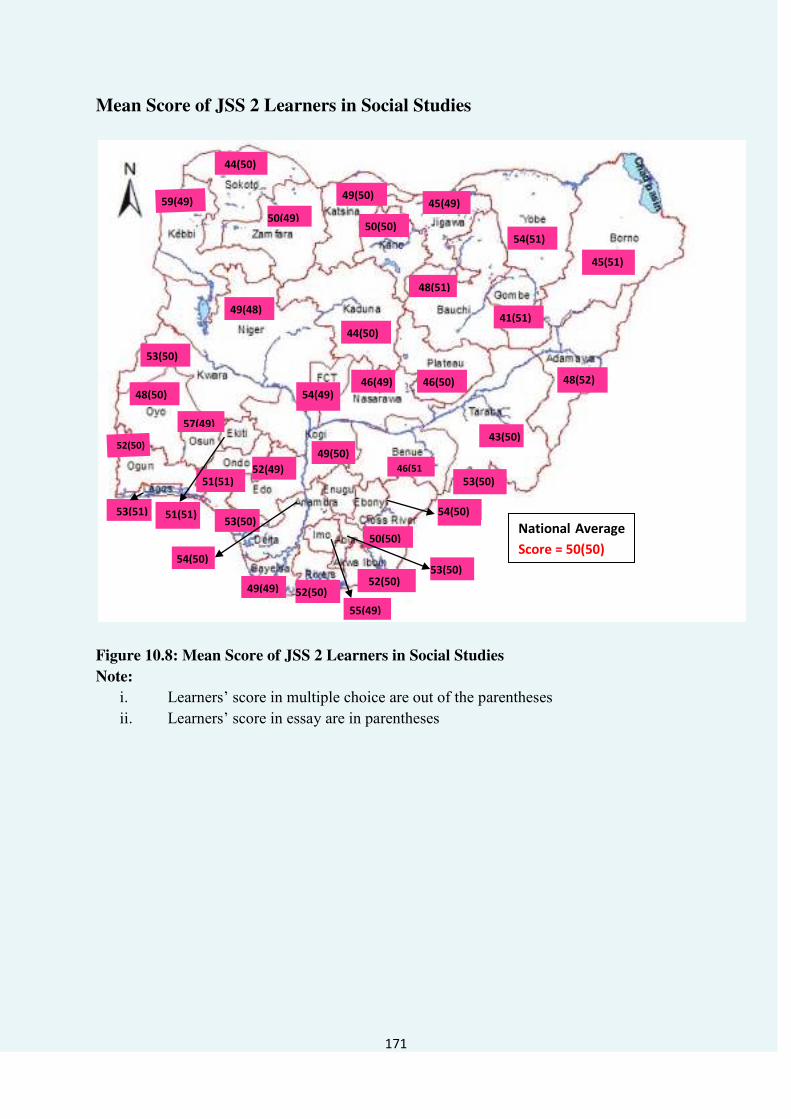
171
Mean Score of JSS 2 Learners in Social Studies
Figure 10.8: Mean Score of JSS 2 Learners in Social Studies
Note:
i. Learners‟ score in multiple choice are out of the parentheses ii. Learners‟ score in essay are in parentheses
59(49)
44(50)
49(50)
49(48)
53(50)
48(50)
52(50)
53(51)
50(49)
54(49)
50(50)
44(50)
45(49)
54(51)
48(51)
41(51)
43(50) 49(50)
52(49)
50(50)
55(49)
52(50) 49(49) 52(50)
46(49)
45(51)
48(52) 46(50)
53(50) 54(50)
54(50) 53(50)
53(50) 51(51)
57(49)
51(51)
46(51
National Average
Score = 50(50)

172
Achievement by Groups
Gender
0.00 20.00 40.00 60.00
ABIA
ADAMAWA
AKWA-IBOM
ANAMBRA
BAUCHI
BAYELSA
BORNO
BENUE
CROSS RIVER
DELTA
EBONYI
EDO
EKITI
ENUGU
GOMBE
IMO
JIGAWA
KADUNA
KANO
KATSINA
KEBBI
KOGI
KWARA
LAGOS
NASARAWA
NIGER
OGUN
ONDO
OSUN
OYO
PLATEAU
RIVERS
SOKOTO
TARABA
YOBE
ZAMFARA
FCT
NATIONAL
51.70
48.16
52.14
54.54
48.06
49.83
45.95
44.89
50.25
52.34
53.18
51.44
51.10
53.53
40.47
54.60
45.15
43.16
48.17
46.95
59.17
46.33
53.00
52.16
46.02
49.93
52.38
50.69
56.11
47.75
47.15
50.99
43.60
43.39
55.57
50.55
52.37
49.69
53.22
47.41
51.20
53.88
47.39
48.99
43.52
48.09
50.76
53.66
55.47
51.78
50.56
51.82
41.87
54.56
44.22
44.06
53.42
52.09
59.33
53.82
52.52
53.60
45.96
47.67
51.36
50.62
57.17
47.41
45.05
52.00
44.72
42.35
53.15
48.78
54.57
50.46
Female
Male
Figure 10.9: Mean Scores in Multiple Choice Based on
Gender across States
National averages for male
learners was 49.69 and female
learners 50.46
At the National level, female
learners had a slightly higher
mean score than the males.
However, the difference was not
statistically significant
Seventeen states had mean
scores for female higher than
that of the male learners.
The mean scores for the male
learners ranges from 40.47
(Gombe state) to 59.17 (Kebbi
state) and 22 states performed
above the national mean for male
learners on the test.
Among the female learners, the
range was 41.87 (Gombe state) to
59.33 (Kebbi) state). Also, 22
states had mean scores higher
than the national average for
female learners.
The achievement of both male
and female learners was highest
for Kebbi state (59.17, 59.33) and
least for Gombe state (40.43,
41.87).
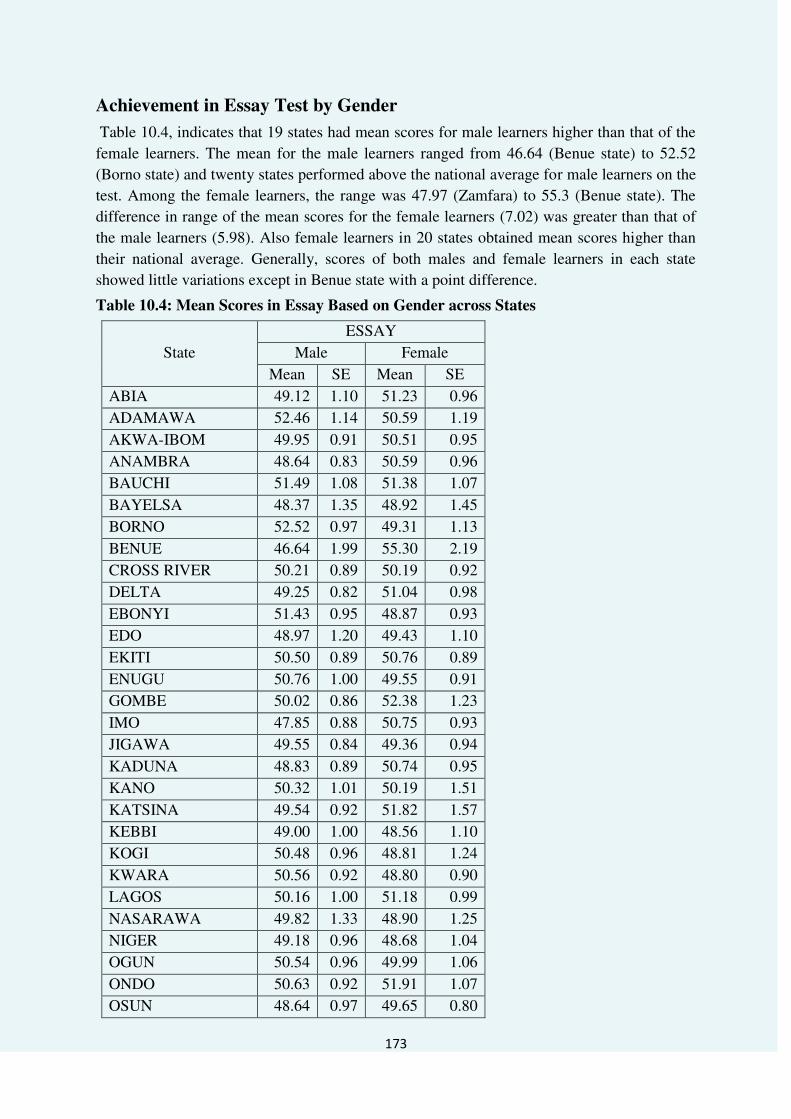
173
Achievement in Essay Test by Gender
Table 10.4, indicates that 19 states had mean scores for male learners higher than that of the
female learners. The mean for the male learners ranged from 46.64 (Benue state) to 52.52
(Borno state) and twenty states performed above the national average for male learners on the
test. Among the female learners, the range was 47.97 (Zamfara) to 55.3 (Benue state). The
difference in range of the mean scores for the female learners (7.02) was greater than that of
the male learners (5.98). Also female learners in 20 states obtained mean scores higher than
their national average. Generally, scores of both males and female learners in each state
showed little variations except in Benue state with a point difference.
Table 10.4: Mean Scores in Essay Based on Gender across States
State
ESSAY
Male Female
Mean SE Mean SE
ABIA 49.12 1.10 51.23 0.96
ADAMAWA 52.46 1.14 50.59 1.19
AKWA-IBOM 49.95 0.91 50.51 0.95
ANAMBRA 48.64 0.83 50.59 0.96
BAUCHI 51.49 1.08 51.38 1.07
BAYELSA 48.37 1.35 48.92 1.45
BORNO 52.52 0.97 49.31 1.13
BENUE 46.64 1.99 55.30 2.19
CROSS RIVER 50.21 0.89 50.19 0.92
DELTA 49.25 0.82 51.04 0.98
EBONYI 51.43 0.95 48.87 0.93
EDO 48.97 1.20 49.43 1.10
EKITI 50.50 0.89 50.76 0.89
ENUGU 50.76 1.00 49.55 0.91
GOMBE 50.02 0.86 52.38 1.23
IMO 47.85 0.88 50.75 0.93
JIGAWA 49.55 0.84 49.36 0.94
KADUNA 48.83 0.89 50.74 0.95
KANO 50.32 1.01 50.19 1.51
KATSINA 49.54 0.92 51.82 1.57
KEBBI 49.00 1.00 48.56 1.10
KOGI 50.48 0.96 48.81 1.24
KWARA 50.56 0.92 48.80 0.90
LAGOS 50.16 1.00 51.18 0.99
NASARAWA 49.82 1.33 48.90 1.25
NIGER 49.18 0.96 48.68 1.04
OGUN 50.54 0.96 49.99 1.06
ONDO 50.63 0.92 51.91 1.07
OSUN 48.64 0.97 49.65 0.80

174
OYO 49.43 1.00 51.00 0.90
PLATEAU 50.20 1.00 49.68 1.04
RIVERS 50.87 1.04 49.80 0.87
SOKOTO 50.65 0.87 47.98 0.93
TARABA 49.52 0.90 50.29 0.99
YOBE 51.00 1.23 50.36 0.98
ZAMFARA 48.82 0.79 47.97 0.98
FCT 51.67 1.71 49.18 1.12
National 49.94 0.16 50.08 0.17
Achievement by Location
Table 10.5 contains the mean scores for learners from urban and rural locations on the
Multiple Choice Test. As can be seen, 21 states had mean scores for learners in urban schools
higher than that of the rural learners. The mean for the learners in rural locations ranges from
40.03 (Taraba state) to 60.6 (Kebbi state) and 18 states performed above the national average
for rural learners on the test. Among the urban learners, the range was 41.70 (Gombe state) to
58.84 (Kebbi state). The difference in range of the mean scores for the rural learners (19.57)
is greater than that of the urban learners (17.14). Learners from Kebbi state had the best
achievement in both rural and urban schools. On the Essay test, 19 states had mean for
learners in rural schools higher than that of the urban learners. The mean scores for the
learners in rural locations ranged from 43.86 (Ogun State) to 53.48 (Bayelsa State) and only
two states performed above the national average for rural learners. Among the urban learners,
the range was 47.61 (Lagos State) to 53.78 (Anambra State). The difference in range of the
mean scores for the rural learners, 9.62 is greater than 6.17 for the urban learners. Urban
learners in 29 states performed above the national average. Generally, achievement in both
tests was homogeneous, except for learners in Yobe state with a 7.27 point difference
between male and female learners on the Multiple Choice test and in Ogun state, with a 7.1
points difference. In both states, male learners were outstanding.

175
TABLE 10.5: Mean Scores in Multiple Choice and Essay Based on Location across States
State
MULTIPLE CHOICE Essay
URBAN RURAL URBAN RURAL
Mean SE Mean SE Mean SE Mean SE
ABIA 52.66 0.79 52.48 0.88 50.57 1.09 52.48 1.21
ADAMAWA 47.73 1.20 47.86 1.05 50.09 0.91 50.36 0.93
AKWA-IBOM
53.35 0.76 50.42 0.69 48.66 0.89 50.54 0.91
ANAMBRA 54.11 0.74 54.26 0.70 53.78 1.13 49.23 0.97
BAUCHI 47.74 0.96 47.61 1.08 48.04 1.06 * * BAYELSA 49.56 0.88 * * 49.95 0.86 53.48 1.34
BORNO 45.66 0.76 43.83 0.98 50.97 1.62 * * BENUE 46.49 1.62 * * 50.39 0.87 49.99 0.95
CROSS RIVER
49.09 1.03 52.05 0.96 50.14 0.85 50.04 0.94
DELTA 52.07 0.86 53.79 0.81 51.60 1.08 47.88 0.86
EBONYI 53.98 0.90 55.03 0.86 50.29 1.10 47.97 1.18
EDO 52.61 0.81 50.45 1.18 51.44 0.92 49.99 0.88
EKITI 52.07 0.79 49.99 0.69 49.44 0.91 50.82 0.99
ENUGU 52.50 0.76 52.78 0.77 51.02 1.02 50.54 0.97
GOMBE 41.70 0.66 40.18 0.61 50.14 0.94 48.55 0.90
IMO 54.03 0.71 55.09 0.69 49.56 0.82 49.32 0.97
JIGAWA 45.32 0.72 43.83 0.84 48.23 1.02 50.49 0.83
KADUNA 44.05 0.98 43.36 0.66 51.52 1.17 48.67 1.18
KANO 48.39 1.02 52.21 1.14 48.14 1.27 51.35 1.01
KATSINA 47.18 1.46 49.25 1.03 48.35 1.15 49.78 1.26
KEBBI 58.84 0.71 60.60 0.63 49.13 1.08 50.55 1.06
KOGI 52.36 1.07 46.04 1.05 50.83 0.96 48.88 1.13
KWARA 52.24 0.69 54.20 0.94 50.55 0.90 50.96 1.14
LAGOS 54.09 0.72 51.16 0.86 47.61 1.05 51.22 1.48
NASARAWA 48.85 1.11 42.97 1.17 48.79 1.07 47.02 0.92
NIGER 49.08 0.89 48.79 1.25 49.44 0.98 51.10 1.04
OGUN 54.82 0.65 48.85 0.78 51.97 0.74 43.86 1.55
ONDO 50.90 0.55 48.53 1.61 50.01 0.93 48.64 0.82
OSUN 55.73 0.64 57.47 0.68 48.79 0.87 51.94 1.01
OYO 50.05 0.69 45.00 0.76 49.36 0.99 50.75 1.04
PLATEAU 46.84 0.93 45.38 1.03 50.95 0.98 49.09 0.90
RIVERS 51.32 0.73 51.99 0.68 49.12 0.88 49.99 0.94
SOKOTO 44.69 0.79 43.45 0.97 50.73 0.84 48.05 1.05
TARABA 44.35 0.64 40.03 0.72 50.21 0.96 51.43 1.31
YOBE 56.90 0.51 49.78 1.19 48.17 0.75 49.26 1.12
ZAMFARA 50.36 0.99 49.48 1.10 48.01 1.19 50.41 1.63
FCT 51.38 1.29 57.03 0.93 49.98 0.16 50.06 0.18
NATIONAL 50.40 0.15 49.56 0.17 48.66 0.92 52.27 1.12
*Not applicable
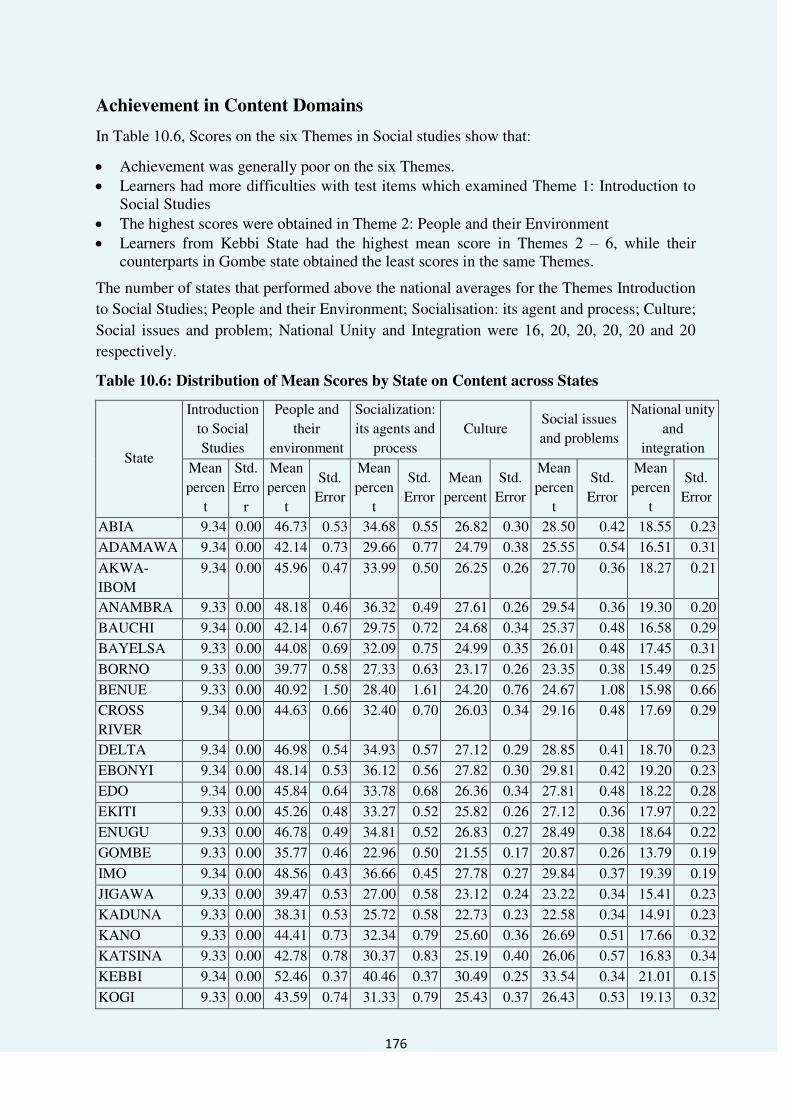
176
Achievement in Content Domains
In Table 10.6, Scores on the six Themes in Social studies show that:
Achievement was generally poor on the six Themes. Learners had more difficulties with test items which examined Theme 1: Introduction to
Social Studies The highest scores were obtained in Theme 2: People and their Environment Learners from Kebbi State had the highest mean score in Themes 2 – 6, while their
counterparts in Gombe state obtained the least scores in the same Themes.
The number of states that performed above the national averages for the Themes Introduction
to Social Studies; People and their Environment; Socialisation: its agent and process; Culture;
Social issues and problem; National Unity and Integration were 16, 20, 20, 20, 20 and 20
respectively.
Table 10.6: Distribution of Mean Scores by State on Content across States
State
Introduction
to Social
Studies
People and
their
environment
Socialization:
its agents and
process
Culture Social issues
and problems
National unity
and
integration
Mean
percen
t
Std.
Erro
r
Mean
percen
t
Std.
Error
Mean
percen
t
Std.
Error
Mean
percent
Std.
Error
Mean
percen
t
Std.
Error
Mean
percen
t
Std.
Error
ABIA 9.34 0.00 46.73 0.53 34.68 0.55 26.82 0.30 28.50 0.42 18.55 0.23
ADAMAWA 9.34 0.00 42.14 0.73 29.66 0.77 24.79 0.38 25.55 0.54 16.51 0.31
AKWA-
IBOM
9.34 0.00 45.96 0.47 33.99 0.50 26.25 0.26 27.70 0.36 18.27 0.21
ANAMBRA 9.33 0.00 48.18 0.46 36.32 0.49 27.61 0.26 29.54 0.36 19.30 0.20
BAUCHI 9.34 0.00 42.14 0.67 29.75 0.72 24.68 0.34 25.37 0.48 16.58 0.29
BAYELSA 9.33 0.00 44.08 0.69 32.09 0.75 24.99 0.35 26.01 0.48 17.45 0.31
BORNO 9.33 0.00 39.77 0.58 27.33 0.63 23.17 0.26 23.35 0.38 15.49 0.25
BENUE 9.33 0.00 40.92 1.50 28.40 1.61 24.20 0.76 24.67 1.08 15.98 0.66
CROSS
RIVER
9.34 0.00 44.63 0.66 32.40 0.70 26.03 0.34 29.16 0.48 17.69 0.29
DELTA 9.34 0.00 46.98 0.54 34.93 0.57 27.12 0.29 28.85 0.41 18.70 0.23
EBONYI 9.34 0.00 48.14 0.53 36.12 0.56 27.82 0.30 29.81 0.42 19.20 0.23
EDO 9.34 0.00 45.84 0.64 33.78 0.68 26.36 0.34 27.81 0.48 18.22 0.28
EKITI 9.33 0.00 45.26 0.48 33.27 0.52 25.82 0.26 27.12 0.36 17.97 0.22
ENUGU 9.33 0.00 46.78 0.49 34.81 0.52 26.83 0.27 28.49 0.38 18.64 0.22
GOMBE 9.33 0.00 35.77 0.46 22.96 0.50 21.55 0.17 20.87 0.26 13.79 0.19
IMO 9.34 0.00 48.56 0.43 36.66 0.45 27.78 0.27 29.84 0.37 19.39 0.19
JIGAWA 9.33 0.00 39.47 0.53 27.00 0.58 23.12 0.24 23.22 0.34 15.41 0.23
KADUNA 9.33 0.00 38.31 0.53 25.72 0.58 22.73 0.23 22.58 0.34 14.91 0.23
KANO 9.33 0.00 44.41 0.73 32.34 0.79 25.60 0.36 26.69 0.51 17.66 0.32
KATSINA 9.33 0.00 42.78 0.78 30.37 0.83 25.19 0.40 26.06 0.57 16.83 0.34
KEBBI 9.34 0.00 52.46 0.37 40.46 0.37 30.49 0.25 33.54 0.34 21.01 0.15
KOGI 9.33 0.00 43.59 0.74 31.33 0.79 25.43 0.37 26.43 0.53 19.13 0.32

177
State
Introduction
to Social
Studies
People and
their
environment
Socialization:
its agents and
process
Culture Social issues
and problems
National unity
and
integration
Mean
percen
t
Std.
Erro
r
Mean
percen
t
Std.
Error
Mean
percen
t
Std.
Error
Mean
percent
Std.
Error
Mean
percen
t
Std.
Error
Mean
percen
t
Std.
Error
KWARA 9.33 0.00 46.97 0.46 35.07 0.48 26.78 0.26 28.46 0.36 18.74 0.20
LAGOS 9.39 0.06 47.02 0.49 35.12 0.53 26.99 0.29 28.68 0.39 18.81 0.24
NASARAW
A
9.33 0.00 40.58 0.81 28.19 0.88 23.78 0.37 24.10 0.54 15.93 0.36
NIGER 9.34 0.00 43.27 0.73 31.05 0.78 25.20 0.35 26.09 0.50 17.16 0.31
OGUN 9.33 0.00 46.20 0.50 34.27 0.53 26.31 0.28 27.80 0.38 18.39 0.22
ONDO 9.33 0.00 45.13 0.48 33.14 0.51 25.69 0.26 26.96 0.36 17.89 0.22
OSUN 9.34 0.00 50.39 0.41 38.35 0.40 29.02 0.27 31.58 0.37 20.07 0.17
OYO 9.33 0.00 42.21 0.50 29.97 0.55 24.29 0.25 24.96 0.35 16.57 0.23
PLATEAU 9.33 0.00 40.74 0.65 28.26 0.69 23.95 0.32 24.35 0.46 15.93 0.28
RIVERS 9.33 0.00 45.94 0.45 34.02 0.48 26.08 0.25 27.52 0.34 18.28 0.20
SOKOTO 9.34 0.00 38.63 0.59 25.91 0.63 23.11 0.29 23.10 0.42 14.98 0.25
TARABA 9.33 0.00 37.74 0.50 25.12 0.55 22.38 0.21 22.10 0.31 14.66 0.22
YOBE 9.33 0.00 48.20 0.53 36.23 0.56 27.75 0.31 29.76 0.43 19.22 0.24
ZAMFARA 9.34 0.00 44.08 0.69 31.68 0.73 26.00 0.36 27.18 0.51 17.39 0.29
FCT 9.34 0.00 47.67 0.80 35.63 0.84 27.49 0.46 29.38 0.64 18.98 0.35
NATIONAL 9.34 0.00 44.34 0.10 32.16 0.11 25.69 0.05 26.85 0.08 17.54 0.05
Achievement in Cognitive Domains
As can be seen in table 10.7, National average for knowledge domain which is 57.80 was
higher than those for comprehension 45.13 and higher order objectives, 53.32. The
differences were statistically significant.
State analysis shows the following:
Scores ranged from 41.77 (Gombe) to 68.18 (Kebbi) for Knowledge, 30.66 (Gombe) to 55.67 (Kebbi) and 47.31 (Sokoto) to 61.99 (Gombe).
Learners in Kebbi state had the highest mean scores on Knowledge and Comprehension sub-tests while learners in Gombe state obtained the highest mean scores on higher order sub-test.
Within each state, there were score variations on the three cognitive domains.
Between states, large score variations were observed especially for knowledge and cognitive domains. Indeed, several pair use comparisons within and between states. This showed statistical significance.
Twenty-two states performed above the National average for knowledge and comprehension while only 16 scored above the National average for higher order sub-test.

178
Table 10.7: Distribution of Mean Score by State on the Behavioural Objectives
State KNOWLEDEGE COMPREHENSION HIGHER ORDER
Mean SE Mean SE Mean SE
ABIA 61.77 0.98 48.04 0.96 57.11 1.49
ADAMAWA 57.93 1.47 46.33 1.38 56.78 1.61
AKWA-IBOM 61.93 0.96 48.36 0.91 53.06 1.39
ANAMBRA 65.37 1.03 52.09 0.96 55.50 1.46
BAUCHI 51.20 1.14 39.17 1.00 60.44 1.52
BAYELSA 60.47 1.35 46.07 1.30 51.98 2.15
BORNO 53.55 1.20 41.24 1.13 60.27 1.57
BENUE 50.03 2.64 38.82 2.07 48.43 3.20
CROSS RIVER 59.38 1.16 46.29 1.07 53.95 1.44
DELTA 67.34 0.99 54.59 0.97 53.56 1.34
EBONYI 64.62 1.01 50.84 0.95 57.03 1.59
EDO 61.65 1.26 47.92 1.20 55.47 1.61
EKITI 63.41 0.91 49.00 0.92 50.28 1.42
ENUGU 61.51 0.97 47.70 0.93 57.69 1.53
GOMBE 41.77 0.87 30.66 0.71 61.99 1.37
IMO 63.83 0.88 50.15 0.90 56.09 1.48
JIGAWA 48.61 1.04 36.89 0.87 49.13 1.50
KADUNA 50.13 1.20 38.61 1.06 50.06 1.54
KANO 62.57 1.38 50.40 1.38 47.91 2.00
KATSINA 49.17 1.23 37.52 1.01 47.62 1.69
KEBBI 68.16 1.00 55.67 1.04 56.62 1.80
KOGI 58.64 1.46 46.53 1.31 47.54 1.69
KWARA 60.42 1.15 48.24 1.07 49.27 1.39
LAGOS 66.86 0.99 53.79 0.96 51.42 1.47
NASARAWA 48.38 1.50 36.10 1.26 51.18 1.06
NIGER 54.62 1.68 44.16 1.47 49.94 1.70
OGUN 63.09 0.97 49.45 0.94 52.14 1.65
ONDO 57.54 1.15 44.23 1.06 48.50 1.49
OSUN 63.76 0.76 49.44 0.82 52.31 1.47
OYO 56.04 1.06 43.59 0.98 53.01 1.55
PLATEAU 47.89 1.09 36.11 0.90 47.71 1.49
RIVERS 63.52 0.92 49.58 0.91 51.05 1.41
SOKOTO 44.94 0.98 33.06 0.83 47.31 1.38
TARABA 44.05 1.01 32.46 0.80 60.88 1.33
YOBE 60.09 1.05 47.67 0.98 57.37 1.46
ZAMFARA 53.83 1.19 43.57 1.09 49.98 1.54
FCT 65.56 1.55 52.25 1.48 48.89 2.29
NATIONAL 57.80 0.20 45.13 0.19 53.32 0.26

179
10.4 Relational Analysis
In this section, relationship between some contextual variables and achievement was
explored. Research provides evidence that some variables exist which could be manipulated
to enhance achievement of learners. Some of these are home-related while others are learner-
related. For example provision by parents, feeding, mode of transportation to school is
somewhat home-related variables. Liking for schooling and Teachers are learner-related. The
central issue in this section is how contextual variables in this study influenced achievement.
Assistance with Homework
Table 10.4.1 shows the variation in achievement with assistance on homework given to the
learners. Nationally, there was no significant difference in achievement in relation to
Assistance with homework, with mean scores of 50.4, 49.9 and 50.0 for low, medium and
high levels of assistance respectively. When states were considered, no consistency was
actually observed. In the case of Akwa Ibom, Anambra and Niger states achievement
increased with increase in level of assistance though not significantly different. In Zamfara
and Kano states achievement at low level of assistance was lower than that of moderate level
of assistance; but the achievement at high level of assistance was lower than that of moderate
level of assistance. In respect of the low level of assistance, the range in achievement was
44.6 (Jigawa state) to 59.5 (Benue state) with 19 states performing above the national
average. At the moderate level of assistance, the range was 45.8 (Gombe state) to 54.4 (Kebbi
state) with 21 states performing above the National average for moderate assistance group
while at the high level of assistance the range was 45.7 (Kaduna state) to 53.9 (Kebbi state)
with 18 states performing above the National average. Using the number of states performing
above the national average as an indicator of achievement, achievement improved at the
moderate level of assistance over that of low level of assistance and decreased at the high
level of assistance.
Table 10.4.1: Homework Assistance as Related to Achievement in Social Studies
State Low Moderate High
Mean SE Mean SE Mean SE
ABIA 52.0 0.9 50.6 0.8 51.8 0.9
ADAMAWA 52.0 1.0 47.4 0.8 49.9 0.9
AKWA-IBOM 50.1 0.7 51.4 0.7 51.7 0.7
ANAMBRA 51.6 0.7 51.8 0.7 52.5 0.6
BAUCHI 50.5 1.1 49.4 0.6 49.2 1.1
BAYELSA 49.4 1.0 48.7 1.0 49.0 1.0
BORNO 48.3 0.9 47.8 0.7 48.5 1.0
BENUE 59.5 5.5 46.6 1.3 50.0 1.7
CROSS RIVER 50.2 0.9 51.3 0.7 49.4 0.8
DELTA 52.2 0.7 51.0 0.6 51.7 0.9
EBONYI 53.0 0.8 51.7 0.6 52.6 1.0
EDO 48.2 1.1 51.8 0.8 50.4 1.0
EKITI 50.8 0.8 50.4 0.5 51.6 1.0

180
State Low Moderate High
Mean SE Mean SE Mean SE
ENUGU 51.0 0.8 52.4 0.8 50.9 0.7
GOMBE 45.5 0.7 45.8 0.5 46.4 1.0
IMO 52.5 0.7 51.7 0.6 51.4 1.1
JIGAWA 44.6 1.2 47.4 0.5 47.1 1.5
KADUNA 46.8 1.3 47.5 0.7 45.7 0.7
KANO 49.5 1.1 50.7 1.0 50.0 0.9
KATSINA 48.7 1.4 49.9 0.8 49.0 1.3
KEBBI 53.4 0.8 54.4 0.6 53.9 1.0
KOGI 49.3 0.9 47.8 0.9 53.5 1.2
KWARA 52.5 1.0 50.8 0.6 51.0 0.7
LAGOS 52.0 0.7 51.2 0.7 52.8 0.9
NASARAWA 48.0 1.3 47.3 1.0 47.8 0.9
NIGER 47.8 1.3 48.5 0.6 50.2 2.4
OGUN 51.4 0.7 51.1 0.7 50.3 0.9
ONDO 51.2 0.9 51.2 0.6 48.4 1.3
OSUN 54.2 0.8 52.7 0.5 52.1 0.9
OYO 49.2 0.8 48.9 0.5 48.7 1.5
PLATEAU 48.1 1.4 48.0 0.5 48.5 1.5
RIVERS 50.5 0.6 51.7 0.6 50.4 1.0
SOKOTO 47.3 1.0 45.9 0.6 48.1 1.0
TARABA 46.1 1.0 49.1 0.7 45.8 0.6
YOBE 52.7 1.0 53.8 0.6 49.8 0.9
ZAMFARA 46.1 1.0 50.4 0.6 49.3 1.0
FCT 52.6 1.4 50.6 1.1 51.6 1.1
National 50.4 0.2 49.9 0.1 50.0 0.2
Availability of Learning Materials
The variation of achievement with available learning materials is contained in Table 10.4.2.
At the national level, as level of availability of learning materials increased, achievement also
increased. However, the mean values of 49.3, 50.3 and 50.5 for low, moderate and high level
assistance were not significantly different. The same trend was observed for Abia, Cross
River, Ekiti and Kebbi states among others. In Ogun, Sokoto, and Ondo states, as level of
available facilities increases achievement decreased. When achievement above, the national
averages were considered, there were 22, 20 and 17 states for low, moderate and high level of
availability respectively. From those observations, it would seem that low level of available
teaching materials relates more to high achievement. Further research should examine the use
of materials beyond just availability.

181
Table 10.4.2: Level of Availability of Learning Materials and Achievement in Social
Studies
State Low Moderate High
Mean SE Mean SE Mean SE
ABIA 49.9 1.3 51.4 0.6 53.4 1.4
ADAMAWA 50.2 0.9 48.9 0.7 52.2 2.5
AKWA-IBOM 51.3 0.9 51.1 0.5 49.9 1.1
ANAMBRA 52.5 1.0 51.6 0.5 52.5 0.7
BAUCHI 48.8 0.7 50.0 0.7 52.0 1.4
BAYELSA 49.7 1.0 48.8 0.8 48.4 1.5
BORNO 48.5 0.9 47.9 0.6 50.3 3.0
BENUE 48.0 1.4 52.6 2.3 45.2 2.0
CROSS RIVER 49.7 0.8 50.6 0.6 50.9 1.3
DELTA 48.5 1.0 52.4 0.5 52.1 1.4
EBONYI 52.4 1.0 52.2 0.6 52.1 1.1
EDO 48.0 1.3 51.3 0.7 48.9 1.1
EKITI 50.5 0.7 50.8 0.6 50.9 1.0
ENUGU 51.5 1.2 51.3 0.5 51.8 1.2
GOMBE 46.5 0.6 45.5 0.6 43.7 1.7
IMO 52.4 0.9 52.0 0.5 50.5 1.7
JIGAWA 47.0 0.7 47.1 0.6 49.1 1.4
KADUNA 46.7 0.8 46.6 0.6 46.9 1.7
KANO 50.3 0.8 49.3 0.8 53.4 2.0
KATSINA 49.6 1.1 49.4 0.8 48.0 2.1
KEBBI 53.5 0.7 54.0 0.6 55.1 1.0
KOGI 49.0 1.2 49.7 0.8 49.7 1.2
KWARA 49.6 0.8 51.7 0.5 50.7 1.4
LAGOS 51.9 1.5 52.0 0.5 51.2 0.9
NASARAWA 47.0 0.9 48.2 0.8 47.9 3.8
NIGER 48.1 0.6 49.0 0.9 * *
OGUN 51.4 1.4 51.3 0.5 49.6 1.2
ONDO 51.6 0.7 50.7 0.6 49.8 1.2
OSUN 54.0 1.1 52.7 0.4 54.1 2.0
OYO 48.4 0.7 48.9 0.5 52.1 1.2
PLATEAU 47.9 0.8 48.7 0.7 45.5 1.4
RIVERS 50.8 1.2 50.7 0.5 51.9 1.1
SOKOTO 47.4 1.0 46.6 0.6 46.3 1.1
TARABA 45.6 0.7 46.8 0.6 47.3 2.2
YOBE 51.1 0.7 53.5 0.7 53.9 2.8
ZAMFARA 49.5 0.7 49.5 0.9 47.7 1.4 FCT 50.2 0.6 53.6 1.0 49.5 1.0 National 49.3 0.2 50.3 0.1 50.5 0.2
*Not applicable

182
Out of School Non-Learning Engagement
At the national level, the Engagement in non-learning activities in Table 10.4.3 shows that achievement decreased progressively with higher engagement in non-learning activities, although the mean values of 50.6, 49.9 and 49.7 for the three groups were not significant. With respect to variation among states achievement increased with increase in involvement in non-learning engagement for learners in Lagos (51.7, 51.8 and 52.4), Kano (48.7, 50.6 and 50.7), Sokoto (46.7, 46.8 and 47) and Taraba (46.1, 46.4 and 46.5) states. Achievement decreased from low to moderate for states like Abia, Anambra, Borno and Benue but increased with high engagement, while it increased for states like Bayelsa, Cross River, Edo and Gombe, but decreased with high engagement. However, the variations were not statistically significant. When number of states performing above the national average was examined, there were 17, 21 and 22 for low, moderate and high levels respectively.
Table 10.4.3: Out of School Non Learning Engagements as Related to Achievement in
Social Studies
State Low Moderate High
Mean SE Mean SE Mean SE
ABIA 52.9 0.9 50.8 0.7 51.1 1.0
ADAMAWA 48.7 1.1 49.6 0.9 50.4 0.9
AKWA-IBOM 50.6 0.8 50.8 0.6 51.7 0.8
ANAMBRA 52.9 0.8 51.5 0.6 51.8 0.7
BAUCHI 50.2 0.8 49.9 0.7 48.1 1.1
BAYELSA 47.9 1.1 49.7 0.9 48.5 1.0
BORNO 49.6 1.1 47.8 0.6 48.3 0.9
BENUE 53.4 2.4 46.7 3.8 47.9 1.3
CROSS RIVER 49.9 0.8 50.7 0.7 50.3 0.8
DELTA 51.5 0.8 51.5 0.6 51.4 1.0
EBONYI 52.4 0.8 52.1 0.6 52.3 0.9
EDO 49.9 1.6 50.7 0.7 49.5 1.5
EKITI 52.5 0.8 50.2 0.5 50.9 1.4
ENUGU 52.2 1.0 51.5 0.6 50.7 0.8
GOMBE 44.7 0.9 46.3 0.5 45.2 0.8
IMO 53.9 1.6 51.3 0.5 53.3 0.9
JIGAWA 46.4 0.9 49.1 0.5 47.8 1.0
KADUNA 47.4 0.9 46.4 0.7 46.4 0.8
KANO 48.7 1.0 50.6 1.1 50.7 0.8
KATSINA 48.2 1.0 50.4 1.0 49.5 1.4
KEBBI 54.6 0.7 54.3 0.6 52.0 1.1
KOGI 50.3 1.2 49.2 0.8 49.8 1.1
KWARA 52.0 0.9 51.3 0.6 49.9 0.9
LAGOS 51.7 0.7 51.8 0.8 52.4 1.0
NASARAWA 49.1 1.5 47.1 0.8 49.2 1.1
NIGER 48.3 2.7 48.3 0.5 50.7 2.4
OGUN 52.1 0.7 51.2 0.7 48.8 1.0
ONDO 50.8 1.0 50.7 0.6 51.4 0.9

183
OSUN 54.5 0.8 52.8 0.5 50.8 1.0
OYO 49.6 0.9 48.5 0.5 50.2 1.1
PLATEAU 47.6 1.0 47.3 0.7 50.1 1.0
RIVERS 51.1 0.8 51.3 0.6 49.8 0.9
SOKOTO 46.6 0.8 46.8 0.7 47.0 1.0
TARABA 46.1 1.0 46.4 0.6 46.5 0.7
YOBE 52.8 0.8 53.8 0.7 50.3 1.0
ZAMFARA 50.1 0.8 48.3 0.8 49.4 1.1
FCT 51.2 1.0 53.5 1.4 49.7 1.1
National 50.6 0.2 49.9 0.1 49.7 0.2
Occupation of Father
Nationally, as in Table 10.4.4, the achievement of learners whose fathers are into other occupations (50.6) was the best, next were learners whose fathers work at public or private sector (50.5); the learners of fathers who are into Farming/Fishing (49.2) had the least. Further examination of the results shows that learners whose fathers were farmers in 21 states had mean scores higher than the National average while their counterparts whose fathers were into business and workers in 19 states each, scored above their respective national average. In 15 states, learners whose fathers were classified as others (Artisan, Drivers tailors etc) obtained mean scored above the National average. It is instructive that learners in 10 states, namely, Abia, Delta, Ebonyi, Enugu, Kebbi, Kwara, Lagos, Ogun, Ondo and Osun obtained mean scores above the National averages for the four types of occupation, an indication that none of the four occupational categories had a stronger relationship with achievement. Table 10.4.4: Occupation of Father as Related to Achievement in Social Studies
State Farming/fishing Business/trading
Worker (Public/ private)
Others
Mean SE Mean SE Mean SE Mean SE
ABIA 50.7 1.4 50.9 1.1 51.4 1.3 51.7 0.8
ADAMAWA 51.0 1.1 48.0 1.1 49.5 1.0 51.0 3.1 AKWA-IBOM 52.0 1.0 51.4 0.8 50.5 0.7 49.9 1.2
ANAMBRA 52.0 1.4 52.4 0.7 50.3 1.0 53.1 0.8
BAUCHI 48.5 0.8 49.1 1.0 51.3 0.9 49.8 2.1
BAYELSA 48.2 1.8 47.4 1.5 50.3 1.1 47.8 1.7
BORNO 48.1 0.6 47.0 1.6 48.4 0.9 49.8 4.4
BENUE 55.9 * 48.9 1.3 53.8 2.2 * *
CROSS RIVER 49.5 1.1 52.9 1.0 49.8 0.9 50.0 0.9
DELTA 51.8 0.9 50.6 0.9 52.1 0.6 51.0 2.6
EBONYI 51.3 0.9 52.5 1.0 53.2 0.8 51.4 1.1
EDO 48.8 1.0 50.5 1.3 52.3 1.1 52.2 3.2
EKITI 50.9 0.8 50.2 0.9 51.2 0.8 49.8 1.1
ENUGU 49.7 1.2 52.0 0.7 53.0 0.9 51.7 1.0
GOMBE 44.1 0.7 46.9 0.9 46.0 0.7 47.7 1.3
IMO 51.6 0.9 53.0 0.7 51.2 0.7 48.7 1.6
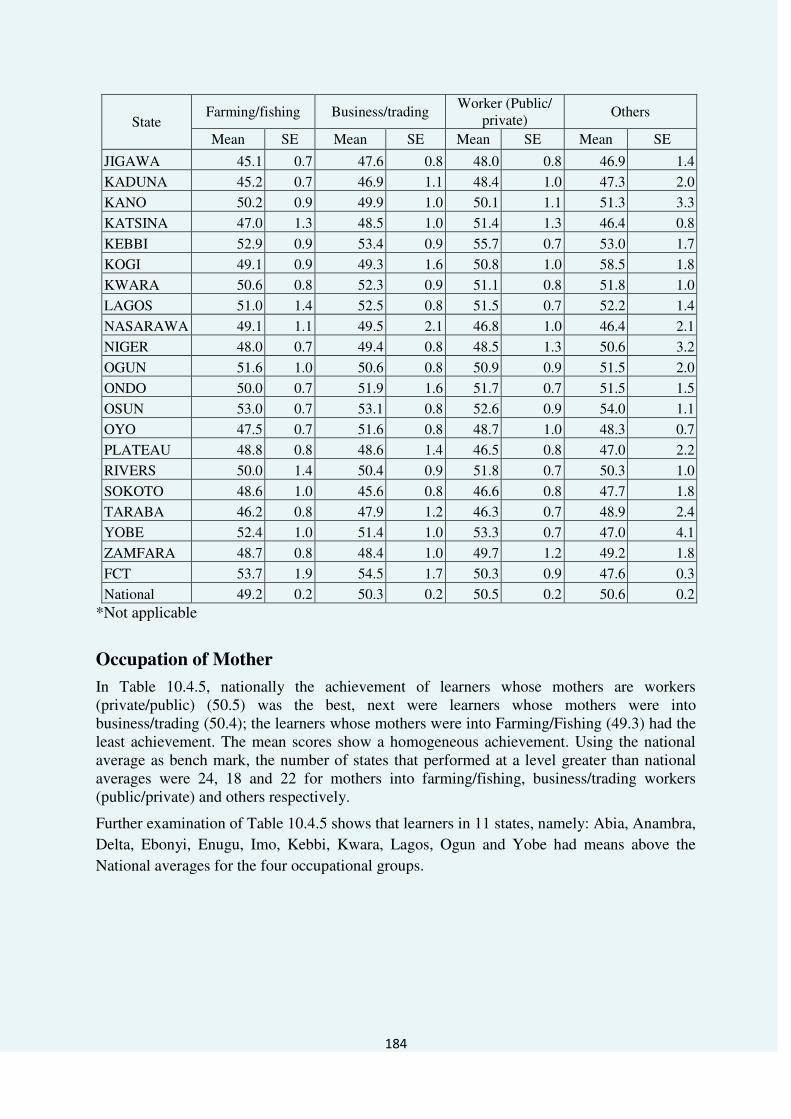
184
State Farming/fishing Business/trading
Worker (Public/ private)
Others
Mean SE Mean SE Mean SE Mean SE
JIGAWA 45.1 0.7 47.6 0.8 48.0 0.8 46.9 1.4
KADUNA 45.2 0.7 46.9 1.1 48.4 1.0 47.3 2.0
KANO 50.2 0.9 49.9 1.0 50.1 1.1 51.3 3.3
KATSINA 47.0 1.3 48.5 1.0 51.4 1.3 46.4 0.8
KEBBI 52.9 0.9 53.4 0.9 55.7 0.7 53.0 1.7
KOGI 49.1 0.9 49.3 1.6 50.8 1.0 58.5 1.8
KWARA 50.6 0.8 52.3 0.9 51.1 0.8 51.8 1.0
LAGOS 51.0 1.4 52.5 0.8 51.5 0.7 52.2 1.4
NASARAWA 49.1 1.1 49.5 2.1 46.8 1.0 46.4 2.1
NIGER 48.0 0.7 49.4 0.8 48.5 1.3 50.6 3.2
OGUN 51.6 1.0 50.6 0.8 50.9 0.9 51.5 2.0
ONDO 50.0 0.7 51.9 1.6 51.7 0.7 51.5 1.5
OSUN 53.0 0.7 53.1 0.8 52.6 0.9 54.0 1.1
OYO 47.5 0.7 51.6 0.8 48.7 1.0 48.3 0.7
PLATEAU 48.8 0.8 48.6 1.4 46.5 0.8 47.0 2.2
RIVERS 50.0 1.4 50.4 0.9 51.8 0.7 50.3 1.0
SOKOTO 48.6 1.0 45.6 0.8 46.6 0.8 47.7 1.8
TARABA 46.2 0.8 47.9 1.2 46.3 0.7 48.9 2.4
YOBE 52.4 1.0 51.4 1.0 53.3 0.7 47.0 4.1
ZAMFARA 48.7 0.8 48.4 1.0 49.7 1.2 49.2 1.8
FCT 53.7 1.9 54.5 1.7 50.3 0.9 47.6 0.3
National 49.2 0.2 50.3 0.2 50.5 0.2 50.6 0.2
*Not applicable
Occupation of Mother
In Table 10.4.5, nationally the achievement of learners whose mothers are workers (private/public) (50.5) was the best, next were learners whose mothers were into business/trading (50.4); the learners whose mothers were into Farming/Fishing (49.3) had the least achievement. The mean scores show a homogeneous achievement. Using the national average as bench mark, the number of states that performed at a level greater than national averages were 24, 18 and 22 for mothers into farming/fishing, business/trading workers (public/private) and others respectively.
Further examination of Table 10.4.5 shows that learners in 11 states, namely: Abia, Anambra,
Delta, Ebonyi, Enugu, Imo, Kebbi, Kwara, Lagos, Ogun and Yobe had means above the
National averages for the four occupational groups.

185
Table 10.4.5: Occupation of Mother as Related to Achievement in Social Studies
State Farming/ fishing
Business/ trading
Worker (Public/private)
Others
Mean SE Mean SE Mean SE Mean SE
ABIA 50.2 1.3 51.7 0.7 53.3 1.7 52.5 1.1
ADAMAWA 49.2 1.3 50.5 1.0 45.9 2.5 49.8 0.9 AKWA-IBOM 51.9 1.4 50.9 0.5 50.3 1.1 58.0 6.7
ANAMBRA 52.5 1.3 51.9 0.6 51.9 0.8 51.5 1.5
BAUCHI 50.8 2.3 48.0 1.1 51.8 1.2 51.1 0.8
BAYELSA 49.9 1.3 50.1 1.1 45.6 1.7 45.8 1.4
BORNO 47.0 0.7 48.2 1.1 48.4 1.8 48.2 2.5
BENUE 46.0 2.6 50.4 2.0 48.2 2.7 39.2 * CROSS RIVER 50.6 1.3 49.7 0.8 49.4 0.9 51.7 1.4
DELTA 50.0 0.9 51.7 0.7 52.2 0.7 51.6 2.1
EBONYI 50.3 1.3 52.7 0.7 53.0 1.0 52.1 1.1
EDO 48.9 1.2 50.5 0.9 51.8 1.6 52.2 3.7
EKITI 50.6 1.8 50.2 0.6 51.2 0.8 51.7 2.4
ENUGU 51.1 1.0 51.2 0.6 52.5 1.4 52.7 1.4
GOMBE 45.3 0.9 46.6 0.9 46.3 0.9 44.1 0.9
IMO 50.3 1.1 51.2 0.6 53.4 0.9 51.3 1.3
JIGAWA 51.0 1.7 47.8 0.8 48.4 1.4 46.0 0.7
KADUNA 45.5 1.0 46.5 0.9 50.1 1.4 45.7 1.2
KANO 56.2 3.4 49.2 1.3 43.5 3.9 50.4 0.7
KATSINA * * 51.7 1.3 54.0 3.2 45.9 1.6
KEBBI 49.9 1.0 54.1 0.7 52.8 1.8 56.0 0.8
KOGI 45.8 1.1 50.1 0.8 51.7 1.6 55.5 2.0
KWARA 52.5 1.4 51.4 0.6 52.0 1.2 51.3 1.5
LAGOS 49.5 2.3 51.9 0.6 52.7 1.1 50.1 1.5
NASARAWA 46.1 1.0 47.1 1.1 47.4 2.2 48.3 2.5
NIGER 52.8 1.0 46.8 0.7 48.3 1.4 46.3 1.9
OGUN 51.6 2.5 50.7 0.6 52.0 1.1 51.7 1.7
ONDO 50.8 1.1 50.3 0.7 52.0 0.8 52.2 2.0
OSUN 53.7 2.1 52.7 0.5 50.5 1.4 56.9 1.4
OYO 49.1 0.9 49.4 0.7 49.7 0.9 48.9 0.7
PLATEAU 48.9 0.9 47.7 0.9 44.8 1.1 48.1 2.9 RIVERS 51.1 1.6 51.1 0.6 49.5 1.2 50.9 2.2
SOKOTO 50.1 3.0 45.7 0.9 50.1 1.9 46.6 0.8 TARABA 48.6 1.0 46.4 0.8 44.3 1.2 47.3 2.0 YOBE 54.1 2.2 52.6 1.0 54.3 1.6 54.6 1.0 ZAMFARA 48.0 2.6 48.7 1.0 50.6 2.8 48.8 0.8 FCT 53.9 2.0 52.3 0.9 49.1 1.4 53.9 5.7
National 49.3 0.2 50.4 0.1 50.5 0.2 49.8 0.2
*Not applicable

186
Means of Going to School
As can be seen in Table 10.4.6 National average of achievement range from 49.3 (Canoe) to
52.3 (Donkey). Interestingly, both means of going to school were available in five and
thirteen states respectively. Data for the states shows that learners in 21, 18, 14 and 15 states
had mean scores higher than the National averages for walking, donkey, canoe,
Okada/Bicycle/Tricycle, Taxi/Bus and family car respectively. The top three mean scores are
64.9 (Yobe), 62.8 (Ogun) and 57.3 (Edo). It would seen that going to school by means of
canoe had a strong relationship with achievement, for learners in Ogun state, their
counterparts in Yobe and Edo states, going to school by means of Taxi/Bus exerted a stronger
relationship on achievement.
Table 10.4.6: Normal Means of Going to School as Related to Performance in Social
Studies
State
Walking
Donkey
Canoe
Okada/Bicycle/Tricycle
Taxi/Bus
Family Car
Mean SE Mean SE Mean SE Mean SE Mean SE Mean SE
Abia 51.6 0.6 * * * * 50.9 1.6 52.8 2.1 49.9 2.5
Adamawa 49.9 0.6 55.0 0.1 * * 46.5 1.4 * * 51.8 3.1
Akwa-Ibom 51.1 0.5 51.5 . * * 50.7 1.2 48.7 1.2 49.7 2.3
Anambra 51.9 0.5 * * * * 52.4 1.0 49.9 1.3 53.2 1.5
Bauchi 50.0 0.5 * * * * 45.4 1.9 48.0 3.7 50.0 1.7
Bayelsa 49.0 0.6 * * * * 51.9 2.7 48.0 2.2 49.2 6.3
Borno 48.3 0.5 * * 41.4 . 48.7 * 46.0 1.9 46.0 2.7
Benue 51.5 1.7 * * * * 50.0 * 46.9 2.3 41.9 2.6
Cross River 50.6 0.5 * * 47.6 4.2 45.9 2.4 47.5 1.4 51.6 1.6
Delta 51.7 0.5 * * * * 51.5 1.6 47.8 2.4 52.3 1.0
Ebonyi 52.3 0.5 * * * * 52.5 1.9 49.1 1.4 52.5 2.0
Edo 50.4 0.6 * * * * * * 57.3 * 49.0 4.1
Ekiti 50.5 0.5 * * * * 54.3 2.2 50.6 1.5 50.4 1.2
Enugu 51.3 0.5 * * * * 52.9 2.6 52.2 1.6 52.0 1.5
Gombe 45.5 0.4 54.6 2.2 54.2 2.0 49.2 2.2 47.1 1.9 45.6 1.3
Imo 51.6 0.4 * * * * 54.3 1.3 54.5 3.1 53.5 2.2
Jigawa 47.0 0.5 * * 55.2 * 46.4 1.9 50.1 1.5 49.8 1.3
Kaduna 46.9 0.5 * * * * 45.7 1.3 43.3 2.4 46.3 2.9
Kano 50.2 0.6 * * 39.8 * 47.7 2.0 51.2 2.7 * *
Katsina 49.0 0.7 * * * * 50.5 2.2 45.8 5.7 56.5 4.2
Kebbi 54.3 0.5 * * * * 52.4 1.5 52.5 3.6 54.1 1.7
Kogi 49.8 0.7 * * * * 49.9 1.8 45.8 1.2 52.1 1.1
Kwara 51.4 0.5 * * 52.1 * 49.9 1.3 52.6 2.1 49.5 1.0
Lagos 52.0 0.6 * * 51.4 2.5 51.0 1.2 52.3 0.9 51.2 1.4
Nasarawa 47.7 0.7 * * 47.8 1.3 46.8 1.5 49.6 3.8 48.6 2.5
Niger 49.1 0.6 41.6 * 44.6 * 52.4 2.1 51.8 1.4 52.1 1.0
Ogun 51.4 0.5 * * 62.8 * 47.9 1.0 52.9 1.9 49.3 1.5
Ondo 51.1 0.5 * * * * 51.0 3.0 50.1 1.4 50.0 1.4
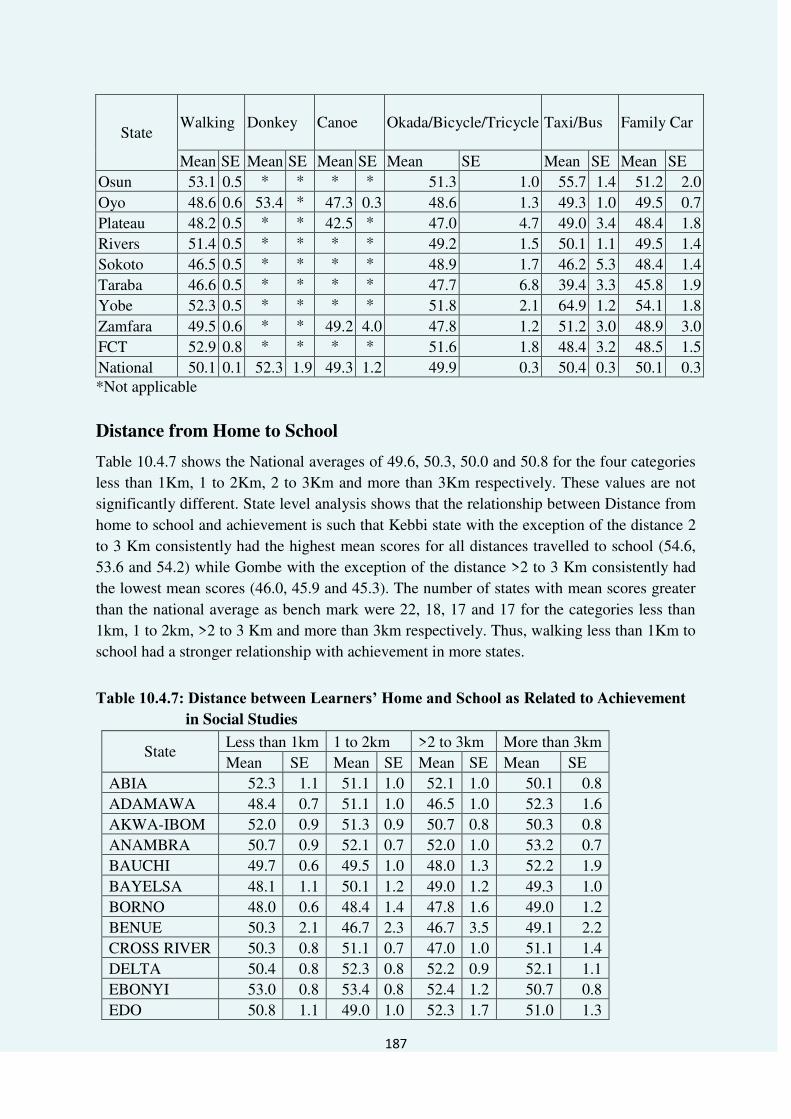
187
State
Walking
Donkey
Canoe
Okada/Bicycle/Tricycle
Taxi/Bus
Family Car
Mean SE Mean SE Mean SE Mean SE Mean SE Mean SE
Osun 53.1 0.5 * * * * 51.3 1.0 55.7 1.4 51.2 2.0
Oyo 48.6 0.6 53.4 * 47.3 0.3 48.6 1.3 49.3 1.0 49.5 0.7
Plateau 48.2 0.5 * * 42.5 * 47.0 4.7 49.0 3.4 48.4 1.8
Rivers 51.4 0.5 * * * * 49.2 1.5 50.1 1.1 49.5 1.4
Sokoto 46.5 0.5 * * * * 48.9 1.7 46.2 5.3 48.4 1.4
Taraba 46.6 0.5 * * * * 47.7 6.8 39.4 3.3 45.8 1.9
Yobe 52.3 0.5 * * * * 51.8 2.1 64.9 1.2 54.1 1.8
Zamfara 49.5 0.6 * * 49.2 4.0 47.8 1.2 51.2 3.0 48.9 3.0
FCT 52.9 0.8 * * * * 51.6 1.8 48.4 3.2 48.5 1.5
National 50.1 0.1 52.3 1.9 49.3 1.2 49.9 0.3 50.4 0.3 50.1 0.3 *Not applicable
Distance from Home to School
Table 10.4.7 shows the National averages of 49.6, 50.3, 50.0 and 50.8 for the four categories
less than 1Km, 1 to 2Km, 2 to 3Km and more than 3Km respectively. These values are not
significantly different. State level analysis shows that the relationship between Distance from
home to school and achievement is such that Kebbi state with the exception of the distance 2
to 3 Km consistently had the highest mean scores for all distances travelled to school (54.6,
53.6 and 54.2) while Gombe with the exception of the distance >2 to 3 Km consistently had
the lowest mean scores (46.0, 45.9 and 45.3). The number of states with mean scores greater
than the national average as bench mark were 22, 18, 17 and 17 for the categories less than
1km, 1 to 2km, >2 to 3 Km and more than 3km respectively. Thus, walking less than 1Km to
school had a stronger relationship with achievement in more states.
Table 10.4.7: Distance between Learners’ Home and School as Related to Achievement
in Social Studies
State Less than 1km 1 to 2km >2 to 3km More than 3km
Mean SE Mean SE Mean SE Mean SE
ABIA 52.3 1.1 51.1 1.0 52.1 1.0 50.1 0.8
ADAMAWA 48.4 0.7 51.1 1.0 46.5 1.0 52.3 1.6
AKWA-IBOM 52.0 0.9 51.3 0.9 50.7 0.8 50.3 0.8
ANAMBRA 50.7 0.9 52.1 0.7 52.0 1.0 53.2 0.7
BAUCHI 49.7 0.6 49.5 1.0 48.0 1.3 52.2 1.9
BAYELSA 48.1 1.1 50.1 1.2 49.0 1.2 49.3 1.0
BORNO 48.0 0.6 48.4 1.4 47.8 1.6 49.0 1.2
BENUE 50.3 2.1 46.7 2.3 46.7 3.5 49.1 2.2
CROSS RIVER 50.3 0.8 51.1 0.7 47.0 1.0 51.1 1.4
DELTA 50.4 0.8 52.3 0.8 52.2 0.9 52.1 1.1
EBONYI 53.0 0.8 53.4 0.8 52.4 1.2 50.7 0.8
EDO 50.8 1.1 49.0 1.0 52.3 1.7 51.0 1.3
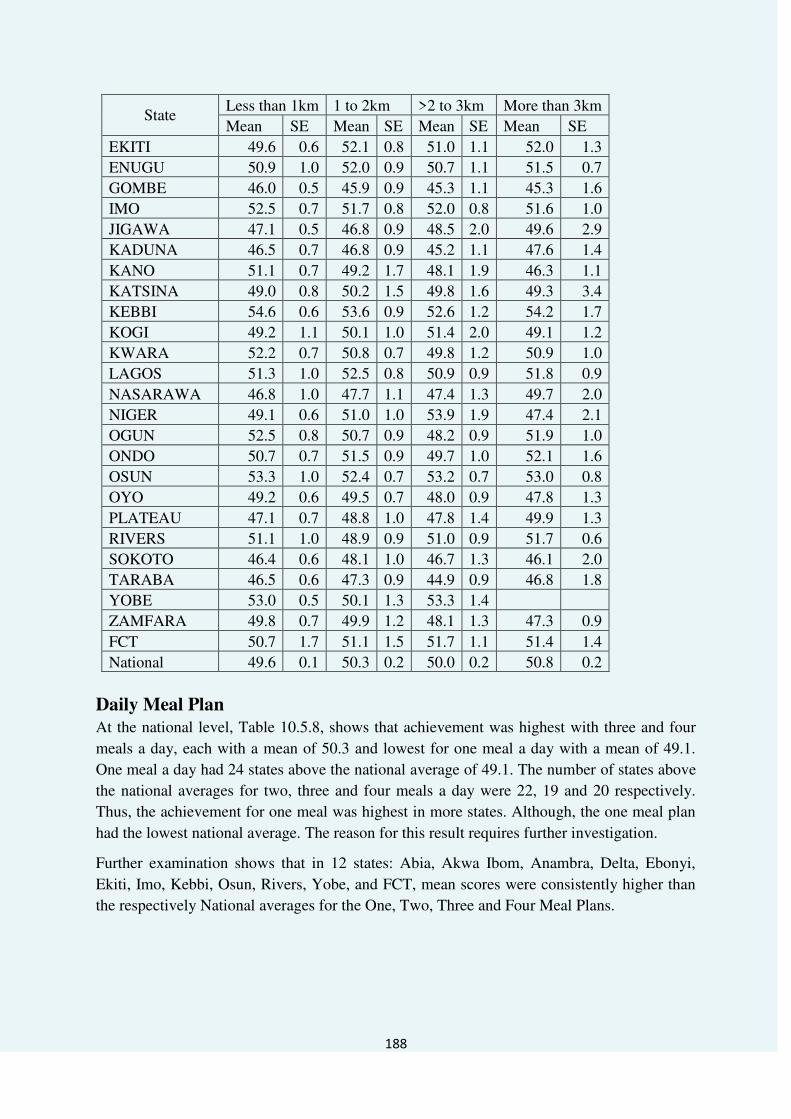
188
State Less than 1km 1 to 2km >2 to 3km More than 3km
Mean SE Mean SE Mean SE Mean SE
EKITI 49.6 0.6 52.1 0.8 51.0 1.1 52.0 1.3
ENUGU 50.9 1.0 52.0 0.9 50.7 1.1 51.5 0.7
GOMBE 46.0 0.5 45.9 0.9 45.3 1.1 45.3 1.6
IMO 52.5 0.7 51.7 0.8 52.0 0.8 51.6 1.0
JIGAWA 47.1 0.5 46.8 0.9 48.5 2.0 49.6 2.9
KADUNA 46.5 0.7 46.8 0.9 45.2 1.1 47.6 1.4
KANO 51.1 0.7 49.2 1.7 48.1 1.9 46.3 1.1
KATSINA 49.0 0.8 50.2 1.5 49.8 1.6 49.3 3.4
KEBBI 54.6 0.6 53.6 0.9 52.6 1.2 54.2 1.7
KOGI 49.2 1.1 50.1 1.0 51.4 2.0 49.1 1.2
KWARA 52.2 0.7 50.8 0.7 49.8 1.2 50.9 1.0
LAGOS 51.3 1.0 52.5 0.8 50.9 0.9 51.8 0.9
NASARAWA 46.8 1.0 47.7 1.1 47.4 1.3 49.7 2.0
NIGER 49.1 0.6 51.0 1.0 53.9 1.9 47.4 2.1
OGUN 52.5 0.8 50.7 0.9 48.2 0.9 51.9 1.0
ONDO 50.7 0.7 51.5 0.9 49.7 1.0 52.1 1.6
OSUN 53.3 1.0 52.4 0.7 53.2 0.7 53.0 0.8
OYO 49.2 0.6 49.5 0.7 48.0 0.9 47.8 1.3
PLATEAU 47.1 0.7 48.8 1.0 47.8 1.4 49.9 1.3
RIVERS 51.1 1.0 48.9 0.9 51.0 0.9 51.7 0.6
SOKOTO 46.4 0.6 48.1 1.0 46.7 1.3 46.1 2.0
TARABA 46.5 0.6 47.3 0.9 44.9 0.9 46.8 1.8
YOBE 53.0 0.5 50.1 1.3 53.3 1.4
ZAMFARA 49.8 0.7 49.9 1.2 48.1 1.3 47.3 0.9
FCT 50.7 1.7 51.1 1.5 51.7 1.1 51.4 1.4
National 49.6 0.1 50.3 0.2 50.0 0.2 50.8 0.2
Daily Meal Plan
At the national level, Table 10.5.8, shows that achievement was highest with three and four
meals a day, each with a mean of 50.3 and lowest for one meal a day with a mean of 49.1.
One meal a day had 24 states above the national average of 49.1. The number of states above
the national averages for two, three and four meals a day were 22, 19 and 20 respectively.
Thus, the achievement for one meal was highest in more states. Although, the one meal plan
had the lowest national average. The reason for this result requires further investigation. Further examination shows that in 12 states: Abia, Akwa Ibom, Anambra, Delta, Ebonyi,
Ekiti, Imo, Kebbi, Osun, Rivers, Yobe, and FCT, mean scores were consistently higher than
the respectively National averages for the One, Two, Three and Four Meal Plans.

189
Table 10.4.8: Number of Meal Daily as Related to Achievement in Social Studies
State Once Twice Three times Four times
Mean SE Mean SE Mean SE Mean SE
ABIA 55.5 3.9 50.9 1.2 51.5 0.6 51.0 2.5
ADAMAWA 49.8 2.4 47.4 1.3 50.3 0.7 48.6 2.7
AKWA-IBOM 55.3 2.9 51.1 1.2 50.4 0.5 53.6 1.2
ANAMBRA 51.6 2.5 51.5 0.7 52.2 0.5 50.8 1.6
BAUCHI * * 50.5 1.9 49.3 0.5 51.5 1.8
BAYELSA 51.8 2.9 49.7 1.5 48.6 0.7 51.8 2.1
BORNO 47.4 2.6 49.3 1.3 48.0 0.6 49.1 2.5
BENUE 57.0 2.8 49.1 2.5 47.1 1.3 * *
CROSS RIVER 52.2 2.5 49.5 1.1 50.8 0.5 49.1 1.9
DELTA 49.3 2.2 52.4 0.9 51.4 0.5 51.9 1.8
EBONYI 52.9 4.1 53.2 1.2 51.9 0.5 53.4 2.7
EDO 51.2 2.1 47.5 1.5 50.6 0.7 54.3 2.5
EKITI 49.5 1.0 51.2 1.2 50.9 0.6 51.4 1.2
ENUGU 49.3 4.3 53.5 1.3 51.1 0.5 50.3 1.8
GOMBE 46.7 1.0 45.7 0.9 45.9 0.6 44.6 1.6
IMO 50.2 1.4 51.8 1.2 52.0 0.5 56.4 *
JIGAWA 50.4 1.7 46.0 0.9 47.1 0.5 49.3 2.7
KADUNA 44.7 1.9 44.7 1.2 47.5 0.5 43.2 1.2
KANO 52.1 1.9 46.5 2.3 50.0 0.6 49.9 3.7
KATSINA 45.5 4.5 52.9 2.9 49.2 0.7 50.8 1.9
KEBBI 52.4 3.2 51.2 1.3 54.1 0.5 54.4 1.3
KOGI 49.9 1.7 48.3 1.3 49.8 0.7 55.1 5.6
KWARA 46.8 2.1 49.6 1.3 51.5 0.5 48.2 0.9
LAGOS 49.2 2.5 49.5 1.1 52.2 0.5 51.3 1.6
NASARAWA 42.7 2.4 46.0 2.2 47.9 0.6 52.0 2.2
NIGER 47.7 0.7 50.6 1.6 48.7 0.9 43.4 3.8
OGUN 54.0 3.0 51.6 1.5 51.4 0.5 47.9 1.1
ONDO 52.6 1.1 49.6 1.5 50.6 0.6 50.8 1.8
OSUN 49.4 6.5 51.7 1.1 53.2 0.4 52.3 1.4
OYO 48.5 0.7 49.1 0.8 49.2 0.6 49.5 2.7
PLATEAU 48.7 1.9 48.5 0.8 47.9 0.7 46.0 2.7
RIVERS 49.2 1.7 50.1 1.1 51.2 0.5 51.3 0.9
SOKOTO 48.1 2.5 46.7 1.0 46.6 0.6 47.1 1.6
TARABA 45.8 1.1 47.9 0.7 45.6 0.6 44.4 2.0
YOBE 59.7 1.9 52.4 0.9 52.0 0.6 53.6 2.8
ZAMFARA 46.3 1.4 47.3 1.7 50.1 0.6 50.1 2.5
FCT 49.8 * 53.3 2.1 51.3 0.8 50.5 1.9
National 49.1 0.3 49.4 0.2 50.3 0.1 50.3 0.3 *Not applicable
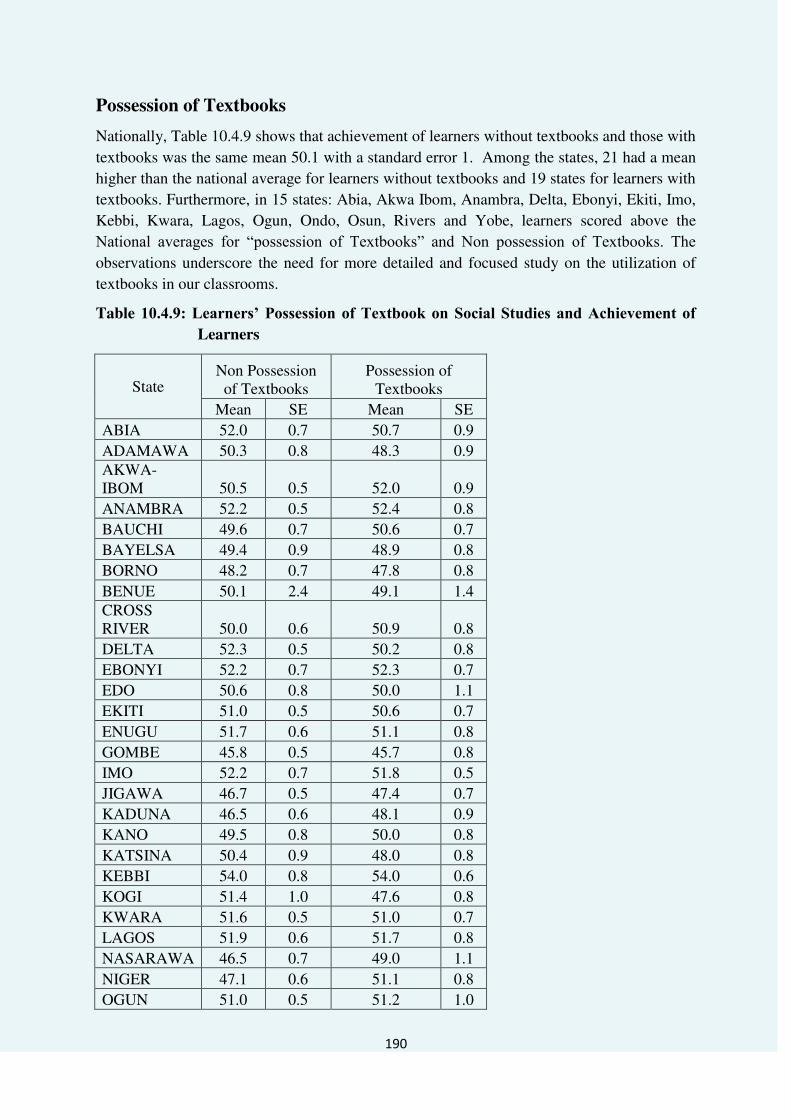
190
Possession of Textbooks
Nationally, Table 10.4.9 shows that achievement of learners without textbooks and those with
textbooks was the same mean 50.1 with a standard error 1. Among the states, 21 had a mean
higher than the national average for learners without textbooks and 19 states for learners with
textbooks. Furthermore, in 15 states: Abia, Akwa Ibom, Anambra, Delta, Ebonyi, Ekiti, Imo,
Kebbi, Kwara, Lagos, Ogun, Ondo, Osun, Rivers and Yobe, learners scored above the
National averages for “possession of Textbooks” and Non possession of Textbooks. The observations underscore the need for more detailed and focused study on the utilization of
textbooks in our classrooms.
Table 10.4.9: Learners’ Possession of Textbook on Social Studies and Achievement of Learners
State Non Possession of Textbooks
Possession of Textbooks
Mean SE Mean SE
ABIA 52.0 0.7 50.7 0.9
ADAMAWA 50.3 0.8 48.3 0.9 AKWA-IBOM 50.5 0.5 52.0 0.9
ANAMBRA 52.2 0.5 52.4 0.8
BAUCHI 49.6 0.7 50.6 0.7
BAYELSA 49.4 0.9 48.9 0.8
BORNO 48.2 0.7 47.8 0.8
BENUE 50.1 2.4 49.1 1.4 CROSS RIVER 50.0 0.6 50.9 0.8
DELTA 52.3 0.5 50.2 0.8
EBONYI 52.2 0.7 52.3 0.7
EDO 50.6 0.8 50.0 1.1
EKITI 51.0 0.5 50.6 0.7
ENUGU 51.7 0.6 51.1 0.8
GOMBE 45.8 0.5 45.7 0.8
IMO 52.2 0.7 51.8 0.5
JIGAWA 46.7 0.5 47.4 0.7
KADUNA 46.5 0.6 48.1 0.9
KANO 49.5 0.8 50.0 0.8
KATSINA 50.4 0.9 48.0 0.8
KEBBI 54.0 0.8 54.0 0.6
KOGI 51.4 1.0 47.6 0.8
KWARA 51.6 0.5 51.0 0.7
LAGOS 51.9 0.6 51.7 0.8
NASARAWA 46.5 0.7 49.0 1.1
NIGER 47.1 0.6 51.1 0.8
OGUN 51.0 0.5 51.2 1.0

191
ONDO 50.3 0.8 51.3 0.6
OSUN 52.9 0.5 53.7 0.9
OYO 49.2 0.5 48.3 0.7
PLATEAU 48.3 0.7 48.4 0.8
RIVERS 50.5 0.6 51.4 0.6
SOKOTO 47.8 0.6 44.9 0.7
TARABA 47.1 0.6 45.9 0.7
YOBE 50.3 0.6 54.1 0.7
ZAMFARA 50.0 0.7 48.5 0.8
FCT 52.8 0.8 48.9 1.2
National 50.1 0.1 50.1 0.1
Liking Teachers
At the National level, achievement of learners who did not like Teachers (50.0) and learners
who liked their teachers (50.1) are about the same as can be seen in Table 10.4.10. However,
learners in 13 states did not indicate dislike for teachers. Among the states, 9 had a mean
greater than national average for learners who do not like their teachers and 19 states had
mean greater than national average for learners who like their teachers. Further examination
of the results revealed that the top three mean scores in Table 10.4.10 are associated with
learners not Liking Teachers in the following states: Anambra (64.7), Cross River (61.2) and
FCT (56.1). The data seem to suggest that liking Teachers has a stronger relationship on
achievement of learners in more states.
Table 10.4.10: Liking of Teacher as Related to Achievement in Social Studies
State Not liking teacher Liking teacher
Mean SE Mean SE
ABIA * * 51.3 0.5
ADAMAWA 53.7 2.8 49.7 0.6
AKWA-IBOM * * 50.9 0.4
ANAMBRA 64.7 * 52.0 0.4
BAUCHI 45.0 6.2 49.6 0.5
BAYELSA * * 49.0 0.6
BORNO * * 48.1 0.5
BENUE 40.2 * 49.0 1.1
CROSS RIVER 61.2 * 50.4 0.5
DELTA * * 51.5 0.4
EBONYI 50.2 1.6 52.3 0.4
EDO 49.3 7.3 50.5 0.6
EKITI * * 50.8 0.4
ENUGU 52.7 6.6 51.5 0.4
GOMBE 44.9 * 45.8 0.5
IMO * * 51.9 0.4
JIGAWA 48.3 2.0 47.0 0.4
KADUNA * * 46.8 0.5

192
State Not liking teacher Liking teacher
Mean SE Mean SE
KANO 50.7 * 50.1 0.6
KATSINA * * 49.3 0.7
KEBBI * * 53.9 0.5
KOGI * * 49.5 0.6
KWARA 49.9 * 51.2 0.4
LAGOS * * 52.0 0.5
NASARAWA 42.1 * 47.5 0.6
NIGER 53.0 1.3 47.8 0.5
OGUN 44.4 4.4 51.2 0.5
ONDO * * 51.0 0.5
OSUN 52.6 2.9 53.0 0.4
OYO 42.3 0.9 49.1 0.4
PLATEAU 48.7 2.6 48.2 0.5
RIVERS 49.7 1.4 51.0 0.4
SOKOTO 49.1 3.8 46.6 0.5
TARABA 48.2 * 46.5 0.4
YOBE 48.1 * 52.5 0.5
ZAMFARA 49.9 5.8 49.5 0.5
FCT 56.1 * 51.3 0.7
National 50.0 0.8 50.1 0.1
*Not applicable
Liking Schooling
As can be seen in Table 10.4.11, learners in 16 states withheld their views on dislike for
schooling. The national data set shows that the average score for learners who did not have
liking for schooling was 49.3 while that of their counterpart who liked schooling was 50.2.
The range of mean scores for liking schooling is from 45.7 percent (Gombe) to 54.0 percent
(Kebbi). Whereas for not liking schooling, the range is 36.6 (Gombe) to 65.2 (Kebbi).
Furthermore, the top five mean scores in Table 10.4.11 are associated with not liking
schooling in the following states: Kebbi (65.2), Kogi (62.1), Kwara (58.9 percent), Anambra
(58.7) and Katsina (57.1). Among the states, 9 had mean scores greater than the national
average for learners who do not like schooling and 20 states had mean scores greater than the
national average for learners who like schooling. The results reveal two discernible patterns:
(1) the top five mean scores are associated with not Liking schooling and (2) 20 states with
mean scores above the National average for Liking schooling.

193
Table 10.4.11: Liking Schooling as Related to Achievement in Social Studies
State Not liking Schooling Liking Schooling
Mean SE Mean SE
ABIA 38.9 2.1 51.6 0.5
ADAMAWA * * 49.7 0.6 AKWA-IBOM * * 50.9 0.4
ANAMBRA 58.7 7.4 51.8 0.4
BAUCHI 44.3 2.5 50.4 0.5
BAYELSA 48.7 * 49.0 0.6
BORNO * * 48.2 0.5
BENUE 40.2 2.3 49.2 1.1 CROSS RIVER 45.0 2.6 50.4 0.5
DELTA 45.2 2.9 51.5 0.4
EBONYI * * 52.2 0.5
EDO 38.3 * 50.5 0.6
EKITI * * 50.9 0.4
ENUGU * * 51.3 0.4
GOMBE 36.6 * 45.7 0.5
IMO * * 51.9 0.4
JIGAWA 50.5 3.0 47.1 0.5
KADUNA * * 46.9 0.5
KANO * * 49.9 0.6
KATSINA 57.1 * 49.4 0.7
KEBBI 65.2 * 54.0 0.4
KOGI 62.1 * 49.6 0.6
KWARA 58.9 * 51.3 0.4
LAGOS * * 51.4 0.5
NASARAWA * * 47.5 0.6
NIGER 53.4 2.5 48.1 0.5
OGUN 44.8 * 51.1 0.5
ONDO 53.6 4.2 50.8 0.5
OSUN * * 53.1 0.4
OYO 41.6 * 48.9 0.4
PLATEAU 44.8 * 48.1 0.5
RIVERS * * 51.0 0.4
SOKOTO 47.0 2.1 47.5 0.5
TARABA * * 46.4 0.4
YOBE * * 52.5 0.5
ZAMFARA 52.0 0.1 49.7 0.5
FCT * * 51.3 0.7
National 49.3 1.2 50.2 0.1 *Not applicable

194
Observations and Challenges
Assistance with homework is expected to enhance performance. The fact that as this increases that achievement diminishes indicates that something must be wrong somewhere. Thus the quality of assistance may need to be examined rather than how much of it was available.
Liking of school and teacher serves motivational purposes and if the level is high the achievement should be expected to be high also. The case in this study did not show substantial differences and so if the benefits are to be achieved, the learners should be encouraged to like school through humanising of teaching and learning from their entry into school.
Textbooks possession not enhancing achievement seems to imply that there is something being done by teachers that do not make this to happen. What exactly is this thing?
Mode of transportation, type of residence, occupation of parents did not seem to show a definitive effect on achievement. One can only hazard some guesses.
The achievements in the three objectives are contained in Table 10.8. Learners in Kebbi state consistently performed better than the other states however, learners in Gombe consistently performed lower than the other states in the three objectives (knowledge, comprehension and higher order).
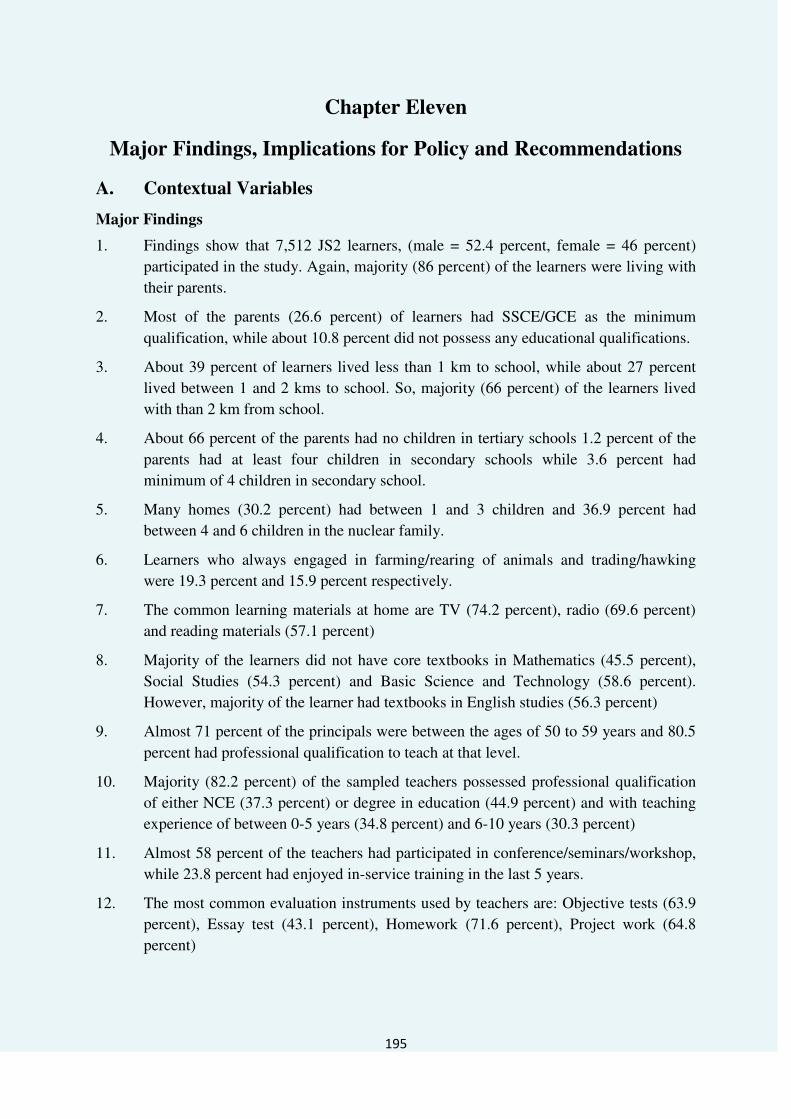
195
Chapter Eleven
Major Findings, Implications for Policy and Recommendations
A. Contextual Variables
Major Findings
1. Findings show that 7,512 JS2 learners, (male = 52.4 percent, female = 46 percent)
participated in the study. Again, majority (86 percent) of the learners were living with
their parents.
2. Most of the parents (26.6 percent) of learners had SSCE/GCE as the minimum
qualification, while about 10.8 percent did not possess any educational qualifications.
3. About 39 percent of learners lived less than 1 km to school, while about 27 percent
lived between 1 and 2 kms to school. So, majority (66 percent) of the learners lived
with than 2 km from school.
4. About 66 percent of the parents had no children in tertiary schools 1.2 percent of the
parents had at least four children in secondary schools while 3.6 percent had
minimum of 4 children in secondary school.
5. Many homes (30.2 percent) had between 1 and 3 children and 36.9 percent had
between 4 and 6 children in the nuclear family.
6. Learners who always engaged in farming/rearing of animals and trading/hawking
were 19.3 percent and 15.9 percent respectively.
7. The common learning materials at home are TV (74.2 percent), radio (69.6 percent)
and reading materials (57.1 percent)
8. Majority of the learners did not have core textbooks in Mathematics (45.5 percent),
Social Studies (54.3 percent) and Basic Science and Technology (58.6 percent).
However, majority of the learner had textbooks in English studies (56.3 percent)
9. Almost 71 percent of the principals were between the ages of 50 to 59 years and 80.5
percent had professional qualification to teach at that level.
10. Majority (82.2 percent) of the sampled teachers possessed professional qualification
of either NCE (37.3 percent) or degree in education (44.9 percent) and with teaching
experience of between 0-5 years (34.8 percent) and 6-10 years (30.3 percent)
11. Almost 58 percent of the teachers had participated in conference/seminars/workshop,
while 23.8 percent had enjoyed in-service training in the last 5 years.
12. The most common evaluation instruments used by teachers are: Objective tests (63.9
percent), Essay test (43.1 percent), Homework (71.6 percent), Project work (64.8
percent)

196
13. Many of the teachers need some help in management practice and co-curricular
activities especially in management of children with disciplinary case and with health
problems
14. About 77 percent of the schools run morning system only.
15. Most of the parents either attended PTA meetings very often (43.6 percent) or often
(35.1 percent).
16. Parents (77.6 percent) levies other charges regularly
17. More than 70 percent of the schools were not fenced.
18. The dropout rates in Zamfara (52.37 percent) and Rivers (35.02 percent) were very
high but moderate in all other states.
19. The recommended textbooks were the only common instructional materials in
schools.
20. Supply of water was guaranteed in most of the schools with schools relying on
borehole (37 percent), well (28.9 percent)
21. Refuse disposal facilities were available only in 26 percent of the schools.
22. Most of the learners (83.6 percent) liked English studies, while 26 percent liked
Mathematics. Learners (29.5 percent) did not like the subjects because they were
difficult.
23. Majority of the learners (93.3 percent) liked their teachers, because the teachers taught
well (29 percent)
24. About 90.8 percent of the learners liked schooling.
197
Implications for Policy
The implications of the results of the survey for policy and practice for this class are
presented with respect to the three sections in this report: Learners‟ Home and Support;
Teachers in the School; and Schools and the Community.
Learners’ Home and Support In this section, a number of variables were examined in the learners‟ home and support,
which included the socio-demographic characteristics of the learners and the parents, such as
the educational qualification of the parents, their employment status, family size and average
income.
Socio-Demographic Characteristics of Parents
The report of the survey indicated that some parents had government jobs, while many did
not have paid jobs. Majority of the parents were self-employed and the incomes received
were not sufficient to cater for all their children. The level of illiteracy among the parents was
also high, as up to 10.8 percent of the parents did not receive any formal education (not even
primary school). This must have resulted into the level of poverty in terms of their
accommodation/where they live in, as the report showed that up to 13.5 percent of the parents
lived in one-room apartments with their children. Moreover, up to 36.9 percent of the parents
indicated that they had four to six children. The number of children in a family has
implications on its type of human environment, social interactions and the utilisation and
diffusion of its material resources. Where families are not well endowed with material
resources, the homes that have fewer children are likely to be less deprived than those with a
larger number of children.
Implication for Policy and Practice: The indices imply clearly that governments and other
national bodies responsible must evolve policies that focus on the empowerment of parents,
in order to enable them to support the learning of their children in school. Parents engaged in
self-employed jobs should be empowered financially to promote their work. Similarly,
governments should intensify efforts to establish more adult education centres in all localities
across the country and encourage parents of the learners to enrol, in order to improve
themselves. They should also be meaningfully sensitised about the importance of education.
Concerning the environment, governments and the relevant national bodies should make a
fresh effort to uphold more the existing policies on personal hygiene and the social life of
families, in order not to compromise the overall health conditions of communities. One
effective way to achieve this is for families to be empowered through an affordable housing

198
scheme. On the whole, national policies, like scholarships and provision of learning materials
at subsidised costs, should consciously be promoted, in order to render support to learners
from low-income homes, who have many children to enrol their children in school.
Support from Home
The report of the survey confirmed that the learners had received different types of support
from their parents. These included the provision of textbooks in the core subjects, meals,
school and transportation to help the learners to manage the distance between their homes and
the school. Thus, although UBEC supplied textbooks to the schools in the four core subjects,
the report showed that less than half of the learners had the required books in Mathematics,
Basic Science and Technology and Social Studies. However, more than half of the learners
were found to have textbooks in English Studies.
Implications for Policy and Practice: (a) With regard to the provision of textbooks to
schools, the UBEC should effectively monitor the distribution of the books, as well as enact a
policy on the minimum life span of the books supplied, so that schools can surcharge learners
who misplace or mutilate their books. In the case of educational activities, the survey report
had revealed that two important educational facilities (computers and internet) were absent in
most of the learners‟ homes, largely because of the cost of purchase and maintenance; and,
possibly, owing to the lack of awareness among the parents of the support the facilities give
to the learners, or other difficulties in operating them, like regular electricity supply.
Governments and private proprietors should, thus, enact due policies to ensure that such
facilities are made accessible to all learners in the schools for the benefit of all; (b) As for
meals, governments at all levels should endeavour to expand the current programme on
school feeding to cover all their learners, as pointed out in other sections of this report. The
benefits of effective feeding for learners in stimulating their learning effort and other school
activities are obvious; any programme designed to achieve that would have many areas of
positive impact on the social and economic lives of the communities in the country; and (c)
The distance between the learners‟ homes and school is an important determinant of the
learners‟ attendance, punctuality and effective learning; hence, the Federal Government
should formulate a policy on the establishment of schools in all communities in accordance
with the policy on maximum distance that learners should normally cover to reach the nearest
school. Lateness or truancy often emanate from the distance the learners travel from home to
school, which can be managed through proper supervision of the learners and greater
cooperation between the home and the school.

199
Learners’ Contributions at Home through Co-Curricular Activities
The extent to which the learners participated in co-curricular activities was assessed under
four headings that included Games and Sports, Cooking, and Economic Activities
(Trading/Hawking, and Farming). The report of the survey indicated that the after school
activities in which the learners engaged were farming/rearing animals, petty trading/hawking;
cooking; and games/sports. Some learners were reported to have always engaged in
farming/rearing of animals and trading/hawking of commercial items. On the other hand,
some learners never engaged in farming/rearing of animals or petty trading. The percentage
of learners who participated in games was relatively smaller, as reported in the survey.
Implications for Policy and Practice: Learners who involve in economic activities after
school to a large extent miss out in the benefits of participating in recreational pursuits.
Schools should regularly organise out of class activities, such as games and sports, in order to
share the benefits to those who may not have the opportunity to do so at home. Governments
should also uphold the national policy against child labour and child abuse; and in this regard,
UBEC and the schools should also emphasise on the regular sensitisation of parents and
guardians of the learners.
Teachers in Schools
This section contains the outcome of the survey, which examined the characteristics of the
teachers and how they supported the academic development of the learners.
i. Ageing Head Teachers
A large proportion of the head teachers are ageing and getting close to the age of
retirement. A challenge of this is the need to begin to think of how they would
eventually be replaced.
Implications for Policy and Practice: The fact that many of the experienced
principals would soon leave service implies that governments and private employers
need to urgently arrange for their replacement at regular intervals. This is necessary,
so that these older and experienced school administrators could appropriately mentor
the younger teachers who will replace them.
ii. Regular Re-Training of Teachers
The report of the survey indicated that a large number of the teachers were
professionally qualified.

200
Implications for Policy and Practice: The fact that some of the teachers lacked
professional qualifications in teaching confirms the need for governments and the
private proprietors to urgently put in place organised plans to support such unqualified
teachers in their schools to go for professional training.
iii. Age Limit for Teachers
The result of the survey indicated that a small number of the teachers were fairly
young (less than 20 years old); which made them only a few years older than their
teenage learners. This poses many challenges to the learning process in the schools,
especially regarding whether or not the learners would take full instructions from the
young teachers.
Implications for Policy and Practice: Government needs to enact a policy, which
would specify the minimum age requirement for aspiring teachers who may wish to
enter into the profession.
iv. Staff Situation in Schools
The qualification of the teachers is the first measure of the quality of the schools.
Teachers should be well prepared to effectively take on their teaching responsibilities
to the benefit of their learners. However, the report of the survey indicated that a
substantial number of the teachers possessed qualifications below the minimum
prescribed for teaching in Nigeria.
Implications for Policy and Practice: Government and private proprietors should
adopt measures to ensure that only qualified teachers are employed to teach in the
schools. At the same time, the governments should evolve policies that would ensure
that teachers currently teaching in the schools are sponsored for training, in order for
them to be fully qualified.
Professional Development
The report of the survey indicated that the participation of the head teachers in development
programmes in the schools was quite high, which was quite healthy for their operations as
head teachers and their schools. However, it was observed that this could have been because
of the mandatory training rendered by the All Nigeria Confederation of Principals of
Secondary Schools (ANCOPSS). Such programme ensures that principals are kept abreast
with the latest developments that enhance good school management practices. The report of

201
the survey also indicated that the training attended by a large number of the teachers included
teaching methods and classroom management.
Implications for Policy and Practice: (i) Government and the private proprietors should
support the programmes of ANCOPSS and all the professional teacher associations, for the
continuous development of the school heads and teachers. Government and the private
proprietors should also ensure that all school heads have the requisite professional
qualifications and managerial experience to run their schools effectively while attending
regular training programmes to keep abreast with the latest developments in their fields; and
(ii) It is not enough for the teachers to be made to regularly attend professional training
programmes but governments and school heads must evolve an effective follow up policy to
ensure that all teachers who benefit from such programmes apply the knowledge gained from
trainings attended.
School Discipline and Climate
The report of the survey identified quarrelling and stealing among the learners as the two
major disciplinary problems that emerged from this study. These are social problems that can
be properly managed by the school counsellors.
Implications for Policy and Practice: Government and private school proprietors must
employ more counsellors in their schools, to help combat this unhealthy habit among the
learners. Moreover, the school counsellors should be made to attend regular training, in order
to share the best practices and learn from experiences in other schools.
Decision Making
The report indicated that head teachers and teachers had limited freedom in selecting what to
teaching their schools and during their lessons. This situation could have a negative
consequence, as some of the teachers often felt aggrieved that their input was not sought, in
spite of their professional and practical experience.
Implications for Policy and Practice: Government and the relevant national agencies should
adopt a conscious policy to involve school heads and the teachers widely and systematically
in designing the national curriculum and the subject clusters to be taught in the schools.
Similarly, the policy should be flexible across schools, as the current practice of directing all
schools to adopt particular subject clusters across the state, without regard to the
specialisation of their teachers, often has a disastrous effect on their learners.
202
Job satisfaction and Morale
As indicated in the report, almost all the school heads involved in the survey were satisfied
with their job; and they considered the task of modelling future of the child to be of great
importance. These feelings can lead to an enhanced interest in their job and serve as a strong
motivation for promoting quality output among the learners in their schools. However, the
head teachers were not happy with the poor working environment and the delay, which was
becoming common practice, in the payment of their monthly entitlements.
Implications for Policy and Practice: Government should attach significance to the working
environment in the schools and promote all existing policies that will help to motivate the
head teachers and all the teachers in the school to have a more positive impact on their
learners. More specifically, governments should adopt a conscious policy of prompt payment
of salaries and other entitlements to all their teachers, in order to enhance their job
satisfaction.
Teaching and Evaluation Practices
The report of the survey indicated that the teachers used almost all the regular instructional
materials in their normal lessons, with the exception of audio-visual materials. This could
have been as a result of the non-availability of these equipment, owing to their high cost. The
report also indicated that the teachers did not employ regular written work during their
lessons, a situation that could have resulted from the materials not being available to them to
work with.
Implications for Policy and Practice: Government and proprietors of private schools should
endeavour to provide the full complement of teaching materials to schools regularly, noting
that effective teaching and learning is not possible without such materials. School heads must
also safeguard the safety of any equipment supplied and ensure that teachers use it
judiciously in their lessons.
Teachers’ Needs
As indicated in the report, the teachers needed help in developing the techniques for teaching
large classes and overcoming the difficulties encountered in providing excursions outside the
classroom. This poses enormous challenges for teacher development, as the learners‟
population in the schools keeps growing steadily.
Implications for Policy and Practice: Government, private proprietors and school heads need
to adopt policies that will help the teachers cope with their expanding classrooms, make
203
constructive use of the teaching time and control the personal behaviours of the learners.
More teachers should also be employed on regular basis in line with the increase in the
population of the learners.
The School and the Community
This section contains the review of the overall outcome of the research, as it affected the
relations between the school and the community and their impact on the learners‟ academic
development. These included the school in perspective, parents‟ relationship with the school
and support from parents for the school provision of school fence and security, school
community relations. The variables discussed below include the school compound and
buildings, classroom spaces and open classrooms, facilities in the school, child-friendly
environment, types of instructional materials and water supply sources.
Distance to School
The distance from their home to the school can be a problem for the learners. The report of
the survey indicated that 80 percent of learners from the schools used lived less than 2
kilometres away from their schools. Thus, they do not spend much time in getting to their
schools. More so, more than 90 percent of the learners confirmed that they normally walked
from their homes to the school.
Implications for Policy and Practice: This is quite commendable. State governments, local
authorities and school heads should put in more effort to ensure that there learners are
admitted into schools near their homes.
Community Assistance to Schools.
The report of the survey confirmed that the assistance rendered by communities to the
schools was satisfactory in most areas, except in the provision of buildings. This may not be
unconnected with the cost of constructing infrastructure.
Implications for Policy and Practice: School heads should endeavour to involve the
communities in the affairs of their schools, especially in sensitising them in respect of their
requirements in terms of building projects. Where the communities may not be able to afford
cash, they should be encouraged to assist in kind or by making available some valuable
resources.
Relationship between the School and the Community
The report affirmed the relationship between the communities and the schools as being very
cordial. This could have informed the commitment of the parents to pay the school charges or
204
levies in respect of their learners regularly, so as to ensure that the schools were able to meet
their operating expenses.
Implications for Policy and Practice: Government, proprietors and school heads must work to
sustain the relationship, by upholding dignity of the schools and ensuring that they are
accountable to parents.
Space for School Buildings, Playgrounds and Gardens
Schools require enough space for buildings, playgrounds and gardens. The fact that only a
few of the schools did not have these available could be due to situational issues relating to
their locations, particularly in urban areas where land is in short supply and expensive to
acquire. This can expose the learners to hazards and make the learning environment
uninviting.
Implications for Policy and Practice: Government must adopt all the necessary
policies to make the school attractive and fit for the learners, so that they look forward to
attending their lessons. School heads should also encourage support organisations and the
corporate bodies to assist them with their required building projects.
Male and Female Enrolment
The report of the survey indicated that there were more female learners enrolled across the
country than males in this class. This confirmed that the education of the female gender was
now being taken seriously. However, the distribution across the states appeared to be quite
unbalanced.
Implications for Policy and Practice: Government at all levels must re-address the gender
imbalance in the school enrolment. In particular, the education of the female learners should
be accorded greater attention.
School Dropout Rate
The survey report indicated that the school dropout rate in Bayelsa and Zamfara states was
quite high.
Implications for Policy and Practice: The governments of the two states should immediately
investigate the factors responsible for the situation and address the matter appropriately.
Policy should look into having all children in school. Schools should do a follow up on their
students. Any learner noticed not to be in school should be investigated.

205
Availability of Toilets in the Schools
The report of the survey indicated that the availability of toilets for the use of the learners and
their teachers was very poor. This sorry situation can constitute a serious health hazard, as
the learners contaminate the school premises and the surrounding areas.
Implications for Policy and Practice: Government and private proprietors must immediately
provide more toilets in schools; those available at the moment should be properly maintained.
Non-Availability of Curriculum Materials
The report of the survey indicated that, although the few available materials were of good
quality, on the whole there was, however, a scarcity of curriculum materials in the schools,
which was an issue of great concern. This was because the materials were expected to direct
the teacher concerning what to teach in the class, as well as provide the source for all other
documents relating to the curriculum.
Implications for Policy and Practice: Governments must ensure that up to date curriculum
materials are supplied to every school across the states in the federation. Seminars and
meetings should also be organised on the materials, so that all the school heads and teachers
are familiar with their contents.
Appropriateness of Classroom Facilities
The report of the survey indicated that the level of appropriateness of the school facilities,
especially furniture, left much to be desired. This was more so, because the facilities were
supposed to provide a measure of comfort for achieving effective teaching and learning in the
school. Without adequate facilities, teachers and learners would not be comfortable and,
therefore, learning would be disturbed. Reasons adduced for the bad condition of the facilities
included dilapidation and insufficient infrastructure in the public schools, which were
aggravated by the fact that under the government‟s „free education‟ policy they could not
collect fees from the learners.
Implications for Policy and Practice: Governments across the country must ensure that
adequate facilities are provided in all public schools and regularly maintained, in order to
achieve quality teaching and learning.
Disparity among Schools in Classrooms and Spaces
The report of the survey indicated a disparity in the number of classrooms and open spaces in
different schools across different locations in the states.
206
Implications for Policy and Practice: Government must enact policies to ensure that the learning
environment within all schools is conducive. A situation in which learning has to take place
under tree, as reported in some cases, cannot augur well for the education system in the
country.
Availability of Textbooks
Textbooks were discovered in the report to have been the only instructional materials readily
available. Considering the sample surveyed, this a far cry from what should be expected, as
other instructional materials were, more or less, not available.
Implications for Policy and Practice: Government must endeavour to provide the necessary
instructional materials, including more books, to the schools.
Water Supply
The report indicated that water was available in most of the schools surveyed, although they
mostly relied on rainwater and tanker supplies.
Implications for Policy and Practice: Government, school heads and communities must
make a permanent arrangement to provide more dependable sources of water to the schools. Lack of Refuse Disposal Facilities
The report indicated that the lack of refuse disposal facilities was of great concern in many
schools. Such a situation could lead to the school environments being dirty, thereby exposing
the learners to different types of diseases and infections.
Implications for Policy and Practice: Government, private proprietors and school heads should
put in place good refuse disposal facilities in the schools and ensure that they are not located
within the vicinity of the classrooms.
Attitude of the Learners
The report indicated that a number of variables were surveyed under attitude of the learners,
which included attitude towards parents, school subject, teachers and schooling.
Parents like the Teachers
The report of the survey indicated that a very substantial number of the learners confirmed
that they liked their parents as they were good and beneficial to them, as parents should
normally be the first set of role models for their children. The learners would, thus, be
motivated to work hard, in order to impress the parents, an attitude that can serve to enhance
their learning achievements.
207
Implications for Policy and Practice: Parents must uphold the respect of the learners at all times.
The school heads should also motivate the learners to achieve more in school, so as to be able
to fulfil their parent‟s expectations.
Subjects the Learners Disliked Most
The report of the survey showed that Mathematics was the subject disliked most by learners
in the school. However, as one of the bedrocks of science and technology, all learners must
take Mathematics seriously; and those who do not like it may not have a positive effect on the
nation‟s development. Similarly, the learners had indicated that they also disliked studying
the Nigerian languages.
Implications for Policy and Practice: Government should commission a policy research in order
for experts to fully investigate why students do not like Mathematics; and the results arising
from the investigation should be treated appropriately. Within the classroom, teachers can
find out why the subject does not often appeal to most of the learners; and try to guide them
into responding to it more positively. In similar vein, the teachers should educate the learners
further about the importance of studying their local languages; otherwise, the languages
would weaken and, eventually, become extinct in the future. Language is the reservoir for
culture; therefore, in order to preserve the nation‟s culture more language activities should be
introduced into the curriculum. A pass in the indigenous language subjects should be made
compulsory for promotions and school heads and teachers should impress it upon the learners
that their education is not complete, if they are unable to pass the language subjects.
The Learners like Their Teachers and Schooling
The report of the survey indicated that the learners liked schooling and their teachers. This
was quite commendable, as it would likely lead them to achieve greater performance in their
subjects. However, more should still be done to sustain their interest in the teachers and
schooling.
Implications for Policy and Practice: Teachers should continuously portray themselves well;
and the school should uphold its dignity, in order to sustain the interest of the learners.

208