National Assessment of Educational Progress (NAEP) 2015 NAEP Reading and Math Nationally, students...
25
National Assessment of Educational Progress (NAEP) Trial Urban District Assessment 2015
Transcript of National Assessment of Educational Progress (NAEP) 2015 NAEP Reading and Math Nationally, students...

National Assessment of Educational Progress (NAEP)
Trial Urban District Assessment 2015

2015 NAEP Reading and Math2
Nationally, students dropped 1‐2 points except in 4th grade reading, where the average score increased 1 point.
Only Chicago, Miami and Cleveland showed gains across both subjects (reading and math) and grades (4th and 8th). Most of these gains were not significant.
Fresno Unified did not show significant gains or losses in any subject (Reading or Math) or grade (4th or 8th) in 2015, when compared to 2013, or from our first year, 2009. Overall scores remain low: Fresno ranks around 18th of 21 Districts in each subject and grade level
Gaps remain between white sub‐group and other groups A non‐significant gain of 3 points occurred in 4th grade reading in 2015, while 4th grade math dropped 2 points.
Reading in 8th grade dropped 3 points after an 8 point gain in 2013. Math 8th grade scores dropped 3 points.

TUDA 2015 Grade 4 Reading 22
121
423
022
622
622
522
222
021
921
621
421
421
321
221
020
720
420
420
119
919
919
718
6
180
190
200
210
220
230
240
3
San
Die
go
Bost
on
Chi
cago
Wa
sh D
C
Atla
nta
Da
llas
New
Yor
k C
ity
Los A
ngel
es
Alb
uque
rque
Phila
del
phia
Balti
mor
eC
ity
Hou
ston
Fres
no
Cle
vela
nd
Det
roit
Nat
’l Pu
blic
Avg
.
Larg
e C
ity A
vg.
Hills
boro
ugh
Cha
rlotte
Jeffe
rson
Cou
nty
Duv
al C
ount
y
Aus
tin
Mia
mi-D
ad
e

NAEP Reading Grade 4 –Average Scale Score for California TUDAs
4
197 197
213210
220
194
201
215211
220
196
205
218
213
221
199
204
216213
221
180
185
190
195
200
205
210
215
220
225
Fresno Los Angeles San Diego California National Public
2009201120132015

NAEP Reading Grade 4 – OverallChange in Average Scale Score: 2013-2015
5
Balti
mor
e
Det
roit
New
Yor
k C
ity
Atla
nta
San
Die
go
Cha
rlotte
Aus
tin
Da
llas
Los A
ngel
es
Alb
uque
rque
Phila
del
phia
Nat
iona
l pub
lic
Jeffe
rson
Cou
nty
(KY)
Larg
e ci
ty
Hou
ston
Hills
boro
ugh
Cou
nty
Fres
no
Mia
mi-D
ad
e
Bost
on
Chi
cago
Cle
vela
nd
Wa
sh D
C
-7
-6
-5
-4
-3
-2
-1
0
1
2
3
4
5
6
7
8
9
10
Cha
nge
in A
vera
ge S
cale
Sco
re
Darker shaded bars indicate significant change

TUDA 2015 Grade 8 Reading26
425
726
526
426
326
226
126
126
125
825
825
725
225
225
125
125
024
824
524
324
224
023
7
220
230
240
250
260
270
280
Bost
on
New
Yor
k C
ity
Alb
uque
rque
Atla
nta
Chi
cago
Balti
mor
e C
ity
Hou
ston
Da
llas
Los A
ngel
es
Phila
del
phia
Fres
no
Wa
sh. D
.C.
Cle
vela
nd
Det
roit
Hills
boro
ugh
6
Nat
’l Pu
blic
Avg
.
Larg
e C
ity A
vg.
Duv
al C
ount
y
Aus
tin
Jeffe
rson
Cou
nty
San
Die
go
Mia
mi-D
ad
e
Cha
rlotte

NAEP Reading Grade 8 –Average Scale Score for California TUDAs
7
240244
254 253
262
238
246
256 255
264
245250
260 262266
242
251
262259
264
220225230235240245250255260265270
Fresno Los Angeles San Diego California NationalPublic
2009201120132015

NAEP Reading Grade 8 – OverallChange in Average Scale Score: 2013-2015
8
Balti
mor
e
Hills
boro
ugh
Cou
nty
Alb
uque
rque
Cha
rlotte
Fres
no
Atla
nta
Nat
iona
l Pub
lic
Det
roit
Da
llas
Larg
e C
ity
Hou
ston
Phila
del
phia
Wa
sh D
C
Aus
tin
Jeffe
rson
Cou
nty
(KY)
Los A
ngel
es
New
Yor
k C
ity
Bost
on
Cle
vela
nd
San
Die
go
Chi
cago M
iam
i-Da
de
-10-9-8-7-6-5-4-3-2-1012345678
Cha
nge
in A
vera
ge S
cale
Sco
re
Darker shaded bars indicate significant change

NAEP 2015 Reading: Average Scale Scores by Student Group
220
186 19
6 207
174
151
130150170190210230250270290
Grade 4White Black HispanicAsian ELL SWD
256
238
238 24
9
206
199
130150170190210230250270290
Grade 8White Black HispanicAsian ELL SWD
9

NAEP Trend by Student Group in Reading - Grade 4
10
217
193 194 194
175
162
216
191 190195
171
151
218
187192
199
170
147
220
186196
207
174
151
120
140
160
180
200
220
240
260
280
White Black Hispanic Asian ELL SWD
2009201120132015

NAEP Trend by Student Group in Reading - Grade 8
11
265
236 241247
210202
257
230 234241
205
189
265
236241 247
210203
256
238 238249
206199
120
140
160
180
200
220
240
260
280
300
White Black Hispanic Asian EL SD
2009201120132015

TUDA 2015 Grade 4 Mathematics24
123
424
824
624
424
324
223
923
823
623
623
323
223
223
123
122
822
421
921
821
721
520
5
190
200
210
220
230
240
250
260
12
Mia
mi-D
ad
e
Jeffe
rson
Cou
nty
Bost
on
Chi
cago
New
Yor
k C
ity
Cle
vela
nd
Da
llas
Wa
sh. D
.C.
Atla
nta
Los A
ngel
es
Phila
del
phia
Alb
uque
rque
Fres
no
Balti
mor
e C
ity
Det
roit
Nat
’l Pu
blic
Avg
.
Larg
e C
ity A
vg.
Hills
boro
ugh
Cha
rlotte
Aus
tin
San
Die
go
Duv
al C
ount
y
Hou
ston

NAEP Mathematics Grade 4 –Average Scale Score for California TUDAs
13
219222
236
232
239
218
223
239
234
240
220
228
241
234
241
218
224
233 232
240
205
210
215
220
225
230
235
240
245
Fresno Los Angeles San Diego California NationalPublic
2009201120132015

NAEP Mathematics Grade 4 – Change in Average Scale Score: 2013-2015
14
San
Die
go
Balti
mor
e C
ity
Phila
del
phia
Atla
nta
New
Yor
k C
ity
Los A
ngel
es
Alb
uque
rque
Fres
no
Bost
on
Nat
iona
l pub
lic
Larg
e ci
ty
Det
roit
Cha
rlotte
Hills
boro
ugh
Cou
nty
Aus
tin
Chi
cago
Jeffe
rson
Cou
nty
Hou
ston
Cle
vela
nd
DC
PS
Da
llas
Mia
mi-D
ad
e
-11-10-9-8-7-6-5-4-3-2-1012345678
Cha
nge
in A
vera
ge S
cale
Sco
re
Darker shaded bars indicate significant change

TUDA 2015 Grade 8 Mathematics28
127
428
628
428
128
027
627
627
527
527
527
427
227
127
126
726
626
325
825
725
525
424
4
220
230
240
250
260
270
280
290
300
15
San
Die
go
Mia
mi-D
ad
e
Duv
al C
ount
y
Alb
uque
rque
Da
llas
Fres
no
Hou
ston
New
Yor
k C
ity
Atla
nta
Phila
del
phia
Los A
ngel
es
Wa
sh. D
.C.
Balti
mor
e C
ity
Cle
vela
nd
Det
roit
Nat
’l Pu
blic
Avg
.La
rge
City
Avg
.
Bost
on
Cha
rlotte
Aus
tin
Jeffe
rson
Cou
nty
Hills
boro
ugh
Chi
cago

NAEP Mathematics Grade 8 –Average Scale Score for California TUDAs
16
258 258
280
270
282
256261
278
273
283
260264
277 276
284
257
263
280275
281
240245250255260265270275280285290
Fresno Los Angeles San Diego California NationalPublic
2009201120132015
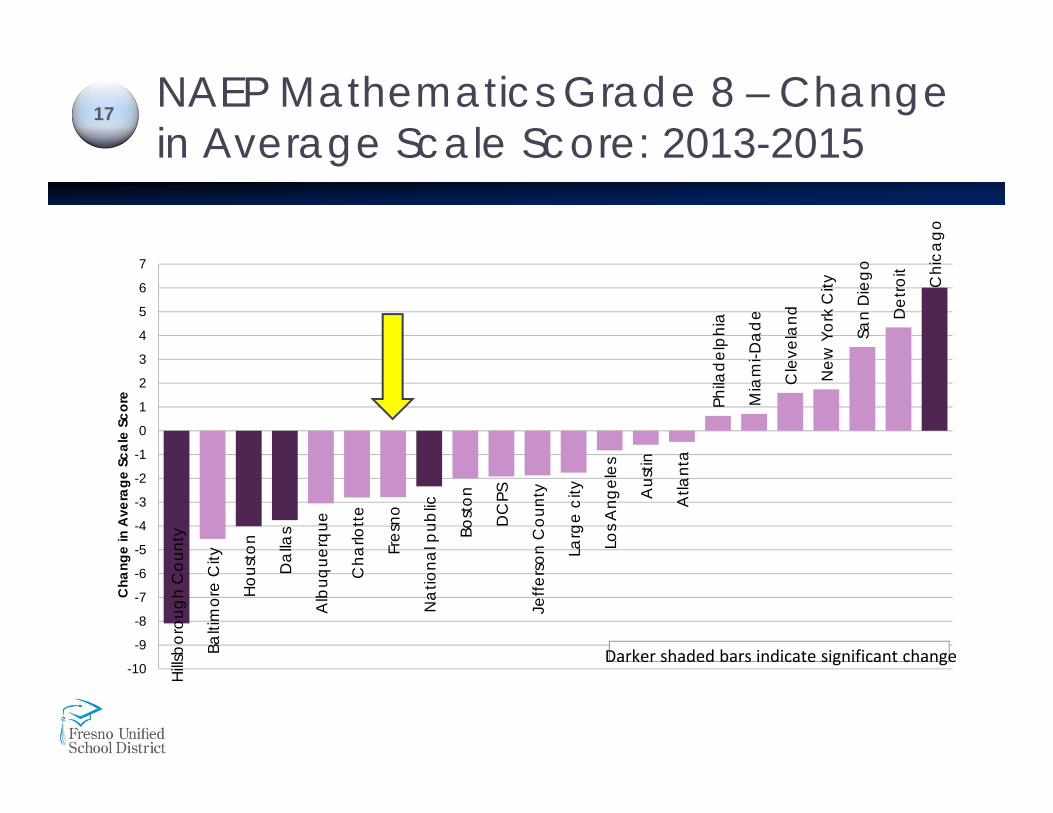
NAEP Mathematics Grade 8 – Change in Average Scale Score: 2013-2015
17
Hills
boro
ugh
Cou
nty
Balti
mor
e C
ity
Hou
ston
Da
llas
Alb
uque
rque
Cha
rlotte
Fres
no
Nat
iona
l pub
lic
Bost
on
DC
PS
Jeffe
rson
Cou
nty
Larg
e ci
ty
Los A
ngel
es
Aus
tin
Atla
nta
Phila
del
phia
Mia
mi-D
ad
e
Cle
vela
nd
New
Yor
k C
ity
San
Die
go
Det
roit
Chi
cago
-10
-9
-8
-7
-6
-5
-4
-3
-2
-1
0
1
2
3
4
5
6
7
Cha
nge
in A
vera
ge S
cale
Sco
re
Darker shaded bars indicate significant change

NAEP 2015 Mathematics- Average Scale Scores by Student Group
235
213
214 22
6
202
189
180
200
220
240
260
280
300
Grade 4White Black HispanicAsian ELL SWD
281
242 25
2
271
227
214
180
200
220
240
260
280
300
Grade 8White Black HispanicAsian ELL SWD
18

NAEP Trend by Student Group in Mathematics - Grade 4
19
237
213 216 220207
190
238214
214223
202186
241
211217 221 205
187
235213 214
226
202189
0
50
100
150
200
250
300
White Black Hispanic Asian EL SWD
2009201120132015

NAEP Trend by Student Group in Mathematics - Grade 8
20
282
246253
266
234
222
281
243251
264
228
212
279
247
256
271
229
221
281
242
252
271
227
214
180
200
220
240
260
280
300
White Black Hispanic Asian EL SWD
2009201120132015

Fresno Unified Participation in NAEP
NAEP is the only nationally representative assessment of student achievement – Gold Standard of Assessments
Fresno Unified is one of 21 school districts to participate in the voluntary NAEP Trial Urban District Assessment (TUDA) in reading in 2015
Among California districts: Both Los Angeles and San Diego dropped significantly in 4thgrade math and had no significant change in the other subjects/grades
Some discussion of the mis‐alignment between the NAEP 4thgrade Math framework and the State Standards (Common Core) occurred for all districts and states at the workshop.
21

Fresno Unified: TUDA School District
The sample of students in TUDA school districts represents an augmentation of the sample of students who would usually be selected by NAEP as part of the state samples.
Students in TUDA samples are also included in “higher‐level” samples. For example, data from students tested in the Fresno sample were used to report results for Fresno and also contributed to the California and the national samples.
22

How is Student Performance Reported?
Scale Scores: Student performance is reported as an average score based on the NAEP scale, which ranges from 0 to 500.
Achievement Levels: Basic – denotes partial mastery of prerequisite knowledge and skills that are fundamental for proficient work at each grade
Proficient – represents solid academic performance Advanced – represents superior performance Achievement levels are not highlighted in this presentation because of the confusion between NAEP and SBAC performance level differences. Some comparison slides are available below.
23

NAEP 2015 Fresno Achievement Levels in Reading
24
Grade
SBAC Percentage
Met Standard or Above
NAEP Percentage
Basic or Above
NAEP Percentage Proficient or
Above
4 22% 42% 13%
8 28% 51% 12%
* Data from California Department of Education website at www.caaspp.cde.ca.gov

NAEP 2015 Fresno Achievement Levels in Mathematics
25
Grade
SBAC* Met or Exceeded
Standards 2015
NAEP Percent Basic or Above
NAEP Percent Proficient or
Above
4 18% 55% 14%
8 15% 44% 12%
* CST Data from California Department of Education website at www.caaspp.cde.ca.gov