National Antimicrobial Utilisation Surveillance Program
60
National Antimicrobial Utilisation Surveillance Program Annual Report 2014 - 2015 1 of 60
Transcript of National Antimicrobial Utilisation Surveillance Program
National Antimicrobial Utilisation Surveillance
Program
Annual Report 2014 - 2015
1 of 60
Foreword The National Antimicrobial Utilisation Surveillance Program (NAUSP) commenced in July 2004 to
provide ongoing, nationally representative data on antimicrobial utilisation in adult acute care
hospitals.
This is the eleventh annual report of the national surveillance program and is intended to give health
care professionals and administrators an overview of antibiotic use by contributors during the period
July 2014 to June 2015 in principal referral hospitals across Australia, with historical comparisons
from a five year period.
The National Antimicrobial Utilisation Surveillance Program has been funded by the Australian
Government Department of Health through the Australian Commission on Safety and Quality in
Health Care and SA Department for Health and Ageing, and is managed by the Infection Control
Service, Communicable Disease Control Branch, SA Department for Health and Ageing.
October 2015
National Antimicrobial Utilisation Surveillance Program Annual Report 2014-2015 ISBN 978-1-74243-816-0 This annual report was prepared by Infection Control Service Communicable Disease Control Branch Department for Health and Ageing 11 Hindmarsh Square Adelaide, South Australia 5000 This annual report can be accessed at the Department for Health and Ageing Internet site: www.sahealth.sa.gov.au/nausp Enquiries to: [email protected] or +61 8 7425 7169
2 of 60

TABLE OF CONTENTS
Abbreviations ................................................................................................................................................ 5 Executive Summary ...................................................................................................................................... 6 1. Introduction ......................................................................................................................................... 7 2. Methodology ....................................................................................................................................... 8 2.1 Contributor Hospitals .......................................................................................................................... 8 2.2 General information for this report ...................................................................................................... 8 3. Overview of Antimicrobial Usage Rates: July 2010 – June 2015 ....................................................... 9 3.1 Overall Usage Rates ........................................................................................................................... 9 3.1.1 Total-Hospital Annual Antimicrobial Usage Rates .............................................................................. 9 3.1.2 Intensive Care Unit Annual Antimicrobial Usage Rates ................................................................... 11 3.2 Usage rates by Antimicrobial Class: July 2010 to June 2015........................................................... 12 3.2.1 Total-Hospital Antimicrobial Class Usage Rates .............................................................................. 12 3.2.2 Intensive Care Unit Antimicrobial Class Usage Rates ...................................................................... 14 4. Antimicrobial Usage Rates by Individual Agents .............................................................................. 15 4.1 Aminoglycosides – amikacin, gentamicin, tobramycin ..................................................................... 15 4.2 Carbapenems – doripenem, ertapenem, imipenem, meropenem .................................................... 18 4.3 Cephalosporins – cephalexin, cephalothin, cephazolin, ceftriaxone, cefotaxime,
ceftazidime, cefepime ....................................................................................................................... 21 4.4 Fluoroquinolones – ciprofloxacin, norfloxacin, moxifloxacin ............................................................. 27 4.5 Glycopeptides – vancomycin, teicoplanin ......................................................................................... 30 4.6 Macrolides – azithromycin, clarithromycin, erythromycin, roxithromycin .......................................... 33 4.7 Penicillins – benzylpenicillin, phenoxymethylpenicillin, dicloxacillin, flucloxacillin,
amoxycillin, ampicillin, amoxycillin with clavulanic acid, ticarcillin/clavulanate and
piperacillin/tazobactam, .................................................................................................................... 36 4.7.1 Penicillins (excluding antipseudomonal penicillin/beta-lactamase inhibitor combinations) .............. 36 4.7.2 Antipseudomonal penicillin/beta-lactamase inhibitor combinations ................................................. 40 4.8 Tetracyclines - doxycycline, minocycline, tigecycline ....................................................................... 44 4.9 Lincosamides (clindamycin, lincomycin) ........................................................................................... 46 4.10 Reserve-line agents (linezolid, colistin, daptomycin, tigecycline) ..................................................... 50 5. Discussion ......................................................................................................................................... 53 6. References ........................................................................................................................................ 55 Appendix 1: NAUSP Contributors .......................................................................................................... 56 Appendix 2: Definitions .......................................................................................................................... 57 Appendix 3: WHO Defined Daily Doses (DDD) for antibacterial agents included in NAUSP
Annual Report (2014-15) ................................................................................................... 58
3 of 60
Disclaimer: The data presented in this report were correct at the time of publication and reflect usage rates based
on antibiotic quantities and occupied bed days data supplied by individual contributors. Variation occurs in the
annual number of contributor hospitals and those with ICUs. As additional hospitals join the surveillance program,
retrospective data may be provided. These are incorporated into annual reports and may result in variations from
previous NAUSP reports.
4 of 60

Abbreviations
ACSQHC Australian Commission on Safety and Quality in Healthcare
AMS Antimicrobial stewardship
ATC Anatomical, Therapeutic, Chemical classification system
AIHW Australian Institute of Health and Welfare
DDD Defined Daily Dose
HAI Healthcare associated infections
ICU Intensive care unit
JETACAR Joint Expert Technical Advisory Committee on Antibiotic Resistance
MRSA Methicillin-resistant Staphylococcus aureus
MRSE Multi-resistant Staphylococcus epidermidis
MRO Multidrug-resistant organism
NAUSP National Antimicrobial Utilisation Surveillance Program
NSQHSS National Safety and Quality Health Service Standard
OBD Occupied Bed Days
QA Quality assurance
SA South Australian
SAAUSP South Australian Antimicrobial Utilisation Surveillance Program
VRE Vancomycin-resistant enterococci
WHO World Health Organization
5 of 60

Executive Summary The National Antimicrobial Utilisation Surveillance Program (NAUSP) commenced in July 2004 and
since 2008 all states and territories are represented in the program. Participating hospitals contribute
on a voluntary basis and the number of hospitals has increased greatly since the introduction of the
NSQHSS in 2011. This report includes data from 148 Australian hospitals (128 public and 20 private).
The 128 public hospitals represent 79% of total beds in Australian hospitals (AIHW classes PR, L, M,
S1, W1, and W2). All Australian Principal Referral hospitals are included in this report.
Standardised usage density rates, based on the World Health Organization’s Anatomical Therapeutic
Chemical (ATC) standards for Defined Daily Doses (DDD) are used. The denominator is the
frequently used metric of inpatient ‘Occupied-Bed Days’ (OBDs). Antimicrobial utilisation reporting,
based on DDD, enables assessment and comparison of total-hospital usage, as a rate.
This report covers antimicrobial utilisation for the period July 2014 to June 2015, during which the
aggregate annual rate for total-hospital antibiotic use by 148 contributors was 923 DDD/1000 OBDs.
The aggregate annual rate for ICU antibiotic use (67 contributors) was 1484 DDD/1000 OBDs
(approximately 60% higher than total-hospital usage rates, reflecting more complex therapeutic
practices and high level of acuity of patients).
Usage data for Intensive Care Units (ICU) and analyses of agent-specific usage by peer group have
been included in this report to supplement data provided in Antimicrobial use in Australian hospitals:
2014 report of the National Antimicrobial Utilisation Surveillance Program [1].
Key findings in this supplement include:
• Inter-hospital usage rates vary several-fold for some antibiotics within peer groups (both for total-
hospital data and the ICU subset) and also between peer groups. Some Large Public Acute
hospitals show usage rates higher than those for Principal Referral hospitals for fluoroquinolones
and third generation cephalosporins. Appropriateness of use is not determined by NAUSP, but
these findings may trigger more in-depth usage analysis at the individual hospital level.
• Usage rates of fluoroquinolones and aminoglycosides continue previous years’ trends
downwards, both in total-hospital and the ICU setting. Doxycycline shows a trend upwards (both
in ICU and non-ICU settings) and usage is seasonal, being highest in winter months.
• For many classes ICU usage rates are significantly greater than non-ICU rates. For example,
utilisation of carbapenems, glycopeptides and the highly reserved agents daptomycin and
linezolid in ICU is many fold greater higher than the non-ICU rate. NAUSP data support that the
majority of use is indeed in severely ill (ICU) patients.
6 of 60
1. Introduction This report provides supplementary information to that recently published in Antimicrobial use in
Australian hospitals: 2014 report of the National Antimicrobial Utilisation Surveillance Program (“the
2014 report”) [1]. Data from an additional 19 hospitals are included. These hospitals had either
recently joined NAUSP (between December 2014 and June 2015), or had been excluded from the
2014 report due to inaccurate data which was subsequently corrected.
Data pertaining to usage in Intensive Care Units (ICU) and benchmarking for a selected number of
antibiotic classes by hospital and peer group are presented.
In 2015 all Australian states and territories are represented in the program. Numbers of participating
hospitals by peer group are shown in Table 1.
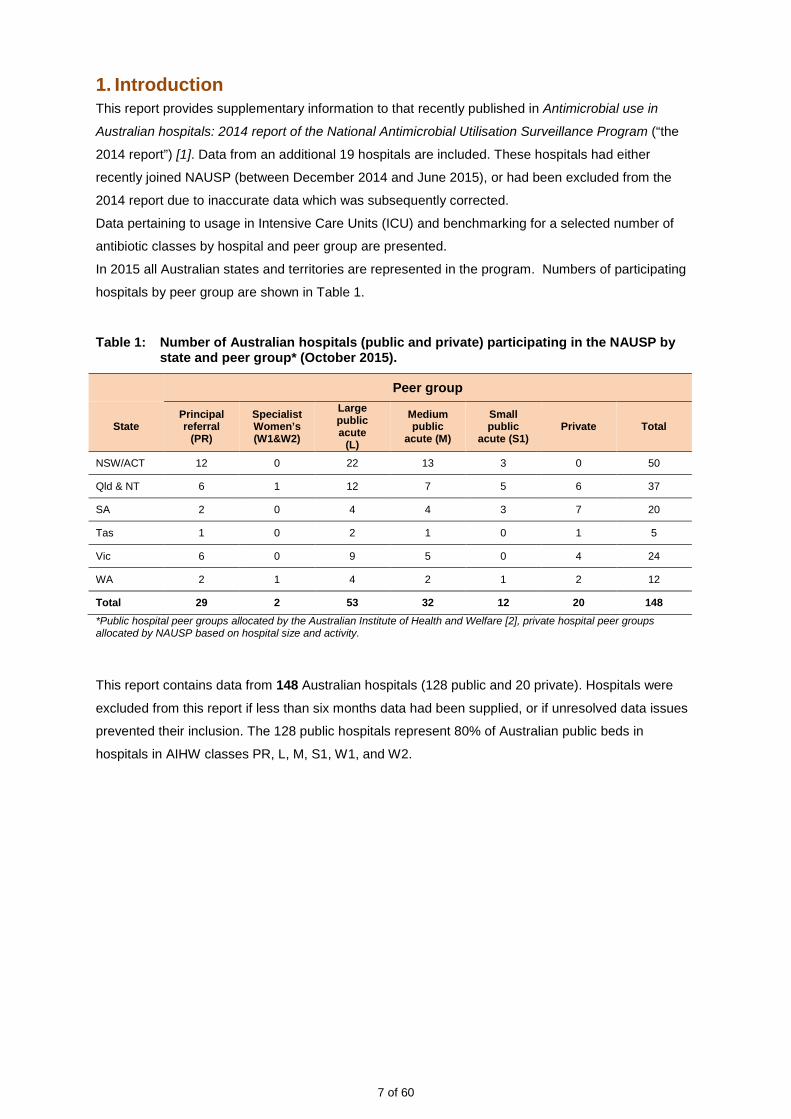
Table 1: Number of Australian hospitals (public and private) participating in the NAUSP by state and peer group* (October 2015).
Peer group
State Principal referral
(PR)
Specialist Women’s (W1&W2)
Large public acute
(L)
Medium public
acute (M)
Small public
acute (S1) Private Total
NSW/ACT 12 0 22 13 3 0 50
Qld & NT 6 1 12 7 5 6 37
SA 2 0 4 4 3 7 20
Tas 1 0 2 1 0 1 5
Vic 6 0 9 5 0 4 24
WA 2 1 4 2 1 2 12
Total 29 2 53 32 12 20 148 *Public hospital peer groups allocated by the Australian Institute of Health and Welfare [2], private hospital peer groups allocated by NAUSP based on hospital size and activity.
This report contains data from 148 Australian hospitals (128 public and 20 private). Hospitals were
excluded from this report if less than six months data had been supplied, or if unresolved data issues
prevented their inclusion. The 128 public hospitals represent 80% of Australian public beds in
hospitals in AIHW classes PR, L, M, S1, W1, and W2.
7 of 60
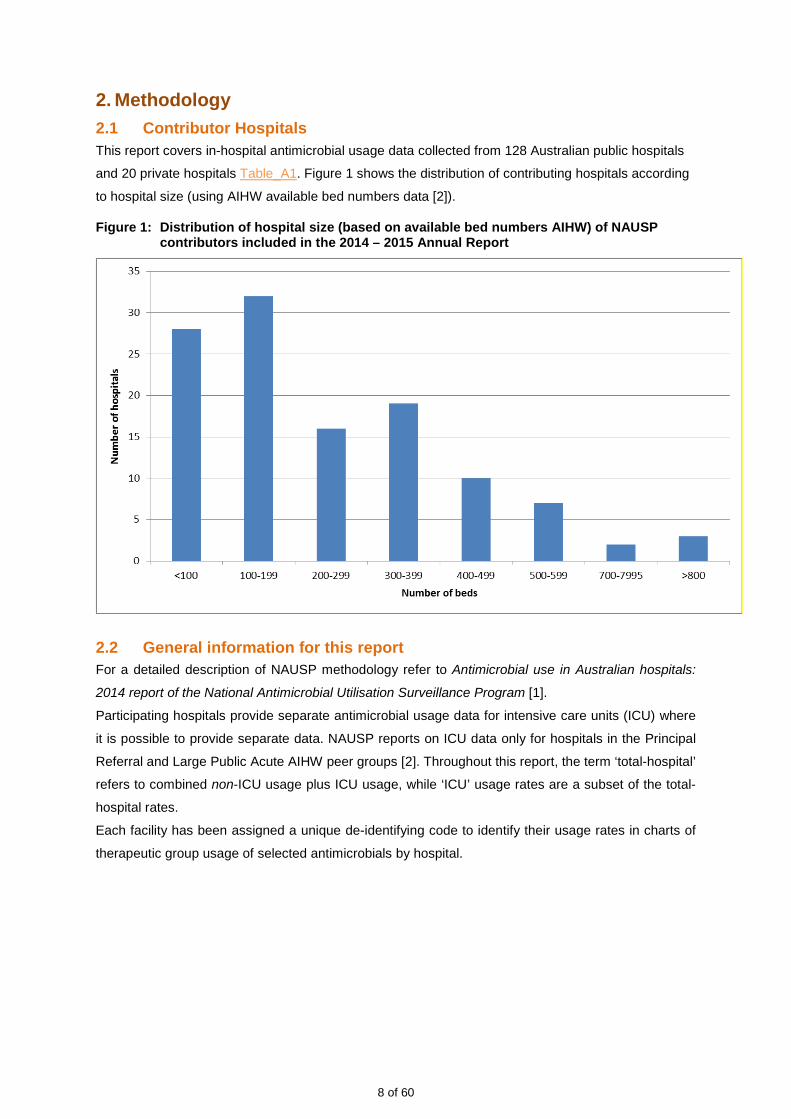
2. Methodology 2.1 Contributor Hospitals This report covers in-hospital antimicrobial usage data collected from 128 Australian public hospitals
and 20 private hospitals Table_A1. Figure 1 shows the distribution of contributing hospitals according
to hospital size (using AIHW available bed numbers data [2]).
Figure 1: Distribution of hospital size (based on available bed numbers AIHW) of NAUSP contributors included in the 2014 – 2015 Annual Report
2.2 General information for this report For a detailed description of NAUSP methodology refer to Antimicrobial use in Australian hospitals:
2014 report of the National Antimicrobial Utilisation Surveillance Program [1].
Participating hospitals provide separate antimicrobial usage data for intensive care units (ICU) where
it is possible to provide separate data. NAUSP reports on ICU data only for hospitals in the Principal
Referral and Large Public Acute AIHW peer groups [2]. Throughout this report, the term ‘total-hospital’
refers to combined non-ICU usage plus ICU usage, while ‘ICU’ usage rates are a subset of the total-
hospital rates.
Each facility has been assigned a unique de-identifying code to identify their usage rates in charts of
therapeutic group usage of selected antimicrobials by hospital.
8 of 60
3. Overview of Antimicrobial Usage Rates: July 2010 – June 2015 3.1 Overall Usage Rates Differences in antimicrobial usage rates within and between hospital services are complex,
multifactorial and may reflect casemix, microbial resistance rates or implementation of antibiotic
stewardship programs as well as changes in hospital formularies, policies and regulation. The tables
and figures below summarise aggregated antimicrobial usage rates of 27 antimicrobial classes.
NAUSP reports contain data related to antimicrobial utilisation in adult hospital in-patients only. In
contrast some European surveillance programs, such as the well-respected Danish surveillance
scheme [3], incorporate clinical antimicrobial usage data, antimicrobial resistance data, multidrug-
resistant organisms isolated from food sources, and the utility of antimicrobials as a growth factor in
agriculture.
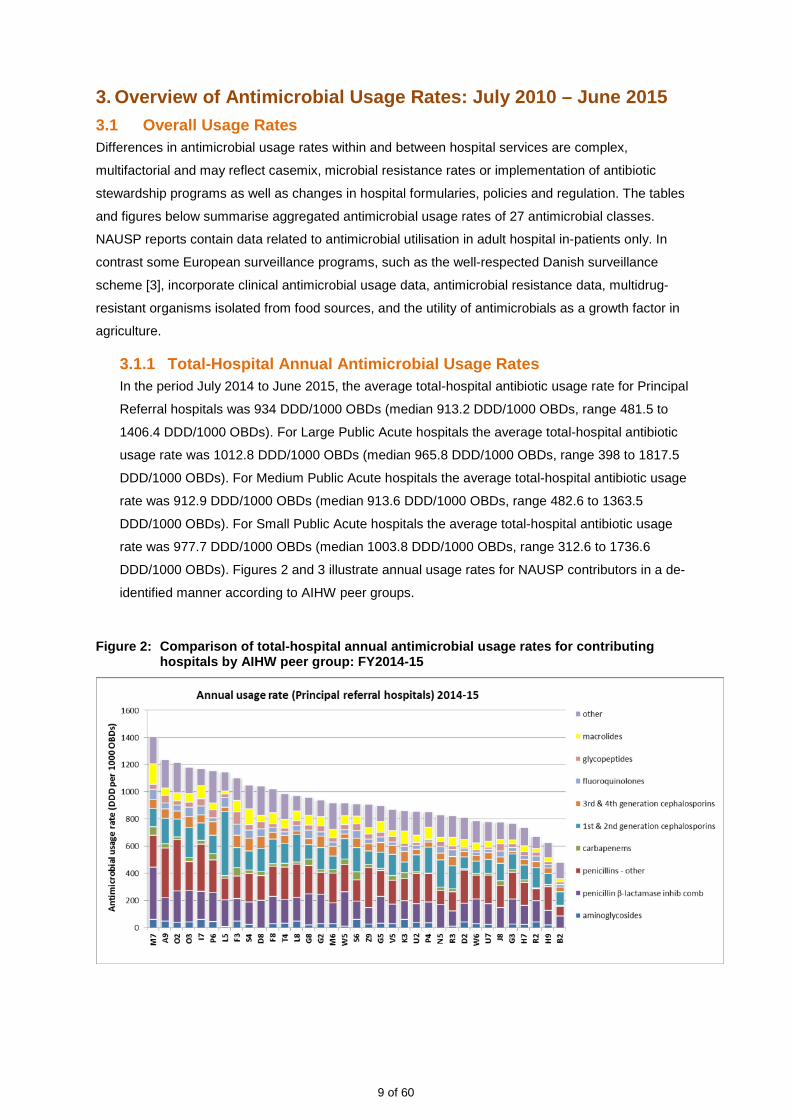
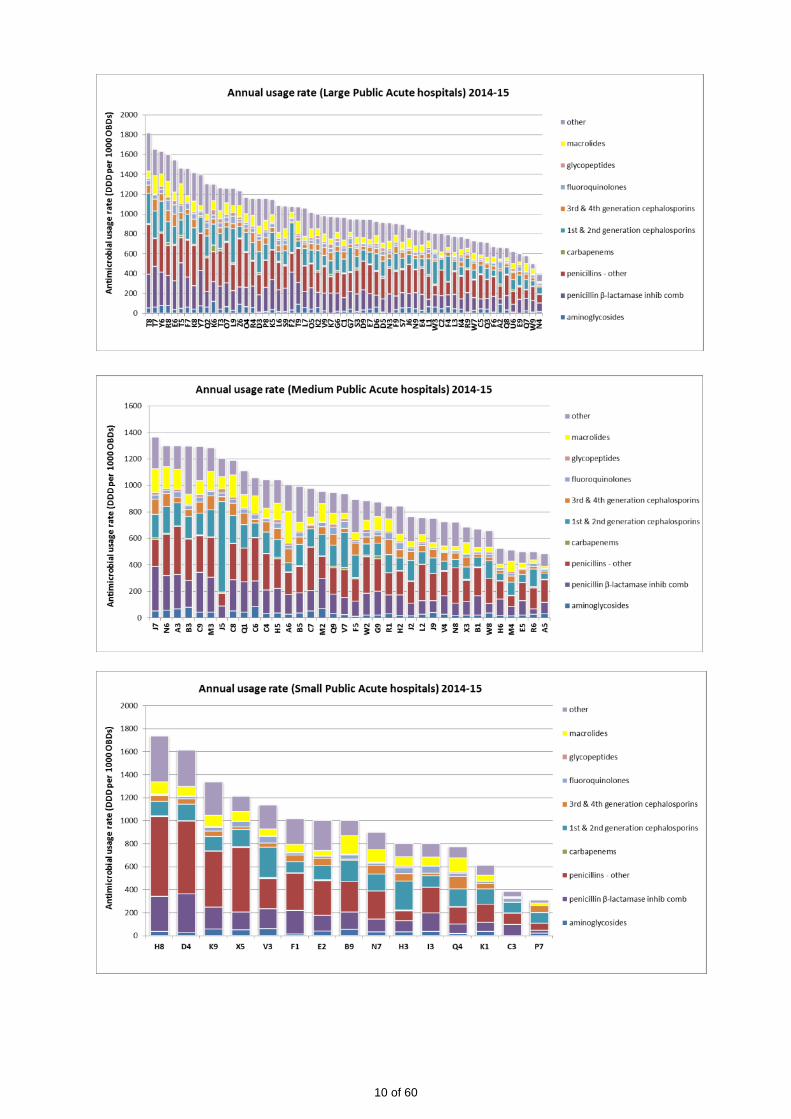
3.1.1 Total-Hospital Annual Antimicrobial Usage Rates In the period July 2014 to June 2015, the average total-hospital antibiotic usage rate for Principal
Referral hospitals was 934 DDD/1000 OBDs (median 913.2 DDD/1000 OBDs, range 481.5 to
1406.4 DDD/1000 OBDs). For Large Public Acute hospitals the average total-hospital antibiotic
usage rate was 1012.8 DDD/1000 OBDs (median 965.8 DDD/1000 OBDs, range 398 to 1817.5
DDD/1000 OBDs). For Medium Public Acute hospitals the average total-hospital antibiotic usage
rate was 912.9 DDD/1000 OBDs (median 913.6 DDD/1000 OBDs, range 482.6 to 1363.5
DDD/1000 OBDs). For Small Public Acute hospitals the average total-hospital antibiotic usage
rate was 977.7 DDD/1000 OBDs (median 1003.8 DDD/1000 OBDs, range 312.6 to 1736.6
DDD/1000 OBDs). Figures 2 and 3 illustrate annual usage rates for NAUSP contributors in a de-
identified manner according to AIHW peer groups.
Figure 2: Comparison of total-hospital annual antimicrobial usage rates for contributing hospitals by AIHW peer group: FY2014-15
9 of 60
10 of 60
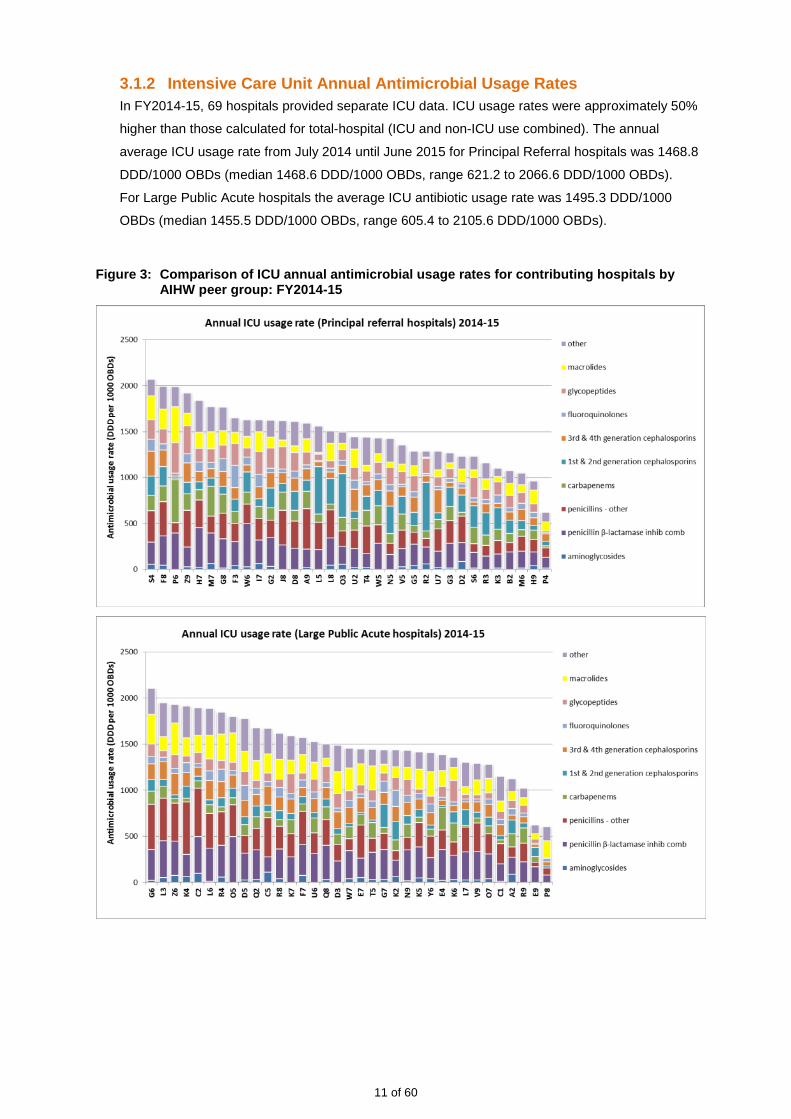
3.1.2 Intensive Care Unit Annual Antimicrobial Usage Rates In FY2014-15, 69 hospitals provided separate ICU data. ICU usage rates were approximately 50%
higher than those calculated for total-hospital (ICU and non-ICU use combined). The annual
average ICU usage rate from July 2014 until June 2015 for Principal Referral hospitals was 1468.8
DDD/1000 OBDs (median 1468.6 DDD/1000 OBDs, range 621.2 to 2066.6 DDD/1000 OBDs).
For Large Public Acute hospitals the average ICU antibiotic usage rate was 1495.3 DDD/1000
OBDs (median 1455.5 DDD/1000 OBDs, range 605.4 to 2105.6 DDD/1000 OBDs).
Figure 3: Comparison of ICU annual antimicrobial usage rates for contributing hospitals by AIHW peer group: FY2014-15
11 of 60

3.2 Usage rates by Antimicrobial Class: July 2010 to June 2015 Antimicrobial classes are categorised into therapeutic groups using the WHO Anatomical Therapeutic
Classification (ATC) system (Appendix 3).
Aggregation of contributed data into therapeutic group allows:
• assessment of relative use of particular classes;
• pooled class-specific antimicrobial usage rate comparisons between contributing hospitals;
• benchmarking with usage data from similar studies.
Changes in antimicrobial usage rates with time may occur due to several factors. Firstly changes in
prescribing practice, with constantly evolving clinical practice and establishment of AMS practices, will
be responsible for the majority of change. Another factor to be considered, which may not directly
impact on the ‘antibiotic burden’, is changes in length of inpatient stay, particularly in regard to acute
hospital admissions, as shorter inpatient stays become more common. Changes may also occur
simply through variance in WHO-defined Defined Daily Dose and doses currently used in clinical
practice.
3.2.1 Total-Hospital Antimicrobial Class Usage Rates Annual contributor usage rate data, aggregated by year and therapeutic group, for five years to
June 2015, demonstrated ongoing decline in usage rates for aminoglycosides, fluoroquinolones,
macrolides, nitroimidazoles (metronidazole), and fusidic acid. In contrast, consistent increases in
aggregated annual usage rates were observed for tetracyclines (Table 2).
12 of 60

Table 2: Total hospital antimicrobial usage rates (DDD/1000 OBD) by WHO antibiotic class: NAUSP contributors, 2010-11 to 2014-15.
Year 2010-11 2011-12 2012-13 2013-14 2014-15 Number of contributors 64 73 91 137 148 Aminoglycosides 48.5 45.2 43.0 40.3 34.8
Amphenicols 0.0 0.0 0.0 0.0 0.0 Beta-lactamase inhib comb (amoxycillin with clavulanic acid) 143.1 134.8 138.2 138.9 128.7 Beta-lactamase inhib comb (antipseudomonal#) 43.1 45.1 44.9 46.9 46.7 Beta-lactamase resistant penicillins 85.1 81.4 88.4 93.6 90.3 Beta-lactamase sensitive penicillins 28.3 22.5 26.1 27.2 30.3 Carbapenems 19.1 19.8 19.3 18.9 17.8 Extended spectrum penicillins (amoxy/ampicillin) 112.4 108.2 103.7 104.9 101.7 First generation cephalosporins 139.1 136.3 129.4 134.1 132.7 Fluoroquinolones 53.4 49.5 42.4 40.7 36.0 Fourth generation cephalosporins 5.8 5.7 5.3 5.1 5.8 Glycopeptides 32.7 32.9 29.8 27.3 25.2 Lincosamides 13.1 13.5 14.6 15.8 14.2 Macrolides 87.9 82.9 74.6 69.5 63.7 Monobactams 0.2 0.2 0.4 0.4 0.4 Nitrofurans 1.1 1.2 0.9 0.9 0.8 Nitroimidazoles (metronidazole) 51.4 50.7 45.7 43.3 38.8 Other antibacterials (daptomycin & linezolid) 1.5 1.7 2.4 2.4 2.3 Other cephalosporins and penems 0.0 0.0 0.0 0.0 0.1 Polymyxins (colistin) 0.6 0.5 0.8 0.7 0.7 Rifamycins 8.1 7.9 5.7 5.4 4.9 Second generation cephalosporins 5.6 5.7 5.3 5.5 5.8 Steroids (fusidic acid) 2.5 2.2 1.8 1.4 1.2 Streptogramins 0.3 0.4 0.6 0.5 0.5 Streptomycins 0.0 0.0 0.0 0.0 0.0 Sulphonamide/trimethoprim combinations 13.8 14.1 15.5 16.6 16.5 Tetracyclines 35.2 38.8 45.5 50.8 58.7 Third generation cephalosporins 53.2 53.1 49.3 48.3 46.9 Trimethoprim 22.6 20.4 20.1 19.7 17.1 Grand Total 1007.6 974.8 953.7 959.2 922.6
Note: Figures will vary from previous NAUSP financial year annual reports due to the inclusion of data from all contributing
hospitals.
13 of 60
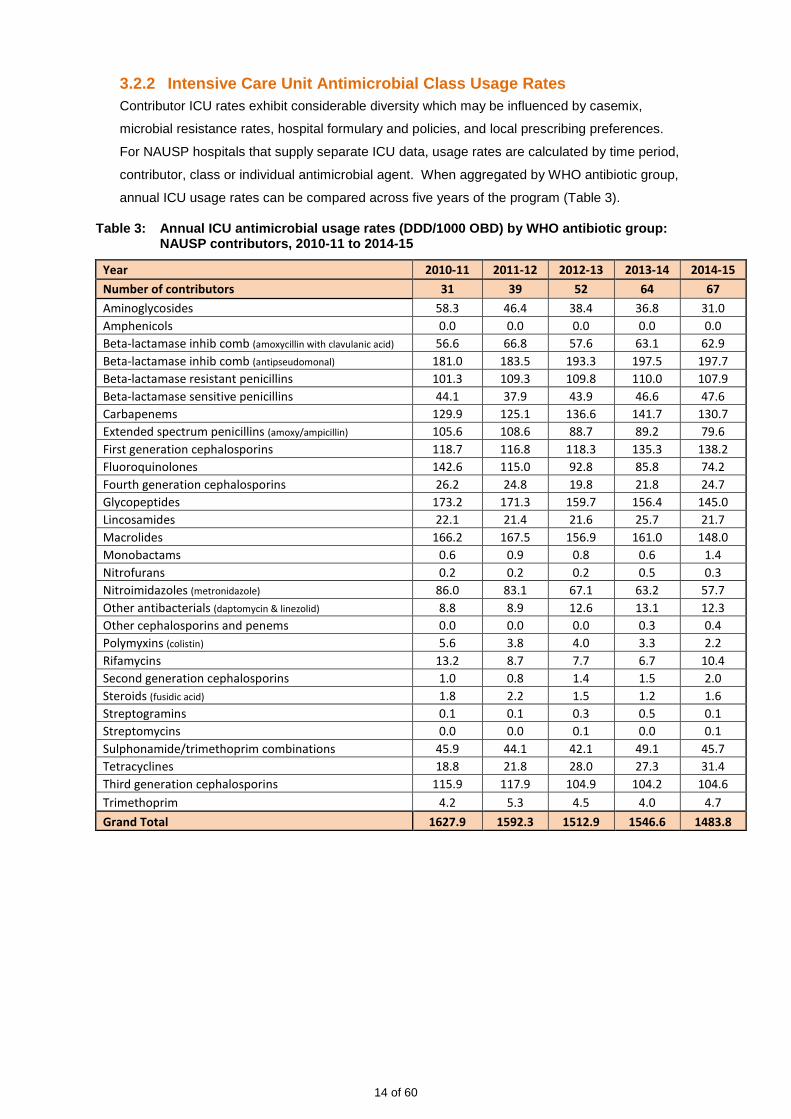
3.2.2 Intensive Care Unit Antimicrobial Class Usage Rates Contributor ICU rates exhibit considerable diversity which may be influenced by casemix,
microbial resistance rates, hospital formulary and policies, and local prescribing preferences.
For NAUSP hospitals that supply separate ICU data, usage rates are calculated by time period,
contributor, class or individual antimicrobial agent. When aggregated by WHO antibiotic group,
annual ICU usage rates can be compared across five years of the program (Table 3).
Table 3: Annual ICU antimicrobial usage rates (DDD/1000 OBD) by WHO antibiotic group: NAUSP contributors, 2010-11 to 2014-15
Year 2010-11 2011-12 2012-13 2013-14 2014-15 Number of contributors 31 39 52 64 67 Aminoglycosides 58.3 46.4 38.4 36.8 31.0 Amphenicols 0.0 0.0 0.0 0.0 0.0 Beta-lactamase inhib comb (amoxycillin with clavulanic acid) 56.6 66.8 57.6 63.1 62.9 Beta-lactamase inhib comb (antipseudomonal) 181.0 183.5 193.3 197.5 197.7 Beta-lactamase resistant penicillins 101.3 109.3 109.8 110.0 107.9 Beta-lactamase sensitive penicillins 44.1 37.9 43.9 46.6 47.6 Carbapenems 129.9 125.1 136.6 141.7 130.7 Extended spectrum penicillins (amoxy/ampicillin) 105.6 108.6 88.7 89.2 79.6 First generation cephalosporins 118.7 116.8 118.3 135.3 138.2 Fluoroquinolones 142.6 115.0 92.8 85.8 74.2 Fourth generation cephalosporins 26.2 24.8 19.8 21.8 24.7 Glycopeptides 173.2 171.3 159.7 156.4 145.0 Lincosamides 22.1 21.4 21.6 25.7 21.7 Macrolides 166.2 167.5 156.9 161.0 148.0 Monobactams 0.6 0.9 0.8 0.6 1.4 Nitrofurans 0.2 0.2 0.2 0.5 0.3 Nitroimidazoles (metronidazole) 86.0 83.1 67.1 63.2 57.7 Other antibacterials (daptomycin & linezolid) 8.8 8.9 12.6 13.1 12.3 Other cephalosporins and penems 0.0 0.0 0.0 0.3 0.4 Polymyxins (colistin) 5.6 3.8 4.0 3.3 2.2 Rifamycins 13.2 8.7 7.7 6.7 10.4 Second generation cephalosporins 1.0 0.8 1.4 1.5 2.0 Steroids (fusidic acid) 1.8 2.2 1.5 1.2 1.6 Streptogramins 0.1 0.1 0.3 0.5 0.1 Streptomycins 0.0 0.0 0.1 0.0 0.1 Sulphonamide/trimethoprim combinations 45.9 44.1 42.1 49.1 45.7 Tetracyclines 18.8 21.8 28.0 27.3 31.4 Third generation cephalosporins 115.9 117.9 104.9 104.2 104.6 Trimethoprim 4.2 5.3 4.5 4.0 4.7 Grand Total 1627.9 1592.3 1512.9 1546.6 1483.8
14 of 60

4. Antimicrobial Usage Rates by Individual Agents The following section contains charts of antimicrobial usage rates showing utilisation of individual agents,
by ICU and total-hospital (ICU plus non-ICU usage) categories, and demonstrates trends over the last
five years. Contributor numbers increased from 64 to 148 during this period, and those also providing
separate ICU data rose from 31 to 67. Data for ICU antimicrobial usage are drawn from Principal Referral
and Large Public Acute hospitals only.
Additional data regarding usage in the FY2014-15 for individual hospitals are presented for four AIHW
peer groups. (Note: private hospital contributors have been included in these charts and have been
assigned a peer group by NAUSP according to the hospital size and patient mix.)
4.1 Aminoglycosides – amikacin, gentamicin, tobramycin Gentamicin is the most commonly used aminoglycoside in Australia, although usage rates in both
total-hospital and ICU settings have steadily decreased over the previous five years (Figure 4).
Amikacin and tobramycin usage rates remain low compared to gentamicin rates. However, large
variations in use occur between individual hospitals for individual aminoglycosides (Figures 5 & 6).
Higher usage rates of tobramycin appear to be confined to larger hospitals with referral services for
cystic fibrosis patients.
Figure 4: ICU and total (ICU plus non-ICU) aminoglycoside usage rates over a 5 year period 2010-2015 (using 3-month moving average) – NB differences in scale between ICU and total rates
Note: tobramycin usage rates include inhaled formulations
15 of 60

Figure 5: Total hospital (ICU plus non-ICU) usage rates FY 2014-15 by AIHW peer group: aminoglycosides - NB differences in scale between peer group charts
16 of 60
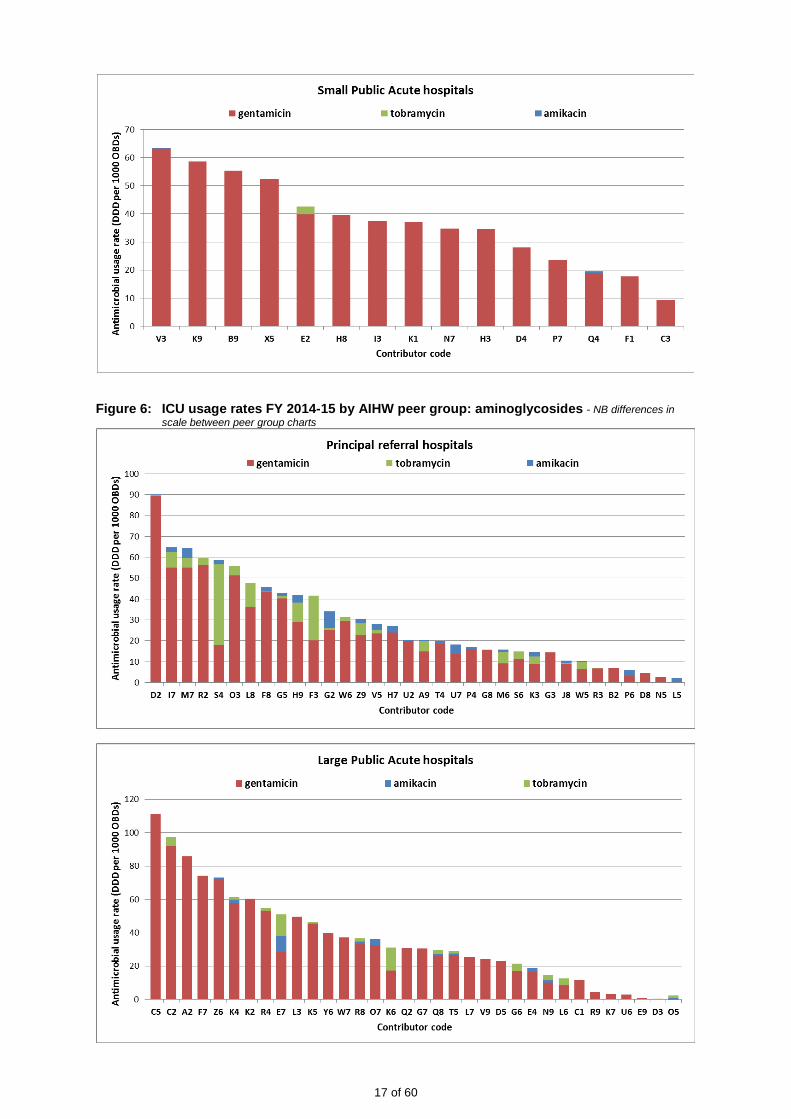
Figure 6: ICU usage rates FY 2014-15 by AIHW peer group: aminoglycosides - NB differences in scale between peer group charts
17 of 60

4.2 Carbapenems – doripenem, ertapenem, imipenem, meropenem Meropenem is the dominant carbapenem used in Australian hospitals. Meropenem has become a key
reserve-line antibiotic with the increasing incidence of infections with extended spectrum beta-
lactamase-producing microorganisms (ESBLs). Some highly resistant Enterobacteriaceae, such as
the carbapenemase-producing Klebsiella species may be carried in asymptomatic individuals’ gut
flora and, due to international travel, the potential for these occurring in Australia requires constant
vigilance.
Figure 7: ICU and total (ICU plus non-ICU) carbapenem usage rates over a 5 year period 2010-2015 (using 3-month moving average) – NB differences in scale between ICU and total rates
Figure 8: Total hospital (ICU plus non-ICU) usage rates FY 2014-15 by AIHW peer group: carbapenems - NB differences in scale between peer group charts
18 of 60

19 of 60

Figure 9: ICU usage rates FY 2014-15 by AIHW peer group: carbapenems - NB differences in scale between peer group charts
20 of 60

4.3 Cephalosporins – cephalexin, cephalothin, cephazolin, ceftriaxone, cefotaxime, ceftazidime, cefepime
First generation cephalosporins are one of the most widely used antibiotic classes in Australian
hospitals. Use of cephazolin in ICU is increasing and appears to be accompanied by a decline in
usage rates of ceftriaxone (Figure 10). The second generation cephalosporins – cefaclor, cefuroxime
and cefoxitin – are used at very low rates (usage negligible in ICU settings) and have been omitted
from this report.
The third generation cephalosporin, ceftriaxone, shows a pattern of seasonal use for both non-ICU
and ICU settings, reflecting its role in the treatment of respiratory infections. Overall, rates of third
generation cephalosporin use have trended downwards slightly over the previous five years in both
ICU and non-ICU usage (Figure 10). ICU usage rates are 2.5 times greater than those in non-ICU
settings, and inter-hospital variation is large. The use of the fourth generation cephalosporin cefepime
is relatively low, and large variations occur between the contributing sites (Figures 11 & 12).
Figure 10: ICU and total (non-ICU + ICU) cephalosporin usage rates over a 5 year period 2010-2015 (using 3-month moving average) – NB differences in scale between ICU and non-ICU
Note: 2nd generation cephalosporins usage minimal (<5 DDD per 1000 OBDs per month) and these agents are not shown
21 of 60

Figure 11: Total hospital (ICU plus non-ICU) usage rates FY 2014-15 by AIHW peer group: first generation cephalosporins - NB differences in scale between peer group charts
22 of 60
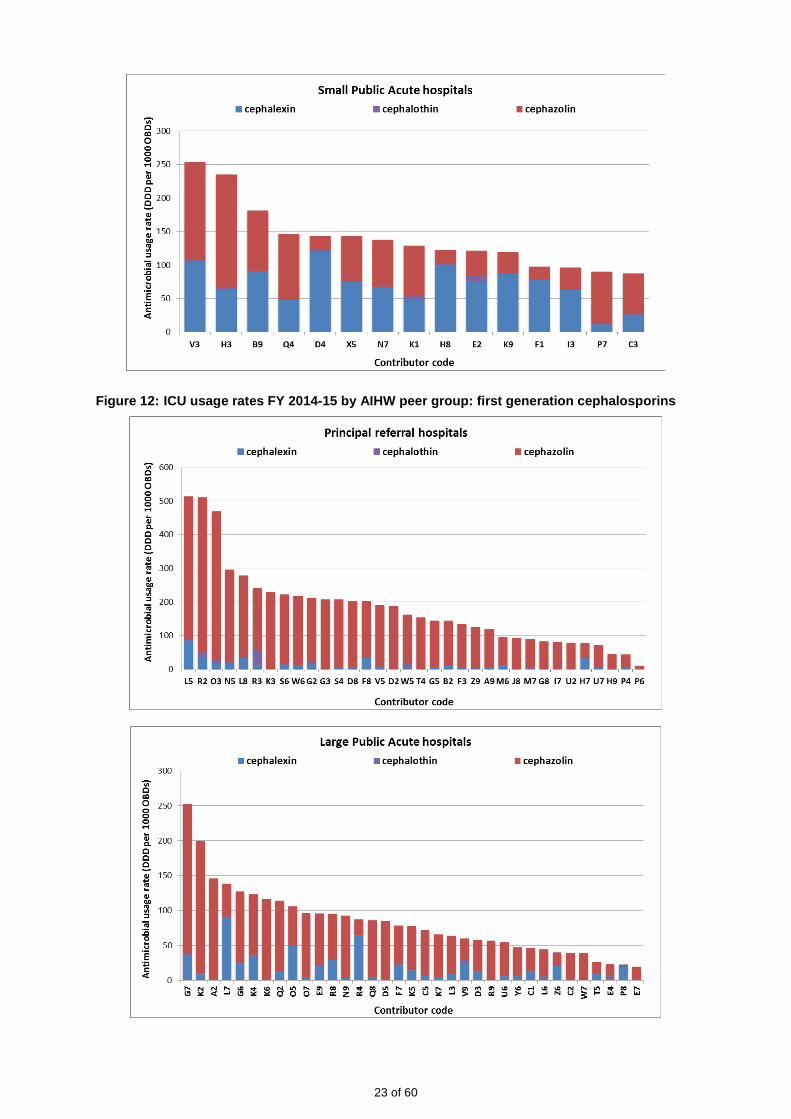
Figure 12: ICU usage rates FY 2014-15 by AIHW peer group: first generation cephalosporins
23 of 60

Figure 13: Total hospital (ICU plus non-ICU) usage rates FY 2014-15 by AIHW peer group: third and fourth generation cephalosporins - NB differences in scale between peer group charts
24 of 60

25 of 60

Figure 14: ICU usage rates FY 2014-15 by AIHW peer group: third and fourth generation cephalosporins
26 of 60
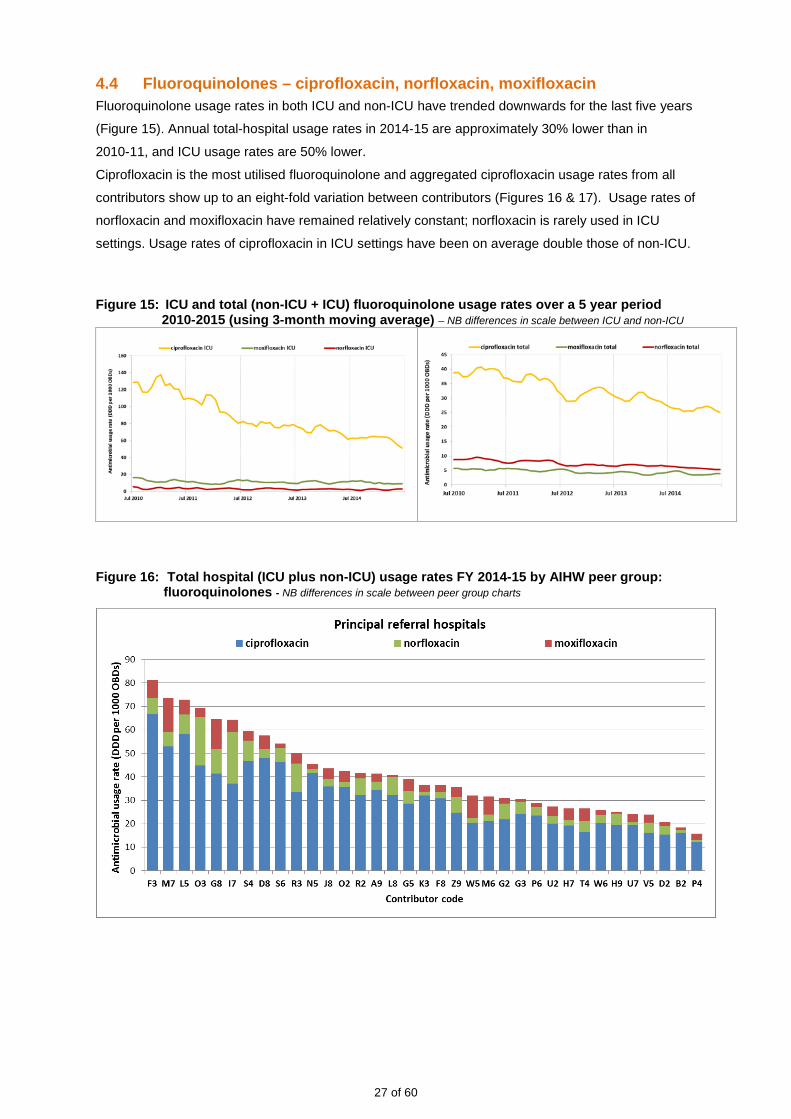
4.4 Fluoroquinolones – ciprofloxacin, norfloxacin, moxifloxacin Fluoroquinolone usage rates in both ICU and non-ICU have trended downwards for the last five years
(Figure 15). Annual total-hospital usage rates in 2014-15 are approximately 30% lower than in
2010-11, and ICU usage rates are 50% lower.
Ciprofloxacin is the most utilised fluoroquinolone and aggregated ciprofloxacin usage rates from all
contributors show up to an eight-fold variation between contributors (Figures 16 & 17). Usage rates of
norfloxacin and moxifloxacin have remained relatively constant; norfloxacin is rarely used in ICU
settings. Usage rates of ciprofloxacin in ICU settings have been on average double those of non-ICU.
Figure 15: ICU and total (non-ICU + ICU) fluoroquinolone usage rates over a 5 year period
2010-2015 (using 3-month moving average) – NB differences in scale between ICU and non-ICU
Figure 16: Total hospital (ICU plus non-ICU) usage rates FY 2014-15 by AIHW peer group: fluoroquinolones - NB differences in scale between peer group charts
27 of 60

28 of 60

Figure 17: ICU usage rates FY 2014-15 by AIHW peer group: fluoroquinolones - NB differences in scale between peer group charts
29 of 60

4.5 Glycopeptides – vancomycin, teicoplanin Vancomycin and teicoplanin are the only glycopeptides available in Australia. Since 2010, aggregated
vancomycin usage rates have decreased, particularly in non-ICU settings (Figure 18). As a result
total-hospital usage rates have fallen by approximately 20% between FY 2010-11 and FY 2014-15.
Although aggregate monthly teicoplanin usage remains low, large variations in usage rates occur
between sites (Figures 19 and 20). ICU vancomycin usage rates are approximately six times those of
non-ICU.
Figure 18: ICU and total (ICU plus non-ICU) glycopeptide usage rates over a 5 year period 2010-2015 (using 3-month moving average) – NB differences in scale between ICU and total rates
Figure 19: Total hospital (ICU plus non-ICU) usage rates FY 2014-15 by AIHW peer group: glycopeptides - NB differences in scale between peer group charts
30 of 60

31 of 60
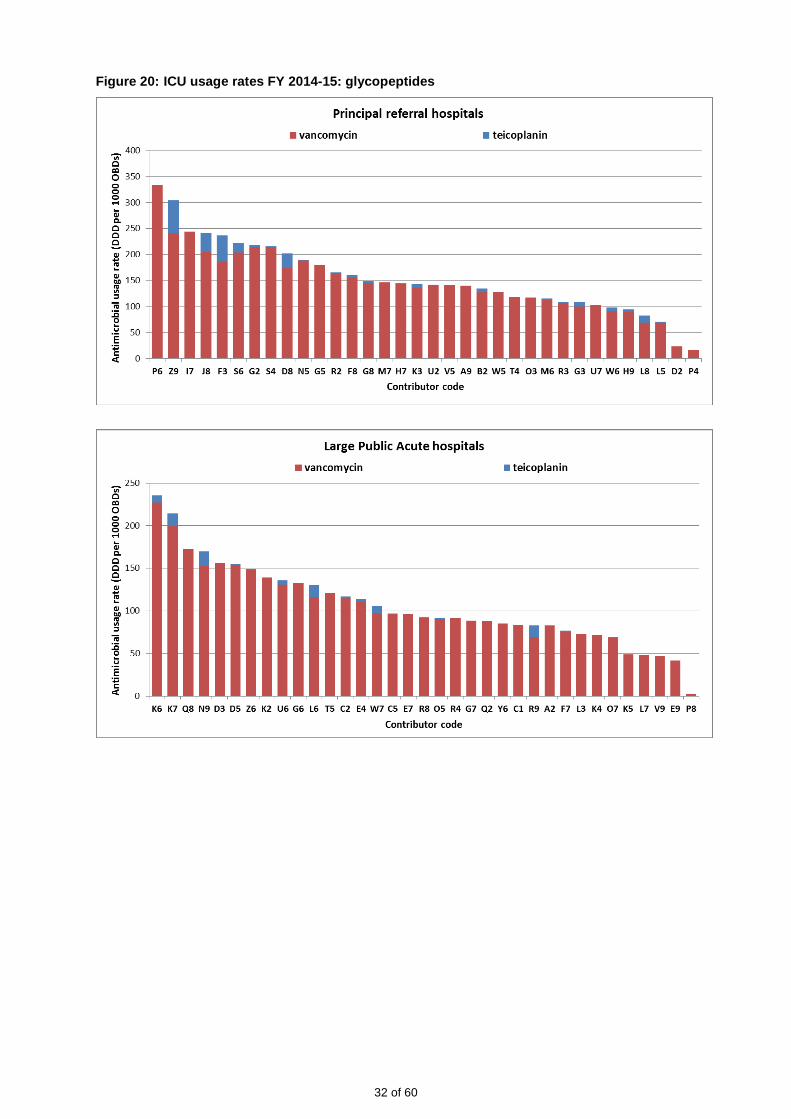
Figure 20: ICU usage rates FY 2014-15: glycopeptides
32 of 60

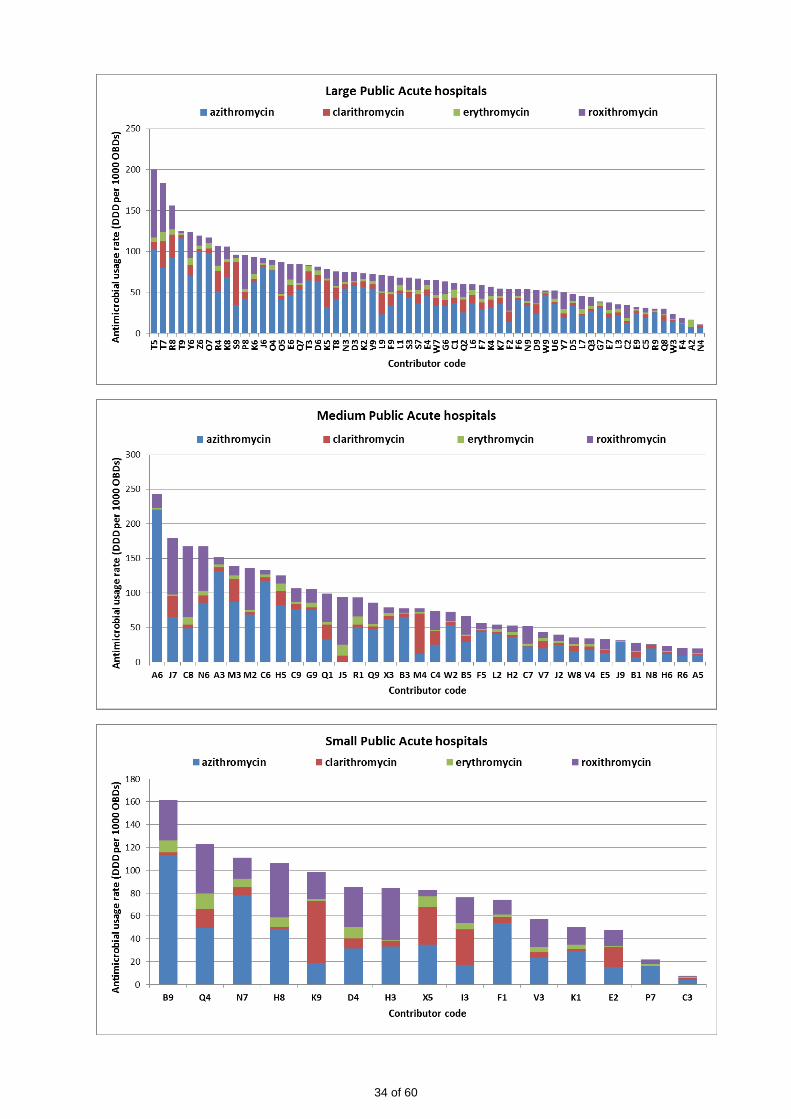
4.6 Macrolides – azithromycin, clarithromycin, erythromycin, roxithromycin Marked seasonal variation is evident in the monthly usage rates for both azithromycin and
roxithromycin, with maximum usage rates in the winter months (Figure 21). Large variations in usage
rates occur between individual hospitals; this may be related to differing patterns of prescribing for the
treatment of community acquired pneumonia (Figures 22 & 23). Usage rates of roxithromycin have
decreased since 2010, possibly due to a shift in prescribing recommendations to azithromycin[2].
Figure 21: ICU and total (ICU plus non-ICU) macrolide usage rates over a 5 year period 2010-2015 (using 3-month moving average) – NB differences in scale between ICU and total rates
Figure 22: Total hospital (ICU plus non-ICU) usage rates FY 2014-15 by AIHW peer group: macrolides - NB differences in scale between peer group charts
33 of 60
34 of 60

Figure 23: ICU usage rates FY 2014-15 by AIHW peer group: macrolides - NB differences in scale between peer group charts
35 of 60
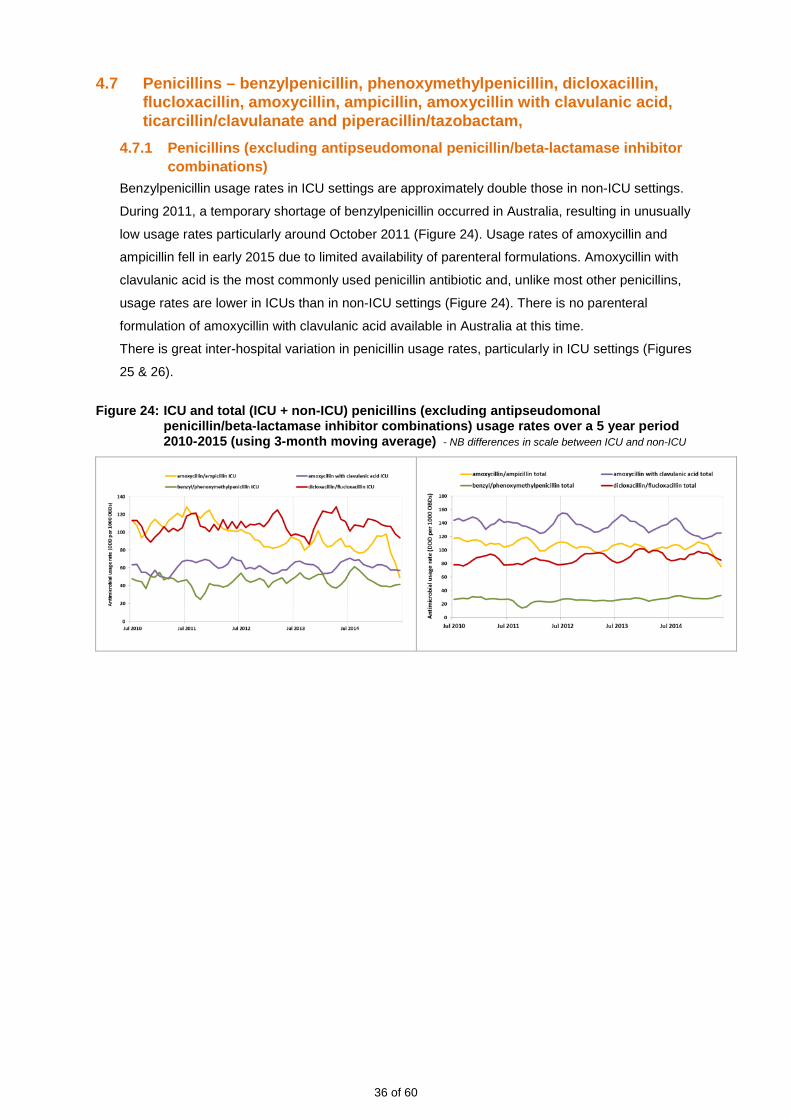
4.7 Penicillins – benzylpenicillin, phenoxymethylpenicillin, dicloxacillin, flucloxacillin, amoxycillin, ampicillin, amoxycillin with clavulanic acid, ticarcillin/clavulanate and piperacillin/tazobactam,
4.7.1 Penicillins (excluding antipseudomonal penicillin/beta-lactamase inhibitor combinations)
Benzylpenicillin usage rates in ICU settings are approximately double those in non-ICU settings.
During 2011, a temporary shortage of benzylpenicillin occurred in Australia, resulting in unusually
low usage rates particularly around October 2011 (Figure 24). Usage rates of amoxycillin and
ampicillin fell in early 2015 due to limited availability of parenteral formulations. Amoxycillin with
clavulanic acid is the most commonly used penicillin antibiotic and, unlike most other penicillins,
usage rates are lower in ICUs than in non-ICU settings (Figure 24). There is no parenteral
formulation of amoxycillin with clavulanic acid available in Australia at this time.
There is great inter-hospital variation in penicillin usage rates, particularly in ICU settings (Figures
25 & 26).
Figure 24: ICU and total (ICU + non-ICU) penicillins (excluding antipseudomonal penicillin/beta-lactamase inhibitor combinations) usage rates over a 5 year period 2010-2015 (using 3-month moving average) - NB differences in scale between ICU and non-ICU
36 of 60
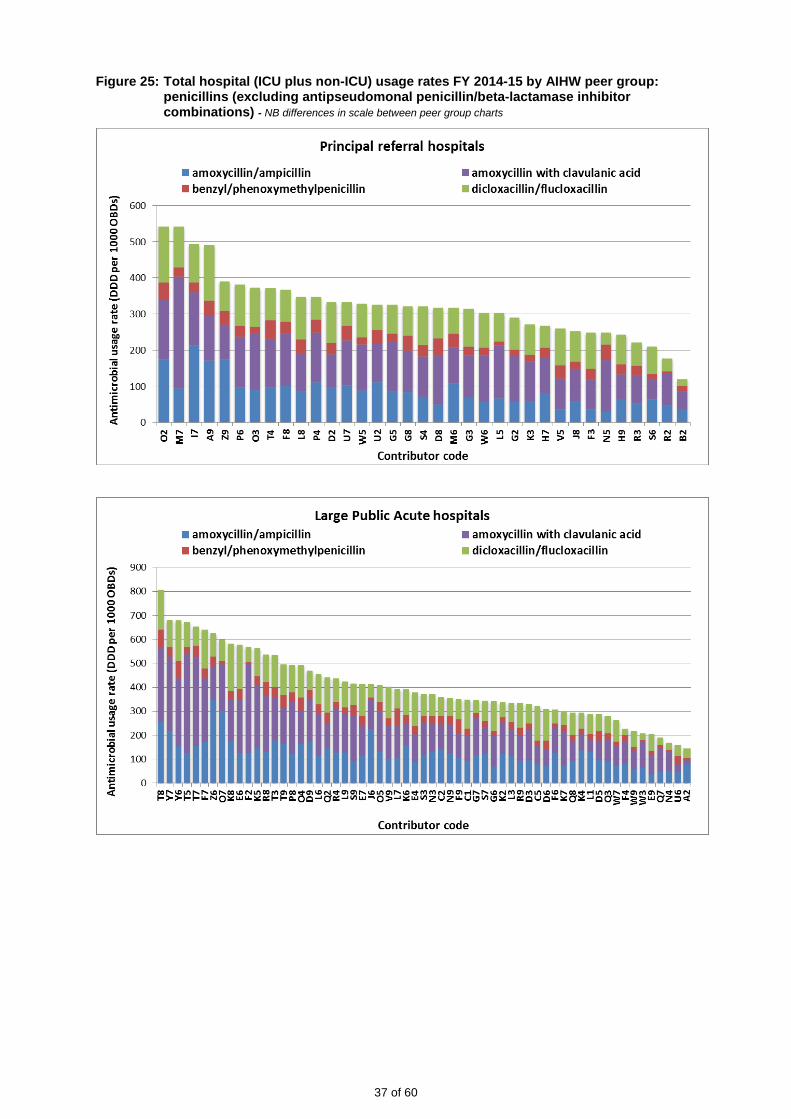
Figure 25: Total hospital (ICU plus non-ICU) usage rates FY 2014-15 by AIHW peer group: penicillins (excluding antipseudomonal penicillin/beta-lactamase inhibitor combinations) - NB differences in scale between peer group charts
37 of 60

38 of 60
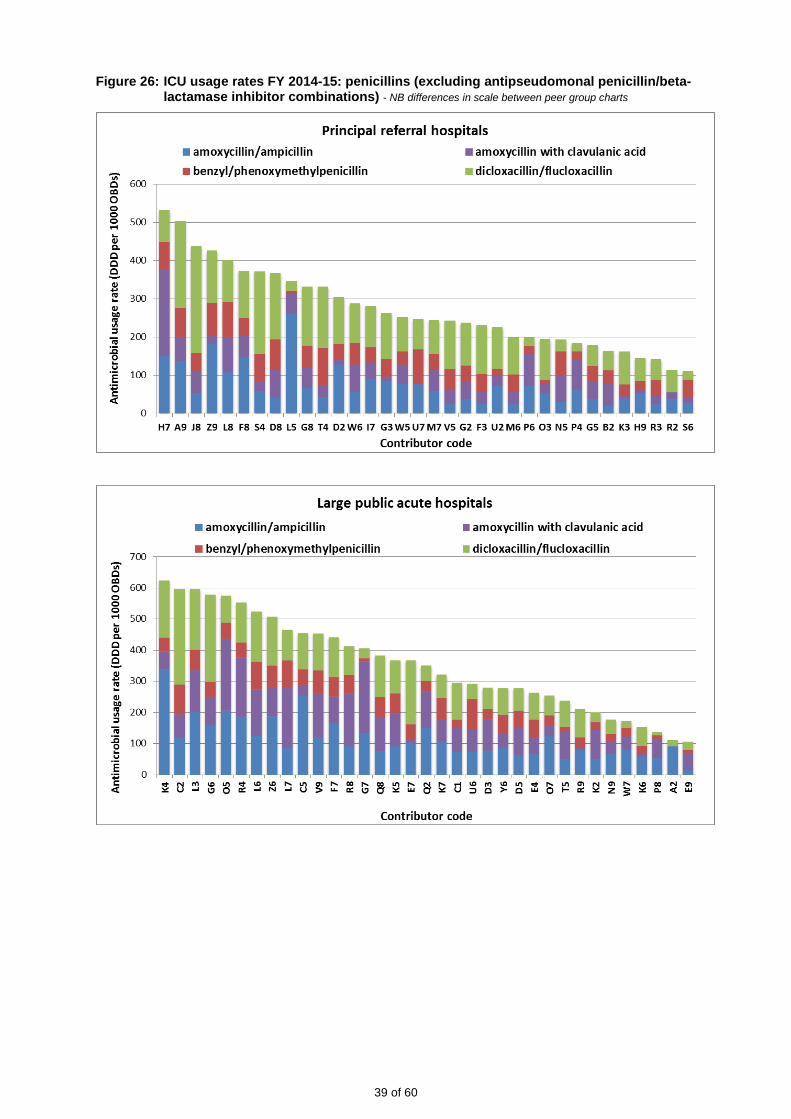
Figure 26: ICU usage rates FY 2014-15: penicillins (excluding antipseudomonal penicillin/beta-lactamase inhibitor combinations) - NB differences in scale between peer group charts
39 of 60

4.7.2 Antipseudomonal penicillin/beta-lactamase inhibitor combinations National usage rates of two antipseudomonal penicillin/beta-lactamase inhibitor combinations
(ticarcillin/clavulanate and piperacillin/tazobactam) increased steadily until 2010; since then, a
drop in usage rates of ticarcillin/clavulanate has been accompanied by an increase in use of
piperacillin/tazobactam combinations (Figure 27). A possible explanation for this changeover is the
decreased cost of piperacillin/tazobactam as generic formulations became available. Usage of
ticarcillin with clavulanic acid is now minimal. Piperacillin/tazobactam’s anaerobic spectrum makes
it suitable for use in critically ill patients, including those with polymicrobial abdominal infections.
A reduction in the use of metronidazole in recent years has accompanied the increased use of
piperacillin/tazobactam [1]. Usage rates of piperacillin/tazobactam in ICU are nearly five times
higher than non-ICU rates.
Figure 27: ICU and total (non-ICU + ICU) ticarcillin/clavulanate and piperacillin/tazobactam usage rates over a 5 year period 2010-2015 (using 3-month moving average) - NB differences in scale between ICU and non-ICU
Although this pattern is consistent in both ICU and total hospital usage rates, wide variations occur
between facilities (Figures 28 & 29).
Piperacillin/tazobactam is used in ICU for indications such as suspected pseudomonal ventilator
associated pneumonia, and out of the ICU setting in multiple patient groups including
haematology-oncology patients and those with severe mixed aerobic/anaerobic infections.
Amoxycillin with clavulanic acid does not have antipseudomonal properties and is not available as
a parenteral formulation in Australia. This may explain its predominance in non-ICU cases. It has a
range of indications including de-escalation from parenteral antimicrobial agents.
40 of 60
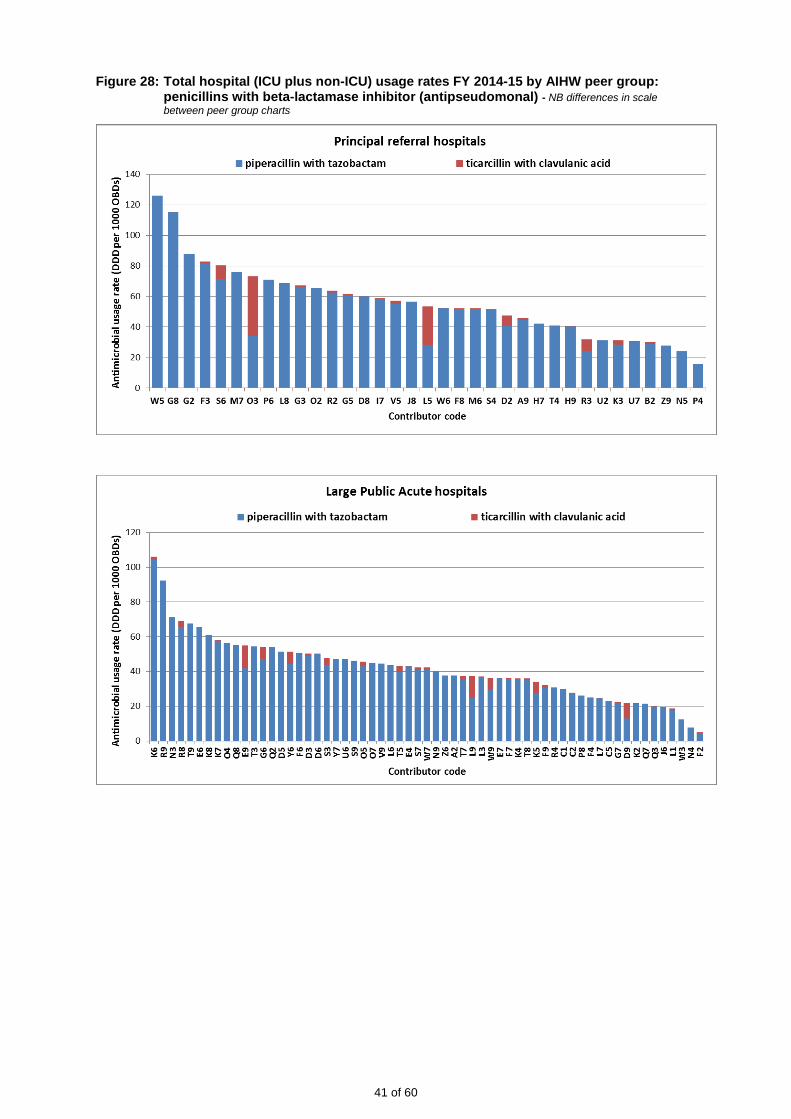
Figure 28: Total hospital (ICU plus non-ICU) usage rates FY 2014-15 by AIHW peer group: penicillins with beta-lactamase inhibitor (antipseudomonal) - NB differences in scale between peer group charts
41 of 60

42 of 60

Figure 29: ICU usage rates FY 2014-15: penicillins with beta-lactamase inhibitor (antipseudomonal) - NB differences in scale between peer group charts
43 of 60
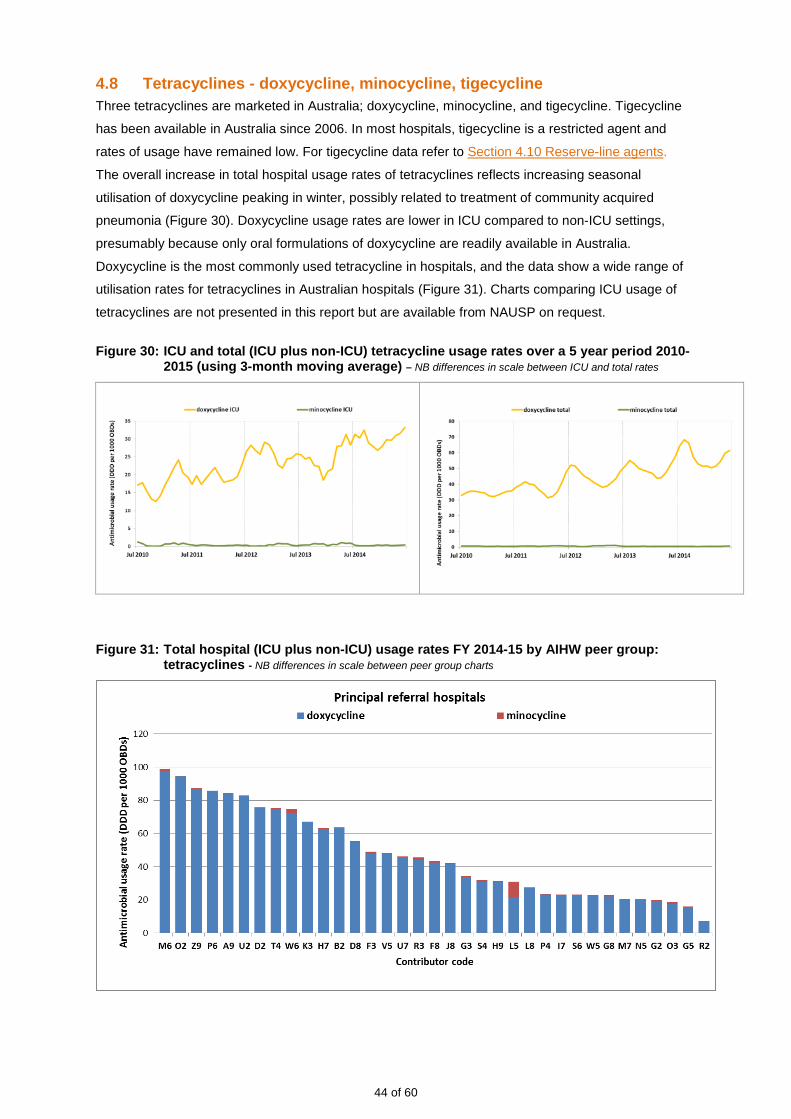
4.8 Tetracyclines - doxycycline, minocycline, tigecycline Three tetracyclines are marketed in Australia; doxycycline, minocycline, and tigecycline. Tigecycline
has been available in Australia since 2006. In most hospitals, tigecycline is a restricted agent and
rates of usage have remained low. For tigecycline data refer to Section 4.10 Reserve-line agents.
The overall increase in total hospital usage rates of tetracyclines reflects increasing seasonal
utilisation of doxycycline peaking in winter, possibly related to treatment of community acquired
pneumonia (Figure 30). Doxycycline usage rates are lower in ICU compared to non-ICU settings,
presumably because only oral formulations of doxycycline are readily available in Australia.
Doxycycline is the most commonly used tetracycline in hospitals, and the data show a wide range of
utilisation rates for tetracyclines in Australian hospitals (Figure 31). Charts comparing ICU usage of
tetracyclines are not presented in this report but are available from NAUSP on request.
Figure 30: ICU and total (ICU plus non-ICU) tetracycline usage rates over a 5 year period 2010-2015 (using 3-month moving average) – NB differences in scale between ICU and total rates
Figure 31: Total hospital (ICU plus non-ICU) usage rates FY 2014-15 by AIHW peer group: tetracyclines - NB differences in scale between peer group charts
44 of 60

45 of 60
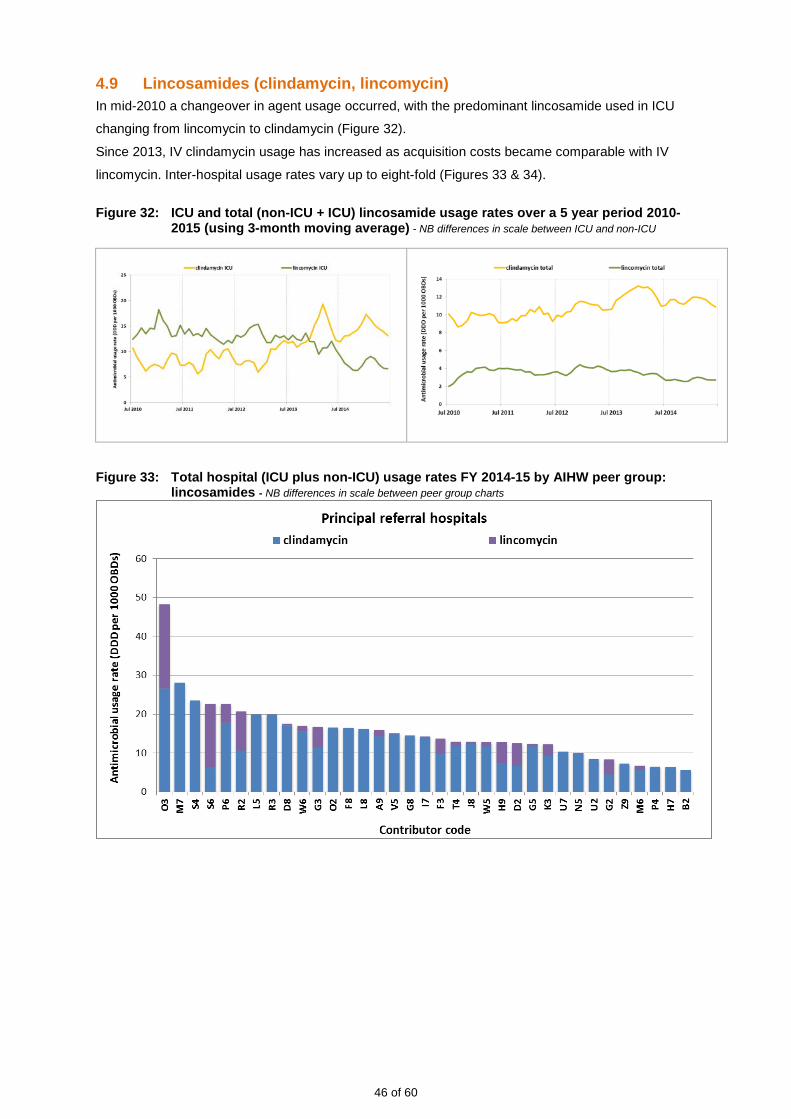
4.9 Lincosamides (clindamycin, lincomycin) In mid-2010 a changeover in agent usage occurred, with the predominant lincosamide used in ICU
changing from lincomycin to clindamycin (Figure 32).
Since 2013, IV clindamycin usage has increased as acquisition costs became comparable with IV
lincomycin. Inter-hospital usage rates vary up to eight-fold (Figures 33 & 34).
Figure 32: ICU and total (non-ICU + ICU) lincosamide usage rates over a 5 year period 2010-
2015 (using 3-month moving average) - NB differences in scale between ICU and non-ICU
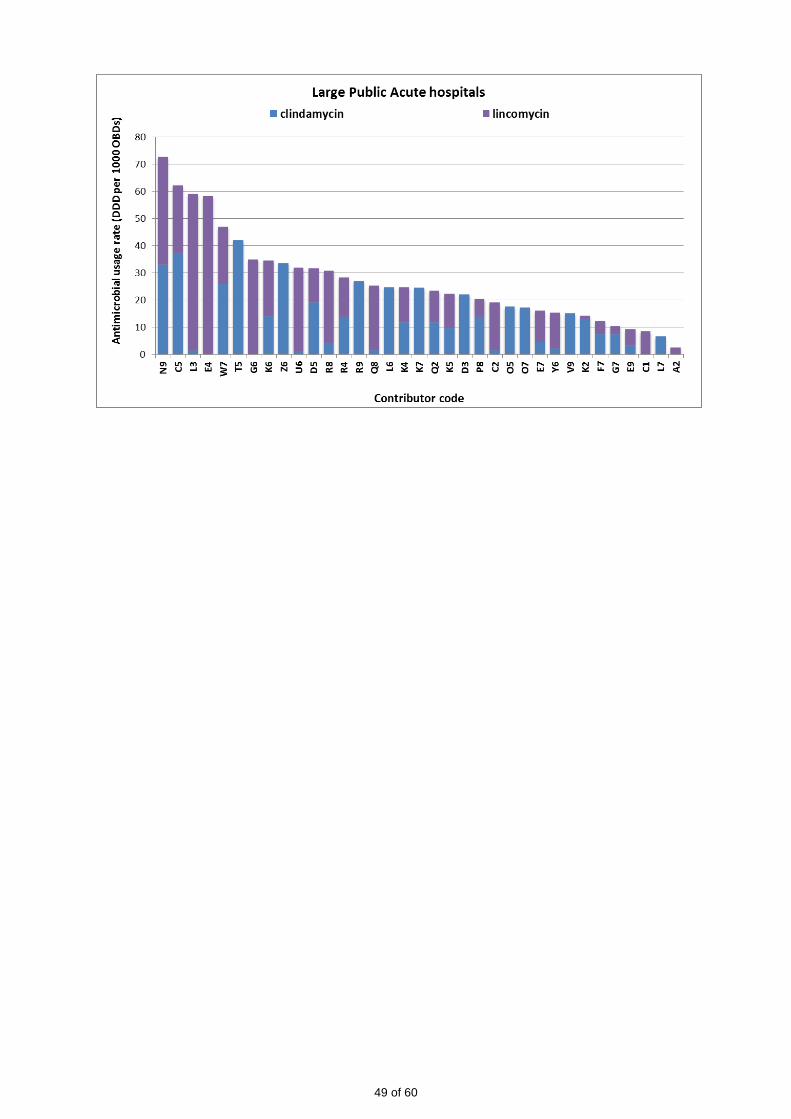
Figure 33: Total hospital (ICU plus non-ICU) usage rates FY 2014-15 by AIHW peer group:
lincosamides - NB differences in scale between peer group charts
46 of 60

47 of 60

Figure 34: ICU usage rates FY 2014-15 by AIHW peer group: lincosamides - NB differences in scale
between peer group charts
48 of 60
49 of 60

4.10 Reserve-line agents (linezolid, colistin, daptomycin, tigecycline) Linezolid usage is minimal in most Australian hospitals. ICU usage of this agent is very much greater
than non-ICU usage, indicating that it is reserved for the severely ill. Non-ICU rates remain stable
(Figure 35). Although usage rates are low there is marked inter-hospital variation (see Figures 36 &
37). Linezolid is used to treat infections with vancomycin-resistant enterococci (VRE). This multidrug-
resistant organism is becoming more prevalent in Australia. Data are not yet available to determine if
linezolid use can be correlated with prevalence of VRE infections.
Usage rates of daptomycin, although low, are increasing in non-ICU and ICU settings (Figure 35).
Parenteral colistin has become an important agent in the treatment of carbapenemase-producing
multi resistant Gram negative organisms where meropenem is ineffective. It should be noted that
colistin usage rates are inclusive of both nebulised and parenteral formulations, as some contributors
are not able to provide data differentiating between these delivery types (See also Figures 36 & 37).
Tigecycline usage remains very low in Australian hospitals and is almost wholly confined to ICU
settings. Although overall usage rates are low in ICU (average less than 2.5 DDD per 1000 OBDs
over the last five years), inter-hospital rates vary greatly (Figures 36 & 37).
Figure 35: ICU and total (ICU plus non-ICU) ‘reserve’ agents – colistin, daptomycin, linezolid and tigecycline - usage rates over a 5 year period 2010-2015 (using 3-month moving average) – NB differences in scale between ICU and total rates
50 of 60
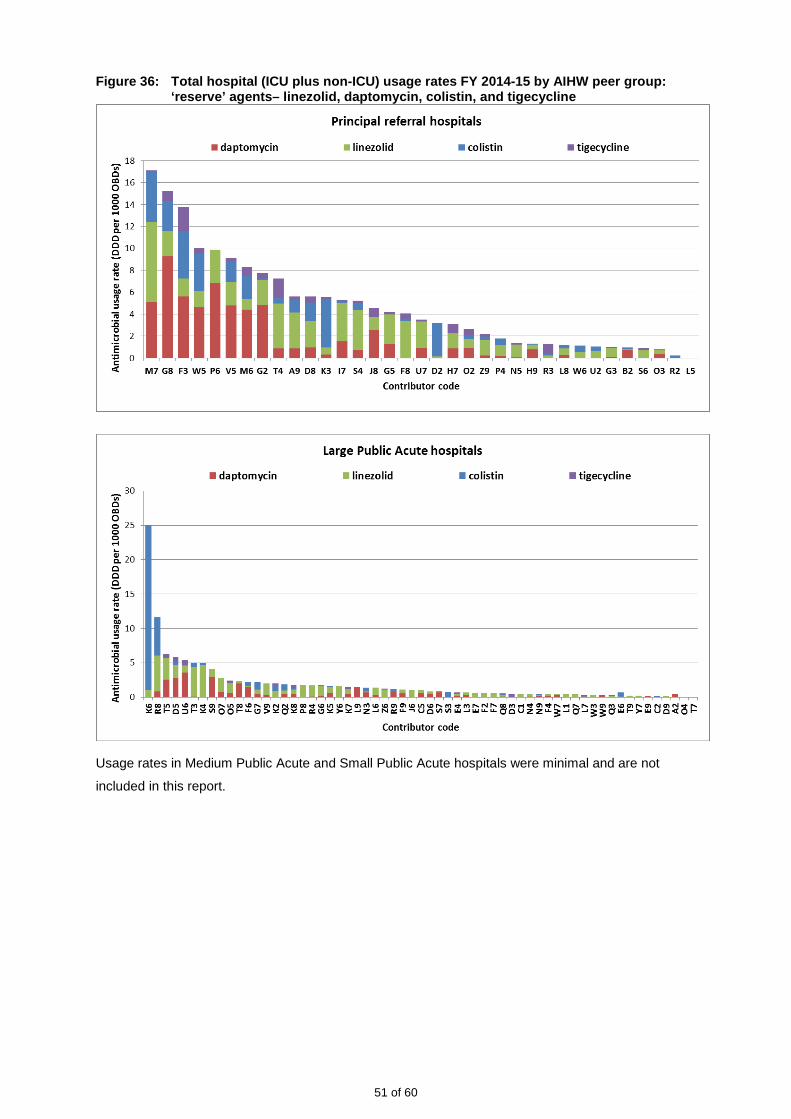
Figure 36: Total hospital (ICU plus non-ICU) usage rates FY 2014-15 by AIHW peer group: ‘reserve’ agents– linezolid, daptomycin, colistin, and tigecycline
Usage rates in Medium Public Acute and Small Public Acute hospitals were minimal and are not
included in this report.
51 of 60

Figure 37: ICU usage rates FY 2014-15 by AIHW peer group: ‘reserve’ agents– linezolid, daptomycin, colistin, and tigecycline FYE 2015:
52 of 60

5. Discussion Prudent antimicrobial prescribing is a primary tool for reducing the emergence of widespread
antimicrobial resistance in microbial pathogens. Consistent measurement of antimicrobial
consumption is essential for evaluating and monitoring interventions implemented through
antimicrobial stewardship programs and is a core component for the objective of correlating antibiotic
use with bacterial resistance patterns. Antimicrobial Stewardship (AMS) is now included in the
National Safety and Quality Health Service Standards (NSQHSS) implemented in 2013 [4]. The
number of contributors to NAUSP has increased as sites utilise the program as a means to undertake
surveillance and optimise monitoring of local use of antimicrobials. In particular, the numbers of
medium- and small-sized hospitals now participating in NAUSP have increased in recent years. As a
result national aggregate usage rates have been increasingly influenced by usage rates in less acute
hospitals.
NAUSP adopted new benchmarking peer groups as a result of revision of AIHW categories in 2013. It
would be expected that hospitals within each peer group would show similarities in antimicrobial
usage patterns; however marked variations are apparent both within and between peer groups. For
example, some Large Public Acute hospitals showed usage rates higher than those for Principal
Referral hospitals for several classes (see fluoroquinolones, macrolides, third generation
cephalosporins, tetracyclines). Nevertheless, variations in quantity and type of antimicrobials used
will vary within peer groups where some hospitals are referral centres for conditions where
antimicrobials are used extensively (e.g. cystic fibrosis or transplant services). Data presented by
NAUSP should be interpreted by individual hospitals with this in mind. Unexpected high or low usage
rates of particular classes of antimicrobials should be followed up with specific audits (for example
using the National Antimicrobial Prescribing Survey tool) to determine appropriateness of prescribing.
The drive for an increased understanding of antimicrobial usage patterns in Australian hospitals is
increasing and NAUSP provides a rich data source for analyses of these usage patterns. AMS
programs aim for optimisation of antimicrobial use and minimisation of potential selection pressure by
antimicrobial agents on the development of resistance in pathogens [5]. Surveillance of hospital
antimicrobial data in a consistent manner enables identification and investigation of changes in usage
that may be linked to the development of resistance, and measurement of the impact of AMS
programs.
While the DDD/OBDs measure is widely accepted by some international surveillance programs for
antibiotic usage rates and enables benchmarking between institutions, it does not account for patient
variability and actual dose administered. [6]. Research is still lacking to determine if the DDD/OBDs
metric is indeed a good measure of correlation with antibiotic-associated risks [7, 8]. A further
limitation of the DDD is the lack of definitions for paediatric populations, which prohibits incorporation
of antimicrobial data relating to children into NAUSP.
Usage rates of fluoroquinolones and aminoglycosides continue previous years’ trends downwards,
both in total-hospital and the ICU setting. Usage rates of these classes in 2014-2015 are
approximately 50% lower than in 2010-2011. Australian usage of fluoroquinolones has been
consistently lower than in European countries such as Denmark, Sweden and The Netherlands [3, 9,
10].
53 of 60
Doxycycline shows a trend upwards (both in ICU and non-ICU settings) and usage is seasonal, being
highest in winter months. This could be due to a number of factors including shifting prescribing
preferences (perhaps from ceftriaxone to doxycycline for community acquired pneumonia) or
increased incidence in diseases where doxycycline is the appropriate antibiotic therapy. Identifying
reasons for these trends is beyond the scope of NAUSP analysis.
Cephazolin usage rates have increased and may reflect the recommendation in the latest version of
Therapeutic Guidelines: Antibiotic of surgical prophylactic doses of 2 grams for adults [11].
Since 2011, usage rates of third generation cephalosporins have trended downwards slowly, although
rates fluctuate each year in the winter months. The decline in usage in Australian hospitals may or
may not be the result of active AMS interventions. Notably some Large Public Acute, Medium Public
Acute and even a number of Small Public Acute hospitals have usage rates similar to the Principal
Referral hospitals. This may indicate an area for targeted AMS intervention.
For many classes ICU usage rates are significantly greater than non-ICU rates. For example,
utilisation of carbapenems, glycopeptides and the highly reserved agents daptomycin and linezolid in
ICU is many fold greater higher than the non-ICU rate (see Tables 2 and 3). NAUSP data support that
the majority of use is indeed in severely ill (ICU) patients. Nevertheless, ongoing vigilance is needed
with these agents. The use of carbapenems can promote emergence of carbapenemase-producing
organisms, which are frequently resistant to most antibiotics and thus an important emerging threat to
healthcare [12].
Among the “last-line” antibiotics with minimal usage is daptomycin, an agent active against Gram-
positive infections and used to treat skin and soft tissue infections [13]. Usage rates trended upwards
between 2012 and 2014. Rates in Australia are now stable and still very low.
At present, data for antimicrobial consumption in psychiatric hospitals, paediatrics, and residential
care are not collected, and data concerning consumption in the community are limited. A more
complete picture of antimicrobial use in Australia will be obtained once surveillance systems are
developed for all sectors. The linking of microbial resistance pattern data with prescribing practices in
Australian hospitals is one of the aims of a nationally coordinated surveillance system [14]. The
Antimicrobial Usage and Resistance (AURA) surveillance project, led by the ACSQHC, commenced in
October 2013. Its goal is to establish an Australia-wide integrated surveillance system for
antimicrobial resistance and antimicrobial utilisation [15]. NAUSP is a key component of this national
surveillance system providing passive surveillance data for antimicrobial utilisation in the hospital
sector.
Acknowledgements Funding for the National Antimicrobial Utilisation Surveillance Program was provided by the
Commonwealth Department of Health through the Australian Commission on Safety and Quality in
Health Care.
We thank all contributors to the program who voluntarily provide monthly data to SA Department for
Health and Ageing.
54 of 60

6. References 1. NAUSP. Antimicrobial use in Australian hospitals: 2014 annual report of the National Antimicrobial Utilisation
Surveillance Program. September 2015; Available from: http://www.safetyandquality.gov.au/national-priorities/amr-and-au-surveillance-project/national-antimicrobial-utilisation-surveillance-program/ www.sahealth.sa.gov.au/nausp.
2. AIHW. Australian hospital statistics 2012-13 Appendix C: Public hospital peer groups. 2014; Available from: http://www.aihw.gov.au/WorkArea/DownloadAsset.aspx?id=60129547084.
3. DANMAP. Use of antimicrobial agents and occurrence of antimicrobial resistance in bacteria from food animals, food and humans in Denmark. 2013; Available from: http://www.danmap.org/~/media/Projekt%20sites/Danmap/DANMAP%20reports/DANMAP%202013/DANMAP%202013.ashx?utm_source=DN+Nyhedsbreve&utm_campaign=dba67a1145-DN_Nyhedsbrev_uge_39_2014&utm_medium=email&utm_term=0_16ebc33b07-dba67a1145-42049169.
4. ACSQHC. Standard 3 Preventing and Controlling Healthcare Associated Inffections Safety and Quality Improvement Guide. 2012; Available from: http://www.safetyandquality.gov.au/wp-content/uploads/2012/10/Standard3_Oct_2012_WEB.pdf.
5. ACSQHC, Antimicrobial Stewardship in Australian Hospitals 2011, ed. M. Duguid and M. Cruikshank. 2010, Sydney.
6. Muller, A., et al., Discrepancies between prescribed daily doses and WHO defined daily doses of antibacterials at a university hospital. British Journal of Clinical Pharmacology, 2006. 61(5): p. 585-91.
7. Berrington, A., Antimicrobial prescribing in hospitals: be careful what you measure. Journal of Antimicrobial Chemotherapy, 2010. 65: p. 163-168.
8. De With, K., et al., Comparison of Defined versus Recommended versus Prescribed Daily doses for measuring hospital antibiotic consumption. Infection, 2009. 37(4): p. 349-352.
9. STRAMA. SWEDRES - SVARM 2013 Use of antimicrobials and occurrence of antimicrobial resistance in Sweden. 2013; Available from: http://www.folkhalsomyndigheten.se/pagefiles/17612/Swedres-Svarm-2013.pdf.
10. SWAB. NethMap 2014 Consumption of antimicrobial agents and antimicrobial resistance among medically important bacteria in the Netherlands. 2014 [cited 2015 13th April]; Available from: http://www.wageningenur.nl/upload_mm/1/a/1/0704c512-5b42-4cef-8c1b-60e9e3fb2a62_NethMap-MARAN2014.pdf.
11. Antibiotic Expert Groups, Therapeutic Guidelines: Antibiotic. Version 15. 2014, Melbourne: Therapeutic Guidelines Limited.
12. Glasner, C., et al., Carbapenemase-producing Enterobacteriaceae in Europe: A survey among national experts from 39 countries, February 2013. Eurosurveillance, 2013. 18(28).
13. Wang, S.Z., et al., The safety and efficacy of daptomycin versus other antibiotics for skin and soft tissue infections: a meta-analysis of randomised controlled trials. BMJ Open, 2013. 4: p. 1-11.
14. Shaban, R.Z., et al., National Surveillance and Reporting of Antimicrobial Resistance and Antibiotic Usage for Human Health in Australia. 2013, Sydney: Commonwealth of Australia.
15. ACSQHC. Antimicrobial Resistance and Antimicrobial Utilisation Surveillance Project Available from: http://www.safetyandquality.gov.au/national-priorities/amr-and-au-surveillance-project/.
55 of 60
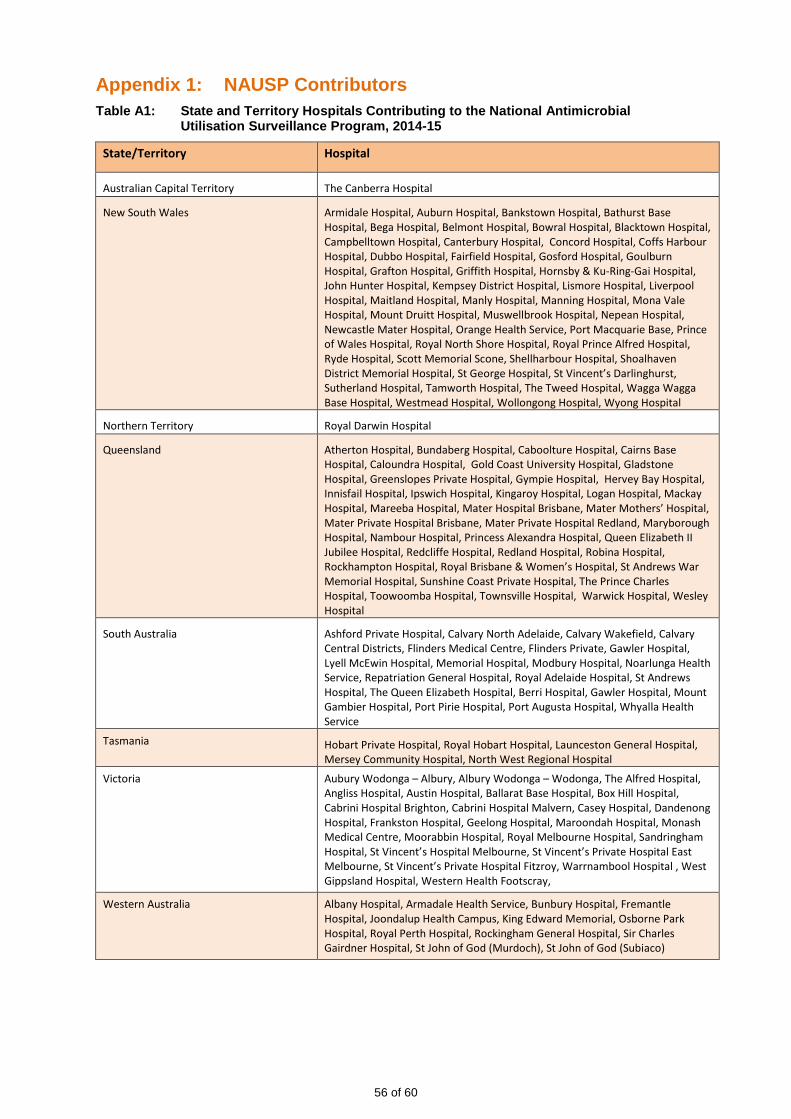
Appendix 1: NAUSP Contributors Table A1: State and Territory Hospitals Contributing to the National Antimicrobial
Utilisation Surveillance Program, 2014-15
State/Territory Hospital
Australian Capital Territory The Canberra Hospital
New South Wales Armidale Hospital, Auburn Hospital, Bankstown Hospital, Bathurst Base Hospital, Bega Hospital, Belmont Hospital, Bowral Hospital, Blacktown Hospital, Campbelltown Hospital, Canterbury Hospital, Concord Hospital, Coffs Harbour Hospital, Dubbo Hospital, Fairfield Hospital, Gosford Hospital, Goulburn Hospital, Grafton Hospital, Griffith Hospital, Hornsby & Ku-Ring-Gai Hospital, John Hunter Hospital, Kempsey District Hospital, Lismore Hospital, Liverpool Hospital, Maitland Hospital, Manly Hospital, Manning Hospital, Mona Vale Hospital, Mount Druitt Hospital, Muswellbrook Hospital, Nepean Hospital, Newcastle Mater Hospital, Orange Health Service, Port Macquarie Base, Prince of Wales Hospital, Royal North Shore Hospital, Royal Prince Alfred Hospital, Ryde Hospital, Scott Memorial Scone, Shellharbour Hospital, Shoalhaven District Memorial Hospital, St George Hospital, St Vincent’s Darlinghurst, Sutherland Hospital, Tamworth Hospital, The Tweed Hospital, Wagga Wagga Base Hospital, Westmead Hospital, Wollongong Hospital, Wyong Hospital
Northern Territory Royal Darwin Hospital
Queensland Atherton Hospital, Bundaberg Hospital, Caboolture Hospital, Cairns Base Hospital, Caloundra Hospital, Gold Coast University Hospital, Gladstone Hospital, Greenslopes Private Hospital, Gympie Hospital, Hervey Bay Hospital, Innisfail Hospital, Ipswich Hospital, Kingaroy Hospital, Logan Hospital, Mackay Hospital, Mareeba Hospital, Mater Hospital Brisbane, Mater Mothers’ Hospital, Mater Private Hospital Brisbane, Mater Private Hospital Redland, Maryborough Hospital, Nambour Hospital, Princess Alexandra Hospital, Queen Elizabeth II Jubilee Hospital, Redcliffe Hospital, Redland Hospital, Robina Hospital, Rockhampton Hospital, Royal Brisbane & Women’s Hospital, St Andrews War Memorial Hospital, Sunshine Coast Private Hospital, The Prince Charles Hospital, Toowoomba Hospital, Townsville Hospital, Warwick Hospital, Wesley Hospital
South Australia Ashford Private Hospital, Calvary North Adelaide, Calvary Wakefield, Calvary Central Districts, Flinders Medical Centre, Flinders Private, Gawler Hospital, Lyell McEwin Hospital, Memorial Hospital, Modbury Hospital, Noarlunga Health Service, Repatriation General Hospital, Royal Adelaide Hospital, St Andrews Hospital, The Queen Elizabeth Hospital, Berri Hospital, Gawler Hospital, Mount Gambier Hospital, Port Pirie Hospital, Port Augusta Hospital, Whyalla Health Service
Tasmania Hobart Private Hospital, Royal Hobart Hospital, Launceston General Hospital, Mersey Community Hospital, North West Regional Hospital
Victoria Aubury Wodonga – Albury, Albury Wodonga – Wodonga, The Alfred Hospital, Angliss Hospital, Austin Hospital, Ballarat Base Hospital, Box Hill Hospital, Cabrini Hospital Brighton, Cabrini Hospital Malvern, Casey Hospital, Dandenong Hospital, Frankston Hospital, Geelong Hospital, Maroondah Hospital, Monash Medical Centre, Moorabbin Hospital, Royal Melbourne Hospital, Sandringham Hospital, St Vincent’s Hospital Melbourne, St Vincent’s Private Hospital East Melbourne, St Vincent’s Private Hospital Fitzroy, Warrnambool Hospital , West Gippsland Hospital, Western Health Footscray,
Western Australia Albany Hospital, Armadale Health Service, Bunbury Hospital, Fremantle Hospital, Joondalup Health Campus, King Edward Memorial, Osborne Park Hospital, Royal Perth Hospital, Rockingham General Hospital, Sir Charles Gairdner Hospital, St John of God (Murdoch), St John of God (Subiaco)
56 of 60
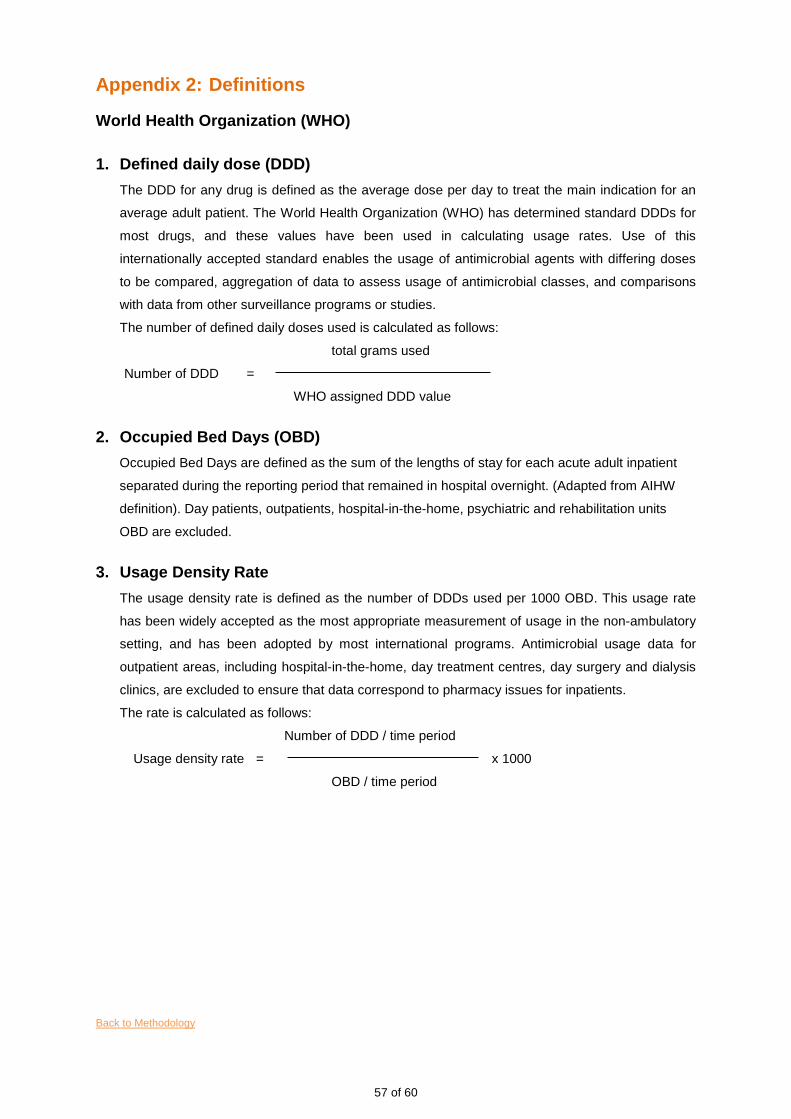
Appendix 2: Definitions
World Health Organization (WHO)
1. Defined daily dose (DDD) The DDD for any drug is defined as the average dose per day to treat the main indication for an
average adult patient. The World Health Organization (WHO) has determined standard DDDs for
most drugs, and these values have been used in calculating usage rates. Use of this
internationally accepted standard enables the usage of antimicrobial agents with differing doses
to be compared, aggregation of data to assess usage of antimicrobial classes, and comparisons
with data from other surveillance programs or studies.
The number of defined daily doses used is calculated as follows:
total grams used
Number of DDD =
WHO assigned DDD value
2. Occupied Bed Days (OBD) Occupied Bed Days are defined as the sum of the lengths of stay for each acute adult inpatient
separated during the reporting period that remained in hospital overnight. (Adapted from AIHW
definition). Day patients, outpatients, hospital-in-the-home, psychiatric and rehabilitation units
OBD are excluded.
3. Usage Density Rate The usage density rate is defined as the number of DDDs used per 1000 OBD. This usage rate
has been widely accepted as the most appropriate measurement of usage in the non-ambulatory
setting, and has been adopted by most international programs. Antimicrobial usage data for
outpatient areas, including hospital-in-the-home, day treatment centres, day surgery and dialysis
clinics, are excluded to ensure that data correspond to pharmacy issues for inpatients.
The rate is calculated as follows:
Number of DDD / time period
Usage density rate = x 1000
OBD / time period
Back to Methodology
57 of 60

Appendix 3: WHO Defined Daily Doses (DDD) for antibacterial agents included in NAUSP Annual Report (2014-15)
ATC CLASSIFICATION GENERIC NAME DDD(g) ROUTE
J01AA TETRACYCLINES J01AA02 Doxycycline 0.1 O,P J01AA08 Minocycline 0.2 O,P J01AA12 Tigecycline 0.1 P
J01C β-LACTAM ANTIBACTERIALS, PENICILLINS J01CA Penicillins with extended spectrum without anti-pseudomonal activity
J01CA01 Ampicillin 2 O,P J01CA04 Amoxycillin 1 O,P
J01CE β-lactamase sensitive penicillins J01CE01 Benzylpenicillin 3.6 P J01CE02 Phenoxymethylpenicillin 2 O J01CE08 Benzathine benzylpenicillin 3.6 P
J01CF β -lactamase resistant penicillins J01CF01 Dicloxacillin 2 O,P J01CF05 Flucloxacillin 2 O,P
J01CR Combinations of penicillins, incl. β-lactamase inhibitors without anti-pseudomonal activity
J01CR02 Amoxycillin and enzyme inhibitor 1 O with anti-pseudomonal activity
J01CR03 Ticarcillin and enzyme inhibitor 15 P J01CR05 Piperacillin and enzyme inhibitor 14 P
J01D OTHER β -LACTAM ANTIBACTERIALS J01DB First generation cephalosporins
J01DB01 Cefalexin 2 O J01DB03 Cefalotin 4 P J01DB04 Cefazolin 3 P
J01DD Third generation cephalosporins J01DD01 Cefotaxime 4 P J01DD02 Ceftazidime 4 P J01DD04 Ceftriaxone 2 P
J01DE Fourth generation cephalosporins J01DE01 Cefepime 2 P
J01DH Carbapenems J01DH02 Meropenem 2 P J01DH51 Imipenem and enzyme inhibitor 2 P J01DH03 Ertapenem 1 P J01DH04 Doripenem 1.5 P
P = parenteral, O = oral, Inh = inhalation solution
58 of 60

J01F MACROLIDES, LINCOSAMIDES AND STREPTOGRAMINS J01FA Macrolides
J01FA01 Erythromycin 1 O,P J01FA01 Erythromycin ethylsuccinate 2 O J01FA06 Roxithromycin 0.3 O J01FA09 Clarithromycin 0.5 O J01FA10 Azithromycin 0.3 O J01FA10 Azithromycin 0.5 P
J01FF Lincosamides J01FF01 Clindamycin 1.2 O J01FF01 Clindamycin 1.8 P J01FF02 Lincomycin 1.8 O,P
J01GB AMINOGLYCOSIDE ANTIBACTERIALS J01GB01 Tobramycin 0.24 P J01GB01 Tobramycin 0.3 Inh sol J01GB01 Tobramycin 0.112 Inh pdr J01GB03 Gentamicin 0.24 P J01GB06 Amikacin 1 P
J01MA QUINOLONE ANTIBACTERIALS J01MA02 Ciprofloxacin 1 O J01MA02 Ciprofloxacin 0.5 P J01MA06 Norfloxacin 0.8 O J01MA14 Moxifloxacin 0.4 O,P
J01X OTHER ANTIBACTERIALS J01XA Glycopeptide antibacterials
J01XA01 Vancomycin 2 O,P J01XA02 Teicoplanin 0.4 P
J01XB Polymyxins J01XB01 Colistin 3MU P, Inh
J01XX Other antibacterials J01XX08 Linezolid 1.2 O,P J01XX09 Daptomycin 0.28 P
P = parenteral, O = oral, Inh = inhalation solution, R = rectal,
Back to Executive Summary | Back to Methodology | Back to Chapter4
59 of 60

For more information
Infection Control Service Public Health and Clinical Systems Department for Health and Ageing 11 Hindmarsh Square Adelaide, South Australia 5000 Telephone: 1300 232 272 www.sahealth.sa.gov.au Public-I2-A2
© Department for Health and Ageing, Government of South Australia. All rights reserved