NATIONAL ACCOUNTS INDICATORS
29
NATIONAL ACCOUNTS INDICATORS THIRD QUARTER 2016
Transcript of NATIONAL ACCOUNTS INDICATORS

NATIONAL ACCOUNTS INDICATORS
THIRD QUARTER 2016
National Accounts Indicators Third Quarter 2016
2
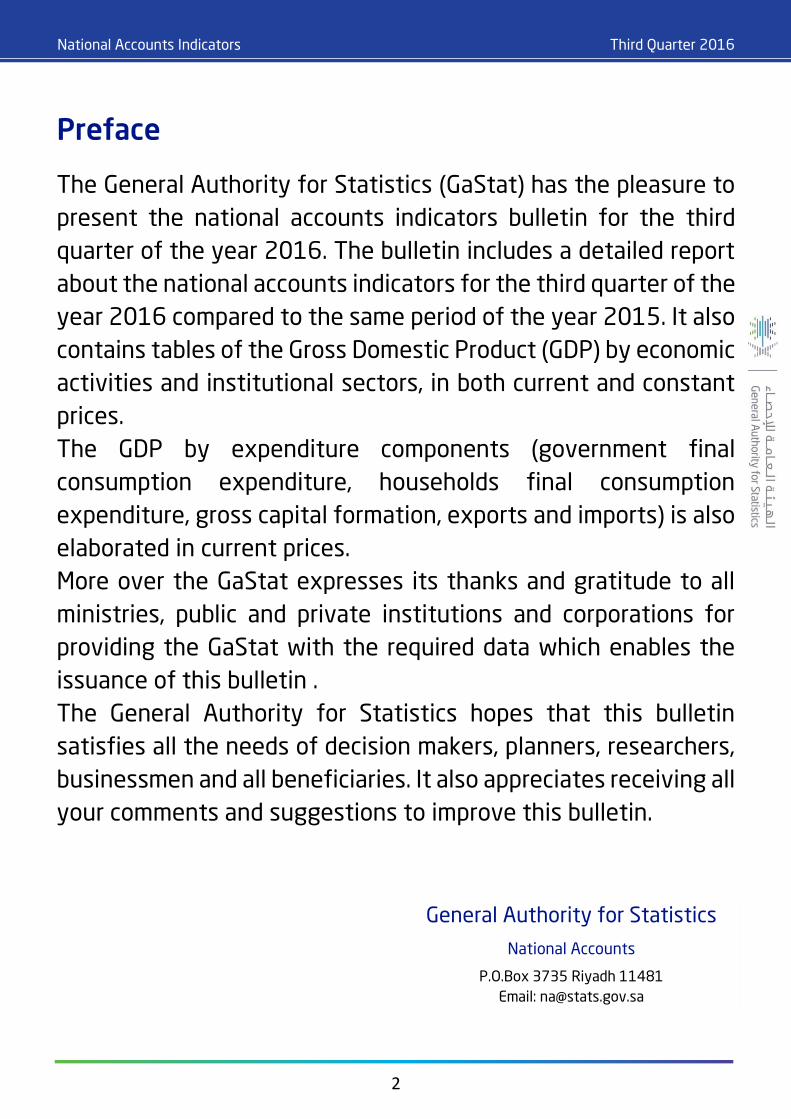
Preface
The General Authority for Statistics (GaStat) has the pleasure to
present the national accounts indicators bulletin for the third
quarter of the year 2016. The bulletin includes a detailed report
about the national accounts indicators for the third quarter of the
year 2016 compared to the same period of the year 2015. It also
contains tables of the Gross Domestic Product (GDP) by economic
activities and institutional sectors, in both current and constant
prices.
The GDP by expenditure components (government final
consumption expenditure, households final consumption
expenditure, gross capital formation, exports and imports) is also
elaborated in current prices.
More over the GaStat expresses its thanks and gratitude to all
ministries, public and private institutions and corporations for
providing the GaStat with the required data which enables the
issuance of this bulletin .
The General Authority for Statistics hopes that this bulletin
satisfies all the needs of decision makers, planners, researchers,
businessmen and all beneficiaries. It also appreciates receiving all
your comments and suggestions to improve this bulletin.
General Authority for Statistics
National Accounts
P.O.Box 3735 Riyadh 11481
Email: [email protected]

National Accounts Indicators Third Quarter 2016
3
Page Index
4 First: Definitions and Concepts
6 Second: Data Sources and Methods of Estimations
10 Third: National Accounts Indicators Report
14 Fourth: Statistical Tables
15 GDP by Kind Of Economic Activity at Current Prices 1
16 GDP by Institutional Sectors at Current Prices 2
17 Annual Growth Rates of GDP by Kind of Economic Activity at Current Prices 3
18 Annual Growth Rates of GDP by Institutional Sectors at Current Prices 4
19 Percent Distribution of GDP by Economic Activities at Current Prices 5
20 Percent Distribution of GDP by Institutional sectors at Current Prices 6
21 Expenditure On GDP at Current Prices 7
22 Annual Growth Rates Of Expenditure On GDP at Current Prices 8
23 GDP by Kind Of Economic Activity at Constant Prices 9
24 GDP by Institutional Sectors at Constant Prices 10
25 Annual Growth Rates of GDP by Kind of Economic Activity at Constant Prices 11
26 Annual Growth Rates of GDP by Institutional Sectors at Constant Prices 12
27 Percent Distribution of GDP by Economic Activities at Constant Prices 13
28 Percent Distribution of GDP by Institutional sectors at Constant Prices 14

National Accounts Indicators Third Quarter 2016
4
First: Definitions and Concepts
Gross Output The value of commodity and services resulted from
producing activity for institutional units that use
input during the accounting period. It includes
finished, unfinished and the products produced for
own use. The value of output is usually estimated
at producer prices, that represents the market value
at factory gate.
Intermediate Consumption It is the value of goods and services that is used as
inputs for the production process excluding fixed
assets as their consumption is considered a
consumption of the fixed capital. The used goods
and services might be totally transformed or
consumed in the production process. Some inputs
may emerge again after being transformed or
merged with the outputs. There are some inputs
that can be totally disappeared such as electricity
and other similar services.
Gross Domestic Product (by production
method) Gross Domestic Product is equals to the total value
added of the resident producers at producer price,
in which taxes are added and subsidies are
deducted. However, it can be referred to as the total
of outputs, from which the intermediate
consumption aggregate is deducted, and the net
products taxes are added (taxes less subsidies),
which are not included in the outputs value.
Gross Domestic Product at Market
Prices (by expenditure method) Gross Domestic product is equal to the total of final
expenditure at purchasers price including exports at
free on board prices (FOB), from which imports are
deducted.
Indirect Taxes They are taxes imposed on producers for any
production, sale, purchase, or use of goods and
services, (including import duties). They are usually
added upon the production costs.
Producing Subsidies Subsidies is the government payments awarded to
the producers of the public and private sectors. It
also includes the public authorities payment for
government projects to compensate any loss that
results because of the government policy to keep
the price at a fixed level. The subsidies might also
be calculated as the difference between the
targeted price and the actual market price paid by
the purchaser. This difference must be
compensated by government .
Net taxes on Products and Imports It equals the value of taxes on products and imports
minus the value of subsidies.
Fixed Capital Depreciation It represents the decrease of the fixed assets value,
used in production, during the accounting period as
a result of a slump, obsolescence, or any
deterioration factor. This depreciation could be
deducted from the fixed capital formation to get the
net fixed capital formation.
Financial Intermediation Services
Indirectly Measured The difference between the value of accrued
interest (revenue) on loans and the value of interest
payable to the depositors on their deposits.

National Accounts Indicators Third Quarter 2016
5
Imports of Goods and Services Imports is the value of goods that have been
transferred from being owned by non- residents to
being owned by residents in Saudi Arabia. Moreover,
the imports include the services provided by non-
residents to residents in Saudi Arabia. The imports
include, the goods that cross the boards for
processing. and the goods that prepared in foreign
ports and transported by local transporters,
nonmonetary gold. The import services include
tourism and transportation services,
communication, insurance, construction, financial
services, royalties, licenses fees, personal and
cultural services, and non-classified government
services.
Exports of Goods and Services Exports is the value of goods that have been
transferred from being owned by residents in Saudi
Arabia to being owned by non-residents. The
exports include exported goods for processing,
goods purchased in local ports by non-residents
transporters, and nonmonetary gold. However, the
exports of services include all services provided to
non-residents such as tourism and transportation
services, communication, insurance, financial
services, royalties, licenses fees, personal, cultural,
and recreation services, and government services.
Government Final Consumption
Expenditure The value of the total goods and services that
consumed by the government in the process of
producing the government services. It equals the
value of the government total production minus the
value of the market and non- market sales. The
government production value equals the
intermediate consumption of goods and services in
addition to the value of the compensation of
employees, fixed capital depreciation, and indirect
taxes.
Households Final Consumption
Expenditure The value of resident households final consumption
expenditure on goods (durable and non-durable)
and services minus their sales of used goods.
Final Consumption Expenditure of NPISHs The value of the resident NPISHs final consumption
expenditure on goods and services in the process of
producing the services that provided free or at
nominal price to households. This equals the value
of production (intermediate consumption plus
compensation of employees plus indirect taxes plus
depreciation) minus market and non- market sales.
Private Final Consumption Expenditure The commission of the resident households' final
consumption expenditure and the NPISHs final
consumption expenditure.
Gross Fixed Capital Formation The values of the net addition of the producers to
the fixed assets (additions – eliminations) during the
accounting period. In addition to the non-financial
non-produced assets such as land improvement,
forest development, implantations and groves …etc.
These additions are used for more than one year.
They include changes in live-stock such as breeding
stock and milk product…etc. They also include
transferring (sales and purchases) property costs
regarding lands, forests, and mines …etc.
Change of Stock The market value of change that occurs during the
accounting period of stock including raw material,
product in process, finished products, animals for
slaughtering, and purchased goods for resale. This
represents the difference in the stock value at the
beginning and at the end of the accounting period.
Gross Capital Formation It equals the value of gross fixed capital formation
in addition to the change in stock.
National Accounts Indicators Third Quarter 2016
6
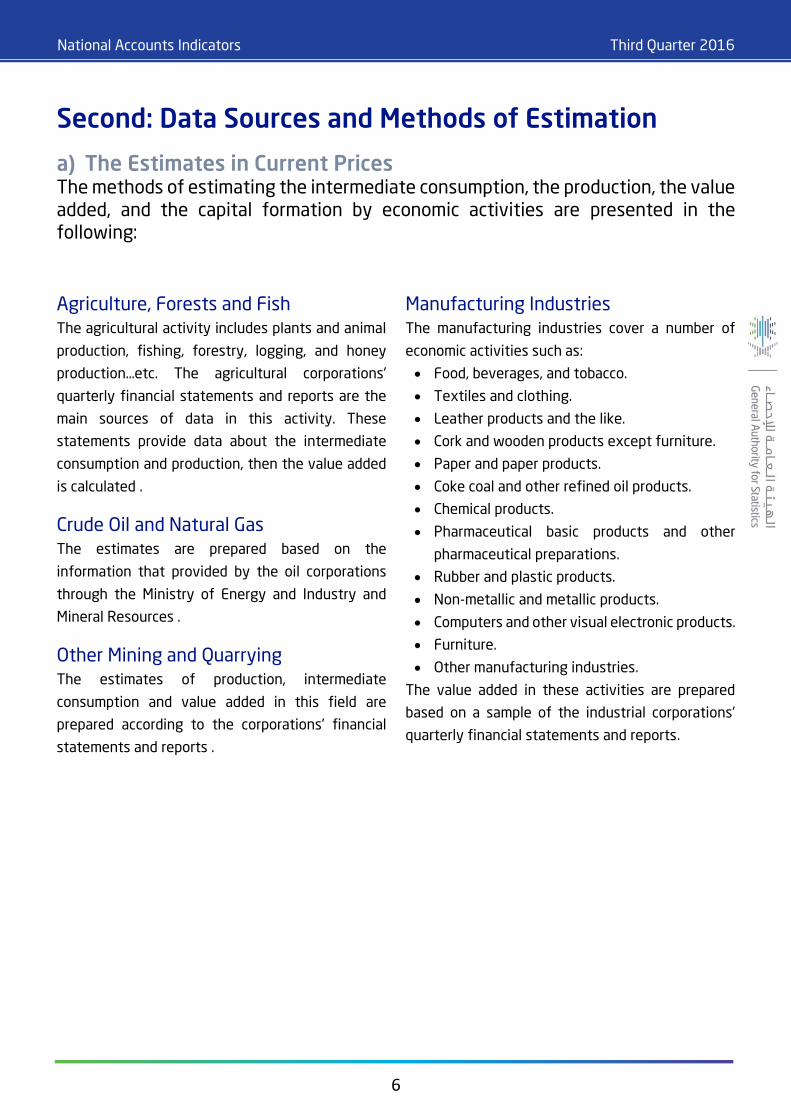
Second: Data Sources and Methods of Estimation
a) The Estimates in Current Prices The methods of estimating the intermediate consumption, the production, the value added, and the capital formation by economic activities are presented in the following:
Agriculture, Forests and Fish The agricultural activity includes plants and animal
production, fishing, forestry, logging, and honey
production…etc. The agricultural corporations'
quarterly financial statements and reports are the
main sources of data in this activity. These
statements provide data about the intermediate
consumption and production, then the value added
is calculated .
Crude Oil and Natural Gas The estimates are prepared based on the
information that provided by the oil corporations
through the Ministry of Energy and Industry and
Mineral Resources .
Other Mining and Quarrying The estimates of production, intermediate
consumption and value added in this field are
prepared according to the corporations' financial
statements and reports .
Manufacturing Industries The manufacturing industries cover a number of
economic activities such as:
Food, beverages, and tobacco.
Textiles and clothing.
Leather products and the like.
Cork and wooden products except furniture.
Paper and paper products.
Coke coal and other refined oil products.
Chemical products.
Pharmaceutical basic products and other
pharmaceutical preparations.
Rubber and plastic products.
Non-metallic and metallic products.
Computers and other visual electronic products.
Furniture.
Other manufacturing industries.
The value added in these activities are prepared
based on a sample of the industrial corporations'
quarterly financial statements and reports.

National Accounts Indicators Third Quarter 2016
7
Electricity, Gas and Water It includes the activities of electricity, gas, and
steam supply and conduction, air conditioning,
water impoundment, treatment, and conduction,
Sanitation, and waste disposal…etc. The Saudi
electricity company's quarterly financial statements
and reports are the only sources for electricity data.
However, the national gas and industry company is
the source of gas data. Whereas the national water
company is the main source for water production
and distribution data. These data are used for
estimating the value added according to the
production method.
Construction It includes the activities of constructing residential
and non-residential buildings. It also includes the
activities of civil engineering such as (roads
pavement, bridges, tunnels, railways, sewage,
water, and sanitation projects, electricity,
telephone, well- drilling, land reform, air
conditioners, water and sewage conduction,
sanitary ware, elevators …etc). Moreover, it includes
the specialized construction activities like (building
destruction, plumbing, heating, air-conditioning
…etc).
The monthly financial statements and reports of
the corporations working in these activities provide
the data and indicators needed for estimating the
value added in these activities .
Some other sources are also used such as the
consumption of some building and construction
material…etc .
Wholesale, Retail, Restaurants and
Hotels It includes the activities of wholesale and retail
trade, vehicles and motorcycles repair, in addition to
the food, beverages, and hotels activities. The
estimates of this field depend on data provided by
the activity's quarterly financial statements and
reports. They also provide data about purchases,
sales, wages, goods and services inputs, and other
revenues. These data are used to estimate the
value added in these activities .
Transportation, Storage and
communication This activity includes land, pipelines, air, and
maritime transportation activities. In addition, it
includes storage, post, parcel transportation, and
the transportation support activities. Moreover, this
activity covers the transportation activities either
in public, private, or mixed sectors. It also contains
computer programming and publishing activities,
consultation experience, information services,
programming, and broadcasting activities. The
major companies that work in the field of
communication, transportation, and storage issue
quarter financial statements and reports. These
sources are used to estimate the value added of
these activities. The production method is used in
estimating the value added .
National Accounts Indicators Third Quarter 2016
8
Finance, Insurance, Real Estate and
Business Services . This includes the financial services, insurance and
reinsurance activities, Pension funds, and other
supporting activities. It also includes the real estate
activities such as renting. In addition, it includes
business services such as legal activities,
accounting, research, and development and
research activities, and advertising and marketing
activities. The residential rents are estimated based
on data that the 2013 household expenditure and
income survey provides. The population growth
rates are taken into account. As for business
services, the estimates depend on the quarter
financial statements and reports of the companies
that work in this activity .
Community, Social and Personal
Services This includes educational services activities, health
care activities, in addition to all kinds of creation,
arts, welfare, entertainment, and sports activities.
Furthermore, it includes computer repairing
activities and repairing of personal and housing
goods. It also includes organizations with
memberships .
Data provided from financial statements and
reports is the main source for estimating the value
added.
Government Services The government sector provides goods and services
free of charge or with nominal price. So, there is no
market value for the production of government
services. Therefore, the government sector
production is estimated by expenditure. The
production equals the intermediate consumption in
addition to the compensation of employees and
depreciation. If we deduct the intermediate
consumption from the production value (production
method), we get the value added which equals the
compensation of employees in addition to
depreciation. So, there is no net surplus for the
government sector .
The quarterly summary data on revenues and
expenses that are provided by the ministry of
finance is the only source for estimating the
government services value added.

National Accounts Indicators Third Quarter 2016
9
b) The Estimates in Constant Prices The year 2010 is considered the base year for preparing the national accounts estimates at constant prices. Different methods of estimation are used for different activities according to the available information of each economic activity. The following are the methods used to prepare the estimates in constant prices:
Agriculture, Forests and Fishing The production quantity index number is used to
estimate the product value in constant prices .
Crude Oil and Natural Gas Estimates in constant prices are calculated based on
the production index of barrels .
Oil Refining A quantitative index number is created based on
the quantities of oil products produced by the
refineries. This quantity index used to deflate the
value added in constant prices .
Other Manufacturing Industries The wholesale price index is used to deflate the
estimates in constant prices.
Electricity, Gas and Water Estimates in constant prices are calculated based on
the index of sales quantities.
Construction The construction material wholesale price index is
used as deflator for these estimates .
Wholesale, Retail, Restaurants and
Hotels Each of the wholesale, retail, restaurants, and
hotels general index numbers are used as deflators
for the estimates in constant prices .
Transportation, Storage, Information
and Communication The communication and transportation price index
numbers are used as deflators to have the value
added in constant prices.
Banking Services Implicit GDP index is used in re-evaluating the
estimates in current prices to estimates in constant
prices.
Rents (buildings) The rent expense index in the CPI is used to
estimate the rent in constant prices.
Community, Social and Personal
Services The CPI is used in re-evaluating the values in
current prices to constant prices.

National Accounts Indicators Third Quarter 2016
10
Third: National Accounts Indicators Report
1) Gross Domestic Product (GDP) GDP value in current prices during the third quarter of 2016 is (602,084) million SAR, with (0.42%) decrease compared to its value in the same period of last year which it was (604,639) million SAR. As for constant prices, it is (638,579) million SAR with (0.93%) increase compared to its value in the same period of last year which it was (632,682) million SAR .
The following are GDP components:
A. Government Sector During the third quarter of 2016, the government sector GDP in current prices is (133,707) million SAR, with (1.35%) decrease compared to its value in the same period of last year which it was (135,532) million SAR. As for constant prices, it is (94,134) million SAR with an decrease by (2.83%) compared to the same period of 2015 which it was (96,875) million SAR.
0 100,000 200,000 300,000 400,000 500,000 600,000 700,000
Q3 2016
Q3 2015
Million SAR
Current Prices Constant Prices
0
20,000
40,000
60,000
80,000
100,000
120,000
140,000
160,000
Q3 2016 Q3 2015
Millio
n S
AR
Constant Prices Current Prices

National Accounts Indicators Third Quarter 2016
11
B. Private Sector During the third quarter of 2016, the private sector GDP increased in both current and constant prices. In current prices, it is (308,291) million SAR with an increase of (1.57%) compared to its value in the same period of 2015 which it was (303,532) million SAR. As for constant prices, it is (250,544) million SAR with an increase of (0.14%) compared to its value in the same period of 2015 which it was (250,189) million SAR.
C. Oil Sector During the third quarter of 2016, oil sector GDP in current prices is (155,445) million SAR with a decrease of (2.16%) compared to the same period of last year which it was (158,882) million SAR. As for constant prices, it increased by (3.64%) registering (290,333) million SAR in the third quarter of 2016 compared to (280,137) million SAR in the same period of last year.
Sectors relative contribution in current prices during the third quarter of 2016
0
50,000
100,000
150,000
200,000
250,000
300,000
350,000
Q3 2016 Q3 2015
Millio
n S
AR
Constant Prices Current Prices
0
50,000
100,000
150,000
200,000
250,000
300,000
350,000
Q3 2016 Q3 2015
Millio
n S
AR
Constant Prices Current Prices
25.82%
51.20%
22.21%
0.77%
Oil Sector
Private Sector
Government Sector
Import Duties

National Accounts Indicators Third Quarter 2016
12
2) Local Demand The primary estimates indicate that the local demand is (573,711) million SAR during the third quarter of 2016 in current prices. It decreased with (10.79%) compared to the same period of last year.
In the following are the main components of the local demand:
1. Government Final Consumption Expenditure
According to the brief data that GaStat received from the Ministry of Finance about the government revenues and expenses. The government final consumption expenditure is (129,776) million SAR during the third quarter of 2016 in current prices. It decreased by (24.65%) compared to the same period of last year in which it was (172,225) million SAR.
2. Private Final Consumption Expenditure
The private final consumption expenditure is (259,378) million SAR during the third quarter of 2016. It increased by (8.59%) compared to the same period of last year in which it was (238,867) million SAR.
3. Expenditure on Gross Capital Formation
The expenditure on total gross capital formation is (184,557) million SAR during the third quarter of 2016. It decreased by (20.44%) compared to the same period of last year in which it was (231,976) million SAR.
0 50,000 100,000 150,000 200,000 250,000 300,000
Q3 2015
Q3 2016
Million SAR
Government Final Consumption Expinditure
Private Final Consumption Expediture
Expediture on Gross Capital Formation
National Accounts Indicators Third Quarter 2016
13
3) Exports and Imports
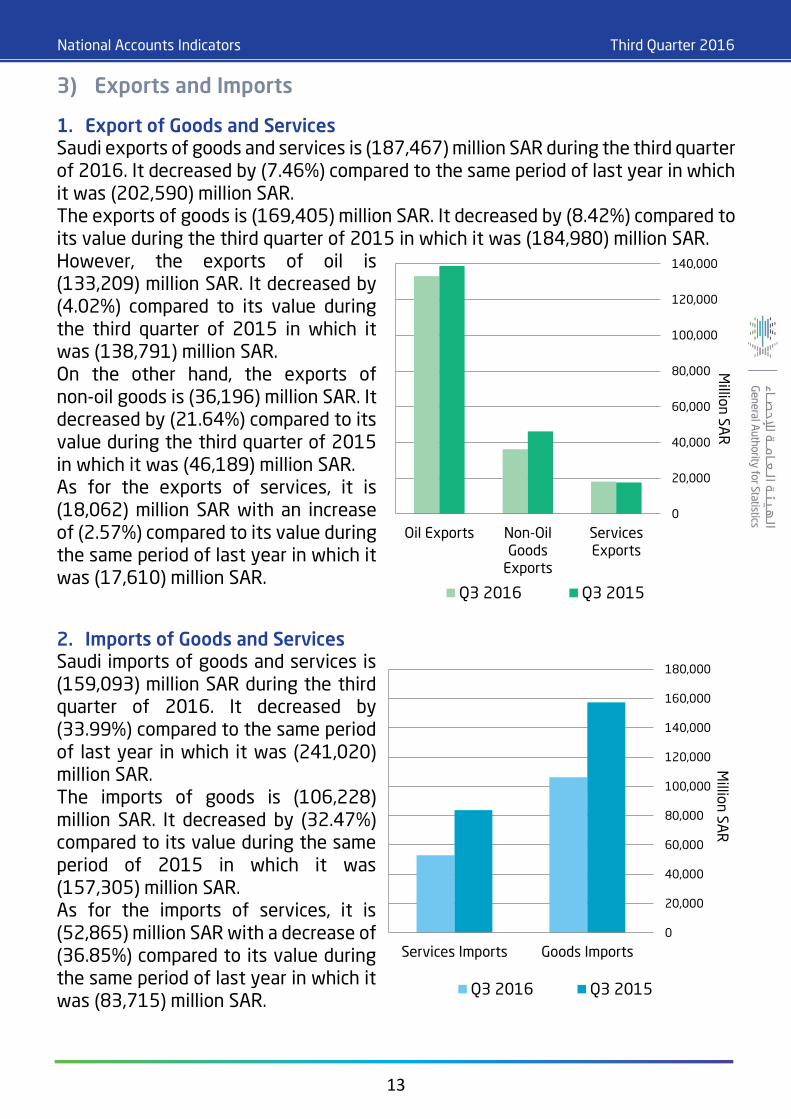
1. Export of Goods and Services Saudi exports of goods and services is (187,467) million SAR during the third quarter of 2016. It decreased by (7.46%) compared to the same period of last year in which it was (202,590) million SAR. The exports of goods is (169,405) million SAR. It decreased by (8.42%) compared to its value during the third quarter of 2015 in which it was (184,980) million SAR. However, the exports of oil is (133,209) million SAR. It decreased by (4.02%) compared to its value during the third quarter of 2015 in which it was (138,791) million SAR. On the other hand, the exports of non-oil goods is (36,196) million SAR. It decreased by (21.64%) compared to its value during the third quarter of 2015 in which it was (46,189) million SAR. As for the exports of services, it is (18,062) million SAR with an increase of (2.57%) compared to its value during the same period of last year in which it was (17,610) million SAR.
2. Imports of Goods and Services Saudi imports of goods and services is (159,093) million SAR during the third quarter of 2016. It decreased by (33.99%) compared to the same period of last year in which it was (241,020) million SAR. The imports of goods is (106,228) million SAR. It decreased by (32.47%) compared to its value during the same period of 2015 in which it was (157,305) million SAR. As for the imports of services, it is (52,865) million SAR with a decrease of (36.85%) compared to its value during the same period of last year in which it was (83,715) million SAR.
0
20,000
40,000
60,000
80,000
100,000
120,000
140,000
Oil Exports Non-OilGoods
Exports
ServicesExports
Millio
n S
AR
Q3 2016 Q3 2015
0
20,000
40,000
60,000
80,000
100,000
120,000
140,000
160,000
180,000
Services Imports Goods Imports
Millio
n S
AR
Q3 2016 Q3 2015

National Accounts Indicators Third Quarter 2016
14
Fourth: Statistical Table

National Accounts Indicators Third Quarter 2016
15
Table No 1جدول رقم (1(
Gross Domestic Productالناتج المحلي الإجمالي
By Kind Of Economic Activity at Current Pricesحسب نوع النشاط الاقتصادي بالأسعار الجارية
(Million Of Saudi Riyals(* 20152016(ملايين الريالات السعودية(
الربع الثالثالربع الثالث
Third QuarterThird Quarter
.Industries & Other Producers Except Producers Of Govt. ServicesAالصناعات والمنتجون الآخرون ماعدا منتجي الخدمات الحكوميةأ-
-16,04016,351Agriculture, Forestry & Fishing **1الزراعة ـ الغابات ـ والاسماك **1-
-144,787141,264Mining & Quarrying2التعدين والتحجير2-
141,816138,317a) Crude Petroleum & Natural Gasالزيت الخام والغاز الطبيعي أ (
2,9712,948b) Otherنشاطات تعدينية وتحجيرية اخرىب (
-75,88175,327Manufacturing3الصناعات التحويلية3-
14,86714,803a) Petroleum Refiningتكرير الزيتأ (
61,01460,524b) Otherصناعات اخرىب (
-14,27616,032Electricity, Gas and Water4الكهرباء ، الغاز والماء4-
-41,24540,335Construction5التشييد والبناء5-
-69,01868,771Wholesale & Retail Trade, Restaurants & hotels6تجارة الجملة والتجزئة والمطاعم والفنادق6-
-36,56237,491Transport, Storage & Communication7النقل والتخزين والاتصالات7-
-75,60779,470Finance, Insurance, Real Estate & Business Services8خدمات المال والتأمين والعقارات وخدمات الاعمال8-
45,05747,722a) Ownership of Dwellingsملكية المساكنأ (
30,55031,749b) Othersأخرىب (
-13,65014,009Community, Social & Personal Services9خدمات جماعية واجتماعية وشخصية9-
-5,3595,332Imputed Bank Services Charge10الخدمات المصرفية المحتسبة10-
481,706483,719Sub - Totalالمجموع الفرعي
.116,240113,724Producers of Government ServicesBمنتجو الخدمات الحكومية ب-
597,946597,443Gross Domestic Product Excluding Import Dutiesالناتج المحلي الإجمالي ماعدا رسوم الاستيراد
6,6934,641Import Dutiesرسوم الاستيراد
604,639602,084Gross Domestic Productالناتج المحلي الإجمالي
Preliminary Data ** بيانات أولية
The data of Agriculture, Forestry & Fishing activity has been updated based on the Agricultural Census 2014 **** تم تعديل بيانات نشاط الزراعة والغابات والاسماك وفقاً لنتائج التعداد الزراعي 2014م
Economic activityالنشاط الاقتصادي

National Accounts Indicators Third Quarter 2016
16
Table No 2جدول رقم (2(
Gross Domestic Productالناتج المحلي الإجمالي
By Institutional Sectors at Current Pricesحسب القطاعات التنظيمية بالأسعار الجارية
(Million Of Saudi Riyals(* 20152016(ملايين الريالات السعودية(
الربع الثالثالربع الثالث
Third QuarterThird Quarter
158,882155,445Oil Sectorالقطاع النفطي
439,063441,998Non-Oil Sectorالقطاع الغير نفطي
303,532308,291Private Sectorالقطاع الخاص
135,532133,707Government Sectorالقطاع الحكومي
597,946597,443Gross Domestic Product Excluding Import Dutiesالناتج المحلي الإجمالي ماعدا رسوم الاستيراد
6,6934,641Import Dutiesرسوم الاستيراد
604,639602,084Gross Domestic Productالناتج المحلي الإجمالي
Preliminary Data ** بيانات أولية
Sectorsالقطاعات

National Accounts Indicators Third Quarter 2016
17
Table No 3جدول رقم (3(
Annual Growth Rates of Gross Domestic Productمعدلات النمو في الناتج المحلي الإجمالي
By Kind Of Economic Activity at Current Pricesحسب نوع النشاط الاقتصادي بالأسعار الجارية
20152016
الربع الثالثالربع الثالث
Third QuarterThird Quarter
.Industries & Other Producers Except Producers Of Govt. ServicesAالصناعات والمنتجون الآخرون ماعدا منتجي الخدمات الحكوميةأ-
-1.961.94Agriculture, Forestry & Fishing1الزراعة ـ الغابات ـ والاسماك1-
-2.43Mining & Quarrying2-49.76-التعدين والتحجير2-
2.47a) Crude Petroleum & Natural Gas-50.31-الزيت الخام والغاز الطبيعي أ (
0.80b) Other-6.96نشاطات تعدينية وتحجيرية اخرىب (
-0.73Manufacturing3-0.38-الصناعات التحويلية3-
0.43a) Petroleum Refining-19.25-تكرير الزيتأ (
0.80b) Other-5.63صناعات اخرىب (
-7.4512.30Electricity, Gas and Water4الكهرباء ، الغاز والماء4-
-2.21Construction5-6.63التشييد والبناء5-
-0.36Wholesale & Retail Trade, Restaurants & hotels6-4.36تجارة الجملة والتجزئة والمطاعم والفنادق6-
-7.512.54Transport, Storage & Communication7النقل والتخزين والاتصالات7-
-5.735.11Finance, Insurance, Real Estate & Business Services8خدمات المال والتأمين والعقارات وخدمات الاعمال8-
7.375.91a) Ownership of Dwellingsملكية المساكنأ (
3.403.93b) Othersأخرىب (
-3.952.64Community, Social & Personal Services9خدمات جماعية واجتماعية وشخصية9-
-0.51Imputed Bank Services Charge10-3.17الخدمات المصرفية المحتسبة10-
21.240.42Sub - Total-المجموع الفرعي
.2.16Producers of Government ServicesB-9.67منتجو الخدمات الحكومية ب-
0.08Gross Domestic Product Excluding Import Duties-16.68-الناتج المحلي الإجمالي ماعدا رسوم الاستيراد
30.66Import Duties-20.49رسوم الاستيراد
0.42Gross Domestic Product-16.39-الناتج المحلي الإجمالي
Economic activityالنشاط الاقتصادي

National Accounts Indicators Third Quarter 2016
18
Table No 4جدول رقم (4(
Annual Growth Rates of Gross Domestic Productمعدلات النمو في الناتج المحلي الإجمالي
By Institutional Sectors at Current Pricesحسب القطاعات التنظيمية بالأسعار الجارية
20152016
الربع الثالثالربع الثالث
Third QuarterThird Quarter
2.16Oil Sector-48.06-القطاع النفطي
6.630.67Non-Oil Sectorالقطاع الغير نفطي
5.501.57Private Sectorالقطاع الخاص
1.35Government Sector-9.26القطاع الحكومي
0.08Gross Domestic Product Excluding Import Duties-16.68-الناتج المحلي الإجمالي ماعدا رسوم الاستيراد
30.66Import Duties-20.49رسوم الاستيراد
0.42Gross Domestic Product-16.39-الناتج المحلي الإجمالي
Sectorsالقطاعات

National Accounts Indicators Third Quarter 2016
19
Table No 5جدول رقم (5(
Percent distribution of Gross Domestic Productالمساهمة النسبية للأنشطة الاقتصادية
By Economic Activities at Current Pricesفي الناتج المحلي الإجمالي بالأسعار الجارية
20152016
الربع الثالثالربع الثالث
Third QuarterThird Quarter
.Industries & Other Producers Except Producers Of Govt. ServicesAالصناعات والمنتجون الآخرون ماعدا منتجي الخدمات الحكوميةأ-
-2.72.7Agriculture, Forestry & Fishing1الزراعة ـ الغابات ـ والاسماك1-
-23.923.5Mining & Quarrying2التعدين والتحجير2-
23.523.0a) Crude Petroleum & Natural Gasالزيت الخام والغاز الطبيعي أ (
0.50.5b) Otherنشاطات تعدينية وتحجيرية اخرىب (
-12.512.5Manufacturing3الصناعات التحويلية3-
2.52.5a) Petroleum Refiningتكرير الزيتأ (
10.110.1b) Otherصناعات اخرىب (
-2.42.7Electricity, Gas and Water4الكهرباء ، الغاز والماء4-
-6.86.7Construction5التشييد والبناء5-
-11.411.4Wholesale & Retail Trade, Restaurants & hotels6تجارة الجملة والتجزئة والمطاعم والفنادق6-
-6.06.2Transport, Storage & Communication7النقل والتخزين والاتصالات7-
-12.513.2Finance, Insurance, Real Estate & Business Services8خدمات المال والتأمين والعقارات وخدمات الاعمال8-
7.57.9a) Ownership of Dwellingsملكية المساكنأ (
5.15.3b) Othersأخرىب (
-2.32.3Community, Social & Personal Services9خدمات جماعية واجتماعية وشخصية9-
-0.90.9Imputed Bank Services Charge10الخدمات المصرفية المحتسبة10-
79.780.3Sub - Totalالمجموع الفرعي
.19.218.9Producers of Government ServicesBمنتجو الخدمات الحكومية ب-
98.999.2Gross Domestic Product Excluding Import Dutiesالناتج المحلي الإجمالي ماعدا رسوم الاستيراد
1.10.8Import Dutiesرسوم الاستيراد
100.0100.0Gross Domestic Productالناتج المحلي الإجمالي
Economic activityالنشاط الاقتصادي

National Accounts Indicators Third Quarter 2016
20
Table No 6جدول رقم (6(
Percent distribution of Gross Domestic Productالمساهمة النسبية للقطاعات التنظيمية
By Institutional sectors at Current Pricesفي الناتج المحلي الإجمالي بالأسعار الجارية
20152016
الربع الثالثالربع الثالث
Third QuarterThird Quarter
26.325.8Oil Sectorالقطاع النفطي
72.673.4Non-Oil Sectorالقطاع الغير نفطي
50.251.2Private Sectorالقطاع الخاص
22.422.2Government Sectorالقطاع الحكومي
98.999.2Gross Domestic Product Excluding Import Dutiesالناتج المحلي الإجمالي ماعدا رسوم الاستيراد
1.10.8Import Dutiesرسوم الاستيراد
100.0100.0Gross Domestic Productالناتج المحلي الإجمالي
Sectorsالقطاعات

National Accounts Indicators Third Quarter 2016
21
Table No 7جدول رقم (7(
Expenditure on Gross Domestic Productالإنفاق على الناتج المحلي الإجمالي
At Current Pricesبالأسعار الجارية
(Million Of Saudi Riyals(* 20152016(ملايين الريالات السعودية(
الربع الثالثالربع الثالث
Third QuarterThird Quarter
-172,225129,776Govt. Final Consumption Expenditure1الانفاق الاستهلاكي النهائي الحكومي1-
-238,867259,378Private Final Consumption Expenditure2الانفاق الاستهلاكي النهائي الخاص2-
-56,72744,978Change in Stock 3التغير في المخزون 3-
-175,250139,579Gross Fixed Capital Formation4اجمالي تكوين رأس المال الثابت4-
-202,590187,467Exports of Goods & Services5صادرات البضائع والخدمات5-
-241,020159,093Imports of Goods & Services6واردات البضائع والخدمات6-
-604,639602,084Expenditure on Gross Domestic Product 7الانفاق على الناتج المحلي الإجمالي 7-
Preliminary Data ** بيانات أولية

National Accounts Indicators Third Quarter 2016
22
Table No 8جدول رقم (8(
Annual Growth Rates Of Expenditure On Gross Domestic Productمعدلات النمو للإنفاق على الناتج المحلي الإجمالي
At Current Pricesبالأسعار الجارية
20152016
الربع الثالثالربع الثالث
Third QuarterThird Quarter
-24.65Govt. Final Consumption Expenditure1-1.35الانفاق الاستهلاكي النهائي الحكومي1-
-2.918.59Private Final Consumption Expenditure2الانفاق الاستهلاكي النهائي الخاص2-
-20.35Gross Fixed Capital Formation3-9.87اجمالي تكوين رأس المال الثابت3-
-7.46Exports of Goods & Services4-39.74-صادرات البضائع والخدمات4-
-33.99Imports of Goods & Services5-5.68-واردات البضائع والخدمات5-
-0.42Expenditure on Gross Domestic Product 6-16.39-الانفاق على الناتج المحلي الإجمالي 6-

National Accounts Indicators Third Quarter 2016
23
Table No 9جدول رقم (9(
Gross Domestic Productالناتج المحلي الإجمالي
By Kind Of Economic Activity at 2010 Constant Pricesحسب نوع النشاط الاقتصادي بالأسعار الثابتة لعام 2010م
(Million Of Saudi Riyals(* 20152016(ملايين الريالات السعودية(
الربع الثالثالربع الثالث
Third QuarterThird Quarter
.Industries & Other Producers Except Producers Of Govt. ServicesAالصناعات والمنتجون الآخرون ماعدا منتجي الخدمات الحكوميةأ-
-14,91514,943Agriculture, Forestry & Fishing **1الزراعة ـ الغابات ـ والاسماك **1-
-259,079266,625Mining & Quarrying2التعدين والتحجير2-
256,566264,171a) Crude Petroleum & Natural Gasالزيت الخام والغاز الطبيعي أ (
2,5132,454b) Otherنشاطات تعدينية وتحجيرية اخرىب (
-74,40276,445Manufacturing3الصناعات التحويلية3-
21,64824,225a) Petroleum Refiningتكرير الزيتأ (
52,75552,220b) Otherصناعات اخرىب (
-13,37013,693Electricity, Gas and Water4الكهرباء ، الغاز والماء4-
-31,53430,329Construction5التشييد والبناء5-
-57,56357,156Wholesale & Retail Trade, Restaurants & hotels6تجارة الجملة والتجزئة والمطاعم والفنادق6-
-33,75734,321Transport, Storage & Communication7النقل والتخزين والاتصالات7-
-56,15557,857Finance, Insurance, Real Estate & Business Services8خدمات المال والتأمين والعقارات وخدمات الاعمال8-
30,57131,663a) Ownership of Dwellingsملكية المساكنأ (
25,58426,194b) Othersأخرىب (
-11,99112,153Community, Social & Personal Services9خدمات جماعية واجتماعية وشخصية9-
-4,9834,860Imputed Bank Services Charge10الخدمات المصرفية المحتسبة10-
547,785558,663Sub - Totalالمجموع الفرعي
.79,41576,349Producers of Government ServicesBمنتجو الخدمات الحكومية ب-
627,201635,012Gross Domestic Product Excluding Import Dutiesالناتج المحلي الإجمالي ماعدا رسوم الاستيراد
5,4823,567Import Dutiesرسوم الاستيراد
632,682638,579Gross Domestic Productالناتج المحلي الإجمالي
Preliminary Data ** بيانات أولية
The data of Agriculture, Forestry & Fishing activity has been updated based on the Agricultural Census 2014 **** تم تعديل بيانات نشاط الزراعة والغابات والاسماك وفقاً لنتائج التعداد الزراعي 2014م
Economic activityالنشاط الاقتصادي

National Accounts Indicators Third Quarter 2016
24
Table No 10جدول رقم (10(
Gross Domestic Productالناتج المحلي الإجمالي
By Institutional Sectors at 2010 Constant Pricesحسب القطاعات التنظيمية بالأسعار الثابتة لعام 2010م
(Million Of Saudi Riyals(* 20152016(ملايين الريالات السعودية(
الربع الثالثالربع الثالث
Third QuarterThird Quarter
280,137290,333Oil Sectorالقطاع النفطي
347,064344,679Non-Oil Sectorالقطاع الغير نفطي
250,189250,544Private Sectorالقطاع الخاص
96,87594,134Government Sectorالقطاع الحكومي
627,201635,012Gross Domestic Product Excluding Import Dutiesالناتج المحلي الإجمالي ماعدا رسوم الاستيراد
5,4823,567Import Dutiesرسوم الاستيراد
632,682638,579Gross Domestic Productالناتج المحلي الإجمالي
Preliminary Data ** بيانات أولية
Sectorsالقطاعات
National Accounts Indicators Third Quarter 2016
25
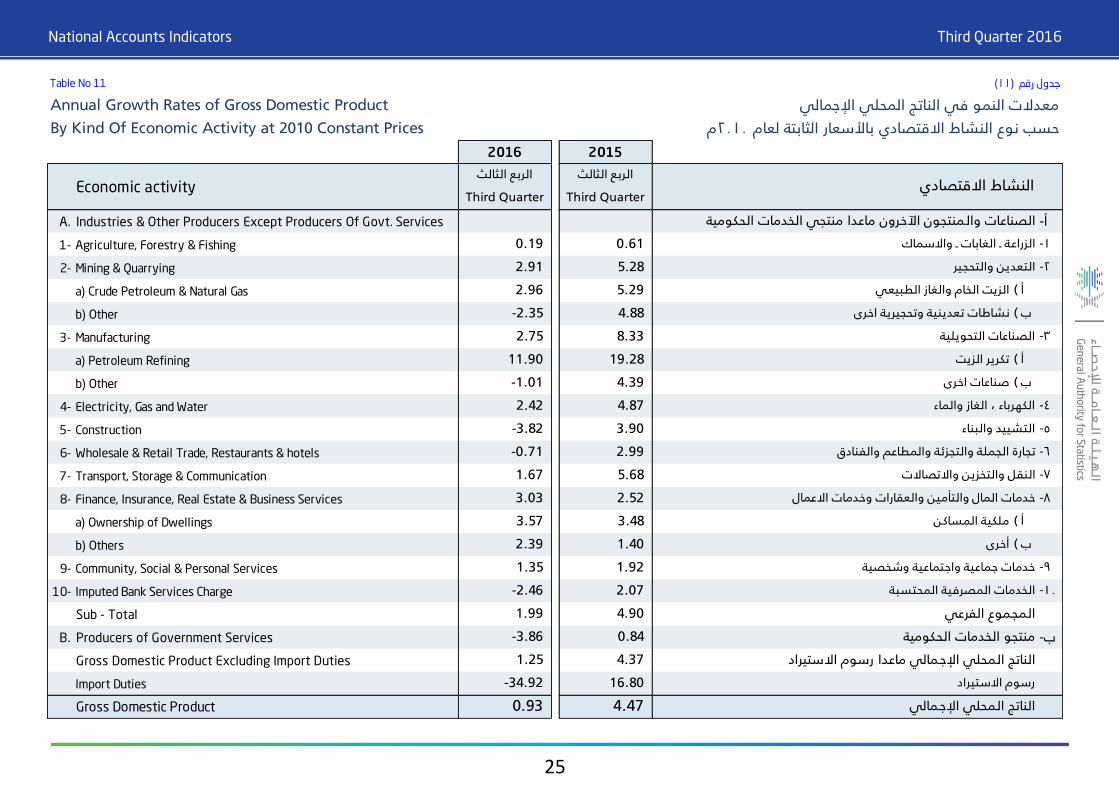
Table No 11جدول رقم (11(
Annual Growth Rates of Gross Domestic Productمعدلات النمو في الناتج المحلي الإجمالي
By Kind Of Economic Activity at 2010 Constant Pricesحسب نوع النشاط الاقتصادي بالأسعار الثابتة لعام 2010م
20152016
الربع الثالثالربع الثالث
Third QuarterThird Quarter
.Industries & Other Producers Except Producers Of Govt. ServicesAالصناعات والمنتجون الآخرون ماعدا منتجي الخدمات الحكوميةأ-
-0.610.19Agriculture, Forestry & Fishing1الزراعة ـ الغابات ـ والاسماك1-
-5.282.91Mining & Quarrying2التعدين والتحجير2-
5.292.96a) Crude Petroleum & Natural Gasالزيت الخام والغاز الطبيعي أ (
2.35b) Other-4.88نشاطات تعدينية وتحجيرية اخرىب (
-8.332.75Manufacturing3الصناعات التحويلية3-
19.2811.90a) Petroleum Refiningتكرير الزيتأ (
1.01b) Other-4.39صناعات اخرىب (
-4.872.42Electricity, Gas and Water4الكهرباء ، الغاز والماء4-
-3.82Construction5-3.90التشييد والبناء5-
-0.71Wholesale & Retail Trade, Restaurants & hotels6-2.99تجارة الجملة والتجزئة والمطاعم والفنادق6-
-5.681.67Transport, Storage & Communication7النقل والتخزين والاتصالات7-
-2.523.03Finance, Insurance, Real Estate & Business Services8خدمات المال والتأمين والعقارات وخدمات الاعمال8-
3.483.57a) Ownership of Dwellingsملكية المساكنأ (
1.402.39b) Othersأخرىب (
-1.921.35Community, Social & Personal Services9خدمات جماعية واجتماعية وشخصية9-
-2.46Imputed Bank Services Charge10-2.07الخدمات المصرفية المحتسبة10-
4.901.99Sub - Totalالمجموع الفرعي
.3.86Producers of Government ServicesB-0.84منتجو الخدمات الحكومية ب-
4.371.25Gross Domestic Product Excluding Import Dutiesالناتج المحلي الإجمالي ماعدا رسوم الاستيراد
34.92Import Duties-16.80رسوم الاستيراد
4.470.93Gross Domestic Productالناتج المحلي الإجمالي
Economic activityالنشاط الاقتصادي
National Accounts Indicators Third Quarter 2016
26
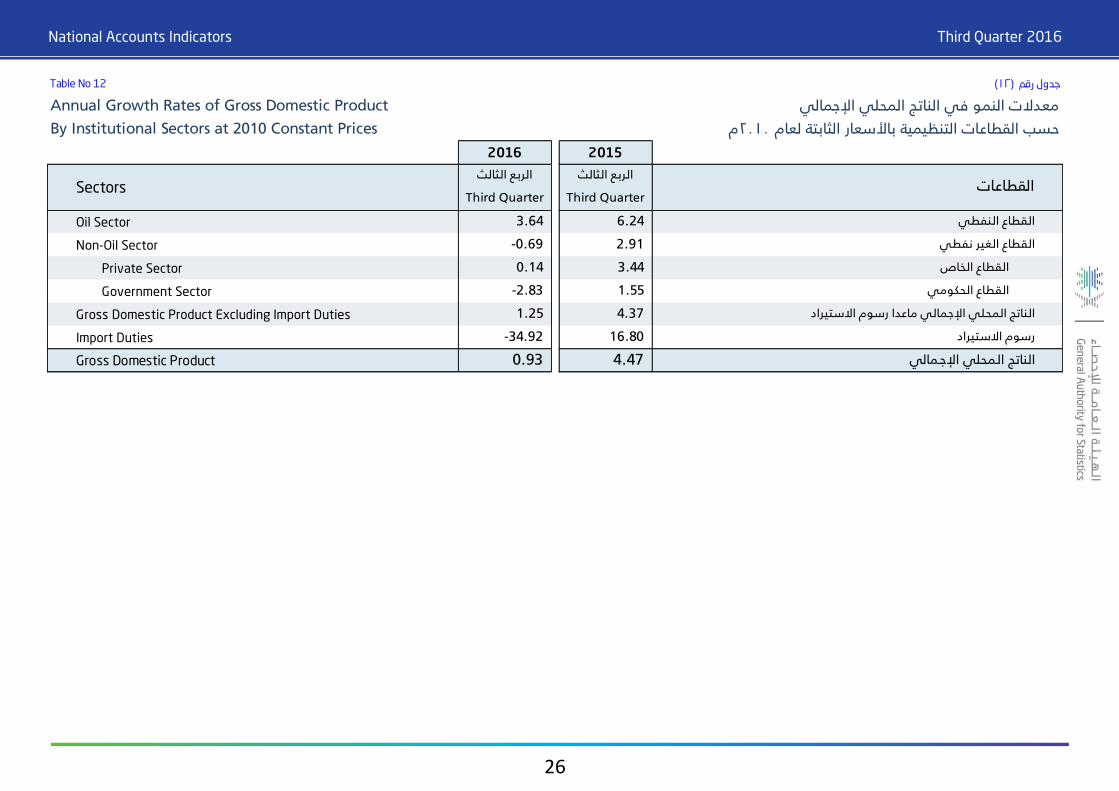
Table No 12جدول رقم (12(
Annual Growth Rates of Gross Domestic Productمعدلات النمو في الناتج المحلي الإجمالي
By Institutional Sectors at 2010 Constant Pricesحسب القطاعات التنظيمية بالأسعار الثابتة لعام 2010م
20152016
الربع الثالثالربع الثالث
Third QuarterThird Quarter
6.243.64Oil Sectorالقطاع النفطي
0.69Non-Oil Sector-2.91القطاع الغير نفطي
3.440.14Private Sectorالقطاع الخاص
2.83Government Sector-1.55القطاع الحكومي
4.371.25Gross Domestic Product Excluding Import Dutiesالناتج المحلي الإجمالي ماعدا رسوم الاستيراد
34.92Import Duties-16.80رسوم الاستيراد
4.470.93Gross Domestic Productالناتج المحلي الإجمالي
Sectorsالقطاعات

National Accounts Indicators Third Quarter 2016
27
Table No 13جدول رقم (13(
Percent distribution of Gross Domestic Productالمساهمة النسبية للأنشطة الاقتصادية
By Economic Activities at 2010 Constant Pricesفي الناتج المحلي الإجمالي بالأسعار الثابتة لعام 2010م
20152016
الربع الثالثالربع الثالث
Third QuarterThird Quarter
.Industries & Other Producers Except Producers Of Govt. ServicesAالصناعات والمنتجون الآخرون ماعدا منتجي الخدمات الحكوميةأ-
-2.42.3Agriculture, Forestry & Fishing1الزراعة ـ الغابات ـ والاسماك1-
-40.941.8Mining & Quarrying2التعدين والتحجير2-
40.641.4a) Crude Petroleum & Natural Gasالزيت الخام والغاز الطبيعي أ (
0.40.4b) Otherنشاطات تعدينية وتحجيرية اخرىب (
-11.812.0Manufacturing3الصناعات التحويلية3-
3.43.8a) Petroleum Refiningتكرير الزيتأ (
8.38.2b) Otherصناعات اخرىب (
-2.12.1Electricity, Gas and Water4الكهرباء ، الغاز والماء4-
-5.04.7Construction5التشييد والبناء5-
-9.19.0Wholesale & Retail Trade, Restaurants & hotels6تجارة الجملة والتجزئة والمطاعم والفنادق6-
-5.35.4Transport, Storage & Communication7النقل والتخزين والاتصالات7-
-8.99.1Finance, Insurance, Real Estate & Business Services8خدمات المال والتأمين والعقارات وخدمات الاعمال8-
4.85.0a) Ownership of Dwellingsملكية المساكنأ (
4.04.1b) Othersأخرىب (
-1.91.9Community, Social & Personal Services9خدمات جماعية واجتماعية وشخصية9-
-0.80.8Imputed Bank Services Charge10الخدمات المصرفية المحتسبة10-
86.687.5Sub - Totalالمجموع الفرعي
.12.612.0Producers of Government ServicesBمنتجو الخدمات الحكومية ب-
99.199.4Gross Domestic Product Excluding Import Dutiesالناتج المحلي الإجمالي ماعدا رسوم الاستيراد
0.90.6Import Dutiesرسوم الاستيراد
100.0100.0Gross Domestic Productالناتج المحلي الإجمالي
Economic activityالنشاط الاقتصادي

National Accounts Indicators Third Quarter 2016
28
Table No 14جدول رقم (14(
Percent distribution of Gross Domestic Productالمساهمة النسبية للقطاعات التنظيمية
By Institutional sectors at 2010 Constant Pricesفي الناتج المحلي الإجمالي بالأسعار الثابتة لعام 2010م
20152016
الربع الثالثالربع الثالث
Third QuarterThird Quarter
44.345.5Oil Sectorالقطاع النفطي
54.954.0Non-Oil Sectorالقطاع الغير نفطي
39.539.2Private Sectorالقطاع الخاص
15.314.7Government Sectorالقطاع الحكومي
99.199.4Gross Domestic Product Excluding Import Dutiesالناتج المحلي الإجمالي ماعدا رسوم الاستيراد
0.90.6Import Dutiesرسوم الاستيراد
100.0100.0Gross Domestic Productالناتج المحلي الإجمالي
Sectorsالقطاعات

Stats.gov.sa