![National 4XDOLÛFDWLRQV SPECIMEN ONLY - … · (m/f) Gracias, María. Adiós (f) Gracias, hasta luego (2 minutes) (t) End of test. Now look over your answers. [END OF SPECIMEN TRANSCRIPT]](https://static.fdocuments.in/doc/165x107/5ba384b209d3f2205e8b7c5f/national-4xdolufdwlrqv-specimen-only-mf-gracias-maria-adios-f-gracias.jpg)
National 4XDOLÛFDWLRQV SPECIMEN ONLY · 2018-09-26 · Duration — 2 hours 20 minutes Biology...
47
*S807760101* *S8077601* H FOR OFFICIAL USE Fill in these boxes and read what is printed below. Number of seat Town © Mark Full name of centre Forename(s) Surname Scottish candidate number Date of birth Year Day Month National Qualications SPECIMEN ONLY Total marks 95 Attempt ALL questions. You may use a calculator. Questions 9 and 17 contain a choice. Write your answers clearly in the spaces provided in this booklet. Additional space for answers and rough work is provided at the end of this booklet. If you use this space you must clearly identify the question number you are attempting. Any rough work must be written in this booklet. Score through your rough work when you have written your final copy. Use blue or black ink. Before leaving the examination room you must give this booklet to the Invigilator; if you do not, you may lose all the marks for this paper. S807/76/01 Date Not applicable Duration 2 hours 20 minutes Biology Paper 2
Transcript of National 4XDOLÛFDWLRQV SPECIMEN ONLY · 2018-09-26 · Duration — 2 hours 20 minutes Biology...
*S807760101*
*S8077601*
HFOR OFFICIAL USE
Fill in these boxes and read what is printed below.
Number of seat
Town
©
Mark
Full name of centre
Forename(s) Surname
Scottish candidate numberDate of birth
YearDay Month
NationalQualicationsSPECIMEN ONLY
Total marks — 95
Attempt ALL questions.
You may use a calculator.
Questions 9 and 17 contain a choice.
Write your answers clearly in the spaces provided in this booklet. Additional space for answers and rough work is provided at the end of this booklet. If you use this space you must clearly identify the question number you are attempting. Any rough work must be written in this booklet. Score through your rough work when you have written your final copy.
Use blue or black ink.
Before leaving the examination room you must give this booklet to the Invigilator; if you do not, you may lose all the marks for this paper.
S807/76/01
Date — Not applicable
Duration — 2 hours 20 minutes
BiologyPaper 2

*S807760102*page 02
MARKS DO NOT WRITE IN
THIS MARGIN
Total marks — 95
Attempt ALL questions
Questions 9 and 17 contain a choice.
1. The diagram shows stages in the production of three different proteins that are coded for by one gene.
Exon 1 Exon 2 Exon 3Intron 1 Intron 2
Transcription
Exon 1 Exon 2 Intron 1 Exon 3 Intron 2
Process X
Mature mRNA1
Mature mRNA2
Mature mRNA3
Translation
Protein 1 Protein 2 Protein 3
MaturemRNAtranscript
PrimarymRNAtranscript
DNA
(a) Identify a non-coding region of DNA.
(b) Name process X.
(c) Explain how process X can produce different mature mRNA transcripts.
1
1
2

*S807760103*page 03
MARKS DO NOT WRITE IN
THIS MARGIN
2. A chromosome mutation in humans can result in the formation of the Philadelphia chromosome, which is associated with a form of leukaemia.
The stages leading to the formation of a Philadelphia chromosome are shown in the diagram.
normalchromosome 9
normalchromosome 22
exchange
mutatedchromosome 9
mutatedchromosome 22
Philadelphiachromosome
(a) Name the type of chromosome mutation, shown in the diagram, which results in the formation of a Philadelphia chromosome.
(b) (i) The presence of a Philadelphia chromosome causes a form of leukaemia through the over-production of an enzyme.
A drug has been used to successfully treat this form of leukaemia by binding at the active site of the enzyme.
Name the type of enzyme inhibition shown by this drug.
[Turn over
1
1
*S807760104*page 04
MARKS DO NOT WRITE IN
THIS MARGIN
2. (b) (continued)
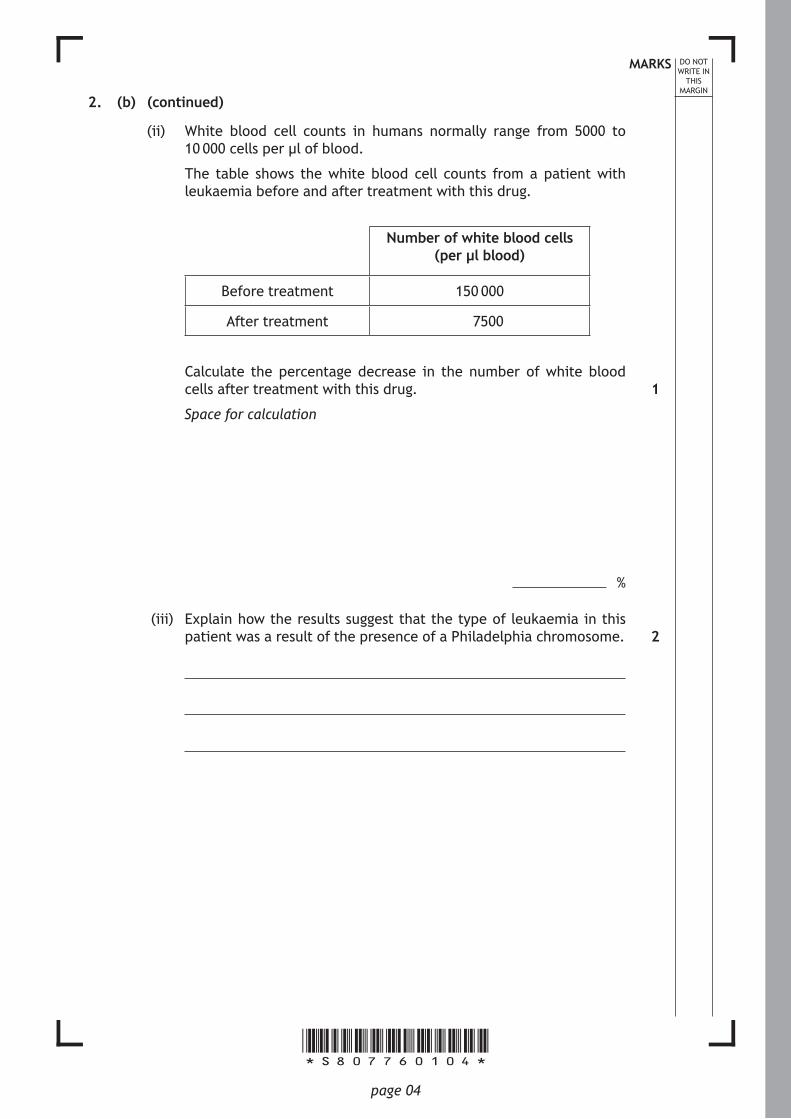
(ii) White blood cell counts in humans normally range from 5000 to 10 000 cells per μl of blood.
The table shows the white blood cell counts from a patient with leukaemia before and after treatment with this drug.
Number of white blood cells (per μl blood)
Before treatment 150 000
After treatment 7500
Calculate the percentage decrease in the number of white blood cells after treatment with this drug.
Space for calculation
%
(iii) Explain how the results suggest that the type of leukaemia in this patient was a result of the presence of a Philadelphia chromosome.
1
2
*S807760105*page 05
MARKS DO NOT WRITE IN
THIS MARGIN
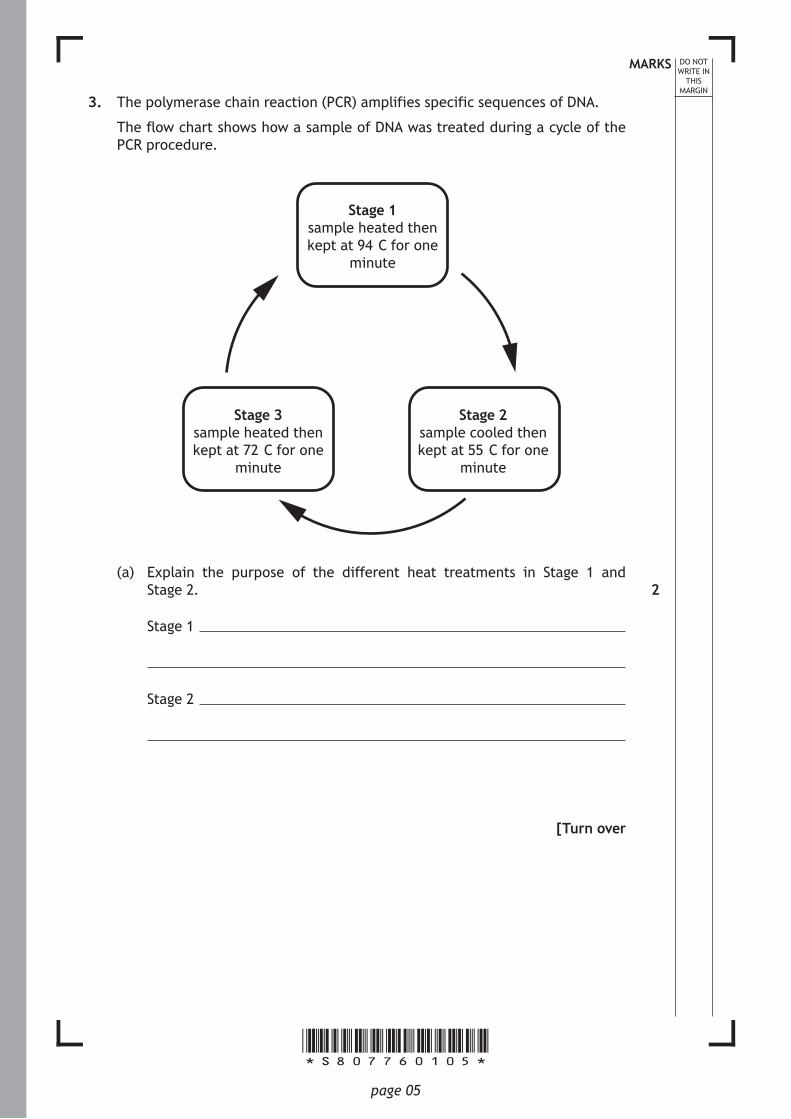
3. The polymerase chain reaction (PCR) amplifies specific sequences of DNA.
The flow chart shows how a sample of DNA was treated during a cycle of the PCR procedure.
Stage 1sample heated thenkept at 94°C for one
minute
Stage 2sample cooled thenkept at 55°C for one
minute
Stage 3sample heated thenkept at 72°C for one
minute
(a) Explain the purpose of the different heat treatments in Stage 1 and Stage 2.
Stage 1
Stage 2
[Turn over
2
*S807760106*page 06
MARKS DO NOT WRITE IN
THIS MARGIN
3. (continued)
(b) The number of DNA molecules doubles during each cycle of the PCR procedure.
Caculate the number of cycles needed to produce 128 copies of a single DNA molecule.
Space for calculation
cycles
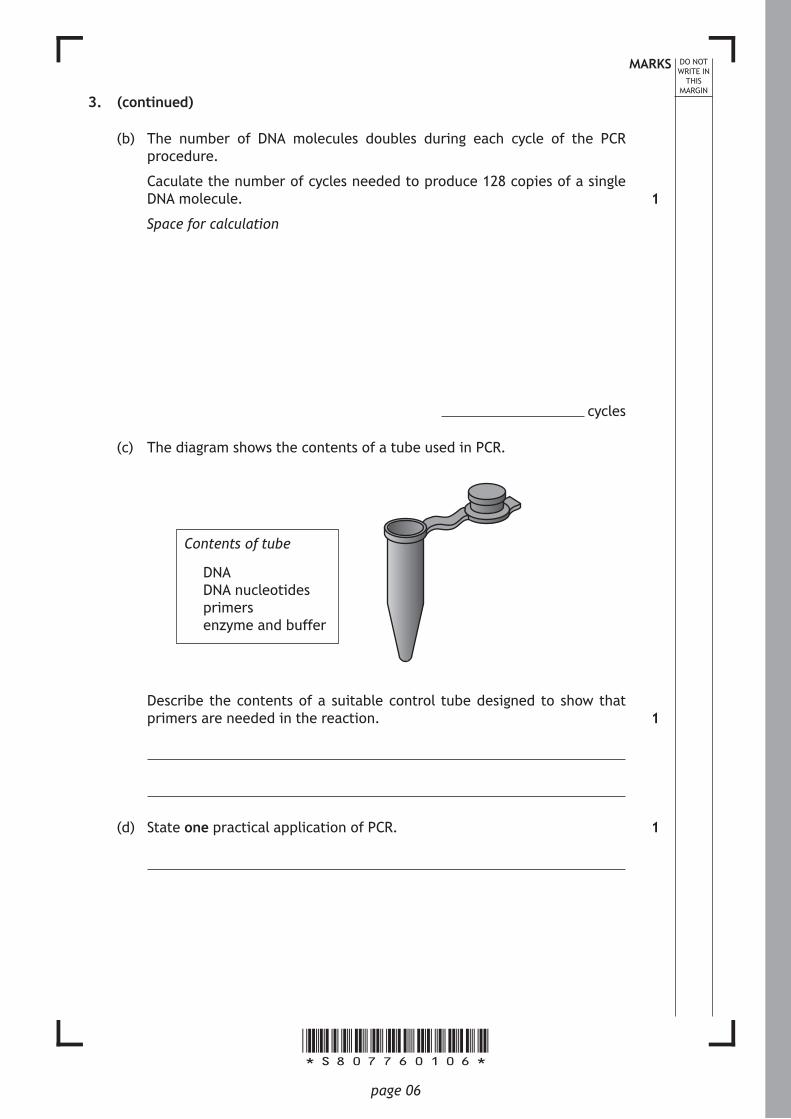
(c) The diagram shows the contents of a tube used in PCR.
Contents of tube
— DNA— DNA nucleotides— primers— enzyme and buffer
Describe the contents of a suitable control tube designed to show that primers are needed in the reaction.
(d) State one practical application of PCR.
1
1
1
*S807760107*page 07
MARKS DO NOT WRITE IN
THIS MARGIN
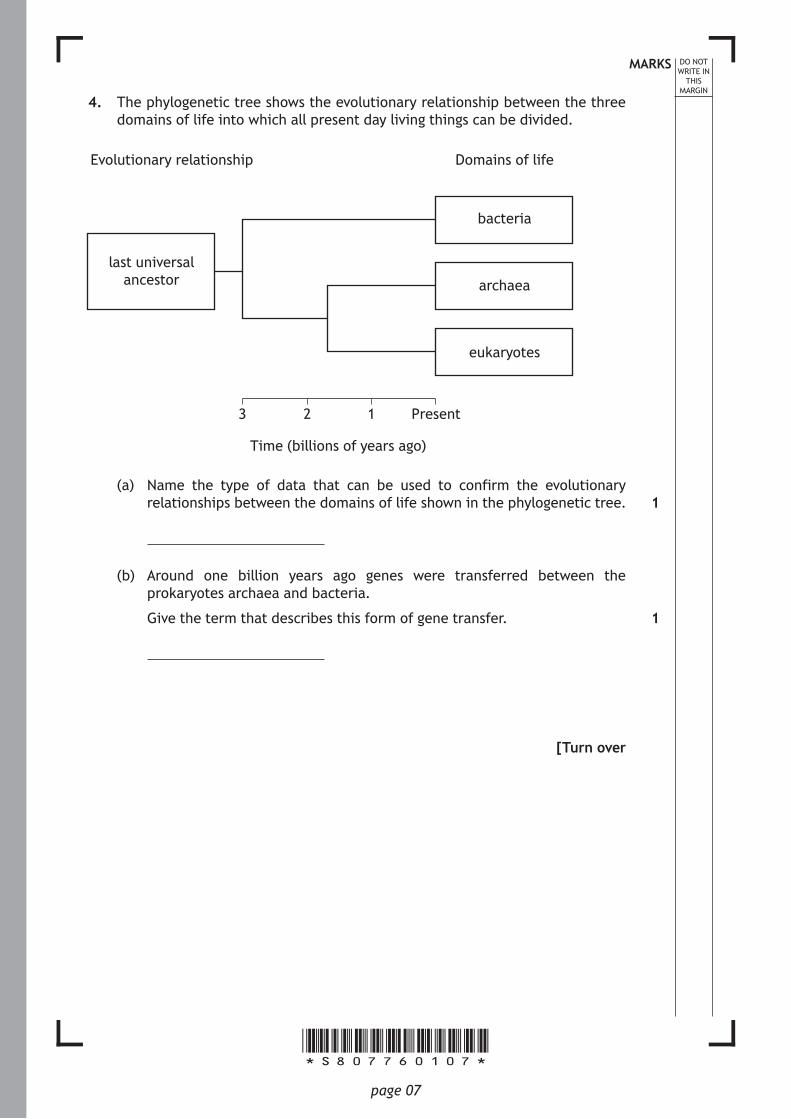
4. The phylogenetic tree shows the evolutionary relationship between the three domains of life into which all present day living things can be divided.
last universalancestor
bacteria
archaea
eukaryotes
3 2 1 Present
Time (billions of years ago)
Evolutionary relationship Domains of life
(a) Name the type of data that can be used to confirm the evolutionary relationships between the domains of life shown in the phylogenetic tree.
(b) Around one billion years ago genes were transferred between the prokaryotes archaea and bacteria.
Give the term that describes this form of gene transfer.
[Turn over
1
1
*S807760108*page 08
MARKS DO NOT WRITE IN
THIS MARGIN
4. (continued)
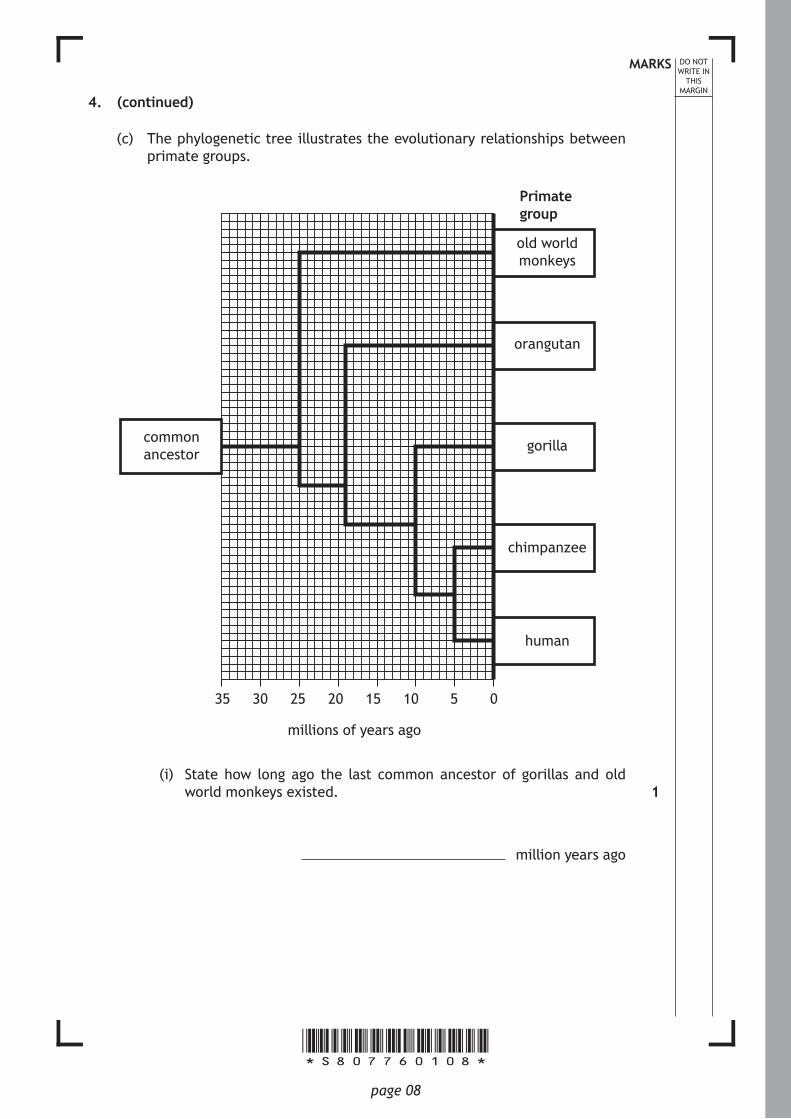
(c) The phylogenetic tree illustrates the evolutionary relationships between primate groups.
Primategroup
old worldmonkeys
orangutan
gorilla
chimpanzee
human
commonancestor
35 30 25 20 15 10 5 0
millions of years ago
(i) State how long ago the last common ancestor of gorillas and old world monkeys existed.
million years ago
1

*S807760109*page 09
MARKS DO NOT WRITE IN
THIS MARGIN
4. (c) (continued)
(ii) Humans are more closely related to chimpanzees than to orangutans.
Explain how this is known, using information from the phylogenetic tree.
[Turn over
1

*S807760110*page 10
MARKS DO NOT WRITE IN
THIS MARGIN
5. The diagram shows some stages in the aerobic respiration of glucose.
glucose
pyruvate
substance P
substance Q
electron transport chain
citrate
glycolysis phosphorylation of intermediates
citricacidcycle
substance N
(a) Name substances P and Q.
Substance P
Substance Q
(b) Explain why the phosphorylation of intermediates in glycolysis is referred to as an energy investment stage.
2
2
*S807760111*page 11
MARKS DO NOT WRITE IN
THIS MARGIN
5. (continued)
(c) Describe the role of the coenzyme NAD.
(d) People who suffer from chronic fatigue syndrome have mitochondria in which some of the proteins embedded in the inner mitochondrial membrane are damaged.
Explain how this might result in the tiredness that is a feature of this condition.
[Turn over
2
2
*S807760112*page 12
MARKS DO NOT WRITE IN
THIS MARGIN
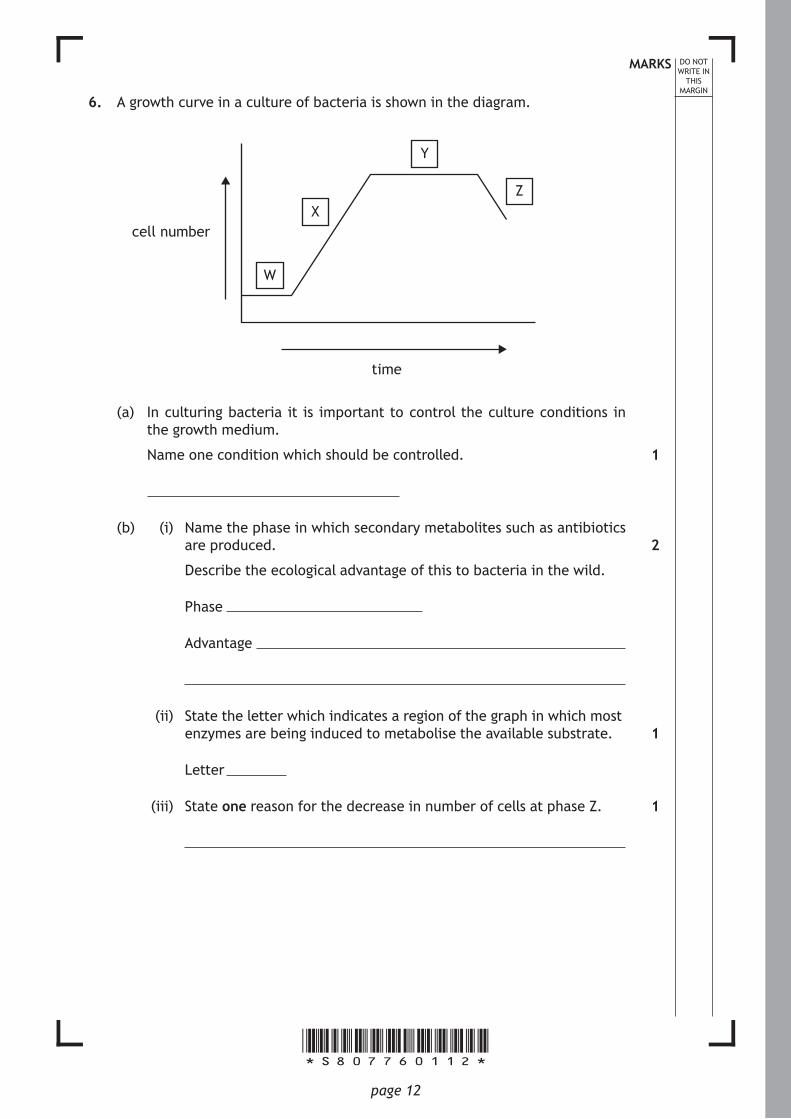
6. A growth curve in a culture of bacteria is shown in the diagram.
time
cell number
W
X
Y
Z
(a) In culturing bacteria it is important to control the culture conditions in the growth medium.
Name one condition which should be controlled.
(b) (i) Name the phase in which secondary metabolites such as antibiotics are produced.
Describe the ecological advantage of this to bacteria in the wild.
Phase
Advantage
(ii) State the letter which indicates a region of the graph in which most enzymes are being induced to metabolise the available substrate.
Letter
(iii) State one reason for the decrease in number of cells at phase Z.
1
2
1
1
*S807760113*page 13
MARKS DO NOT WRITE IN
THIS MARGIN
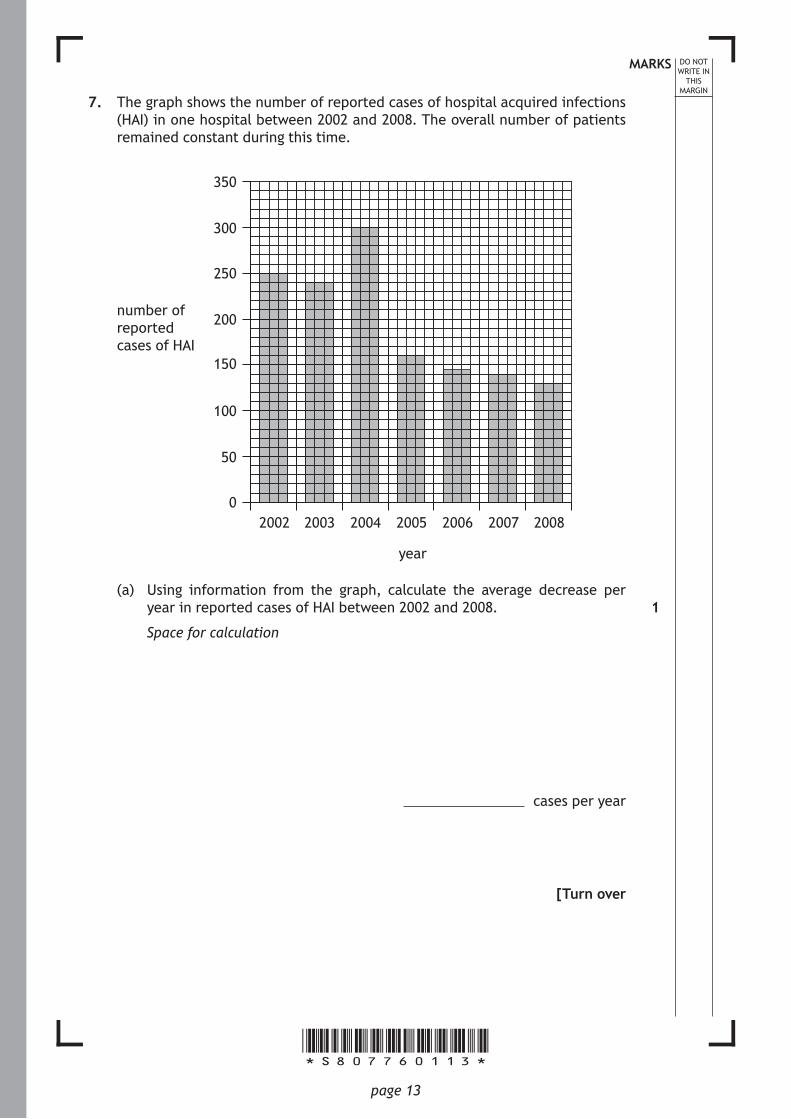
7. The graph shows the number of reported cases of hospital acquired infections (HAI) in one hospital between 2002 and 2008. The overall number of patients remained constant during this time.
350
300
250
200
150
100
50
02002 2003 2004 2005 2006 2007 2008
year
number of reported cases of HAI
(a) Using information from the graph, calculate the average decrease per year in reported cases of HAI between 2002 and 2008.
Space for calculation
cases per year
[Turn over
1
*S807760114*page 14
MARKS DO NOT WRITE IN
THIS MARGIN
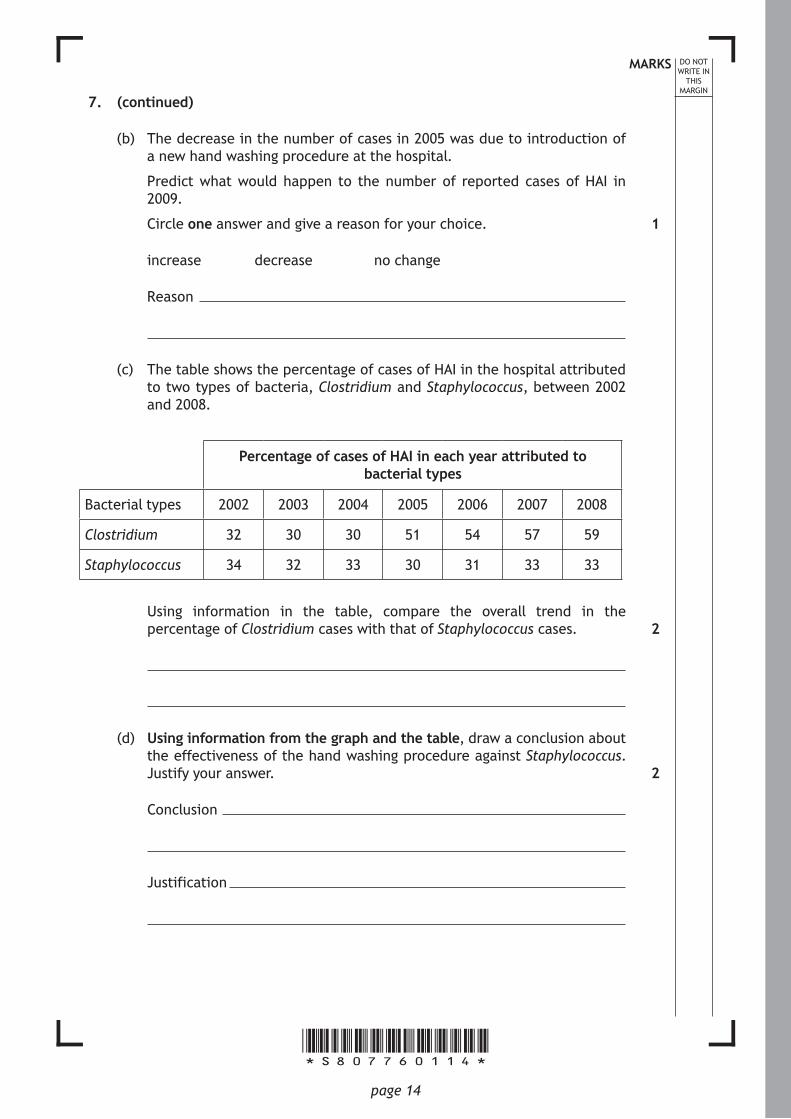
7. (continued)
(b) The decrease in the number of cases in 2005 was due to introduction of a new hand washing procedure at the hospital.
Predict what would happen to the number of reported cases of HAI in 2009.
Circle one answer and give a reason for your choice.
increase decrease no change
Reason
(c) The table shows the percentage of cases of HAI in the hospital attributed to two types of bacteria, Clostridium and Staphylococcus, between 2002 and 2008.
Percentage of cases of HAI in each year attributed to bacterial types
Bacterial types 2002 2003 2004 2005 2006 2007 2008
Clostridium 32 30 30 51 54 57 59
Staphylococcus 34 32 33 30 31 33 33
Using information in the table, compare the overall trend in the percentage of Clostridium cases with that of Staphylococcus cases.
(d) Using information from the graph and the table, draw a conclusion about the effectiveness of the hand washing procedure against Staphylococcus. Justify your answer.
Conclusion
Justification
1
2
2

*S807760115*page 15
MARKS DO NOT WRITE IN
THIS MARGIN
7. (continued)
(e) Some bacteria form endospores to survive adverse conditions.
Identify which of the two types of bacteria in the table forms endospores and give a reason for your answer.
Bacterial type
Reason
[Turn over
1
*S807760116*page 16
MARKS DO NOT WRITE IN
THIS MARGIN
8. Mammals are regulators and can control their internal environment.
(a) Give one reason why it is important for mammals to regulate their body temperature.
(b) (i) Name the temperature monitoring centre in the body of a mammal.
(ii) State how messages are sent from the temperature monitoring centre to the skin.
(c) The blood vessels in the skin of a mammal respond to a decrease in environmental temperature.
(i) Describe this response.
(ii) Explain the effect of this response.
1
1
1
1
1
*S807760117*page 17
MARKS DO NOT WRITE IN
THIS MARGIN
9. Attempt either A or B. Write your answer in the space below.
A Describe how animals survive adverse conditions.
OR
B Describe recombinant DNA technology.
You may use labelled diagrams where appropriate.
4
4
[Turn over

*S807760118*page 18
MARKS DO NOT WRITE IN
THIS MARGIN
10. Nettles are plants which often grow below trees. Their leaves contain photosynthetic pigments X and Y. The table shows the percentage of light of different wavelengths absorbed by these pigments.
Wavelength of light (nm) Colour of light
Light absorbed (%)
Pigment X Pigment Y
400 violet 40 20
440 blue 60 30
550 green 5 60
680 red 50 5
(a) State what else can happen to light striking the leaves of plants, apart from it being absorbed.
(b) Identify which of the pigments in the table, X or Y, is chlorophyll a.
Explain your choice.
Pigment
Explanation
(c) (i) Describe the relationship between the wavelength of light and the percentage of light absorbed by pigment Y.
(ii) Describe how the presence of pigment Y in their leaves would benefit nettle plants growing below trees.
1
1
2
1
*S807760119*page 19
MARKS DO NOT WRITE IN
THIS MARGIN
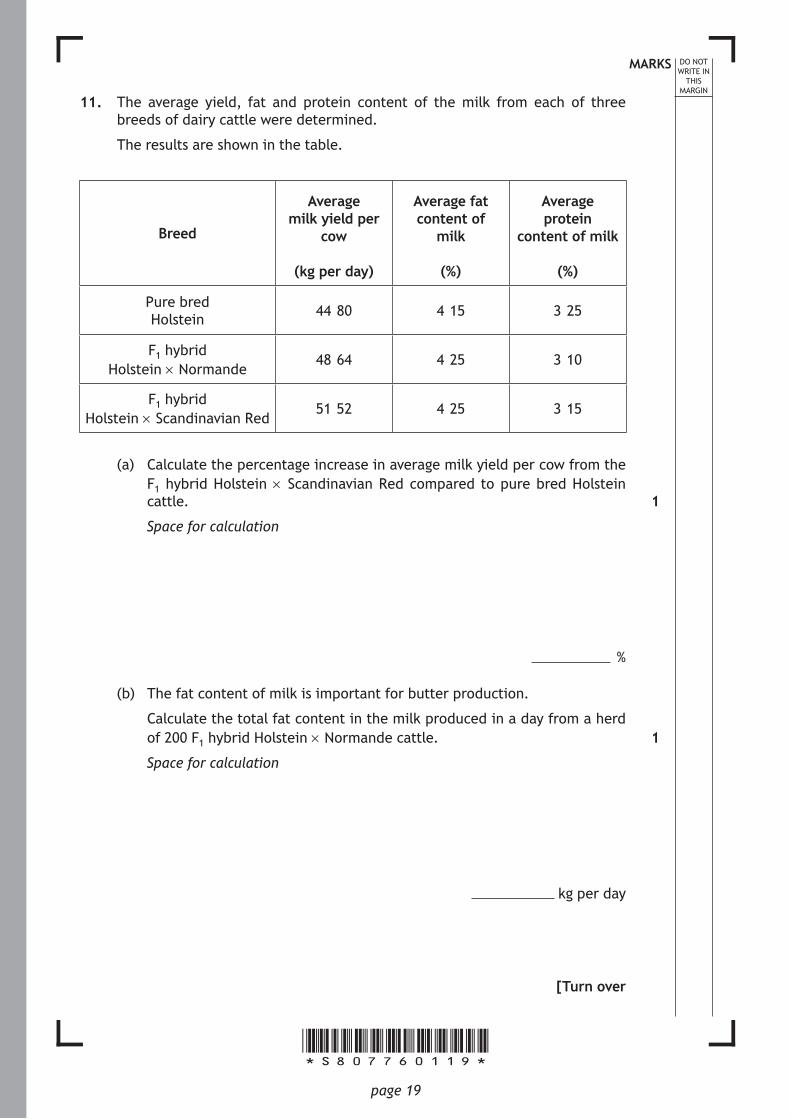
11. The average yield, fat and protein content of the milk from each of three breeds of dairy cattle were determined.
The results are shown in the table.
Breed
Average milk yield per
cow
(kg per day)
Average fat content of
milk
(%)
Average protein
content of milk
(%)
Pure bred Holstein 44·80 4·15 3·25
F1 hybrid Holstein × Normande
48·64 4·25 3·10
F1 hybrid Holstein × Scandinavian Red
51·52 4·25 3·15
(a) Calculate the percentage increase in average milk yield per cow from the F1 hybrid Holstein × Scandinavian Red compared to pure bred Holstein cattle.
Space for calculation
%
(b) The fat content of milk is important for butter production.
Calculate the total fat content in the milk produced in a day from a herd of 200 F1 hybrid Holstein × Normande cattle.
Space for calculation
kg per day
[Turn over
1
1

*S807760120*page 20
MARKS DO NOT WRITE IN
THIS MARGIN
11. (continued)
(c) Select one from: average milk yield per cow; average fat content of milk; or average protein content of milk.
For your choice, draw a conclusion about the effects of crossbreeding.
Choice
Conclusion
(d) The development of pure breeds such as Holsteins has led to an accumulation of deleterious recessive alleles.
State the term that describes this.
(e) Some F2 offspring from crosses of F1 hybrid Holstein × Scandinavian Red cattle will have less desirable milk-producing characteristics than their parents.
Give one reason for this.
1
1
1
*S807760121*page 21
DO NOT WRITE IN
THIS MARGIN
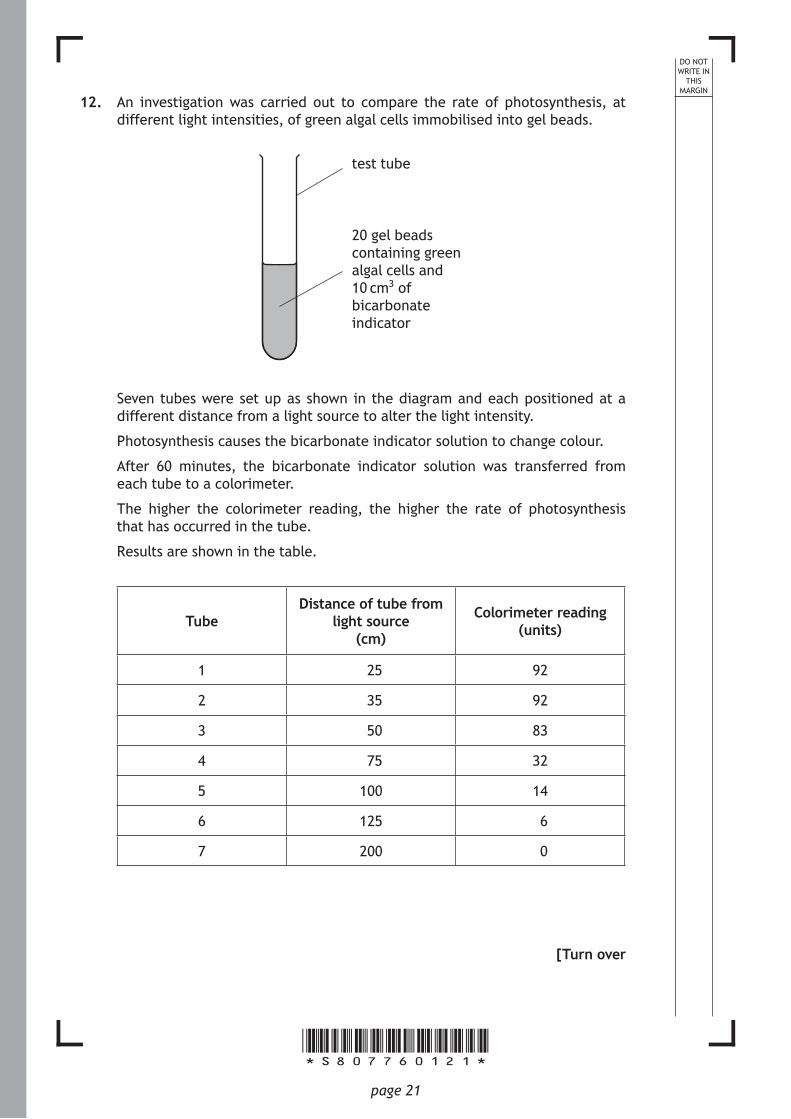
12. An investigation was carried out to compare the rate of photosynthesis, at different light intensities, of green algal cells immobilised into gel beads.
test tube
20 gel beads containing green algal cells and 10 cm3 of bicarbonate indicator
Seven tubes were set up as shown in the diagram and each positioned at a different distance from a light source to alter the light intensity.
Photosynthesis causes the bicarbonate indicator solution to change colour.
After 60 minutes, the bicarbonate indicator solution was transferred from each tube to a colorimeter.
The higher the colorimeter reading, the higher the rate of photosynthesis that has occurred in the tube.
Results are shown in the table.
TubeDistance of tube from
light source(cm)
Colorimeter reading (units)
1 25 92
2 35 92
3 50 83
4 75 32
5 100 14
6 125 6
7 200 0
[Turn over

*S807760122*page 22
MARKS DO NOT WRITE IN
THIS MARGIN
12. (continued)
(a) Identify the dependent variable in this investigation.
(b) Describe how the apparatus could be improved to ensure that temperature was kept constant.
(c) Suggest why the tubes were left for 60 minutes before transferring the bicarbonate indicator solution to the colorimeter.
(d) Describe how the experimental procedure could be improved to increase the reliability of the results.
1
1
1
1
*S807760123*page 23
MARKS DO NOT WRITE IN
THIS MARGIN
12. (continued)
(e) On the grid, draw a line graph using the results in the table.
(Additional graph paper, if required, can be found on page 33)
(f) From the results of this investigation, draw a conclusion about the effect of light intensity on the rate of photosynthesis.
[Turn over
2
2
*S807760124*page 24
MARKS DO NOT WRITE IN
THIS MARGIN
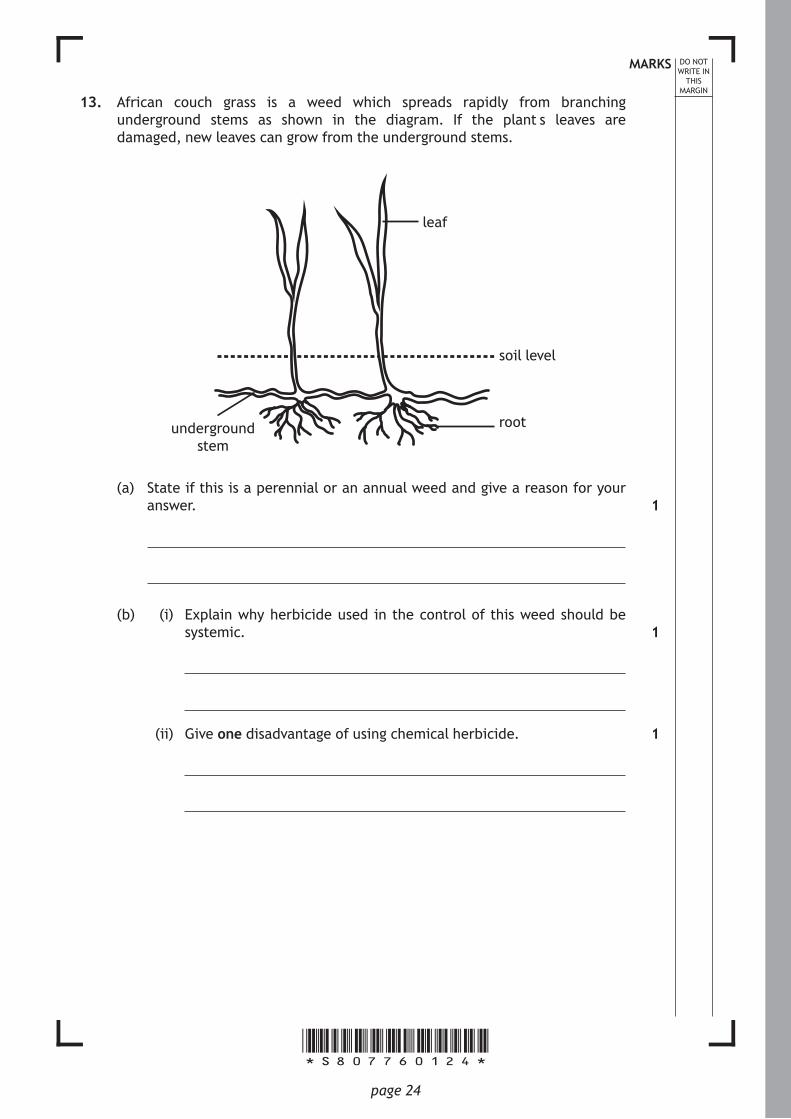
13. African couch grass is a weed which spreads rapidly from branching underground stems as shown in the diagram. If the plant’s leaves are damaged, new leaves can grow from the underground stems.
leaf
soil level
rootunderground stem
(a) State if this is a perennial or an annual weed and give a reason for your answer.
(b) (i) Explain why herbicide used in the control of this weed should be systemic.
(ii) Give one disadvantage of using chemical herbicide.
1
1
1
*S807760125*page 25
MARKS DO NOT WRITE IN
THIS MARGIN
13. (continued)
(c) Explain why weeds are regarded as pests when they grow among crop plants.
(d) Herbicides are sometimes used along with ploughing to control weeds.
What name is given to this type of combined weed control?
[Turn over
2
1

*S807760126*page 26
MARKS DO NOT WRITE IN
THIS MARGIN
14. (a) The honey bee (Apis mellifera) is a social insect that lives in colonies.
The queen is the only female in a colony that reproduces. Other females are workers that collect food, maintain the colony and care for the developing offspring.
Explain the advantage to the worker bees of caring for the offspring of the queen.
(b) The graph shows the changes in the number of honey bee hives kept by bee-keepers in the USA from 1945 to 2005.
number of honey bee
hives(millions)
1945 1950 1955 1960 1965 1970 1975 1980 1985 1990 1995 2000 2005
year
6
5
4
3
2
1
0
2
*S807760127*page 27
MARKS DO NOT WRITE IN
THIS MARGIN
14. (b) (continued)
(i) Using values from the graph, describe changes in the number of bee hives from 1980 to 1995.
(ii) Calculate the simplest whole number ratio of the number of bee hives in 1965 and 2005.
Space for calculation
hives in 1965 : hives in 2005
[Turn over
2
1

*S807760128*page 28
MARKS DO NOT WRITE IN
THIS MARGIN
15. The genetic diversity of individual species is affected when fragments of woodland become isolated.
The diagram illustrates habitat fragmentation of an area of woodland over time.
The shaded areas represent woodland.
time
(a) (i) State what is meant by genetic diversity.
(ii) Suggest a reason why a decrease in genetic diversity of an individual species can lead to local extinctions within habitat fragments.
(b) Explain how degradation at the edges of woodland habitat fragments affects biodiversity.
(c) Habitat corridors can be created to remedy habitat fragmentation.
(i) State what is meant by the term ‘habitat corridor’.
(ii) Explain how a habitat corridor can increase biodiversity after local extinction.
1
1
2
1
1
*S807760129*page 29
MARKS DO NOT WRITE IN
THIS MARGIN
16. Japanese knotweed (Fallopia japonica) was introduced to Britain as an ornamental plant. It grows to 3 metres in height and has large leaves. It has become naturalised and has colonised many parts of the country where it out-competes native plants.
(a) Give the term used for a naturalised species that eliminates native species.
(b) Name one resource for which Japanese knotweed may outcompete the native plants.
(c) Japanese knotweed has spread very rapidly in Britain.
Suggest a reason for this.
(d) An insect from Japan, which feeds on Japanese knotweed, has been proposed as a biological control agent.
Describe one possible risk of introducing this insect into Britain.
[Turn over
1
1
1
1

*S807760130*page 30
MARKS DO NOT WRITE IN
THIS MARGIN
17. Attempt either A or B. Write your answer in the space below and on pages 31 and 32.
A Describe DNA under the following headings.
(i) Structure of DNA
(ii) Replication of DNA
OR
B Describe the evolution of new species under the following headings.
(i) Isolation and mutation
(ii) Selection
You may use labelled diagrams where appropriate.
9
9

*S807760131*page 31
MARKS DO NOT WRITE IN
THIS MARGIN
SPACE FOR ANSWERS

*S807760132*page 32
MARKS DO NOT WRITE IN
THIS MARGIN
SPACE FOR ANSWERS
[END OF SPECIMEN QUESTION PAPER]

*S807760133*page 33
MARKS DO NOT WRITE IN
THIS MARGIN
ADDITIONAL SPACE FOR ANSWERS AND ROUGH WORK
ADDITIONAL GRAPH PAPER FOR QUESTION 12 (e)

*S807760134*page 34
MARKS DO NOT WRITE IN
THIS MARGIN
ADDITIONAL SPACE FOR ANSWERS AND ROUGH WORK

*S807760135*page 35
MARKS DO NOT WRITE IN
THIS MARGIN
ADDITIONAL SPACE FOR ANSWERS AND ROUGH WORK
©
NationalQualicationsSPECIMEN ONLY H
S807/76/01 BiologyPaper 2
Marking Instructions
The information in this publication may be reproduced to support SQA qualifications only on a non-commercial basis. If it is reproduced, SQA should be clearly acknowledged as the source. If it is to be used for any other purpose, written permission must be obtained from [email protected].
Where the publication includes materials from sources other than SQA (ie secondary copyright), this material should only be reproduced for the purposes of examination or assessment. If it needs to be reproduced for any other purpose it is the user’s responsibility to obtain the necessary copyright clearance.
These marking instructions have been provided to show how SQA would mark this specimen question paper.

page 02
General marking principles for Higher Biology Always apply these general principles. Use them in conjunction with the detailed marking instructions, which identify the key features required in candidates’ responses. (a) Always use positive marking. This means candidates accumulate marks for the demonstration of
relevant skills, knowledge and understanding; marks are not deducted for errors or omissions. (b) If a candidate response does not seem to be covered by either the principles or detailed marking
instructions, and you are uncertain how to assess it, you must seek guidance from your team leader.
(c) Do not award half marks. (d) Where a candidate makes an error in the first part of a question, award marks for subsequent
answers that are correct with regard to this original error. Do not penalise candidates more than once for the same error.
(e) Unless a numerical question specifically requires evidence of working to be shown, award full
marks for a correct final answer (including units, if appropriate) on its own. (f) Candidates should not use bulleted lists to answer extended-response questions. They must
respond to the ‘command’ word as appropriate and provide extended answers to communicate fully their knowledge and understanding. Candidate responses in the form of bulleted lists may not be able to access the full range of available marks.
(g) In the detailed marking instructions, if a word is underlined then it is essential; if a word is
(bracketed) then it is not essential. (h) In the detailed marking instructions, words separated by / are alternatives. (i) A correct response can be negated if the candidate includes:
• an extra, incorrect, response • additional information that contradicts the correct response
(j) Where the candidate is instructed to choose one question to answer but instead answers two
questions, mark both responses and award the higher mark. (k) Unless otherwise required by the question, the use of abbreviations (for example DNA, ATP) or
chemical formulae (for example CO2, H20) are acceptable alternatives to naming. (l) If a numerical answer is required and units are not given in the stem of the question or in the
answer space, candidates must supply the units to gain the mark. If units are required on more than one occasion, do not penalise candidates repeatedly.
(m) If incorrect spelling is given, sound out the word(s).
• If the correct word is recognisable then award the mark. • If the word can easily be confused with another biological term then do not award the mark,
for example glucagon and glycogen.

page 03
(n) Presentation of data:
• If a candidate provides two graphs, in response to one question, mark both and award the higher mark.
• If a question asks for a particular type of graph/chart and the candidate gives the wrong type, do not award full marks. Candidates cannot achieve the plot mark but may be able to achieve the mark for scale and label. If the x and y data are transposed, then do not award the scale and label mark.
• If the graph uses less than 50% of the axes then do not award the scale and label mark. • If 0 is plotted when no data for this is given, then do not award the plot mark — candidates
should only plot the data given.
(o) Only award marks for a valid response to the question asked. For example, in response to questions that ask candidates to: • identify, name, give or state, they need only answer or present in brief form • describe, they must provide a statement as opposed to simply one word • explain, they must provide a reason for the information given • compare, they must demonstrate knowledge and understanding of the similarities and/or
differences between topics being examined • calculate, they must determine a number from given facts, figures or information • predict, they must indicate what may happen based on available information • suggest, they must apply their knowledge and understanding to a new situation
page 04
Marking instructions for each question
Question Expected response Max mark
Additional guidance
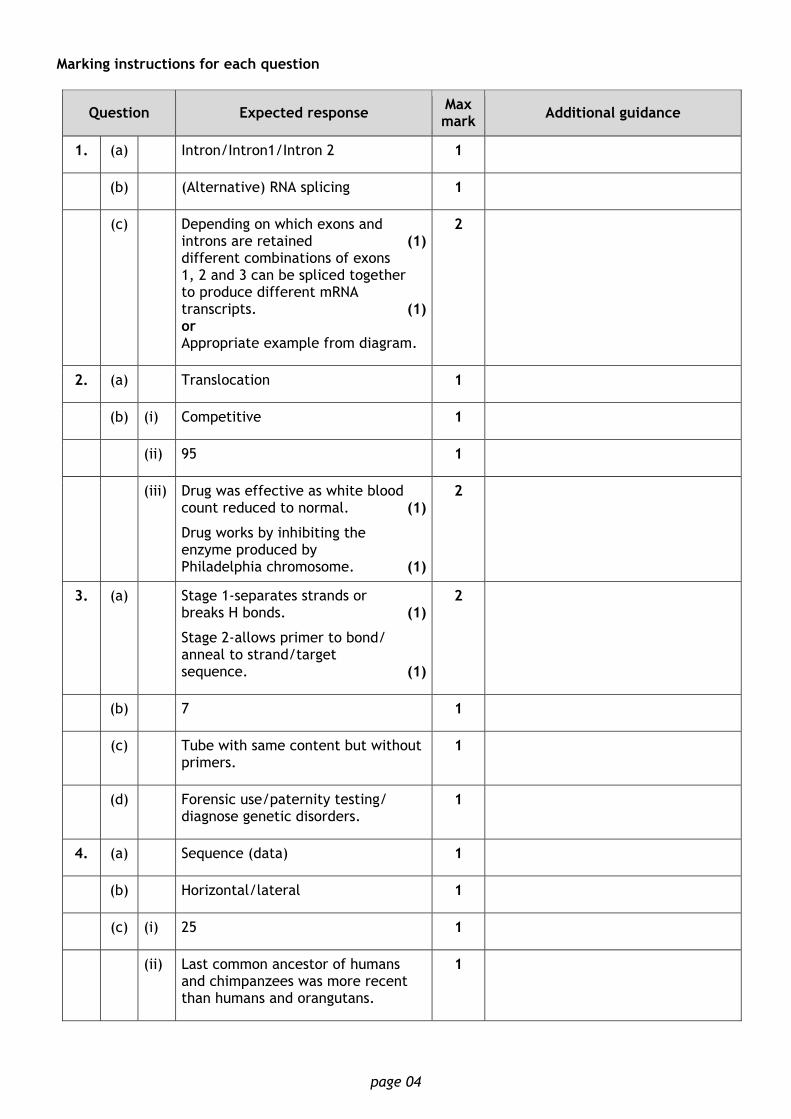
1. (a) Intron/Intron1/Intron 2 1
(b) (Alternative) RNA splicing 1
(c) Depending on which exons and introns are retained (1) different combinations of exons 1, 2 and 3 can be spliced together to produce different mRNA transcripts. (1) or Appropriate example from diagram.
2
2. (a) Translocation 1
(b) (i) Competitive 1
(ii) 95 1
(iii) Drug was effective as white blood count reduced to normal. (1)
Drug works by inhibiting the enzyme produced by Philadelphia chromosome. (1)
2
3. (a) Stage 1-separates strands or breaks H bonds. (1)
Stage 2-allows primer to bond/ anneal to strand/target sequence. (1)
2
(b) 7 1
(c) Tube with same content but without primers.
1
(d) Forensic use/paternity testing/ diagnose genetic disorders.
1
4. (a) Sequence (data) 1
(b) Horizontal/lateral 1
(c) (i) 25 1
(ii) Last common ancestor of humans and chimpanzees was more recent than humans and orangutans.
1

page 05
Question Expected response Max mark Additional guidance
5. (a) P is Acetyl CoA/Acetyl co-enzyme A. (1)
Q is Oxaloacetate. (1)
2
(b) ATP/Energy is required. (1)
A greater amount of energy/ATP is produced. (1)
2
(c) Carry hydrogen and electrons (1)
to the electron transport chain. (1)
2
(d) Less ATP/energy is produced. (1)
ATP synthase/carrier proteins damaged. or Fewer hydrogen ions are pumped across the membrane/fewer electrons passed along electron transport chain. (1)
2
6. (a) Sterility/oxygen/temperature/pH 1
(b) (i) Phase - stationary (1)
Advantage – allows them to out-compete other micro-organisms. (1)
2
(ii) W/Lag 1
(iii) (Cells are dying) because of toxic waste/secondary metabolites accumulating/building up/being produced. or Running out/lack of/no nutrients /oxygen/food/ respiratory substrate. or Increasing competition (for food).
1 Not acceptable: death rate higher than birth rate; substrate on its own.

page 06
Question Expected response Max mark Additional guidance
7. (a) 20 1
(b) Increase – people becoming complacent about hand washing or bacteria becoming resistant. or No change – everyone now using procedure. or Decrease – increased uptake of procedure.
1
(c) Clostridium increases, (1) Staphylococcus remains fairly constant (1)
2
(d) Conclusion - effective (1)
Justification – although percentage of cases remains similar number of cases falls. (1)
2
(e) Type - Clostridium
Reason - percentage of cases due to Clostridium increased.
1
8. (a) So that enzymes are at their optimum temperature or for faster diffusion rates.
1
(b) (i) Hypothalamus 1
(ii) Nerve impulse/electrical impulse through nerves.
1
(c) (i) Vasoconstriction/vessels get narrower.
1
(ii) Reduces blood flow to skin so less heat loss.
1

page 07
Question Expected response Max mark Additional guidance
9. A 1. Metabolic rate reduced.
2. Dormancy can be predictive or consequential.
3. Hibernation in winter (usually mammals).
4. Aestivation allows survival in periods of drought or high temperature.
5. Daily torpor is reduced activity in animals with high metabolic rates.
6. Example of hibernation or aestivation or daily torpor.
4 Award 1 mark for each correct description, up to a maximum of 4 marks.
Check any diagram(s) for relevant information not present in text and award accordingly.
B 1. Plant/animal gene transferred into micro-organism that makes plant/animal protein.
2. Restriction endonuclease to cut gene out/cut plasmid.
3. Genes introduced to prevent microbe surviving in external environment.
4. Ligase seals gene into plasmid.
5. Recombinant yeast cells to overcome polypeptides being incorrectly folded.
6. Regulatory sequences in plasmids/artificial chromosomes to control gene expression.
4 Award 1 mark for each correct description, up to a maximum of 4 marks.
Check any diagram(s) for relevant information not present in text and award accordingly.
10. (a) Reflected or Transmitted
1
(b) Pigment X Explanation: Absorbs in red and blue (light). Best/better/much more/mainly/ at a higher percentage/greater/ higher/more efficiently (than pigment Y/than green). or Converse for green.
1 Both pigment and explanation for 1 mark.
Not acceptable: absorbs red and blue light alone/absorbs very little green light/high absorption of red and blue light.
page 08
Question Expected response Max mark Additional guidance
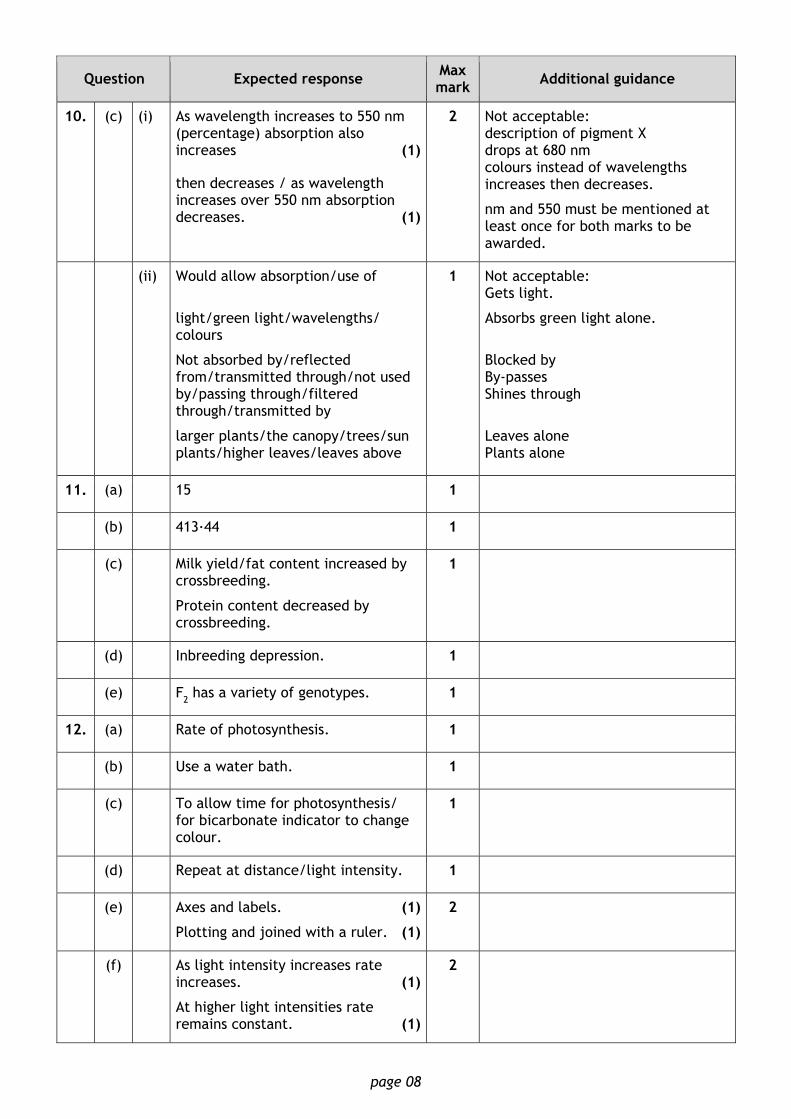
10. (c) (i) As wavelength increases to 550 nm (percentage) absorption also increases (1)
then decreases / as wavelength increases over 550 nm absorption decreases. (1)
2 Not acceptable: description of pigment X drops at 680 nm colours instead of wavelengths increases then decreases.
nm and 550 must be mentioned at least once for both marks to be awarded.
(ii) Would allow absorption/use of
light/green light/wavelengths/ colours
Not absorbed by/reflected from/transmitted through/not used by/passing through/filtered through/transmitted by
larger plants/the canopy/trees/sun plants/higher leaves/leaves above
1 Not acceptable: Gets light.
Absorbs green light alone.
Blocked by By-passes Shines through
Leaves alone Plants alone
11. (a) 15 1
(b) 413·44 1
(c) Milk yield/fat content increased by crossbreeding.
Protein content decreased by crossbreeding.
1
(d) Inbreeding depression. 1
(e) F2 has a variety of genotypes. 1
12. (a) Rate of photosynthesis. 1
(b) Use a water bath. 1
(c) To allow time for photosynthesis/ for bicarbonate indicator to change colour.
1
(d) Repeat at distance/light intensity. 1
(e) Axes and labels. (1)
Plotting and joined with a ruler. (1)
2
(f) As light intensity increases rate increases. (1)
At higher light intensities rate remains constant. (1)
2
page 09
Question Expected response Max mark Additional guidance
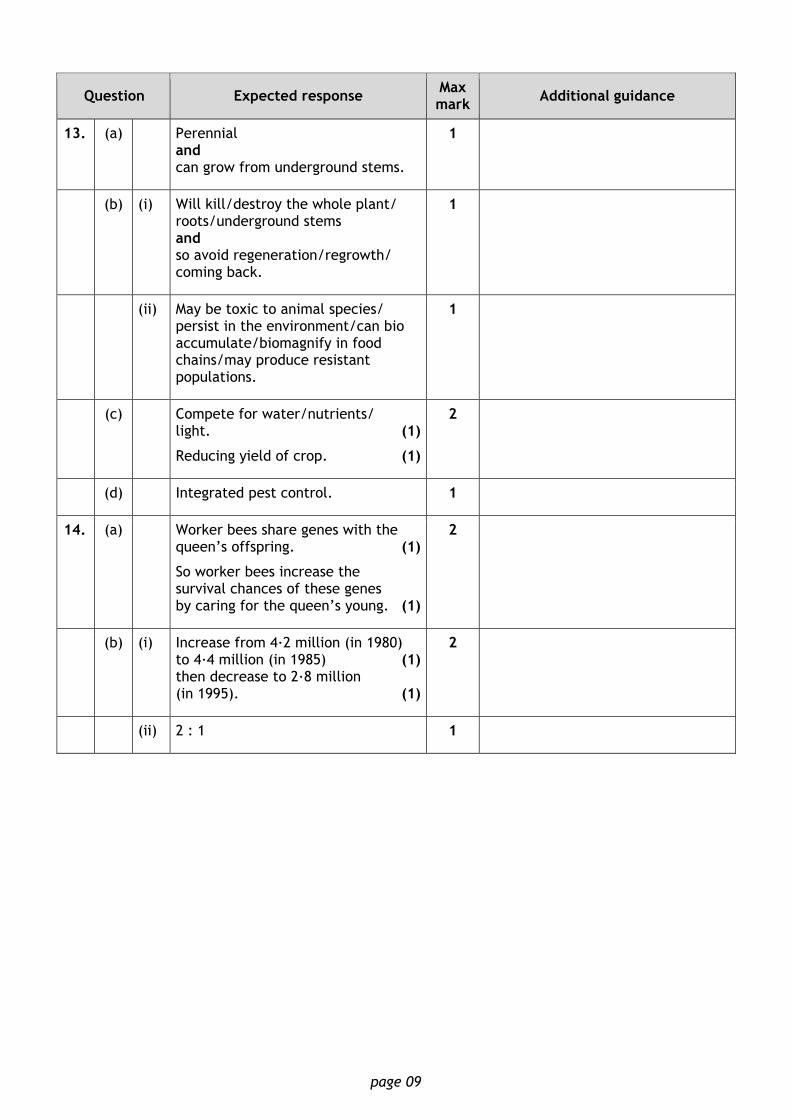
13. (a) Perennial and can grow from underground stems.
1
(b) (i) Will kill/destroy the whole plant/ roots/underground stems and so avoid regeneration/regrowth/ coming back.
1
(ii) May be toxic to animal species/ persist in the environment/can bio accumulate/biomagnify in food chains/may produce resistant populations.
1
(c) Compete for water/nutrients/ light. (1)
Reducing yield of crop. (1)
2
(d) Integrated pest control. 1
14. (a) Worker bees share genes with the queen’s offspring. (1)
So worker bees increase the survival chances of these genes by caring for the queen’s young. (1)
2
(b) (i) Increase from 4·2 million (in 1980) to 4·4 million (in 1985) (1) then decrease to 2·8 million (in 1995). (1)
2
(ii) 2 : 1 1
page 10
Question Expected response Max mark Additional guidance
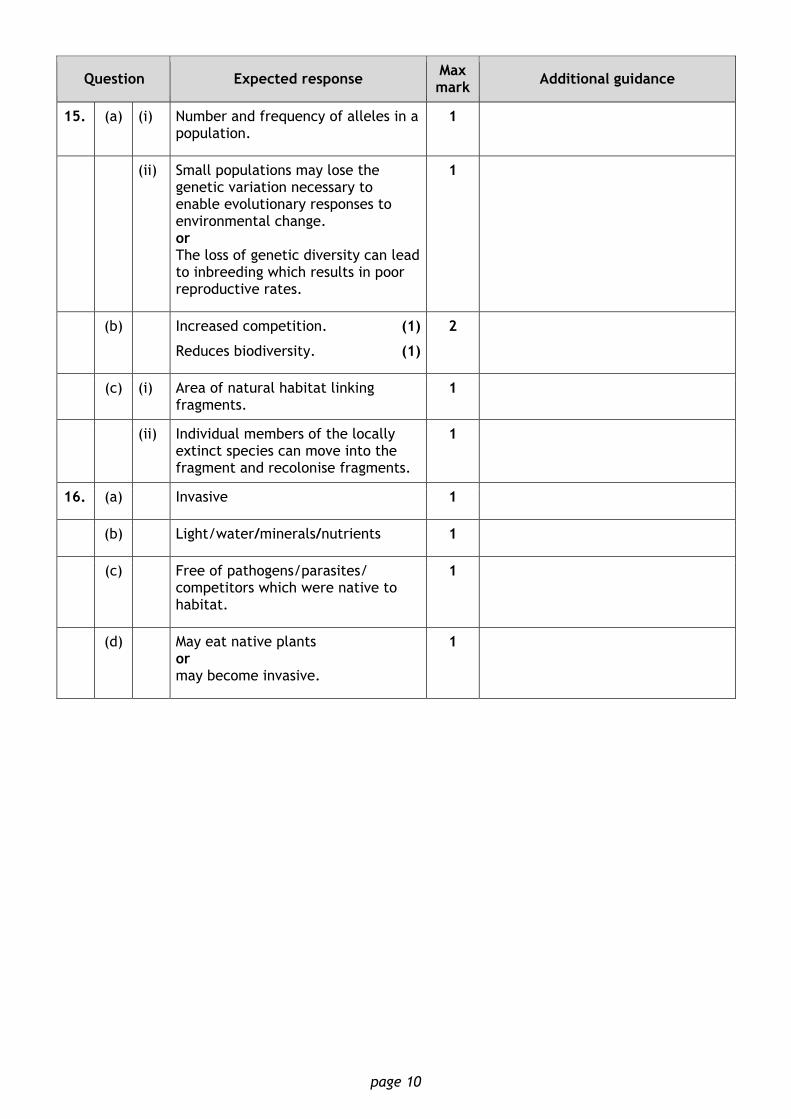
15. (a) (i) Number and frequency of alleles in a population.
1
(ii) Small populations may lose the genetic variation necessary to enable evolutionary responses to environmental change. or The loss of genetic diversity can lead to inbreeding which results in poor reproductive rates.
1
(b) Increased competition. (1)
Reduces biodiversity. (1)
2
(c) (i) Area of natural habitat linking fragments.
1
(ii) Individual members of the locally extinct species can move into the fragment and recolonise fragments.
1
16. (a) Invasive 1
(b) Light/water/minerals/nutrients 1
(c) Free of pathogens/parasites/ competitors which were native to habitat.
1
(d) May eat native plants or may become invasive.
1
page 11
Question Expected response Max mark Additional guidance
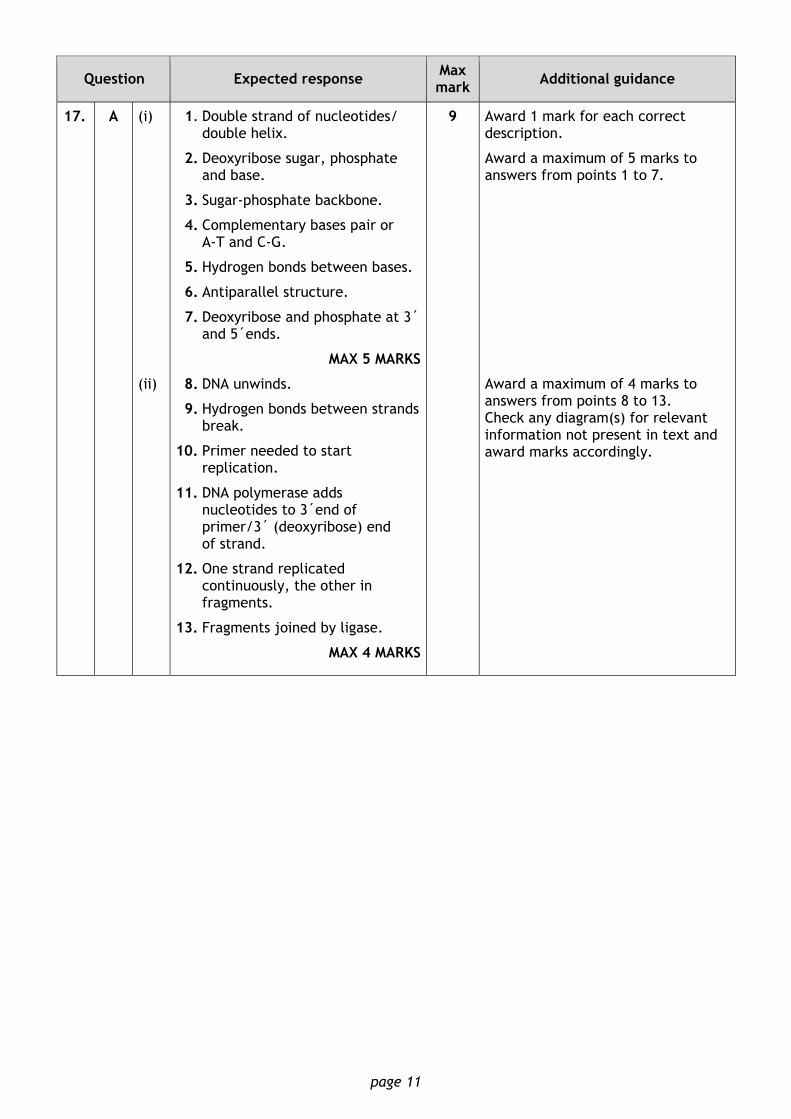
17. A (i)
(ii)
1. Double strand of nucleotides/ double helix.
2. Deoxyribose sugar, phosphate and base.
3. Sugar-phosphate backbone.
4. Complementary bases pair or A-T and C-G.
5. Hydrogen bonds between bases.
6. Antiparallel structure.
7. Deoxyribose and phosphate at 3´ and 5´ends.
MAX 5 MARKS
8. DNA unwinds.
9. Hydrogen bonds between strands break.
10. Primer needed to start replication.
11. DNA polymerase adds nucleotides to 3´end of primer/3´ (deoxyribose) end of strand.
12. One strand replicated continuously, the other in fragments.
13. Fragments joined by ligase.
MAX 4 MARKS
9 Award 1 mark for each correct description.
Award a maximum of 5 marks to answers from points 1 to 7.
Award a maximum of 4 marks to answers from points 8 to 13. Check any diagram(s) for relevant information not present in text and award marks accordingly.

page 12
Question Expected response Max mark Additional guidance
17. B (i)
(ii)
1. Isolation barriers prevent gene flow between populations/ populations interbreeding.
2. Geographical isolation leads to allopatric speciation.
3. Behavioural isolation leads to sympatric speciation.
4. Ecological isolation leads to sympatric speciation.
5. Different mutations occur on each side of isolation barrier.
6. Some mutations may be favourable/provide selective advantage.
MAX 4 MARKS
7. Natural selection is non-random increase in frequency of genetic sequences that increase survival.
8. There are different selection pressures each side of the barrier.
9. Any 2 from disruptive/ directional/stabilising selection.
10. Third type of selection from 9.
11. After many generations/long period of time.
12. New species form.
13. If populations can no longer interbreed to produce fertile young then different species.
MAX 5 MARKS
9 Award 1 mark for each correct description. Award a maximum of 4 marks to answers from points 1 to 6.
Award a maximum of 5 marks to answers from points 7 to 13. Check any diagram(s) for relevant information not present in text and award marks accordingly.
[END OF SPECIMEN MARKING INSTRUCTIONS]


![National 4XDOLÛFDWLRQV SPECIMEN ONLY · PDF filenational 4xdolÛfdwlrqv specimen only ... april may june ... [end of specimen question paper] 2 1 2 2 2 3 3 *s800750101* *s8007501*](https://static.fdocuments.in/doc/165x107/5a8414c57f8b9a24668ee688/national-4xdolfdwlrqv-specimen-only-4xdolfdwlrqv-specimen-only-april-may-june.jpg)