
Nathan VanRheenen Rick Palmer Civil and Environmental Engineering University of Washington ...
47
Nathan VanRheenen Rick Palmer Civil and Environmental Engineering University of Washington www.tag.washington.edu Attention Snake River Water Users: You Really Can Have It All! (or Maybe You Can’t) -Optimization as a means to better long-term water policies in the Snake River Basin- CIG Weekly Seminar Series – Nov 16, 2004
-
date post
22-Dec-2015 -
Category
Documents
-
view
219 -
download
0
Transcript of Nathan VanRheenen Rick Palmer Civil and Environmental Engineering University of Washington ...

Nathan VanRheenenRick Palmer
Civil and Environmental EngineeringUniversity of Washington
www.tag.washington.edu
Attention Snake River Water Users:
You Really Can Have It All!(or Maybe You Can’t)
-Optimization as a means to better long-term water policies in the Snake River
Basin-
CIG Weekly Seminar Series – Nov 16, 2004

Overview
Research Goals Setting Model intro Model inputs Model approach and processes Model output On deck

Goals of Research
What are the long-range impacts of climate change on the managed Snake River system? Goal: Develop a model that incorporates
current and future operating rules and management strategies
Simulation Model of Snake River Basin (SnakeSim)
How can the potential impacts of climate change be mitigated? Goal: Develop a model that provides the
“best” management strategy for SRB usersNew starting point for policy-makers Optimization Model of SRB (SIRAS)

Setting - Snake River Basin
Basin in parts of 7 states Largest tributary of Columbia River 1000 miles long 20 major reservoirs 14 MAF surface storage 250 MAF groundwater aquifer 17 MAF allocated water rights Agriculture Productivity - 3rd in US Hydropower, Fish

Snake River Basin WR Network

Snake River Basin WR Network

Political Landscape
Many users Many opinions Scientific controversy Established positions Political activism

Political Landscape
No More Ignoring the Obvious – Idaho Sucks Itself Dry – High Country News, 2/95
“The department has handed out water rights and groundwater permits as if there’s no tomorrow."
"The fish were there first, but they didn’t fill out the (water rights) forms." Ongoing Issues
Basin Adjudication Biological Opinions Groundwater supply uncertainty Changing water supply needs Relationship to the Columbia River and the PNW Uncertainty of future climate and impacts on water resources

Snake River Models

SnakeSimOperations Model
VICHydrology Model
Changes in Mean Temperature and
Precipitation or Bias Corrected Output
from GCMs
SIRASOptimization Model

SIRAS
Snake River Basin Integrated Water Resources Allocation System Purpose: Identify the “best” management
strategy for SRB users Considers
Major surface water features (94% of system storage)
System uses e.g., flood control, irrigation, fish, hydropower
Groundwater impacts 8 major irrigation districts
Economic Objective Function

SIRAS Inputs
Streamflow PET Precipitation Crop coefficient Groundwater response

SIRAS Inputs - Streamflows
J ackson Lake
0
50
100
150
200
250
Oct
-79
Jan
-80
Ap
r-8
0
Jul-
80
Oct
-80
Jan
-81
Ap
r-8
1
Jul-
81
Oct
-81
Jan
-82
Ap
r-8
2
Jul-
82
Oct
-82
Jan
-83
Ap
r-8
3
Jul-
83
Oct
-83
Jan
-84
Ap
r-8
4
Jul-
84
Oct
-84
Jan
-85
Ap
r-8
5
Jul-
85
Oct
-85
Jan
-86
Ap
r-8
6
Jul-
86
Oct
-86
Jan
-87
Ap
r-8
7
Jul-
87
Oct
-87
Jan
-88
Ap
r-8
8
Jul-
88
Oct
-88
Jan
-89
Ap
r-8
9
Jul-
89
Oct
-89
TA
F
hist
base
J ackson Lake
0
50
100
150
200
250
Oct
-79
Jan
-80
Ap
r-8
0
Jul-
80
Oct
-80
Jan
-81
Ap
r-8
1
Jul-
81
Oct
-81
Jan
-82
Ap
r-8
2
Jul-
82
Oct
-82
Jan
-83
Ap
r-8
3
Jul-
83
Oct
-83
Jan
-84
Ap
r-8
4
Jul-
84
Oct
-84
Jan
-85
Ap
r-8
5
Jul-
85
Oct
-85
Jan
-86
Ap
r-8
6
Jul-
86
Oct
-86
Jan
-87
Ap
r-8
7
Jul-
87
Oct
-87
Jan
-88
Ap
r-8
8
Jul-
88
Oct
-88
Jan
-89
Ap
r-8
9
Jul-
89
Oct
-89
TA
F
base
comp2020

SIRAS Inputs - StreamflowsJ ackson Lake, 1976-1992
0
10
20
30
40
50
60
70
80
90
100
Oct
Oct
No
v
De
c
De
c
Jan
Fe
b
Fe
b
Ma
r
Ap
r
Ap
r
Ma
y
Jun
Jul
Jul
Au
g
Se
p
Se
p
TA
F
histbase
J ackson Lake, 1976-1992
0
20
40
60
80
100
120
Oct
Oct
No
v
De
c
De
c
Jan
Fe
b
Fe
b
Ma
r
Ap
r
Ap
r
Ma
y
Jun
Jul
Jul
Au
g
Se
p
Se
p
TA
F
basecomp2020
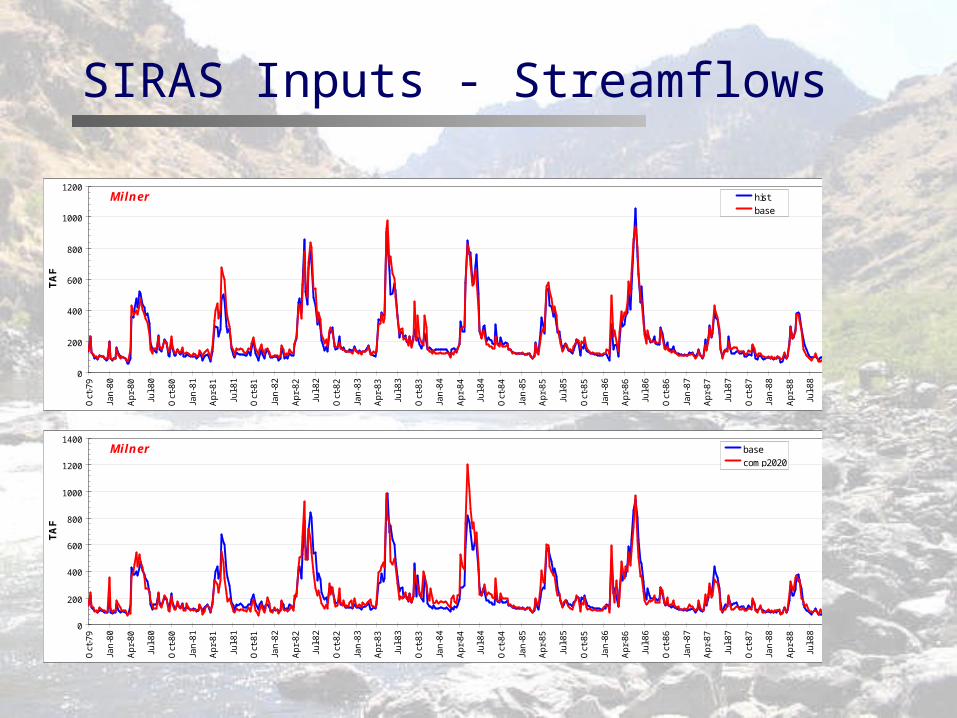
SIRAS Inputs - Streamflows
Milner
0
200
400
600
800
1000
1200
Oct
-79
Jan
-80
Ap
r-8
0
Jul-
80
Oct
-80
Jan
-81
Ap
r-8
1
Jul-
81
Oct
-81
Jan
-82
Ap
r-8
2
Jul-
82
Oct
-82
Jan
-83
Ap
r-8
3
Jul-
83
Oct
-83
Jan
-84
Ap
r-8
4
Jul-
84
Oct
-84
Jan
-85
Ap
r-8
5
Jul-
85
Oct
-85
Jan
-86
Ap
r-8
6
Jul-
86
Oct
-86
Jan
-87
Ap
r-8
7
Jul-
87
Oct
-87
Jan
-88
Ap
r-8
8
Jul-
88
Oct
-88
Jan
-89
Ap
r-8
9
Jul-
89
Oct
-89
TA
F
hist
base
Milner
0
200
400
600
800
1000
1200
1400
Oct
-79
Jan
-80
Ap
r-8
0
Jul-
80
Oct
-80
Jan
-81
Ap
r-8
1
Jul-
81
Oct
-81
Jan
-82
Ap
r-8
2
Jul-
82
Oct
-82
Jan
-83
Ap
r-8
3
Jul-
83
Oct
-83
Jan
-84
Ap
r-8
4
Jul-
84
Oct
-84
Jan
-85
Ap
r-8
5
Jul-
85
Oct
-85
Jan
-86
Ap
r-8
6
Jul-
86
Oct
-86
Jan
-87
Ap
r-8
7
Jul-
87
Oct
-87
Jan
-88
Ap
r-8
8
Jul-
88
Oct
-88
Jan
-89
Ap
r-8
9
Jul-
89
Oct
-89
TA
F
base
comp2020

SIRAS Inputs - Streamflows
Milner, 1976-1992
0
100
200
300
400
500
600
Oct
Oct
No
v
De
c
De
c
Jan
Fe
b
Fe
b
Ma
r
Ap
r
Ap
r
Ma
y
Jun
Jul
Jul
Au
g
Se
p
Se
p
TA
F
hist
base
Milner, 1976-1992
0
100
200
300
400
500
600
Oct
Oct
No
v
De
c
De
c
Jan
Fe
b
Fe
b
Ma
r
Ap
r
Ap
r
Ma
y
Jun
Jul
Jul
Au
g
Se
p
Se
p
TA
F
base
comp2020

SIRAS Inputs - Streamflows
Lower Granite, 1976-1992
0
500
1000
1500
2000
2500
Oct
Oct
No
v
De
c
De
c
Jan
Fe
b
Fe
b
Ma
r
Ap
r
Ap
r
Ma
y
Jun
Jul
Jul
Au
g
Se
p
Se
p
TA
F
base
comp2020
Lower Granite
0
500
1000
1500
2000
2500
3000
3500
4000
4500
Oct
-79
Jan
-80
Ap
r-8
0
Jul-
80
Oct
-80
Jan
-81
Ap
r-8
1
Jul-
81
Oct
-81
Jan
-82
Ap
r-8
2
Jul-
82
Oct
-82
Jan
-83
Ap
r-8
3
Jul-
83
Oct
-83
Jan
-84
Ap
r-8
4
Jul-
84
Oct
-84
Jan
-85
Ap
r-8
5
Jul-
85
Oct
-85
Jan
-86
Ap
r-8
6
Jul-
86
Oct
-86
Jan
-87
Ap
r-8
7
Jul-
87
Oct
-87
Jan
-88
Ap
r-8
8
Jul-
88
Oct
-88
Jan
-89
Ap
r-8
9
Jul-
89
Oct
-89
TA
F
base
comp2020

SIRAS Inputs – GW Discharge Change
Milner to King Hill, 1976-1992
29.0
29.5
30.0
30.5
31.0
31.5
32.0
Oct
Oct
No
v
De
c
De
c
Jan
Fe
b
Fe
b
Ma
r
Ap
r
Ap
r
Ma
y
Jun
Jul
Jul
Au
g
Se
p
Se
p
TA
F
gw-base
gw-comp2020
Milner to King Hill
25
26
27
28
29
30
31
32
33
34
35
Jan
-76
Ap
r-7
6
Jul-
76
Oct
-76
Jan
-77
Ap
r-7
7
Jul-
77
Oct
-77
Jan
-78
Ap
r-7
8
Jul-
78
Oct
-78
Jan
-79
Ap
r-7
9
Jul-
79
Oct
-79
Jan
-80
Ap
r-8
0
Jul-
80
Oct
-80
Jan
-81
Ap
r-8
1
Jul-
81
Oct
-81
Jan
-82
Ap
r-8
2
Jul-
82
Oct
-82
Jan
-83
Ap
r-8
3
Jul-
83
Oct
-83
Jan
-84
Ap
r-8
4
Jul-
84
Oct
-84
Jan
-85
Ap
r-8
5
Jul-
85
Oct
-85
Jan
-86
TA
F
gw-base
gw-comp2020

SIRAS Inputs - PET
PET WD01
0.00
0.01
0.02
0.03
0.04
0.05
0.06
0.07
0.08
Oct
-79
De
c-7
9
Fe
b-8
0
Ap
r-8
0
Jun
-80
Au
g-8
0
Oct
-80
De
c-8
0
Fe
b-8
1
Ap
r-8
1
Jun
-81
Au
g-8
1
Oct
-81
De
c-8
1
Fe
b-8
2
Ap
r-8
2
Jun
-82
Au
g-8
2
Oct
-82
De
c-8
2
Fe
b-8
3
Ap
r-8
3
Jun
-83
Au
g-8
3
Oct
-83
De
c-8
3
Fe
b-8
4
Ap
r-8
4
Jun
-84
Au
g-8
4
Oct
-84
De
c-8
4
Fe
b-8
5
Ap
r-8
5
Jun
-85
Au
g-8
5
Oct
-85
De
c-8
5
Fe
b-8
6
Ap
r-8
6
Jun
-86
Au
g-8
6
Oct
-86
De
c-8
6
Fe
b-8
7
Ap
r-8
7
Jun
-87
Au
g-8
7
Oct
-87
De
c-8
7
Fe
b-8
8
Ap
r-8
8
Jun
-88
Au
g-8
8
Oct
-88
De
c-8
8
Fe
b-8
9
Ap
r-8
9
Jun
-89
Au
g-8
9
Oct
-89
FT
et.base
et.comp2020
PET WD01, 1976-1992
0.00
0.01
0.02
0.03
0.04
0.05
0.06
Oct
Oct
Oct
Nov
Nov
Dec
Dec Ja
n
Jan
Feb
Feb Mar
Mar
Apr
Apr
Apr
May
May
Jun
Jun
Jul
Jul
Aug
Aug
Sep
Sep
FT
et.baseet.comp2020

SIRAS Inputs – Precip
Precip WD01
0.00
0.02
0.04
0.06
0.08
0.10
0.12
0.14
0.16
0.18
Oct
-79
De
c-7
9
Fe
b-8
0
Ap
r-8
0
Jun
-80
Au
g-8
0
Oct
-80
De
c-8
0
Fe
b-8
1
Ap
r-8
1
Jun
-81
Au
g-8
1
Oct
-81
De
c-8
1
Fe
b-8
2
Ap
r-8
2
Jun
-82
Au
g-8
2
Oct
-82
De
c-8
2
Fe
b-8
3
Ap
r-8
3
Jun
-83
Au
g-8
3
Oct
-83
De
c-8
3
Fe
b-8
4
Ap
r-8
4
Jun
-84
Au
g-8
4
Oct
-84
De
c-8
4
Fe
b-8
5
Ap
r-8
5
Jun
-85
Au
g-8
5
Oct
-85
De
c-8
5
Fe
b-8
6
Ap
r-8
6
Jun
-86
Au
g-8
6
Oct
-86
De
c-8
6
Fe
b-8
7
Ap
r-8
7
Jun
-87
Au
g-8
7
Oct
-87
De
c-8
7
Fe
b-8
8
Ap
r-8
8
Jun
-88
Au
g-8
8
Oct
-88
De
c-8
8
Fe
b-8
9
Ap
r-8
9
Jun
-89
Au
g-8
9
Oct
-89
FT
p.base
p.comp2020
Precip WD01, 1976-1992
0.00
0.01
0.02
0.03
0.04
0.05
0.06
Oct
Oct
Oct
Nov
Nov
Dec
Dec Ja
n
Jan
Feb
Feb Mar
Mar
Apr
Apr
Apr
May
May
Jun
Jun
Jul
Jul
Aug
Aug
Sep
Sep
FT
p.base
p.comp2020

SIRAS Inputs - Crops
Available Crops: AlfalfaMean, BarleyFeed, BarleyMalt, Beans,
CornField1, CornField2, CornSweet1, CornSweet2, Onions, Pasture, Potatoes, Sugarbeets, WheatSpringHard, WheatSpringSoft
Crop Coefficient (K) dictates water needs through growing cycle (K is nonlinear)
Crop Water Use (PETcrop)= Kcrop * PETref(alfalfa)
Irrig Need = Acres * (PETcrop – Precip)

SIRAS Approach and Processes


SIRAS Approach – Obj Function Objective Function
Weekly timestep Maximize
Z = Agriculture Revenue ($) + Hydropower Revenue ($) - Flood damages ($) - Environmental Target Penalties
Subject to Inflows, PET Water rights Groundwater availability Farmland availability, crop values and costs,
irrigation efficiency Energy demand and rates Infrastructure limitations (reservoir and
powerplant capacity, etc.) Network flow constraints

SIRAS Approach – Also Optimized
Surface vs. groundwater use Cropping area Crops planted Environmental flow targets, as desired
427 rule Flows at Milner, etc.
Real value is in generating tradeoff curves for testing in simulation tools

SIRAS Approach – LP/SLP Decomp
Run model from 1950-1992 LP/SLP Decomposition Rolling 5-year window Step 1
Maximize over 5 years (260 mo.) Extract conditions at week 52 Redefine constraints Rerun first 52 weeks to determine first year model
optimum Step 2
Move to 2nd 5-year window Redefine constraints with Step 1 end conditions Proceed with 2nd window as per Step 1

Step 1: Optimize over 5 years
Step 2: Extract year 1 ending conditions
Step 3: Redefine conditions as constraints
Step 4: Optimize year 1 only with new constraints
Step 6: Move to next rolling 5-year block and repeat Steps 1-5
Step 5: Initialize year 2 starting storage and gw responses
Year 1 Year 2 Year 3 Year 4 Year 5
Year 2 Year 3 Year 4 Year 5 Year 6
End StorageTotal Power
Irrig AreaGW Response
End Storage
GW Response
SIRAS Approach – LP/SLP Decomp

SIRAS Approach – LP/SLP Decomp
1971-1975
1972-1976
1973-1977
1974-1978
1975-1979
1976-1980
1977-1981
71 72 73 74 75 76 77 78 79 80 81 82 83 84 85 86 87 88 89 90 91 92 93 94 95 96

SIRAS Output

SIRAS Output – Storage
Upper Snake, Base Case, 1979-1988 Traces
UpperSnake
2000
2500
3000
3500
4000
4500
Oct
Oct
Nov
Dec
Dec Jan
Feb
Feb
Mar
Apr
Apr
May Jun
Jul
Jul
Aug
Sep
Sep
TA
F

SIRAS Output – Storage
UpperSnake
0
500
1000
1500
2000
2500
3000
3500
4000
4500
5000
Oct
-79
Jan
-80
Ap
r-8
0
Jul-
80
Oct
-80
Jan
-81
Ap
r-8
1
Jul-
81
Oct
-81
Jan
-82
Ap
r-8
2
Jul-
82
Oct
-82
Jan
-83
Ap
r-8
3
Jul-
83
Oct
-83
Jan
-84
Ap
r-8
4
Jul-
84
Oct
-84
Jan
-85
Ap
r-8
5
Jul-
85
Oct
-85
Jan
-86
Ap
r-8
6
Jul-
86
Oct
-86
Jan
-87
Ap
r-8
7
Jul-
87
Oct
-87
Jan
-88
Ap
r-8
8
Jul-
88
Oct
-88
Jan
-89
Ap
r-8
9
Jul-
89
TA
F
basecomp2020hist
UpperSnake, 1979-1988
0
500
1000
1500
2000
2500
3000
3500
4000
4500O
ct
Oct
Oct
No
v
No
v
De
c
De
c
Jan
Jan
Fe
b
Fe
b
Ma
r
Ma
r
Ap
r
Ap
r
Ap
r
Ma
y
Ma
y
Jun
Jun
Jul
Jul
Au
g
Au
g
Se
p
Se
p
TA
F
base
comp2020
hist
Elev Raised for EnergyElev Raised for Energy

SIRAS Output – Storage
Dworshak, Base Case, 1979-1988 Traces
Dworshak
1000
1200
1400
1600
1800
2000
2200
2400
2600
2800
3000O
ct
Oct
No
v
De
c
De
c
Jan
Fe
b
Fe
b
Mar
Ap
r
Ap
r
May
Jun
Jul
Jul
Au
g
Se
p
Se
p
TA
F
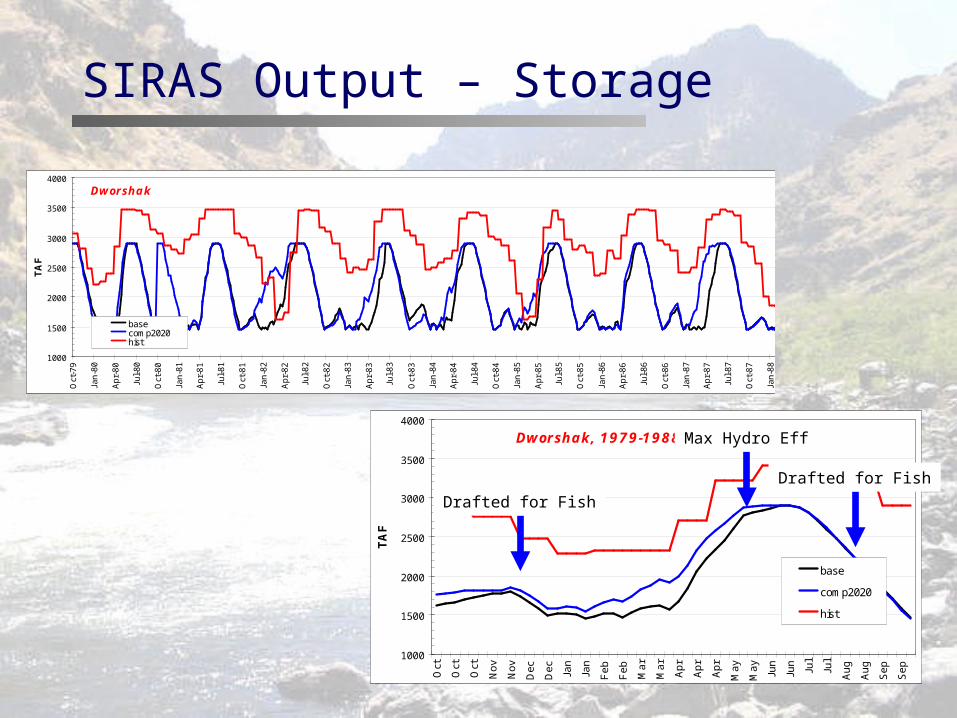
SIRAS Output – Storage
Dworshak, 1979-1988
1000
1500
2000
2500
3000
3500
4000
Oct
Oct
Oct
No
v
No
v
De
c
De
c
Jan
Jan
Fe
b
Fe
b
Ma
r
Ma
r
Ap
r
Ap
r
Ap
r
Ma
y
Ma
y
Jun
Jun
Jul
Jul
Au
g
Au
g
Se
p
Se
p
TA
F
base
comp2020
hist
Dworshak
1000
1500
2000
2500
3000
3500
4000
Oct
-79
Jan
-80
Ap
r-8
0
Jul-
80
Oct
-80
Jan
-81
Ap
r-8
1
Jul-
81
Oct
-81
Jan
-82
Ap
r-8
2
Jul-
82
Oct
-82
Jan
-83
Ap
r-8
3
Jul-
83
Oct
-83
Jan
-84
Ap
r-8
4
Jul-
84
Oct
-84
Jan
-85
Ap
r-8
5
Jul-
85
Oct
-85
Jan
-86
Ap
r-8
6
Jul-
86
Oct
-86
Jan
-87
Ap
r-8
7
Jul-
87
Oct
-87
Jan
-88
Ap
r-8
8
Jul-
88
Oct
-88
Jan
-89
Ap
r-8
9
Jul-
89
TA
F
basecomp2020hist
Max Hydro Eff
Drafted for Fish
Drafted for Fish

SIRAS Output – Releases for Fish
Supplemental releases to meet Lower Granite targets
427 TAF rule is met every year
Total, 1979-1988
0
20
40
60
80
100
120
140
Oct
Oct
Oct
No
v
No
v
De
c
Dec Ja
n
Jan
Fe
b
Fe
b
Ma
r
Ma
r
Ap
r
Ap
r
Ap
r
Ma
y
Ma
y
Jun
Jun
Jul
Jul
Au
g
Au
g
Se
p
Sep
TA
F
base
comp2020
Total
0
50
100
150
200
250
300
350
400
450
Oct
-79
Jan
-80
Ap
r-8
0
Jul-
80
Oct
-80
Jan
-81
Ap
r-8
1
Jul-
81
Oct
-81
Jan
-82
Ap
r-8
2
Jul-
82
Oct
-82
Jan
-83
Ap
r-8
3
Jul-
83
Oct
-83
Jan
-84
Ap
r-8
4
Jul-
84
Oct
-84
Jan
-85
Ap
r-8
5
Jul-
85
Oct
-85
Jan
-86
Ap
r-8
6
Jul-
86
Oct
-86
Jan
-87
Ap
r-8
7
Jul-
87
Oct
-87
Jan
-88
Ap
r-8
8
Jul-
88
Oct
-88
Jan
-89
Ap
r-8
9
Jul-
89
TA
F

SIRAS Output – Releases for Fish
Bulk of fish releases are from Jackson-Palisades complex
So, why is that?
J ackPal, 1979-1988
0
10
20
30
40
50
60
70
80
90
100
Oct
Oct
Oct
No
v
No
v
De
c
De
c
Jan
Jan
Fe
b
Fe
b
Ma
r
Ma
r
Ap
r
Ap
r
Ap
r
Ma
y
Ma
y
Jun
Jun
Jul
Jul
Au
g
Au
g
Se
p
Se
p
TA
F
base
comp2020
Total, 1979-1988
0
20
40
60
80
100
120
140
Oct
Oct
Oct
No
v
No
v
De
c
De
c
Jan
Jan
Fe
b
Fe
b
Ma
r
Ma
r
Ap
r
Ap
r
Ap
r
Ma
y
Ma
y
Jun
Jun
Jul
Jul
Au
g
Au
g
Se
p
Se
p
TA
F
base
comp2020
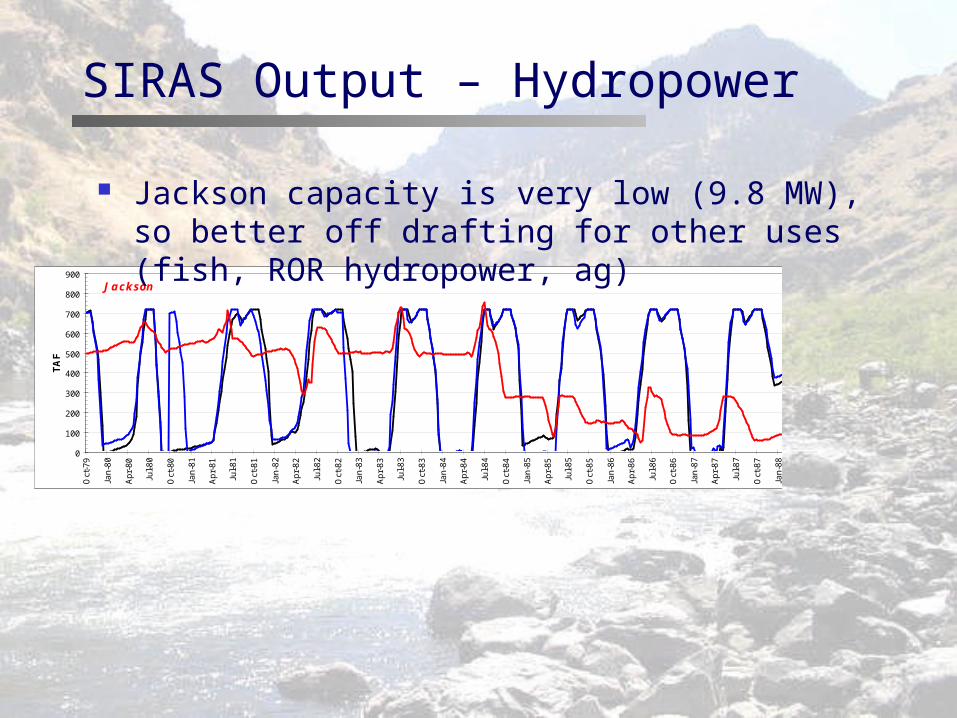
SIRAS Output – Hydropower
J ackson
0
100
200
300
400
500
600
700
800
900
Oct
-79
Jan
-80
Ap
r-8
0
Jul-
80
Oct
-80
Jan
-81
Ap
r-8
1
Jul-
81
Oct
-81
Jan
-82
Ap
r-8
2
Jul-
82
Oct
-82
Jan
-83
Ap
r-8
3
Jul-
83
Oct
-83
Jan
-84
Ap
r-8
4
Jul-
84
Oct
-84
Jan
-85
Ap
r-8
5
Jul-
85
Oct
-85
Jan
-86
Ap
r-8
6
Jul-
86
Oct
-86
Jan
-87
Ap
r-8
7
Jul-
87
Oct
-87
Jan
-88
Ap
r-8
8
Jul-
88
Oct
-88
Jan
-89
Ap
r-8
9
Jul-
89
TA
F
Jackson capacity is very low (9.8 MW), so better off drafting for other uses (fish, ROR hydropower, ag)

SIRAS Output – Hydropower
BOR, 1979-1988
0
100
200
300
400
500
600
700
800
Oct
Oct
Oct
No
v
No
v
De
c
De
c
Jan
Jan
Fe
b
Fe
b
Ma
r
Ma
r
Ap
r
Ap
r
Ap
r
Ma
y
Ma
y
Jun
Jun
Jul
Jul
Au
g
Au
g
Se
p
Se
p
MW
base
comp2020
IP, 1979-1988
1000
1050
1100
1150
1200
1250
1300
1350
1400
Oct
Oct
Oct
No
v
No
v
De
c
De
c
Jan
Jan
Fe
b
Fe
b
Ma
r
Ma
r
Ap
r
Ap
r
Ap
r
Ma
y
Ma
y
Jun
Jun
Jul
Jul
Au
g
Au
g
Se
p
Se
p
MW
base
comp2020
COE, 1979-1988
2700
2800
2900
3000
3100
3200
3300
3400
3500
3600
Oct
Oct
Oct
No
v
No
v
De
c
De
c
Jan
Jan
Fe
b
Fe
b
Ma
r
Ma
r
Ap
r
Ap
r
Ap
r
Ma
y
Ma
y
Jun
Jun
Jul
Jul
Au
g
Au
g
Se
p
Se
p
MW
base
comp2020

Snake River Energy Production, 1975-1985Optimized: Current vs Comp2040 Flows
900000
1100000
1300000
1500000
1700000
1900000
2100000
2300000
2500000
2700000
Oct Nov Dec Jan Feb Mar Apr May Jun Jul Aug Sep
MW
h
Current
Comp2040
Historic
SIRAS Output – Hydropower
10% Overall Decrease, Loss of $82 M/yr

SIRAS Output – Irrigation
Total Diversionsin largest district
WD01, 1979-1988
0
50
100
150
200
250
300
350
400
450
Oct
Oct
No
v
De
c
De
c
Jan
Fe
b
Fe
b
Ma
r
Ap
r
Ap
r
Ma
y
Jun
Jul
Jul
Au
g
Se
p
Se
p
TA
F
base
comp2020
WD01, 1979-1988
0
2
4
6
8
10
12
14
16
18
Oct
Oct
Oct
No
v
No
v
De
c
De
c
Jan
Jan
Fe
b
Fe
b
Ma
r
Ma
r
Ap
r
Ap
r
Ap
r
Ma
y
Ma
y
Jun
Jun
Jul
Jul
Au
g
Au
g
Se
p
Se
p
TA
F
base
comp2020
GW pumpingin largest district

SIRAS Output – Irrigation
Total Diversionsin second largestdistrict
WD02, 1979-1988
0
10
20
30
40
50
60
70
80
Oct
Oct
No
v
De
c
De
c
Jan
Fe
b
Fe
b
Ma
r
Ap
r
Ap
r
Ma
y
Jun
Jul
Jul
Au
g
Se
p
Se
p
TA
F
base
comp2020
GW pumpingin second largestdistrict
WD02, 1979-1988
0
1
2
3
4
5
6
7
Oct
Oct
Oct
No
v
No
v
De
c
De
c
Jan
Jan
Fe
b
Fe
b
Ma
r
Ma
r
Ap
r
Ap
r
Ap
r
Ma
y
Ma
y
Jun
Jun
Jul
Jul
Au
g
Au
g
Se
p
Se
p
TA
F
base
comp2020

SIRAS –Management Options
Unconstrained system (capacities only) Flood space preserved 427 rule (or others) met every year All reservoirs operated conjunctively BOR, IP, COE hydropower not
conjunctive Groundwater not used or used
selectively

Implications
Climate change will negatively impact agriculture productivity, fish flow satisfaction, and energy production
But… If the system is operated in a “more
optimal” way, the improvement over historical management far outpaces predicted climate change impacts

Implications
Why isn’t the system operated like this now? Historical precedent
Snake River managed as 2 distinct rivers Irrigators get the “first fruits” Belief that extensive groundwater pumping in the
upper river is necessary to ensure high flows (vis-à-vis gw discharge) in the lower river
However, users in the Basin may now be receptive to new ideas…

Feasibility testing of optimal rules in SnakeSim
Annual planning 52-week forecast and 4 years climate
change prediction How much water can irrigators, utilities, and
fish get in the next year to ensure a sustainable future?
Where are the tradeoffs?
SnakeOpt – Future Work


SIRAS – The Value of Optimization
What can be learned from an optimization? Can management alternatives be tested in an
optimization? Why must it be in economic terms? What
about “values”? Can an optimization model “stand alone” or
must it be used with a simulation model?

Optimizing Sleeping, Eating, Diaper changing, Marriage, and (oh, yeah) a
Dissertation, with Triplets and a Two-Year Old
Subtitle: I Sleep at Red Lights