Naseem Akhtar Gorikhan ID: 2013310009 › bitstream › 1234 › 805 › 1 › 2013310009.pdf ·...
59
i A study on Implementation of classification techniques to predict students’ results for Institutional Analysis سي المؤسيللتحلب لئج الطؤ بنتالتنبوب التصنيف ل تطبيق اسل دراسة حول موجزBy Naseem Akhtar Gorikhan ID: 2013310009 Dissertation submitted in partial fulfillment of the requirements for the degree of MSc IT Faculty of Engineering & IT Dissertation Supervisor Dr. Sherief Abdullah Jan-2016
Transcript of Naseem Akhtar Gorikhan ID: 2013310009 › bitstream › 1234 › 805 › 1 › 2013310009.pdf ·...

i
A study on Implementation of classification techniques to
predict students’ results for Institutional Analysis
موجز دراسة حول تطبيق اسلوب التصنيف للتنبؤ بنتائج الطالب للتحليل المؤسسي
By
Naseem Akhtar Gorikhan ID: 2013310009
Dissertation submitted in partial fulfillment of the requirements for
the degree of MSc IT
Faculty of Engineering & IT
Dissertation Supervisor
Dr. Sherief Abdullah
Jan-2016

ii
DISSERTATION RELEASE FORM
Student Name Naseem Akhtar Gorikhan
Student ID 2013310009
Programme IT Management
Date 10/01/2016
Title
A study on Implementation of classification techniques to predict students’
results for Institutional Analysis
I warrant that the content of this dissertation is the direct result of my own work and that any use
made in it of published or unpublished copyright material falls within the limits permitted by
international copyright conventions.
I understand that one copy of my dissertation will be deposited in the University Library for
permanent retention.
I hereby agree that the material mentioned above for which I am author and copyright holder
may be copied and distributed by The British University in Dubai for the purposes of research,
private study or education and that The British University in Dubai may recover from purchasers
the costs incurred in such copying and distribution, where appropriate.
Electronic Submission Copyright Statement
Please choose one of the following two licenses and check appropriate box.
I grant The British University in Dubai the non-exclusive right to reproduce and/or distribute
my dissertation worldwide including the users of the repository, in any format or medium, for
non-commercial, research, educational and related academic purposes only.
Public access to my dissertation in the Repository shall become effective:
Immediately 24 months after my submission
12 months after my submission 48 months after my submission
I grant The British University in Dubai the non-exclusive right to reproduce and/or distribute
my dissertation to students, faculty, staff and walk-in users of BUiD Library, in any format or
medium, for non-commercial, research, educational and related academic purposes only.
Signature

iii
Abstract
This thesis presents an implementation of classification techniques for a Vocational Institutional
analysis. The institute is known as IAT. The classification techniques used were decision tree,
knn, logistic regression, support vector and neural network and it was found that the decision tree
proved out to be accurate prediction model for institute’s analysis of students’ results. Based on
the prediction, teachers in institution worked on weak students to improve their performance.
After final exam result declaration, the results were compared with previous year results and it
was found that the classification technique helped the institution to increase the overall passing
average in computer science course. Moreover, the prediction analysis was applied for newly
enrolled students.
An educational institution must always have an estimated previous knowledge of enrolled
students to predict their performance in future academics. This assists many decision makers in
educational field to identify talented students and to focus on low achievers in order to improve
their grades. This thesis emphasizes on data mining tasks that will predict the academic
performance of students in CS (Computer Science) exam by considering their grades in math and
science from previous exam. The prediction models are developed using classification
techniques such as decision tree, knn, logistic regression, support vector and neural networks.
The outcome of these models is to predict the number of students who were likely to pass or fail.
The results were given to teachers and steps were taken to improve the academic performance of
the weak/ fail students.
After final examination, CS exam results of year 2015 were fed in the system for analysis and
then compared with the previous year results (2014). The comparative analysis of results states
that the prediction has helped the weaker students to improve their marks in CS exam which has
eventually lead to increased overall passing average of the CS course. In this thesis, the analysis
was done using classification models with and without math and science marks of previous
exam, the models are then compared to select the prediction model that produced highest
accuracy, which helped the institute to identify the students likely to fail, and work on their
academics accordingly in order to achieve better results.
Keywords: ID3 Classification, Decision Tree, K-Nearest Neighbor, students’ performance.

iv
خالصـــــــة
مهني. يعرف المعهد بأسم أي ايه تي. و يقدم هذا البحث تطبيق اساليب التصنيف للتحليل بمعهد تدريب
طريقة التصنيف التي تم استخدامها هي شجرة القرارات ، نظرية الجار االقرب، االرتداد اللوجيستي،
متجهات الدعم و الشبكة العصبية و قد تم التوصل إلى أن شجرة القرارات اثبتت دقتها كنموذج للتنبؤ بنتائج
عهد. و بناءاً على التنبؤ هذا ، بدأ االساتذة في المعهد العمل مع الطلبة من ذوي الطلبة عند تحليلها بواسطة الم
المستويات الضعيفة لتحسين أداءهم .
بعد اعالن نتائج االمتحانات النهائية ، تمت مقارنة نتائج االمتحانات مع نتائج السنة السابقة، تم التوصل الى
معدل النجاح االجمالي في مقرر علوم الكمبيوتر، باإلضافة أن اسلوب التصنيف ساعد المعهد في في ذيادة
الى ذلك تم تطبيق نظام التحليل التنبؤي للطلبة الذين تم تسجيلهم حديثاً.
المسجلين لديها للتنبؤ بمستوى على المؤسسات التعليمية أن يكون لديها و بشكل دائم معرفة سابقة بالطلالب
ادائهم االكاديمي المستقبلي. و هذا يساعد الكثيرين من صناع القرار في الحقل التعليمي في تمييز الطلبة
الموهوبين و التركيز على ذوي القدرات االقل لتحسين مستوياتهم. هذا البحث يشدد على مهام استخالص
بؤ بأداء الطلالب في امتحان علوم الكمبيوتر و ذلك من خالل اخذ البيانات و التي من خاللها يمكن التن
درجاتهم في الرياضيات و العلوم من خالل نتائجهم في االمتحانات السابقة . تم تطوير نماذج التنبؤ بإستخدام
و اسلوب التصنيف و المتمثل في شجرة القرارات، نظرية الجار االقرب، االرتداد اللوجيستي، متجهات الدعم
الشبكة العصبية. الناتج من هذه النماذج هو التنبؤ بعدد الطلالب الذين من المحتمل أن يجتازو أو يسقطو في
االمتحان.
قة( اال يجب أن تقارن بنتيجة السنوات الساب1تعليق )اس ايه

v
تم تقديم النتائج الى المدرسين و اتخذت الخطوات الالزمة نحو تحسين االداء االكاديمي للطلالب الذين يعانون
من ضعف و الذين لم يجتازو االمتحان.
للتحليل ، و من ثم 5102متحانات النهائية ، تمت تغذية النظام بنتيجة امتحان علوم الكمبيوتر للعام بعد اال
( و اوضح التحليل المقارن بأن التنبؤ ساعد الطالب االضعف 5102تمت مقارنتها مع نتائج السنة السابقة )
دة في متوسط النجاح العام في في تحسين درجاتهم في امتحان علوم الكمبيوتر و الذي بدوره أدى الى ذيا
مقرر علوم الكمبيوتر. في هذا البحث تم عمل التحليل بإستخدام نماذج التصنيف مع و دون ضم درجات
الرياضيات و العلوم لالمتحان السابق ، و من ثم تمت مقارنة النماذج إلختيار نموذج التنبؤ و الذي تمتع بالدقة
تحديد الطالب الذين قد يسقطو في االمتحان و العمل على تحسين االعلى، االمر الذي ساعد المعهد في
مستوياتهم االكاديمية وفقاً لذلك و للحصول على نتائج افضل .
ابقة. ال يمكنك ( التباس، انت ال تقوم بالمقارنة لنتائج تم التنبؤ بها و لكن لنتائج السنوات الس2تعليق )اس ايه
ج الفعلية مع التدخل، النه و ببساطة قد يكون التنبؤ خاطئاً. مقارنة التنبؤ بالنتائ

vi
Declarations
I declare that this thesis was composed by myself, that the work contained herein is
my own except where explicitly stated otherwise in the text, and that this work has
not been submitted for any other degree or professional qualification except as
specified.
(Naseem Akhtar Gorikhan)

vii
Table of Contents
1. Introduction........................................................................................................................................................ 1
1.1. Overview about Data Mining ...................................................................................................... 1
1. 2. Aims and objectives of the study .............................................................................................. 2
1.3 . Literature Review .......................................................................................................................... 3
2. Data Mining......................................................................................................................................................... 4
2.1. Overvie about Data Mining ------------------------------------------------------------------------4
2.2 Classification ..................................................................................................................................... 5
2.2.Classification techniques .............................................................................................................. 6
2.3 Software Used ................................................................................................................................. 11
2.4. Related Work ................................................................................................................................. 13
3. Dataset Collection .......................................................................................................................................... 16
3.1. Dataset Description ..................................................................................................................... 16
3.2. Preprocessing of data ................................................................................................................. 17
4. Experimental setup ....................................................................................................................................... 20
4.1. Experimental analysis and building of the prediction model ...................................... 20
4.2. Decision tree analysis ................................................................................................................. 21
4.3. Generation of decision tree in this experiment ................................................................. 26
5. Experimental analysis of Decision tree and Model Evaluation ..................................................... 31
5.1. Decision tree (constructed using students data and math/science marks) .......... 31
5.2. Decision tree constructed using students data without math/science marks ....... 34
5.3. Accuracy calculation .................................................................................................................... 35 5.4 . Evaluation of Performance metric ----------------------------------------------------------- 36
5.5. Performance metric of Decision tree built with Dataset 1 using ............................... 37
math and science marks ..................................................................................................................... 37
5.6. Performance metric of Decision tree built with Dataset 2 without math/ science marks for decision tree ...................................................................................................................... 38
5.7. Comparison of performance metric for all classification models (with math /science marks) ..................................................................................................................................... 39
5.8. Comparison of performance metric for all classification models (Without math /science marks) ..................................................................................................................................... 40
5.9 Findings ............................................................................................................................................. 41
6. Conclusion and Future work ...................................................................................................................... 43
6.1. Conclusion ....................................................................................................................................... 43
6.2. Application of the analysis results ......................................................................................... 43
6.3. Future Improvement ................................................................................................................... 47
References ................................................................................................................................................................................. 48

viii
List of Figures
Fig 1-1 CRISP DM process (Azevedo and Santos, 2008)-------------------------------------- 4
Fig 2 .1 Rapid miner stages (Jungermann, 2011)----------------------------------------------------12 Fig 4.1 A decision tree model process in rapid miner ........................................................................ 28 Fig 4.2 Preprocessed data-------------------------------------------------------------------------------29 Fig 5.1 A decision tree generated for Dataset 1 with math and science attribute .................... 31 Fig 5.2 Charts representation of distribution of science and math marks after discretizing
into various ranges ................................................................................................................................... 32 Fig 5.3 Decision tree algorithm predicting number of passes and fails in decision tree ........ 33 Fig 5.4 A decision tree generated for Dataset 2 without math and science features ............. 34

ix
List of Tables Table 3.1 Used attributes in experiment ................................................................................................... 19 Table 4.1 Roles of attributes .......................................................................................................................... 27 Table 4.2 Description of input –output ports in decision tree process ....................................... 29 Table 5.1 performance table for model with math / science features........................................... 36 Table 5.3 Classifiers accuracy table for Dataset 1 using math and science for classification
models ........................................................................................................................................................... 39 Table 5.4 Classifiers accuracy table for Dataset 2without using math and science for
classification models ................................................................................................................................ 40 Table 6.1 Institute results before and after applying data mining .................................................. 44 Table 6.2 Statistical results of previous year (2014) and current year (2015)----------------45
Table 6.3 chi square test statistics results for the course in 2014-2015 ...................................... 46

1
Chapter 1
This chapter discusses an overview and introduction to data mining in an education domain.
Moreover, it states the goals and the objectives of this dissertation along with importance of data
mining and the structure of the thesis.
1. Introduction The main purpose of this report is to evaluate various classification methods to predict the
students’ performance (failing students) in computer science course that was newly introduced in
the academies of the vocational Institute called as IAT. Each student record has a class label of
‘pass’ if the student has passed out, and ‘fail’ if the student has failed and a set of attribute values
(students’ general data, math, science marks) that lead to an outcome of ‘pass’ or ‘fail’. By
following the rules obtained from the decision tree, the class labels (pass /fail) for other student
records that have no class label can be predicted.
1.1 Overview about Data Mining
Data mining is a field of computer science that focus on the detection of patterns and hidden
knowledge discovery in enormous data and gives the information in logical form. Artificial
intelligence, machine learning statistics and databases are some of the areas applied in Data
mining (Leventhai, 2010). Data mining is extensively implemented and applied in industries
and in Educational organizations. Since the Educational world is growing more competitive,
the usage of data mining technology has befitted an integral part of Educational development.
Also, many businesses trust on the use of data mining techniques that deals with enormous data
to reveal the substantial and unknown relationships between different features of data.

2
1.2 Aims and objectives of the study
IAT (Institute of Applied Technology) a well-known vocational institute has commenced a
new CS course for higher grades and the management desires to discover and learn the
students learning patterns by data mining current institute data in order to forecast unknown
data for future performance.
The objective of this thesis is to identify the weak students by using data mining
technique known as classification in order to assist and improve performance of the low
academic achievers in computer science subject to achieve high passing average in the
newly introduced CS course.
Another objective is to apply the prediction analysis on newly enrolled students in other
courses to check the probability of students who can be successful in achieving high
marks or pass these courses that may avoid having many students drop off later in each
course.
Currently the passing average in the course is 62% and the vocational institute is looking
forward to reach overall passing score of at least 85% and above which is being tried to
achieve by implementing data mining technique.
In any educational organization, it is imperative to record the past data of students which
help the institutions to make a quick and automatic predictions of the level of students
and also to identify the drop out students who are in need of extra academic attention and
coaching from their respective teachers in any subjects (Baradwaj & Pal, 2012).
In this thesis, this problem is addressed through the application of data mining
classification procedures such as decision tree, knn, logistic regression, support vector and
neural networks. The most efficient model that is selected constitutes the highest accuracy
in predicting the students’ results (pass or fail) in CS exam.
The ability to predict students’ mark could be useful in many ways. In this study, the
prediction models are generated using students’ data along with or without considering
previous academic marks in math and science.
The results of the empirical study show that prediction results in computer science course
based on previous year math and science marks are more accurate and realistic as compared
to models based on general data of students (without considering math and science marks).
Finally, it is also observed that the students’ previous academic scores are imperative and

3
significant in predicting the future performance in CS course which means that the student
with good math and science skills are likely to pass and do well in computer science course.
The contribution of this thesis could be perceived as below:
This research is the first data mining prediction analysis using students’ data in
educational domain that was applied to improve the passing average of course.
The outcome of the analysis was based on the real data of students from the educational
institute that consisted of 127 records of students’ information of the year 2014 and 2015.
Research Questions
The primary goal of the thesis is to find answer for the following questions:
Which data attributes are significant in achieving the most significant
prediction analysis that will help to improve course passing average?
(Prediction models are built considering students’ general and academic
attributes and then compared)
Identifying the most precise and accurate classification model.
1.3 Structure of the Thesis
The structure of the thesis is as follows: Chapter 2 describes literature review on data mining
alongside classification algorithms; Chapter 3 explains different studies from authors on
related work. Chapter 4, defines the experimental analysis performed on various datasets by
making prediction models using classification algorithms on students data; and Chapter 5
illustrates, evaluation of the models, results analysis with discussions and finally Chapter 6
focus on the conclusion, the benefits after applying data mining, its limitations and potential
future work.

4
Chapter 2
This chapter discusses the use of general information about data mining, classification and
various types of classification techniques. The section also explains the related work carried
in the field of classification for prediction analysis.
2. Literature Review
2.1 Data Mining The main purpose of data mining is to determine and extract vital information from a large
bulk of data which cannot be discovered through normal methods and use this extracted
information many interesting patterns are derived for future analysis.
There are various data mining methods that used depending on the type of data. Most of the
time these approaches follow repeated implementation of certain methods such as loops to
achieve the essential results (Fayyad, Piatetsky-Shapiro & Smyth, 1996). Few methods are
discussed in this report.
One of the important standards used to describe data mining method is Cross Industry
Standards Process for data mining (CRISP) which has six stages required to perform data
mining (Leventhal, 2010).
Figure 1-1 CRISP DM process (Azevedo and Santos, 2008)

5
Figure 1.1 shows the process of Cross Industry Standard Process for Data Mining, CRISP-
DM (Azevedo and Santos, 2008)
Business understanding is used to define the data-mining objectives regarding the study of
the problem domain.
Data understanding needs data collection and to get acquainted with data itself and the
structure of data.
Data preparation comprises of all stages of preprocessing of data required for the data-mining
task from raw data. It is done in numerous phases till the data is entirely prepared for
analysis. Data preparation contains data cleaning, removing redundancy, selection of features
and records, feature reduction, etc.
Modeling uses distinctive data mining methods that are selected based on the requirements of
the analysis. It may need data preparation steps that is used to make certain that data meets
modeling specifications.
Evaluation estimates the built model to conform that the model encounters the predefined
requirements of the data-mining task.
Deployment is a repeated procedure where data mining task is functional continuously on
data set to analyze results using data mining tool.
2.2 Classification
One of the most widely used data mining technique used by researchers for data analysis is
classification which is a supervised learning approach (Romero et al., 2008). Classification
uses training record sets with labeled attributes that is used for designing data model in order
to predict unknown records (Baradwaj & Pal, 2012). Initially, a learning model is generated
using classification techniques such as Knn, Decision tree, Artificial Neural Network,
Support vector that can be used for classifying the unknown records. The model accuracy is
then verified using test data with known attributes before classifying unknown records.

6
Classification is also known as one of the predictive data mining type. It is implemented by
building a model based on the training data whose class labels are known. Classifiers use
these models to predict the class labels for the data set with unknown class labels. Data
mining is share of the knowledge discovery method. The data is handled in the following
steps:
Data Preprocessing: the preprocessing step is used to reduce data noise (such as outliers)
and data size for improved knowledge discovery results.
o Data preprocessing includes:
o Cleaning: eliminating noise and inconsistent parts;
o Integration: combining different data sources;
o Selection: selecting the relevant data from the database;
o Transformation: changing the forms of the data into the ones suitable for data mining
task by using different operations;
Mining: extorting the data rules from the data;
Evaluation: evaluating the knowledge the data carry
Presentation: presenting the mined knowledge from the data to the user by using different
representation techniques.
2.3 Classification techniques
2.3.1 Decision tree analysis
Decision trees are measured as one of the best classification technique to predict classifier
label by growing a tree based on the data collected. A decision tree comprises of nodes that
starts from a root node that does not have incoming edges, while as all other nodes have
incoming edges. A node with out going edge is known as test node, and nodes without edges
are called terminal or leaf nodes. In decision tree, each internal node separates instances
space into sub nodes as per discrete function of the input attributes values. In numeric
attributes the situation denotes a range assigned. Each leaf is allocated to one class that
represents the highest correct target value. As stated by, Breiman et al. (1984) the complexity
of tree can lead to critical result on its accuracy. Also stopping criteria used unequivocally
controls the tree complexity and the pruning method active.
7
Typically, a complexity of tree is measured by the following metrics: the total number of
leaves, total number of nodes, tree depth and number of attributes used.
In decision tree, every path from the root to one of its leaves is converted into a rule by
connecting the tests alongside the path to shape the antecedent part, and taking the leaf’s
class prediction as the class value. Here are many top-down decision trees inducers like ID3,
C4.5, CART in which C4.5 and CART consists of two conceptual stages growing and
pruning.
It is clear that Decision trees are modest methods that is used for prediction in data mining.
Trees are symbolized graphically as hierarchical structures that makes them them easy to
understand as compared to other techniques. Decision trees are self-explanatory that can hold
various data types such as nominal, numeric and also textual. A decision tree is a decision
support system that uses tree like structure to after analyzing the results. It is a classification
technique to learn a classification function, which decides the dependent variable (class)
value based given values of independent variables. In this study, the construction of tree uses
a top down analysis and merit selection criteria to choose the best splitting attribute to make
a branch. The tree includes a root node (Math attribute) and two lead classes (Pass and fail)
internal nodes (Science, cluster, Gender) after applying pruning. Each path that begins from
root and finishes at one of its leave represents a rule.
The criterion is based on gain ratio. It considers the branch size while selecting an attribute.
Entropy: is defined as a function that satisfy the following properties:
In case of pure node, measure must be 0.
When impurity is highest (i.e all classes equally likely) measure is maximal.
Data Mining A Practical Machine Learning Tools by Ian H. Witten, Eibe Frank
Decision tree has many advantages to data mining such as:
End user can understand easily
Can handle variety of data like nominal, numeric, textual.
Can process missing values
High performance with less efforts
Can be implemented on variety of platforms.
Intrinsic information of the split

8
Entropy of distribution of instances into branches.
How much information is needed to identify which branch an instance belongs to
Data Mining: A Practical Machine Learning Tools by Ian H. Witten, Eibe Frank
Gain ratio
Data Mining: A Practical Machine Learning Tools by Ian H. Witten, Eibe Frank
Gain Ratio is used to rank attributes and generate decision tree where each node has the
attribute with the highest Gain Ratio among the attributes that are not reflected in the path
from the root.
Pruning is used in tree creation because of outliers and to address over fitting. It is also used
to classify the instances that are not well defined in the subsets. In this experiment both pre
and post pruning are applied.
Pre-Pruning: is a step where branch growing stops when there is no information available.
Post-Pruning: is a step that grows a decision tree which rightly classifies all training data.
Later is can be simplified by replacing certain nodes with leafs.
2.3.2 ID3 Algorithm
ID3 by J.R. Quinlan is one of the main algorithm used for generating Decision trees which
use a top down, greedy search through several branches without any back tracking.
Information gain and Entropy is used by ID3 to construct a decision tree. The idea is to map
all instances to various categories according to the attribute values, that decides the best
classification attribute from the complete attribute set. ID3 is mainly is applied in the machine
learning and natural language processing areas.

9
The ID3 is a classification algorithm, which is, also based on Information Entropy, the
fundamental notion is that entire examples are planned to diverse groups conferring to
different values of the condition attribute set; its basic idea is to decide the best classification
attribute form condition attribute sets. The algorithm also selects the information gain as
criteria of attribute selection, in which the attribute having the highest information gain is
designated as the splitting attribute of current node. Branches are molded as per attribute
values and the above process is recursively implemented for every branch to create other
nodes and branches until all samples belong to the same group. A decision tree is represented
as a recursive structure of a leaf node that is labeled as a class value, or a test node that has
two or more outcomes, each related to a sub tree. The decision tree technique includes
building a tree to build the classification process. After a tree is built, it can be applied to
every tuple in the database that ends in classification for that tuple.
A general description of ID3 by Ian H. Witten, Eibe Frank is explained below
Function ID3
Input: Example set S Output: Decision Tree DT
If all examples in S belong to the same class c return a new leaf and label it with c
Else
Select an attribute A according to some heuristic function
Generate a new node DT with A as test
For each Value vi of A
Let Si =all examples in S with A=vi
Use ID3 to construct a decision tree DTi for example set Si
Generate an edge that connects DT and DT
Some of the problems incurred by most decision tree algorithms are while selecting splitting
attributes
When the splitting attributes are ordered
How many splits to be taken
Applying pruning to balance the tree hierarchy

10
What criteria could be used in stopping the tree
2.3.3 K Nearest Neighbors
K-NN is considered as another usual technique used for classification. The input for this
algorithm is the k closest training data set. The classification of data is based on majority
vote of its neighbors where the data is assigned to the class which is most common among its
k nearest neighbors. K-NN is considered as one of the easiest among all machine algorithms.
However, one of the drawback of K-NN is that it is sensitive to local arrangement of the data.
2.3.4 Logistic Regression
Regression is considered as a statistical analysis method that is used to predict, estimate and
recognize the relationship between different dependent and independent variables (Fayyad,
Piatetsky-Shapiro & Smyth, 1996). Complex real world problems are solved using regression
models that is in turn designed using Decision trees and Neural networks (Baradwaj & Pal,
2012).
2.3.5 Neural Networks
Neural networks were created following the cognitive processes of the brain. They are used
to forecast new observations based on the current observations. Neural network comprises of
processing elements that are interconnected known as units, neurons or nodes. The neurons
inside the network work together in parallel producing an output function. The computation
is accomplished by the collective neurons. The output function is generated by neural
network even if individual neurons malfunction in case of vigorous or fault tolerant network.
An activation number is linked with each neuron in a neural network. In addition, a given
weight is associated with every connection between the neurons in the network. These
quantities simulate their counterparts in the biological brain firing rate of a neuron, and
strength of a synapse. The activation of a neuron changes on the activation of the other
neurons and the weight of the edges that are linked to it. The neural network has the neurons
that are arranged as layers. Each investigated fact is matched with the number of layers
inside the neural network and the number of neurons inside each layer. The network is
exposed to training after the size is determined. The network then obtains a sample training
input with its connected classes.
The weights of the neural network are adjusted using an interactive process on the input to
predict the optimal future predictions. After completing the training stage, the network

11
will execute predictions on testing data. Most of the times Neural networks produce very
précised predictions. Nevertheless, one of the disadvantages of this technique is that they
represent a “black-box” method for research as it does not deliver any vision into the
underlying nature of the phenomena.
2.3.6 Support vector machines
The main purpose of Support Vector Machines was to solve the patterns in classification and
regression (Vapnik and his colleagues [8]). Support vector machines (SVMs) can be
described as connected set of supervised learning methods that are implemented for
classification and regression. A separate hyper plane is constructed by SVM by viewing input
data as sets of vectors in a one dimensional space which is used to maximize the margin
between the two data sets. Two parallel hyper planes are constructed in order to calculate the
margin, one on each side that is “pushed up against” the two data sets. The hyper plane that
has the highest distance to the neighboring data points of both classes contributes the good
separation. Since in general the larger the margin, the lower will be the generalization error of
the classifier. This type of hyper plane is identified by using a support vector and margins.
2.4 Software Used
It is equally essential to choose an appropriate data-mining tool for research and analysis of
data. The software must encompass tools for data preparation, analysis and modeling
techniques and results’ visualization methods etc. As per (Leventhal, 2010) apart from
setting a multi step environment, the tool that runs in a single process is always better.
Therefore, Rapid Miner 6.0 would be the best choice for using in data mining task in this
research. Rapid Miner studio 6.2 is a freely available tool online to record the data.
2.4.1 About Rapid Miner
It is one of the most broadly used data-mining tools currently in the field of research and in
Industry analysis. It is used for data mining and text mining prediction analysis and business
statistics. (Rapid Miner, 2010).
It is an open sources application that is applied in java programming that makes it easy to be
cross platform. It has a wonderful GUI (graphical user interface) that allows makes it easy to
observe and control and visualize work process. Another important feature is it allows
inserting breakpoints anywhere in the process that helps to significantly monitor the data

12
flow between carious operators and thus helps in validation of the results (Asilkan, Ismaili,
and Nuredini, 2011).
A rapid miner process usually consists of the following stages (Jungermann, 2011):
Figure 2 .1 Rapid miner stages (Jungermann, 2011)
1. Retrieve: In this step the data is processed and evaluated by using various operators such as
Retrieve, Read csv etc.
2. Preprocessing step involves preparing of data before generating the model, few
preprocessing techniques are discretization operator, filtering, type conversion, attribute
reduction, transformation operators.
3. Modeling stage involves creating models from prepared data. Some of the modeling
operators are classification, regression, clustering, association etc.
4. Evaluation is the stage where operators (like performance, apply) are used to apply, test and
validate the performance of the applied model data on the test data. There is a a customized
evaluation operator for every modeling technique.
Retrieve preprocess modelling evaluation

13
2.5 Related Work
This part explains the previous related work carried in the field of educational data mining
and how it differs from my thesis.
In a study conducted by (Baradwaj & Pal, 2012) decision tree classification was used to
predict performance of students in their final exam. They claim the hidden information of
educational database plays a significant role in improving the students’ performance.
As compared to this the study in this thesis is using students’ academic attributes rather than
general data to identify the low achievers.
Another work was conducted by (Surjeet Kumar and Saurab Pal) in which the authors tried
to use some hidden data from educational database and used it to improve students’
performance, by applying classification techniques like decision trees, Bayesian network etc
on educational data for predicting the students’ performance in examination. The prediction
was the identification of weak students to help them to score better marks is future exams.
The decision algorithms used were C4.5, ID3 and CART that were applied on engineering
students’ data to predict results in final exam. The decision tree forecasted the students who
were likely to pass, fail, or promoted to next year, which supported weak students to focus
more on academics to improve their performance. After result declaration the actual final
exam marks obtained by students were entered in system and analyzed for the next session.
The results were then compared and it was found that the prediction supported weak students
to improve and eventually have better results. The study was conducted by applying decision
tree algorithms (ID3, C4.5 and CART), which were related to the data sets using 10-fold
cross validation. The study revealed that C4.5 has the highest accuracy compared to other
algorithms. Hence C4.5 can learn efficient predictive models from the student data and this
can be applied on new students to identify the students with special attention needed. In
comparison the study in this thesis is implementing prediction models using all classification
techniques such as Knn, support vector, neural network, logistic regression with or without
previous year math/ science marks. Models are evaluated and compared based on the
accuracy level.

14
Another study related to students’ performance forecast was by using institutional internal
and external open data source showed some interesting predictions, which was done by
(Farhana Sarker, Thanassis Tiropanis and Hugh C Davis). The analysis in this study showed
that prediction models based on institutes internal and external data sources delivered better
results with high accuracy in the models as compared to models that were based on only
institutional internal data sources. They also claim that the external data sources turned out to
be the best predictor in students’ mark prediction, which again turned out to be beneficial for
future predictive models to support students to perform well in their academics. In this study
two types of prediction models are developed that are based a) on only institutional internal
variables and b) on using institutional internal variables and external open data sources.
Subsequently, another two predictive models were developed by adding current academic
performance on the prediction performance models in order to identify the effect of external
data source on both predictive models before and after adding current academic performance
of first semester marks. After analysis it was found that all attributes considered were
significant in prediction analysis which indicated that students’ mark prediction was highly
dependent on Student A level point while in model 2 students mark prediction highly
depended on A level mark and some on source data as well. Model 3 showed that students’
performance depended on first semester marks and then A level point and then the external
source data.
Finally, it was clear that model based on internal and external open data sources (model2)of
the institution performs better in predicting students mark compared to the model using only
institutional internal datasets (model1).
Data mining plays an important role in classifying students’ results in online educational
system that involved many tools that detected internet misuse by students such as playing
games, finding misconceptions professed by students, to identify low motivated learners, to
predict failure cases. These parameters will require educationalists to forecast unknown
issues that allows them to intercede and resolve the issues at the right time (Romero et al,
2008). (Adhatrao et al, 2013) affirms that any educational organization must possess pre
knowledge of students those who are enrolled for courses which can support them to offer
remedial coaching to weak students that can eventually help to improve their performance
sooner. Classification techniques such as ID3 and C4.5 are implemented to analyze training
data set consisting of Grade 10 and 12 board exam grades gender, entrance exam scores,
students’ first year results that was used to predict performance of newly enrolled students.
Unlike previous papers, a study conducted by Brijesh Kumar Bharwaj (April 2011) which

15
was on performance improvement of students based on classification to classify the
difference between high learners and low learners shows that students’ academic
performance does not always rely on their individual work but other external factors also
have important influence on their results. In another research by (Kalpesh Adhatrao,
September 2013) have predicted the performance of students’ under classification using
students general information such as gender, marks scored in the board exam of classes X
and XII, marks and rank in entrance exam, alongside the results in first year of the prior set
students’ by employing ID3 and C4.5 algorithms and have anticipated the general and
individual performance of recently enrolled students in future examination. Furthermore,
another research report by Megha Gupta (March 2010) shows that classification techniques
can also be applied on XML data to evaluate their benefits and problems because knowledge
coded in XML is easy-going to understand, analyze and process as it is open and extendible
and does not rely on fixed tags, new tags are created when required and in addition xml
contain meta data in the form of tags and attributes. It separates content from presentation.
A comparable study conducted by M.N. Quadri and Dr. N.V. Kalyankar have anticipated
student’s academic performance using the CGPA grade system where the training data
included gender, parental education details, financial background etc. The author has
investigated numerous attributes that helped to predict students who are at risk of failing in
exam.
How this thesis is different as compared to the above related work?
To the best of our knowledge, all findings piloted for predicting students’ performance were
achieved using decision tree or Bayesian analysis using students’ external data. Therefore,
the contributions of this thesis can be viewed as:
The attributes considered for this thesis for training data set comprises of a mix of general
students’ data alongside academic data. Another important finding of this thesis is to
identify which attributes play a significant role in analyzing and predicting the best
classification.
The research focus on implementation and evaluation of all classification techniques such
as knn, decision tree, support vector, neural network and logistic regression.
The research then compares all the prediction models in terms of accuracy to select the
best classification method that shows the highest accuracy.
The results of the experiments were verified based on the students’ data combined with
the previous academic data in math and science subjects.

16
Chapter 3
This chapter explains the dataset collection and data description used in the analysis. The
section also depicts details about the preprocessing of data before using it in the model.
3 Dataset collection
Predicting the academic performance of students is challenging and needs non-trivial
parameters to be considered in result analysis. This study is using data source from a
vocational institute that has introduced computer science (CS) course for the secondary level
and is interested in improving the overall passing average of the course by predicting the
number of weak students to provide more academic support to these students before final
examination. This study is trying to support the institute by conducting an experiment in
which two prediction models (using various classification models) are modeled. Model 1
using dataset of student details with their math and science marks in previous exam. Model 2
students’ details without considering math and science marks.
3.1 Dataset Description
This section describes the source data that was used as training and test dataset. The original
data is extracted from vocational institute for the students enrolled for the year 2013-14. The
institute’s maximum intake of students for the course is 150 per year; hence it is a small
dataset of 123 records. The original data included student details such as (id, name, age, dob,
address, gender, cluster, father_occupation, mother-occupation, father-qualification,
mother_qualification, parent_income) along with attributes such as math and science marks.
During analysis, few features were removed, as they were not found relevant in analysis,
which is explained in data preprocessing stage.

17
3.2 Preprocessing of data
The initial step was to normalize data as it was spread in multiple excel sheets which was
done by de normalizing the data where multiple records for a given attribute was put into
single record while creating a training example. For instance, students’ general data and
marks in science and math were combined were used in single data set.
3.2.1 Transforming the data
Training set consists of attributes like gender classified as: {male, female}
Parent_Income: {high, medium, low}
Classification techniques such as logistic regression, support vector and neural network
require all attributes to be transformed to numeric values, which were done by using nominal
to numeric operator in rapid miner.
3.2.3 Discretizing numeric attributes
It is a preprocessing stage where numeric attributes are converted into a nominal /categorical
one by using discretization technique. This includes splitting the range of values in a given
attribute into sub ranges called bins. In this experiment, math and science marks are
discretized by applying discretize by size operator. This operator converts the selected
numerical attributes (science and math marks) into nominal attributes by discretizing the
numerical attribute into bins of user specified size (28 was the bin size) used in decision tree
analysis.
Below are the ranges applied for math and science marks for decision tree analysis.
Range 1- [infinity – 59.50], Range 2 – [59.00- 69.00], Range 3 – [69.50- 79.50],
Range 4– [79.50- 90.50], Range 5 – [90.50- infinity]
3.2.3. Removing problematic attributes
Irrelevant attributes: The attributes like student Id, age, DOB, address were not helpful in
predicting the class hence were excluded from the training data set.
Redundant attributes: are the ones that give mostly the identical information as another
attribute were also eliminated.

18
Example: date-of-birth and age deliver the identical information as some algorithms can end
up offering these attributes too much weight while predicting the class. In Rapid miner,
select attributes operator is used to select the attributes required for analysis from the
example set.
Dividing the data file into training and test data by using validation operator. This operator
makes a cross validation to guess the statistical performance of unseen data sets and its
accuracy. It has training process (used for training model) and testing processes (where
training model is applied in the testing process). The input example set is partitioned into k
subsets and out of k subsets one subset is held for testing data set and the remaining k-1
subsets are used as training sets, the cross validation is repeated several stages depending
upon number of validations parameter.
The final dataset considered for analysis is as shown in the table 3.1 below along with
description of the dataset.
Attribute Description and possible values
Par_High_Edu Parents’ higher education
Yes /No
M_qua Mother’s qualification
UG- undergraduate
PG-post graduate
PhD
Elementary school
F_qua Father’s qualification
UG- undergraduate
PG-post graduate
PhD
Elementary school
F_occ Fathers ‘occupation
Service
Business
Retired

19
Table 3.1 Used attributes in experiment
In this analysis, rapid miner 6.0 is used as a data-mining tool for analyzing and predicting
new students’ performance in computer science exam by using students’ general data and
their scores in previous exam of math and science. Using various classification techniques
such as decision trees, KNN, logistic regression, neural networks, performs the prediction
and support vector algorithms carries the experiment. After analysis, the results of all models
are compared in terms of accuracy and class precision to identify the model that predicts the
best results towards improve of the course overall passing average in future.
NA (not applicable)
M_occ Service
Business
House wife
NA (not applicable)
P_ANN_INC Parents’ annual income
High
Medium
Low
Gender Students gender
Male/Female
Cluster Students cluster
ES/CS/AE
Math marks 90-100%, 80-90%, 70-80%, 60-70%, <60%
Science marks 90-100%, 80-90%, 70-80%, 60-70%, <60%

20
Chapter 4
Methodology
This chapter describes the detail implementation of decision tree generated using the
algorithm and gain ratio. The section also explains the comparison of the models that give
the best results in terms of accuracy, class precision, class recall in the performance
evaluation metric.
4 Experimental Setup
4.1 Experimental analysis and building of the prediction model
As per the main goal of this thesis which was to help the institution to identify and assist the
low academic achievers in CS exam in order to improve and achieve better overall passing
average in CS course. The experiment is implemented in the following stages:
1. Firstly, to identify which parameters (attributes) are significant in identifying students’
learning behavior and performance during academic career. To implement this step, two
types of trainings sets are used:
Data set 1 - math and science marks along with students’ data
Data set 2- without math and science marks (only students’ data)
2. To generate prediction models using classification techniques such as decision tree, knn,
logistic regression, neural network, support vector algorithms for both data sets on the
basis of predictive variables (classifiers).
3. To use validation and evaluate performance of the models in terms of accuracy along
with correctly and incorrectly classified results (pass/ fail).

21
4.1.1. Outcome of the model
The outcome of the predicted model is given to Institute with the number of fail students.
The teachers provide extra academic attention and support to the predicted weak students
who are expected to fail. After final examination, the actual passing average is compared
with the predicted model to cross check if the prediction analysis to answer the following
questions:
Did the prediction model really help the institute in identifying weak students?
If yes, which attributes played a significant role in accurate prediction?
How did the prediction analysis help in overall increase in the passing average of the
course?
After analysis, the report revealed that decision tree method was the most efficient prediction
model with the highest accuracy that classified correct number of pass and fail students as
compared to other models. Below is the detail analysis of the decision tree execution. Also
introduced are some basic database concepts, which are used in this report.
4.2 Decision tree analysis
A decision tree is used as a classification method for the training tuples. It is a hierarchical
tree structure, where the internal nodes represent the attributes selected at each step; the
branches are the values of the attributes; and the leaf nodes are labeled with a class label of
the tuples tested under them. The classification rules can be easily obtained by tracing the
root to-leaf paths of the decision tree.
4.2.1. Entities, Attributes and Tuples
An entity is an object that exists in the world, such as a house or a student, which contains set
of properties and attributes. A set of entities that share the same group of properties is known
as an entity set. Each unique entity in an entity set is distinguished by the unique values of the
properties. For example, a student can be separated from other students by unique values of
the set of the student’s properties, such as ID, GPAs. Each entity with its property values is
known as a tuple. In other words, a tuple is the set of property values for a specific entity.
The attributes are the properties that describe similar information shared by all entities in an
entity set. Gender, GPA, country, age is attributes. In this report we also have a classification

22
attribute to set the tuple into different classes, e.g., pass or fail. A domain is a set of all
possible values of an attribute.
The general classification algorithm of the decision tree is introduced below. The inputs
to the algorithm are as follows:
A set of tuples with their class labels. For this study, the class attribute is “cs exam” For each
tuple, the values of students who are expected to pass the exam are labeled as pass and failed
students are labeled as fail.
A list of candidate attributes that the algorithm can choose to build the internal nodes of the
decision tree are (F_occ, M_occ, par_annual_income, gender, cluster, math-mark, science-
mark). The attribute selection criteria used here is gain ratio, which is explained more in detail
in the later section.
The subsequent algorithm defines the generation of decision tree classification in a study
paper by J. R. Quinlan.
First, generate nodes that represent the entire tuple set.
If all remaining tuples belong to same class, then the node is labeled as leaf node with
this class.
If the attribute list is empty (that means no attribute could be selected in the next step),
then identify the majority class of training tuples that are represented by this node (Ex: if 20
tuples are labeled as pass in a group of 28 tuples then pass will be majority class of the
group), next label the node as leaf node with this class (pass). If no majority exists, then
either pass or fail can be chosen.
The best attribute is chosen based on the selected attribute selection method from the
remaining attributes. Label the node with selected attribute and the selected attribute is
deleted from the main attribute list.
Split the tuples (D) into groups. For each distinct domain of the selected attribute there
will be one group. In case of an empty group, a leaf node is generated for this group. Label
the node with majority class of the parent group from which the group is formed.
For non-empty groups, repeat the procedure from the first step.
The algorithm performs iterations by repeating the same steps for building the
tree and stops when the terminating conditions are met. Some of the terminating
conditions can be:
o The group for a node can have same tuples from the same class.

23
o There may be a case of empty selection group in which the node will be labeled
as a leaf node and the class will be majority class in the group of tuples.
o The group of tuples can be empty for one of the branch node in which the node
generated new is labeled as a leaf node pertaining to the majority class of the parent
tuple.
Therefore, decision tree is the simplest and fast classification technique,
generally accurate for knowledge discovery. However, one limitation is that it is
difficult to incorporate new domain values, as the tree needs to be rebuilt.
4.2.2. Attribute Selection Measures
Overview of Measures
An attribute selection measure is used to find the attribute that is the most appropriate one for
partitioning the training tuples into groups. Attribute selection measures may affect the
algorithm result during the process of tree building.
The decision tree partitions a group of training tuples into several smaller groups based on
the attribute selection measure. Preferably, each group should be pure, which means all
tuples in each group must belong to the same class. Based on this constraint, the best
attribute for splitting the group of tuples should be chosen so that groups are as pure as
possible. An attribute selection measure will rank the attributes to describe the tuples where
the attribute with the best score is chosen.
There are various different ways of selecting the attributes in decision tree such as
Information Gain: This method chooses the attribute, which reduces the information,
reflecting best purity in the partitions. This selection will yield a simple tree with least
number of tests.
Gini index: It selects the attributes for a binary split method, which divides attribute
values into 2 groups. It considers the weight of the impurity of each partition. The
attribute, which maximizes the purity, is selected as the splitting attribute and it results in
a deep tree.

24
Gain Ratio: When an attribute (such as student number) has a large number of distinct values,
the information gain will choose to select this attribute over others because it will result in a
lot of pure partitions as the information gain calculated for these attributes is close to 1 in that
indicates that these attributes will always be chosen that in turn results in very few tuples and
not useful. However, this issue can be resolved by Gain Ratio that extends the split
information that is required to describe likely information based on the number of tuples with
each value of the attributes.
4.2.3 Gain Ratio calculation
In decision tree analysis, if the criterion is based on gain ratio then it takes number and
branch size while selecting an attribute.
Choosing a good attribute
For instance, to grow a simple tree, a good attribute chooses attributes that spilt data such
that each descendant node is pure as possible i.e the distribution of examples in each node is
such that the node takes instances that belong to a single class.
Entropy: It is a measure for un orderedness and is expressed as the function that satisfy the
following properties
In case of pure code, measure should be 0.
In case of maximum impurity (i.e all classes equally likely) measure is maximal.
Data Mining: Practical Machine Learning Tools by Ian H. Witten, Eibe Frank
Intrinsic information of the split is based on the
Entropy of distribution of instances into branches.
Amount of information required to know which branch an instance belongs to
Data Mining: Practical Machine Learning Tools by Ian H. Witten, Eibe Frank
Finally, a definition of gain ratio can be expresses as

25
Data Mining: Practical Machine Learning Tools by Ian H. Witten, Eibe Frank
Here we can see the Gain ration is used in ranking attributes and generate decision trees in
which every node is the attribute with highest Gain ratio among attributes that are not
considered in the way to root node.
Pruning is used in tree creation because of outliers and to address over fitting. It is also used
to classify the instances that are not well defined in the subsets. In this experiment both pre
and post pruning are applied.
Pre-Pruning: is a phase that stops growing the tree when it finds unreliable information.
Post-Pruning is a step that grows an efficient decision tree by classifying correctly the
training data and then simplify it by replacing few nodes with leafs.
4.2.4. Gain Ratio Selection Method
In the study of Institutional Analysis, gain ratio is chosen as the attribute selection method,
because it partitions on multiple attribute values at each step, and at the same time it can
handle a large amount of distinct attribute values better than information gain based on the
reason explained above.
The information in tuple D is given as
Data Mining: Concepts and Techniques [J Hanand M Kamber. ]
Where
Pi = probability that tuple D belongs to class Ci
D = tuple group, m = number of classes D has
Di= is the subset of tuples from D that belongs to Class Ci
For careful classification, the value of InfoA(D) is required for each attribute. It is the
information necessary to classify a tuple of D based on partitioning by attribute A. A lesser
value of InfoA(D) stands for greater purity of the partitions

26
Data Mining: Concepts and Techniques [J Hanand M Kamber. ]
Where |Dj|/|D| is the weight of the jth partition and v is the number of partitions.
The information gain is the difference of Info (D) and InfoA(D)
Gain (A) = Info(D) − InfoA(D)bits
For v distinct values of attribute, A, we need to split information to denote the possible
information generated by splitting D:
Data Mining: Concepts and Techniques [J Hanand M Kamber. ]
At the end, the attribute with maximum gain ratio is selected as the splitting attribute.
Data Mining: Concepts and Techniques [J Hanand M Kamber. ]
The steps are repeated on all groups of D will all groups are completely processed.
4.3 Generation of decision tree in this experiment
A decision tree is a decision support system that generates tree like structure after analyzing
the results. It is a classification technique used to learn a classification function, which
decides the value of dependent variable (class) based on the given values of independent
variables. The construction of tree uses a top down analysis and merit choice criteria to
choose the best splitting attribute to create a branch. In training set, the tree selects math
attribute as the root node and two lead classes (pass and fail) internal nodes (math, science,
cluster, gender) after applying pruning. Each path that begins from root and finishes at one of
its leave represents a rule.
The selection criterion is based on gain ratio. It takes branch size for selecting an attribute.

27
Before running the experiments, a specific role is assigned to each attribute using rapid
miner. For instance, ‘ID’ feature is assigned a role of a unique identifier for each record. CS
exam is assigned as label role, which is the targeted feature for prediction, whereas the other
features are given regular role that has no specific function and are only used to describe the
records (RapidMiner, 2010).
The table 4.1 below indicates the assigned roles to each attribute used in the analysis.
Feature Role Data Type
ID ID Integer
CS Exam Label Binominal
Math Regular Integer
Science Regular Integer
F_qua Regular Polynomial
M_qua Regular Polynomial
F_occ Regular Polynomial
M_occ Regular Polynomial
Par_income Regular Polynomial
Gender Regular Binominal
Cluster Regular Polynomial
Table 4.1 Roles of attributes
4.3.1 Making of Decision tree in rapid miner
With reference to the explanation of typical Rapid Miner process as mentioned in section
2.4.1, the decision tree is built based on the main stages which are Retrieve, preprocessing,
modeling, and evaluation. Figure 4.1 demonstrates the applied Rapid Miner process for the
Decision tree experiment.

28
Fig 4.1 A decision tree model process in rapid miner
Data retrieval: The example set of type csv file containing all records of students is
imported by selecting the attributes, its data types and creating a class label (EXAM
CS), which is then, retrieved using the Retrieve operator.
Preprocessing: The only preprocessing step done here is the discretization of math and
science marks using Discretize by Size operator. Parameters considered are the size of bins
is assigned a value of 28, which means each bin contains 28 instances from the data set.
Sorting algorithm, the values are sorted in increasing direction. Figure 4.2 below shows the
data after preprocessing by applying discretize operator along with nominal value range
intervals of marks in math and science.

29
The data after preprocessing as shown below in fig 4.2.
Fig 4.2 Preprocessed data
Modeling: a dataset with the new attributes is fed into decision tree operator, that builds
and calculates Decision tree model. Below table 4.2 describes the input and output port for
the decision tree.
Table 4.2 Description of input –output ports in decision tree process
From
Operator
To Operator Description
Validation/
tra
Decision tree Each iteration receives data from the data set
to build the training model
Decision
tree/ mod
Mod Training model is delivered to testing set then
is applied on 10% of the iterations remaining
data.
Apply
model
Performance/
lab
Passes the data set with model predictions and
actual label values to performance operator
for evaluation
Performanc
e
Ave Shows the performance results for a single
iteration to the validation operator for
averaging other iterations and delivers to
result port.

30
Evaluation: To evaluate and find the accuracy of the model using the x validation
operator, which does a cross validation in order to evaluate the statistical performance of
unseen data sets. It is nested operator with training and test sub processes. The training is
used for a training model (decision tree) and the trained model is implemented in the
testing sub process during which performance is also checked. The testing sub process
receives testing data from the testing port.
The input example set is partitioned into k subsets and out of k subsets a single subset is
retained as the testing data set and the remaining k-1 subsets are used as training sets, the
cross validation is continued several times depending upon the number of validations
parameter. Number of validations used in this analysis is 20, which implies that the
example set is separated into 20 subsets and number of iterations will also be 20.
Sampling type used in this analysis is shuffled to build random subsets of the example
set.
Example: In first iteration a model (decision tree) will be trained on subset 2 to subset 20
during the training sub process, the trained model will be applied on sub 1 during the
testing sub process and the other iterations continues in similar way.

31
Chapter 5
Experimental Analysis
In this chapter we will perform an empirical evaluation of the application of the decision
tree classification algorithm and discuss the experimental results.
5 Experimental analysis of decision tree and Model Evaluation
5.1 Decision tree (constructed using students data and math/science marks)
Fig 5.1 A decision tree generated for Dataset 1 with math and science attribute
In the figure 5.1 decision tree operator forecasts the attribute value with the label role, in
this example the 'cs exam' attribute is predicted (pass /fail). Based on Gain ratio math
attribute is selected as the root node. Students with higher marks (range 4 and 5) are
classified as pass (all instances fall in the same group which is pass) without considering

32
their science marks. However, students with marks range 3 are classified correctly as
pass with only 3 fail.
On the other side, students with range2 (scored between 59 and 69) in math attribute are
further split into another branch that chooses science attribute as node. The algorithm
then checks if the students fall in range 4 (between 78.5 and 88. 50) in science and
classify as pass, whilst out of 6 students in the ranges 3, four students have passed while
2 are classified as fail. However, students with range 2 science marks are split based on
gender, which shows all females with range2 (62.5 and 70.5) and math range 2(59.5 and
69.5) are predicted as pass whereas male students with same range in science have one
pass out of 3.
Students’ who have performed academically low (below 62.5 in science) and (59.5 and
69.5 in math) shows all female students fail and 50% male students pass. Finally,
students who have scored less than 60% in both math and science are predicted as fail.
Fig 5.2 Charts representation of distribution of science and math marks after discretizing into various ranges
33
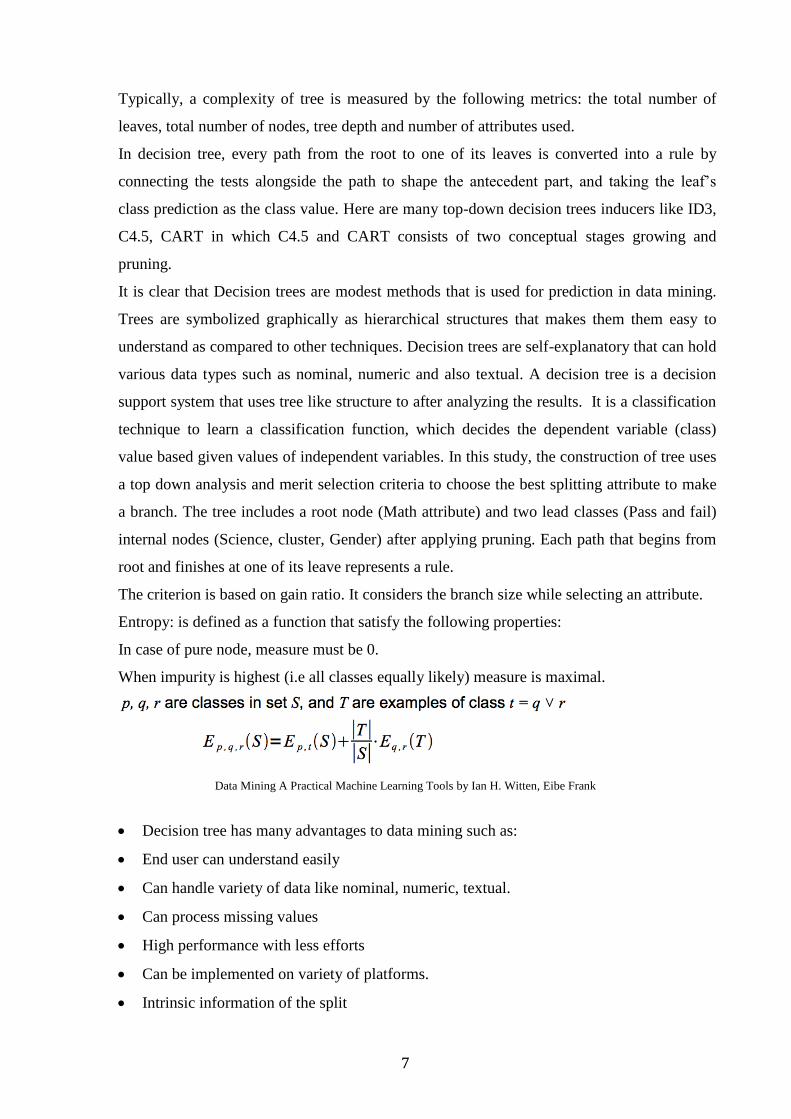
Figure 5.3 illustrates the decision tree algorithm generated predicting pass and fail
based on the math attribute that is selected as root node.
Fig 5.3 Decision tree algorithm predicting number of passes and fails in decision tree

34
5.2 Decision tree constructed using students’ data without math/science marks
Fig 5.4 A decision tree generated for Dataset 2 without math and science features
From the tree it is clear that prediction is entirely different as math and science marks are
not considered. The following observations are made from the tree: F_qua id considered
as root node which and is further split into cluster attribute in case f_qua is no. The
cluster node has 3 leaf nodes that depicts CS group all pass. In case of F-qua as PG or
UG, where the tree ends with leaf node that shows 60% pass whilst, in case f_qua is phd
then, the tree branches further based on gender that leads to leaf nodes. Finally, in case of
F-qua as elementary school, the tree is split based on cluster where AE and CS lead to
leaf nodes (which are more failures) and ES is further grown to check on M-qua which
shows that M-qual with UG are all pass and ele_school are all fail.

35
5.3 Accuracy calculation of the Decision tree model
First, the data was preprocessed, and gain ratio was used as partition method to build a
decision tree. The rules were acquired from the decision tree and used to predict data and to
get reasonable presumptions for the students’ results. The tree used 20 validations and
shuffled sampling type, to test how the patterns predict the final class results in different
situations. Accuracy is an important factor to assess the result of data mining.
Some of the terms used in accuracy calculation are as below:
True positives (tpos): the positive tuples that were labeled correctly with a positive class.
False positives (fpos): the negative tuples, which were labeled incorrectly, but are labeled
with a positive class
True negatives (tneg): the negative tuples, which were labeled correctly with a negative
class.
False negatives (fneg): the positive tuples, which were labeled incorrectly, e.g, labeled with
a negative class.
Accuracy is calculated by using the following terms: Sensitivity, also known as “true positive
rate”; Specificity, the “true negative rate” and Precision, the percentage of positive tuples
labeled correctly.
Accuracy is a function of Sensitivity and Specificity that offers more information on the
accurate prediction of data classification for unknown data classes. Accuracy is the
probability of choosing true positives and negatives from all positive and negative tuples,
or the probability of correct prediction for data.
Following is the function for Accuracy

36
The tuples that are unclassified are not used for accuracy calculation
5.4 Evaluation of Performance metric
The table 5.1 shows the performance metric of decision tree in predicting the course
results based on training set that contains students’ general data along with math and
science marks.
Accuracy table of decision tree with math/ science marks
Accuracy: 89.42% +/- 7.17% (mikro: 89.43%)
True pass True fail Class
precision
Pred. pass 77 9 89.53%
Pred. fail 4 33 89.19%
Class recall 95.06% 78.57%
Table 5.1 performance table for model with math / science features using Decision tree
In this report, the experiment is trying to determine how many students will fail in CS
exam in order to focus on these students to improve their academic performance. The
value ‘pass ‘is positive class and ‘fail’ is negative class. The data set consists of 123
records of new students, which are used by decision tree algorithm in classifying the
results by using the math and science marks of previous exam.
In the first row, in the true pass column of the confusion matrix, 77 students are classified
as positive (predicted to pass) and are true pass (actually passed). However, there are 9
students classified incorrectly, where they were actual fail but were predicted as passes
that are false negatives (FN).
In the second row, in true pas, there are 4 instances predicted as fail but are actually pass.
Secondly, 33 instances are predicted fail and are actually fail.

37
5.5 Performance metric of Decision tree built with Dataset 1 using math and science marks
As seen in the table 5.1, the model shows an accuracy of 89.42% with a margin of error
(+/- 7.17%).
In this case probability that students will be classified correctly is
(TP + TN) /(TP + FP + TN + FN) which is (33 + 77)/(77 + 9 + 4 + 33) = 89.32% and
approximately 10% were classified incorrectly.
5.5.1 Precision
The percentage of cases which rapid miner classified correctly (pass) is 89.53% and
correctly (fail) is 89.19% respectively.
5.5.2 Recall
The percentage of cases in which Rapid Miner predicted pass is (95.06%) with a margin
on 4.96%, which is acceptable. The recall measure answers the question;
"If a student is going to pass, what is the likelihood that the model will sense it?" the
answer is (95.06%).
On the other side, the percentage of cases in which Rapid Miner predicted fail is
(78.57%). Therefore, the model made incorrect prediction of (about 9 students) who
were actually fail but were predicted as pass, that accounts to 11% incorrect prediction.
In other words, there were actually 41 students out of 123 who were likely to fail the CS
course and the model predicted 33 out of 41 correctly, which helped IAT to work on
these students in improving their performance.

38
5.6 Performance metric of Decision tree built with Dataset 2 without math/ science marks for decision tree
Accuracy table of decision tree with math/ science marks
Accuracy: 65.19% +/- 13.75% (mikro: 65.04%)
True pass True fail Class
precision
Pred. pass 54 30 64.29%
Pred. fail 13 36 66.67%
Class recall 80.06% 46.43%
Table 5. 2 Performance table for model without math / science features using Decision tree
The performance metric of decision tree in the above table shows only an accuracy of
65.19% where 30 students are classified as pass that are actually fail which implies that the
model predicts approximately 35% of incorrect results when a model is generated based on
only students’ data without considering math and science marks. In addition, class precision
for true pass is 64.29% and 66.67% for true fail. Finally, it indicates that the algorithm
predicted 43 students’ results out of 123 incorrectly.
In conclusion, this analysis, assumes that math and science marks are extremely critical
attributes to predict students passing in CS exam otherwise the decision tree tracks the
father’s occupation as the root node with multi split based on cluster, parent_annual_income
which are trivial attributes to identify students’ performance in exam.
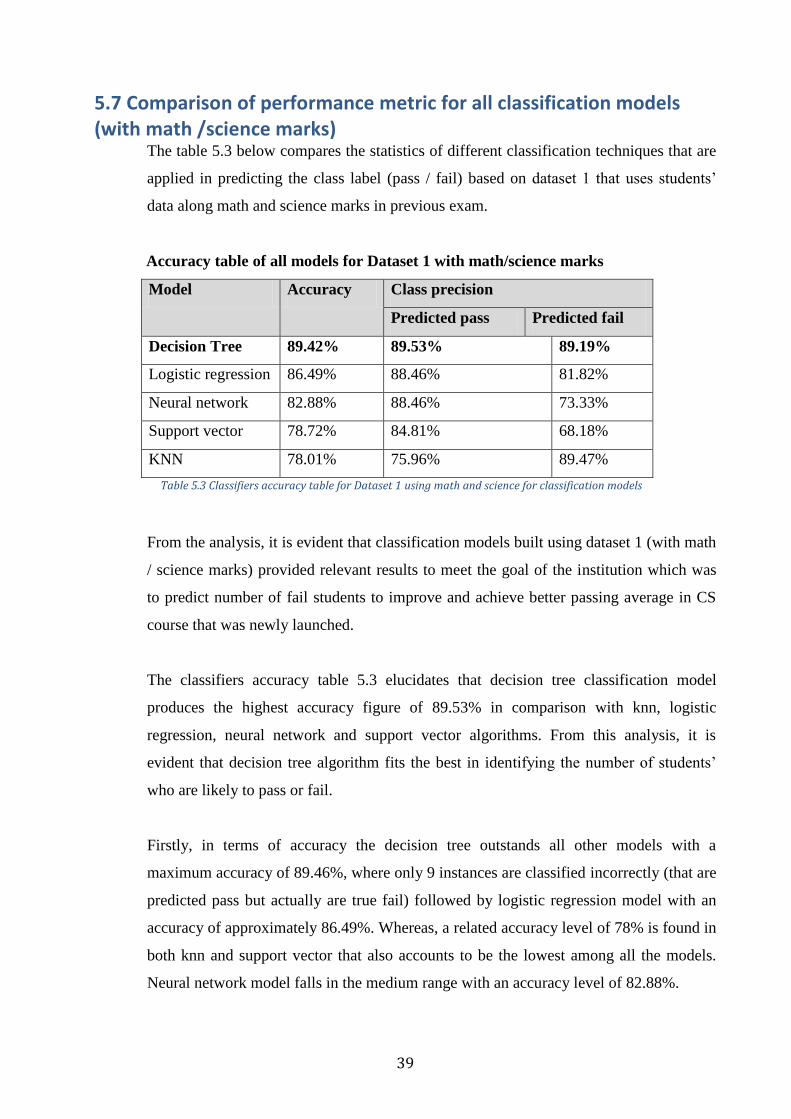
39
5.7 Comparison of performance metric for all classification models (with math /science marks)
The table 5.3 below compares the statistics of different classification techniques that are
applied in predicting the class label (pass / fail) based on dataset 1 that uses students’
data along math and science marks in previous exam.
Accuracy table of all models for Dataset 1 with math/science marks
Model Accuracy Class precision
Predicted pass Predicted fail
Decision Tree 89.42% 89.53% 89.19%
Logistic regression 86.49% 88.46% 81.82%
Neural network 82.88% 88.46% 73.33%
Support vector 78.72% 84.81% 68.18%
KNN 78.01% 75.96% 89.47%
Table 5.3 Classifiers accuracy table for Dataset 1 using math and science for classification models
From the analysis, it is evident that classification models built using dataset 1 (with math
/ science marks) provided relevant results to meet the goal of the institution which was
to predict number of fail students to improve and achieve better passing average in CS
course that was newly launched.
The classifiers accuracy table 5.3 elucidates that decision tree classification model
produces the highest accuracy figure of 89.53% in comparison with knn, logistic
regression, neural network and support vector algorithms. From this analysis, it is
evident that decision tree algorithm fits the best in identifying the number of students’
who are likely to pass or fail.
Firstly, in terms of accuracy the decision tree outstands all other models with a
maximum accuracy of 89.46%, where only 9 instances are classified incorrectly (that are
predicted pass but actually are true fail) followed by logistic regression model with an
accuracy of approximately 86.49%. Whereas, a related accuracy level of 78% is found in
both knn and support vector that also accounts to be the lowest among all the models.
Neural network model falls in the medium range with an accuracy level of 82.88%.

40
Secondly, in view of class precision, again decision tree shows the most accurate
percentage of predicted pass (89.53%) and fail (89.19%) as compared to other models
with knn listing the minimum of 78.01% and 75.96% respectively for pass and fail.
Finally, the prediction results extracted from decision tree algorithm are given to IAT to
work on the weak students before final examination in order to improve the overall
passing percentage of the CS course.
5.8 Comparison of performance metric for all classification models (Without math /science marks)
The table 5.4 below shows the statistics of different classification techniques that are
applied in predicting the class label (pass / fail) on dataset 2 based on students’ data
without considering math and science marks in previous exam.
Accuracy table of all models for Dataset 1 with math/science marks
Model Accuracy Class precision
Predicted
pass
Predicted fail
Decision Tree 65.19% 64.29% 66.67%
KNN 68.97% 66.67% 75%
Logistic
regression
67.57% 62.96% 80.00%
Neural network 59.04% 65.45% 54.41%
Support vector 67.31% 65.52% 72.22%
Table 5.4 Classifiers accuracy table for Dataset 2 without math and science for classification models
The accuracy of all models was radically low as compared to the accuracy of models
generated with academic attributes i.e science and math marks. The percentage of accuracy
in all models is between the range 59%- 69%, in which the neural network shows least
accuracy of 59%. After evaluation, it is evident that science and math marks do show
accurate prediction of exam results.

41
5.9 Findings
The objective of this study is to predict students’ results (pass/ fail) in CS exam based on
two datasets. Considering the below objectives, classifications models such as decision tree,
knn, logistic regression, neural network, support vector are modeled using both dataset1
and dataset2. The models are then compared in terms of accuracy, predicted pass and
predicted fail percentage. The training set consists of 123 student records.
1. Dataset 1 comprising of students’ information combined with their math and science
marks of previous exam. The dataset is applied in classification techniques for predicting
students’ results (pass or fail) in CS exam.
Results observed
Using Dataset 1 and table 5.3, it was found that the students’ result (pass / fail) prediction
was highly dependent on students’ previous exam marks in science and math. This means
students who score well in math and science can perform better in CS exam. However, It is
very likely that the students can fail in CS exam if they scored below 60 in both math and
science, either in math or science. Furthermore, the analysis revealed that decision tree fit
as the best classification model that predicted more accurate results as compared to other
models.
The above-derived predictions are shared with teachers and are notified to give added
coaching to students who were in the category of fail before final examination with the
hope that this prediction will benefit the institute to improve and increase the students
passing average in the new course (CS). Finally, adding science and math marks increased
the models prediction performance remarkably.

42
2. Dataset 2 comprising of only students’ information without math and science marks of
previous exam. The dataset is applied in classification techniques for predicting students’
results (pass or fail) in CS exam.
Results observed
With Dataset 2 and table 5.4, another set of classification models were built using in which
the results indicated that the accuracy of the model was between 60 – 67% where the
models could not predict the number of failures correctly as there were no relevant
attributes that could be used to generate accurate results. This means other attributes that
are students’ general information, does not support model in predicting correct classifiers.
After studying models on dataset1 and dataset2, it can be strongly agreed that students’
academic performance in CS exam mainly depends upon their previous exam scores in
science and math. These findings can be further co related with the study results supported
by (Zlatko J. Kovacic and Green, 2010), where the authors strongly suggested that the
former academic result plays a vital role in forecasting the students’ academic performance.

43
Chapter 6
This chapter briefs the conclusion of the thesis alongside its main contributions. In addition,
the answers to the research questions and the proposed future work.
6 Conclusion and Future work
6.1 Conclusion
The key goal of this thesis was to analyze data of student records and create predictions from
the data based on the classifiers generated using decision tree, knn, logistic regression,
support vector and neural network classification algorithms. Rapid miner is used to preprocess
data before building the tree. Two set of models were generated Dataset 1 considering
science and math marks and Dataset 2 without considering science and math marks.
After analysis and comparison, it is being found that the models generated using dataset
1(math and science marks) produced more accurate predictions (number of students who
passed and failed) as compared to models built using dataset 2 (without science and math
marks).
Moreover, after comparing, Decision tree analysis proved to yield highest accuracy (89%)in
predicting the correct results where only 9 instances out of 123 were predicted incorrectly (it
was predicted as pass while it was fail). It used the gain ratio attribute selection method when
building the decision tree for classification. From they’re the rules or knowledge patterns
based on the classifiers and the tree paths were generated. Finally, these rules were used to
predict the class labels for other unclassified data of 123 records.
6.2 Application of the analysis results
The experimental findings will be used for students’ result prediction for a newly introduced
course in IAT. Using the students’ records where the class label is known (pass / fail), the
decision tree will be built to predict the final class labels for another file of new student
records or same students who are registered in CS course to forecast if the students are at risk
of failing the course. The rules obtained from the different training files are dissimilar based

44
on the information hidden in the data. Also, the rules only can be applied to the data, which
have the same structure as the training data used to build the decision tree.
The predicted model results are given to vocational institute with the number of fail students.
The institute teachers provide extra academic attention and support to the students who are
likely to fail. After final examination, the actual passing average is compared with the
predicted model to cross check if the prediction analysis really helped in achieving the
institution goal.
How the vocational Institute was benefited after applying data mining
prediction?
The following research questions were answered after analysis:
1. Did the prediction model really help the institute in identifying weak students?
If yes, how did it help?
A 27% increase in the overall passing average of CS course
Results before Applying Data mining Results after applying Data mining
Year 2012 - 62 %
2013 – 61%
2014 - 62.5%
Average - 62 % passing
Year 2015-
89 % passing
Table 6.1 Institute results before and after applying data mining
The table 6.1 above indicates that the average passing of the course in the year 2012 was
62%, 61% in 2013 and 62.5% in 2014. Moreover, the course contents were the same and the
same teachers were teaching the course. Unfortunately, the results were an average of 62% for
last three years and had not shown any significant improvement in the passing average. In
addition, it was noticed that the high achievers were the once who were always passing with
better marks.
After applying data mining, the prediction of weak students in advance before the final
examination alerted the teachers to focus on these students by giving them more academic
support and extra classes that helped in increasing the passing average of the course
dramatically in the year 2015 (which was 89%) after comparing the results with the previous
year (2014) after final examination.

45
The model predictions helped in improving students’ academic performance and overall
passing average of students. In other words, 33 students were predicted fail by the model was
offered extra academic support by conducting additional classes and more practice before the
final examination. After declaration of results, it was observed that majority of the students
predicted fail had passed after the extra coaching. In addition, few students passed the final
exam with good marks in CS course. Consequently, it was verified that model prediction
helped the institute in working on the weak students and improve the average passing rate.
From previous institute knowledge, it is found that the overall passing average of the course
before applying the data mining technique was 62%. After, implementation of prediction
analysis, there was a drastic increase in the passing score from 62% to 89%, which is
undoubtedly a remarkable academic progress. The analysis also considered other factors such
as the same teacher was teaching the subject previous and current year, same standard of
exam was conducted that consists of similar pattern of questions. Therefore, it is indeed a
significant achievement that was obtained by applying data mining techniques.
6. 3 Statistical testing of the course results using chi square test
Testing statistical significance of results for previous year and current year using Chi Square
test
Year Pass Fail Total
2014 73 44 117
2015 (after data mining) 104 13 117
Table 6.2 Statistical results of previous year (2014) and current year (2015)
To examine statistically whether data mining using classification really helped in increasing
the course passing average (in other words to examine whether there is an association
between prediction analysis using data mining and the course passing average), a hypothesis
is framed.
H0: The null hypothesis is that the data mining technique will not significantly
increase the course passing score (i.e data mining prediction and results are
independent)
H1: H0 is false (α=0.05)

46
The chi-square statistic, p-value and statement of significance appear beneath the table.
Year Pass Fail Marginal Row Totals
2014 73 (88.5) [2.71] 44 (28.5) [8.43] 117
2015 (After data mining) 104 (88.5) [2.71] 13 (28.5) [8.43] 117
Marginal Column Totals
177 57 234 (Grand Total)
Table 6.3 chi square test statistics results for the course in 2014-2015
The chi-square statistic is 22.289. The p-value is .000002. This result is significant at
p < .05.
Conclusion of chi square test
We reject H0 because p value is < 0.05. We have statistically substantial evidence at
α=0.05 to show that H0 is false or that data mining prediction and course results are
dependent. (i.e. the prediction analysis are related and using data mining has shown a
significant increase in the course passing average)
2. Identification of significant attributes from knowledge data that can
generate accurate prediction results.
It was conformed that the student’s academic data plays a significant role in predicting
their future performance. In this study, it was clearly examined that the models
generated using math and science marks produced reliable predictions.
3. To estimate and reduce the numbers of drop outs in new courses.

47
The results can also be applied for other courses with a proper analysis done on past
data can help the institution to rapidly and spontaneously predict students’ level and at
the same time to recognize dropouts in the new courses.
6.4 Future Improvement
The classification algorithm (decision tree) is generating too many details, for instance it
generates unnecessary extra nodes and paths in the tree to hold some special cases that rarely
arises which, allow the tree to become more complex than required. The branches of these
special tuples do not carry much of information. Hence, as an important part of future works
the algorithm must be modified. One possible solution is the following: the program can
count the total number of tuples in each group after the selection of an attribute, and if the
number of tuples is less than a certain percentage of the total number of tuples in the data
set, then a leaf node could be generated on the majority class in the group.
Further more, the analysis is implemented for a small dataset, to get more precise results the
experiment can be repeated for large dataset to get new findings and compare to check if it
makes any difference in the prediction.

48
References
1. AI-Radaideh, Q. A., AI-Shawakfa, E.M., and AI-Najjar, M. I., “Mining Student Data
using Decision Trees”, International Arab Conference on Information Technology(
ACIT'2006), Yarmouk University, Jordan, 2006.
2. “A tutorial on support vector machines for pattern recognition,” Data Mining and
Knowledge Discovery, vol. 2, no. 2, pp. 121-167, 1998 by C. Burges.
3. Alaa el-Halees, “Mining Students Data to Analyze e-Learning Behavior: A Case Study”,
2009.
4. “An improved algorithm for Decision Tree Based SVM” Xiaodan Wang Zhaohui Shi
Chogming Wu Wei Wang, 6th
world congress on intelligent control and automation,
June 2006.
5. Azevedo, A., and Santos, M. (2008). KDD, SEMMA AND CRISP-DM: A Parallel
Overview in Ajith Abraham, ed., IADIS European Conference on Data Mining, IADIS,
pp. 182-185
6. Bhardwaj, B. K., & Pal, S. (2012). Data Mining: A prediction for performance
improvement using classification. arXiv preprint arXiv:1201.3418.
7. Baradwaj, B. K., & Pal, S. (2012). Mining educational data to analyze students'
performance. arXiv preprint arXiv:1201.3417.
8. BRIJESH KUMAR BHARWAJ, S. P. April 2011. Data Mining: A Prediction for
performance improvement using classfication. (IJCSIS) International Journal of
COmputer Science and Information Security 9
9. “Data Mining: practical machine learning tools and techniques with java
implementation” Morgan Kaufmann Publishers, San Francisco, USA, 2000.
http://www.cs.waikato.ac.nz/ml/weka/. By I.H.Witten and E.farnk.
10. DR.NEERAJ BHARGAVA, G. S., DR.RITU BHARGAVA, MANISH MATHURIA
June 2013. Decision Tree Analysis on J48 Algorithm for Data Mining International
Journal of Advanced Research and Software Engineering, 3.

49
11. Fayyad, U. M., Piatetsky-Shapiro, G., & Smyth, P. (1996, August). Knowledge
Discovery and Data Mining: Towards a Unifying Framework. In KDD (Vol. 96, pp. 82-
88).
12. Galit.et.al, “Examining online learning processes based on log files analysis: a case
study”. Research, Reflection and Innovations in Integrating ICT in Education 2007.
13. Han,J. and Kamber, M., "Data Mining: Concepts and Techniques", 2nd edition. The
Morgan Kaufmann Series in Data Management Systems, Jim Gray, Series Editor, 2006.
14. Hijazi, S. T., and Naqvi, R.S.M.M., “Factors Affecting Student’ s Performance: A Case
of Private Colleges”, Bangladesh e-Journal of Sociology, Vol. 3, No. 1, 2006.
15. http://www.simonstl.com/articles/whyxml.htm 2003.
16. http://www.softwareag.com/xml/about/xml_ben.h tm 2003.
17. http://www.ohsu.edu/library/staff/zeigenl/xml/pre sent/sld008.htm 2005.
18. Jungermann , F. (2011). Documentation of the Information Extraction Plugin for
RapidMiner [online]. [Accessed 30 March 2014]. Available at: http://www-ai.cs.uni-
dortmund.de/PublicPublicationFiles/jungermann_2011c.pdf
19. J. R. Quinlan. Induction of decision trees. Mach. Learn., 1(1):81–106, 1986.
20. KALPESH ADHATRAO, A. G., AMIRAJ DHAWAN, ROHIT JHA AND VIPUL
HONRAO September 2013. Predicting Stidents' Performance using ID3 and C4.5
Classification Algorithms. International Journal of Data Mining & Knowledge
Managemet Process (IJDKP), 3.
21. Leventhal, B. (2010). An introduction to data mining and other techniques for advanced
analytics. Journal of Direct, Data and Digital Marketing Practice, pp. 137–153
22. Ma, Y., Liu, B., Wong, C. K., Yu, P. S., & Lee, S. M. (2000, August). Targeting the right
students using data mining. In Proceedings of the sixth ACM SIGKDD international
conference on Knowledge discovery and data mining (pp. 457-464). ACM.

50
23. MEGHA GUPTA, N. A. March 2010. Clasification Techniques Analysis. National
Conference on Computationa Instrumentation CSIO 19-20.
24. Merceron, A., & Yacef, K. (2005, May). Educational Data Mining: a Case Study. In
AIED (pp. 467-474).
25. Pandey, U. K. and Pal, S., “Data Mining: A prediction of performer or underperformer
using classification”, (IJCSIT) International Journal of Computer Science and
Information
26. Technology, Vol. 2(2), 2011, 686-690, ISSN:0975-9646. [11] Pandey, U. K. and Pal, S.,
“A Data Mining View on Class Room Teaching Language”, (IJCSI) International Journal
of Computer Science Issue, Vol. 8, Issue 2, March -2011, 277-282, ISSN:1694-0814
27. RapidMiner (2010). RapidMiner 5.0 User Manual [online]. [Accessed 15 July 2013].
Available at: http://rapidminer.com/documentation/
28. “Research and Implement of Classification Algorithm on Web Text Mining” Shiqun Yin
Gang Wang Yuhui Qiu Weiqun Zhang, Faculty of Computer and Information Science
Southwest University 2007 IEEE
29. Romero, C., Ventura, S., Espejo, P. G., & Hervás, C. (2008, June). Data Mining
Algorithms to Classify Students. In EDM (pp. 8-17).
30. Romero, C., & Ventura, S. (2010). Educational data mining: a review of the state of the
art. Systems, Man, and Cybernetics, Part C: Applications and Reviews, IEEE
Transactions on, 40(6), 601-618.
31. Quinlan, J. R. "Improved Use of Continuous Attributes in C4.5." 14. Web. 11 Jan. 2013.