NASA · Two Type VI1 Aircraft Tires John A. Tanner, Sandy M. Stubbs, ... (Committee A-5 on...
82
NASA Technical Paper 1863 c. 1 Static and Yawed-Rolling Mechanical Properties .of " ~. ..Two Type VI1 Aircraft Tires . .. John A. Tanner, Sandy . - and John L. McCarty MAY 1981 NASA M. Stu&bs, https://ntrs.nasa.gov/search.jsp?R=19810015936 2018-06-03T14:27:31+00:00Z
Transcript of NASA · Two Type VI1 Aircraft Tires John A. Tanner, Sandy M. Stubbs, ... (Committee A-5 on...

NASA Technical Paper 1863 c. 1
Static and Yawed-Rolling Mechanical Properties .of
" ~.
..Two Type VI1 Aircraft Tires . ..
John A. Tanner, Sandy . - and John L. McCarty
MAY 1981
NASA
M. Stu&bs,
https://ntrs.nasa.gov/search.jsp?R=19810015936 2018-06-03T14:27:31+00:00Z
TECH LIBRARY KAFB, NM
NASA Technical Paper 1863
Static and Yawed-Rolling Mechanical Properties of Two Type VI1 Aircraft Tires
John A. Tanner, Sandy M. Stubbs, and John L. McCarty La lzgley Resea rcb Cerlter Hamptorl, Virginia
National Aeronautics and Space Administration
Scientific and Technical Information Branch
1981
00677b3

CONTENTS
INTRODUCTION . . . . . . . . . . . . . . . . . . . . . . . . . . . . . . . . 1
APPARATUS AND TEST PROCEDURE . . . . . . . . . . . . . . . . . . . . . . . . 1 Static Vertical-Loading Tests . . . . . . . . . . . . . . . . . . . . . . 2 Static. Cmbined Vertical- and Lateral-Loading Tests . . . . . . . . . . . 2 Yawed-Rolling Vertical-Loading Tests . . . . . . . . . . . . . . . . . . . 3
RESULTS AND DISCUSSION . . . . . . . . . . . . . . . . . . . . . . . . . . 4 Static Vertical Loading . . . . . . . . . . . . . . . . . . . . . . . . . 4 Footprint Geometric Properties . . . . . . . . . . . . . . . . . . . . . . Vertical Load-Deflection Relationships . . . . . . . . . . . . . . . . . 6
Static. Combined Vertical and Lateral Loading . . . . . . . . . . . . . 8 Lateral Load-Deflection Relationships . . . . . . . . . . . . . . . . . 9 Static Relaxation Length . . . . . . . . . . . . . . . . . . . . . . . . 11
Yawed Rolling Under Vertical Loading . . . . . . . . . . . . . . . . . . . . . Yawed-Rolling Relaxation Length . . . . . . . . . . . . . . . . . . . . 1 2 Steady-State Characteristics . . . . . . . . . . . . . . . . . . . . . . . .
CONCLUDING REMARKS . . . . . . . . . . . . . . . . . . . . . . . . . . . . . 1 4
APPENDIX . GLOSSARY OF mRM!3 AND SYMBOLS . . . . . . . . . . . . . . . . . . 1 6 Forces and Mment in Footprint Plane . . . . . . . . . . . . . . . . . . . 1 6
Forces and Mment in Wheel Plane . . . . . . . . . . . . . . . . . . . . . 1 9 Miscellaneous Terms . . . . . . . . . . . . . . . . . . . . . . . . . . . 20
Forces and Moment in Vertical Plane Perpendicular to Wheel Plane . . . . . 1 7
Symbols . . . . . . . . . . . . . . . . . . . . . . . . . . . . . . . . . 22
REFERENCES . . . . . . . . . . . . . . . . . . . . . . . . . . . . . . . . . 25
TABLES . . . . . . . . . . . . . . . . . . . . . . . . . . . . . . . . . . . 26
FIGURES . . . . . . . . . . . . . . . . . . . . . . . . . . . . . . . . . . 30
iii

INTRODUCTION
Designers of t i r e s and landing-gear systems mus t have knowledge of t i r e mechanical properties i n order t o solve problems associated w i t h a i r c ra f t take- off, landing, and taxi operations. For example, t i r e mechanical s t i f fness prop- er t ies are fundamental t o computation of landing-gear shimmy characterist ics and to design of antiskid braking systems. Among the publications which deal w i t h the many mechanical properties of the pneumatic aircraft t ire, references 1 and 2 are noteworthy. Reference 1 collected and summarized the knowledge of t i r e mechanical properties as it existed i n 1950; and reference 2, relying on experimental and theoretical studies conducted prior to 1958, established empir- ical expressions to describe most t i r e mechanical properties. Reference 2 is generally recognized as the basis of current knowledge of t i r e mechanical prop- e r t ies ; however, it is l imited to s ta t ic and low-speed conditions.
During the past 20 years, many new a i r c ra f t t i r e s have been introduced into the world's f l ee t of commercial and mil i tary a i rcraf t , and there have been a number of isolated t ire studies. These studies, however, have been limited i n scope. The University of Michigan, for example, has centered i ts research of t i r e mechanical properties primarily around the development and use of scale model t i res to predict ful l -scale t i re behavior (refs. 3 , 4 , and 5 ) . Refer- ences 6 and 7 are typical of NASA studies to obtain steady-state yawed-rolling data on new t i r e concepts, and references 8 and 9 present results from studies limited to braked-rolling and s t a t i c fore-and-aft t ire properties.
I n view of the concern that new t i r e s may not exhibit characteristics or trends observed for earlier designs, the Society of Automotive Engineers, Inc. (Committee A-5 on Aerospace Landing Gear Systems) requested NASA to par t ic ipate i n a joint experimental program w i t h the U.S. Air Force and the University of Michigan to evaluate mechanical properties of two sizes of a i r c ra f t t i r e s cur- rently i n wide use. The purpose of t h i s paper is to contribute to that request and present i n detai l resul ts from the tes t program a t NASA to measure s t a t i c and dynamic mechanical properties of 1 8 x 5.5 and 49 x 1 7 type V I 1 a i rc raf t t i r e s . During t h i s program, t i r e s were subjected t o pure vertical load and t o combined vertical and lateral loads under both s t a t i c and dynamic (roll ing) con- ditions. Test parameters for the static tests consisted of t i r e load i n the vertical and la teral d i rect ions, and t e s t parameters for the dynamic tes t s included t ire vertical load, yaw angle, and ground speed. Effects of each of these parameters on the measured t ire characterist ics are discussed; and, where possible, comparisons are made w i t h previous work. An appendix is included which defines terms and expressions used i n studying these tire characteristics and symbols used i n presenting results of the s t u d y .
APPARATUS AND TEST PROCEDURE
S ta t ic t es t s and yawed rol l ing tes ts were conducted on two sizes of high- pressure, high-speed, bias-ply a i r c ra f t t i r e s i n t h i s experimental investiga-
L-141 25

t i o n : s i z e 1 8 x 5.5 w i t h a 1 4 - p l y r a t i n g a n d s i z e 49 x 1 7 w i t h a 26-p ly ra t ing . C h a r a c t e r i s t i c s of t h e two t i r e des igns are p r e s e n t e d i n t a b l e I. S e v e r a l tires of e a c h s i z e were f u r n i s h e d by t h e U.S. A i r F o r c e , a n d e a c h s i z e was pro- c u r e d f r a n t h e same m a n u f a c t u r e r w i t h c l o s e l y s p a c e d ser ia l numbers and dates of manufac ture . Pr ior to tes t ing , a l l t ires were broken i n a t r a t e d p r e s s u r e and load for t h r e e t a x i r u n s of 3.2 km (2 miles) each on a road wheel (drum) dynamometer) a t the Landing Gear Development F a c i l i t y , W r i g h t - P a t t e r s o n Air Force Base.
T i r e v e r t i c a l l o a d c o n s i s t e d of 50, 75, 100, and 125 pe rcen t of t h e r a t e d l o a d , a n d f o r t h e s ta t ic tests, t h e s e l o a d s were each applied a t f o u r e q u a l l y spaced pe r iphe ra l pos i t i ons a round t he t i re . For a l l tests, t h e i n f l a t i o n pres- sure was limited t o t h e r a t e d p r e s s u r e , w h i c h was set pr ior to load ing .
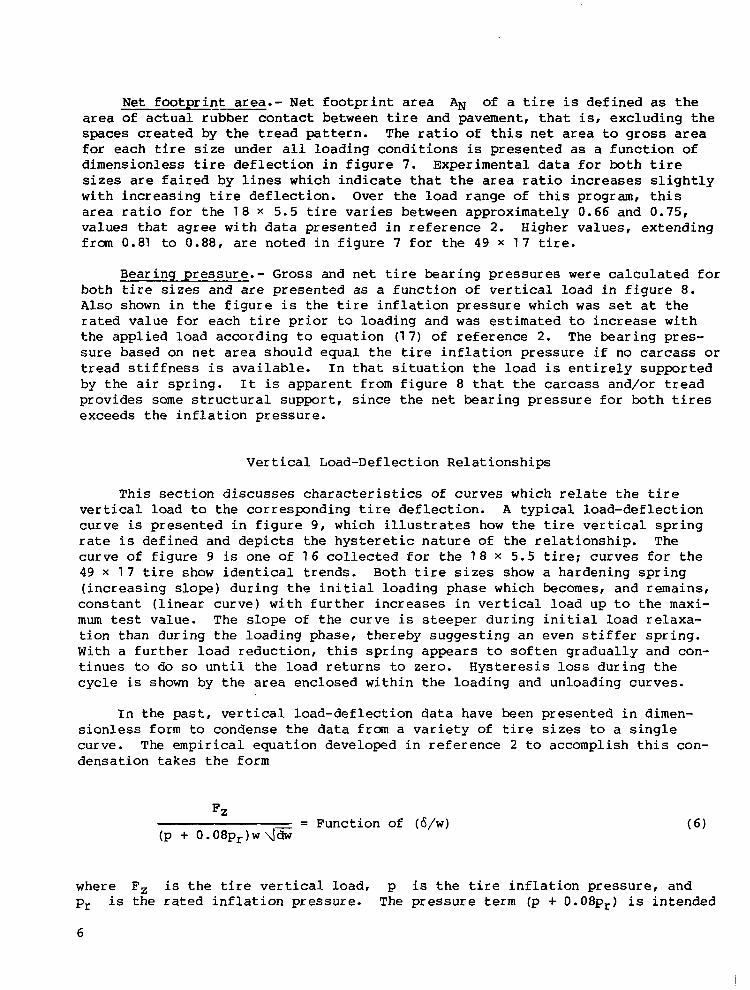
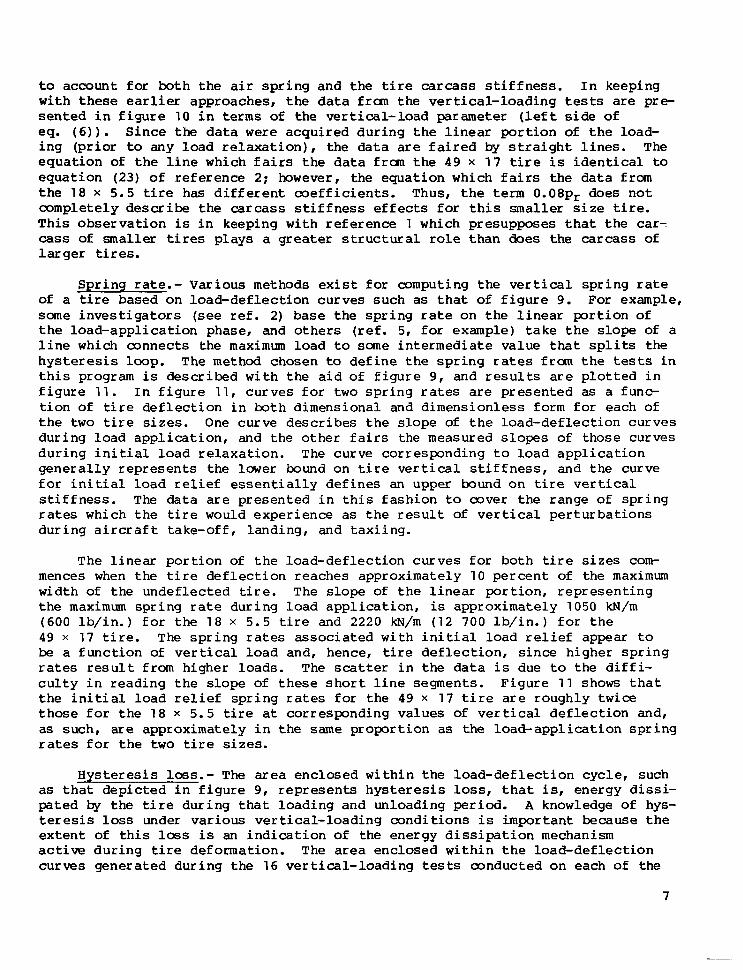
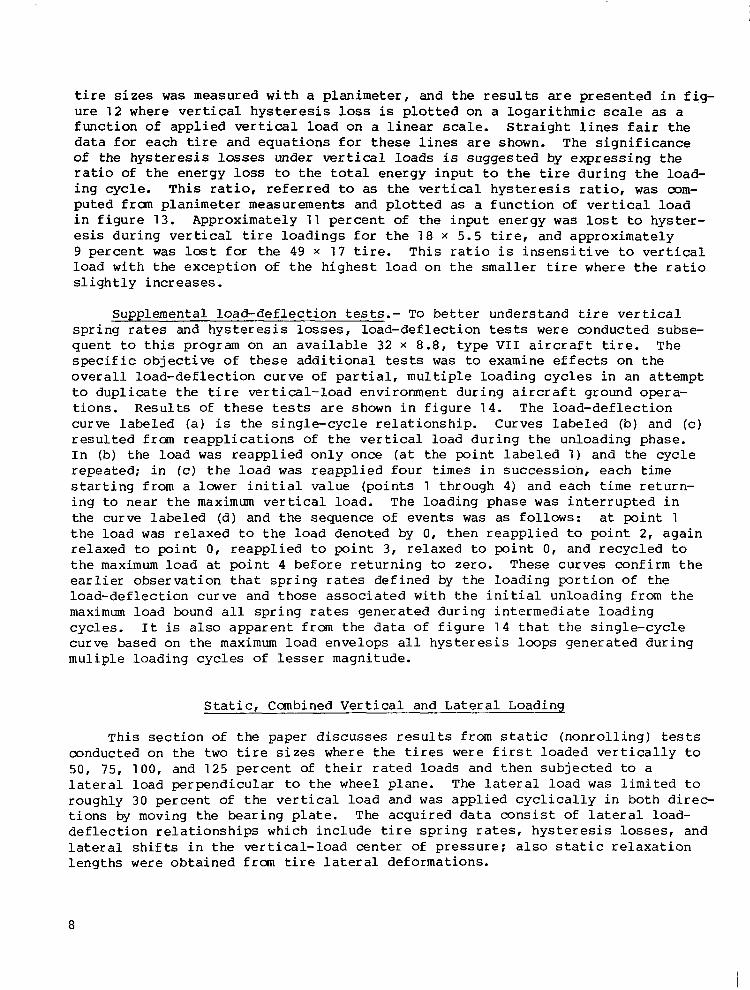
Both the s ta t ic a n d t h e r o l l i n g tests were conduc ted w i th t he t i r e s i n s t a l l e d o n test c a r r i a g e s a t the Langley Landing Loads Track. The 48 000-kg (106 000-lb) tes t c a r r i a g e shown i n f i g u r e 1 a n d d e s c r i b e d i n r e f e r e n c e 9 was employed i n tests of t h e 49 x 1 7 t i r e , and the 29 500-kg (65 000-lb) carriage shown i n f i g u r e 2 a n d d e s c r i b e d i n r e f e r e n c e 1 0 was u s e d i n tests of t h e 1 8 x 5.5 t i r e . On b o t h c a r r i a g e s , t h e test t i r e was mounted within an instru- mented dynamometer (described i n t h e a p p e n d i x ) t o measu re d rag , ve r t i ca l , and l a t e ra l t i r e forces. The dynamometer used t o s u p p o r t t h e 49 x 1 7 t i r e o n t h e l a r g e c a r r i a g e i s shown i n f i g u r e 3 .
S t a t i c V e r t i c a l - L o a d i n g T e s t s
S t a t i c v e r t i c a l - l o a d i n g tests were performed t o measu re t he geomet r i c prop- e r t i e s o f t h e t i r e f o o t p r i n t a n d to d e t e r m i n e v e r t i c a l l o a d - d e f l e c t i o n r e l a t i o n - s h i p s f o r t h e t i r e s over the range of t e s t v e r t i c a l load. F o o t p r i n t d a t a were ob ta ined by c o a t i n g t h e t i r e t r e a d w i t h c h a l k , a p p l y i n g t h e d e s i r e d v e r t i c a l l oad t o t h e t i r e on a s h e e t of paper cove r ing a f l a t s u r f a c e , a n d m e a s u r i n g t h e g e o m e t r i c c h a r a c t e r i s t i c s o f t h e r e s u l t i n g " c h a l k e d " f o o t p r i n t w i t h a scale and a p l an ime te r . Vertical l o a d - d e f l e c t i o n c u r v e s were e s t a b l i s h e d a c c o r d i n g t o t h e procedure recommended i n r e f e r e n c e 11 by c o n t i n u o u s l y m o n i t o r i n g t h e v e r t i c a l l o a d on t h e t i r e , which was h y d r a u l i c a l l y a p p l i e d , a n d t h e c o r r e s p o n d i n g d e f l e c - t i on be tween t he whee l f l ange and t he f l a t bea r ing su r f ace . The v e r t i c a l l o a d was measured with s t ra in-gage beams i n t h e dynamometer, and t h e t i r e d e f l e c t i o n was o b t a i n e d frcm a l i n e a r m o t i o n t r a n s d u c e r . The l o a d was increased beginning when t h e t i r e came i n c o n t a c t w i t h t h e f l a t b e a r i n g s u r f a c e u n t i l t h e d e s i r e d load (50, 75, 100, and 125 percent of the ra ted load) was reached. The load was then reduced t o zero. The r e s u l t i n g l o a d - d e f l e c t i o n c u r v e , or loop, is ind ica - t i v e of t h e t i r e ver t ica l - loading behavior and provides in format ion which d e f i n e s t h e t i r e v e r t i c a l s p r i n g r a t e a n d h y s t e r e s i s loss. B o t h t h e f o o t p r i n t a n d t h e l o a d - d e f l e c t i o n tests were conducted a t f o u r p e r i p h e r a l p o s i t i o n s a r o u n d t h e t i r e .
S t a t i c , Combined Ver t ica l - and La tera l -Loading Tes ts
S t a t i c tests with combined ver t ical and l a t e r a l l o a d i n g s were performed t o de termine t i r e l a t e r a l l o a d - d e f l e c t i o n r e l a t i o n s h i p s w h i c h i n c l u d e l a t e r a l
2

spring rate and hysteresis loss, l a t e ra l center-of-pressure sh i f t , and s t a t i c relaxation l eng th . The spring rate and hysteresis loss were determined from lateral load-deflection curves which were obtained by again following the pro- cedures recommended i n reference 1 1 . The process involved applying the desired vertical load to t h e t i r e followed by displacing the frictionless bearing plate, against which t h e t i re rested, i n a direction perpendicular to the wheel plane. The l a t e ra l displacement, imposed i n the presence of the vertical load, was increased u n t i l the lateral load was approximately 30 percent of the vertical load as recommended i n reference 1 1 . The l a t e ra l load was then reduced t o zero, increased i n the opposite direction to 30 percent of the vertical load, and f ina l ly reduced t o zero again. One such hysteresis loop was generated for each load and a t each peripheral position for the 49 x 1 7 t i r e , two s u c h loops were generated for the 1 8 x 5.5 t i r e . During the loading cycles, both the lateral load and the la teral displacement of the bearing plate were continuously moni- tored. The l a t e ra l load was measured by a load cell located between a hydraulic piston and a backstop, and l a t e ra l displacements of the bearing plate were mea- sured by a linear motion transducer. The vertical load, hydraulically applied to the t i re , was measured by load cells under the bearing plate.
The l a t e ra l s h i f t i n the center of pressure (centroid of vertical forces i n the t ire footprint) was obtained during the lateral-loading tests from data pro- vided by multiple load cells which supported the bearing plate and from l a t e ra l displacement measurements of the plate. Static relaxation lengths were computed from measurements of the deformation i n the tire free-tread periphery due to the combined vertical and lateral loads. These deformation measurements were taken from linear motion transducers and d i a l displacement gages located along the t i re center l ine a t known peripheral positions.
Yawed-Rolling Vertical-Loading Tests
Yawed-rolling t e s t s were performed t o measure the rolling relaxation length of the t i r e s and to es tabl ish t i re s teady-state character is t ics over a range of ground speed. The relaxation lengths for several yaw angles at each vertical load were determined from a procedure which involved f i r s t yawing the wheel assembly, then lowering the t i r e onto the pavement and applying the desired ver- t ical load, and subsequently rolling the tire straight ahead a t the constant yaw angle while monitoring the distance traveled and the buildup of lateral force. Steady-state yawed data were obtained by either propelling or towing the car- riage over a dry concrete runway a t a preselected ground speed, releasing the f ixture which supported the wheel assembly t o apply the desired vertical load to the t i re , and monitoring the output f r m the instrumented dynamometer. The dynamometer and its output are described i n the appendix. The yaw angle of the wheel assembly was held constant for each t e s t run and consisted of lo, 3O, 6O, and go for each vertical load and ground speed. Nominal ground speeds for these t e s t s were 5, 50, 75, and 1 0 0 knots. For a speed of 5 knots, t h e tes t carr iage was towed by a ground vehicle; for higher speeds, the carriage was propelled by the hydraulic water je t catapul t . During each t e s t on the 49 x 1 7 t i r e , a discrete vertical load was applied to the t ire to yield steady-state data; on the 1 8 x 5 . 5 t ire, the vertical load was gradually increased t o approximately 1 2 5 percent of the t i re ra ted load, and the quasi-steady-state characteristics were measured as the load reached selected values. Early tests performed dur-
3

i n g t h i s p r o g r a m h a d c o n f i r m e d t h a t c h a r a c t e r i s t i c s m e a s u r e d a t a p a r t i c u l a r v e r t i c a l load d u r i n g t h e c o u r s e of a v a r i a b l e l o a d i n g ( q u a s i - s t e a d y - s t a t e con- d i t i o n ) a g r e e d w i t h t h o s e m e a s u r e d d u r i n g tests c o n d u c t e d w i t h t h a t l o a d h e l d c o n s t a n t .
RESULTS AND DISCUSSION
S t a t i c Vertical Loading
T h i s s e c t i o n o f t h e p a p e r d i s c u s s e s t h e r e s u l t s f r o m s t a t i c ( n o n r o t a t i n g ) v e r t i c a l - l o a d i n g tests conduc ted on t he t w o t i r e s i z e s . F o r a l l tests t h e t i r e s , i n f l a t e d t o t h e i r r a t e d pressure, were loaded t o 50, 75, 100, and 1 2 5 p e r c e n t o f t h e i r r a t e d l o a d (see t a b l e I ) . The resul ts inc lude geometr ic p r o p e r t i e s o f t h e t i r e f o o t p r i n t a n d r e l a t i o n s h i p s b e t w e e n t h e v e r t i c a l l o a d and the co r re spond ing t i r e v e r t i c a l d e f l e c t i o n .
F o o t p r i n t Geometric Properties
Foo tp r in t l eng th . - The l eng th of t h e f o o t p r i n t area Lf is p resen ted as a f u n c t i o n of t i r e v e r t i c a l d e f l e c t i o n 6 i n f i g u r e 4 where both parameters have been nondimensionalized by the t i r e o u t s i d e d i a m e t e r d . The da ta f rom the two t i r e sizes can be f a i r e d i n a l e a s t s q u a r e s manner by a s ingle-va lued , nonl inear cu rve desc r ibed by t h e e x p r e s s i o n ,
The n u m e r i c a l c o n s t a n t i n t h i s e x p r e s s i o n is s l i g h t l y lower t h a n t h e va lue (1 .70 ) p re sen ted i n r e f e rence 2 f o r o t h e r t y p e VI1 t i r e s . A l s o i n c l u d e d i n f i g - ure 4 is t h e c u r v e f o r t h e e x p r e s s i o n t h a t d e f i n e s t h e r e l a t i o n s h i p b e t w e e n f o o t p r i n t l e n g t h a n d v e r t i c a l d e f l e c t i o n i f t h e t i r e were n o t d i s t o r t e d by t h e v e r t i c a l l o a d . W i t h o u t d i s t o r t i o n , t h e l e n g t h o f t h e f o o t p r i n t equals t h e length o f the geometr ic chord formed by t h e i n t e r s e c t i o n w i t h t h e g r o u n d p l a n e o f a ci rc le having a d iameter equal t o t h a t o f t h e t i r e , and t he numer i ca l con- s t a n t is 2.0. Thus, f o r b o t h t i r e s i z e s t h e e x p e r i m e n t a l f o o t p r i n t l e n g t h i s approximately 83 percent of the geometr ic-chord length.
Footpr in t wid th . - The v a r i a t i o n o f f o o t p r i n t w i d t h Wf w i th t i r e v e r t i c a l d e f l e c t i o n is p r e s e n t e d i n f i g u r e 5 where both parameters have been made dimen- s i o n l e s s by w, t h e maximum wid th o f t he unde f l ec t ed t i r e . The d a t a are f a i r e d by two s ing le -va lued , non l inea r cu rves , one fo r each t i r e s i z e , t h a t d i f f e r o n l y by a m u l t i p l i c a t i o n f a c t o r . The wid th o f t h e f o o t p r i n t for t h e 1 8 X 5 . 5 t i r e is c lose ly approximated by the express ion ,
w h i c h d e f i n e s t h e l e n g t h o f t h e g e o m e t r i c c h o r d g e n e r a t e d a t the g round p lane by an undeformed c i rc le of d iameter w. I t is similar t o t h e e x p r e s s i o n i n
4
reference 2 for other larger type V I 1 t i res . For the 49 x 1 7 t i r e of t h i s pro- gram, the measured widths are roughly 86 percent of the l e n g t h of s u c h a chord and hence are somewhat lower than those presented i n reference 2.
Gross footprint area.- Gross footprint area AG is defined as the overall area of contact between the t i r e and the pavement including spaces created by t h e tread pattern. If t h e footprint is assumed t o be e l l i p t i ca l , then
IT
4 % = - LfWf
Substituting the expressions which fa i r the experimental data for Lf and Wf i n figures 4 and 5, respectively, results i n the following area equation i n terms of t ire deflection and geometry:
where kL is the constant associated w i t h the footprint length and determined experimentally to equal 0.83 for both t i re s izes , and kW is the constant for footprint wid th found t o equal 1 . 0 for the 1 8 x 5.5 t i r e and 0.86 for the 49 x 1 7 t i re .
I n equation (3b), the area can be nondimensionalized and expressed i n terms of dimensionless tire deflection to obtain the gross-footprint-area parameter:
AG/W 6 = kLkwl'i (6 /w) \I 1 - (6/d) - ( 6 / w ) + ( 62/dw)
If the fractions under the radical are neglected, equation ( 4 ) simplifies to a linear equation:
Measured gross footprint areas from the 1 6 tests conducted on each t i r e size ( 4 loadings a t 4 peripheral tire positions) were nondimensionalized as i n equation (5) and plotted as a function of dimensionless t i re def lect ion i n f ig- ure 6. The data are faired by expressions which take the form of equation (5) where the product of kLkwlT is 2.5 for the 1 8 x 5.5 t i r e and 2.1 for the 49 x 1 7 t i re . These values are s l i g h t l y lower than the values of 2.61 and 2.24 computed from constants kL and kW based on footprint length and w i d t h mea- surements (see discussion of eq. (3b) ) . These differences can be attr ibuted perhaps to the footprint not being t ru ly e l l ip t ica l . The curves which describe the data for the two t i re s izes of t h i s t e s t program encompass the data of reference 2 for other type V I 1 a i rc raf t t i res .
5
Net footprint area.- Net footprint area AN of a t i r e is defined as t h e area of actual rubber contact between t i re and pavement, tha t is, excluding the spaces created by the tread pattern. The r a t i o of t h i s net area to gross area for each t i r e s i ze under a l l loading conditions is presented as a function of dimensionless t i re deflection i n figure 7. Experimental data for b o t h t i r e sizes are faired by l ines which indicate that t h e area ratio increases sl ightly wi th increasing t i re def lect ion. Over the load range of t h i s program, t h i s area ratio for the 1 8 x 5.5 t i re var ies between approximately 0.66 and 0.75 , values that agree w i t h data presented i n reference 2. Higher values, extending from 0.81 to 0 .88 , are noted i n figure 7 for t h e 49 x 1 7 t i r e .
Bearing pressure.- Gross and ne t t i r e bearing pressures were calculated for both t i re s izes and are presented as a function of vertical load i n figure 8. Also shown i n the figure is the t ire inflation pressure which was s e t a t t h e rated value for each t ire prior to loading and was estimated to increase w i t h the applied load according t o equation (17 ) of reference 2. The bearing pres- sure based on net area should equal the t ire inflation pressure if no carcass or tread stiffness is available. I n that situation the load is ent i re ly supported by the air spring. I t is apparent from figure 8 that the carcass and/or tread provides some structural support, since the net bearing pressure for both tires exceeds the inflation pressure.
Vertical Load-Deflection Relationships
T h i s section discusses characteristics of curves which r e l a t e t he t i r e vertical load to the corresponding tire deflection. A typical load-deflection curve is presented i n figure 9, which i l lus t ra tes how the t ire vertical spring rate is defined and depicts the hysteretic nature of the relationship. The curve of figure 9 is one of 1 6 collected for the 1 8 x 5.5 t i r e ; curves for the 49 x 1 7 t i r e show identical trends. Both t i r e s i z e s show a hardening spring (increasing slope) during the initial loading phase which becomes, and remains, constant (linear curve) w i t h further increases i n vertical load up to the maxi- mum t e s t value. The slope of the curve is steeper during initial load relaxa- tion than during the loading phase, thereby suggesting an even s t i f fer spr ing. With a further load reduction, t h i s spring appears to soften gradually and con- tinues to do so u n t i l the load returns to zero. Hysteresis loss during the cycle is shown by the area enclosed w i t h i n the loading and unloading curves.
I n the past, vertical load-deflection data have been presented i n dimen- sionless form to condense the data f r m a variety of t i r e s i ze s t o a single curve. The empirical equation developed i n reference 2 t o accomplish t h i s con- densation takes the form
where Fz is the t i re ver t ical load, p is the tire inflation pressure, and pr is the rated inflation pressure. The pressure term (p + 0 . 0 8 ~ ~ ) is intended
6
to account for b o t h t h e air s p r i n g a n d t h e t i r e carcass s t i f f n e s s . I n k e e p i n g w i t h t h e s e earlier a p p r o a c h e s , t h e d a t a f r a n t h e v e r t i c a l - l o a d i n g tests are pre- sented i n f i g u r e 10 i n terms of t h e v e r t i c a l - l o a d parameter ( l e f t side of eq. ( 6 ) ) . S i n c e t h e data were acqu i red du r ing t he l i nea r po r t ion o f t he l oad - i n g ( p r i o r to a n y l o a d r e l a x a t i o n ) , t h e d a t a are f a i r e d by s t r a i g h t l i n e s . The e q u a t i o n of t h e l i n e w h i c h f a i r s t h e d a t a f r a n t h e 4 9 x 1 7 t i r e is i d e n t i c a l to e q u a t i o n (23) o f r e f e r e n c e 2; however , the equat ion which fa i r s the da ta f rom t h e 1 8 x 5.5 t ire h a s d i f f e r e n t c o e f f i c i e n t s . T h u s , t h e term 0 . 0 8 ~ ~ does no t comple t e ly desc r ibe t he carcass s t i f f n e s s e f f e c t s f o r t h i s smaller s i z e t ire. T h i s o b s e r v a t i o n is in keep ing w i th r e f e rence 1 wh ich p re supposes t ha t t he car- cass of smaller t ires p l a y s a g r e a t e r s t r u c t u r a l role than does the carcass of l a r g e r tires.
S p r i n g rate.- V a r i o u s me thods ex i s t fo r oomput ing t he ve r t i ca l sp r ing ra te of a t ire based on load-def lec t ion curves such as t h a t o f f i g u r e 9. For example, some i n v e s t i g a t o r s (see r e f . 2) b a s e t h e s p r i n g rate o n t h e l i n e a r p o r t i o n o f t h e l o a d - a p p l i c a t i o n p h a s e , a n d o t h e r s ( r e f . 5, for example) take t h e slope of a l i n e which connects the maximum l o a d to sane i n t e r m e d i a t e v a l u e t h a t s p l i t s t h e hysteresis loop. The method chosen to d e f i n e t h e s p r i n g r a t e s f r a n t h e tests i n t h i s program is d e s c r i b e d w i t h t h e a i d o f f i g u r e 9 , and results are p l o t t e d i n f i g u r e 1 1 . I n f i g u r e 1 1 , c u r v e s f o r t w o s p r i n g rates are p r e s e n t e d as a func- t i o n of t i r e d e f l e c t i o n i n b o t h d i m e n s i o n a l and dimensionless form for each of t h e two t i r e s i z e s . One c u r v e d e s c r i b e s t h e s l o p e of t h e l o a d - d e f l e c t i o n c u r v e s d u r i n g l o a d a p p l i c a t i o n , and the o the r f a i r s t he measu red slopes of those curves d u r i n g i n i t i a l l o a d r e l a x a t i o n . The curve cor responding t o load a p p l i c a t i o n g e n e r a l l y r e p r e s e n t s t h e lwer bound on t i r e v e r t i c a l s t i f f n e s s , and the curve f o r i n i t i a l l o a d r e l i e f e s s e n t i a l l y d e f i n e s an upper bound on t i re v e r t i c a l s t i f f n e s s . The data are p r e s e n t e d i n t h i s f a s h i o n to cover the range of spr ing ra tes which the t i r e would experience as t h e resu l t of v e r t i c a l p e r t u r b a t i o n s d u r i n g a i r c r a f t t a k e - o f f , l a n d i n g , a n d t a x i i n g .
The l i n e a r p o r t i o n of t h e l o a d - d e f l e c t i o n c u r v e s f o r b o t h t i r e s i z e s com- mences when t h e t i r e d e f l e c t i o n reaches approximate ly 10 p e r c e n t of the maximum width of the undeflected t i r e . The s lope of t h e l i n e a r p o r t i o n , r e p r e s e n t i n g t h e maximum s p r i n g ra te dur ing load a p p l i c a t i o n , is approximate ly 1050 kN/m (600 lb / in . ) f o r t h e 1 8 x 5.5 t i r e and 2220 kN/m (1 2 700 l b / i n . ) f o r t h e 49 x 17 t i re . The s p r i n g rates a s s o c i a t e d w i t h i n i t i a l load r e l i e f a p p e a r to be a f u n c t i o n of v e r t i c a l load and, hence, t i re d e f l e c t i o n , s i n c e h i g h e r s p r i n g rates r e s u l t from higher loads. The scatter i n t h e data i s due t o t h e d i f f i - c u l t y i n r e a d i n g t h e s l o p e of t h e s e s h o r t l i n e s e g m e n t s . F i g u r e 1 1 shows t h a t t h e i n i t i a l l o a d r e l i e f s p r i n g rates f o r t h e 49 x 17 t i r e are roughly t w i c e t h o s e f o r t h e 1 8 x 5.5 t i re a t co r re spond ing va lues o f ve r t i ca l de f l ec t ion and , as such, are a p p r o x i m a t e l y i n t h e same p r o p o r t i o n as t h e l o a d - a p p l i c a t i o n s p r i n g rates f o r t h e t w o t i r e s i z e s .
H y s t e r e s i s loss.- The area enc losed w i th in t he l oad -de f l ec t ion cyc le , such as t h a t d e p i c t e d i n f i g u r e 9, r e p r e s e n t s h y s t e r e s i s loss, t h a t is, e n e r g y d i s s i - p a t e d by t h e t i re dur ing t ha t l oad ing and un load ing period. A knowledge of hys- teresis loss u n d e r v a r i o u s v e r t i c a l - l o a d i n g c o n d i t i o n s is impor tan t because t h e e x t e n t o f t h i s loss is an i n d i c a t i o n o f t h e e n e r g y d i s s i p a t i o n mechanism active d u r i n g t i r e deformat ion . The area e n c l o s e d w i t h i n t h e l o a d - d e f l e c t i o n curves gene ra t ed du r ing t he 16 ve r t i ca l - load ing tests conducted on each of the
7
t i r e s i z e s was measured with a p l a n i m e t e r , a n d t h e r e s u l t s are p r e s e n t e d i n f i g - u r e 1 2 w h e r e v e r t i c a l h y s t e r e s i s loss is p l o t t e d o n a l o g a r i t h m i c scale as a f u n c t i o n o f applied v e r t i c a l load on a l i n e a r scale. S t r a i g h t l i n e s fa i r t h e d a t a f o r e a c h t i r e and equat ions for t h e s e l i n e s are shown. The s i g n i f i c a n c e of t h e h y s t e r e s i s losses under vertical l o a d s i s sugges ted by e x p r e s s i n g t h e r a t io o f t he ene rgy loss to t h e t o t a l ene rgy i npu t to t h e t i re d u r i n g t h e l o a d - i n g c y c l e . T h i s ratio, referred to as t h e ver t ical h y s t e r e s i s ra t io , was com- pu ted fran planimeter measurements and plot ted as a f u n c t i o n of v e r t i c a l load i n f i g u r e 13. Approximately 11 percent of t h e i n p u t e n e r g y was lost to hys te r - esis d u r i n g v e r t i c a l t i r e l o a d i n g s for t h e 18 x 5.5 t i re , and approximately 9 p e r c e n t was lost f o r t h e 49 x 17 t i r e . T h i s r a t io is i n s e n s i t i v e t o v e r t i c a l l o a d w i t h t h e e x c e p t i o n of t h e h i g h e s t l o a d o n t h e s m a l l e r t i r e where t he r a t i o s l i g h t l y i n c r e a s e s .
Supplementa l load-def lec t ion tests.- To better unders tand t i r e v e r t i c a l s p r i n g rates and h y s t e r e s i s losses, l o a d - d e f l e c t i o n tests were conducted subse- quent to t h i s program on an avai lable 32 x 8.8, t y p e V I 1 a i r c r a f t t i r e . The s p e c i f i c o b j e c t i v e o f t h e s e a d d i t i o n a l tests was to examine e f f e c t s on t h e o v e r a l l l o a d - d e f l e c t i o n c u r v e o f p a r t i a l , multiple l o a d i n g c y c l e s i n a n attempt t o d u p l i c a t e t h e t i r e ve r t i ca l - load env i ronmen t du r ing a i r c r a f t ground opera- t i o n s . R e s u l t s of t h e s e tests are shown i n f i g u r e 1 4 . The l o a d - d e f l e c t i o n cu rve l abe led (a) is the s ing le -cyc le r e l a t ionsh ip . Curves l abe led (b ) and (c) r e s u l t e d frcnn r e a p p l i c a t i o n s of t h e v e r t i c a l l o a d d u r i n g t h e u n l o a d i n g p h a s e . I n ( b ) t h e l o a d was reapp l i ed on ly once ( a t t h e p o i n t l a b e l e d 1) and t he cyc le r e p e a t e d ; i n (c) t h e l o a d was r e a p p l i e d four times i n s u c c e s s i o n , e a c h time s t a r t i n g from a l c w e r i n i t i a l v a l u e ( p o i n t s 1 through 4) and each time r e t u r n - i n g t o n e a r t h e maximum v e r t i c a l l o a d . The loading phase was i n t e r r u p t e d i n the curve l abe led (d) and the sequence of events was as fo l lows: a t p o i n t 1 t h e l o a d was r e l a x e d t o t h e l o a d d e n o t e d by 0, t h e n r e a p p l i e d to p o i n t 2 , a g a i n r e l axed t o p o i n t 0, r e a p p l i e d t o p o i n t 3, r e l a x e d to p o i n t 0, and recyc led t o t h e maximum l o a d a t p o i n t 4 b e f o r e r e t u r n i n g to zero . These curves conf i rm the ear l ier o b s e r v a t i o n t h a t s p r i n g rates d e f i n e d by t h e l o a d i n g p o r t i o n of t h e l o a d - d e f l e c t i o n c u r v e a n d t h o s e a s s o c i a t e d w i t h t h e i n i t i a l u n l o a d i n g f r o m t h e maximum load bound a l l s p r i n g rates gene ra t ed du r ing i n t e rmed ia t e l oad ing cyc le s . I t is a l s o a p p a r e n t f r o m t h e d a t a o f f i g u r e 1 4 t h a t t h e s i n g l e - c y c l e curve based on the maximum load envelops a l l h y s t e r e s i s l o o p s g e n e r a t e d d u r i n g m u l i p l e l o a d i n g c y c l e s o f lesser magnitude.
S t a t i c , Combined Vertical and Lateral Loading
T h i s s e c t i o n of t h e p a p e r d i s c u s s e s results from s t a t i c ( n o n r o l l i n g ) tests conducted on the two t i r e s i z e s where the t i res were f i r s t l o a d e d v e r t i c a l l y t o 50, 75, 100 , and 125 percent o f the i r ra ted loads and t hen sub jec t ed to a l a t e r a l l o a d p e r p e n d i c u l a r to the wheel plane. The l a t e r a l l o a d was l i m i t e d t o roughly 30 pe rcen t o f t he ve r t i ca l l oad and was a p p l i e d c y c l i c a l l y i n b o t h d i r e c - t i o n s by moving t h e b e a r i n g p l a t e . The a c q u i r e d d a t a c o n s i s t o f l a t e r a l load- d e f l e c t i o n r e l a t i o n s h i p s w h i c h i n c l u d e t i r e s p r i n g r a t e s , h y s t e r e s i s losses, and l a t e r a l s h i f t s i n t h e v e r t i c a l - l o a d c e n t e r o f p r e s s u r e ; also s t a t i c r e l a x a t i o n l e n g t h s were o b t a i n e d f r a n t i r e l a t e r a l deformations.
8
Lateral Load-Deflection Relationships
A typical lateral load-deflection curve is presented i n figure 15. After the ini t ia l por t ion of the loading, these curves are characterized by a nearly constant spring (linear curve) throughout the loading phase ( i n both direc- t ions) , an immediate hardening of the spring when the load is f i r s t relaxed (fran either extreme), and a gradual softening of t h e spring during load release u n t i l the slope of the curve reaches that associated w i t h the load-application phase. A s w i t h the vertical load-deflection curves, the area enclosed w i t h i n the loop formed by the loading and unloading cycles is a measure of dissipated energy, or hysteresis loss.
Spring rate.- As pointed out i n reference 2, t h e load-deflection curve should be taken through a complete cycle to obtain a re l iable measure of t i r e spring rate i n the lateral direction. Once a cycle has been experimentally established, there are several ways of defining spring rate. For example, the spring rate was obtained i n reference 5 by measuring the slope of the l i ne joining end points of the load-deflection loop, and i n reference 2 the slope of the nearly linear response i n the loading phase was considered the spring rate. For purposes of t h i s program, two lateral spring rates, defined by the slope of l ines AA and BB i n figure 15, were calculated for each test condition. Line AA corresponds to the linear portion of the load-deflection curve during load application, and l ine BB approximates the slope of the curve a t i n i t i a l load relief. These two se ts of spring rates were selected because they appear to be upper and lower bounds for each loading condition. Note that the slopes of both l ines AA and BB are repeated i n the other loading quadrant.
Spring rates calculated from lateral load-deflection tests conducted a t the four tire peripheral positions at each of the four loading conditions are sum- marized i n figure 16 where each data point is the average of rates from loadings i n both directions. Scatter is more pronounced i n the spring rates for init ial load relief because of early onset of nonlinearity associated w i t h the softening spring. Data for both t ire sizes are faired by s t ra ight l ines , and figure 1 6 shows that the load-application spring rates decrease w i t h increasing vertical load. T h i s trend is consistent w i t h that noted i n reference 2. Spring rates associated w i t h i n i t i a l load relief are essentially insensitive to vertical load.
To compare resul ts from these tests wi th resul ts from other type VI1 t i r e s presented i n reference 2, the spring rates associated w i t h load application were made dimensionless by use of ra t io Ky/(p + 0 . 2 4 ~ ~ ) ~ which i n reference 2 is referred to as the lateral-stiffness parameter. T h i s parameter was computed for both t i r e s and is presented as a function of dimensionless vertical deflec- tion i n figure 17. Two separate and d i s t i n c t curves, one for each t i r e s i ze , are required to fair the data; however, the data for both t i r e s f a l l w i t h i n the lower edge of the scatter band of the data presented i n figure 2 0 ( c ) of refer- ence 2. Also presented i n figure 17 is the curve representing empirical equa- tion ( 3 3 ) of reference 2 which attempts to fa i r the s t i f fness parameter data of that reference. A l l three curves show similar trends i n that la teral-
9

st i f fness parameter decreases wi th increasing tire vertical deflection, although the decrease associated w i t h the present tests appears to be more pronounced than that of reference 2.
Hysteresis loss.- The s ta t ic l a te ra l hys te res i s loss can be obtained from load-deflection curves, such as that i n f igure 15, by measuring the area enclosed wi th in the lateral loading and unloading cycle. Losses measured from the curves for the two t i re s izes a re summarized i n f igure 18. These losses were cmputed fran the areas of complete hysteresis loops formed by repeated loading cycles and are plotted on a logarithmic scale i n the figure as a func- tion of the average of the extreme lateral loads applied i n both directions. Recall that these extreme loads were l imited to approximately 30 percent of the vertical load. Data for both t i re s izes are fa i red by s t ra ight l ines , and equa- tions for these exponential curves are included i n f igure 18.
The extent of the hysteresis loss is i l lus t ra ted i n figure 1 9 where l a t e r a l hysteresis ratio is plotted as a function of l a t e ra l load. The lateral hystere- sis ratio, the ratio of hysteresis loss t o t o t a l energy input to the t i re , i s obtained by d i v i d i n g the area w i t h i n the hysteresis loop by the area under the load-deflection curve including the hysteresis loop (see appendix). The data of figure 19 indicate that the input energy lost to hysteresis during lateral load- i n g s is roughly twice tha t los t during pure vertical loadings and is a function of the applied load. Since the lateral load applied to the tires was limited to 30 percent of the vertical load, trends i n the hysteresis ratio noted i n f i g - ure 19 could be attributed to ei ther the vertical or the lateral load, or t o both.
TO isolate the effect of lateral load, additional tests were conducted on the 49 x 1 7 t ire: hysteresis loops were generated by various lateral loads while the vertical load was held essentially constant. Results from these tests are presented i n figure 20 for several vertical loads. Increasing lateral load increases the input energy lost to hysteresis, and the influence of ver t ical load is inconsequential. Figures 21 (a) and 21 (b) are reproductions of hystere- sis loops which provided a portion of the data for figure 20. These load- deflection curves together w i t h those of figure 21 (c) are included to aid under- s t and ing of t i r e s t a t i c l a t e r a l response. I n f igure 21 (a) the hysteresis loops were decreased i n s ize w i t h each successive cycle; i n figure 21 (b) the size of the loops was sequentially increased; and i n f igure 21 (c) the cycles were randomly varied. I n all three figures the loading steps are sequentially n u m bered. A study of these figures reveals that for a given vertical load, the lateral spring rates as defined i n t h i s paper are essentially independent of la te ra l load. I t is apparent, however, that spring rates defined by the slope of the line connecting the end points of the load-deflection loop (see ref. 5) would s h o w a distinct increase w i t h decreasing lateral load. The spring rates associated w i t h t h i s l a t te r def in i t ion would f a l l between the two curves of f ig- ure 16 which bound the spring rate data a t each loading condition.
Center-of-pressure ” s h i f t . - When a lateral load is applied to a standing t i r e , the footprint is displaced laterally, and the center of the vertical-load reaction (center of pressure) is also displaced i n the same direction. The
10
s h i f t i n the center of pressure is less than the displacement of the footprint, and reference 2 considered the ratio of these two distances Cx to be a t i r e constant w i t h a value of 0.7 for type V I 1 t i res . Values of Cx, referred to as the center-of-pressure coefficient, are plotted i n figure 22 as a function of dimensionless vertical deflection. For the 49 x 17 t i r e , Cx is essent ia l ly independent of vertical deflection, and hence loading, and has a mean value of about 0.69 which is compatible w i t h the results presented i n reference 2. For the 18 x 5.5 t i r e , however, Cx is sensit ive to vertical deflection over the t e s t range and is oonsiderably lower than the 0.7 predicted by reference 2. I t is apparent, therefore, that one value of Cx is not valid for al l type V I 1 t i res .
S t a t i c Relaxation Length
Another parameter available from s t a t i c , combined ver t ical and l a t e r a l t i r e loading is the static relaxation length which is obtained from displacements of the t i r e equator a t various angular positions around the circumference. Such measurements taken on the two t i re s izes under four vertical-loading conditions are presented i n f igure 23 where lateral deflection of the t i re equator x is plotted as a function of t ire peripheral angle 8 measured from the footprint centerline. The angular positions of the footprint leading edge are identified i n figure 23. The la te ra l displacement of the free-tread periphery of the t i re near the leading edge of the footprint varies exponentially w i t h circumferential angular position and, as pointed out i n reference 2, can be expressed i n the f ollcwi ng form:
x = Ae -s&
where A is a constant, s is the circumferential distance from the footprint leading edge, and L, is called the tire static relaxation length. Relaxation lengths were computed from the data of figure 23, nondimensionalized by the t i r e width w, and plotted as a function of dimensionless vertical deflection i n f ig - ure 24. Data from the two t i re s izes are fa i red by separate linear curves both showing a decrease i n relaxation length w i t h increasing t ire deflection. Static relaxation lengths for the 49 x 17 t ire are consistent w i t h data presented i n figures 24 and 25 of reference 2 for other type V I 1 t ires. Static relaxation lengths for the 18 x 5.5 t i r e , however, are higher than those predicted by reference 2.
Yawed Rolling Under Vertical Loading
T h i s section of the paper discusses results from tes t s conducted on the two sizes of tires to define the yawed-rolling relaxation lengths and the steady- s ta te character is t ics of the t i res under various combinations of vertical load, yaw angle, and ground speed. A l l tes ts were conducted on dry concrete.
11

Yawed-Rolling Relaxation Length
When a wheel and tire are positioned at a yaw angle and then rolled straight ahead while maintaining that angle, the lateral force Fy perpendicu- lar to the direct ion of motion builds up exponentially w i t h distance rolled x to a steady-state value Fy,e. For a t i r e t h a t is init ially undistorted, the increase i n la teral force can be expressed by an equation of the following form:
where Ly is called the yawed-rolling relaxation length. Values of Ly were calculated from low-speed yawed-rolling tes t s oonducted on the two t i r e s i z e s under various combinations of vertical load and yaw angle. These values, i n dimensionless form, are plotted as a function of dimensionless vertical deflec- tion i n figure 2 5 where the yaw angle for each t e s t i s identified. Also included i n figure 25 for comparison are linear curves which faired the s t a t i c - relaxation-length data of figure 24. The yawed-rolling data from both t i r e s exhibit substantial scatter because i r regular i t ies i n the side force required a certain amount of fa i r ing judgment, and a l l attempts to establish trends asso- ciated w i t h variations i n vertical deflection and yaw angle proved unsuccessful. The mean value of Ly/w for the 18 x 5.5 t i r e is 0.75 w i t h a standard deviation of 0.40. T h i s value is considerably belaw values computed from the s t a t i c data. For the 4 9 x 1 7 t i re the mean value of L /w is 1.30 w i t h a standard deviation of 0.32. I n figure 2 5 ( b ) , the curve whicx f a i r s the static-relaxation-length data fa l ls w i t h i n the scatter of the dynamic data for t h i s t i re .
Steady-State Characteristics
A l l steady-state data fran the yawed-rolling t e s t s conducted on the two tire sizes are presented, together w i t h the corresponding t e s t conditions, i n tables I1 and 111. For purposes of discussion, these data are also presented i n figures 26 t o 31. The t e s t s examined the effects of three parameters - t i r e vertical load, yaw angle, and ground speed - on the steady-state characteristics of side force, self-aligning and overturning torques, friction-force moment arm, and lateral center-of-pressure s h i f t . To simplify the presentation of resul ts , analysis-of-variance studies were performed on the characteristics, and i t was found tha t a l l b u t the lateral center-of-pressure shift were strongly affected by the t i re ver t ica l load and yaw angle and insensit ive to ground speed over the range of speed examined i n t h i s program. Therefore, for those characteristics, the data are presented i n the form of carpet plots to illustrate functional relationships between the characteristics and the test parameters. I n the car- pet plots, the steady-state characteristic i s presented as a function of both vertical load and yaw angle, and the ground speed is identified by test-point symbols. Lines of constant load and c o n s t a n t yaw angle were then f i t t e d t o the data i n a least squares fashion to serve as an interpolation aid. The dashed lines are extrapolations of the data t o zero ver t ical load or t o zero yaw angle. The intersections of the faired lines represent the desired test conditions; the data points represent the actual test conditions. The actual vertical load s m e
12

times d i f f e r e d s i g n i f i c a n t l y from t h e d e s i r e d load, b u t t h e d e s i r e d and a c t u a l yaw angles a lways agreed because of t h e c o n t r o l m a i n t a i n e d o v e r t h a t parameter.
The fo l lowing pa rag raphs d i scuss i n detai l t h e e f f e c t s of t i r e v e r t i c a l l oad , yaw angle, and ground speed on t h e s t e a d y - s t a t e c h a r a c t e r i s t i c s d e t e r m i n e d from yawed-roll ing tests.
Side force . - The effect of t h e test parameters on the deve loped side force Fs is p r e s e n t e d i n f i g u r e 26 where t h e s i d e force is measured normal to the wheel p lane (as opposed to c o r n e r i n g force which is measured normal to t h e d i r e c t i o n of mot ion) . When yaw a n g l e is h e l d c o n s t a n t , side force i n c r e a s e s w i t h i n c r e a s i n g v e r t i c a l load and reaches a maximum a t v e r t i c a l l o a d s b e t w e e n 75 and 100 percent of t h e rated v e r t i c a l l o a d for t h e 1 8 x 5.5 t i r e and between 100 and 125 percent of the rated load for t h e 49 x 17 t i re . F i g u r e 26 f u r t h e r shows t h a t t h e e f f e c t on s i d e force due to c h a n g e s i n v e r t i c a l load becomes more pronounced as yaw ang le is increased . As expec ted , i nc reas ing yaw a n g l e w h i l e h o l d i n g v e r t i c a l load c o n s t a n t i n c r e a s e s s i d e force, r e g a r d l e s s o f t h e v e r t i c a l l o a d . N o d i s c e r n i b l e t r e n d s are e v i d e n t w i t h v a r i a t i o n s i n ground speed. Since side-force d a t a are g e n e r a l l y p r e s e n t e d i n d i m e n s i o n l e s s form, they were d i v i d e d by t h e r e s p e c t i v e v e r t i c a l l o a d on t h e t i r e . Th i s pro- cess y i e l d e d , by d e f i n i t i o n , side-force f r i c t i o n c o e f f i c i e n t s ps, which are p r e s e n t e d i n t h e c a r p e t p l o t of f i g u r e 27. H i s t o r i c a l l y , it h a s been bel ieved t h a t side-force f r i c t i o n c o e f f i c i e n t is i n s e n s i t i v e to v a r i a t i o n s i n v e r t i c a l load; however t h e d a t a o f f i g u r e 27 i n d i c a t e a d i s t i n c t v e r t i c a l - l o a d e f f e c t . For f i x e d yaw a n g l e s , there is a d e c r e a s e i n ps w i t h i n c r e a s i n g v e r t i c a l l o a d , and t h i s t r e n d becomes more pronounced as yaw angle -is increased. These obser- v a t i o n s may have impor t an t imp l i ca t ions fo r s imu la t ions of a i r c r a f t ground- handling problems. The f i g u r e a lso shows t h a t for f i x e d v e r t i c a l l o a d s , pS i n c r e a s e s w i t h i n c r e a s i n g yaw angle and t h e r a t e of i n c r e a s e d e c r e a s e s w i t h i n c r e a s i n g yaw angle. Thus a p e a k f r i c t i o n c o e f f i c i e n t is as soc ia t ed w i th each v e r t i c a l l o a d a t some higher yaw angle. Again, no trends d u e to v a r i a t i o n s i n ground speed a re ev ident .
Aligning torque.- Al igning to rque M, is d e f i n e d as t h e torque developed about t h e s t e e r i n g a x i s o f a yawed t i r e . When p o s i t i v e , Mz is s e l f - a l i g n i n g , t h a t is, it t e n d s to reduce yaw angle . Al igning torques from tests w i t h t h e two t i r e s i z e s are p r e s e n t e d i n c a r p e t p l o t f o r m i n f i g u r e 28. When yaw ang le is h e l d c o n s t a n t , a l i g n i n g torque i n c r e a s e s w i t h i n c r e a s i n g v e r t i c a l l o a d , a n d the r a t e o f change of torque w i t h v e r t i c a l l o a d is g r e a t e r a t h igher yaw ang les . The f i g u r e also shows t h a t when v e r t i c a l load is he ld cons tan t and yaw a n g l e is inc reased from z e r o , a l i g n i n g torque i n c r e a s e s r a p i d l y , r e a c h e s a maximum, and then decreases w i t h f u r t h e r i n c r e a s e s i n yaw. For s e v e r a l c o n d i t i o n s , s p e c i f i - c a l l y when t h e t i r e s were l i g h t l y l o a d e d and a t a h igh yaw ang le , t he t o rque is n e g a t i v e , t h a t is, n o l o n g e r s e l f - a l i g n i n g . I n g e n e r a l , t h e a l i g n i n g t o r q u e appea r s to reach a maximum v a l u e a t yaw angles between 3O and 6O. These t rends , i n c l u d i n g t h e i n s e n s i t i v i t y of a l i g n i n g torque to ground speed, are c o n s i s t e n t wi th data from r e f e r e n c e 6.
Overturning torque.- The torque which tends to tilt the whee l p l ane away from t h e v e r t i c a l is r e f e r r e d to as o v e r t u r n i n g t o r q u e Mx. The carpet plots o f f i g u r e 29 for t h e two t i r e s i z e s show t h e effects t h a t v e r t i c a l load, yaw
13
angle, and ground speed have on t h i s characterist ic. A t small yaw angles, over- turning torque is generally insensitive to variations i n vertical load; hawever, as the yaw angle increases, the torque becomes more sensitive to load (torque increases w i t h increasing load). Figure 29 also shows that, as expected, an increase i n yaw angle at a fixed vertical load increases overturning torque and that the rate of increase generally increases as vertical load becanes larger. A s i n the case of the other characteristics, no discernible trends are attrib- uted to ground speed variations.
Friction-force manent a r m . - The friction-force manent arm q is the dis- tance fran the friction-force resultant vector to the steering axis and is considered positive when the friction force acts along a l i ne behind the steer- i n g axis. T h i s manent arm is akin to pneumatic caster, b u t unlike that param- eter , it includes the drag force i n the resultant vector. The friction-force resultant vector and the manent arm represent a force system which is s t a t i ca l ly equivalent to the actual forces and manents i n the footprint. Friction-force manent arms computed fran the data of these tests are plotted i n figure 30 t o show the effect of the various t e s t parameters. Linear curves were used t o f a i r the data. The manent arm for both t ire sizes increases w i t h increasing vertical load on the t i r e and decreases w i t h increasing yaw angle. Again, no ident i f i - able trends are associated w i t h variations i n ground speed. Values of q are negative at l i g h t loads and high yaw angles, as expected, since the aligning torque ( f ig . 28) is negative at these test conditions.
Center-of-pressure s h i f t . - L i t t l e information is available i n the l i tera- tu re o n l a te ra l movement of the center of pressure i n the t i re footpr int under yawed-rolling conditions because of the severe instrumentation demands to acquire that parameter. Analysis-of-variance studies indicated that the effects on the lateral center-of-pressure s h i f t yc due t o t i r e v e r t i c a l load and yaw angle could not be isolated by us ing a carpet plot. The analysis further i n d i - cated that the yc data were not sensi t ive to sped var ia t ions. Consequently, the center-of-pressure s h i f t is plotted i n f igure 31 as a function of yaw angle only, and vertical-load ranges are denoted by test-point symbols. For the 18 x 5.5 t ire (f ig. 31 (a) ), yc generally increases with yaw angle b u t exhibits no mnsistent trend for variations i n vertical load. For the 49 x 17 t i r e (fig. 31 ( b ) ) , no trends i n yc can be established €or variations i n either verti- ca l load or yaw angle.
CONCLUDING REMARKS
An experimental program was conducted to evaluate selected mechanical prop- e r t ies of two sizes of type VI1 aircraf t t i res current ly i n widespread use. Data were obtained under s t a t i c loading conditions and under yawed-rolling conditions a t ground speeds up to 100 knots. Results of the yawed-rolling tes ts indicate that dynamic t i re charac te r i s t ics under investigation were generally insensitive t o speed variations and therefore support the conclusion t h a t many of these char- acter is t ics can be obtained from s t a t i c and low-speed rolling tests. Further- more, many t i r e mechanical properties presented here are i n good agreement w i t h empirical predictions based on earlier research performed on a i rc raf t t i res of various types and sizes. Among these properties are tire footprint geanetry characterist ics, vertical and lateral load-deflection relationships, and t i r e
14

yawed-rolling properties of side force and aligning torque. Sufficient differ- ences do exis t i n sane properties, however, to warrant additional research before extending the current empirical prediction procedures to include a l l new t i r e designs.
Langley Research Center National Aeronautics and Space Administration Hampton, VA 23665 April 7, 1981
15
APPENDIX
GLOSSARY OF TERMS AND SYMBOLS
The purpose of t h i s a p p e n d i x is to d e f i n e terms, express ions , and symbols used i n t h e s t u d y of t i re mechanica l properties. Many of t h e s e terms are asso- c i a t e d w i t h t h e f o r c e s a n d moments developed i n t h e f o o t p r i n t p l a n e , t h e w h e e l p l a n e , a n d t h e v e r t i c a l p l a n e p e r p e n d i c u l a r t o t h e w h e e l p l a n e . O t h e r terms are d e f i n e d by va r ious no rma l i z ing func t ions .
Forces and Moment i n F o o t p r i n t P l a n e
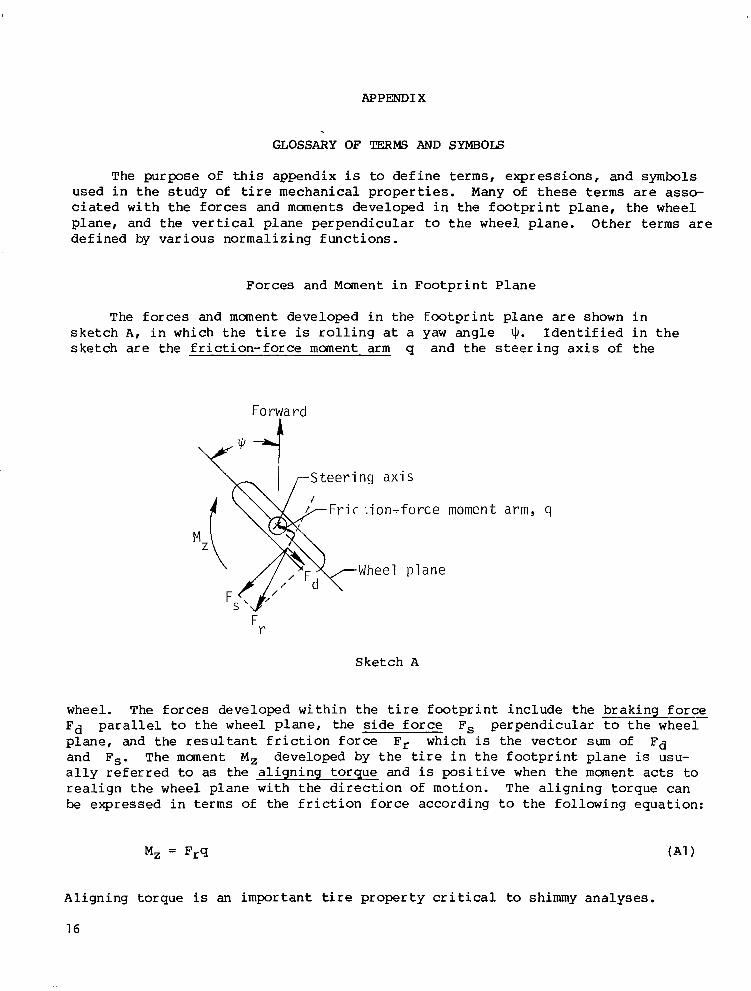
The forces and moment d e v e l o p e d i n t h e f o o t p r i n t p l a n e are shown i n s k e t c h A, i n which t h e t i r e is r o l l i n g a t a yaw a n g l e 9. I d e n t i f i e d i n t h e ske tch are t h e f r i c t i o n - f o r c e moment arm q a n d t h e s t e e r i n g a x i s o f t h e
Fo rwa rd
I ,--Steering ax i s
,force moment arm, q
plane
F r
Sketch A
wheel. The f o r c e s d e v e l o p e d w i t h i n t h e t i r e f o o t p r i n t i n c l u d e t h e b r a k i n g force Fd p a r a l l e l to the wheel plane, the s i d e f o r c e F, perpend icu la r t o t h e w h e e l p l a n e , a n d t h e r e s u l t a n t f r i c t i o n f o r c e F r w h i c h is t h e v e c t o r sum of Fd and Fs. The moment M, developed by t h e t i r e i n t h e f o o t p r i n t p l a n e is usu- a l l y r e f e r r e d to as the a l ign ing t o rque and is p o s i t i v e when t h e moment acts to r e a l i g n t h e w h e e l p l a n e w i t h t h e d i r e c t i o n o f m o t i o n . The a l i g n i n g torque can be e x p r e s s e d i n terms o f t h e f r i c t i o n force accord ing t o t h e f o l l o w i n g e q u a t i o n :
Al igning to rque is an impor t an t t i r e p r o p e r t y c r i t i ca l to shimmy ana lyses .
16
AePENDIX
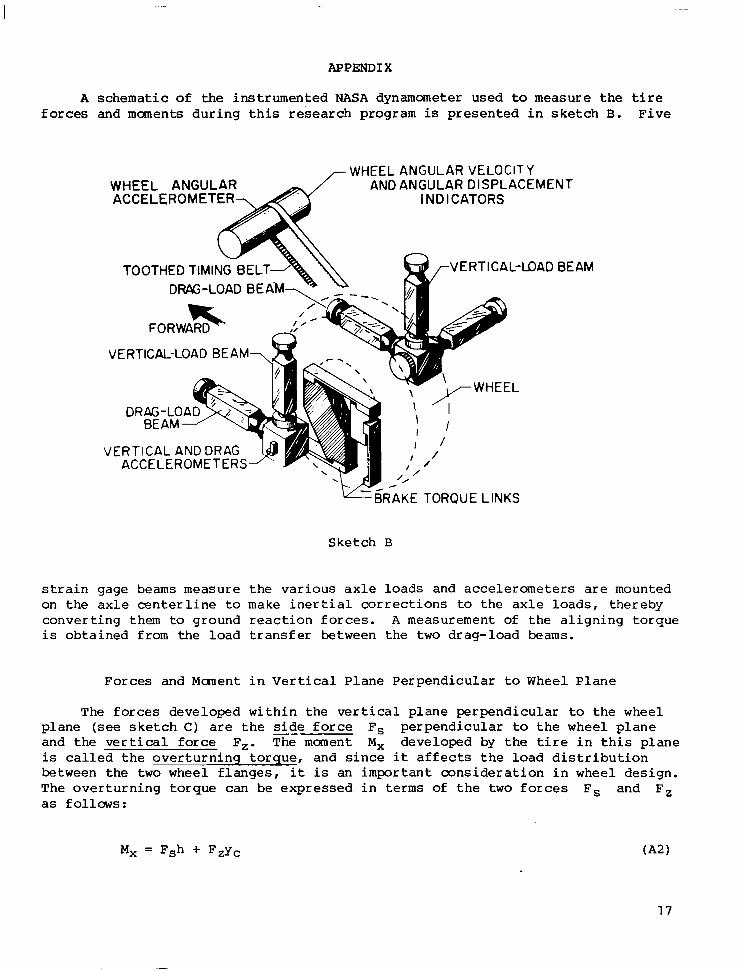
A schemat ic of the i n s t rumen ted NASA dynamometer used to measure t he t i r e forces and moments d u r i n g t h i s r e s e a r c h p r o g r a m is p r e s e n t e d i n s k e t c h B. F i v e
VERTICAL-LOAD BEAM--,
VERTICAL-LOAD BE
VERTICAL AND DRAG 9 I / / I
I ’ ACCELEROMETERS / ’/ -
E RAKE TORQUE LINKS
Sketch B
s t r a i n gage beams measu re t he va r ious ax le l oads and acce le romete r s are mounted o n t h e a x l e c e n t e r l i n e to m a k e i n e r t i a l c o r r e c t i o n s to t h e a x l e l o a d s , t h e r e b y conve r t ing them to ground reac t ion forces. A measurement of t h e a l i g n i n g torque is obta ined f rom the load t r ans fe r be tween t he t w o drag-load beams.
Forces and Mment i n Vertical P lane Pe rpend icu la r t o Wheel Plane
The f o r c e s d e v e l o p e d w i t h i n t h e v e r t i c a l p l a n e p e r p e n d i c u l a r t o the wheel p lane (see s k e t c h C) are t h e side force F, pe rpend icu la r t o t h e w h e e l p l a n e a n d t h e v e r t i c a l f o r c e F,. The moment Mx developed by t h e t i r e i n t h i s p l a n e is called the ove r tu rn ing t o rque , and s ince it a f f e c t s t h e l o a d d i s t r i b u t i o n between the t w o wheel f langes , it is an i m p o r t a n t c o n s i d e r a t i o n i n wheel des ign . The ove r tu rn ing t o rque can be expres sed i n terms of t h e t w o forces Fs and F, as fo l lows:
17
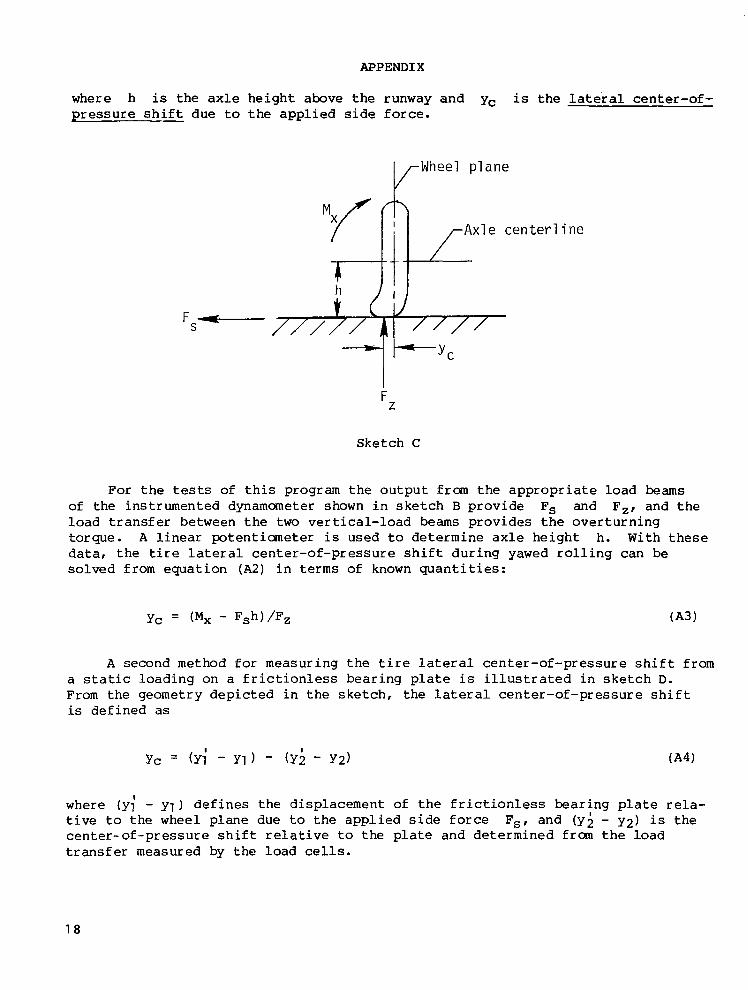
APPEND1 X
where h is the axle height above the runway and yc is the lateral center-of- pressure s h i f t due to the applied side force.
I/ Wheel plane
Sketch C
For the tes ts of t h i s program the output frcnn the appropriate load beams of the instrumented dynamometer shown i n sketch B provide Fs and F,, and the load transfer between the two vertical-load beams provides the overturning torque. A linear potentimeter is used t o determine axle height h. With these data, the tire lateral center-of-pressure s h i f t during yawed roll ing can be solved from equation (A2) i n terms of known quantities:
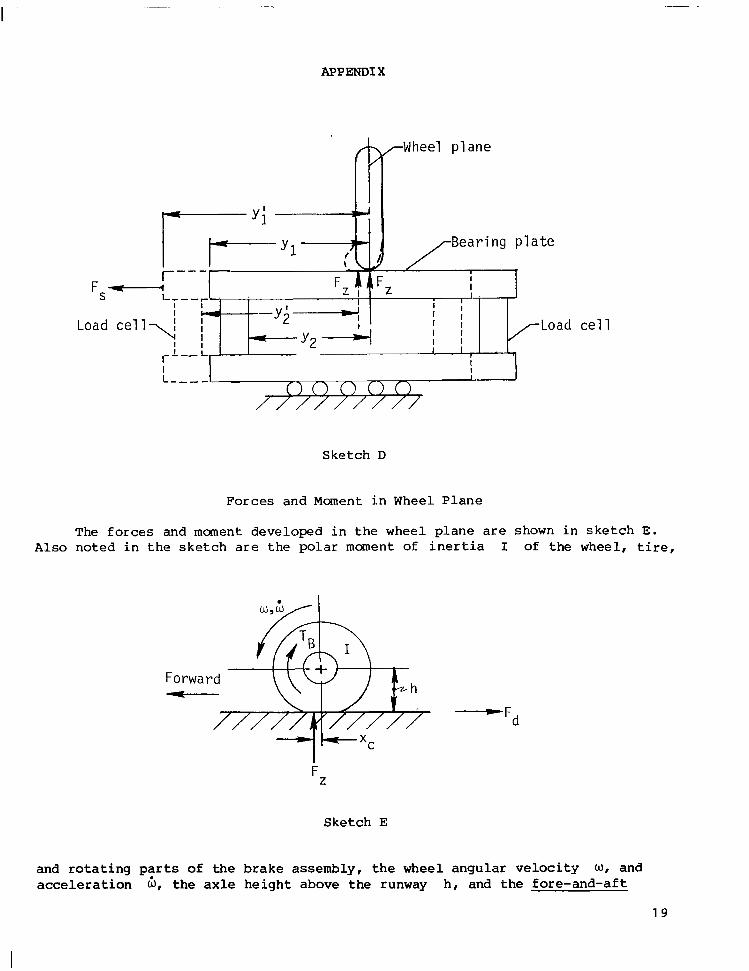
A second method for measuring the t i r e l a t e ra l center-of-pressure s h i f t from a s t a t i c loading on a frictionless bearing plate i s i l lus t ra ted i n sketch D. From the geometry depicted i n the sketch, the lateral center-of-pressure s h i f t is defined as
where (y ; - yl) defines the displacement of the frictionless bearing plate rela- t ive to the wheel plane due to the applied side force F,, and ( y i - y ~ ) i s the center-of-pressure s h i f t relative to the plate and determined from the load transfer measured by the load cells.
1 8
~ ~. . .
APPENDIX
" .
Sketch D
Forces and Moment i n Wheel P l a n e
The f o r c e s and moment d e v e l o p e d i n t h e wheel plane are shown i n s k e t c h E. Also n o t e d i n t h e s k e t c h a r e t he p o l a r moment of i n e r t i a I of the wheel , t i re ,
F Z
Sketch E
-Fd
1 9

APPEND I X
center-of-pressure-shift of the t ire xC. The moment developed about t h e axle TB is called brake torque and is defined to be positive when it opposes wheel rotation. The brake torque can be expressed i n terms of the angular accelera- tion of the wheel and the forces i n the wheel plane i n the following manner:
The brake torque l i n k s i n the NASA dynamometer (sketch B) are used to obtain a measure of the brake torque independent of the braking force.
For a t i re f reely rol l ing (unbraked) a t a constant angular velocity, both the brake torque TB and the wheel angular acceleration 6 equal zero, and equation ( A 5 ) reduces to
I n the freely rolling case, Fd is a measure of rolling resistance, and for aircraft t ires the value of the fore-and-aft center-of-pressure s h i f t is usually between 2 and 5 percent of the axle height.
Miscellaneous Terms
The following paragraphs describe several additional terms associated w i t h the study of t i r e mechanical properties.
Free-tread periphery.- That portion of the tread not i n contact w i t h the pavement is frequently called the free-tread periphery.
Gross-footprint-area parameter ( k / w \ j r d ) . - The gross-footprint area is nor- malized by the maximum t i r e w i d t h times the square root of the product of the maximum t i r e wid th and the maximum t i r e diameter. T h i s gross-footprint-area parameter is a measure of the flotation capability of the t i r e .
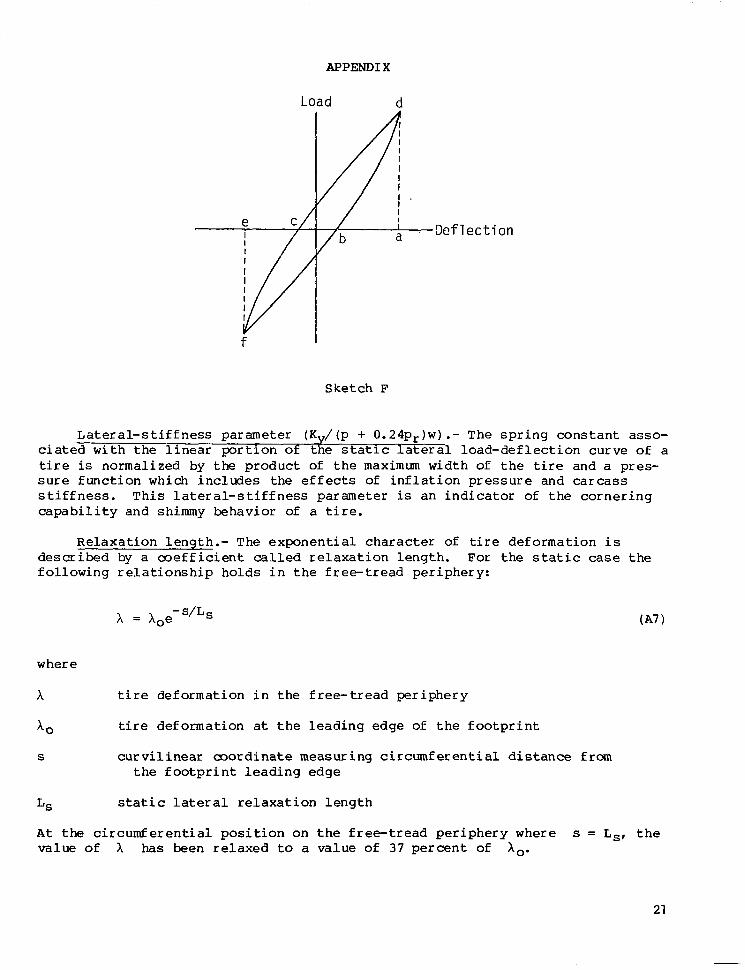
Hysteresis loss ratio.- The ra t io of energy lost during a loading-unloading cycle to the total energy input is called the hysteresis loss ratio. A typical -
example o f a t i r e load-deflection hysteresis loop i n the lateral direction is shown i n sketch F. The area cdbfc enclosed by the hysteresis loop represents the total energy loss associated w i t h a complete loading-unloading cycle i n both lateral directions. The to t a l energy input to the tire is the sum of the two triangular areas acda and ebfe. Similar loops are generated i n the vertical and fore-and-aft directions. The hysteresis loss ra t io is an indicator of the damping characterist ics of a t i r e and is an important factor i n the tire landing impact capability, shimmy performance, and braking and rolling resistance character ist ics .
"
20
APPEND1 X
Load d
I ' 3ef 1 e c t ion
f
Sketch F
Lateral-stiffness parameter (Kv/(p + 0 . 2 4 ~ ~ ) ~ ) .- The spring constant asso- ciated w i t h the linear portion of the static lateral load-deflection curve of a t i r e is normalized by the product of the maximum wid th of the t i re and a pres- sure function which includes the effects of inflation pressure and carcass s t i f fness . T h i s la teral-s t i f fness parameter is an indicator of the cornering capability and shimmy behavior of a t i re .
Relaxation length.- The exponential character of t i r e deformation i s described by a coefficient called relaxation length. For the s t a t i c case the following relationship holds i n the free-tread periphery:
where
x t i r e deformation i n the free-tread periphery
X 0 t i r e deformation at the leading edge of the footprint
S curvilinear coordinate measuring circumferential distance from the footprint leading edge
LS static lateral relaxation length
A t the circumferential position on the free-tread periphery where s = Ls, t h e value of X has been relaxed t o a value of 37 percent of X,.
21

APPEND1 X
The i n i t i a l buildup i n side force under yawed rolling follows a similar exponential law:
where
X distance rolled
FY instantaneous cornering force perpendicular to the direction of motion
FY, e
=Y
steady-state cornering force
yawed-rolling relaxation length
Equation ( A 8 ) s ta tes tha t Fy reaches approximately 63 percent of the steady- s t a t e value when the t i r e r o l l s a distance x = %. The relaxation length is an important t i re charac te r i s t ic which influences t ire shimmy behavior.
Spring rate.- The nonlinear stiffness of a t i r e i n i ts various operational modes is measured by spring rate. I t is defined i n t h i s paper as the instanta- neous slope of the tire load-deflection curve. The spring rate of a t i r e affects i ts landing impact capability, shimmy characterist ics, and response to braking and steering inputs.
Vertical-force parameter (F,/(p + 0 .08pr )~ G d ) .- Tire vertical load i s normalized by the product of a pressure function, which includes the effects of inflation pressure and carcass stiffness, and a footprint-area function.
Symbols
Values are given i n both S I and U.S . Customary U n i t s . The measurements and calculations were made i n U.S . Customary U n i t s . Factors relating the two sys- tems are presented i n reference 12 .
A m n s tant
AG gross footprint area
AN net footprint area
CA ra t io of l a t e ra l s h i f t i n center of pressure to t i re footpr int displacement
d outside diameter of unloaded t i r e
Fd drag force parallel to wheel plane
22
MZ
PR
P V
P
Pr
q
S
V
Wf
W
X
yc
x 6
APPENDIX
side force perpendicular to wheel plane
l a t e ra l or cornering force perpendicular to direction of motion
steady-state lateral force perpendicular to direction of motion
t ire vertical loading
constant associated w i t h footprint length
constant associated w i t h footprint width
t i re la teral spr ing ra te
t ire vertical spring rate
length of tire-ground contact area (footprint)
t i re s ta t ic re laxat ion length
t i r e yawed-rolling relaxation length
overturning torque, moment about horizontal axis i n wheel plane through wheel center
aligning torque, mcment about vertical axis through wheel center
t i re l a te ra l - s t i f fness parameter
t i r e ver ti cal-f or ce par meter
t ire inflation pressure
t ire rated inflation pressure
friction-force moment arm
peripheral distance around t i r e
ground speed
width of tireground contact area (footprint)
maximum width of undeflected t i r e
displacement i n direction of motion
lateral center-of-pressure s h i f t
lateral deflection of t i r e equator
ver t ical t i re def lect ion
23
" .
APPEND1 X
4J t i r e yaw angle
e tire peripheral angle
PS side-force friction coefficient
24
1. Hadekel, R.: The Mechan ica l Cha rac t e r i s t i c s of Pneumat ic Tyres - A D i g e s t of P r e s e n t Knowledge. S & T Memo. No. 10/52, TPA 3/TIB, B r i t i s h Min. Supply, Nov. 1952. (Supersedes S & T Memo. No. 5/50. )
2. Smiley, Robert F.; and Horne, Walter B.: Mechanical Properties of Pneumatic T i r e s W i t h S p e c i a l R e f e r e n c e t o Modern A i r c r a f t T i r e s . NASA TR R-64, 1960. (Supersedes NACA TN 4110.)
3. Nybakken, G. H.; Dodge, R. N.; and C l a r k , S. K. : A S tudy of Dynamic T i r e P r o p e r t i e s Over a Range of Tire Cons t ruc t ions . NASA CR-2219, 1973.
4. C l a r k , S. K.; Dodge, R. N.; Lackey, J. I.; and Nybakken, G. H. : S t r u c t u r a l Mode l ing o f A i rc ra f t Tires. NASA CR-2220, 1973.
5. Dodge, R. N . ; Larson, R. B.; C l a r k , S. K.; and Nybakken, G. H . : T e s t i n g Techniques for De te rmin ing S t a t i c Mechan ica l Properties of Pneumatic Tires. NASA CR-2412, 1974.
6. Tanner, John A.; and Dreher, Robert C.: Corne r ing Charac t e r i s t i c s o f a 40 x 14-16 Type VI1 A i r c r a f t Tire and a Comparison With Characteristics of a C40 x 14-21 C a n t i l e v e r A i r c r a f t T i r e . NASA TN D-7351, 1973.
7. Dreher , Rober t C.; and Tanner John A. : E x p e r i m e n t a l I n v e s t i g a t i o n of t h e C o r n e r i n g C h a r a c t e r i s t i c s of 18 x 5.5, T y p e VII, Aircraf t Tires Wi th D i f - f e r e n t T r e a d P a t t e r n s . NASA TN D-7815, 1974.
8. Tanner, John A . ; McCarty, John L.; and Bat terson, Sidney A . : The Elas t ic Response of Bias-ply Aircraf t Tires to Braking Forces. NASA TN D-6426, 1971.
9 . Tanner , John A.: Fore-and-Aft Elast ic Response Charac t e r i s t i c s of 34 x 9.9, Type VII, 14 P l y - R a t i n g A i r c r a f t Tires of Bias-ply, Bias-Bel ted, and Radial-Bel ted Design. NASA TN D-7449, 1974.
10. Dreher, Robert C.; and Yager, Thomas J.: F r i c t i o n C h a r a c t e r i s t i c s of 20 x 4 . 4 , Type V I I , A i r c r a f t T i r e s C o n s t r u c t e d W i t h D i f f e r e n t T r e a d R u b b e r C m p o U d s . NASA TN D-8252, 1976.
11. Recommended P r a c t i c e f o r Measurement of S t a t i c M e c h a n i c a l S t i f f n e s s Proper- ties o f A i r c r a f t Tires. A I R 1380, Soc. Automot. Eng., Aug. 1975.
12 . S tandard for Metric P r a c t i c e . E 380-79, American SOC. Tes t ing & Mater., c. 1980.
25

TABLE 1.- CHARACTERISTICS OF TW TIRE SIZES
1 18 X 5 .5
I 49 X 17 -4 T y p e . . . . . . . . . . . . . . . . . . . . . . . . . . j V I I V I I
P l y r a t i n g . . . . . . . . . . . . . . . . . . . . . . . Type of p l y . . . . . . . . . . . . . . . . . . . . . . Rated v e r t i c a l load F,, kN ( lb ) . . . . . . . . . . . .
Rated i n f l a t i o n p r e s s u r e , P r , kPa ( p s i ) . . . . . . .
O u t s i d e diameter of unloaded tire, d, cm ( i n . ) . . . .
Maximum width of unloaded t i re , w, cm ( i n . ) . . . . . .
14
Bias
27.6 (6200)
1482 (21 5)
44.7 (17 .6)
14 .03 (5 .525)
26
Bias
1 76 (39 600)
1172 (1 70)
122.49 (48 .225)
42.74 (16 .825)
Tread desc r ip t ion (no . of c i r c u m f e r e n t i a l g r o o v e s ) . . . I I ___ ~ __-
26
TABLE 11.- SUMMARY OF TEST CONDITIONS AND STEADY-STATE RESULTS EXOM YAWED-ROLLING
V
knots
5
5
5
5
5
5
5
50
50
50
50
1
3
6
6
9
9
9
I
3
6
9
Fz
kN Ibf
20.33 13.12
27.46 33.79
20. 08 13.20
27.13 34.00
20. 88 13.60
27.56 34.25
20.65 13.86
27.58 32.51
20.46 13.84
27.30 28.94
20.78 13.59
27. 83 28.53
21.46 14.55
28.53 29.91
20.43 13.12
27.26 34. 80
13.56 19.30 25.74 32.55
20.73 12.52
27.00 34.52
20.70 13.39
26. 83 30. I0
2950 4570 6173 7595
2967 4515 6 I00 7644
3056
6195 4695
7701
31 15 4643 6201 7309
31 12 4600 6137 6506
3055 467 1 6257 64 I5
3270 4824 64 I4 6724
2949 4593 6 I29 7823
3049 4339 5786 73 17
2815 4659 6070 7760
3010 4654 603 1 6767
TESTS OF 18 x 5.5 TIRE
Fs
kN Ibf
2.14 2.52 2.44 2.44
5.14 5.95 5.95 5.44
7.57 9.21 10.16 9.65
7.79 9.22 9.99 9.92
12.19 9.99
13.26 13. 15
11.46 9.40
12.41 12.56
11.42 9.31
12.22 12.37
2.36 2.58 2.74 2.66
5. I4 5.80 5.66 5.29
7.24 9.80 10.24 9.21
1 I .46 8.46
12.51 13.03
481 567 549 549
1156 1338 1338 1222
207 1 1701
2285 2 170
2073 I75 I
2246 2229
2246 274 I 298 I 2956
21 I4 2576 2791 2824
2094 2568 2748 278 I
530 58 1 615 598
1156 I305 1272 I189
1627 2202 2301 207 1
2576 1902
281 1 2929
Fd
kN Ibf
.55
.74 1.18 I .44
.31
.66
1.20 .79
.05
. 6 6
1.17 . 6 1
.35
.52
.78
.79
.28
.55 1 .03 1.05
.24
.65
1 .E5 .89
.27
.64
1.14 .97
1 .E7 .52
1.26 1.92
.46
.50
1.15 1.14
.23
.43
1.30 . E l
.14
.57
.91
123 167 266 323
148 69
269 177
I0 149
264 136
I I7 80
I75 178
62 123 23 I 235
55 146 20 I 236
143 61
218 257
242 1 I6
284 43 I
I13 I03 258 256
51 97
293 1 82
31
204 129
1.01 226
Mz
N-m in-lbf
61.7 77.3 115.7 140.4
116.6 162.8 245.0 327.9
134.8 34.7
236.9 363.9
32.5
235.7 113.0
335.5
-2.8
216.5 89.1
287.9
9. I 98.2
252.5 283.0
165.2 48.2
305. 8 276.5
57.6
129.5 60.2
146.5
68.6 165.8
282.6 173.0
126.5 13.9
197. I 339.2
-41. I 11.0
116.5 289.2
547 684 1024 1243
I032 I44 I 2 I68 2902
I193 3 07
2096 322 I
287
2086 1000
2970
789 -25
1916 2548
80 870
2235 2504
1462 426
2706 2447
510 533 I146 1297
1467 607
2501 1531
123 1119
3002 1744
-364 97
1031 2560
Mx
N-m in-lbf
257.9 135.7
242.4 239.6
723. 8 968.6 991.2 942.5
1404.6 1835.4 2112.0 1990.4
1315.9 1746.9 1910.7 1956.8
2498.9 3096.4 3486.0 3512.5
2293. 8 2888.4 3255.6 3297.6
2347.3 2933.8 3199.3 3238.2
215.3 308.4 324.9 334.6
1095.6
1302.7 1176.9
1173.2
2155.3 1418.2
2245.7 2147.7
2168.6 2960.2 3283.2 3387.5
2283 1201
2121 2146
6406 8573 8773 8342
12432 16245 18692 17616
11647
16911 15461
17319
221 17 27406 30854 31089
20302 25564 28815 29186
20775 25966 283 16 28660
1906 2730 2875 2962
10416 9697
I I530 10384
12553
19876 19076
19009
26200 19194
29058 29982
Y c
cm in.
-2.29 -1.19 -.a1 - .61
-2.29 -.91 -.41 -. 10 -.E4 .30 . 84 . 86
-1.73 -. 13 .48 .23
3.78 3.81 3.96 3.99
3.12 3.38
3.58 3.58
3.35 3.48 3.33 3.20
-1.98
-.74 -. 99 -.46
. 18
.33
. 6 1
.94
-.64 I .07
1.37 I .E2
3.18 3.25 3.25
-.90 -.47 -. 32 -.24
-. 90 - . 3 6 -. 16 -.E4
-.33 .12 .33 .34
-.68 -.E5 .E9 .I9
I .49 1.50 1.56 1.57
1.23 1.33 1.41 1.41
1.32 1.37 1.31 I .26
-.?E
-.29 -.39
-. 18
.E7
.I3
.37
.24
-.e5 .42 .40 .54
1.25 1.28 1.28
3.15 1.24
2.79 2.95 4.27 4.95
2.26 2.72 4.09 5.89
I .45 .46
2.34 3.73
.41
2.36 1.22
3.38
-.E3 .74
1.63 2. 18
. I0 . 86 2.03 2.24
1.45 . 51
2.49 2.24
2.39
4.29 2. I6
4.47
1.32
3.00 2.84
5.23
I .30 .20
1.93 3.66
- . 4 8 .10
2.21 .94
I . 10 1.16 1.68 1.95
1 .E7 -89
2.32 1.61
.18
.57
1.47 .92
. 16
.48
1.33 .93
-.E1 .29
.86
.64
.04
.34
.E8
. 80
.20
.57
.98
.E8
.94
. 8 5
1.76 I .69
.52 1.12
2.06 1.18
.E8
.51
I .44 .76
-. 19 .04 .37 .87

TABLE 11.- Concluded
v '
k n o t s
75
75
75
75
1 00
I 00
I 00
I 00
F z
k H Ibf
20.06 13.20
26.68 33.61
20.56 13.82
28.02 34.27
20.30 13.45
27.76 34.59
12.91 19.29 27.52 29. 89
20.36 12.28
26.68 33.90
21.01 13.23
28. 16 34.95
12. 14 19.93 27. I6 33.75
20.48 14.12
27.56 30.41
2966 4510 5997 7555
3 108
6298 462 I
7704
3024 4563 624 I 7776
2903 4336 6186 6720
2760 4577 5999 762 I
2973 4723 633 I 7857
2729 4480 6106 7587
3 173 4605 6195 6836
Fs
k N Ibf
2.08 468 2.55 572 2.62 590 2.78 624
5.55 I248
5.95 1337 6.13 1377
5.19 1167
10.33 2323 7.45 1676
11.22 2522 10.63 2389
I I .25 2530 8.46 1902
13.19 2965 12.89 2898
2.07 466 2.30 518 2.46 552 2.46 552
5.30 1191 6.54 1471
6.39 1436
7.06 1588 9. 17 2063 IQ.15 2282 9.58 2154
12.67 2848 8.79 1977
!3.34 2999 13.19 2965
6.70 1506
Fd
krl Ibf
.58
.92 I .42 1.40
.46 . 85 1.17 1 . 5 1
.58
.35 1.24 I .49
. 05
.50
1.14 .94
.96
.63
I .E9 .96
.54
.30 1 .E8 1.77
.42
.46 I .39
. 9 1
-. 74 .24
-. 37 . I 1
208 131
320 316
1 03 192 263 340
I30 80
279 336
I2
21 1 I I3
256
216 143
215 425
I22 68
242 398
94
312 104
204
-167 54
-84 25
Mz
N-m ~ n - l b f
46.6 412 5 6 . 8 502
156.7 1387 83.8 742
132.0 1168 176.7 1511 267.4 2366 326.4 2889
-27.9 -217 128. I 1134
334.1 2957 139.7 1236
-26.8 -238 -14.4 -128 224.7 1989 275.9 2442
96.9 858 40.7 361
178.6 1581 140.8 1246
162.3 1437 26.9 238
217.5 1925 225.7 1997
-59.1 -523 29. I 258
408.7 3617 114.3 I011
-148.1 -1310 -50.7 -449
207.9 1840 107.6 952
Mx
N-m ln-lbf
364.2 3223 153.4 1358
363.3 3215 315.3 2790
1188.8 18522 1432.5 12679 1515.8 13416 1403.5 12422
1623.6 14370 2219.9 19648 2476.2 21917 2482.8 21974
~-
2050.3 18146 2816.8 24931 3303.2 29236 3339.6 29558
454.8 4025 263.5 2332
407.0 3602 426.6 3776
1192.9 10558 1561.6 13821
1258.2 11136 1510.8 13372
1745. I 15445 2282.8 20204 2601.9 23029 2666.2 23598
2367.2 20952 2970. 8 26294 3125.5 27663 3184.2 28183
Yc
c m in.
-2.06 -.74 -. 56 - . 6 1
1 .E9 .48
1.40 1.32
. 7 1
. 84 1.19 I .55
2.44 3.05 2.97 3.25
-1.37 -.E8 -. 30 -. 13
I . 14 .76
.69
. I 5
2.21 2. 16 2.34 2.57
3.91 2.34
- .81 - . 2 9 -.22 - . 24 .I9 .43 , 55 .52
.28
.33
.47
. 6 1
I .20 .96
1.17 1.28
-.54 -.E3 -. 12 -.E5
.30
.45
.27
. E6
. 87 . 85
I .E1 .92
I .54 .92
2.24 . E 8 2.49 .98
9
cm in.
2.16 .E5 2.11 .E3 2.82 1 . 1 1 5.03 1.98
2.36 .93 2.77 1.09
6.05 2.38 4.42 1.74
-.38 -.I5 1.24 .49
3.12 1.23 1.24 .49
-.30 -.I2 -.I3 -.E5
2.13 .E4 I .70 .67
3.89 1.53 1 .E8 .74
6.78 2.67 4.55 1.79
2.49 .98 . 5 1 .20
3.20 1.26 3.40 1.34
-.E4 -.33 .30 .I2
1.12 .44 4.24 1.67
-1.68 - . 6 6 -.41 -.I6
1.57 .62 . E 1 .32

TABLE 111.- SUMMARY OF TEST CONDITIONS AND STEADY-STATE RESULTS FROM YAWED-ROLLING
TJ3STS OF 4 9 x 17 TIRE
k n o t s ~ deg kN Ibf j k N Ibf kN I b f N-rn in-lbf ."
r4-m in-lbf crn in. 1 crn in. 50
50
50
50
75
75
75
75
1 00
I80
I 00
I 00
1 73.53 16531 126.21 28374 157.88 35493 208.62 46906
3 95.73 21520 126.02 28331
204.36 45942 179.51 40354
6 128.37 28859 88.34 19859
203.43 45734 184.25 41421
9 92.43 20780 133.82 30083 188.35 42343 204.92 46069
1 128.28 28838 81.43 18307
181.48 40798 194.44 43711
15.92 3580 1 .73 16.82 3781 1 1.78 14.42 3241 , 3.61 12.96 2915 3.61
37.97 8536 1.51 33.88 7617 1.51 42.14 9473 4.36 34.98 7864 4.18
59.97 13481 -.77 67.46 15166 1.48 69.02 15515 2.05 6 8 . 0 1 15289 , 3.77
163 676.2 5984 399 1622.1 14356 812 2201.8 19487 8 1 0 2389.8 21152
339 , 1845.2 16331 339 , 3118.5 27601 980 5221 .E 46209 939 1 5964.4 52790
-173 333 ~ 2564.6 22699
769.7 6812
460 6150.2 54434 846 7750.9 68601
7689.5 68058 9304.9 82355 14945.8 132282 9554.0 84560
20802.7 184120 25616.6 226726 23027.4 203810 21323.9 188733
31947.9 282763 38526.8 340991 40242.2 356173 40037.7 354363
36102.8 319537 48068.5 425442 56234.3 497716 58521.0 517955
18695.5 89352 9844.1 87 127
8659.2 76641 9408.8 83275
23491.2 207915 19731.4 174637
29415.2 260346 23713.2 209879 ,
-2.41 -.95 1 4.24 - . I 3 -.E5 1 9.60 4.47 1.76 , 14.81
3.78 1.67
5.83 6 .99 1.19 .47
-1.70 -.67 5.05 1.99 ****N/fl**** 1.24 .49
****N/fl**** .E3 .El
1 .50 .59 1.73 .68
-1.32 -.52
4.29 1.69 .66 .26
5.03 1.98
2.01 .79
-.20 -.E8 I .24 .49
.53 .21
1.09 .43 ****N/fl**** 4.42 1.74 1.63 .64
17.75
4.85
12.32 9.19
16.94
I .30 3.81
11.38 8.92
-1.24 .56
4.17 6 .81
4.72 11.05 13.87 15.52
3.63
13.28 8.53
16.51
I .85 3.33
11.28
-1.52
3.76 .79
6.81
7.44 10.46
22.99 15.95
4.29 7.82 12.34 13.41
3 .89 . I 8
10.36 11.96
-1.35
3.30 -.36
4.98
1.91 1 3.62 I
6.67
1 .SO .51
3.51 4.48
-.49 .22
2.68 1 1.64 '
1.86 4.35
6 . 1 1 5.46
1.43 3.36
6.50 5.23
4.85 ~
- I .26 I .54 3.51 4.89
2.19 1.56
3.26 3.32
. 09
.27 2.48 3.72
- .53 .65
4 .E3
.52
.28
3.42 I .92
.95 2.08 2.41 1.12
- . EO 1.75 1.79 4.17
-.e4
2.04 . 07
2.59
. 08 2.33 I .22
-284 347
1 099 789
35 I 49 I 732 746
21
558 60
836
-120 147
907
117
43 I 63
770
213 468 54 1 25 I
393 -0
402 937
-189
458 15
583
I8 275 525
63.47 14268 83.12 18686 90.17 20272 92.71 20842
13.75 3092 14.70 3304 16.50 3709 15.62 3511
31.23 7022 34.48 7752 39.98 8988 37.18 8359 I
I
53.05 11925 67.23 15115
69.77 15685
61 .96 13930 79.46 17863 90.63 28374 90.95 20447
r
1 I .90 2675 12.39 2786 1 12.49 2809 11.31 2543
34.26 7701
39.66 8916 39.71 8927
38.98 8763
48.47 10897 63.98 14383 66.46 !4942 65.49 14723
60.93 13698 73.96 16627 88.16 19819
-796.7 -705 1
3767.2 33343 463.4 4101
6321.0 55945
653.6 5785 1641.2 14526
2477.0 21923 2332.2 20642
2939.8 26020 1135.0 10045
5318.8 47075 6169.5 54604
2233.7 19770 984.0 8709
7878.8 69733
-939.7 -8317
3411.2 30191 634.9 5619
6197.0 54848
887.5 7855 1314.0 11638 2029.7 17964 2613.0 23177
!471.2 13021 3105.3 27484 4899.3 43362 5261.8 46571
81.6 722 2480.0 71958 6085.4 bag41 7844.7 69432
-8 16.3 - 7225 -259.0 - 2?92 2902.2 25687 4503.3 39858
I 88.83 19969 1 127.03 28557
158.40 35610 i 203.37 45719 I
89.97 20226 ' 125.15 28136 1.31
.73
4.44
- . 6 E .31
2.68 1.48
2.93 4.12 6.28 9.05
1.69 3.08 4.86 5.28
. 07 4.08 I .53
4.71
-.53 -. 14 1.96 I .30
30326.7 268414 -1.30 -.SI 39359.1 348357 .46 .18
393EE.6 348371
34868.3 308610 46041.2 407499 56607.9 501022 56113.5 436646
7827.1 69275 7176.9 63521 8096.2 71657 6774.7 59361
20603.2 182354. 24489.7 216752 24579.0 217542 24055.4 212908
36968.3 327197 2805Q.I 248264
39750.5 351821 38722.6 342724
35903.0 317769 44826.9 396751 52863.4 460808 56884.5 503470
.91 .36
-2.24 - .E8
3.86 1.52 .48 .I9
3.51 1.38
****Wfl**** ****N/fl**** .69 .27 .28 . I 1
-.I3 - . E 5 ****N/fl**** 1.09 .43 I .37 .54
-1.75 - . 69 U***N/fl**** 1.12 .44 1 .88 .74
-1.30 -.51 1.24 .49 1.57 .62 4.19 1.65
205.82 46270
90.63 20374 136. I4 30605 181.27 40752 212.19 47703
' I 9 I. 77 20630 I 1 127.65 28698
170.79 197.27
84. 03 133.50 176.65 !92.05
80.21 127.53 185. I8 191.57
89.49 126.C4
189.82 185.28
38395 44347
38013 18890
39713 43175
28670 18831
4 1630 43067
?Q1 19 P8335 4 1652 42673 h)
W 2.66 599 L J L

L-69-5858 F igure 1 .- C a r r i a g e u s e d i n t e s t i n g t h e 49 x 17 t i re .
L-79-1761
F i g u r e 2.- C a r r i a g e u s e d i n t e s t i n g t h e 1 8 x 5.5 t i re .
30
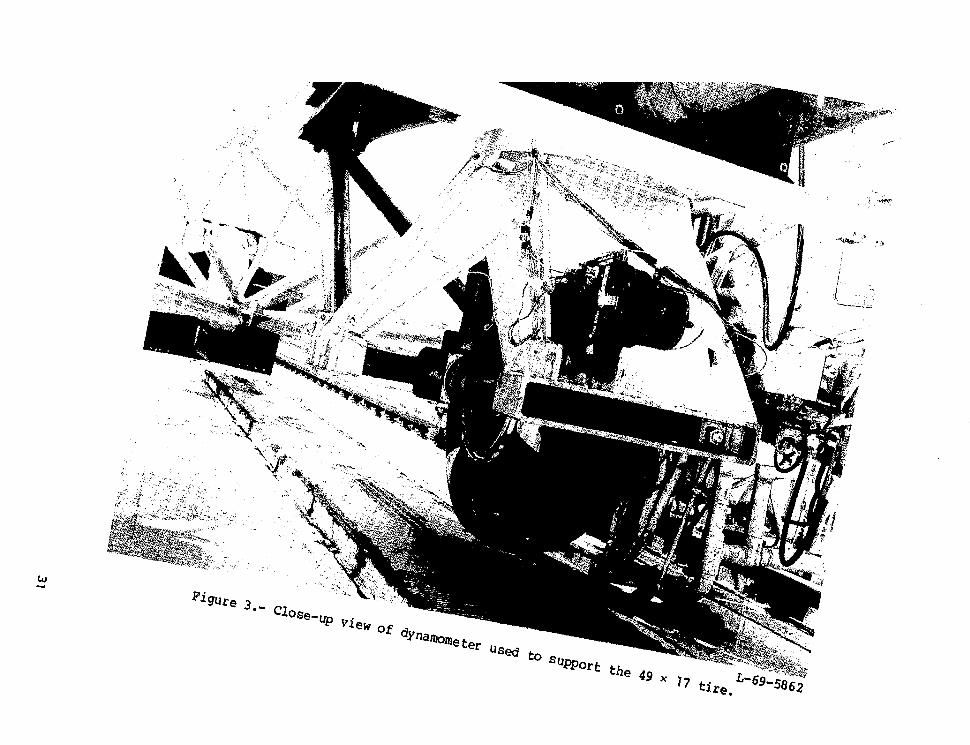

W h)
.6
.5
.4
Lf/d - 3
.2
.1
0
T i r e s i z e
0 18 X 5.5 0 49 X 17
I I 1 1 1 1 1 1 1 .01 .02 .03 .04 .05 .06 .07 .08 .09
Figure 4.- Variation of tire footprint length with vertical deflection.

1.2
1.0
.8
Wf /w .6
.4
.2
0
W W
Tire size 0 18 X 5.5 0 49 X 17
I I I I I 1
.05 .10 .15 .20 .25 .30
S/W
Figure 5.- Variation of t ire footprint wid th w i t h vertical deflection.
W Ip
1.0
.6
.4
.2
0 .05 .10 .15 .20 .25 .30
8 / w
Figure 6.- Variation of tire grOSS-fOOtprint-area parameter with vertical deflection.
*N/*G
1.0
.8
.6
.4
.2
0
Tire size 18 x 5.5 n
-+-J“ 49 X 17
I I f I I J 05 .10 .15 .20 25 .30
Figure 7.- Ratio of t i r e net footprint area to gross-footprint area as a function vertical deflection.
W ul
2001
150(
Bearing pressure,
kPa
IOOC
50C
0
1 Estirrated pressure (ref. 2 ) [Rated inf la t ion pressure
"""~""""""""~ - "--------- x$"===- "=& Gross> A'
I I I I I I I
10 20 30 40
Fz* kN
1 I I
0 2 4 6 I 1
8
Fz, k i p s
(a) 18 x 5.5 tire.
Figure 8.- Variation of tire net and gross bearing pressures with vertical load.
36
2000
1500
Bear ing
500
0 75
Net
n
/ R a t e d i n f l a t i o n p r e s s u r e
100 125 150
Fz. kN 175 200 225
18 2 4 30 36 42 48 F z , k i p s
(b) 49 x 17 t i re .
Figure 8 . - Concluded.
2 50
200
150
Bear ing p ressu re
p s i
100
50
0
37

35
30
25
20
10
5
0
Slope of I I i n i t i a l load re l ie f \//
I 8
8 /\ I Slope of
load appl ica t ion
I I 1 1
1 2 3 4
~~ . "
8, cm
0 .5
8, i n .
7
6
5
4
F z y kips
3
2
1
3
Figure 9.- Typical tire vertical load-deflection curve showing how ver t ical spring rates were acquired (18 x 5.5 t i r e ) .
38

.7
9 h =6 Q co
0
+ Q
\
LL
L
9 .5
v
N
.#
n >
.4 L aJ c, aJ iu E L fu a aJ . 3 u L rc 0
7 1 ru V
c, L
>
.r
aJ .2
.1
0
Tire size 0 18 X 5,5 0 49 X 17
I I I I I 1 ., 05 .10 ., 15 .20 25 .30
39
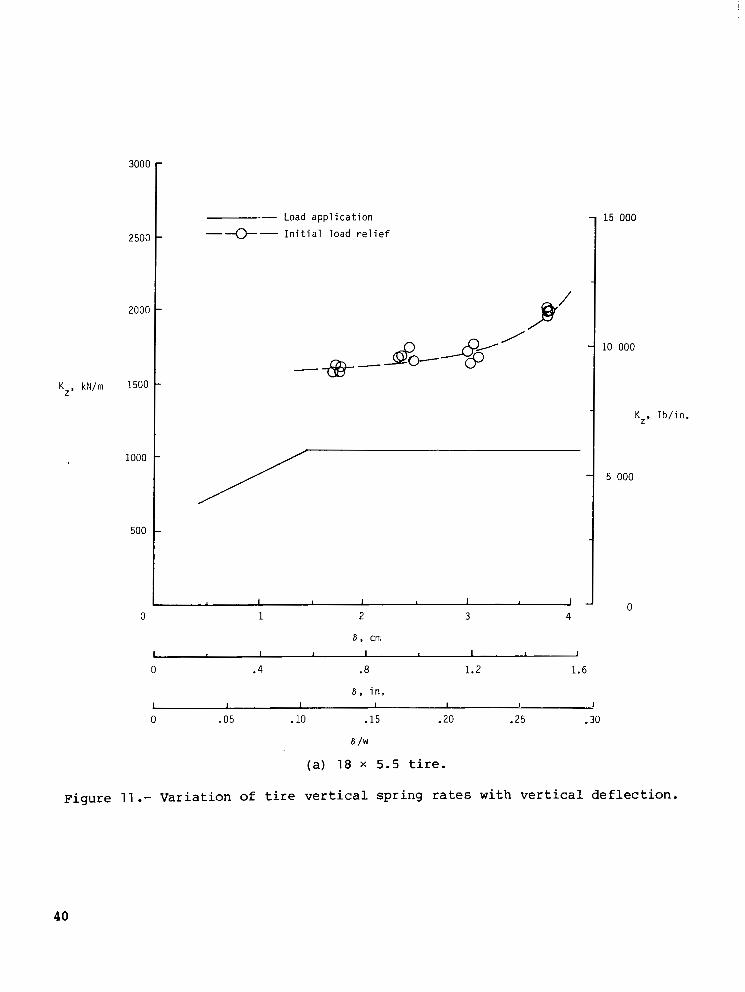
3000
2500
2000
KZ, k W r n 1500
1000
500
0
0
Load application -e- Initial load relief
P’ -33” W
1 I I I I 1 2 3 4
6, cm
.4 .a 1.2
6 . in.
1.6
0 05 .10 .15 .20 .25 .30
6 /w
(a) 18 x 5.5 t i r e .
15 000
10 000
KZ, lb/in.
5 000
0
Figure 11 .- Variation of t ire vertical spring rates w i t h vertical deflection.
40

4000
3000
KZ, kN/m 2000
1000
0
Load appl i c a t i on ----0- - I n i t i a l l o a d r e l i e f
I I I I I I 2 4 6 a 10 12
S , cm
0 1 2 3 4 5
8 , i n .
0 .05 .10 .15 .20 D 25 .30
S I W
(b) 49 x 17 t i re .
. . .
20 000
15 000
10 000
KZ, l b / i n .
5 000
0
F i g u r e 11.- Concluded.
41
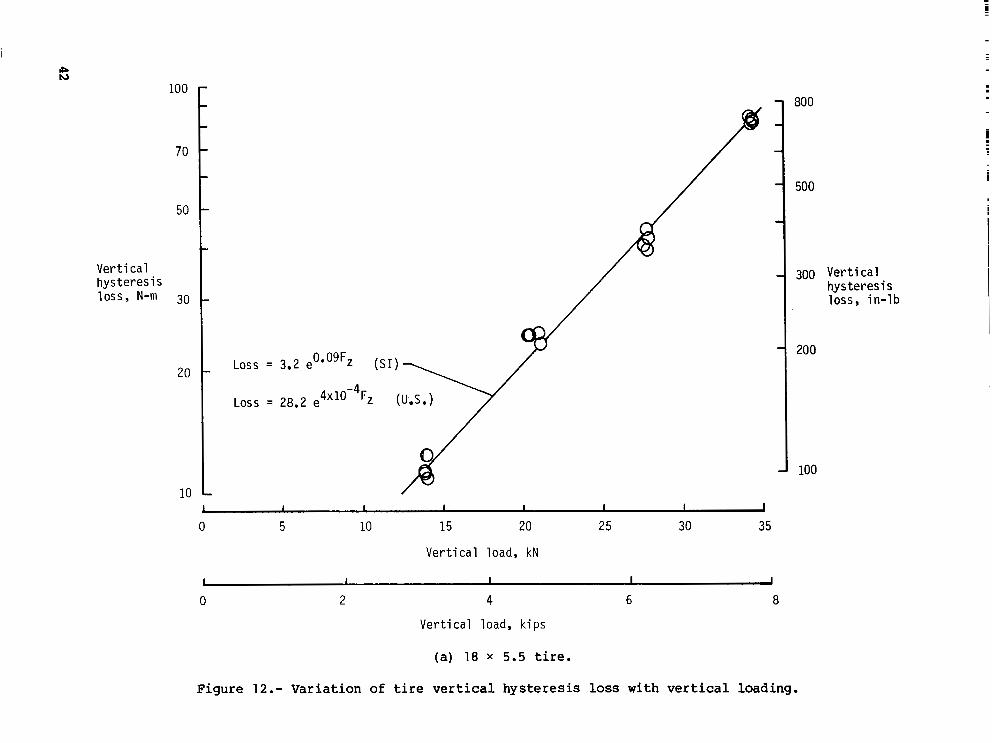
100
70
50
Vertical hys teres i s loss, N-rn 30
20
10 1 I I 1 I I I 1 0 5 10 15 20 25 30 35
Vertical load, kN
I I I I I
0 2 4 6 a Vertical load, kips
(a) 18 x 5 . 5 t i r e .
aoo
500
300 Vertical hysteresis loss, in-lb
200
100
Figure 12.- Variation of t i r e v e r t i c a l h y s t e r e s i s loss with vert ical loading.
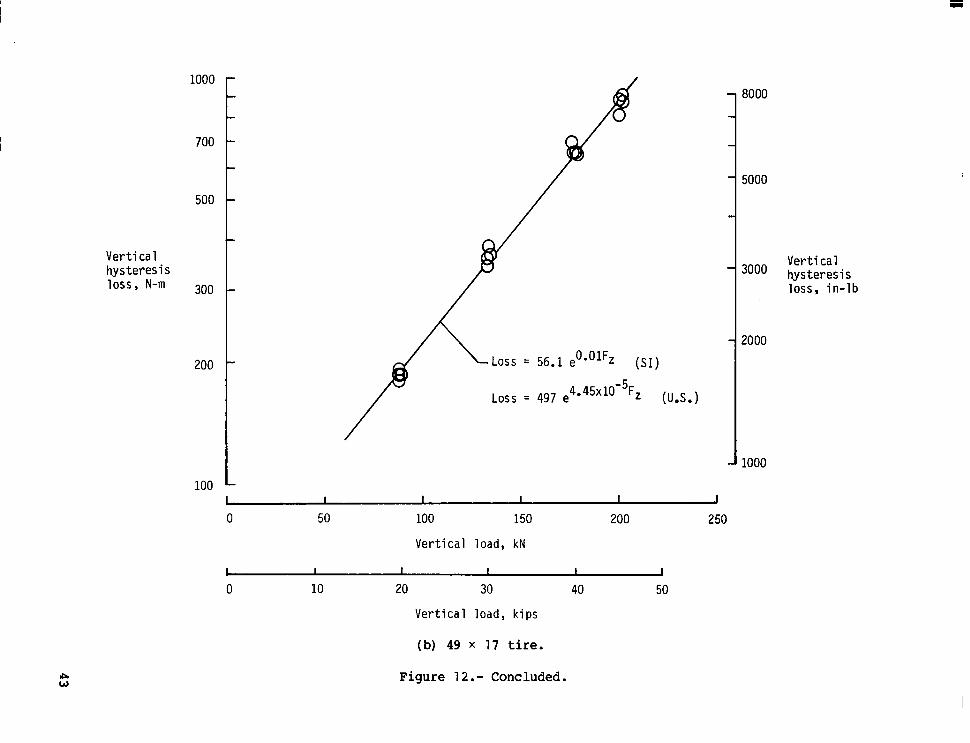
1000
700
500
Vertical hysteresis loss , N-m 300
200
100
0 50 100 150 200 250
Vertical load, kN
0 10 20 30 40 50
Vertical load, k i p s
(b) 49 x 17 t i r e .
Figure 12.- Concluded.
8000
5000
Vertical 3000 hvs teresi s
lbss, in-lb
2000
1000

24
20
16
Vertical hysteresis 12 r a t i o , %
8
4
0
X v u
0
I 1 1 . "-1 ~~~~ 1 I ~ ~- ~ ~ . ~ _ _
5 10 15 20 25 30 35
Vertical load, kN
(a) 18 x 5.5 t i r e .
Figure 13.- Variation of t i re ver t ical hysteresis ra t io w i t h vertical loading.
44

Vertical hysteresis ratio, %
24
20
16
12
8
4
0 40 80 120 160 ' 200 2 40 ~-
Vertical load, kN
0 10 20 30 40 50
Vertical load, k i p s
(b) 49 x 17 tire.
Figure 13.- Concluded.
45
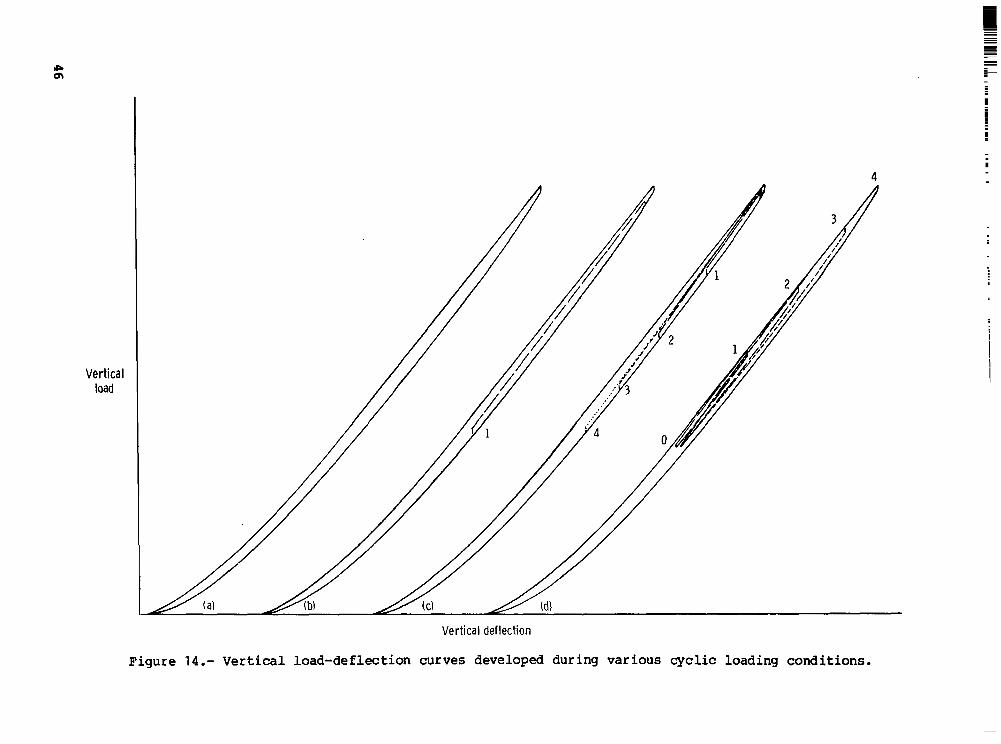
4
Vertical load
Vertical deflection
Figure 14.- Vertical load-deflection curves developed during various cyclic loading conditions.
I

I
I I I I
-6 - 4 2 4 6 La tera 1 def 1 ec t i on, cm
/ / -30 c
-50 L -2 -1 0 1 2
Lateral deflection, i n .
10
5
0 Fy, kips
-5
Figure 15.- Typical t i r e l a t e r a l load-deflection curve showing how l a t e r a l spr ing rates are acquired (49 x 17 t i r e ) .
47

60C
K kN/m 400 Y '
200
0
0 U
-s- Load appl ica t ion - &-In i t i a l load re l ie f
10 20 30
Vertical load, kN
0 2 4 6
__ 0
Vertical load, kips
40 l o
(a) 18 x 5.5 t i r e .
Figure 16.- Variation of t i re la teral spr ing ra tes w i t h vertical loading. Maximum l a t e r a l load = 30% F,.
48

1400
1200
1000
800
Ky. k N / m
600
400
200
0
6- Load a p p l i c a t i o n
-+- I n i t i a l l o a d r e l i e f
I " I ~ - = I I I I 40 80 120 160 200 240
V e r t i c a l l o a d , kN I" I I I
0 I
10 20 30 40 50
V e r t i c a l l o a d , k i p s
(b) 49 x 17 t i re .
F igure 16.- Concluded.
8000
6000
Ky, l b / i n .
4000
2000
0
49
PQ =
r P o = 2.45(0.87 - 6 / ~ )
-\ \
-s-- 18 X 5.5 ti re
-"- 49 X 17 t i r e
- - - - - - - - - - - - - - -Equat ion 33 , ref. 2
I I I 1 I I ~ -~
0 05 .10 ., 15 .20 .25 .30
S/W
Figure 17.- Variation of t i r e l a t e r a l - s t i f f n e s s parameter with v e r t i c a l d e f l e c t i o n .
50
La tera 1 hys teresi s loss, N-m
100
70
50
30
20 ,
-Loss = i!
L"23 - LJ.3.J c - \".d.,
10 t I I I I I I 0 2 4 6 a 10 12
Average lateral load, kN
0 .5 1.0 1.5 2.0 2.5
Average lateral load, k i p s
(a ) 18 x 5.5 t i r e .
51
120
100
70
50
Lateral hysteresis loss, N-m
30
20
10 L I I I 1 I I
0 10 20 30 40 50 60
Average lateral load, k N
1 I I I
0 2 I I
4 I
6 I
a 10 12 14
Average lateral load, k i p s
(b) 49 x 17 t i r e .
12 000
10 000
7 000
5 000
La tera 1 hysteresis loss, in-lb
3 000
2 000
1 000
F i g u r e 18.- Concluded.
52

60
50
40
La t e r a 1 h y s t e r e s i s 30 r a t i o , %
20
10
0
0
0
I I I I I I 2 4 6 8 10 12
La te ra l l oad , kN
.5 1.0 1.5 2.0 2.5
L a t e r a l l o a d , kips
(a) 18 x 5.5 t i r e .
Figure 19.- Variation of t i re la teral hysteresis ra t io w i t h l a t e ra l load. Lateral load = 30% F,.
53
50
40
Lateral hysteresis 30 ra t io , %
20
10
0 10 20 30 40 50 60 Lateral load, kN
1 I I & I I I I 0 2 4 6 8 10 12 14
Lateral 1 oad, kips
(b) 49 x 17 tire.
Figure 19.- Concluded.
54
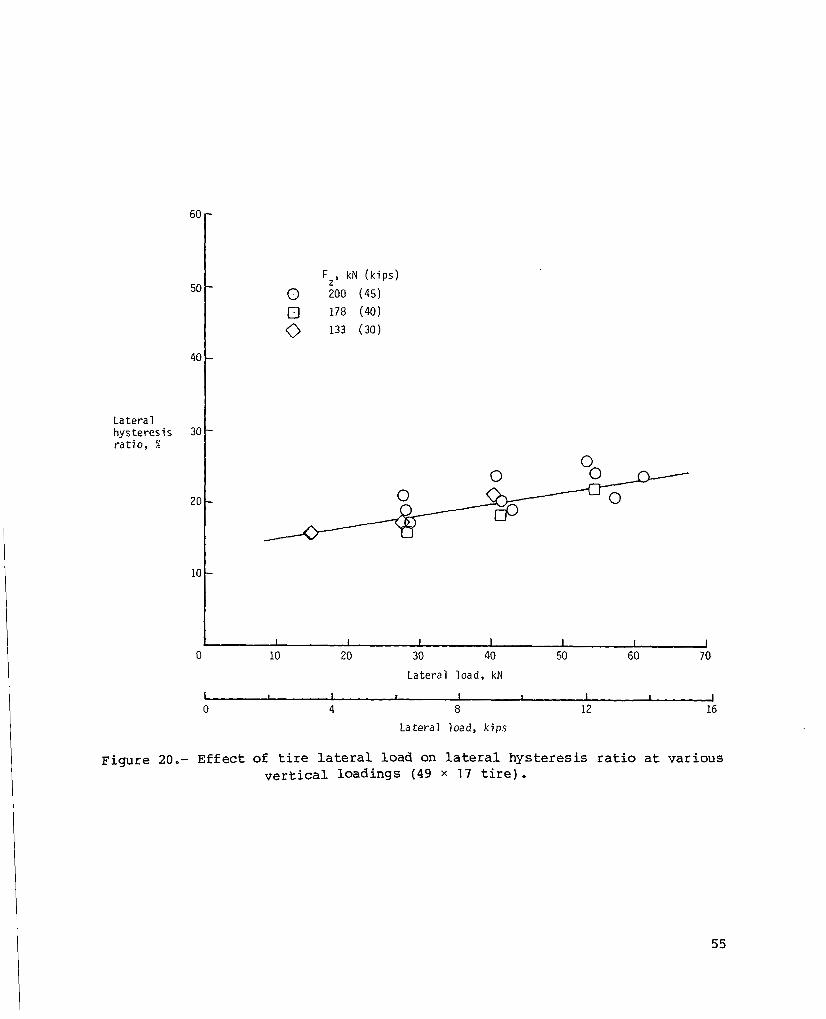
60
50
40
La te ra 1 hys te res i s 30 r a t i o , %
20
10
0 I I I I I I I
10 20 30 40 50 60 70
Lateral load, kN
1 I I f I I I I
0 4 a 12 16 I
Lateral load, k i p s
55
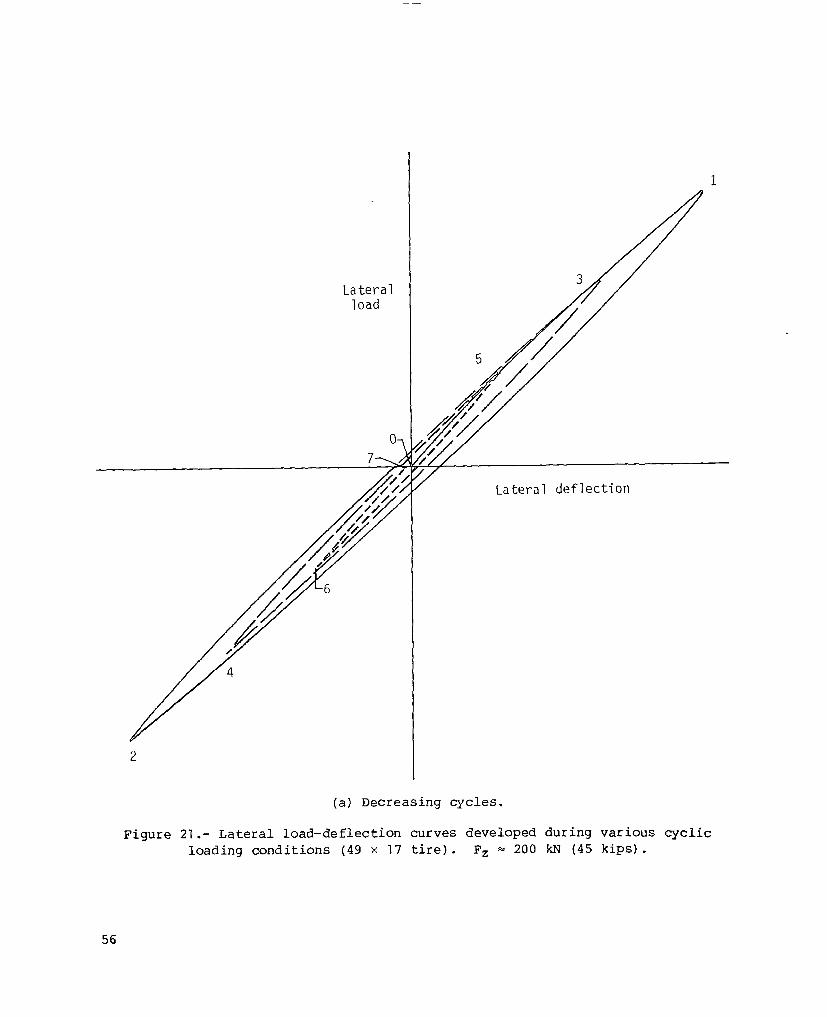
Lateral load
/ Lateral deflection
(a ) Decreasing cycles.
Figure 21.- Lateral load-deflection curves developed during various cyclic loading conditions ( 4 9 x 17 t i r e ) . F, = 200 kN (45 kips) .
56
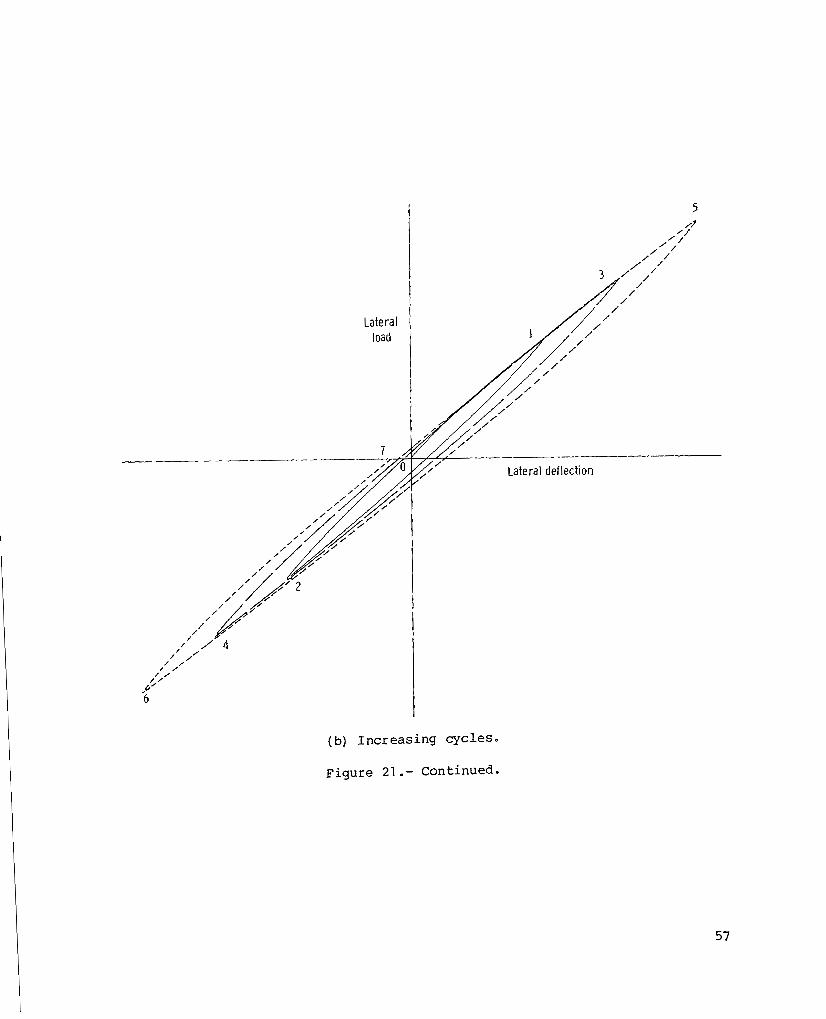
(b) I n c r e a s i n g cycles.
Figure 21 .- Continued.
57

Lateral load
6
(c) Random cyc le s .
Figure 21 Concluded.
58
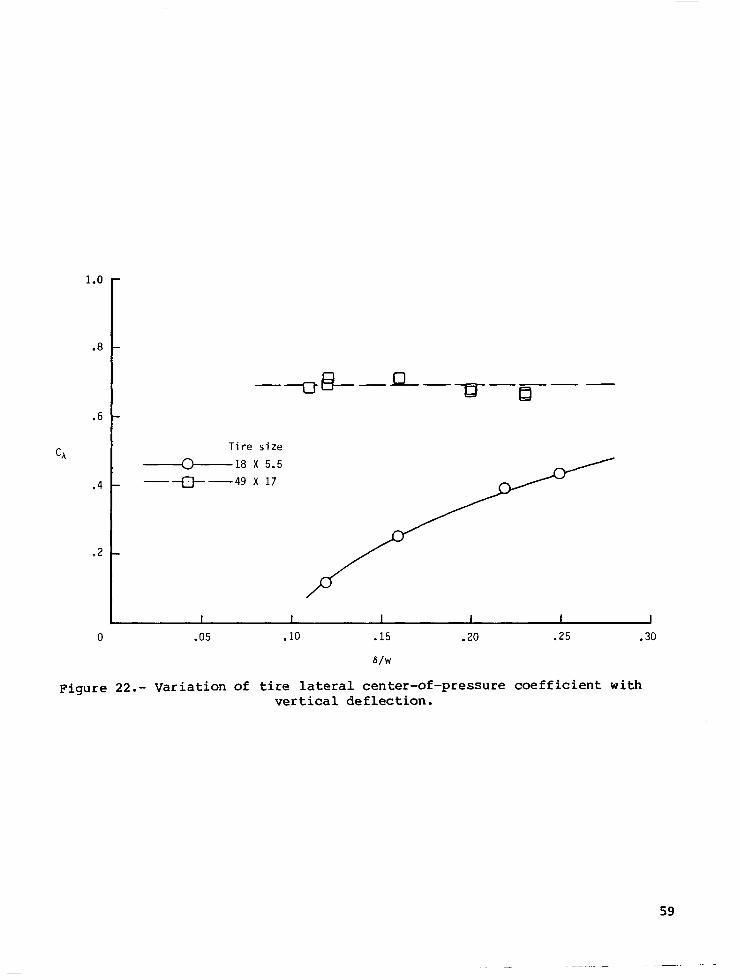
1.0
.8
.6
CA
.4
.2
0
"R" D- ~ " B "
Tire s i z e
-c-18 X 5.5 - e - 4 9 X 17
I I I I I I .05 .IO .15 .20 .25 .30
a/w

81
6(
e , deg 40
20
0
0 0 0 A
F z , kN ( k i p s ) F , kN ( k i p s ) I
13.7 (3.1) 4 ( .go) - ~1 20.2 (4.5) 6 (1.35)
28.0 (6.3) 8 (1.80)
1 -. u 0 .2 .4 - 6 .8 1,o 1.2
X , i n .
(a) 18 x 5.5 t i r e .
Figure 23 . - Lateral deformation of tire tread periphery under combined ver t ical and lateral loadings. Table deflection is a t 0 = 0.
60
0 0 0 A -
Fz, kN ( k i p s ) F , kN ( k i p s )
88 (19.8) 26 ( 5.9) 133 (29.8) 39 ( 8.8) 177 (39.7) 52 (11.7) 202 (45.4) 58 (13.2)
X , cm
I I I 1 I I I 0 .5 1.0 1.5 2.0 2.5 3.0
A , i n . (b) 49 x 17 tire.
Figure 23.- Concluded.
LS/W
2.t
1. E
1,c
c .i
\ b
T i r e s i z e n 18 X 5.5
-"- 49 X 17
\
% \
0 .05 .10 .15 .20 .25 .30
6 /W
Figure 24.- Variation of t i re s ta t ic re laxat ion length w i t h vertical deflection.
62
2.5
2.0
1.5
Ly/w
l o o
.5
0
0 0 0 D
+ = 1 2 O
0 B 0
D
D D
0 O d O 8 + = 15' P P, = 21O
$ = 18'
0 0 0
00 0
(a ) 18 x 5 . 5 t i r e .
Figure 25.- Variation of t i re yawed-ro l l ing re laxat ion l ength w i th ver t i ca l def lect ion for varying yaw angles .
63

Ly/w
2.5
2.0
1.5
1.0
.5
0
0 0 0
0
n
00 A "
D
U
\ n
e , = 1 2 O \ Ls/w ( f r o m f i g .
0 .05 .10 .15 .20 .25
8 / w
(b) 49 x 1 7 t i r e .
F igure 25.- Concluded.
.30
64

- V , k n o t s 0 5 F,, % R a t e d l o a d
(a ) 18 x 5.5 t i re . Rated load = 27.6 kN (6 .2 kips).
Figure 26.- Variation of tire side force w i t h vertical load and yaw angle over a range of ground speed.

100
8 0
6 0
4 0
2 0
0
V , k n o t s
5 0 75 100
F,, % R a t e d l o a d
1 2 0 x 1 0 3
15
1 0
5
0.
(b) 49 x 17 t i r e . Ra ted l oad = 76.1 kN (39.6 k i p s ) .
F igure 26.- Concluded.

I
1.0 -
.8
. 6
. 4
. 2
0
t 11
0 0
A 0
V , k n o t s 5
5 0 75 1 0 0
$=6
$=9 O
\ Q F,, % R a t e d l o a d
jJ=3 O
(a) 18 x 5.5 t i re . Rated load = 27.6 kN (6 .2 kips).
Figure 27.- Variation of t i r e side-force friction coefficient w i t h vertical load and yaw angle over a range of ground speed.

1.0
. 8
. 6
. 4
V , k n o t s
0 5 0 0 7 5
.d
25
0
(b) 49 x 17 t i r e . R a t e d l o a d = 176.1 kN (39.6 k ips ) .
Figure 27.- Concluded.

4 5 0
300
1 5 0
0
- 1 5 0
$=6 $=9 O
V , k n o t s
F,, % R a t e d l o a d
-
( a ) 18 x 5.5 t i r e . Rated load = 27.6 kN ( 6 . 2 k i p s ) .
I
Figure 28.- Var ia t ion of t i r e a l i gn ing t o rque wi th ve r t i ca l l oad and yaw angle Over a range of ground speed.

9
E I Z A
N - 6
L
a, 3 0- L 0 +,
3 m
7
a
0
- 1
8 0 ~ 1 0 ~
6 0
0
-10
(b) 49 x 17 t ire. Rated load = 176.1 (39.6 kips).
Figure 28 .- Concluded.

4
I E I Z
0
V , k n o t s F,, % R a t e d l o a d 0 5 0 5 0
A 100 0 75
(a) 18 x 5.5 t i re . Rated load = 27.6 kN (6.2 kips).
Figure 29.- Variation of t i r e overturning torque w i t h vertical load and yaw angle over a range of ground speed.
! i

6 0
4 0
2 0
0
F,, % R a t e d l o a d -
(b) 4 9 x 17 t i r e . Rated load = 176.1 kN (39.6 kips).
Figure 29.- Concluded.
4
9
6
3
0
-3
v 0 0
n 0
, k n o t s 5
50 75 100 n
$=9 O n
(a) 18 x 5.5 t i re . Rated load = 27.6 kN ( 6 . 2 kips).
2
1 .- L
CT
0
- 1
Figure 30.- Variation of tire friction-force moment arm wi th vertical load and yaw angle over a range of ground speed.
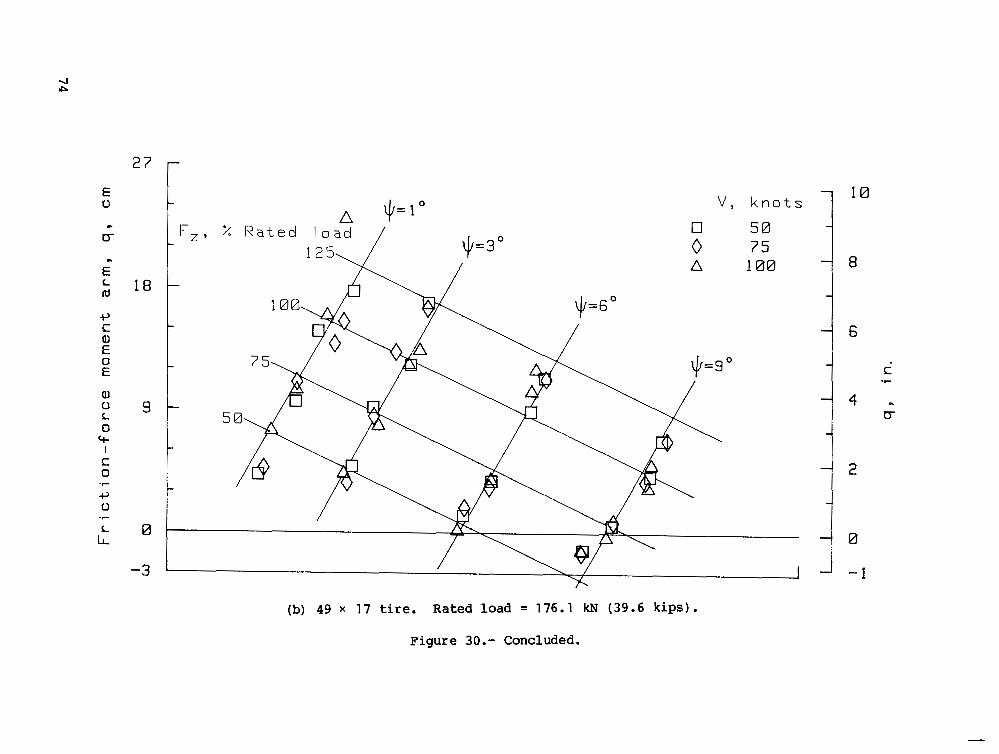
E 0
m.
E L Id
+, c al E 0 E
27 r
18
9
0
-3
(b) 49 x 17 t i r e . Rated load = 176.1 kN (39.6 k i p s ) .
Figure 30.- Concluded.
c .C
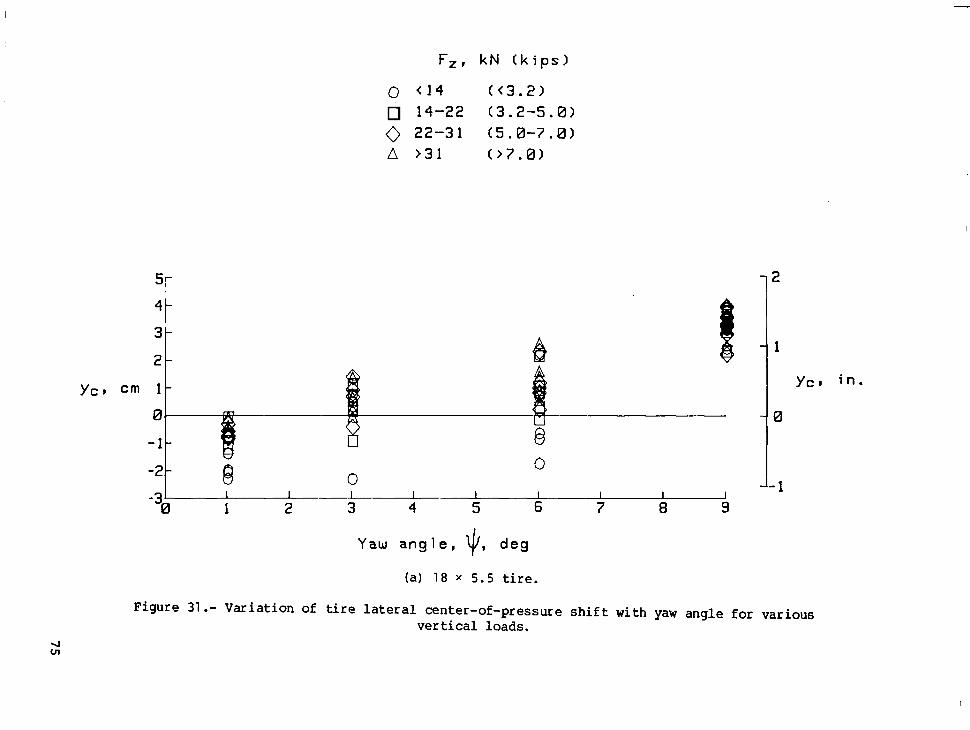
Fz, k N ( k i p s )
0 < 1 4 ((3.21 14-22 (3 .2 -5 .81
0 22-31 (5.8-7.8) A >31 (>7.0)
I
4
3
2
1
0
-1
-2 t 8 0 -31A
I I I I I I I I
1 2 3 4 5 6 7 8 9 I
Yaw a n g l e , $, deg
(a) 18 x 5 . 5 t i re .
Figure 31.- Variation of t i re l a te ra l center-of-pressure s h i f t w i t h yaw angle for various vertical loads.

F,, kN (kips)
0
0 (89 ( < 2 0 > CI 89-133 (20-30)
0 133-178 (30-48) A >I78 0 4 0 )
A
-T -2 0 0
-3&l I I I
1 2 3 4 5 6 7 8 9 I I I I I I
Yaw angle, 9, d e g
(b) 49 x 17 t i r e .
Figure 31 .- Concluded.

I 1. Report No.
4. Title and Subtitle
NASA TP-1863 2. Government Accession No.
STATIC AND YAh?ED-ROLLING MECHANICAL PROPERTIES OF TWO TYPE V I 1 AIRCRAET TIRES
7. Author(s1 John A. Tanner, Sandy M. Stubbs, and John L. McCarty
9. Performing Organization Name and Address NASA Langley Research Center Hampton, VA 23665
12. Sponsoring Agency Name and Address National Aeronautics and Space Administration Washington, DC 20546
-
15. Supplementary Notes
~
3. Recipient's C a t a l o g No. ~~ ~
5. Repon Date
May 1987 6. Performing Orcyniration Code 505-44-33-01
8. Performing Organization Report No. L-1 41 25
10. Work Unit No.
1 1 . Contract or Grant No.
13. Type of Report and Period Covered Technical Paper
14. Sponsoring Agency Code
16. Abstract
Selected mechanical properties of 1 8 x 5.5 and 49 x 17 size, type V I 1 a i rc raf t t i res were experimentally evaluated i n r e spnse ' t o a request by the Society of Automotive Engineers, Inc. The t i r e s were subjected to pure vertical loads and to combined ver t ical and l a t e ra l loads under both s t a t i c and rolling conditions. Parameters for the s t a t i c tests consisted of t i r e load i n the vertical and la teral d i rect ions, and parameters for the rol l ing tes ts included t i r e ve r t i ca l load, yaw angle, and ground speed. Effects of each of these parameters on the measured t ire characterist ics are discussed and, where possible, compared w i t h previous work. Results indicate that dynamic tire properties under investigation were generally insensitive to speed vari- ations and therefore tend t o support the conclusion that many t i r e dynamic character- i s t i c s can be obtained f r m s t a t i c and low-speed rol l ing tes ts . Furthermore, many of the t i r e mechanical properties are i n good agreement w i t h empirical predictions based on earlier research. Sufficient differences appear to exis t i n some properties to warrant additional research before extending the current empirical prediction proce- dures t o include a l l new t i r e designs.
17. Key Words (Suggested by Author(sJ J 18. Distribution Statement
Aircraf t t i res Tire mechanical properties High-speed cornering Hysteresis
Unclassified - Unlimited
I Subject Category 39 19. Security Classif. (of this report1 22. Price 21. No. of Pages 20. Security Classif. (of this page)
Unclassified A0 5 78 . Unclassified
For sale by the National Technical information Service, Springfield. Vlrglnla 22161
NASA-Lanpley, 1951