NASA Trapezoidal Wing Computations Including … Trapezoidal Wing Computations Including Transition...
50
NASA Trapezoidal Wing Computations Including Transition and Advanced Turbulence Modeling C. L. Rumsey and E. M. Lee-Rausch NASA Langley Research Center Computational AeroSciences Branch 30 th AIAA Applied Aerodynamics Conference, High Lift Special Session June 25-28, 2012, New Orleans
Transcript of NASA Trapezoidal Wing Computations Including … Trapezoidal Wing Computations Including Transition...

NASA Trapezoidal Wing Computations Including Transition
and Advanced Turbulence Modeling
C. L. Rumsey and E. M. Lee-Rausch NASA Langley Research Center
Computational AeroSciences Branch
30th AIAA Applied Aerodynamics Conference, High Lift Special Session June 25-28, 2012, New Orleans

Introduction
Prediction of high-lift flows is challenging
2

Introduction
Prediction of high-lift flows is challenging
3
Wing tip vortex

Two parts to this talk
• Brief summary of HiLiftPW-1
– Serves as an overview to the Special Sessions
• Rumsey/Lee-Rausch recent work on Trap Wing
– Corresponding to AIAA paper 2012-2843
4

Brief Summary of HiLiftPW-1

Timeline
6

Summary of HiLiftPW-1
• Held Summer 2010 • Open series of international High Lift Prediction
Workshops (HiLiftPW) • Long-term objectives of workshop series
– Assess current prediction capability – Develop modeling guidelines – Advance understanding of physics – Enhance CFD prediction capability for design and
optimization – Provide impartial forum – Identify areas needing additional research & development
• Looking for: overall collective results, trends, and outliers
7

NASA Trapezoidal Wing
• In Langley 14x22 ft Wind Tunnel
8

HiLiftPW-1 participant statistics
9
21 groups 39 entries 15 different CFD codes

HiLiftPW-1 test cases
• Focused on two configurations: – Config 1 (slat 30 flap 25)
– Config 8 (slat 30 flap 20)*
• Grid convergence studies
• Optional: effect of brackets
• All cases “free air”, fully turbulent
• Compared against 14x22 data corrected to free air conditions
10
*Note: Config 8 not discussed here; see J Aircraft 48(6):2068-2079, 2011

“Clean” vs. brackets
11

Typical result
12
Configuration 1, medium grid (no brackets)
Including brackets makes comparisons worse

Summary of all results
13
-In the collective, CFD tended to under-predict lift, drag, and moment magnitude -There were CFD outliers, especially at higher alphas
Configuration 1, medium grid (no brackets)

Summary of all results
14
-In the collective, CFD tended to under-predict lift, drag, and moment magnitude -There were CFD outliers, especially at higher alphas -Some problems at high alphas due to code sensitivity to initial conditions
Configuration 1, medium grid (no brackets)
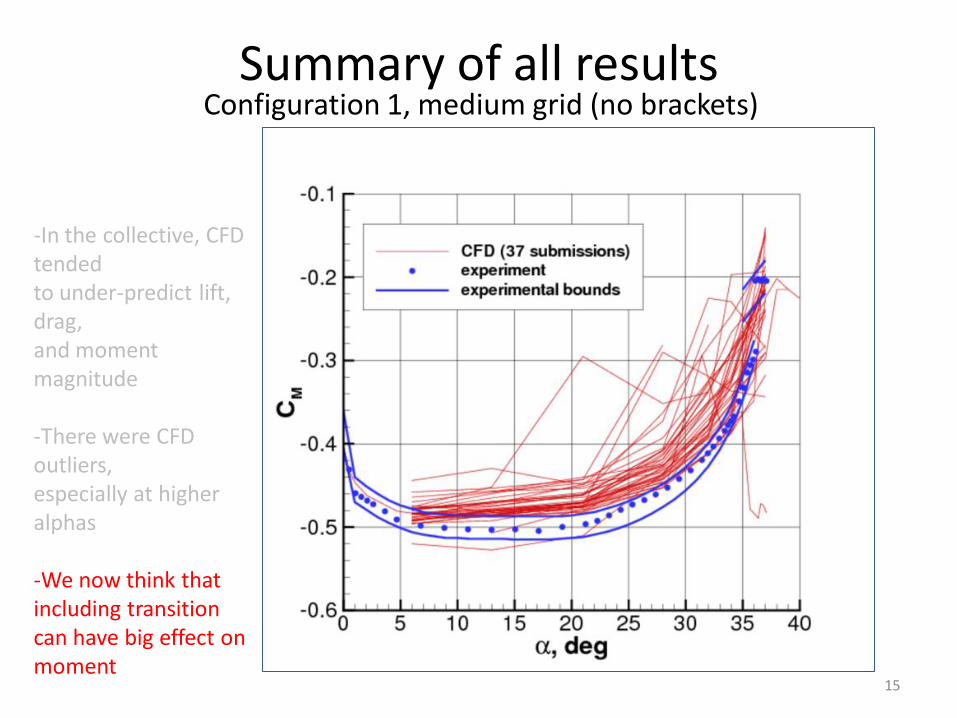
Summary of all results
15
-In the collective, CFD tended to under-predict lift, drag, and moment magnitude -There were CFD outliers, especially at higher alphas -We now think that including transition can have big effect on moment
Configuration 1, medium grid (no brackets)

Predictions near the wing tip
16
body
Flow direction
slat
flap
wing

Predictions near the wing tip
17
Alpha=280, configuration 1
Typical thin-layer N-S Typical full N-S

Statistical analysis
18
Coarse grid Medium grid Fine grid
Helpful to identify outliers

Statistical analysis
19
Coarse grid Medium grid Fine grid
Helpful to identify outliers
UT5 grid SST model (fully turbulent)

Statistical analysis
20
Coarse grid Medium grid Fine grid
Helpful to identify outliers
SST model (fully turbulent)
SST model (w transition)

Subsequent study at FOI
21
Including brackets and transition (SA model) From AIAA-2011-3009 (Eliasson et al)
Including transition increases lift and decreases moment (both in better agreement with experiment)

Some conclusions from Trap Wing studies to date
• Wing tip region difficult to predict – CFD codes have trouble agreeing with experiment
– CFD codes have trouble agreeing with each other
– Additional targeted grid refinement probably required
– Thin-layer assumption is particularly poor
• Refining grid typically increases lift
• Including brackets decreases lift
• Accounting for transition is particularly important – Increases lift, decreases moment
– Studies by Steed (ANSYS-CFX), Eliasson (FOI), Fares (Exa)
22

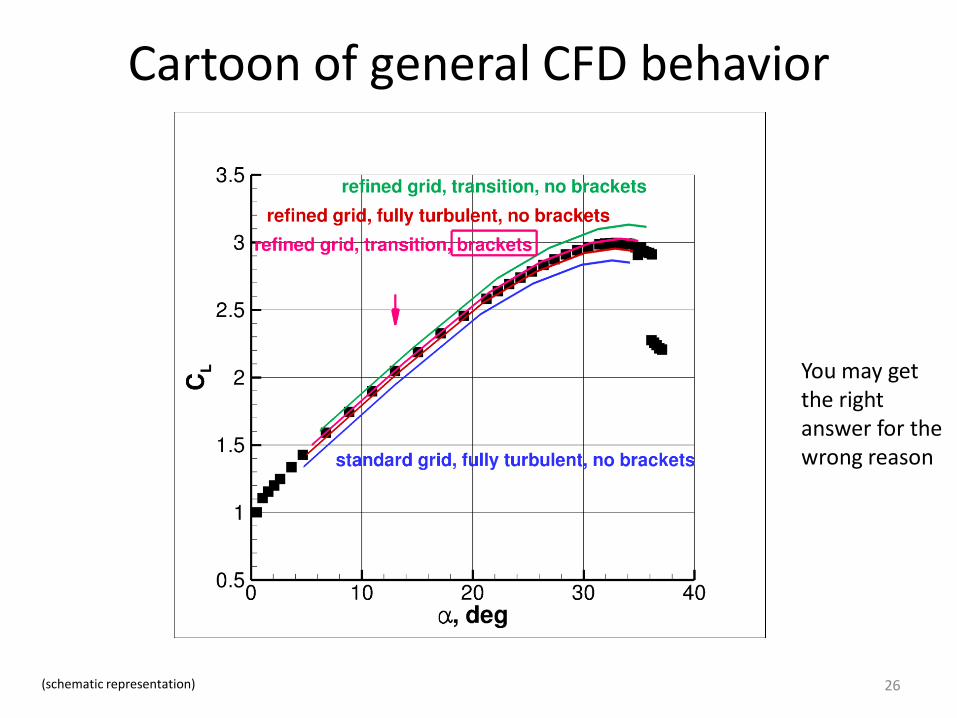
Cartoon of general CFD behavior
23 (schematic representation)

Cartoon of general CFD behavior
24 (schematic representation)

Cartoon of general CFD behavior
25 (schematic representation)
Cartoon of general CFD behavior
26 (schematic representation)
You may get the right answer for the wrong reason

Why Hold Special Sessions?
• Build on lessons learned from HiLiftPW-1
– Same Trap Wing configuration
– Is there more we can learn?
– Can we do better?
– Make use of new velocity probe information
• Provide forum for new groups to participate
– Many of presenters are new to HiLiftPW
27

NASA Trapezoidal Wing Computations Including Transition
and Advanced Turbulence Modeling
AIAA Paper 2012-2843

Current contribution
• Verification of transition influence
• Investigation of grid and model effect on wake velocity profile predictions
• Influence of turbulence model rotation and curvature corrections
29

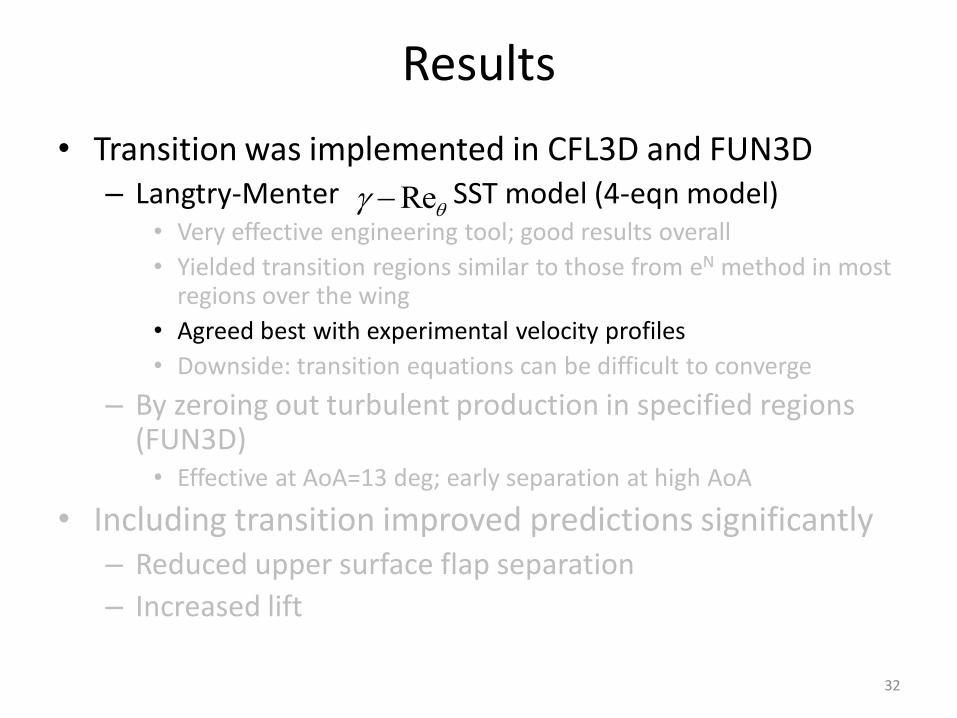
Results
• Transition was implemented in CFL3D and FUN3D – Langtry-Menter SST model (4-eqn model)
• Very effective engineering tool; good results overall
• Yielded transition regions similar to those from eN method in most regions over the wing
• Agreed best with experimental velocity profiles
• Downside: transition equations can be difficult to converge
– By zeroing out turbulent production in specified regions (FUN3D) • Effective at AoA=13 deg; early separation at high AoA
• Including transition improved predictions significantly – Reduced upper surface flap separation
– Increased lift
30
Re
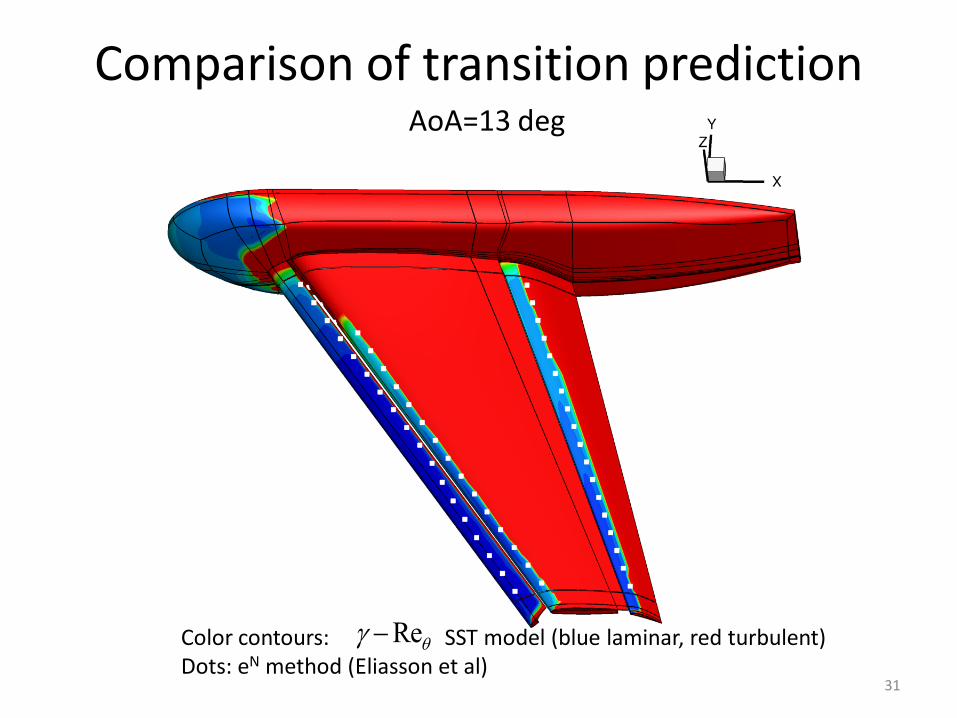
Comparison of transition prediction
31
AoA=13 deg
Color contours: SST model (blue laminar, red turbulent) Dots: eN method (Eliasson et al)
Re
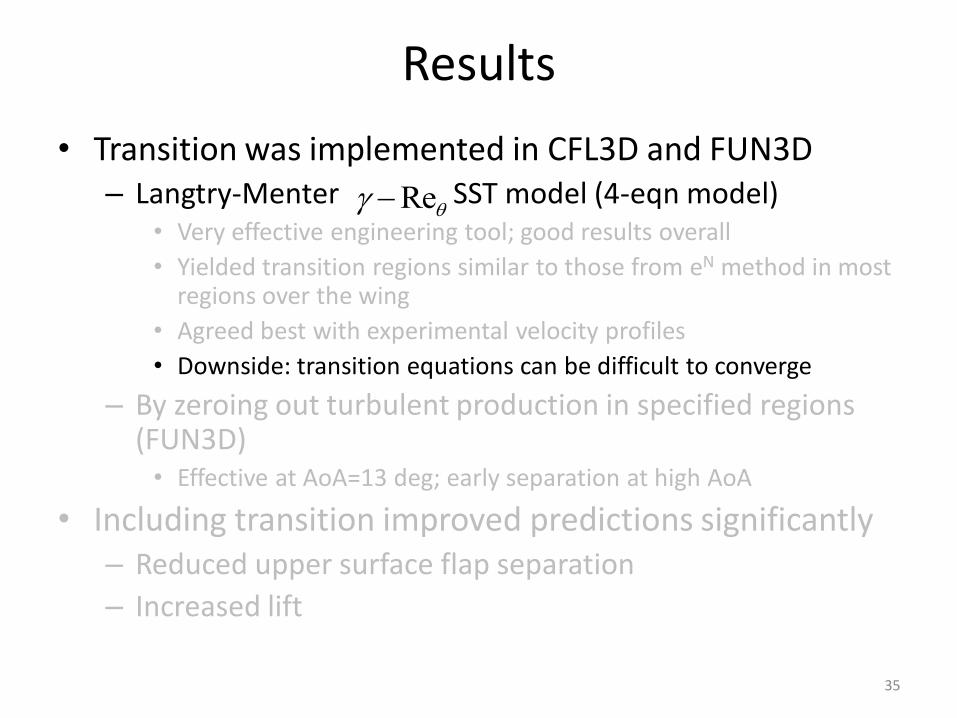
Results
• Transition was implemented in CFL3D and FUN3D – Langtry-Menter SST model (4-eqn model)
• Very effective engineering tool; good results overall
• Yielded transition regions similar to those from eN method in most regions over the wing
• Agreed best with experimental velocity profiles
• Downside: transition equations can be difficult to converge
– By zeroing out turbulent production in specified regions (FUN3D) • Effective at AoA=13 deg; early separation at high AoA
• Including transition improved predictions significantly – Reduced upper surface flap separation
– Increased lift
32
Re

Velocity profiles
33

Effect of transition on velocity profiles
34
AoA=28 deg, structured SX1/UX9 grid (no brackets)
Main element, 83% span Flap forward element, 83% span
Results
• Transition was implemented in CFL3D and FUN3D – Langtry-Menter SST model (4-eqn model)
• Very effective engineering tool; good results overall
• Yielded transition regions similar to those from eN method in most regions over the wing
• Agreed best with experimental velocity profiles
• Downside: transition equations can be difficult to converge
– By zeroing out turbulent production in specified regions (FUN3D) • Effective at AoA=13 deg; early separation at high AoA
• Including transition improved predictions significantly – Reduced upper surface flap separation
– Increased lift
35
Re

Results
• Transition was implemented in CFL3D and FUN3D – Langtry-Menter SST model (4-eqn model)
• Very effective engineering tool; good results overall
• Yielded transition regions similar to those from eN method in most regions over the wing
• Agreed best with experimental velocity profiles
• Downside: transition equations can be difficult to converge
– By zeroing out turbulent production in specified regions (FUN3D) • Effective at AoA=13 deg; early separation at high AoA
• Including transition improved predictions significantly – Reduced upper surface flap separation
– Increased lift
36

Results
• Transition was implemented in CFL3D and FUN3D – Langtry-Menter SST model (4-eqn model)
• Very effective engineering tool; good results overall
• Yielded transition regions similar to those from eN method in most regions over the wing
• Agreed best with experimental velocity profiles
• Downside: transition equations can be difficult to converge
– By zeroing out turbulent production in specified regions (FUN3D) • Effective at AoA=13 deg; early separation at high AoA
• Including transition improved predictions significantly – Reduced upper surface flap separation
– Increased lift, decreased moment
37

AoA=13 deg
38
Velocity contours near 85% span
Velocity contours near 85% span
u/U=1.9
0
ReSST SST
(no brackets)

39
CFL3D results (no brackets)
Lift and moment predictions

Results
• Grid resolution issues
– Unstructured grids mis-predicted wake profiles (too diffused)
– Automatic grid adaption would be helpful
• Rotation and curvature corrections in turbulence models helped
– Increased lift (reduced upper surface pressures)
– Improved resolution of wing tip vortex
40
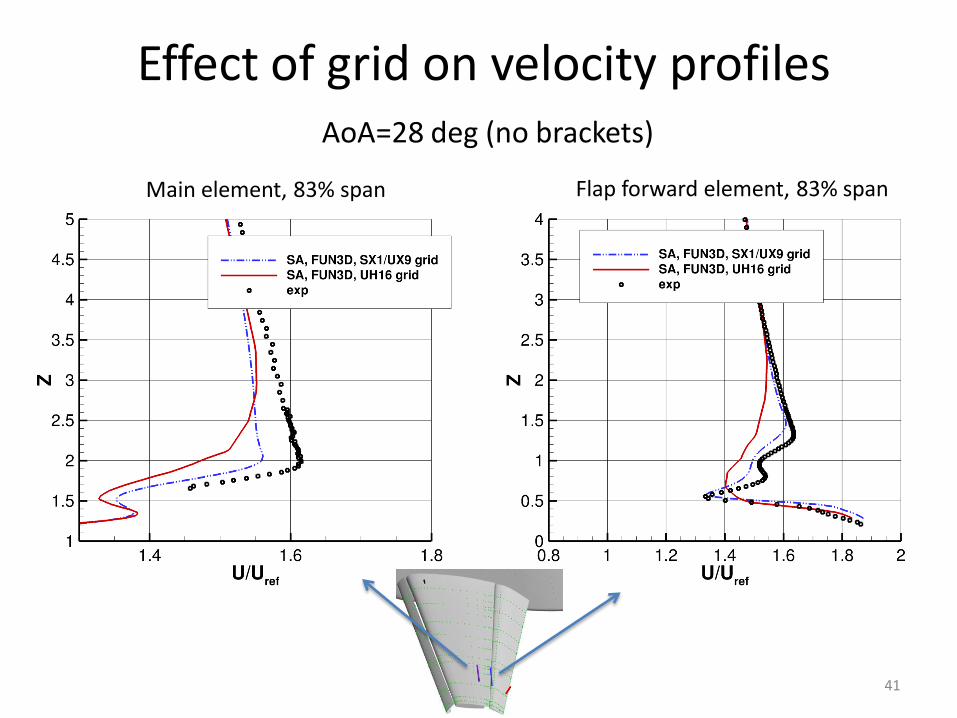
41
Main element, 83% span Flap forward element, 83% span
Effect of grid on velocity profiles AoA=28 deg (no brackets)

Comparison of grid section cuts
42
Better wake resolution
Structured grid SX1/UX9 Unstructured grid UH16
Near 85% span

43
Main element, 83% span Flap forward element, 83% span
Effect of brackets and transition on velocity profiles
AoA=28 deg, unstructured UH16 grid

Results
• Grid resolution issues
– Unstructured grids mis-predicted wake profiles (too diffused)
– Automatic grid adaption would be helpful
• Rotation and curvature corrections in turbulence models helped
– Increased lift (reduced upper surface pressures)
– Improved resolution of wing tip vortex
44

Rotation/curvature corrections
45
• Tested: SA-R, SA-RC, SST-RC, SST-RC • Example of effect of SA vs. SA-RC:
Re
AoA=13 deg (with brackets)

Rotation/curvature corrections
46
• Tested: SA-R, SA-RC, SST-RC, SST-RC • Example of effect of SA vs. SA-RC:
Re
Still getting poor predictions near the wing tip
AoA=13 deg (with brackets)
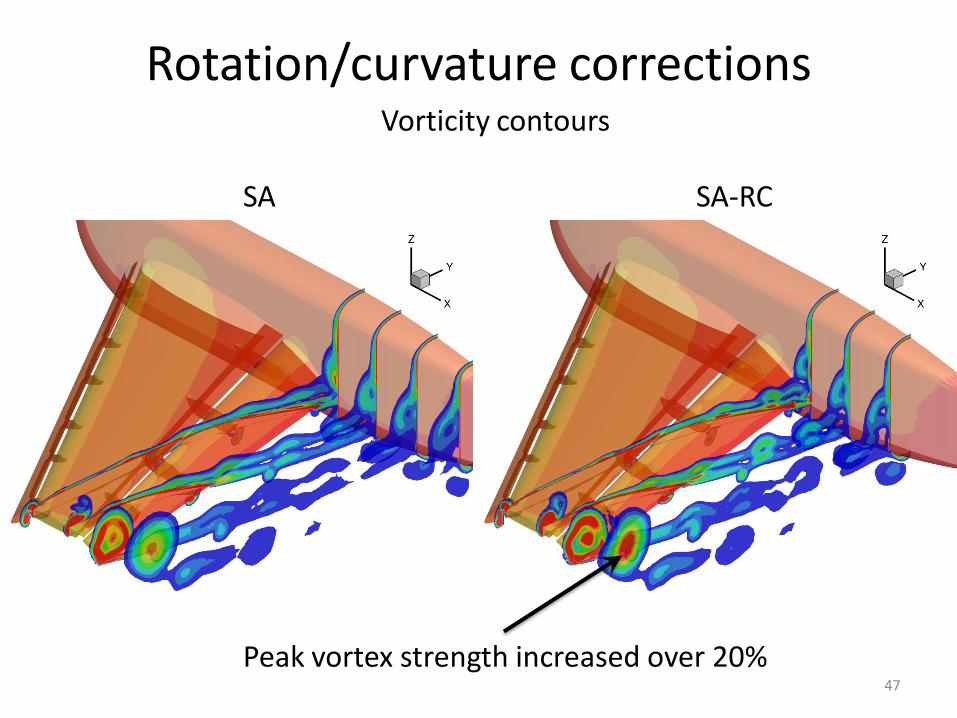
Rotation/curvature corrections
47
SA SA-RC
Peak vortex strength increased over 20%
Vorticity contours

Conclusions
• Brief summary of HiLiftPW-1 given • Brief summary of recent NASA LaRC results given • Predicting CL,max accurately for the “right” reasons is
still a challenge for CFD • Many pieces have influence:
– Transition – Turbulence modeling (e.g., RC effects) – Geometric fidelity (e.g., brackets) – Grid resolution, both global and local (e.g., tip vortex and
wake regions)
• Upcoming talks this session and tomorrow AM – Many Trap Wing studies: including transition, separation,
unsteady, adaptive, and uncertainty quantification
48
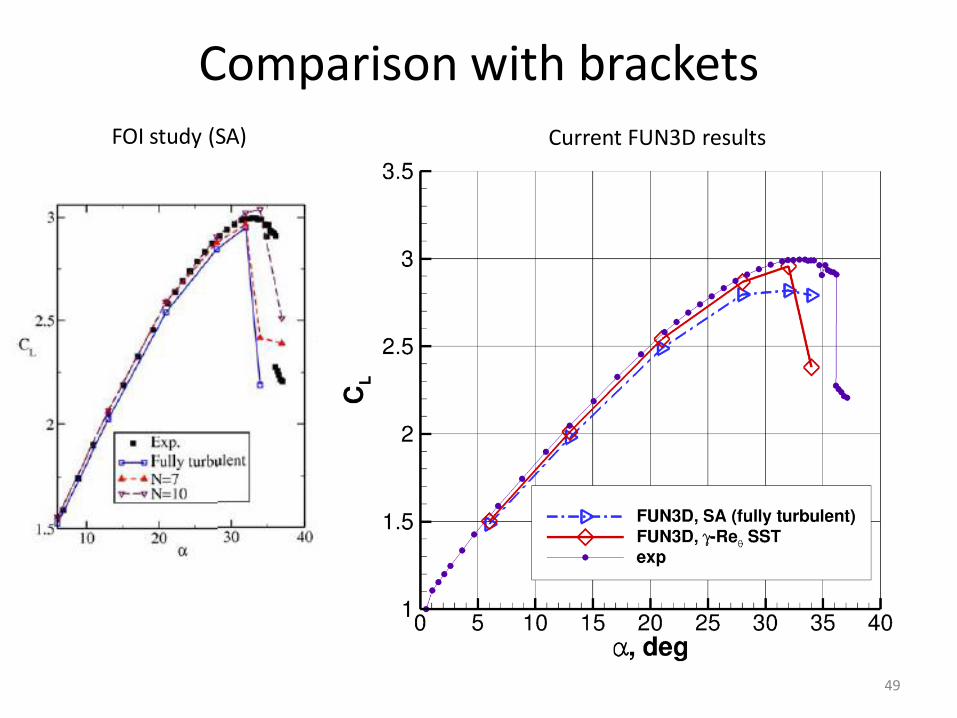
Comparison with brackets
49
FOI study (SA) Current FUN3D results

Conclusions
• Brief summary of HiLiftPW-1 given • Brief summary of recent NASA LaRC results given • Predicting CL,max accurately for the “right” reasons is
still a challenge for CFD • Many pieces have influence:
– Transition – Turbulence modeling (e.g., RC effects) – Geometric fidelity (e.g., brackets) – Grid resolution, both global and local (e.g., tip vortex and
wake regions)
• Upcoming talks this session and tomorrow AM – Many Trap Wing studies: including transition, separation,
unsteady, adaptive, and uncertainty quantification
50