NASA Technical micron pyrometers Angle iron _ _.__1. (b) Rectangular bar specimen _: tb 05 _ - 127...
52
NASA Technical Paper 3676 Army Research Laboratory Technical Report ARL-TR-1341 1997 National Aeronautics and Space Administration Office of Management Scientific and Technical Information Program Influence of High Cycle Thermal Loads on Thermal Fatigue Behavior of Thick Thermal Barrier Coatings Dongming Zhu and Robert A. Miller Lewis Research Center Cleveland, Ohio https://ntrs.nasa.gov/search.jsp?R=19970018102 2018-06-24T02:17:18+00:00Z
Transcript of NASA Technical micron pyrometers Angle iron _ _.__1. (b) Rectangular bar specimen _: tb 05 _ - 127...
NASATechnical
Paper3676
Army Research
Laboratory
Technical ReportARL-TR-1341
1997
National Aeronautics and
Space Administration
Office of Management
Scientific and Technical
Information Program
Influence of High Cycle Thermal Loads on
Thermal Fatigue Behavior of ThickThermal Barrier Coatings
Dongming Zhu and Robert A. MillerLewis Research Center
Cleveland, Ohio
https://ntrs.nasa.gov/search.jsp?R=19970018102 2018-06-24T02:17:18+00:00Z

INFLUENCE OF HIGH CYCLE THERMAL LOADS ON THERMAL
FATIGUE BEHAVIOR OF THICK THERMAL BARRIER COATINGS
Dongming Zhu t and Robert A. Miller
National Aeronautics and Space AdministrationLewis Research Center, Cleveland, OH 44135
ABSTRACT
Thick thermal barrier coating systems in a diesel engine experience severe thermal
low cycle fatigue (LCF) and high cycle fatigue (HCF) during engine operation. In the
present study, the mechanisms of fatigue crack initiation and propagation, as well as of
coating failure, under thermal loads which simulate engine conditions, are investigated
using a high power CO2 laser. In general, surface vertical cracks initiate early and grow
continuously under LCF and HCF cyclic stresses. It is found that in the absence of
interfacial oxidation, the failure associated with LCF is closely related to coating sintering
and creep at high temperatures, which induce tensile stresses in the coating after cooling.
Experiments show that the HCF cycles are very damaging to the coating systems. The
combined LCF and HCF tests produced more severe coating surface cracking,
microspallation and accelerated crack growth, as compared to the pure LCF test. It is
suggested that the HCF component cannot only accelerate the surface crack initiation, but
also interact with the LCF by contributing to the crack growth at high temperatures. The
increased LCF stress intensity at the crack tip due to the HCF component enhances the
subsequent LCF crack growth. Conversely, since a faster HCF crack growth rate will be
expected with lower effective compressive stresses in the coating, the LCF cycles also
facilitate the HCF crack growth at high temperatures by stress relaxation process. A surface
wedging model has been proposed to account for the HCF crack growth in the coating
system. This mechanism predicts that HCF damage effect increases with increasing
temperature swing, the thermal expansion coefficient and the elastic modulus of the
ceramic coating, as well as the HCF interacting depth. A good agreement has been found
between the analysis and experimental evidence.
t National Research Council -- NASA Research Associate at Lewis Research Center.
NASA TP-3676 1
INTRODUCTION
Ceramicthermalbarriercoatingshaveattractedincreasingattentionin heatengines
becauseof their ability toprovidethermalinsulationto enginecomponents.Theadvantages
of usingtheceramiccoatingsincludeapotentialincreasein engineoperatingtemperature
with eliminationof the water cooling systemanda longerservicelife in the harsh in-cylinderenvironment.ZrO2-basedceramicsarethe most important coating materials for
such applications because of their low thermal conductivity, relatively high thermal
expansivity and excellent mechanical properties. A typical thermal barrier coating system
consists of a top layer ZrO2-8%Y203 coating and an intermediate superalloy-type bond
coat and the alloy substrate. The application of advanced thick thermal barrier coatings
(TTBCs) for diesel engine components such as piston crowns and cylinder heads is
promising for increasing engine fuel efficiency, performance and reliability [1, 2]
However, durability of thick thermal barrier coatings under severe temperature
cycling conditions encountered in a diesel engine remains a major problem. In a diesel
engine, two types of thermal fatigue transients exist [1, 3, 41. The first transient type, which
is associated with the start/stop and no-load/full-load engine cycle, generates thermal low
cycle fatigue (LCF) in the coating system. The second transient type, which is associated
with the in-cylinder combustion process, generates a thermal high cycle fatigue (HCF). It
occurs at a frequency on the order of 10 Hz (i.e., 1000-2600 RPM). The HCF transient can
generate a temperature fluctuation of more than 200°C that will superimpose onto the
steady-state engine temperature at the coating surface [1, 3, 5] Therefore, the failure
mechanisms of thick thermal barrier coatings are expected to be quite different from those
of thin TBCs under these temperature transients. The coating failure is related not only to
thermal expansion mismatch and oxidation of the bond coats and substrates [2, 6, 7], but
also to the steep thermal stress gradients induced from the temperature distributions during
the thermal transients in the coating systems [1, 2, 7-10]
The development of advanced thick thermal barrier coatings requires a thorough
understanding of thermal fatigue behavior. Although it has been reported [8, 11] that stresses
generated by a thermal transient can initiate surface and interface cracks in a coating
system, the mechanisms of the crack propagation and of coating failure under the complex
LCF and HCF conditions are still not understood. Particularly, the understanding of surface
vertical crack propagation in thick thermal barrier coatings under thermal cyclic loading is
of great importance. Experimental evidence has shown all coating failure under severe
NASA TP-3676 2

thermal cycling conditions, produced either by a high heat flux burner rig or a high power
laser, is more or less associated with surface vertical cracks [7, 121. These vertical surface
cracks and sometimes through-thickness-cracks can facilitate the interracial crack
formation, eventually resulting in the coating delamination and spallation. In addition, the
interaction between LCF and HCF cycles, and the impact of relative amplitude of the LCF
and HCF transients on coating fatigue life are among the most important aspects in
understanding the thermal fatigue behavior of the coating systems. In this paper, thermal
fatigue behavior of an yttria partially stabilized zirconia coating system under simulated
LCF and HCF engine conditions is investigated. The effects of LCF and HCF parameters
on surface fatigue crack initiation and propagation in the coating are also discussed.
EXPERIMENTAL MATERIALS AND METHODS
Materials and Specimen Preparation
ZRO2-8 wt % Y203 ceramic coating and Fe-25Cr-5A1-0.5Y bond coat were
plasma-sprayed onto 4140 and 1020 steel substrates using an ABB ASEA IFB2000 6-axis
industrial robot. The plasma spray conditions used for both the ceramic coating and bond
coat are listed in Table 1. The sample substrate configurations were rectangular bar, as well
as angle iron which provided a corner shape for the coating. The specimen dimensions are
illustrated in Figure 1. The thickness of the ceramic coating was about 1.5-1.6 mm. The
bond coat thicknesses were 0.28 mm and 0.5 mm for the angle iron specimens and the
rectangular flat specimens, respectively.
Table 1 Plasma spray parameters for ZrO2-8wt%Y203 to
Coatingsmaterials
FeCrA1YPRAX-
AIR
FE213
44-74 gm
ZrO 2-
8%Y203
ZIRCOA9507/46
44-74 gm
Torch
power
KW
35
(9mBplasma
torch, GH
nozzle)
40
(9mBplasma
torch, GHnozzle)
Plasma
gas flowrate
Standardliter/min.
Ar: 56.6
N2:9.4
At: 14.2
N2:7.1
Carrier
gas flow
Standardliter/min.
Ar: 8.3
Ar: 3.2
Spraydistance
mm
127
101.6
Feed
rate
g/min.
68
20
coat and FeCrA1Y bond coat
Torchtranslation
ratemm/s
1300
Air
coolingcondition
Psi
50
501000
Substrate
temperature
°C
250
250
NASA TP-3676 3
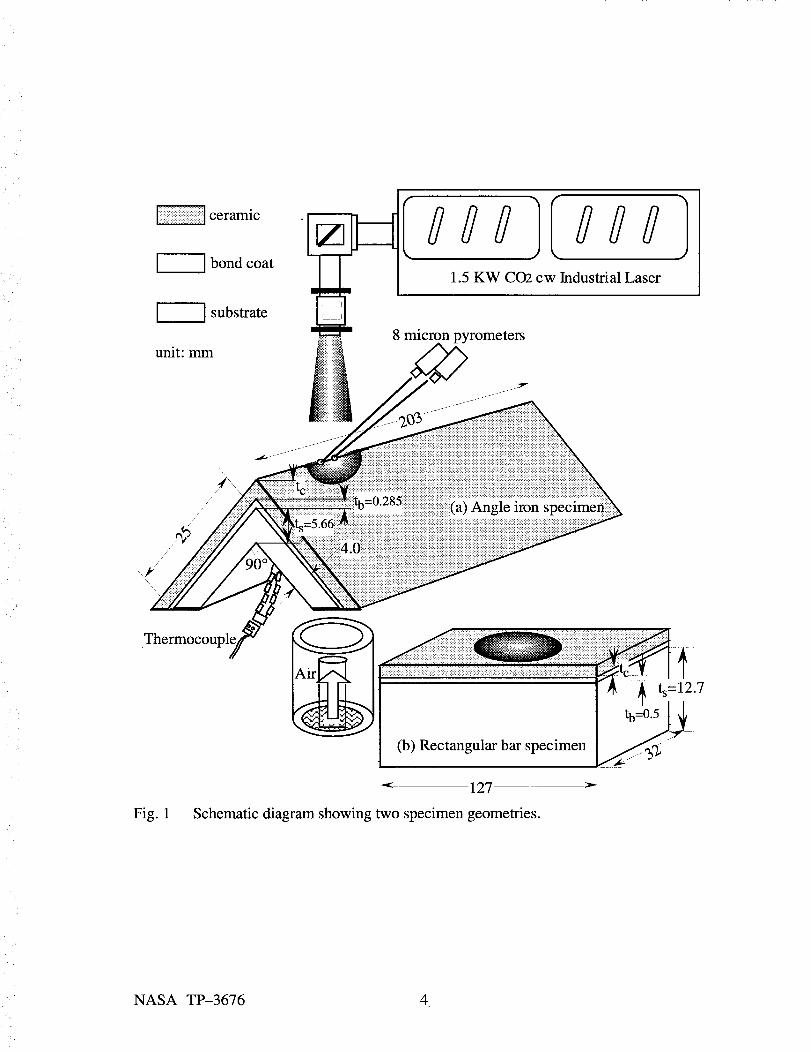
Fig. 1
ceramic
-----] substrate
unit: mm
1.5 KW CO2 cw Industrial Laser
8 micron pyrometers
Angle iron
_ _.__1. (b) Rectangular bar specimen _: -tb 05 _
127
Schematic diagram showing two specimen geometries.
NASA TP-3676 4

Low CycleandHigh CycleFatigueTests
Low cycle andhigh cycle fatiguetestsundersimulatedenginetemperatureandstressconditionswere conductedusinga high power 1.5 KW COe laser(EVERLASE,
CoherentGeneralInc.,Massachusetts).This testrig wascontrolledby aPC programmed
to simulatedifferentLCF andHCFtemperaturecycles.In thisstudy,theHCF combustion
cyclesweresimulatedusingthepulsedlasermode.Thelaserpulseperiodandpulsewidth
weresetat92and9 milliseconds(ms) respectively,with effectivesquarewaveequivalent
pulse heatingtime about6 ms. The total beampower in the pulsed mode was set to
approximately180W.Thelaserpulseinputwaveform,measuredby anoscilloscope(THS
720 Tekscopewith frequency100MHz anddataacquisitionrate 500 Meg samples/sec.,
Tektronix,Oregon),is shownin Figure2.
Laserpulsewaveform2500.0 i
2000.0
1500.0
o 1000.0
500.0
0 • 0 ...... _ _ I _ , _ , I
0.0 100.0 300.0 400.0
Time, ms
I
i , I i
200.0
- 10.0
- 8.0
- 6.0
- 4.0
- 2.0
, , 0.0
500.0
o>.
Fig. 2 Laser pulse waveform recorded from the laser pulse signal by THS 720
Tekscope.
The laser power density for an idealized spherical Gaussian beam is related to laser
total power P and beam radius w by the following relation [13, 14]
I(r)=loexp(-_3=_2 expl-- 'v--2)(1)
NASA TP-3676 5

where I0 is laser power density at the center, r is the distance from the center. The beam
radius w has been defined as the distance at which the laser power density has dropped to
1/e 2 of ._.tsvalue at the center. In this study, in order to produce a lower power density
suitable for simulating diesel engine conditions, and also to cover a larger test specimen
area, a Piano Concave ZeSe lens with focal length -330 mm was used to expand the laser
beam. With the specimen being placed at a distance 460 mm from the magnifying lens, the
beam radius w was increased from 7 mm to about 16 mm, as determined from laser burn
patterns. Laser power density distributions under the test conditions are shown in Figure 3.
Expanded beam, pulse mode--_--- Expanded beam, CW mode
......... Raw beam, pulse mode
¢-q
6.0 f .... I .... I .... t .... :l' .... I .... I .... t .... 25.0
-30 30
5.0
x_ 4.0
©
= 3.0
©
2.0
"_ 1.0
0
20.0 I
]5.0
10.0r_
'x35.0
©
0
0.0 0.0
-40 -20 -10 0 10 20 40
Distance from center, mm
Fig. 3 Laser power density distributions estimated from the measured laser waveform
and total power output. Minor beam non-uniformity observed is neglected.
During the thermal fatigue testing, specimen surface temperatures were measured
by two 8 micron infrared Pyrometers (Model MX-M803 Maxline Infrared Thermometer
Measurement and Control System, Ircon, Inc., Illinois), aimed at the beam center (giving
the peak temperature) and 7 mm away from the center, as shown in Figure 1. The backside
metal temperature was determined by an R-type thermocouple. For the combined LCF and
HCF tests, the pulsed laser mode was used to generate the heating and cooling cycles, and
the total power output was 180W. Two sets of experiments were conducted for angle iron
specimens, with heating/cooling cycle times set at 30/5 and 5/3 minutes respectively.
Because the high energy laser pulse was used, an HCF component was inherently
NASA TP-3676 6
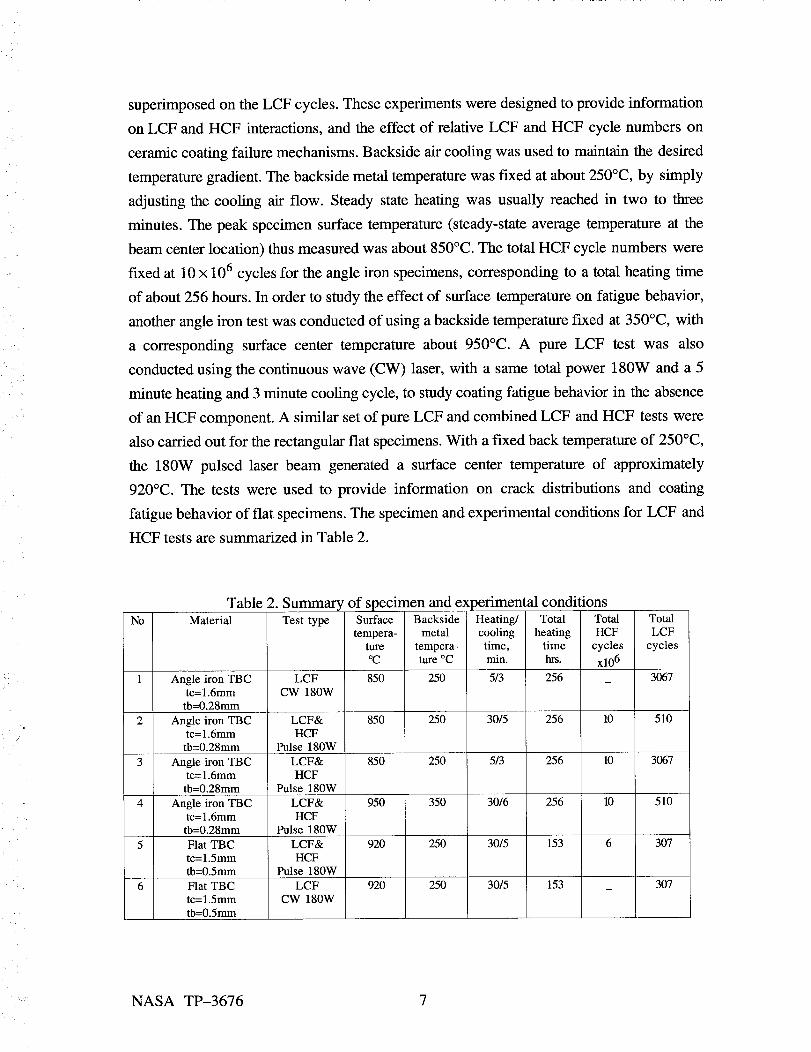
superimposedon theLCF cycles.Theseexperimentsweredesignedto provideinformationonLCF andHCF interactions,andthe effectof relativeLCF andHCF cyclenumberson
ceramiccoatingfailuremechanisms.Backsideair coolingwasusedto maintainthedesired
temperaturegradient.Thebacksidemetaltemperaturewasfixed atabout250°C,by simply
adjustingthecooling air flow. Steadystateheatingwas usually reachedin two to three
minutes.Thepeakspecimensurfacetemperature(steady-stateaveragetemperatureat the
beamcenterlocation)thusmeasuredwasabout850°C.ThetotalHCFcyclenumberswere
fixedat 10x 106cyclesfor theangleiron specimens,correspondingto atotalheatingtime
of about256hours.In orderto studytheeffectof surfacetemperatureon fatiguebehavior,
anotherangleiron testwasconductedof usingabacksidetemperaturefixed at 350°C,with
a correspondingsurfacecenter temperatureabout 950°C. A pure LCF test was also
conductedusingthecontinuouswave(CW) laser,with a sametotalpower 180Wand a5
minuteheatingand3minutecoolingcycle,to studycoatingfatiguebehaviorin the absence
of anHCFcomponent.A similar setof pureLCF andcombinedLCF andHCF testswere
alsocarriedout for therectangularflat specimens.With afixedbacktemperatureof 250°C,
tile 180Wpulsed laser beam generateda surfacecenter temperatureof approximately
920°C. The testswere usedto provide information on crack distributionsand coating
fatiguebehaviorof flat specimens.Thespecimenandexperimentalconditionsfor LCF andHCFtestsaresummarizedin Table2.
No
Table 2. Summary of specimen and exMaterial Test type Surface Backside
tempera-ture
oC
metal
tempera-ture °C
Angle iron TBC LCF 850 250tc=l.6mm CW 180W
tb=0.28mm
Angle iron TBC LCF& 850 250 30/5tc= 1.6mm HCF
tb=0.28mm Pulse 180W
850 250 5/3LCF&
HCF
Pulse 180W
LCF&
HCF
Pulse 180W
Angle iron TBCtc=l.6mm
tb=0.28mm
950Angle iron TBCtc= 1.6mm
tb=0.28mm
350
)erimental conditions
Heating/ Total Total Total
cooling heating HCF LCF
time, time cycles cycles
min. hrs. xl06
5/3 256 3067
510
3067
256 10
256 10
30/6 256 10 510
Flat TBC LCF& 920 250 30/5
tc=l.5mm HCF
tb=0.5mm Pulse 180W
Flat TBC LCF 920 250 30/5
tc=l.5mm CW 180W
tb=0.5mm
153 6 307
153 307
: NASA TP-3676 7
Since the pyrometer has a slower response time (> 25 ms) compared to the actual
laser pulse width (6 ms), the temperature swing generated by the pulsed laser on the
ceramic surface could not be recorded. Therefore, one dimensional finite difference
analysis has been used to model the thermal HCF temperature profile, providing the
important thermal parameters such as the temperature fluctuation AT and interaction depth
on the ceramic surface under the given test conditions.
Microscopic Examinations
The tested coating surfaces and cross-sections were examined under both optical
and electron scanning microscopes to obtain information on crack density and distribution,
as well as crack surface morphology. To prevent damage by specimen cross-section
preparation, a pressurized epoxy infiltration method for specimen mounting was used. By
this technique, epoxy was first poured over the specimens and their holding cups in a
vacuum chamber. After the epoxy degassing in vacuum, the specimens were moved into a
pressurized chamber (up to 1200 Psi) for 24 hours, as the epoxy cured. Therefore, the
epoxy filled the cracks in the specimen, and the original crack characteristics generated in
thermal fatigue tests were preserved.
EXPERIMENTAL RESULTS
Temperature Cycles Induced by Laser Beam Heating
Figure 4 shows typical temperature cycles of laser thermal fatigue tests. The steady
states were reached during the first few minutes of the cycling. It may be noticed that under
the combined LCF and HCF conditions, even though the pyrometer could not accurately
read the temperature fluctuations of the HCF component because of its slow response time,
large variations in recorded temperatures were still observed during laser heating. In
contrast, the continuous wave laser test simulating the pure LCF condition showed very
little temperature fluctuation. This suggests that regardless of the similar steady state
average temperature profiles produced by the pulsed laser beam and the CW laser beam,
the pulsed laser beam heating induced a severe surface temperature swing which was
superimposed onto the steady state temperature.
Because of an expanded near-Gaussian laser beam used, temperature distributions
are expected to vary across the beam diameter. This was confirmed by experiments, as
shown in Figure 4. The average temperature reading from the pyrometer aimed at a point
NASA TP-3676 8.
7 mm away from the center is 250°C lower than that from the pyrometer aimed at the
center for the angle iron specimens. Even higher temperature differences were observed for
the flat specimens. This Gaussian beam profile, in principle, can provide additional
information on coating failure mechanisms with heat flux distributions, establishing a
relationship between the coating damage and the test parameters, such as the average
surface temperature and temperature swing from a set of experiments.
Temperature and Thermal Stress Distributions
Figure 5 shows the calculated temperature distributions (with a simplified one-
dimensional configuration) across the thermal barrier coating system on an angle iron
during the steady state heating under various heat fluxes. Because of the constraints
imposed by the angle iron structure, specimen bending was not likely to occur. Therefore,
the in-plane stress distributions in the system at the steady state during the first heat up
could be calculated from the mechanical equilibrium and strain compatibility conditions.
The results are shown in Figure 6. The material properties used in the calculations are listed
in Table 3. It should be noted that the overall stress is the summation of the thermal stress
and residual stress in the system. As will be discussed later, for longer heating times,
ceramic sintering and creep will become significant, thus modifying the stress states in the
coating system.
When pulsed laser heating is used, a severe thermal transient will be induced even
in the absence of LCF cycling. This temperature fluctuation and history under the HCF
conditions were modeled by the one dimensional finite difference approach. In order to
verify the validity of this model under the present laser beam conditions, the one
dimensional finite difference analysis method was compared with analytical solutions for
both a uniform, constant irradiance model and a Gaussian beam model in calculating the
surface temperature swing [12]. The temperature swing predicted by all three approaches
was essentially the same, implying that the Gaussian beam is sufficiently widespread to
allow the use of the one-dimensional assumption. The modeled results indicate that the
HCF transient occurs only at the surface layer of the ceramic coating. This layer may be
defined as the HCF interaction depth at which appreciable temperature fluctuation (20°C or
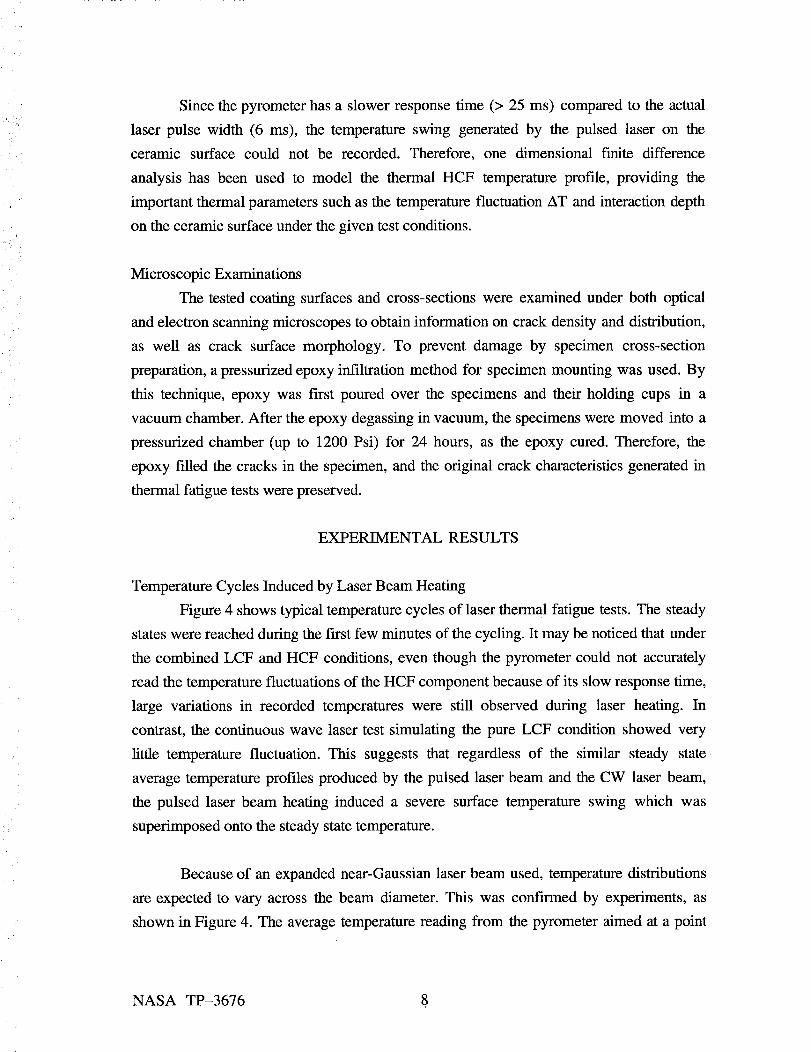
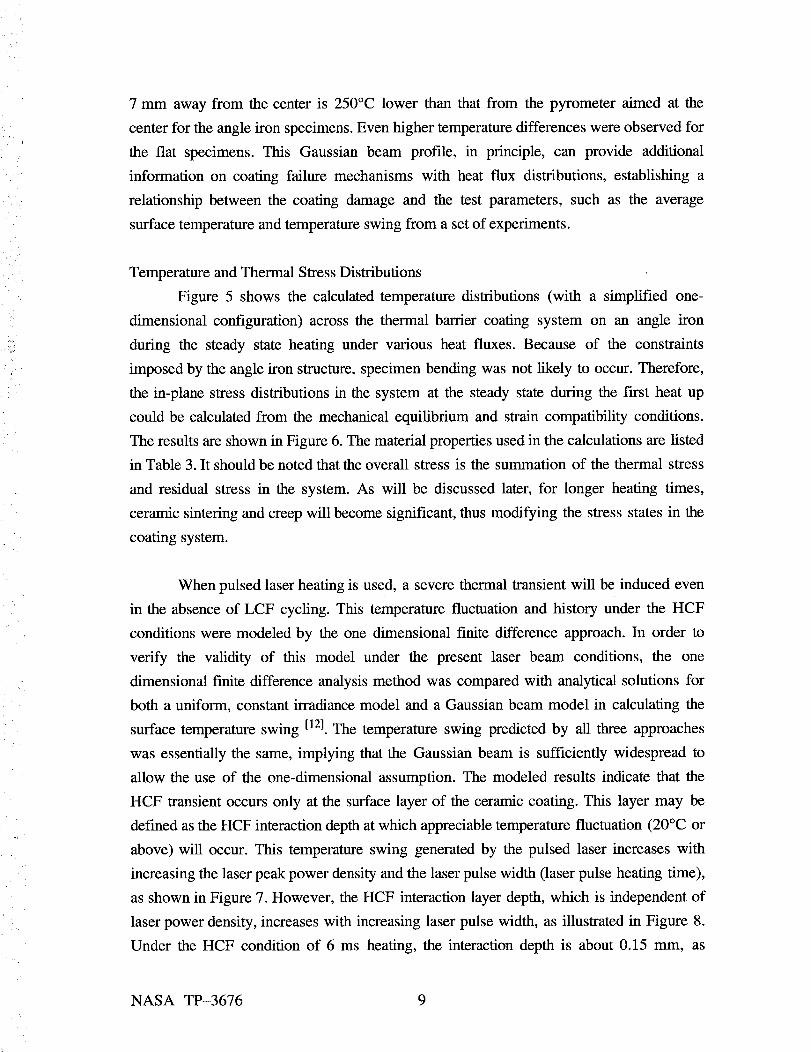
above) will occur. This temperature swing generated by the pulsed laser increases with
increasing the laser peak power density and the laser pulse width (laser pulse heating time),
as shown in Figure 7. However, the HCF interaction layer depth, which is independent of
laser power density, increases with increasing laser pulse width, as illustrated in Figure 8.
Under the HCF condition of 6 ms heating, the interaction depth is about 0.15 mm, as
NASA TP-3676 9

calculated by the finite difference method. The HCF component, therefore, is generated
only on the very surface of the ceramic coating. However, the effect of HCF on thermal
fatigue is more complex and will extend far beyond this characteristic depth, as will be
discussed later.
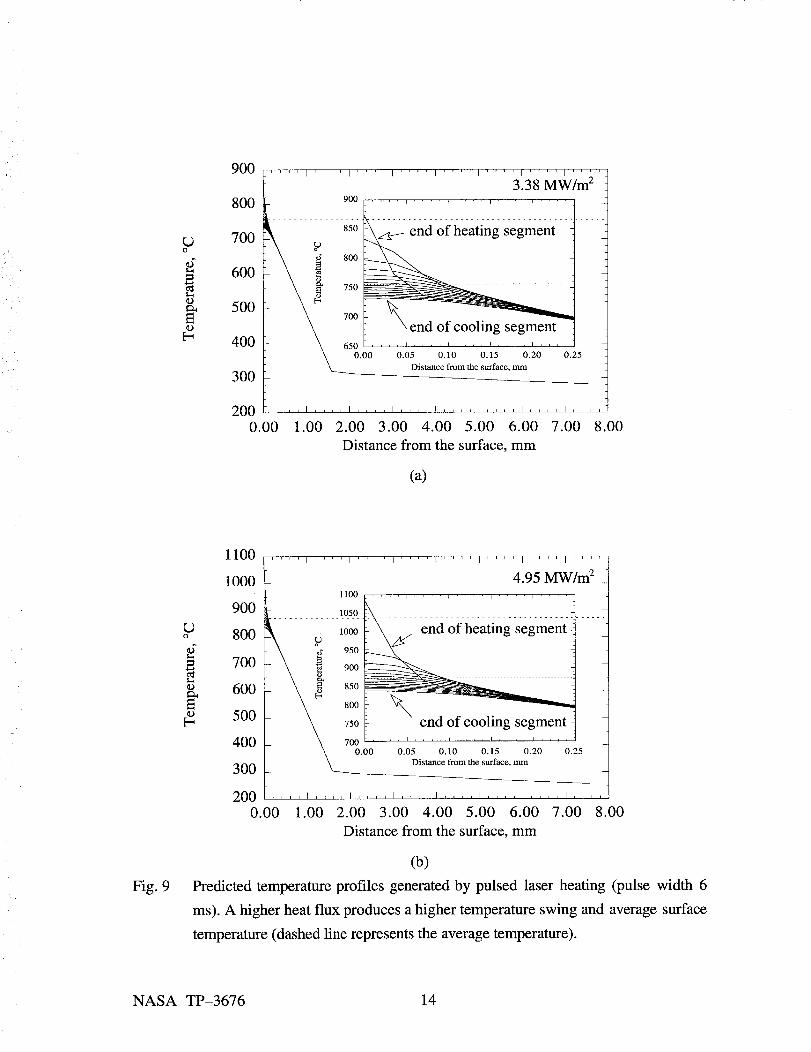
The temperature profiles generated by the pulsed laser under peak heat fluxes 3.38
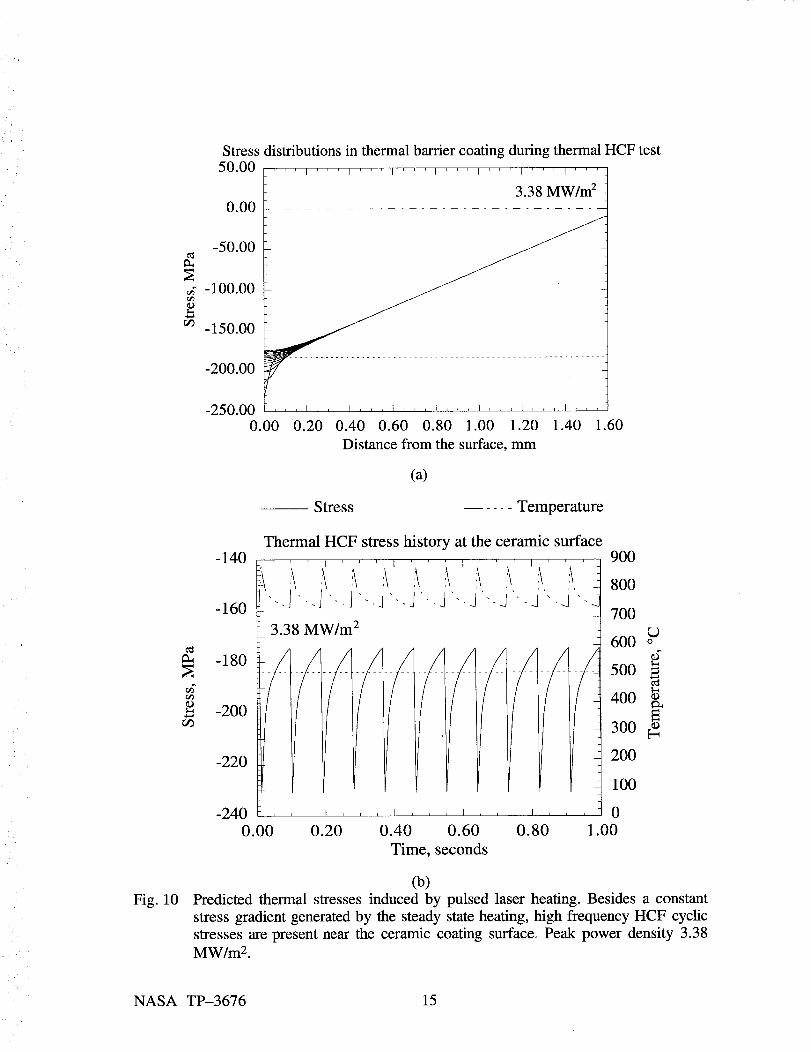
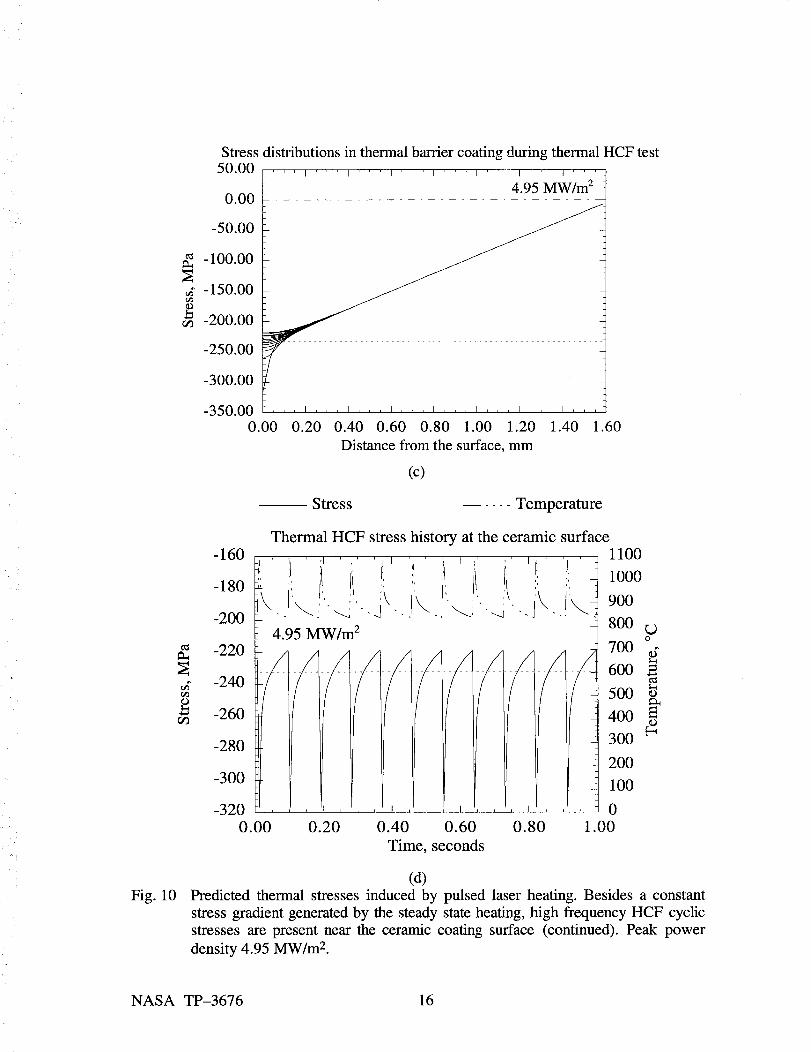
and 4.95 MW/m 2 are illustrated in Figure 9. The HCF stress distributions with coating
depth and variations with time are shown in Figure 10. It can be seen that this temperature
fluctuation induces high-frequency cyclic stresses on the coating surface, with the predicted
HCF stress ranging from around 60 MPa at 3.38 MW/m 2 to 100 MPa at 4.95 MW/m 2.
The dashed lines in Figure 10 represent the ceramic surface stress values at the average
steady state surface temperatures under the corresponding average heat fluxes 0.220 and
0.323 MW/m 2, respectively.
Table 3 Physical and mechanical properties of the thermal barrier coating system
used in calculations
Material Properties
Thermal conductivity
k, W/m-K
Thermal expansion
coefficient
0_, m/m.°K
Density
p, kg/m 3
Heat capacity
c, J/kg-K
Young's modulus
E, GPa
Plasma sprayed ZrO2-
8%Y203
0.9
10.8 × 10 -6
5236
582
27.6
Plasma sprayed
FeCrA1Y
11.0
12.4 × 10 -6 m/m°C
137.9
Steel substrate
46.7
14.2 × 10 -6 m/m°C
7850
456.4
207.0
Poisson's ratio, V 0.25 0.27 0.25
NASA TP-3676 10

?
o_
TmetaI -- Tcerami c (0) ----tr---- Tce_am_c(7rnna )
(a) LCF (CW Laser) Thermal Fatigue Test1000.0
.... i .... i .... i .... i .... i .... t .... i ....
800.0
600.0
400.0
200.0
0,0 .... I .... I .... I .... Ili n.I .... I .... I ....
0.0 10.0 20.0 30.0 40.0 50.0 60.0 70.0 80.0
Time, minutes
TmetaI -- Tceranac(0 ) ----o---- Tceramic(7mm )
(c) Combined LCF and HCF Thermal Fatigue Test1000.0
...i...i...i...1.,,i.,,i...i...
800.0
600.0
400.0
200.0
0.0
0.0
,j,, ,i ,,,i ,,,lllllll ,i ,. ,
20.0 40.0 60.0 80.0 100.0
Time, minutes
u _i , , . i , , ,
120.0 140.0 160.0
?
T etaI -- T .... io(0) "---0"-- Tcc,_,_ac(7mm)
(b) Combined LCF and HCF Thermal Fatigue Test1000.0
800.0
600.0
400.0
200.0
0.0 ,
0.0
i i i
i ..... i , , i
50.0 100.0 150.0 200.0 250.0 300.0 350.0
Time, minutes
Tm__ -- T e_a_e(0 ) ---n--- Tec,._c(7mm )
(d) Combined LCF and HCF Thermal Fatigue Test
0000I
800.0
600.0
400.0
200.0
0.0
0.0
.... i .... i .... i .... i ........ i,,
50.0 100.0 150.0 200.0 250.0 300.0
Time, minutes
, , i
350.0
?
8:h
800.0
600.0
400.0
200.0
0.0
0.0
1000.0.... n ....
i
i ? i i I ....
50.0
Tr_t_ _ -- Tceramic(0) _ Teen,c(7)
(e) Combined LCF and HCF Thermal Fatigue Test
0
.... i .... i .... i,,,,
100.0 150.0 200.0 250.0 300.0
Time, minutes
Fig. 4 Laser heating and cooling profiles simulating the engine operating conditions
(temperature has been corrected with angle iron configurations). (a) Angle iron
with LCF only; (b), (c) and (d) Angle iron with combined LCF and HCF; (e) Flat
specimen with combined LCF and HCF.
NASA TP-3676 11

Fig. 5
o
©
©
1000
800
600
400
200
00.0
-m--r-, , [ , ,
Ceramic':1 .... I .... I .... I .... I .... I ....
!/Bond coat Metal Substrate-- 0.05 MW/m 2
- 0.10 MW/m 2
'_",'¢ -- -- - O. 15 MW/m 2,
, ..... 0.20 MW/rn z
_'_ 2
_'_. : ..... 0.25 MW/m
....... 0.30 MW/m 2
1.0 2.0 3.0 4.0 5.0 6.0 7.0 8.0
Distance from the surface, mm
Temperature distributions in a thermal barrier coating system on an angle iron at
steady state heating for various heat fluxes.
Fig. 6
--LX- - O "th ,
--D O "th '
--0- - o'Ih
150.0
100.0
50.0
0.0
-50.0©
-100.0r/3
-150.0
-200.0
-250.00.0
0.10 N'IW/m 2 -- - O- - - _, ceramic ______ (_total 0.10 MW/m z
0.20 M_V/m 2 - - i - - o_e, bond coat + a t°tal, 0.20 MW/m 2
0.32 MW/m 2 - - A- - - _c subs_ate + c t°t_l, 0.32 MW/m 2
I
1.0 2.0 3.0 4.0 5.0 6.0 7.0 8.0
Distance from the surface, mm
Stress distributions in a thermal barrier coating system on an angle iron at steady
state heating for various heat fluxes.
NASA TP-3676 12
Fig. 7
o
<l
.9
©
-'a
£E
600.0
500.0
400.0
300.0
200.0
100.0
Maximum temperature fluctuation, calculated by finite difference analysis, as a
function of laser pulse width.
Fig. 8
E
0.40 ' 'l .... I .... t .... I .... i ....
+,,a
©
@
©
0.35
0.30
0.25
0.20
0.15
0.10
0.05
0.000.0
,,,, I .... I, ,,, I,,, i I .... I ....
5.0 10.0 15.0 20.0 25.0 30.0
Laser pulse width, ms
The relationship between laser interaction depth and laser pulse width. The
interaction depth is independent of laser power density.
NASA TP-3676 13
o
_DtZa
©
900
800
700
600
500
400
300
2000.00
.... I .... I .... I .... I .... I .... I .... I .... J
3.38 MW/m 2 t900 .... , _ , . . , ....
0.00 0.05 0.10 0.15 0.20 0.25
__ Distance from the surface, mm
1.00 2.00 3.00 4.00 5.00 6.00 7.00 8.00
Distance from the surface, mm
(a)
Fig. 9
o
_2
0.1
1100
1000
900
8OO
700
600
5OO
400
300
2000.00
f .... I .... I .... I .... I .... I .... I .... I ....
4.95 MW/m 21100 .... _ .... _ .... _
............. 1_o_5o___ ................................ ......
_ °i 1ooo _iiea- end of heating segment i92.......................... i \
\ 850 -__ i\ \
750 k -- end of cooling segment_ _, 700 .... ' .... ' .... ' .... ' ....
0.00 0.05 0.10 0.15 0.20 0.25
Distance from the surface, mm
1.00 2.00 3.00 4.00 5.00 6.00 7.00 8.00
Distance from the surface, mm
(b)
Predicted temperature profiles generated by pulsed laser heating (pulse width 6
ms). A higher heat flux produces a higher temperature swing and average surface
temperature (dashed line represents the average temperature).
NASA TP-3676 14
Stress distributions in thermal barrier coating during thermal HCF test
50.00 '' ' i '' ' i ' ' ' i ' ' ' i ' ' ' i ' ' ' I ' ' ' I ' '
3.38 M-W/m 2
0.00 ................................
-200.00
-250.00 ,,, i,,, I,,, i,,, i,,, i,,, I,,, I , , ,0.00 0.20 0.40 0.60 0.80 1.00 1.20 1.40 1.60
Distance from the surface, mm
-50.00
-100.00©
-150.00
Ca)
-- Stress Temperature
ca,
¢/3
r_
-140
-160
-180
-200
-220
F-240 F ,
0.00
Thermal HCF stress history at the ceramic surface900
-.1 -1 ; .J.JJ J " 800- 700
3.38 MW/m 2600 or')
500
- 400
- 300-- 200
-- 100
, , 0
1.00
(b)Fig. 10 Predicted thermal stresses induced by pulsed laser heating. Besides a constant
stress gradient generated by the steady state heating, high frequency HCF cyclic
stresses are present near the ceramic coating surface. Peak power density 3.38
MW/m 2.
NASA TP-3676 15
Stressdistributionsin thermalbarriercoatingduringthermalHCFtest50.00 I_' ' ' i ' ' ' I ' ' ' I ' ' ' I ' ' ' I ' _-_ I ' ' ' J ' ' '
4.95 MW/m 20 O0
,,,, I,,, I,,, I, ,, I, ,, I,,, I,,, I , , ,
-50.00
-100.00
-150.00
-200.00
-250.00
-300.00
-350.000.00 0.20 0.40 0.60 0.80 1.00 1.20
Distance ffomthesufface, mm
1.40 1.60
(c)
Stress ..... Temperature
Thermal HCF stress history at the ceramic surface
-' ,,
4.95 MW/m 2
i t i
0.20
-160
-180
-200
-220
-240
-260
-280
-300
-320
0.00
/
/-t--.
i i i _ i [ i i
0.40 0.60
Time, seconds
i\ i/ i\
i I i i
0.80
1100
1000
900
8000
700
600
500
400
300 _
200
100
' - 0
1.00
(d)
Fig. 10 Predicted thermal stresses induced by pulsed laser heating. Besides a constant
stress gradient generated by the steady state heating, high frequency HCF cyclic
stresses are present near the ceramic coating surface (continued). Peak power
density 4.95 MW/m 2.
NASA TP-3676 16

LCF and HCF Damage on Thermal Barrier Coatings
The surface cracking was observed for all specimens tested under LCF and/or HCF
conditions (total heating time up to 256 hours). Compared to the pure LCF tested
specimen, the combined LCF and HCF tests produced much higher crack densities, with
more complex crack networks on the ceramic surfaces. Examination of surface cracks on
the fiat specimens shows that the crack density decreases with decreasing laser power
density.
The crack patterns on the angle iron and flat specimen surfaces are schematically
illustrated in Figure 11. At the angle iron corners, nearly parallel cracks which run across
the corners were formed by the laser thermal fatigue tests. In contrast, equiaxial crack
networks (mud flat cracks) were generated by the laser beam at the fiat specimen surfaces.
However, at the edges of the flat specimens, parallel cracks similar to those found on the
angle iron corners were observed with crack direction perpendicular to the edges.
Compared to pure LCF tests, the combined LCF and HCF initiated more secondary cracks,
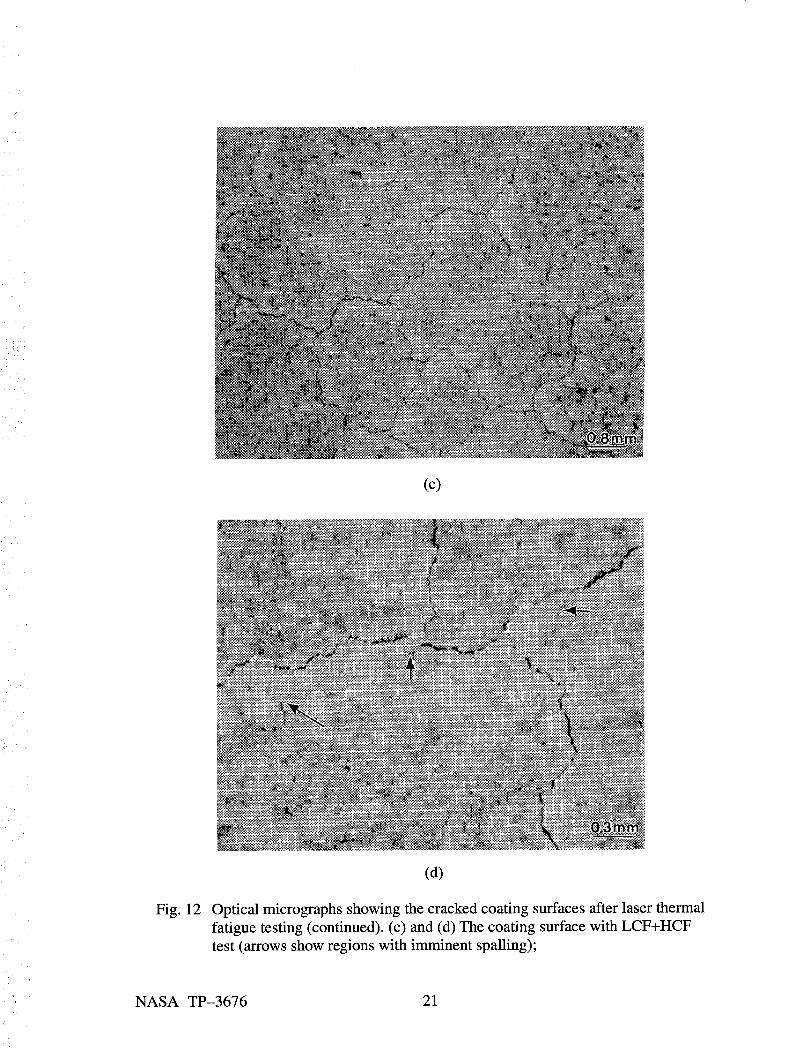
and micro-spallation at the cracked surfaces. The optical micrographs of the cracked
surfaces are shown in Figure 12. The results suggest that much higher surface stresses
were induced at the ceramic surface by the pulsed laser HCF component.
secondary cracksmajor cracks spallation
,x :, \ ! :
/ "\
J// J.(L?
LCF LCF+HCF
(a) Angle iron specimen
?
Fig. 11
_ _ _ " I . Imajor cracks spallatlon!
secondary cracksedge cracks.__, _ ! _ _ _ 1
LCF LCF+HCF
(b) Rectangular flat specimen
Schematic diagram showing the crack patterns on coating surfaces after laser
testing.
NASA TP-3676 17

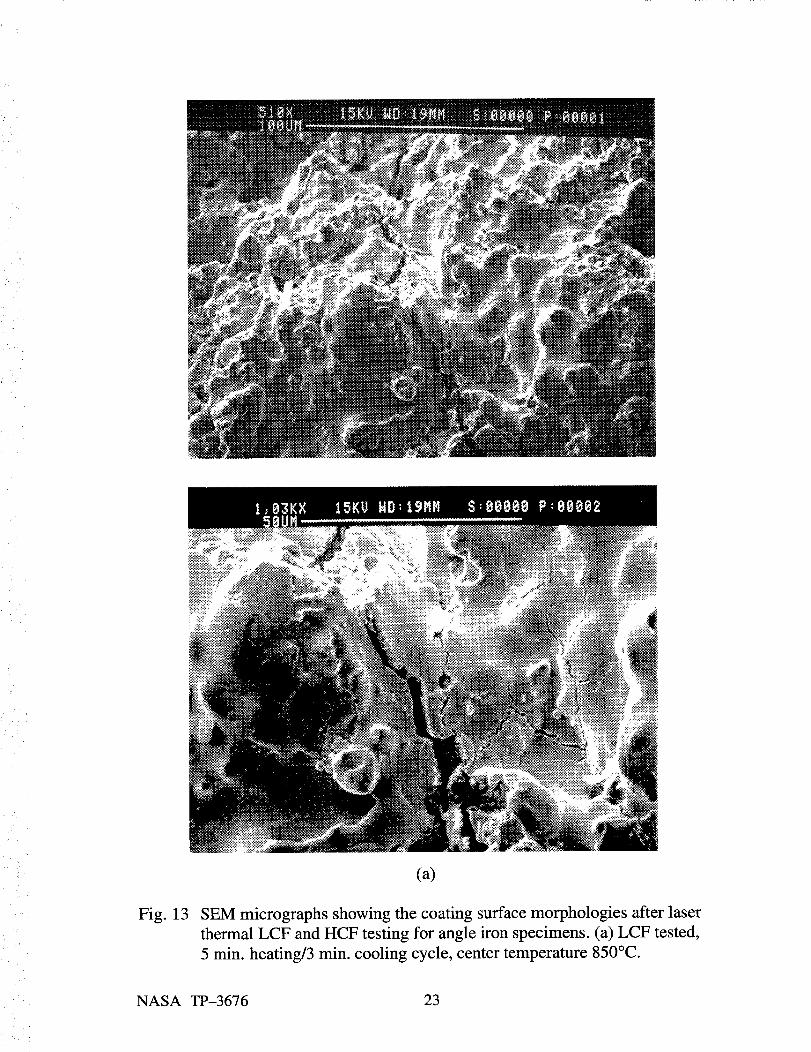
Figure 13 shows SEM micrographs of the tested coatings on angle iron specimens.
It can be noticed that the pure LCF tested specimen shown in Figure 13 (a) has the most
intact coating surface, and the thermal fatigue cracks are relatively regular with well
matched crack faces. However, the combined LCF and HCF tests produced more severe
coating surface damage. Besides the major thermal fatigue cracks, surface coating micro-
spallation, crack branching and loose particles intruding into the cracks are often observed.
For all combined LCF and HCF tested specimens, the specimen with the 30 minute
heating/5 minute cooling cycles at a lower temperature (850°C) showed the least surface
damage. In contrast, the most surface damage was found for the specimen with the 30
minute heating/5 minute cooling cycles at the higher temperature (950°C). In the latter
specimen, cracks were branched into multiple crack networks and accompanied with more
coating spallation, and the major crack density and the crack width were also significantly
higher compared with the lower temperature tested specimens.
DISCUSSION
Ceramic Coating Sintering and Creep at High Temperatures
During thermal fatigue testing, ceramic sintering and creep will occur under the
given temperature and stress conditions. Due to the porous and microcracked nature of
plasma-sprayed ceramic coatings, the primary creep stage is often observed for these
coatings, with the strain rate continuously decreasing with time [15, 16]. This creep behavior
is probably related to stress-enhanced ceramic sintering phenomenon, the splat relative
sliding, and the stress redistribution around the splats and microcracks. The stress-
dependent deformation can result in coating shrinkage and thus stress relaxation at
temperature under the compressive thermoelastic stresses. The strain rate _p can be
generally written as
where A, n and s are constants, Q is activation energy, R is gas constant, Gth is the in-
plane compressive thermal stress in the coating, and t is time. The time exponent s is
reported to be 0.82 under low stresses (<80 MPa), and to be 0.67 under high stresses (up
to 655 MPa) [15, 16]. The creep strain ep t in the ceramic coating can be expressed as
NASA TP-3676 18

• ti ti ( Q _ (ep' = _ep(Crth,T,t)dt= _A.exp_-_--_). ai°-ep i-1-0 0
n
Ec- .t-Sdt (3)
1-v c
where ep _ and Ep i-1 are creep strains at time ti, and the previous time step ti_l,
respectively, tr° is the initial thermal compressive stress in the coating, E c and v c are the
elastic modulus and Poisson's ratio of the ceramic coating. The stress relaxation effect on
the total creep strain is considered by the Epi-1 term in Equation (3). Using the literature
reported data A, n, s and Q for the plasma-sprayed ceramic coating [15, 16], the creep
strains as a function of time can be estimated for a heat flux 0.323 MW/m 2, as illustrated in
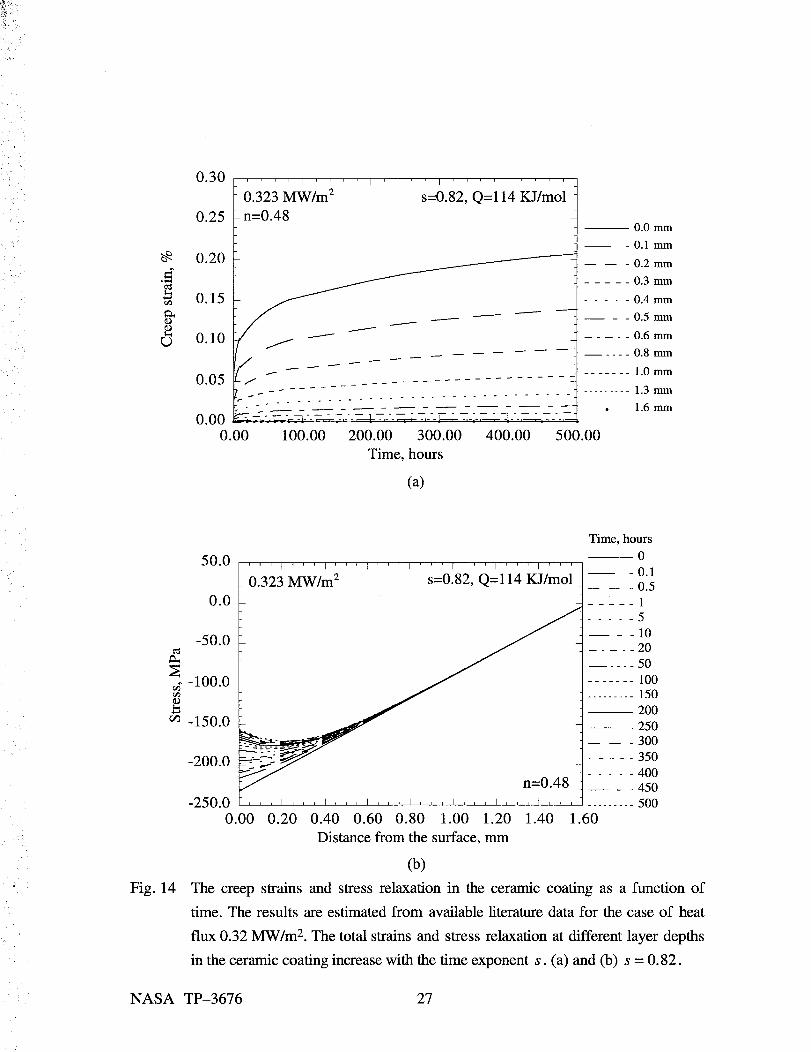
Figure 14 (a) and (c). The in-plane stress distribution profiles in the coating, as shown in
Figure 14 (b) and (d), indicate that significant stress relaxation will occur, especially at the
top half of the coating, because of higher thermal stresses and temperatures at these
locations. In addition, the creep strain and thus stress relaxation increase with decreasing
the time exponent s. The coating creep and stress relaxation are strongly dependent upon
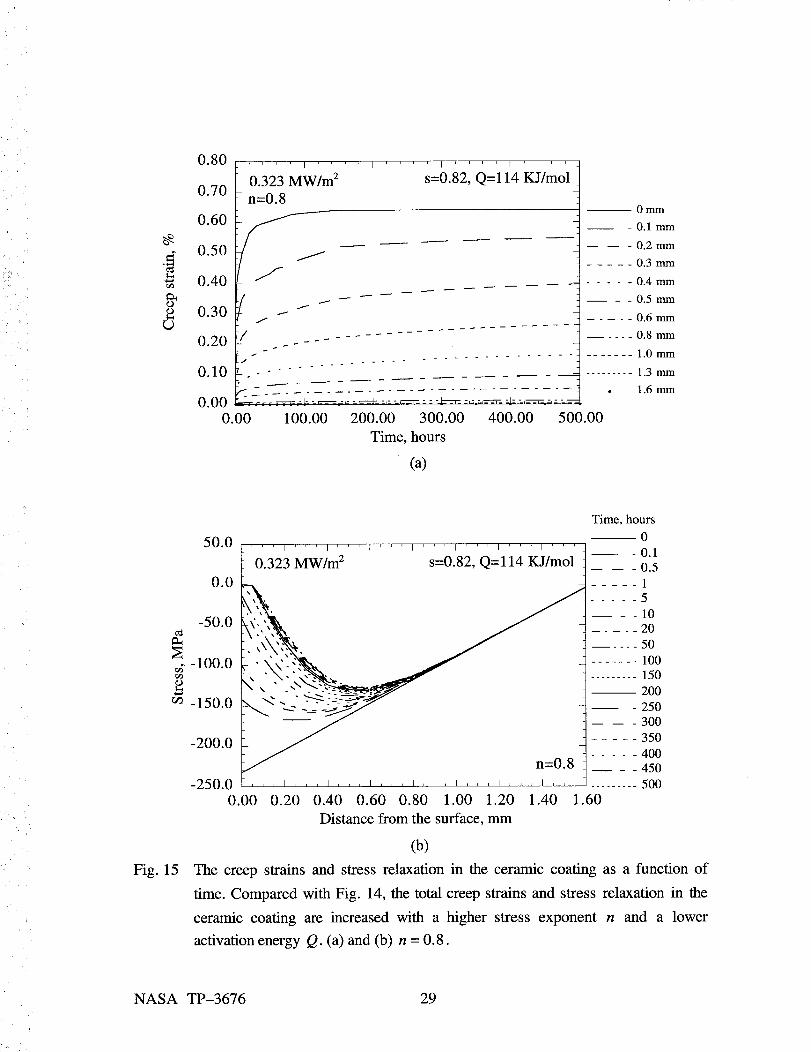
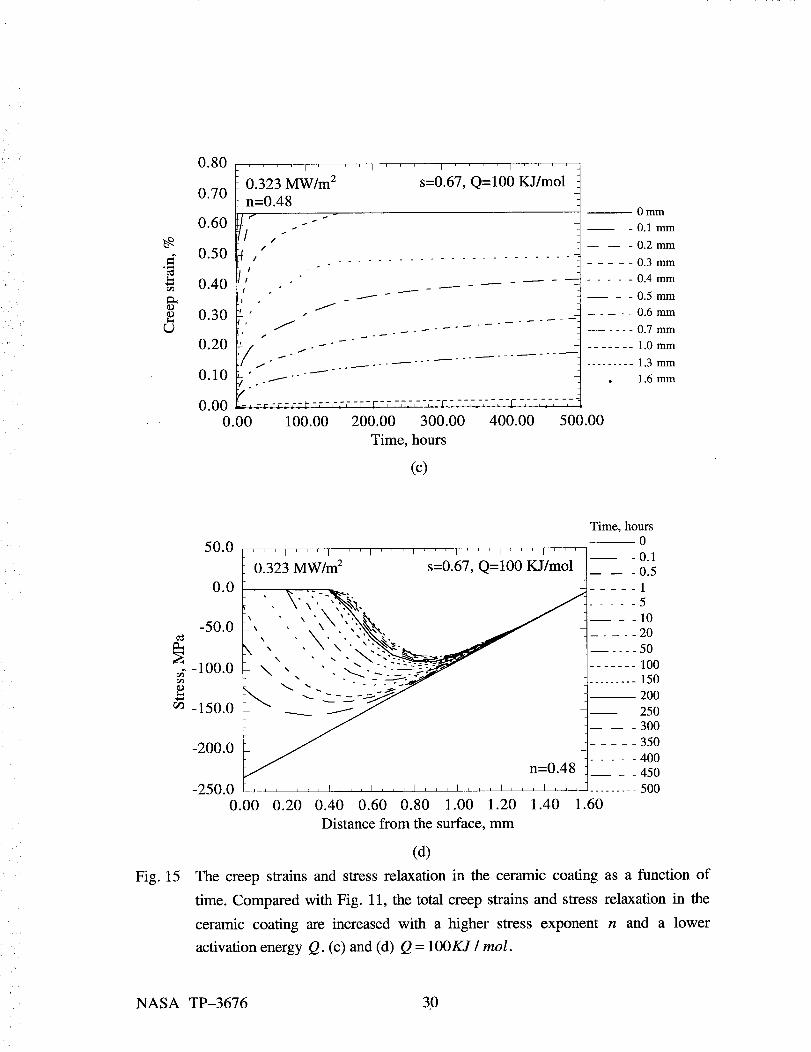
the stress exponent, n, and the activation energy, Q. As illustrated in Figures 14 and 15,
with a higher n value and a slightly lower activation energy, more significant stress
relaxation will occur in the coating system.
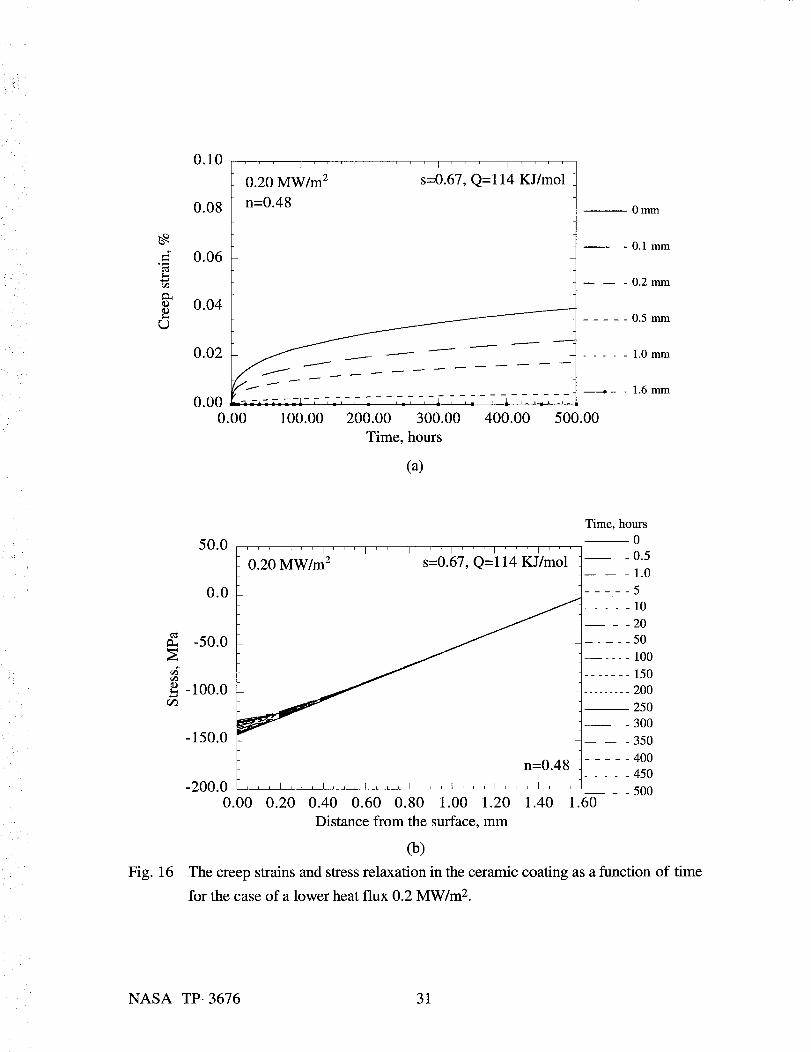
The laser heat flux has a significant effect on coating creep and stress relaxation. As
shown in Figure 16, a lower laser heat flux (0.20 MW/m 2) will establish a lower surface
temperature and a less steep temperature gradient across the coating, therefore, a lower
thermal stress will be expected in the coating. As a consequence, total creep strain and
stress relaxation will be much less as compared with those in the high heat flux case.
NASA TP-3676 19

(a)
Fig. 12
(b)
Optical micrographs showing the cracked coating surfaces after laser thermal
fatigue testing. (a) and (b) The coating surface with pure LCF test;
NASA TP-3676 20
(c)
Fig. 12
N
N
N
@
NN
(d)
Optical micrographs showing the cracked coating surfaces after laser thermal
fatigue testing (continued). (c) and (d) The coating surface with LCF+HCF
test (arrows show regions with imminent spalling);
NASA TP-3676 21
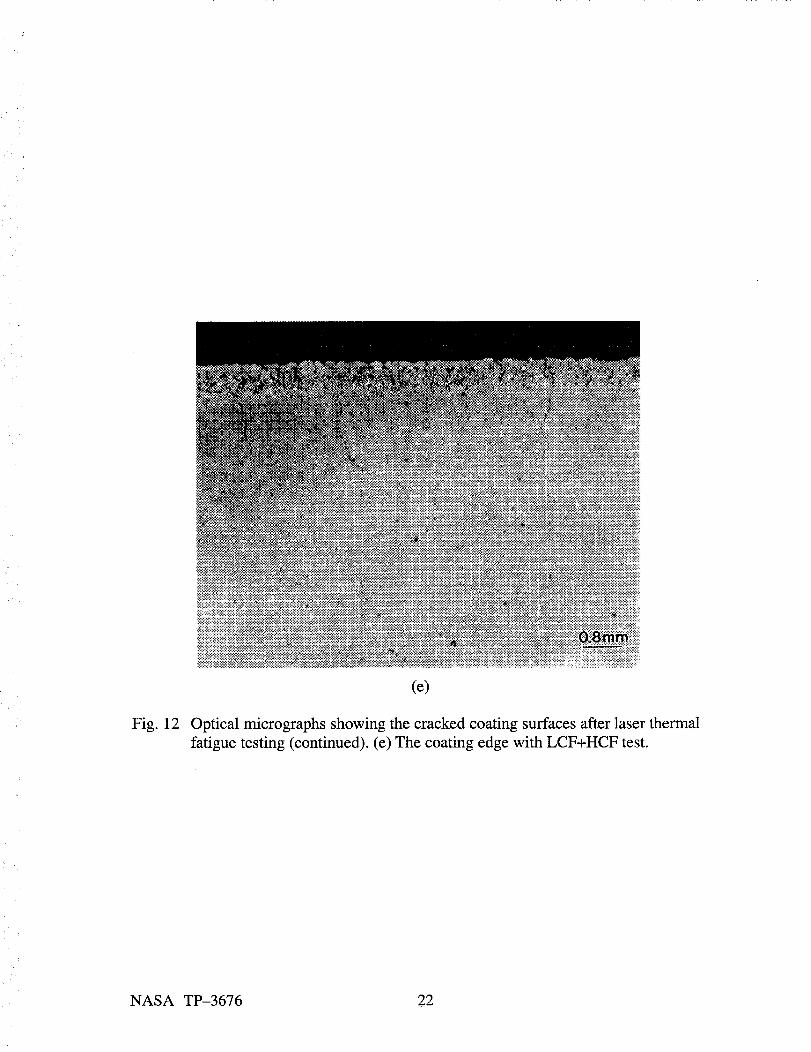
Fig. 12
(e)
Optical micrographs showing the cracked coating surfaces after laser thermal
fatigue testing (continued). (e) The coating edge with LCF+HCF test.
NASA TP-3676 22
_%!iiii!iiiii!iiil
Fig. 13
(a)
SEM micrographs showing the coating surfacemorphologies after laserthermal LCF and HCF testing for angle iron specimens.(a) LCF tested,5 min. heating/3 min. cooling cycle, center temperature850°C.
NASA TP-3676 23
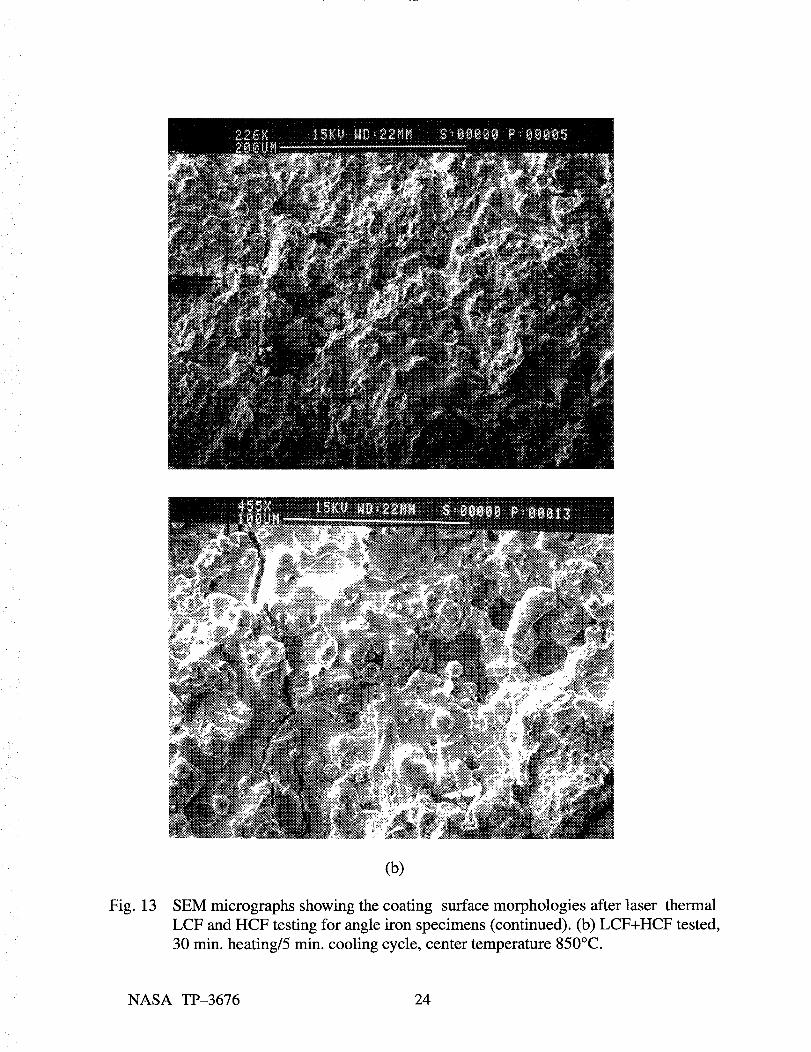
(b)
Fig. 13 SEM micrographsshowingthecoating surfacemorphologiesafter laser thermalLCF andHCF testingfor angleiron specimens(continued).(b) LCF+HCF tested,30min. heating/5min. cooling cycle, centertemperature850°C.
NASA TP-3676 24

(c)
Fig. 13 SEM micrographs showing the coating surface morphologies after laser thermal
LCF and HCF testing for angle iron specimens (continued). (c) LCF+HCF
tested, 5 min. heating/3 min. cooling cycle, center temperature 850°C.
NASA TP-3676 25

Fig. 13
(d)
SEM micrographs showing the coating surface morphologies after laser thermal
LCF and HCF testing for angle iron specimens (continued). (d) LCF+HCF
tested, 30 min. heating/6 min. cooling cycle, center temperature 950°C.
NASA TP-3676 ,26
0.30
0.25
0.15
0.10
0.05
0.000.00
I I I I
0.323 MW/m 2 s=0.82, Q=114 KJ/mol
- n=0.48
I.___----
I
Jm
J
i
I --------.-.-.------ -_-.-.-.-- - -.-.-.- -_--.-
100.00 200.00 300.00 400.00 500.00
Time, hours
Ca)
-- 0.0 mm
- 0.1 mm
-- -- -0.2ram
..... 0.3 mm
..... 0.4 mm
- - 0.5 mm
..... 0.6 mm
..... 0.8 mm
....... 1.0mm
......... 1.3 mm
1.6 mm
Fig. 14
Time, hours
50.0 -- 0
f' ' ' I ' ' ' I ' ' ' I ' ' ' i ' ' ' I ' ' ' i ' ' ' I ' ' '_0.323 MW/m 2 s=0.82, Q=114 KJ/mol t 0.10.5
0.0 ..... 1..... 5
lO205olOO15o2002503OO
-200.0 350400
n=0.48 ----450
-250.0 ,,, _,,, i,,, i,,, _,,, _,,, i,,, i ............ 5000.00 0.20 0.40 0.60 0.80 1.00 1.20 1.40 1.60
Distance from the surface, mm
(b)
The creep strains and stress relaxation in the ceramic coating as a function of
time. The results are estimated from available literature data for the case of heat
flux 0.32 MW/m 2. The total strains and stress relaxation at different layer depths
in the ceramic coating increase with the time exponent s. (a) and (b) s = 0.82.
-50.0
-100.0
_D
r_ -150.0
NASA TP-3676 27

_D
0.80
0.70
0.60
0.50
0.40
0.30
0.20
0.10
0.000.00
I I
0.323 MW/m 2
n=0.48
/
J
I I
s=0.67, Q=114 KJ/mol
o - . -
100.00 200.00 300.00 400.00 500.00
-- 0.0mm
- 0.1 mm
-- -- - 0.2 mm
..... 0.3 mm
..... 0.4 mm
-- - - 0.5 mm
..... 0.6 mm
-- .... 0.8 mm
....... 1.0 mm
......... 1.3mm
• 1.6 mm
Time, hours
(c)
Fig. 14
50.0
0.0
-50.0
-100.0r_
cD
r_ -150.0
-200.0
' ' ' I ' ' ' I ' ' ' I ' ' ' I ' ' ' I ' ' ' I ' ' ' I ' ' '
0.323 MW/m 2 s=0.67, Q=114 KJ/mol
n--O 48
-250.0 ,,, I,,, I,,, i,,, I,,, i,,, I,,, I , , ,0.00 0.20 0.40 0.60 0.80 1.00 1.20 1.40 1.60
Time, hours--0
-0.]-- -- - 0.5..... ]
.....
-- - - ]0..... 20..... 50....... 100........ 150
-- 200- 250
-- -- - 300..... 350..... 400
450......... 500
Distance from the surface, mm
(d)
The creep strains and stress relaxation in the ceramic coating as a function of
time. The results are estimated from available literature data for the case of heat
flux 0.32 MW/m 2. The total strains and stress relaxation at different layer depths
in the ceramic coating increase with the time exponent s. (c) and (d) s = 0.67.
NASA TP-3676 28
:];ii rJ_
_D
0.80
0.70
0.60
0.50
0.40
0.30
0.20
0.10
0.000.00
I I
0.323 MW/m 2
n=0.8
/
s=0.82, Q=114 KJ/mol
I
0 mm
- 0.1 mm
-- -- - 0.2 mm
..... 0.3mm
...... 0.4 mm
- - 0.5 mm
tj ...... 0.6 mm
i/ .........._ _ _ - ............ 0.8 mm
........ _ ....... 1.0ram.j .... - _ . _
_- - " - ........ 1.3 mm
p .............................. . 1.6 mm
100.00 200.00 300.00 400.00 500.00
Time, hours
(a)
Fig. 15
Time, hours
--0
50"0 t' ' ' I ' ' ' I ' ' ' I ' ' ' I ' ' ' I ' ' ' I ' ' ' I ' ' -- -0.10.323 MW/m 2 s=0.82, Q=114 KJ/mol -- -- - 0.5
F0.0 -, ..... 1,_,_ _, _ 5
', - 20
50
- N,X" - : _,'_"_ 100
,, -k -._ _2.--__-____ 200
300
- .... 350
400
_/" n =0.8 450,,, t,,, I,,, t,,, I,,, t,,, t,,, t ............ 500
0.00 0.20 0.40 0.60 0.80 1.00 1.20 1.40 .60
Distance from the surface, mm
(b)
The creep strains and stress relaxation in the ceramic coating as a function of
time. Compared with Fig. 14, the total creep strains and stress relaxation in the
ceramic coating are increased with a higher stress exponent n and a lower
activation energy Q. (a) and (b) n = 0.8.
-50.0
-100.0rJJ_D
-150.0
-200.0
-250.0
NASA TP-3676 29
0.80
0.70
0.60
0.50
0.40
0.30
0.20
0.10
0.000.00
I I
s=0.67, Q=100 KJ/mol
0 mm
- 0.1 mm
-- -- - 0.2 mm
..... 0.3 mm
......... 0.4mm
-- - - 0.5 mm..... 0.6mm
..... 0.7 mm
....... 1.0 mm
......... 1.3 mm• 1.6 mm
200.00 300.00 400.00 500.00
Time, hours
(c)
50.0
0.0
-50.0
-100.0r_3
r_ -150.0
-200.0
' ' ' I ' ' ' I ' ' ' I ' ' ' L ' ' ' I ' ' ' I ' ' ' I ' ' '
0.323 MW/m 2 s=0.67, Q=100 KJ/mol
-/
Time, hours--0
-0.1-- -- -0.5..... 1..... 5
.... 10
..... 20
...... 50
....... 100
......... 150-- 200-- - 250-- -- - 300..... 350..... 400
450
-250.0 ,,, i,,, _,,, i,,, i,,, i,,, t,,, i ............ 5000.00 0.20 0.40 0.60 0.80 1.00 1.20 1.40 1.60
Distance from the surface, mm
(d)
Fig. 15 The creep strains and stress relaxation in the ceramic coating as a function of
time. Compared with Fig. 11, the total creep strains and stress relaxation in the
ceramic coating are increased with a higher stress exponent n and a lower
activation energy Q. (c) and (d) Q = 100KJ / mol.
NASA TP-3676 30
©
0.10
0.08
0.06
1 ' I I I
0.20 MW/m 2 s=0.67, Q=114 KJ/mol
n=0.48-- Omm
- 0.1 mm
-- -- - 0.2mm
0.04...... 0.5mm
0.02 _ __-__..__--- -------- -'-'--- _ 1.0 mm
• 1.6 mm
0.00 L.-,=.zz-.z-l-77_-,-7i-,-7_7-,-['7-,_,- ......., ± ......... L
0.00 100.00 200.00 300.00 400.00 500.00
Time, hours
(a)
Fig. 16
Time, hours
50.0 --o' ' ' I ' ' ' I ' ' ' I ' ' ' I ' ' ' I ' ' ' I ' ' ' I ' ' ' / 0.5
• = " = - 1.0
0.0 510
20
50
100
150
200
250300
-150.0 -- -- - 350
n=0.48 ..... 400..... 450
-200.0 ,,, i,,, i,,, _,,, _,,, _,,, _,,, i , , , --5000.00 0.20 0.40 0.60 0.80 1.00 1.20 1.40 1.60
Distance from the surface, mm
(b)
The creep strains and stress relaxation in the ceramic coating as a function of time
for the case of a lower heat flux 0.2 MW/m 2.
-50.0
_g
-100.0
NASA TP-3676 31

CrackInitiation DuringThermalFatigueTestsTheplasmasprayedZrO2-Y2O3 ceramic coatings contain microcrack networks
with a typical crack width around 0.5-1 _tm after processing. Therefore, initiation of larger
cracks at the coating surface during thermal fatigue testing will not be a difficult process.
The mechanisms of the crack initiation can be surface tensile stress induced cracking
during cooling, and/or HCF peak compressive stress induced cracking at the heating stage.
The surface tensile stresses are mainly generated by coating shrinkage after cooling due to
the coating sintering and creep at temperatures. The pulsed laser induced temperature swing
can generate locally high compressive stresses that could result in the surface coating
fracture in a short time period. Since the laser HCF component will promote both the
coating surface creep and the coating surface compressive cracking, the accelerated crack
initiation and higher surface crack density at the coating surfaces are expected. This has
been confn'med by this experiment.
Fatigue Behavior of Thick Thermal Barrier Coatings under Thermal Cyclic Loading
The fatigue crack propagation rates in a ceramic material under cyclic loads can be
written as [17-19]
da--= CKmax( Kma x - Kmin) p = CK_naxAKP (4)dN
where C, m and p are material dependent constants, Kma x and Kmi n are the maximum and
minimum stress intensity factors, and AK the stress intensity amplitude, of the crack.
Under the condition that Kmi n equals zero, Equation (4) can be reduced to the conventional
Paris law relationship [:0[
da-- = Cl_r_ q (5)dN
where q = m + p. During a superimposed thermal LCF and HCF testing, the surface
vertical crack growth can be generally induced by both LCF and HCF components, as
illustrated in Figure 17. The crack growth rate with respect to LCF cycle number can thus
be expressed as
(/ /da =el AKLc F q+ _ C2 AKHc F
-_ LCF 0
NASA TP-3676 32

where C1 and C2 are constants, NHC v is the characteristic HCF cycle number, AKLc F and
AKt_ICv are stress intensity factors of the crack under low cycle and high cycle loads,
respectively. The stress intensity factors are functions of crack geometry, crack length and
stress magnitudes. It can be seen that the crack propagation rate depends not only on
coating properties, but also on LCF and HCF parameters which define the stress states and
fatigue mechanisms.
©
(ai)HCF
/-/-
(ai)LCF
©[-,
Cycle number
Fig. 17 Schematic diagram showing crack growth resulting from thermal LCF and HCF
loads.
Low Cycle Fatigue Mechanism
Under the present test conditions, the oxidation of the bond coat and the substrate is
not important because of the low interfacial temperatures and short testing times.
Therefore, the low cycle fatigue mechanism is primarily associated with coating sintering
and creep at high temperatures. The time and elastic stress dependent, non-elastic strains in
NASA TP-3676 33
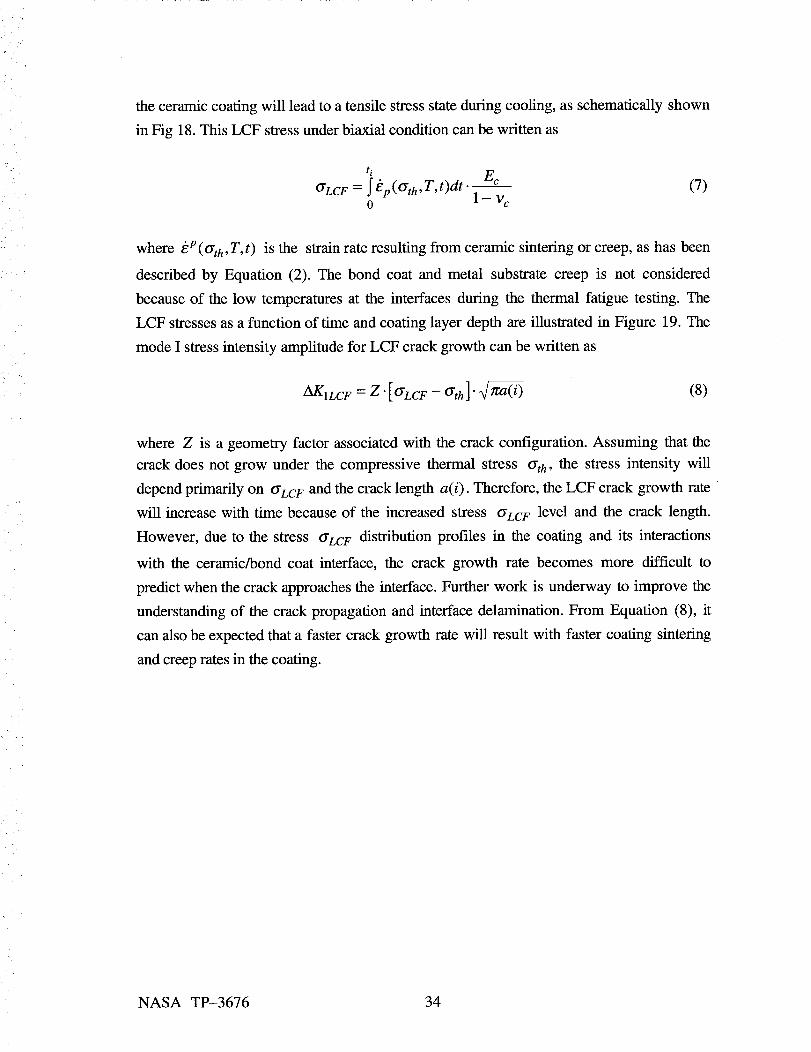
the ceramic coating will lead to a tensile stress state during cooling, as schematically shown
in Fig 18. This LCF stress under biaxial condition can be written as
ti
¢7LCF = S_p(CTth,T,t)dt" Ec0 1-Vc
(7)
where izP(crth, T, t) is the strain rate resulting from ceramic sintering or creep, as has been
described by Equation (2). The bond coat and metal substrate creep is not considered
because of the low temperatures at the interfaces during the thermal fatigue testing. The
LCF stresses as a function of time and coating layer depth are illustrated in Figure 19. The
mode I stress intensity amplitude for LCF crack growth can be written as
Z_ILCF = Z" [ (YLCF -- (Tth ]" (8)
where Z is a geometry factor associated with the crack configuration. Assuming that the
crack does not grow under the compressive thermal stress Crth, the stress intensity will
depend primarily on tYLCF and the crack length a(i). Therefore, the LCF crack growth rate
will increase with time because of the increased stress ¢rLCF level and the crack length.
However, due to the stress CrLcF distribution profiles in the coating and its interactions
with the ceramic/bond coat interface, the crack growth rate becomes more difficult to
predict when the crack approaches the interface. Further work is underway to improve the
understanding of the crack propagation and interface delamination. From Equation (8), it
can also be expected that a faster crack growth rate will result with faster coating sintering
and creep rates in the coating.
NASA TP-3676 34
(YLCF
Sintering and creep at high temperatures// \,\
j \
,, ................. Crack . y .....
A
ceramic coating
i ....
bond coat
substrate
_LCF
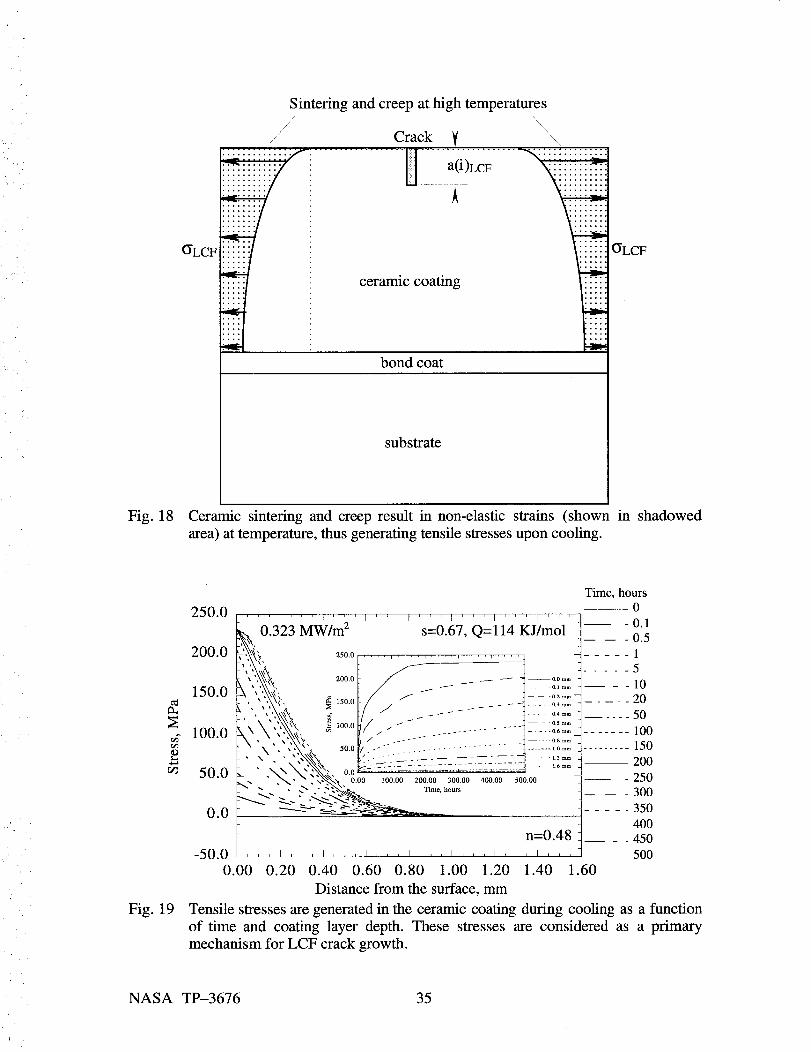
Fig. 18 Ceramic sintering and creep result in non-elastic strains (shown in shadowed
area) at temperature, thus generating tensile stresses upon cooling.
Time, hours--0
250.0 ' ' ' i ' ' ' I ' ' ' I ' ' ' r ' ' ' I ' ' ' I ' ' ' I '
_,._ 0.323 MW/m 2 s=0.67, Q=l14 KJ/mol - 0.1-- -- -0.5
200.0 _',,_; 2so.o ....................... ._ ..... 1-,, _, ..... 5-_\_' 200.0 _ _ _ _ --0.0 mm
100.0 _ , -,,,_, , .............
_ -- ----_'V_ _' X _ ;._ _Q_ " " 50.0 ..... . ................... "_ .................... 150
50.0 k " .\\\',N.'N_', 0.o :---=- ............................ =_, " ,",,,,x,'_.,_,?'-G. o.oo mo.oo 200.00 300.00 4oo.00 soo.oo -250
_-. -" .-:...C-_'_v.."_. -- -- - 300-'- -__z_- __" --_._'______ 3500.0 .....
..... 400b n=0.48 _ _ 450L-
-50.0 I,,, I,,, I,,, i,,, I,,, I,,, I,,, I ......... 500
0.00 0.20 0.40 0.60 0.80 1.00 1.20 1.40 .60
Distance from the surface, mm
Fig. 19 Tensile stresses are generated in the ceramic coating during cooling as a function
of time and coating layer depth. These stresses are considered as a primary
mechanism for LCF crack growth.
NASA TP-3676 35
High Cycle Fatigue Mechanism
The high cycle fatigue is associated with the cyclic stresses originated from the high
frequency temperature fluctuation at the ceramic coating surface. Because this temperature
swing results in significant thermal strains, considerable stresses will develop at the coating
surface. HCF stresses are dynamic in nature, with a very short interaction time; therefore,
stress relaxation can be neglected. The HCF stress amplitude is dependent on the
temperature swing, and a stress level of 100 MPa can be induced at the surface by a
temperature change of 250°C. With a surface crack in the coating, the HCF thermal loads
can be equivalently acting on the crack by a wedging process, as schematically illustrated in
Figure 20 (a) and (b). This wedging process, which provides an intrinsic mechanism for
the HCF phenomenon, can be further enhanced by crack face shifting and spalled particle
intruding, as shown in Figure 20 (c) and (d). Since the minimum HCF stress intensity
factor equals zero, the net mode I stress intensity amplitude for this case can be expressed
as [21]
and
AK1HcF = 2" P 1 + f(i) _ (9a)
/r _/a(i) 2 _ bi2
P = aHC F •b i (9b)
where P is a concentrated load per unit thickness acting on the crack, bi is the load acting
distance from the surface which is taken as laser interaction depth in the present study,
anc F is the HCF stress, a(i) is the crack length at the ith cycle, f(i) is a geometry factor,
which can be related to the crack length a(i) and the interaction depth bi in the following
form [21]
f(i) =ta(i)).I
0.2945-0.3912.a(i))
-0.9942"( bi ]6+0.5094" (10)
_.a(i))
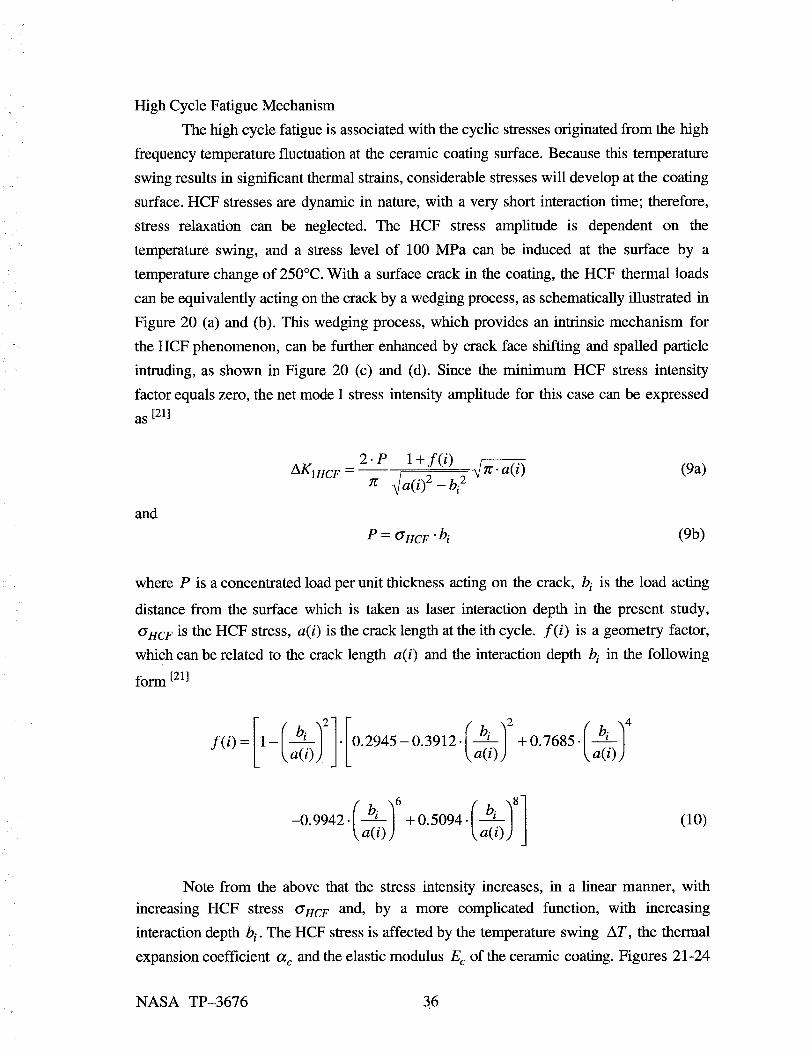
Note from the above that the stress intensity increases, in a linear manner, with
increasing HCF stress OHCF and, by a more complicated function, with increasing
interaction depth b i. The HCF stress is affected by the temperature swing AT, the thermal
expansion coefficient o¢c and the elastic modulus E c of the ceramic coating. Figures 21-24
NASA TP-3676 36

illustrate the relationship between the stress intensity factor and the normalized crack
length, with various values of bi , AT, o_c and E c of the coating. The results show that the
stress intensity factor, thus the high cycle fatigue effect, decreases with increasing crack
length, but increases with increasing the interaction depth, the temperature swing, the
thermal expansion coefficient and Young's modulus of the ceramic coating. It should be
noted that, depending on the coating stress state at high temperature, the HCF may affect
crack propagation far beyond the laser interaction depth. This has been demonstrated in
pure HCF cycling where high temperature swings, and therefore high thermal loads, were
generated near the surface of the ceramic coating while the interior of the specimen
remained cool [12]. This test condition was shown to cause not only surface crack initiation
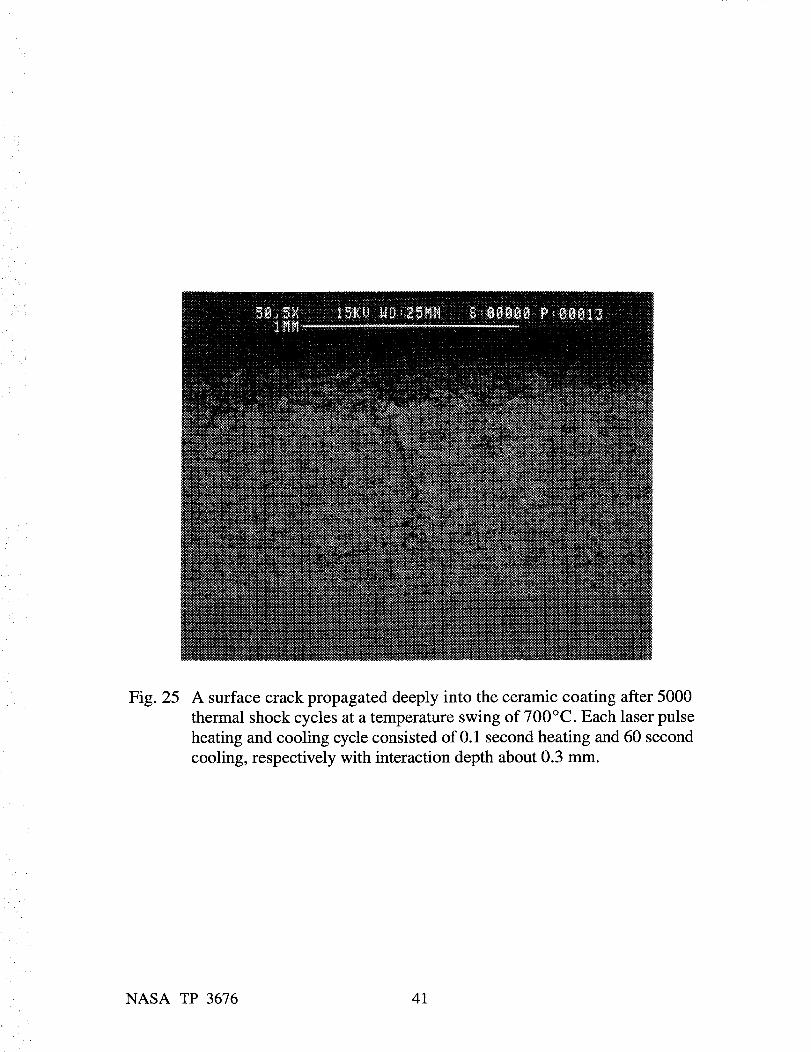
but also propagation deep into the coating, as shown in Figure 25. In fact, some of the
cracks have reached the ceramic/bond coat interface after 5000 cycles when surface
temperature swing was 700°C. In another experiment with a lower temperature swing
from lower laser energy input, the crack growth was slower.
NASA TP-3676 37

ceramic
i i i i i i i i i i i_.bs._a.teliiiiiiiiiii
(a)cracksinitiatedduringthermalHCFandLCF tests
HCFinteractionlayer
• ....2Tceralmc
............................
............................
........... substrate ...........
(b) crack growth under HCF conditions by surface wedging mechanism
Crack
(c) enhanced surface wedging damage (d) enhanced surface wedging damageby surface crack face shifting by spalled particle intruding
Fig. 20 Schematic diagram illustrating surface wedging mechanism during high cycle
fatigue process.
NASA TP-3676 38
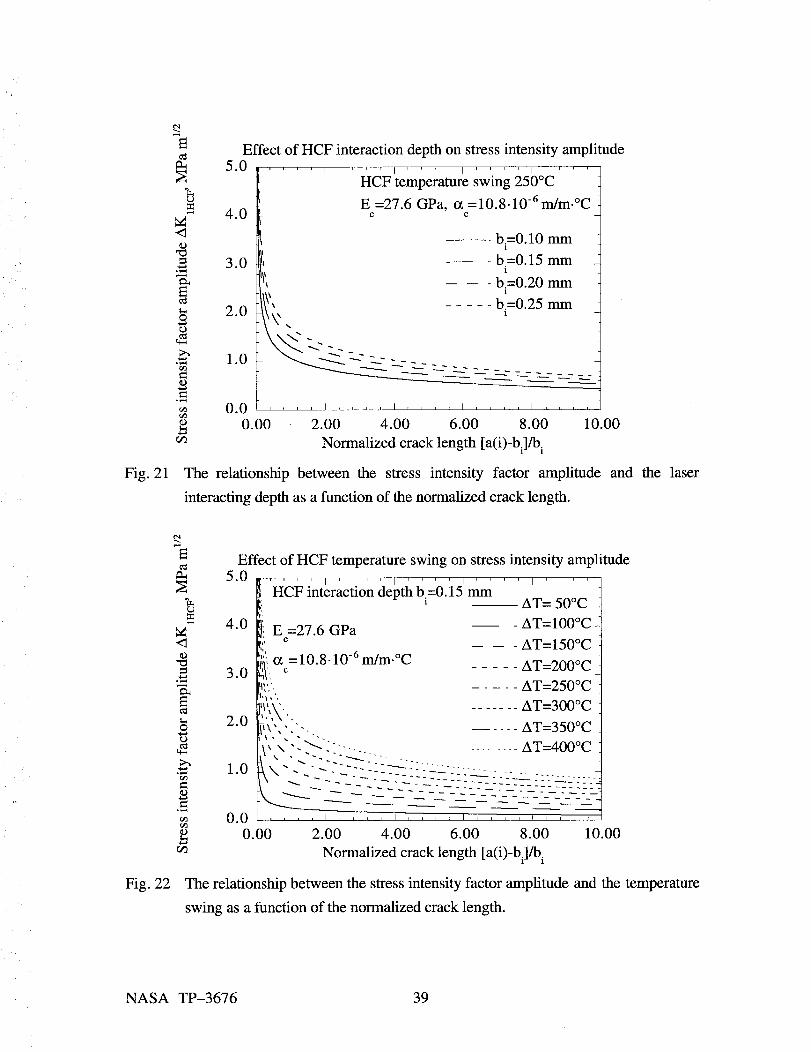
Fig. 21
%u
<1©
@
©
r/3
Effect of HCF interaction depth on stress intensity amplitude
5.0 , , , ,HCF temperature swing 250°C
E =27.6 GPa, o_ =10.8.10 -6 m/m.°C4.0 c
-- b.=0.10 mm1
3.0 - b =0.15 mmi-- -- - b.=0.20 mm
1
..... b.=0.25 mm2.0 1
1.0_'_'- :--_ _----2_:--- :--- --- --- :_- ______:____
0.0 , , , , I , , , , I , , , , I , , , , I , , , ,
0.00 2.00 4.00 6.00 8.00 10.00
Normalized crack length [a(i)-bi]/b i
The relationship between the stress intensity factor amplitude
interacting depth as a function of the normalized crack length.
and the laser
Fig. 22
5.0
- 4.0
= 3.0
o
©
2.0
Effect of HCF temperature swing on stress intensity amplitude
' ' I I I I
HCF interaction depth b =0.15 mmi -- AT= 50°C
E =27.6 GPa - AT=100°CC _ _ _----_--A.[,=/_()ot:
=10.8-10 -6 m/m.°C AT=200ocC .....
_,,,, ..... AT=250°CI,l,' ,
,I,V ........ AT=300°C\ , . .. AT=350°C
, \ "- ."-- 2i ....... - ........ AT=400°C
0.0 .... i .... i .... , .... , .... ,0.00 2.00 4.00 6.00 8.00 10.00
Normalized crack length [a(i)-bi]/b i
The relationship between the stress intensity factor amplitude and the temperature
swing as a function of the normalized crack length.
NASA TP-3676 39
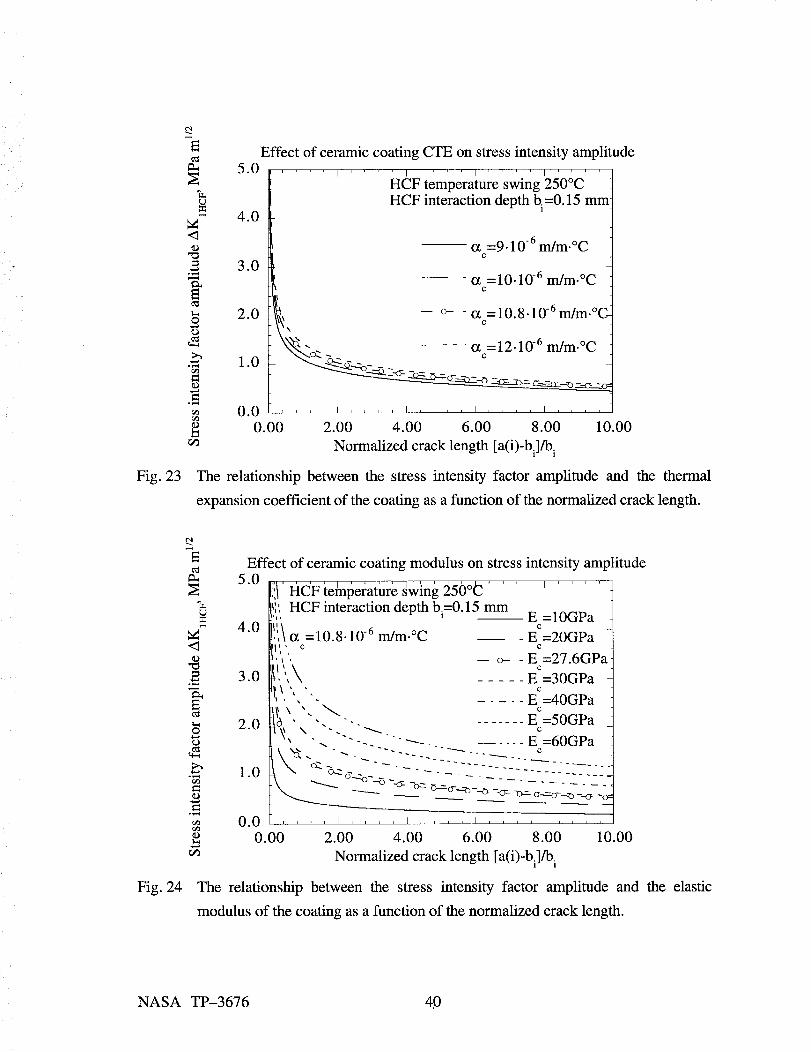
Fig. 23
o
<1©
¢.)
r/3tD
Effect of ceramic coating CTE on stress intensity amplitude
5.0 , , , ,HCF temperature swing 250°CHCF interaction depth b. =0.15 mm
4.0 '
-- ¢_ =9.10-6m/m.°CC
3.0- _ =10.10 -6 rn/m.°C
C
- t_ =10.8.10-6 m/m.°C-- On2.0 '__x c
• 6_._ ..... m/m.OCt_c=12.10-
1.0 __._ _ _ _
00. .... i .... i .... i .... i ....0.00 2.00 4.00 6.00 8.00 10.00
Normalized crack length [a(i)-bi]/b i
The relationship between the stress intensity factor amplitude and the thermal
expansion coefficient of the coating as a function of the normalized crack length.
r.9
<1_D
Fig. 24
o
o
4.a
_D
2=¢¢k©
Effect of ceramic coating modulus on stress intensity amplitude5.0
i'l .... i .... I : ' ' i.. HCF temperature swing 250°_
iq', HCF interaction depth b.=0.15 mm',. ' -- E =10GPa4.0 _, t_ =10.8.10 -6 m/m.°C - E =20GPa
II _ ' C C.', '. -- o- - E =27.6GPa
3.0 ll.",\ ..... Ec=30GPa -
L_\ "- _ ..... E_=40GPa
t6 _ _ E =50GPa2.0 ... - ......x \ " "_. c--. "'_-. -- .... E =60GPa
_.- ........... ____ c1.0 _-" -_ _ - .............. U-Zj\ _z _..v._..zo_ - ................
_ "<Y- o-= O_.mo--..=o_. _ --cv- _ _Y---=-o----_ -c_ o=
0.0 .... i .... i .... i .... i ....0.00 2.00 4.00 6.00 8.00 10.00
Normalized crack length [a(i)-bi]/b i
The relationship between the stress intensity factor amplitude and the elastic
modulus of the coating as a function of the normalized crack length.
NASA TP-3676 4,0
_I_
Fig. 25 A surface crack propagated deeply into the ceramic coating after 5000
thermal shock cycles at a temperature swing of 700°C. Each laser pulse
heating and cooling cycle consisted of 0.1 second heating and 60 second
cooling, respectively with interaction depth about 0.3 mm.
NASA TP-3676 41

TheInteractionsbetweenLCF andHCFCrackGrowth
StronginteractionsbetweenLCF andHCFhavebeenconfn'medby thepreliminary
experiments.More severecoatingdamagehasbeenobservedfor thecombinedLCF and
HCFtestscomparedto thepureLCF test.Thehighercrackdensityandwider crackwidth
observedin thespecimenswith thehigher testtemperaturesuggestthat significantcoating
sinteringandcreeparedetrimentalto thecoatingfatigueresistance.Higherheatflux near
thebeamcenter,asimposedby thespatialenergydistributionof theGaussianlaserbeam,
resultedin increasedsurfacecrackingandspallation.This resultcanbeexpectedbecausea
higherheatflux will leadto notonly ahighersurfacetemperatureandtemperaturegradient
acrossthecoating(generatingmore significantstressrelaxationat temperatureand thus
moresevereLCF damageaftercooling),butalsoagreatertemperatureswingthatenhances
HCFfailure.It seemsto betruethatbothLCF andHCF areaffectedby thecoatingsystem
configurations.In one dimensionalcoating systems such as angle iron corners and
specimenedges,thecrackingis lesslikely to occurin the lessconstraineddirection,which
is perpendicularto the one dimensionalline direction.This result can be explainedby
consideringthat both the LCF and HCF stresseswould be much lower in the less
constraineddirection. This implies that ff a perfectbond coat strain isolation can be
achieved,the coatingfatigueresistancecould be greatly improved. Further studiesare
requiredto obtainabetterunderstandingof thisphenomenon.
TheinteractionsbetweenLCFandHCFleadto anearlierfailureof thecoating.The
highcyclefatiguecomponentpromotessurfacecrackinitiationand increasessurfacecrackdensities.Thiscausesfastinitial crackpropagationnearthecoatingsurfaceaccordingto the
surfacewedgingmechanism,becauseof theextremelyhigh stressintensityvaluesat the
initial stage. The longer cracks then increasethe subsequentLCF stress intensity
amplitudes,thusleadingto afastercrackgrowthrateundertheLCF mechanism.TheLCF
componentwill acceleratethe subsequentHCF crackgrowth at high temperaturesby
predominantlytwo mechanisms.First,stressrelaxationathightemperatures,which results
from coatingsinteringandcreepunderLCF cycling,aswell asfrom LCF inducedcrack
formationandpropagation,cansignificantlyreducethe effectivecompressivestressesin
thecoating.TheHCFcrackgrowth will be facilitatedby thisprocess.Second,the coating
surfacesinteringunderLCF cyclescouldconsiderablyincreasethecoatingelasticmodulus.
A highercoatingmoduluswill leadto higherHCF stresses,and thus enhancethe HCF
crackgrowth.
NASA TP-3676 42
SUMMARY
The present analysis presents a detailed explanation of the processes occurring
when thick TBCs are subjected to combined thermal low cycle and high cycle fatigue. This
work also provides a framework for developing strategies to manage ceramic layer
sintering and creep, thermal expansion mismatch, and other characteristics of the coating
system. For example, since ceramic sintering and creep are detrimental to the coating
system, creep resistant coatings, especially near the surface region, would be expected to
improve the durability of the system. In addition, since it is well known that LCF behavior
is closely related to the thermal expansion mismatch, good strain isolation provided by
well-structured and compliant bond coats would further improve the fatigue resistance. The
HCF resistance could be effectively achieved by high compressive stresses in the coating.
A high toughness top surface layer with low modulus and thermal expansion coefficient
would also improve the HCF fatigue life. The relative importance of LCF and HCF crack
growth and its correlation with coating stress states, creep behavior and bond coat
properties need to be carefully investigated.
CONCLUSIONS
1. Strong interactions between LCF and HCF have been observed in preliminary
experiments. The combined LCF and HCF tests induced more severe coating damage
compared to the pure LCF test. Significant coating sintering and creep, which are
confirmed to accelerate both the LCF and HCF failure by experiments, are detrimental to
the coating fatigue resistance.
2. In the absence of severe interfacial oxidation, the LCF mechanism is closely related
to coating sintering and creep phenomena at high temperatures. The stress relaxation, at
temperature, induces tensile stresses in the coating after cooling. However, the HCF
mechanism is associated with the surface wedging process. The HCF damaging effect will
increase with the heat flux, thus the temperature swing, the thermal expansion coefficient
and the elastic modulus of the ceramic coating, as well as the HCF interaction depth.
NASA TP-3676 43
ACKNOWLEDGMENT
Thisworkwasperformedwhile thefirst authorhelda NationalResearchCouncil-
NASA Lewis ResearchCenterResearchAssociateshippartially supportedby the Army
ResearchLaboratoryattheNASA LewisResearchCenter.The authorsareindebtedto M.
Brad Beardsley,CaterpillarInc., for valuablediscussions.The authorsare grateful to
GeorgeW. LeisslerandSandraL. Skotkofor their assistancein the preparationof TBC
coatingsandmetallographicspecimens,andto DennisL. Weismantelfor his assistancein
thelaserwaveformmeasurementandrelateddataacquisition.
[1]
[2]
[3]
[4]
[5]
[6]
REFERENCES
Yonushonis, T. M., "Thick Thermal Barrier Coatings for Diesel Components",
NASA CR-187111, August 1991.
Beardsley, M. B. and Larson, H. J., "Thick Thermal Barrier Coatings for Diesel
Components", DOE/NASAl0332-1, NASA CR - 190759, 1992.
Miller, R. A., "Assessment of Fundamental Materials Needs for Thick Thermal
Barrier Coatings for Truck Diesel Engines", NASA TM-103130,
DOE/NASAl21794-1, May, 1990.
Morel, T., "Analysis of Heat Transfer in LHR Engines: A. Methodology,
Validation, Applications; B. Translucence Effects in Ceramics", in Proceedings of
the 1987 Coatings for Advanced Heat Engines Workshop (eds. Fairbanks, J.),
II17-II28, Castine, Maine, July 27-30, 1987.
Dickey, D., Vinyard, S., Callahan, T. and Keribar, R., "The Effect of Insulated
Diesel Surfaces on Performance, Emissions and Combustion", in Proceedings of
the Twenty-Fifth Automotive Technology Development Contractors' Coordination
Meeting, 49-56, P209, Dearborn, Michigan, October 26-29, 1988.
Zhu, D. and Miller, R. A., "Evaluation of Oxidation Damage in Thermal Barrier
Coating Systems", NASA TM107360, Army Research Laboratory TR ARL-TR-
1254, November 1996. Also in "Fundamental Aspects of High Temperature
Corrosion" (eds. Shores, D. A., Rapp, R. A. and Hou, P. Y), 289-307, The
Electrochemical Society, Inc., Pennington, New Jersey, 1997.
NASA TP-3676 44

[7]
[8]
[9]
[10]
[11]
[12]
[13]
[14]
[15]
[16]
[17]
[18]
Zhu, D. and Miller, R. A., "On Delamination Mechanisms of Thick Thermal
Barrier Coating Systems under Thermal Fatigue Conditions", in preparation,
1997.
Takeuchi, Y. R. and Kokini, K., "Thermal Fracture of Multilayer Ceramic
Thermal Barrier Coatings", Journal of Engineering for Gas Turbines and Power,
116, 266-271, 1994.
Kokini, K., Choules, D. B. and Takeuchi, Y., "Thermal Fracture Mechanisms in
Ceramic Thermal Barrier Coatings", in Thermal Barrier Coating Workshop (eds.
Brindley, W. J.), 235-250, Cleveland, Ohio, March 27-29, 1995.
Sidewell, C. V. and Cruse, T. A., "Mechanical Testing Program for Thermal
Barrier Coating Development", Report 960801, 1996.
Kokini, K., Takeuchi, Y. R. and Choules, B. D., "Surface Thermal Cracking of
Thermal Barrier Coatings owing to Stress Relaxation: Zirconia vs. Mullite",
Surface and Coating Technology, 82, 77-82, 1996.
Zhu, D. and Miller, R. A., "Investigation on Thermal Fatigue Behavior of Thermal
Barrier Coatings", in International Conference on Metallurgical Coatings and
Thin Films, ICMCTF 97 San Diego, California, April 21-23, 1997.
Luxon, J. T. and Parker, D. E., "Industrial Lasers and Their Applications",
Prentice-Hall, Inc., Englewood Cliffs, New Jersey, 1985.
Milonni, P. W. and Eberly, J. H., "Lasers", John Wiley & Sons, New York, 1988.
Johnsen, B. P., Cruse, T. A., Miller, R. A. and Brindley, W. J., "Compressive
Fatigue of a Plasma Sprayed ZrO2-8%Y203 and ZrO2-10%NiCrA1Y TTBC",
Journal of Engineering Materials and Technology, 117, 305-310, 1995.
Thurn, G., Schneider, G. A. and Aldinger, F., "High-temperature Deformation of
Plasma-sprayed ZrO2-Thermal Barrier Coatings", Materials Science and
Engineering, to be published, 1996.
Liu, S.-Y. and Chen, I.-W., "Fatigue of Yttria-Stablized Zirconia:II, Crack
Propagation, Fatigue Striations, and Short-Crack Behavior", Journal of the
American Ceramic Society, 74, 1206-1216, 1991.
Dauskardt, R. H., James, M. R., Porter, J. R. and Ritchie, R. O., "Cyclic Fatigue-
crack Growth in a SiC-whisker-reinforced Alumina Ceramic Composite: Long-
and Small-crack Behavior", Journal of the American Ceramic Society, 75, 759-
771, 1992.
NASA TP-3676 45
[19] Dauskardt,R. H., Dalgleish,B. K., Yao, D., Ritchie,R. O. andBecher,P. T.,
"Cyclic Fatigue-crack Propagation in a Silicon Carbide Whisker-reinforced
Alumina Composite: Role of Load Ratio", Journal of Materials Science, 28, 3258-
3266, 1993.
[20] Paris, P. C., Gomez, M. P. and Anderson, W. E., "A Rational Analytic Theory of
Fatigue", The Trend in Engineering, 13, 9-14, 1961.
[21] Murakami, Y., "Stress Intensity Factors Handbook", 108, Pergamon Press,
Oxford, 1987.
NASA TP-3676 46
i ¸ 5'
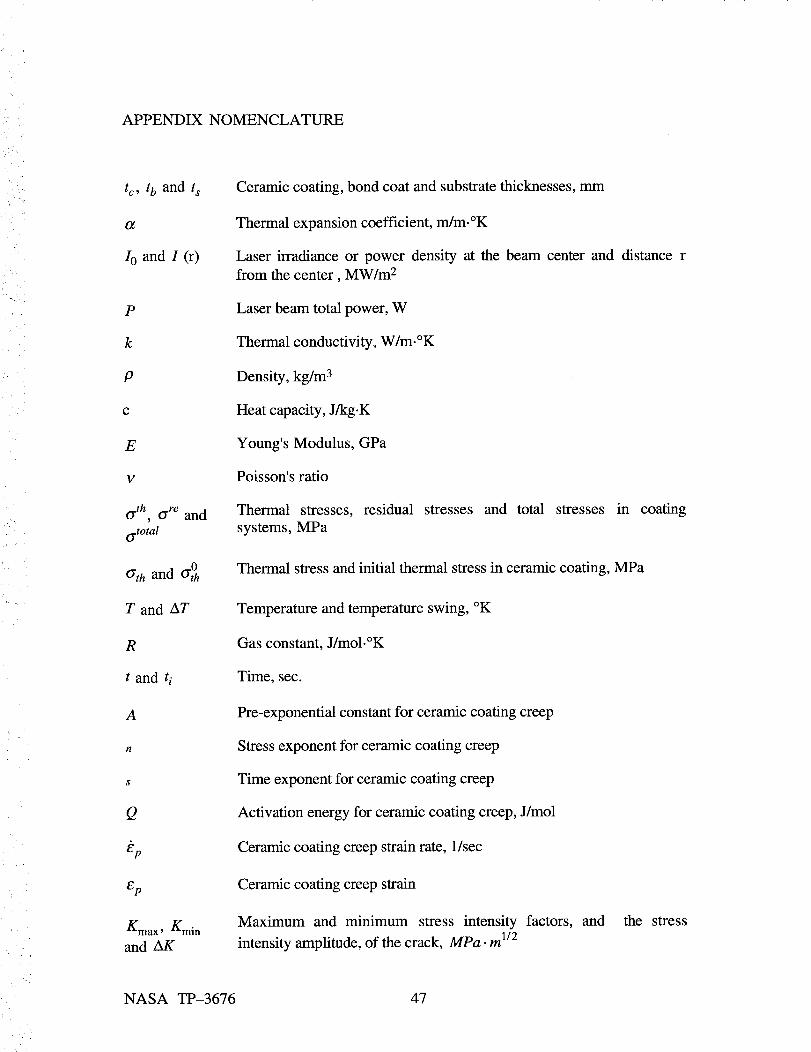
APPENDIX NOMENCLATURE
tc, t b and ts
Ot
I0 and I (r)
P
k
P
C
E
V
(7 th, t7 re and
tTtotal
O'th and _o
T and AT
R
t and ti
A
n
s
Q
ep
Ep
Km , Kminand AK
Ceramic coating, bond coat and substrate thicknesses, mm
Thermal expansion coefficient, m/m.°K
Laser irradiance or power density at the beam center and distance r
from the center, MW/m e
Laser beam total power, W
Thermal conductivity, W/m-°K
Density, kg/m 3
Heat capacity, J/kg.K
Young's Modulus, GPa
Poisson's ratio
Thermal stresses, residual stresses and total stresses in coating
systems, MPa
Thermal stress and initial thermal stress in ceramic coating, MPa
Temperature and temperature swing, °K
Gas constant, J/mol.°K
Time, sec.
Pre-exponential constant for ceramic coating creep
Stress exponent for ceramic coating creep
Time exponent for ceramic coating creep
Activation energy for ceramic coating creep, J/mol
Ceramic coating creep strain rate, 1/sec
Ceramic coating creep strain
Maximum and minimum stress intensity factors, and the stress
intensity amplitude, of the crack, MPa. m 1/2
NASA TP-3676 47
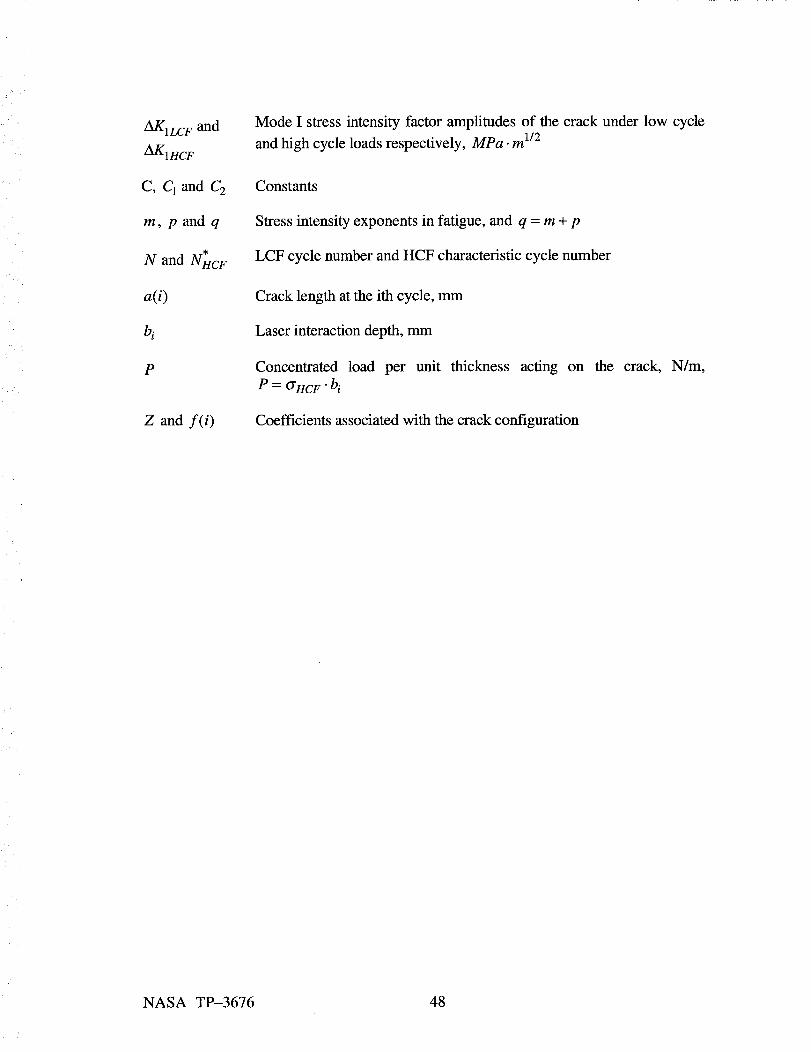
z_t¢f l LCF and
AK1HcF
C, C1 and C2
m, p and q
N and NHC F
a(i)
bi
P
Z and f(i)
Mode I stress intensity factor amplitudes of the crack under low cycle
and high cycle loads respectively, MPa. m 1/2
Constants
Stress intensity exponents in fatigue, and q = m + p
LCF cycle number and HCF characteristic cycle number
Crack length at the ith cycle, mm
Laser interaction depth, mm
Concentrated load per unit thickness acting on the crack, N/m,
P = tYHCf •bi
Coefficients associated with the crack configuration
NASA TP-3676 48


Form ApprovedREPORT DOCUMENTATION PAGE OMB No. 0704-0188
Public reporting burden for this collection of information is estimated to average 1 hour per response, including the time for reviewing instructions, searching existing data sources,
gathering and maintaining the data needed, and completing and reviewing the collection of information. Send comments regarding this burden estimate or any other aspect of this
collection of information, including suggestions for reducing this burden, to Washington Headquarters Services, Directorate for Information Operations and Reports, 1215 Jefferson
Davis Highway, Suite 1204, Arlington, VA 22202-4302, and to the Office of Management and Budget, Paperwork Reduction Project (0704-0188), Washington, DC 20503.
1. AGENCY USE ONLY (Leave blank) 2. REPORT DATE 3. REPORTTYPE AND DATES COVERED
May 1997 Technical Paper
4. TITLE AND SUBTITLE 5. FUNDING NUMBERS
Influence of High Cycle Thermal Loads on Thermal Fatigue Behavior of
Thick Thermal Barrier Coatings
6. AUTHOR(S)
Dongming Zhu and Robert A. Miller
7. PERFORMING ORGANIZATION NAME(S) AND ADDRESS(ES)
NASA Lewis Research Center
Cleveland, Ohio 44135- 3191and
U.S. Army Research LaboratoryCleveland, Ohio 44135-3191
9. SPONSORING/MONITORING AGENCY NAME(S) AND ADDRESS(ES)
National Aeronautics and Space Administration
Washington, DC 205464)001and
U.S. Army Research Laboratory
Adelphi, Maryland 20783-1145
WU-523-21-13
1L161102AH45
8. PERFORMING ORGANIZATION
REPORT NUMBER
E-10691
10. SPONSORING/MONITORINGAGENCY REPORT NUMBER
NASA TP-3676
ARL-TR-1341
11. SUPPLEMENTARY NOTES
Responsible person, Dongming Zhu, organization code 5160, (216) 433-3161.
12a. DISTRIBUTION/AVAILABILITY STATEMENT
Unclassified - Unlimited
Subject Categories 23 and 24
This publication is available from the NASA Center for AeroSpace Information, (301) 6214390.
12b. DISTRIBUTION CODE
13. ABSTRACT (Maximum 200 words)
Thick thermal barrier coating systems in a diesel engine experience severe thermal low cycle fatigue (LCF) and high cycle
fatigue (HCF) during engine operation. In the present study, the mechanisms of fatigue crack initiation and propagation, as
well as of coating failure, under thermal loads which simulate engine conditions, are investigated using a high power CO 2
laser. In general, surface vertical cracks initiate early and grow continuously under LCF and HCF cyclic stresses. It is
found that in the absence of interfacial oxidation, the failure associated with LCF is closely related to coating sintering and
creep at high temperatures, which induce tensile stresses in the coating after cooling. Experiments show that the HCF
cycles are very damaging to the coating systems. The combined LCF and HCF tests produced more severe coating surface
cracking, microspallation and accelerated crack growth, as compared to the pure LCF test. It is suggested that the HCF
component cannot only accelerate the surface crack initiation, but also interact with the LCF by contributing to the crack
growth at high temperatures. The increased LCF stress intensity at the crack tip due to the HCF component enhances the
subsequent LCF crack growth. Conversely, since a faster HCF crack growth rate will be expected with lower effective
compressive stresses in the coating, the LCF cycles also facilitate the HCF crack growth at high temperatures by stress
relaxation process. A surface wedging model has been proposed to account for the HCF crack growth in the coating
system. This mechanism predicts that HCF damage effect increases with increasing temperature swing, the thermal
expansion coefficient and the elastic modulus of the ceramic coating, as well as the HCF interacting depth. A good
agreement has been found between the analysis and experimental evidence.
14.
17.
SUBJECT TERMS
Thermal barrier coatings; Thermal high cycle and low cycle fatigue;
Ceramic sintering and creep; Fatigue mechanisms
SECURITY CLASSIFICATION
OF REPORT
Unclassified
18. SECURITY CLASSIFICATIONOF THIS PAGE
Unclassified
19. SECURITY CLASSIFICATION
OF ABSTRACT
Unclassified
15. NUMBER OF PAGES51
16. PRICE CODE
A04
20. LIMITATION OF ABSTRACT
NSN 7540-01-280-5500 Standard Form 298 (Rev. 2-89)Prescribed by ANSI Std. Z39-18298-102