NASA Revised Phase III Response to NTIA 1755-1850 MHz ... · NASA Phase III REPORT NASA Revised...
61
1 NASA Phase III REPORT NASA Revised Phase III Response to NTIA 1755-1850 MHz Relocation Revision 2 October 5, 2011
Transcript of NASA Revised Phase III Response to NTIA 1755-1850 MHz ... · NASA Phase III REPORT NASA Revised...

1
NASA Phase III REPORT
NASA Revised Phase III Response to NTIA
1755-1850 MHz Relocation
Revision 2
October 5, 2011

2
Table of Contents
I. Introduction and Executive Summary ......................................................................................... 3
II. Relocation of NASA Assignments ............................................................................................. 7
II.A. NASA Wallops Flight Facility (WFF) 1755-1850 MHz Operations and Relocation Plan 7
II.B. NASA Langley Research Center (LaRC) 1755-1850 MHz Operations and Relocation Plan ............................................................................................................................................. 8
II.C. NASA Dryden Flight Research Center (DFRC) 1755-1850 MHz Operations and Relocation Plan ........................................................................................................................... 8
II.D. NASA Johnson Space Center (JSC) 1755-1850 MHz Operations and Relocation Plan ... 9
EXHIBIT 1 - Wallops Flight Facility (WFF) ......................................................................... 9
EXHIBIT 2 - Wallops Flight Facility (WFF) ....................................................................... 11
EXHIBIT 3 - Langley Research Center (LaRC) ................................................................... 12
EXHIBIT 4 - Langley Research Center (LaRC) ................................................................... 12
EXHIBIT 5 - Dryden Flight Research Center (DFRC) ........................................................ 16
EXHIBIT 6 - Dryden Flight Research Center (DFRC) ........................................................ 17
III. Relocation of Other Agencies and Departments to NASA Bands .......................................... 20
III.A. 2025-2110 MHz Band ..................................................................................................... 20
III.B. 2200-2290 MHz Band ..................................................................................................... 36
III.C. 2360-2395 MHz Band ..................................................................................................... 54
III.D. 4400-4940 MHz Band ..................................................................................................... 54
III.E. 5091-5250 MHz Band ..................................................................................................... 55
III.F. 7125-8500 MHz Band ..................................................................................................... 56

3
NASA Phase III Response to NTIA Regarding 1755-1850 MHz Relocation
October 5, 2011
I. Introduction and Executive Summary This report describes NASA’s current operations and relocation strategy related to the 1755-1850 MHz band which is being considered by NTIA for reallocation to the commercial wireless broadband service. NASA has a total of 18 Radio Frequency Assignments (RFAs) in the band supporting aeronautical telemetry/telecommand operations for a variety of aircraft research and flight test programs involving manned aircraft, unmanned aerial vehicle/remote piloted vehicle (UAV/RPVs), and high altitude scientific balloons. There is also a single RFA supporting Shuttle space-to-space communications. These operations are under the control of four NASA Centers: (1) Wallops Flight Facility (WFF); (2) Langley Research Center (LaRC); (3) Dryden Flight Research Center (DFRC); and (4) Johnson Space Center (JSC). For this Phase III effort, the NASA Headquarters Spectrum Office requested that each of these Centers provide an update of their relocation plans that identifies comparable/preferable bands for relocating their 1755-1850 MHz operations and estimates of the time and cost to transition to these bands. The NASA Phase II report of June 1, 2011 contained initial estimates and Section II of this report contains the updated estimates. Note in this Report, the term “telemetry” refers to air-to-ground/downlink transmissions while “telecommand” refers to ground-to-air/uplink transmissions. Of the (18) NASA RFAs: nine support aero-telemetry, eight support aero-telecommand and one supports Shuttle short range space-to-space communications. Bands that have been identified for relocation of aero telemetry/telecommand operations are: 1435-1525 MHz; 2360-2395 MHz; and 4400-4940 MHz. These are all existing aero-telemetry/telecommand bands currently being used by NASA for similar operations. For WFF, time for relocation is estimated to be 12-24 months with estimated costs of $0.6M, if migrating to 1435-1525/2360-2395 MHz or $6M, if migrating to 4400-4940/5091-5150 MHz. For LaRC, time for relocation is estimated to be 12-18 months with an estimated cost of $4.189M, based on a migration to 4400-4940 MHz. For DFRC, time for relocation is estimated to be 36-60 months with an estimated base cost of $27.3M based on migration to the 2025-2110 MHz and 4400-4940/5091-5150MHz bands. If the installation requires the full 60 months, the estimated cost would be $30.7M. For JSC, NASA does not intend to relocate the Shuttle RFA since the Space Shuttle program ended July 31, 2011. NASA HQ coordination and technical support for the NASA Centers is estimated to be 12-36 months with a cost of $0.4M. Thus, total NASA base cost to relocate from the 1755-1850 MHz band is approximately $35.5M with an upper estimated limit of $41.3M .
As described in Section III, NASA also has conducted compatibility analysis for potential relocation of some types of federal operations from the 1755-1850 MHz band to two of its most critical space operation bands: 2025-2110 MHz and 2200-2290 MHz.

4
With regard to the 2025-2110 MHz band, NASA currently has 209 RFAs in the band. As shown in Figure 1, this band is used to support (direct-from-ground) satellite uplinks and Tracking Data and Relay Satellite (TDRS) forward links (GEO TDRS-to-LEO satellite). The victim receivers in this case are therefore onboard LEO satellites. The analysis focused on the TDRS forward links (interference path #2 in Figure 1), since these are more vulnerable to interference than the direct uplinks due to the relatively weak TDRS forward link signal to the LEO satellites. Only DoD has identified the 2025-2110 MHz band for relocation of some of its systems.
Section III.A.1 of the Report considers the 2025-2110 MHz band and interference from DoD SGLS (Space Ground Link System) uplink operations to the NASA TDRS forward links. In this analysis, interference from 13 different SGLS earth stations were considered along with 21 different NASA TDRS user satellites and 3 different TDRS satellites. Based on DoD provided SGLS data, the analysis shows that for the LEO case, where DoD SGLS earth stations are transmitting to LEO satellites, interference levels from the DoD earth stations exceed the ITU-R recommended TDRS forward link interference threshold (i.e. I/N = -10 dB not to be exceeded more than 0.1% of the time) for about 9% of the TDRS user cases analyzed. For the GEO case, where DoD earth stations are transmitting to GEO satellites, interference levels exceed the ITU-R threshold in about 17% of the TDRS user cases analyzed. Accommodation of DoD SGLS in the band therefore appears workable. NASA recommends that DoD avoid using frequencies in the TDRS MAF portion of the band (the 6.2 MHz between 2103.3 – 2109.5 MHz) due to the large number of user spacecraft that NASA supports over this channel. DoD has indicated that they will attempt to avoid assignments in the MAF band. However, they also stated that they will use it if required, and if so, this use will be coordinated with NASA via the DoD/NASA/NOAA frequency pre-coordination process and the FAS.
Section III.A.2 of the Report considers the 2025-2110 MHz band and interference from other DoD systems (i.e. ACTS, TRR, UAS) to the NASA TDRS forward links. Based on the specific parameters and assumptions used in the analysis, it appears that accommodation of these DoD systems – with the exception of ACTS in its present form - is possible. It must be emphasized, however, that this conclusion is based on the assumption that the transmit/deployment characteristics of the DoD TRR and UAS systems moving into the band are consistent with those used in the analysis. This conclusion does not hold if there is significant deviation from these characteristics. With regard to ACTS, based on the characteristics we have on these systems from DoD (which represent current 1755-1850 MHz operation), the interference from ACTS alone exceeds the ITU criteria by about 5-9 dB and therefore remains a concern. The analysis assumed only (4) co-frequency interfering emitters (located in NV,AZ,FL,VA), but the ACTS transmit power is very high (100W) and uses non-directional/omni antennas along with large duty cycles (50%). These types of transmit characteristics make it difficult to share with DRS systems on a co-frequency basis. There has been some discussion with DoD of using frequency avoidance for ACTS so that they do not operate co-frequency with TDRSS forward links, but DoD has stated that at this point it is not a primary option. NASA will continue to work with DoD to investigate improvements to the current ACTS (e.g. different modulations, spread spectrum, power, antenna characteristics, etc.) to ensure compatibility with NASA systems as these systems move into the band.

5
Section III.B of the Report considers the 2200-2290 MHz band. This band is also a critical space operation band for NASA. NASA currently has 207 RFAs in the band. As shown in Figure 2, this band is used to support (direct space-to-ground) satellite downlinks (i.e. victim receivers at NASA earth stations); TDRS return links (i.e. links from LEO satellites to GEO TDRS satellites with victim receivers onboard the GEO TDRS satellites); air-to-ground telemetry (i.e. victim receivers are at ground stations receiving telemetry from aircraft and launch vehicles); and ISS (International Space Station) proximity operations with nearby resupply spacecraft. A number of agencies (DoD, Treasury, USPS, DHS, DOJ, DOI) have proposed moving some of their 1755-1850 MHz operations, primarily video surveillance and military TRR, into the band. Therefore NASA has performed analysis of interference from these systems to its satellite receiving earth stations; aero-telemetry receiving ground stations; and to the TDRS return links. NASA satellite receiving earth stations and aircraft telemetry receiving ground stations will require protection from incoming transmitters using appropriate coordination contours around the earth station and telemetry sites. The Report provides some sample coordination contours based on the expected EIRP levels of video surveillance systems. Additional coordination contours may be required for protection from DoD TRR systems if they move into the band. Note DoD has identified the 2025-2110 MHz band as the primary band for TRR, but also selected 2200-2290 MHz as an alternate band. Analysis was also performed to assess the impact to NASA TDRSS return links. Based on the system characteristics of DoD, DHS, DOJ, DOI, and Treasury systems described in the Report, it appears that interference from these systems into the NASA TDRSS return links is acceptable. Again, however, this conclusion is only valid as long as there is no significant deviation of these agency system characteristics from those used in the analysis.

6
Figure 1.Interference Scenarios for NASA 2025-2110 MHz Operations

7
Figure 2. Interference Scenarios for NASA 2200-2290 MHz Operations
II. Relocation of NASA Assignments
The NASA Phase II Report of June 1, 2011 contains detailed descriptions of NASA’s current operations and assignments in the 1755-1850 MHz band. It also contains initial cost estimates and timelines for relocation. We therefore did not include all that data here. The information below contains updated relocation cost and timeline data from the various NASA Centers.
II.A. NASA Wallops Flight Facility (WFF) 1755-1850 MHz Operations and Relocation Plan
NASA WFF, located on Virginia’s Eastern Shore, currently has (7) RFAs in the 1755-1850 MHz band supporting UAV video telemetry and high altitude scientific balloon video/data telemetry. WFF plans to transition these RFAs to other aero-telemetry bands (i.e. 1435-1525/2360-2395 MHz) where similar NASA operations are being conducted. The specific transition frequencies in these bands are:

8
A. Primary Band Selection:
1. 1440 MHz, 10 MHz BW 2. 1470 MHz, 10 MHz BW 3. 1490 MHz, 10 MHz BW 4. 2365 MHz, 10 MHz BW 5. 2380 MHz, 10 MHz BW 6. 2390 MHz, 10 MHz BW
B. Secondary Band Selection in order:
1. 4400-4940 MHz or 2. 5091-5250 MHz (Telemetry - Regulatory Action Required).
In the 1435-1525/2360-2395 MHz bands, NASA has contacted existing assignment holders (Air Force, Army, and Navy) and there is no additional coordination required. NASA has existing assignments and operations in these bands as well. If we are able to relocate to these two bands the estimated cost would be $ 600K with a relocation time frame of 12 to 18 months. See Exhibits 1 and 2 below.
If we are unable to relocate to the above primary bands and instead choose either of the secondary bands, the cost will increase significantly due to the need to purchase all new equipment. The estimated cost then would be in the neighborhood of $ 6M with a relocation time frame of up to 24 months. See Exhibits 1 and 2 below.
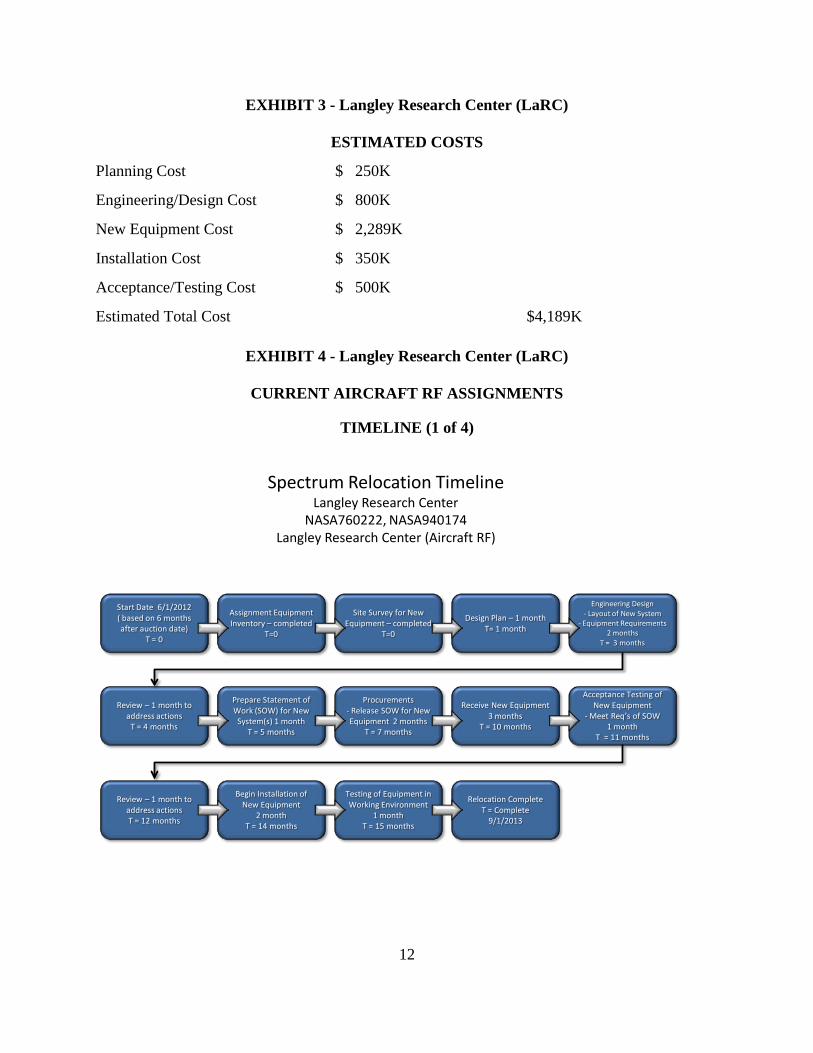
II.B. NASA Langley Research Center (LaRC) 1755-1850 MHz Operations and Relocation Plan NASA LaRC, located in Hampton, VA, has (7) RFAs in the 1755-1850 MHz band. Six of these support telecommand links and one supports telemetry for various UAV and research aircraft projects. NASA already has similar aero-telemetry/telecommand operations in the 4400-4940 MHz band and therefore LaRC plans to transition all these RFAs to that band. NASA has contacted existing assignment holders (Air Force, Army, Coast Guard, DHS, DOE, Marine Corps, Treasury and USPS) and there is no additional coordination required. NASA has existing assignments and operations in these bands as well. Estimated relocation time is 18 months and cost is $4.189M. Please see Exhibits 3 (cost estimate) and 4 (relocation timelines for the various RFAs) below.
II.C. NASA Dryden Flight Research Center (DFRC) 1755-1850 MHz Operations and Relocation Plan NASA DFRC, located at Edwards, CA, in the western Mojave Desert and adjacent to Edwards Air Force Base, is NASA’s primary center for atmospheric flight test research and operations. DFRC has 3 RFAs in 1755-1850 MHz, all at 1804.5 MHz, to provide flight test telemetry (1 RFA) and telecommand links (2 RFAs) for developmental aircraft and RPVs in the R-2508 test

9
airspace. DFRC provides both telemetry and telecommand services for internal and external customers and since the demand for these services is ongoing and growing, they will pursue several relocation avenues to ensure that they maintain the capability required by their customers. NASA has contacted existing assignment holders and there is no additional coordination required. NASA has existing assignments and operations in these bands as well.
A. Planned Relocation Bands:
1. 2025-2110 MHz Band (for telecommand ops) (Federal Aeronautical Mobile - Regulatory Action Required)
2. 4400-4940 MHz Band (for both telecommand and telemetry)
3. 5091-5150 MHz Band (for telemetry)
Relocation of telecommand to the 2025-2110 MHz band would require regulatory action for a (Federal) aeronautical mobile service allocation (currently there is a non-fed only MOBILE service allocation). NASA has contacted existing assignment holders (Air Force, Army, DOE) in the 2025-2110/4400-4940 MHz bands and there is no additional coordination required. NASA has assignments in these bands. With regard to the 4400-4940 MHz band, NASA has 10 RFAs in the band to support similar video/data telemetry operations for high performance aircraft and UAVs. NASA has contacted existing assignment holders (Air Force, Army, Coast Guard, DHS, DOE, Marine Corps, Treasury and USPS) and no further coordination is required. Aero-telemetry use of 5091-5150 MHz will require regulatory action for a new aeronautical mobile service allocation that allows aero telemetry. NASA has contacted government assignment holders in the band (Air Force and FAA) and there has been no objection to potential relocation. Estimated relocation time is 3 to 5 years. Please see Exhibits 5 and 6.
II.D. NASA Johnson Space Center (JSC) 1755-1850 MHz Operations and Relocation Plan The one assignment in this band that the Johnson Space Center has in the band is being cancelled due to the end of the Space Shuttle Program and will not be replaced.
EXHIBIT 1 - Wallops Flight Facility (WFF)
COSTS
Option 1: Total approximately $.5M to $.6M
Requested Frequencies: Three L-Band allocations: 1440.0 MHz, 1470.0 MHz, 1490.0 MHz all 10MHz wide. Three S-Band allocations: 2365.5 MHz, 2380.5 MHz, 2390.5 MHz all 10 MHz wide.

10
If frequencies are acquired, then: New Equipment cost 1 - Telemetry Receivers to cover wide IF, video capability, SOQPSK 8 dual receiver units @ $54K each (16 Total receivers for PSN, FTS, Winslow) = $432,000 2 - Telemetry Transmitters 8 units @ $8.5K each = $68,000 Option #2: Total Approximately $5M to $6M If we cannot get authorization for the noted channels above then we will have to move to C-Band at much increased cost: Engineering/design costs NRE and link budget analysis for new frequency band: $250,000 Flight Hardware testing, changes to PCM Encoders, NTSC Encoders: $250,000 New Equipment Cost Test equipment to cover C band (Spectrum analyzer, Signal Generator, Wattmeters, PCM Encoders, etc): $500,000 C Band Telemetry transmitters: 8 units @ $16K each = $68,000 Telemetry Receivers 8 dual receiver units @ $54K each = $432,000 Tri-band Telemetry Antenna system, 7 units @ $450K each = $3,150,000 Tri-band Multicoupler, 7 units @ $13K each = $91,000 Flight Antenna for C-band 50 @ 10K each = $50,000 Acceptance/Testing cost Flight Testing, qualification (Batteries, expendables, flight piggyback costs): $250,000 Total Approximately $5M to $6M.

11
EXHIBIT 2 - Wallops Flight Facility (WFF)
12
EXHIBIT 3 - Langley Research Center (LaRC)
ESTIMATED COSTS
Planning Cost $ 250K
Engineering/Design Cost $ 800K
New Equipment Cost $ 2,289K
Installation Cost $ 350K
Acceptance/Testing Cost $ 500K
Estimated Total Cost $4,189K
EXHIBIT 4 - Langley Research Center (LaRC)
CURRENT AIRCRAFT RF ASSIGNMENTS
TIMELINE (1 of 4)
Spectrum Relocation TimelineLangley Research Center
NASA760222, NASA940174Langley Research Center (Aircraft RF)
Start Date 6/1/2012( based on 6 months after auction date)
T = 0
Assignment Equipment Inventory – completed
T=0
Site Survey for New Equipment – completed
T=0
Design Plan – 1 monthT= 1 month
Engineering Design- Layout of New System
- Equipment Requirements 2 months
T = 3 months
Review – 1 month to address actions
T = 4 months
Prepare Statement of Work (SOW) for New
System(s) 1 monthT = 5 months
Procurements- Release SOW for New Equipment 2 months
T = 7 months
Receive New Equipment3 months
T = 10 months
Acceptance Testing of New Equipment
- Meet Req’s of SOW1 month
T = 11 months
Review – 1 month to address actionsT = 12 months
Begin Installation of New Equipment
2 month T = 14 months
Testing of Equipment in Working Environment
1 month T = 15 months
Relocation CompleteT = Complete
9/1/2013

13
EXHIBIT 4 (cont.) - Langley Research Center (LaRC)
CURRENT AIRCRAFT RF ASSIGNMENTSTIMELINE (2 of 4)
Spectrum Relocation TimelineLangley Research Center
NASA940130 Langley Research Center
Start Date 6/1/2012 T = 0
Assignment Equipment Inventory – completed
T=0
Site Survey for New Equipment – completed
T=0
Design Plan – 1 monthT= 1 month
Engineering Design- Layout of New System
-Equipment Requirements 2 months
T = 3 months
Review – 1 month to address actions
T = 4 months
Prepare Statement of Work (SOW) for New System(s) 1 month
T = 5 months
Procurements-Release SOW for New Equipment 2mmonths
T = 8 months
Receive New Equipment4 months
T = 12 months
Acceptance Testing of New Equipment
-Meet Req’s of SOW1 month
T = 13 months
Review – 1 month to address actionsT = 14 months
Begin Installation of New Equipment
1 month T = 15 months
Testing of Equipment in Working Environment
1 month T = 16 months
Relocation CompleteT = Complete 10/1/2013

14
EXHIBIT 4 (cont.) - Langley Research Center (LaRC)
CURRENT AIRCRAFT RF ASSIGNMENTS
TIMELINE (3 of 4)
Spectrum Relocation TimelineLangley Research Center
NASA900122Langley Research Center (Aircraft RF)
Start Date 6/1/2012( based on 6 months after auction date)
T = 0
Assignment Equipment Inventory – completed
T=0
Site Survey for New Equipment – completed
T=0
Design Plan – 1 monthT= 1 month
Engineering Design- Layout of New System
- Equipment Requirements 1 months
T = 2 months
Review – 1 month to address actions
T = 3 months
Prepare Statement of Work (SOW) for New System(s) 1 month
T = 4 months
Procurements- Release SOW for New Equipment 2 months
T = 6 months
Receive New Equipment3 months
T = 9 months
Acceptance Testing of New Equipment
- Meet Req’s of SOW1 month
T = 10 months
Review – 1 month to address actionsT = 11 months
Begin Installation of New Equipment
1 month T = 12 months
Testing of Equipment in Working Environment
1 month T = 13 months
Relocation CompleteT = Complete
7/1/2013

15
EXHIBIT 4 (cont.) - Langley Research Center (LaRC)
CURRENT AIRCRAFT RF ASSIGNMENTS
TIMELINE (4 of 4)
Spectrum Relocation TimelineLangley Research Center
NASA940174, NASA900123,NASA092004Langley Research Center (Aircraft RF)
Start Date 6/1/2012( based on 6 months after auction date)
T = 0
Assignment Equipment Inventory – completed
T=0
Site Survey for New Equipment – completed
T=0
Design Plan – 1 monthT= 1 month
Engineering Design- Layout of New System
- Equipment Requirements 2 months
T = 3 months
Review – 1 month to address actions
T = 4 months
Prepare Statement of Work (SOW) for New System(s) 1 month
T = 5 months
Procurements- Release SOW for New Equipment 2 months
T = 7 months
Receive New Equipment3 months
T = 10 months
Acceptance Testing of New Equipment
- Meet Req’s of SOW1 month
T = 11 months
Review – 1 month to address actionsT = 12 months
Begin Installation of New Equipment
2 month T = 14 months
Testing of Equipment in Working Environment
1 month T = 15 months
Relocation CompleteT = Complete
9/1/2013

16
EXHIBIT 5 - Dryden Flight Research Center (DFRC)
ESTIMATED COSTS
Dryden’s initial estimate had zero spectrum mgt cost as they had considered solely the costs to alter the RF gear performing the function of the RFA. The first three items were added due to the extremely heavy spectrum use at EAFB and the need to be able to more completely monitor usage and respond in timely fashion to RFI/EMI events. The first item is obvious: more/better hardware. The second item addresses improving the site for the monitoring gear (rack mounting, power, A/C, internet connectivity, RF cabling, antennae installation, etc.) and completing and certifying the installation. The third item covers operating and maintaining the spectrum monitoring gear for the 20 years following the transition (the period suggested by the DoD brief). The fourth item includes the operations and maintenance costs associated with the RF gear itself (in this case, the uplink section) for the 20 year period following the transition.

17
EXHIBIT 6 - Dryden Flight Research Center (DFRC)
CURRENT RF ASSIGNMENTS
TIME LINE (1 of 3)
Spectrum Relocation TimelineDFRC (uplink relo to S band)NASA900149, NASA990018
DFRC
Start Date01jun12
Assignment Equipment Inventory08jun12
Site Survey for New Equipment
22jun12
Design Plan15sep12
Engineering Design- Layout of New System
-Equipment Requirements15jan13
Review30feb13
Prepare Statement of Work (SOW) for New
System(s)15may13
Procurements-Release SOW for New
Equipment15jul13
Receive New Equipment15jul15
Acceptance Testing of New Equipment
10nov15
Review24dec15
Begin Installation of New Equipment
02feb16
Testing of Equipment in Working Environment
15may17
Relocation Complete30jun17

18
EXHIBIT 6 (cont.) - Dryden Flight Research Center (DFRC)
CURRENT RF ASSIGNMENTS
TIME LINE (2 of 3)
Spectrum Relocation TimelineDFRC (uplink relo to C band)NASA900149, NASA990018
DFRC
Start Date01jun12
Assignment Equipment Inventory08jun12
Site Survey for New Equipment
22jun12
Design Plan15sep12
Engineering Design- Layout of New System
-Equipment Requirements15jan13
Review30feb13
Prepare Statement of Work (SOW) for New
System(s)15may13
Procurements-Release SOW for New
Equipment15jul13
Receive New Equipment15jul15
Acceptance Testing of New Equipment
10nov15
Review24dec15
Begin Installation of New Equipment
02feb16
Testing of Equipment in Working Environment
15may17
Relocation Complete30jun17

19
EXHIBIT 6 (cont.) - Dryden Flight Research Center (DFRC)
CURRENT RF ASSIGNMENTS
TIME LINE (3 of 3)
Spectrum Relocation TimelineDFRC (aero TM relo to C band)
NASA940205DFRC
Start Date01jun12
Assignment Equipment Inventory15jun12
Site Survey for New Equipment
15jul12
Design Plan15oct12
Engineering Design- Layout of New System
-Equipment Requirements15feb13
Review30mar13
Prepare Statement of Work (SOW) for New
System(s)15jun13
Procurements-Release SOW for New
Equipment15aug13
Receive New Equipment15aug15
Acceptance Testing of New Equipment
10dec15
Review24jan16
Begin Installation of New Equipment
01mar16
Testing of Equipment in Working Environment
15may17
Relocation Complete30jun17
20
III. Relocation of Other Agencies and Departments to NASA Bands
III.A. 2025-2110 MHz Band
III.A.1. Relocation of DoD SGLS/Satellite TT&C Operations into 2025-2110 MHz Band
III.A.1.a. Background As a result of the Broadband relocation efforts, the DoD has indicated that it intends to use Unified S-band (USB, 2025-2110 MHz band) for uplinks to future DoD spacecraft. NASA has a large number of Tracking and Data Relay Satellite (TDRS) forward link users that receive commands from TDRS in the 2025-2110 MHz band. This analysis summarizes the interference results from DoD uplinks into NASA TDRS forward links based on the latest information provided by DoD.
III.A.1.b. DoD Uplink Parameters USB uplink characteristics used in this analysis are based on the latest information provided by DoD in response to Action Item 2011Mar/01 from the most recent NASA/DoD/DoC pre-coordination meeting in March 2011. These characteristics are summarized as follows:
• DoD earth station transmitted nominal power is 1325W for all stations;
• DoD uplink antenna gain is 46.43 dBi for all stations and are assumed to use a pattern provided by DoD shown in Figure 3a below. The simulations use an envelope of this pattern which is shown in Figure 3b below;
• Potential interference is modeled from 7 AFSCN (Air Force Satellite Control Network) ARTS (Automated Remote Tracking Station) earth stations for the LEO case and 6 AFSCN ARTS earth stations for the GEO case;
• It is assumed that each DoD earth station uplink may transmit to either a low Earth orbit (LEO) or geostationary (GEO) DoD satellite, with parameters shown in Table 1;
• Each DoD earth station transmits to only a single DoD satellite at any given time;
• DoD uplinks to LEOs operate with 70% duty cycle during an orbital pass;
• DoD uplinks to GEOs will generally operate with a 5.6% duty cycle (80 minutes/day).

21
Figure 3a. DoD Provided SGLS Antenna pattern
Figure 3b. Envelope of DoD SGLS Antenna pattern
-20
-10
0
10
20
30
40
50
0 1 2 3 4 5 6 7 8 9 10 11 12 13 14 15 16 17 18 19 20
Ant
enna
gai
n (d
Bi)
Antenna off axis angle (deg.)

22
Table 1. Key Uplink Parameters
Transmit Earth Station Receive Spacecraft
Name Lat. (deg.)
Long. (deg.)
Power (W)
Ant. Gain (dBi)
Orbit Type
Long. (deg.)
Alt. (km)
Inc. (deg.)
Vandenburg, CA 34.82 -120.5 1325 46.43 LEO n/a 800 98.7 Diego Garcia -7.27 72.37 1325 46.43 LEO n/a 800 98.7 Oakhangar, England 51.12 0.91 1325 46.43 LEO n/a 800 98.7 Guam 13.62 144.86 1325 46.43 LEO n/a 800 98.7 New Boston, NH 42.94 -72.37 1325 46.43 LEO n/a 800 98.7 Thule, Greenland 76.52 -69.4 1325 46.43 LEO n/a 800 98.7 Hawaii 21.56 -159.8 1325 46.43 LEO n/a 800 98.7 Vandenburg, CA 34.82 -120.5 1325 46.43 GEO -105 35786 0 Diego Garcia -7.27 72.37 1325 46.43 GEO 50 35786 0 Oakhangar, England 51.12 0.91 1325 46.43 GEO -23 35786 0 Guam 13.62 144.86 1325 46.43 GEO 180 35786 0 New Boston, NH 42.94 -72.37 1325 46.43 GEO -105 35786 0 Hawaii 21.56 -159.8 1325 46.43 GEO 180 35786 0
II.A.1.c. NASA TDRS Forward Link Parameters NASA has a number of S-band Single Access Forward (SSAF) and Multiple Access Forward (MAF) users as illustrated in Figure 4 and Table 2.
Figure 4. SSAF (Yellow) and MAF (blue) users
Table 2. SSAF and MAF TDRS users
System Center
Frequency (MHz)
Bandwidth (MHz)
Date of Bring to Use
Service Type
1 SpaceX - Dragon 2040.5675 6.16 2011/05 SSA 2 Cygnus 2040.5675 6.16 2011/10 SSA 3 CONNECT 2041.0271 6.16 2011/07 SSA 4 WISE 2070.4938 6.16 IN ORBIT SSA 5 TRMM 2076.9396 6.16 IN ORBIT SSA

23
6 ISS 2085.6875 6.16 IN ORBIT SSA 7 MMS 2101.2496 6.16 2014/10 SSA 8 AQUA 2106.4063 6.16 IN ORBIT MA 8 ATV (ESA) 2106.4063 6.16 2007/05 MA 8 AURA 2106.4063 6.16 IN ORBIT MA 8 C/NOFS 2106.4063 6.16 TBD MA 8 CONNECT 2106.4063 6.16 2011/07 MA 8 GLAST 2106.4063 6.16 IN ORBIT MA 8 GP-B 2106.4063 6.16 IN ORBIT MA 8 GPM 2106.4063 6.16 2013/07 MA 8 HST 2106.4063 6.16 IN ORBIT MA 8 HTV (JAXA) 2106.4063 6.16 2009/07 MA 8 LANDSAT-7 (NOAA) 2106.4063 6.16 IN ORBIT MA 8 SWIFT 2106.4063 6.16 IN ORBIT MA 8 TERRA 2106.4063 6.16 IN ORBIT MA 8 RXTE 2106.4063 6.16 IN ORBIT MA
Three TDRS transmitting locations were modeled (41W, 174W, 85E) with several SSAF and MAF user satellites as receivers. Table 3 summarizes the NASA forward link victim parameters used in this analysis.
Table 3. NASA SSAF and MAF System Parameters
Transmit TDRS
Long. (deg.)
Receive Spacecraft
Name BW (MHz)
Center Frequency
(MHz) Alt. (km)
Inc. (deg.)
Ant. Gain (dBi)
Ant. Temp (K)
174 W AURA Forward Link 6.16 2106.406 705 98.2 7.0 240 174 W CONNECT -HGA 6.16 2041.027 400 51.6 12.0 600 174 W Cygnus 6.16 2040.568 460 51.6 1.6 1849 174 W GPM Forward Link 6.16 2106.406 407 65.0 23.0 226 174 W ISS -HGA 6.16 2085.688 400 51.6 12.9 589 174 W MMS Forward Link 6.16 2101.250 35700 28.0 4.0 1023 174 W Swift Forward Link 6.16 2106.406 600 22.0 3.5 139 174 W Terra Forward Link 6.16 2106.406 705 98.2 25.8 410 174 W TRMM -HGA 6.16 2076.940 403 35.0 23.0 513 174 W WISE 6.16 2070.490 500 97.3 6.0 437 41 W AURA Forward Link 6.16 2106.406 705 98.2 7.0 240 41 W CONNECT -HGA 6.16 2041.027 400 51.6 12.0 600 41 W Cygnus 6.16 2040.568 460 51.6 1.6 1849

24
41 W GPM Forward Link 6.16 2106.406 407 65.0 23.0 226 41 W ISS -HGA 6.16 2085.688 400 51.6 12.9 589 41 W MMS Forward Link 6.16 2101.250 35700 28.0 4.0 1023 41 W Swift Forward Link 6.16 2106.406 600 22.0 3.5 139 41 W Terra Forward Link 6.16 2106.406 705 98.2 25.8 410 41 W TRMM -HGA 6.16 2076.940 403 35.0 23.0 513 41 W WISE 6.16 2070.490 500 97.3 6.0 437 85 E AURA Forward Link 6.16 2106.406 705 98.2 7.0 240 85 E CONNECT -HGA 6.16 2041.027 400 51.6 12.0 600 85 E Cygnus 6.16 2040.568 460 51.6 1.6 1849 85 E GPM Forward Link 6.16 2106.406 407 65.0 23.0 226 85 E ISS -HGA 6.16 2085.688 400 51.6 12.9 589 85 E MMS Forward Link 6.16 2101.250 35700 28.0 4.0 1023 85 E Swift Forward Link 6.16 2106.406 600 22.0 3.5 139 85 E Terra Forward Link 6.16 2106.406 705 98.2 25.8 410 85 E TRMM -HGA 6.16 2076.940 403 35.0 23.0 513 85 E WISE 6.16 2070.490 500 97.3 6.0 437
III.A.1.d. Interference Criteria Note that ITU-R SA.1155 which applies to protection of Data Relay Satellite (DRS) forward links states that the received interference level from all sources should not exceed a threshold of Io/No = -10 dB for more than 0.1% of the time which corresponds to a link margin degradation of 0.4 dB.
III.A.1.e. Simulation Approach Simulations were used to calculate long-term interference statistics to the NASA forward links. Each simulation was run for 30,000 samples points. The simulation included:
• Interferer: orbit simulation of a typical DoD polar LEO orbit at 800 km altitude and 98.7 degree inclination or example GEO orbits;
• Victim: orbit simulation of the TDRS (GEO) and TDRS user spacecraft (LEO).
• In order to account for DoD LEO (70%) and GEO (5.6%) duty cycles, at each time step each DoD interfering uplink earth station has a 70% or 5.6% probability (as appropriate ) of transmitting. These probabilities are generated independently at each time step and for each uplink.
Results were obtained for single earth station interference cases.

25
III.A.1.f. Assumptions All DoD uplink interferers transmit only when the receiving DoD satellite is in view of the transmitting DoD earth station and above 3 degrees elevation. One uplink signal from each of the corresponding DoD USB earth stations is communicating with either a LEO or a GEO satellite. Also, a NASA TDRS satellite transmits only when its respective user satellite is in view.
• Single earth station case: o Calculate interference separately from each of the corresponding USB earth
stations and provide the results;
o Assumes DoD and NASA systems operate co-frequency;
o Assumes all DoD emission power falls within the NASA victim receiver bandwidth.
III.A.1.g. Results A. Interference from LEO with 70% duty cycle
The results of the interference simulations for the case of DoD uplinks to LEO spacecraft are summarized in Table 4. The cases where the interference criterion is exceeded are highlighted.
Table 4. Interference Results from LEO with 70% duty cycle
LEO Interferers (Io/No @ probability = 0.1%), 70% duty cycle
User Satellite Tx GEO Location
Vandenburg, CA
Diego Garcia
Oakhangar, UK Guam
New Boston,
NH Thule,
Greenland Hawaii
AURA Forward Link 174 W <-100 <-100 <-100 <-100 -27.0 -2.0 <-100 CONNECT -HGA 174 W -17.0 <-100 <-100 -34.0 -43.5 <-100 -26.3 Cygnus 174 W -17.7 <-100 <-100 <-100 -29.7 <-100 -23.0 GPM Forward Link 174 W -10.0 <-100 <-100 <-100 -9.0 -8.0 <-100 ISS HGA 174 W -16.0 <-100 <-100 -34.0 -43.5 <-100 -26.3 MMS Forward Link 174 W -33.0 -30.6 -31.1 -33.0 -30.6 -30.1 -35.6 Swift Forward Link 174 W -13.3 <-100 <-100 -7.2 <-100 <-100 -14.6 Terra Forward Link 174 W <-100 <-100 <-100 <-100 -14.4 -4.4 <-100 TRMM -HGA 174 W -10.3 <-100 <-100 -11.5 -13.9 <-100 -11.0 WISE 174 W <-100 <-100 <-100 <-100 -28.0 -4.2 <-100 AURA Forward Link 41 W -22.0 <-100 -12.2 <-100 -17.0 -2.9 <-100 CONNECT -HGA 41 W -15.0 <-100 -23.0 <-100 -14.3 <-100 <-100 Cygnus 41 W -18.7 <-100 -24.5 <-100 -16.2 <-100 <-100 GPM Forward Link 41 W -9.5 <-100 -7.2 <-100 -9.3 -7.6 <-100 ISS HGA 41 W -14.9 <-100 -23.0 <-100 -14.3 <-100 <-100 MMS Forward Link 41 W -30.5 -31.8 -34.1 -32.9 -34.6 -33.3 -29.8 Swift Forward Link 41 W -12.0 -24.0 <-100 <-100 <-100 <-100 <-100 Terra Forward Link 41 W -14.4 <-100 -11.6 <-100 -14.0 -4.0 <-100

26
TRMM -HGA 41 W -7.8 <-100 <-100 <-100 -10.8 <-100 <-100 WISE 41 W <-100 <-100 -18.4 <-100 -13.5 -3.1 <-100 AURA Forward Link 85 E <-100 <-100 -12.5 <-100 <-100 -6.5 <-100 CONNECT -HGA 85 E <-100 <-100 -14.0 -22.0 <-100 <-100 <-100 Cygnus 85 E <-100 -23.0 -19.4 -40.0 <-100 <-100 <-100 GPM Forward Link 85 E <-100 <-100 -6.4 <-100 <-100 <-100 <-100 ISS HGA 85 E <-100 <-100 -14.0 -22.0 <-100 <-100 <-100 MMS Forward Link 85 E -32.2 -33.4 -30.8 -30.4 -31.8 -29.9 -32.0 Swift Forward Link 85 E <-100 -9.6 <-100 -5.6 <-100 <-100 <-100 Terra Forward Link 85 E <-100 <-100 -12.5 <-100 <-100 -5.0 <-100 TRMM -HGA 85 E <-100 -12.7 <-100 -12.5 <-100 <-100 <-100 WISE 85 E <-100 <-100 -14.5 <-100 <-100 -11.7 <-100
B. Interference from GEO with 5.6% duty cycle
The results for DoD uplinks to GEO spacecraft operating at the assumed 5.6% duty cycle are summarized in Table 5. The cases where the interference criterion is exceeded are highlighted.
Table 5. Interference results from GEO with 5.6% duty Cycle
GEO Interferers (Io/No @ probability = 0.1%), 5.6% duty cycle
User Satellite Tx GEO Location
Vandenburg, CA
Diego Garcia
Oakhangar, UK Guam
New Boston,
NH Hawaii
AURA Forward Link 174 W -12.5 <-100 <-100 -12.4 -16.0 -14.4 CONNECT -HGA 174 W -11.7 <-100 <-100 -14.9 -22.0 -15.2 Cygnus 174 W -15.5 <-100 <-100 -17.7 -24.0 -18.7 GPM Forward Link 174 W -5.7 <-100 <-100 -6.8 -7.1 -7.3 ISS HGA 174 W -11.7 <-100 <-100 -14.8 -22.0 -15.0 MMS Forward Link 174 W -29.5 -25.0 -31.3 -30.0 -27.2 -31.8 Swift Forward Link 174 W -9.7 -19.6 <-100 -4.3 <-100 -8.0 Terra Forward Link 174 W -11.4 <-100 <-100 -11.8 -12.6 -11.9 TRMM -HGA 174 W -6.8 <-100 <-100 -8.5 -12.2 -8.0 WISE 174 W -13.5 <-100 <-100 -19.3 -23.0 -16.6 AURA Forward Link 41 W -8.7 -25.7 -7.8 <-100 -10.6 -32.0 CONNECT -HGA 41 W -9.7 <-100 -13.0 <-100 -10.3 <-100 Cygnus 41 W -14.9 <-100 -16.0 <-100 -13.9 <-100 GPM Forward Link 41 W -6.0 <-100 -6.1 <-100 -4.8 <-100 ISS HGA 41 W -9.5 <-100 -12.7 <-100 -10.3 <-100 MMS Forward Link 41 W -29.0 -27.1 -32.7 -30.6 -30.6 -25.4 Swift Forward Link 41 W -7.9 -18.4 <-100 <-100 -29.0 -23.0 Terra Forward Link 41 W -10.3 -14.8 -9.0 <-100 -11.3 -15.2 TRMM -HGA 41 W -6.3 <-100 -13.9 <-100 -10.8 <-100 WISE 41 W -11.5 <-100 -9.7 <-100 -13.2 <-100 AURA Forward Link 85 E <-100 -15.5 -9.5 -13.0 <-100 <-100

27
CONNECT -HGA 85 E <-100 -20.0 -11.7 -18.3 <-100 <-100 Cygnus 85 E <-100 -18.8 -12.7 -17.1 <-100 <-100 GPM Forward Link 85 E <-100 -6.9 -4.9 -7.7 <-100 <-100 ISS HGA 85 E <-100 -19.0 -11.0 -18.3 <-100 <-100 MMS Forward Link 85 E -31.8 -28.0 -28.0 -26.5 -31.1 -26.4 Swift Forward Link 85 E <-100 -7.6 <-100 -2.7 <-100 -21.0 Terra Forward Link 85 E <-100 -12.8 -9.5 -12.9 <-100 <-100 TRMM -HGA 85 E <-100 -10.4 <-100 -7.8 <-100 <-100 WISE 85 E <-100 -17.7 -9.8 -16.0 <-100 <-100
C. Results Summary
For the LEO case, in about 9% of the cases, aggregate interference levels exceed the recommended Io/No = -10 dB threshold value. For the GEO case, in about 17% of the cases, aggregate interference levels exceed the recommended Io/No = -10 dB threshold value.
The exceedance is no more than 8 dB. For the LEO case, the maximum level of interference of -2 dB occurs at Thule, Greenland for the Aura forward link from TDRS 174W. For the GEO case, the maximum level of interference of -2.7 dB occurs at Guam for the Swift forward link from TDRS 85E.
III.A.1.h. Recommendations NASA recommends that DoD not select frequencies in the TDRS MAF Band (2103.3 – 2109.5 MHz) because of the large number of spacecraft that NASA supports over this channel (i.e., over a 6.2 MHz portion of the entire 2025-2110 MHz band). DoD has indicated that they will attempt to avoid assignments in the MAF band. However, they also stated that they will use it if required, and if so, this use will be coordinated with NASA via the DoD/NASA/NOAA frequency pre-coordination process and the FAS.
III.A.2. Relocation of DoD Terrestrial Operations into 2025-2110 MHz Band
III.A.2.a. Background As a result of the Broadband relocation efforts, the DoD is considering relocating some or all of its current terrestrial operations in the 1755-1850 MHz band to the 2025-2110 MHz band. As stated previously, NASA supports a large number of TDRS forward link users in this band. Analysis results of interference from DoD terrestrial systems into NASA TDRS forward links based on the latest information provided by DoD (in August/September 2011) is given below.
III.A.2.b. DoD Terrestrial Parameters The DoD characteristics used in this analysis are based on information provided by DoD to NASA in August/September 2011:
• DoD intends to move the following systems into the USB band:

28
o Air Combat Training Systems (ACTS) – see Table 6.
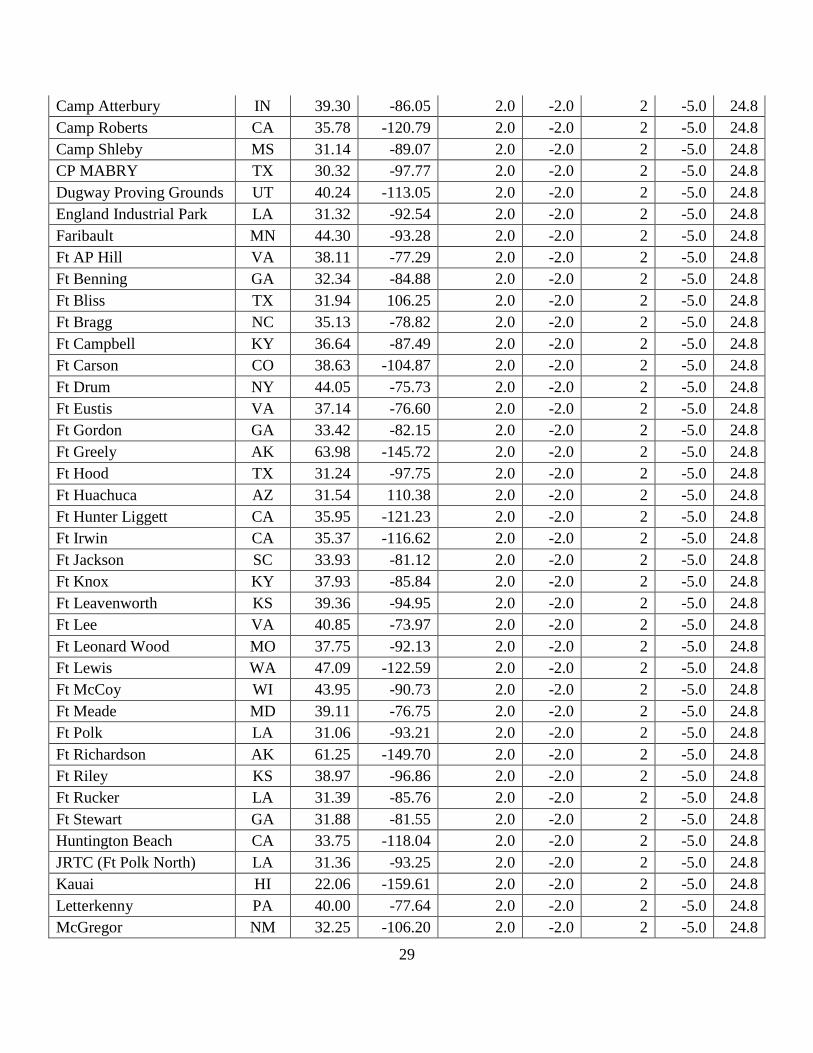
o Tactical Radio Relay (TRR) for the Army– see Table 7.
o Tactical Radio Relay (TRR) for the Navy– see Table 8.
o Tactical Radio Relay (TRR) for the U.S. Marine Corps only – see Table 9.
o Unmanned Airborne Systems (UAS) – see Table 10.
• For systems with antenna gain equal to 0 dBi, 0 dBi was used in all directions. For systems with antenna gain more than 0 dBi but less than or equal to 20.0 dBi, the antenna pattern used is based on Recommendation ITU-R F.1336. For systems with antenna gain greater than 20.0 dBi, the antenna pattern used is based on Recommendation ITU-R F.1245
• all simulated links operate with 50% duty cycle except UAS systems which operate with 25% duty cycle
• TX QTY "1+" indicates that 1 full emission and 1 partial emission should be simulated, based on the 4.68 MHz channel spacing per 6.16 MHz TDRS. Therefore the total power level is increased by 10*LOG(6.16/4.68)=1.19 dB, relative to the single entry power level.
• TX QTY "2+" indicates that 2 full emissions and 2 partial emissions should be simulated, based on the 4.68 MHz channel spacing per 6.16 MHz TDRS. Therefore the total power level is increased by 10*LOG(2*6.16/4.68)=4.19 dB, relative to the single entry power level.
• The interfering antennas’ azimuth angle is randomly distributed between 0º and 360º and its elevation angle is 0º, except for TRR Army and TRR USMC systems where the elevation angle is randomly distributed between -5º and +5º.
Table 6. ACTS Transmitter Parameters
Location State Latitude (N)
Longitude (E)
Bandwidth (MHz)
Single Tx.
Power (dBW)
Tx. Quantity
Total Tx.
Power (dBW)
Ant. Gain (dBi)
Fallon NAS NV 39.29 -116.45 1.5 20.0 1 20.0 0.0 Luke AFB AZ 32.23 -113.02 1.5 20.0 1 20.0 0.0 Key West NAS FL 24.55 -81.81 1.5 20.0 1 20.0 0.0 Langley AFB VA 37.08 -76.35 1.5 20.0 1 20.0 0.0
Table 7. TRR ARMY Transmitter Parameters
Location State Latitude (N)
Longitude (E)
Bandwidth (MHz)
Single Tx.
Power (dBW)
Tx. Quantity
Total Tx.
Power (dBW)
Ant. Gain (dBi)
Aberdeen Proving Ground MD 39.42 -76.17 2.0 -2.0 2 -5.0 24.8
29
Camp Atterbury IN 39.30 -86.05 2.0 -2.0 2 -5.0 24.8 Camp Roberts CA 35.78 -120.79 2.0 -2.0 2 -5.0 24.8 Camp Shleby MS 31.14 -89.07 2.0 -2.0 2 -5.0 24.8 CP MABRY TX 30.32 -97.77 2.0 -2.0 2 -5.0 24.8 Dugway Proving Grounds UT 40.24 -113.05 2.0 -2.0 2 -5.0 24.8 England Industrial Park LA 31.32 -92.54 2.0 -2.0 2 -5.0 24.8 Faribault MN 44.30 -93.28 2.0 -2.0 2 -5.0 24.8 Ft AP Hill VA 38.11 -77.29 2.0 -2.0 2 -5.0 24.8 Ft Benning GA 32.34 -84.88 2.0 -2.0 2 -5.0 24.8 Ft Bliss TX 31.94 106.25 2.0 -2.0 2 -5.0 24.8 Ft Bragg NC 35.13 -78.82 2.0 -2.0 2 -5.0 24.8 Ft Campbell KY 36.64 -87.49 2.0 -2.0 2 -5.0 24.8 Ft Carson CO 38.63 -104.87 2.0 -2.0 2 -5.0 24.8 Ft Drum NY 44.05 -75.73 2.0 -2.0 2 -5.0 24.8 Ft Eustis VA 37.14 -76.60 2.0 -2.0 2 -5.0 24.8 Ft Gordon GA 33.42 -82.15 2.0 -2.0 2 -5.0 24.8 Ft Greely AK 63.98 -145.72 2.0 -2.0 2 -5.0 24.8 Ft Hood TX 31.24 -97.75 2.0 -2.0 2 -5.0 24.8 Ft Huachuca AZ 31.54 110.38 2.0 -2.0 2 -5.0 24.8 Ft Hunter Liggett CA 35.95 -121.23 2.0 -2.0 2 -5.0 24.8 Ft Irwin CA 35.37 -116.62 2.0 -2.0 2 -5.0 24.8 Ft Jackson SC 33.93 -81.12 2.0 -2.0 2 -5.0 24.8 Ft Knox KY 37.93 -85.84 2.0 -2.0 2 -5.0 24.8 Ft Leavenworth KS 39.36 -94.95 2.0 -2.0 2 -5.0 24.8 Ft Lee VA 40.85 -73.97 2.0 -2.0 2 -5.0 24.8 Ft Leonard Wood MO 37.75 -92.13 2.0 -2.0 2 -5.0 24.8 Ft Lewis WA 47.09 -122.59 2.0 -2.0 2 -5.0 24.8 Ft McCoy WI 43.95 -90.73 2.0 -2.0 2 -5.0 24.8 Ft Meade MD 39.11 -76.75 2.0 -2.0 2 -5.0 24.8 Ft Polk LA 31.06 -93.21 2.0 -2.0 2 -5.0 24.8 Ft Richardson AK 61.25 -149.70 2.0 -2.0 2 -5.0 24.8 Ft Riley KS 38.97 -96.86 2.0 -2.0 2 -5.0 24.8 Ft Rucker LA 31.39 -85.76 2.0 -2.0 2 -5.0 24.8 Ft Stewart GA 31.88 -81.55 2.0 -2.0 2 -5.0 24.8 Huntington Beach CA 33.75 -118.04 2.0 -2.0 2 -5.0 24.8 JRTC (Ft Polk North) LA 31.36 -93.25 2.0 -2.0 2 -5.0 24.8 Kauai HI 22.06 -159.61 2.0 -2.0 2 -5.0 24.8 Letterkenny PA 40.00 -77.64 2.0 -2.0 2 -5.0 24.8 McGregor NM 32.25 -106.20 2.0 -2.0 2 -5.0 24.8

30
Oahu HI 21.50 -158.06 2.0 -2.0 2 -5.0 24.8 Pinon Canyon CO 37.42 -103.90 2.0 -2.0 2 -5.0 24.8 Pohakuloa HI 19.76 -155.54 2.0 -2.0 2 -5.0 24.8 PT Loma CA 32.69 -117.27 2.0 -2.0 2 -5.0 24.8 Redstone Arsenal AL 34.66 -86.66 2.0 -2.0 2 -5.0 24.8 Rosemount MN 44.74 -93.13 2.0 -2.0 2 -5.0 24.8 St Joseph MO 39.77 -94.79 2.0 -2.0 2 -5.0 24.8 Two Rivers WI 44.15 -87.55 2.0 -2.0 2 -5.0 24.8 Vichy Airfield MO 38.12 -91.77 2.0 -2.0 2 -5.0 24.8 Whitesands Missile Range NM 33.00 -106.50 2.0 -2.0 2 -5.0 24.8 Yukon Range AK 64.58 -146.72 2.0 -2.0 2 -5.0 24.8 Yuma Proving Grounds AZ 32.87 -114.12 2.0 -2.0 2 -5.0 24.8
Table 8. TRR Navy Transmitter Parameters
Location State Latitude (N)
Longitude (E)
Bandwidth (MHz)
Single Tx.
Power (dBW)
Tx. Quantity
Total Tx.
Power (dBW)
Ant. Gain (dBi)
Apra Harbor GUM 13.44 144.66 1.0 11.0 1 11.0 6.0 Charleston SC 32.92 -79.97 1.0 11.0 1 11.0 6.0 Elizabeth City NC 36.23 -76.13 1.0 11.0 1 11.0 6.0 Pearl Harbor HI 21.37 -157.97 1.0 11.0 1 11.0 6.0 ST Juliens Creek VA 36.85 -76.30 1.0 11.0 1 11.0 6.0
Table 9. TRR U.S. Marine Corp Transmitter Parameters
Location State Latitude (N)
Longitude (E)
Bandwidth (MHz)
Single Tx. Power (dBW)
Tx. Quantity
Total Tx.
Power (dBW)
Ant. Gain (dBi)
Bogue Field NC 34.69 -77.03 2.0 -2.0 2 -5.0 24.8 Bridgeport CA 38.26 -119.09 2.0 -2.0 2 -5.0 24.8 Brooklyn NY 40.58 -74.00 2.0 -2.0 2 -5.0 24.8 Cincinnati OH 39.14 -84.48 2.0 -2.0 2 -5.0 24.8 CP Lejeune NC 34.64 -77.39 2.0 -2.0 2 -5.0 24.8 CP Pendleton CA 33.38 -117.43 2.0 -2.0 2 -5.0 24.8 Fox Lake IL 42.40 -88.19 2.0 -2.0 2 -5.0 24.8 Great Lakes IL 42.35 -87.86 2.0 -2.0 2 -5.0 24.8 Greensboro NC 36.09 -79.97 2.0 -2.0 2 -5.0 24.8

31
Grissom IN 40.66 -86.16 2.0 -2.0 2 -5.0 24.8 Hawthorne NV 38.54 -118.63 2.0 -2.0 2 -5.0 24.8 Kaneohe HI 21.45 -157.75 2.0 -2.0 2 -5.0 24.8 Mcas Yuma AZ 32.48 -114.48 2.0 -2.0 2 -5.0 24.8 Miramar CA 32.88 -117.13 2.0 -2.0 2 -5.0 24.8 Quantico VA 38.52 -77.32 2.0 -2.0 2 -5.0 24.8 Sand Ridge IL 39.75 -89.30 2.0 -2.0 2 -5.0 24.8 Twentynine Palms CA 34.31 -116.18 2.0 -2.0 2 -5.0 24.8
Table 10. UAS Transmitter Parameters
Location State Latitude (N)
Longitude (E)
Bandwidth (MHz)
Single Tx.
Power (dBW)
Tx. Quantity
Total Tx.
Power (dBW)
Ant. Gain (dBi)
Aberdeen Proving Ground MD 39.42 -76.17 4.7 1.8 1+ 3.0 2.0 Bend OR 44.05 -121.32 4.7 1.8 1+ 3.0 2.0 Boardman Range OR 45.73 -119.68 4.7 1.8 1+ 3.0 2.0 Brookville KS 38.69 -97.82 4.7 1.8 1+ 3.0 2.0 Camp Claiborne LA 31.15 -92.60 4.7 1.8 1+ 3.0 2.0 Camp Ripley MI 46.20 -94.42 4.7 1.8 1+ 3.0 2.0 Camp Roberts CA 35.78 -120.79 4.7 1.8 1+ 3.0 2.0 CP Atterbury IN 39.36 -86.02 4.7 1.8 1+ 3.0 2.0 CP Blanding FL 29.93 -81.98 4.7 1.8 1+ 3.0 2.0 CP Grayling MI 44.77 -84.57 4.7 1.8 1+ 3.0 2.0 CP Gruber OK 35.65 -95.21 4.7 1.8 1+ 3.0 2.0 CP Guernsey WY 42.26 -104.73 4.7 1.8 1+ 3.0 2.0 CP Rilea OR 46.12 -123.93 4.7 1.8 1+ 3.0 2.0 CP Shelby MS 31.16 -89.17 4.7 1.8 1+ 3.0 2.0 Dugway PG UT 40.18 -112.93 4.7 1.8 1+ 3.0 2.0 Fort McClellan AL 33.66 -85.97 4.7 1.8 1+ 3.0 2.0 Ft AP Hill VA 38.11 -77.29 4.7 1.8 1+ 3.0 2.0 FT Benning GA 32.33 -84.99 4.7 1.8 1+ 3.0 2.0 FT Bliss TX 31.86 -106.36 4.7 1.8 1+ 3.0 2.0 FT Bragg NC 35.13 -79.01 4.7 1.8 1+ 3.0 2.0 Ft Campbell KY 36.67 -87.50 4.7 1.8 1+ 3.0 2.0 FT Carson CO 38.68 -104.79 4.7 1.8 1+ 3.0 2.0 Ft Chaffee AR 35.27 -94.19 4.7 1.8 1+ 3.0 2.0 FT Drum NY 44.03 -75.73 4.7 1.8 1+ 3.0 2.0 Ft Eustis VA 37.14 -76.60 4.7 1.8 1+ 3.0 2.0

32
Ft Gillem GA 33.61 -84.37 4.7 1.8 1+ 3.0 2.0 Ft Gordon GA 33.35 -82.25 4.7 1.8 1+ 3.0 2.0 Ft Greely AK 63.85 -145.77 4.7 1.8 1+ 3.0 2.0 FT Hood TX 31.13 -97.70 4.7 1.8 1+ 3.0 2.0 Ft Huachuca AZ 31.54 -110.38 4.7 1.8 1+ 3.0 2.0 FT Indiantown Gap PA 40.41 -76.68 4.7 1.8 1+ 3.0 2.0 Ft Irwin (NTC) CA 35.37 -116.62 4.7 1.8 2+ 6.0 2.0 Ft Knox KY 37.93 -85.84 4.7 1.8 1+ 3.0 2.0 FT Knox KY 37.88 -85.93 4.7 1.8 1+ 3.0 2.0 Ft Leavenworth KS 39.36 -94.95 4.7 1.8 1+ 3.0 2.0 Ft Lee VA 40.85 -73.97 4.7 1.8 1+ 3.0 2.0 FT Leonard Wood MO 37.74 -92.15 4.7 1.8 1+ 3.0 2.0 FT Lewis WA 46.84 -122.76 4.7 1.8 1+ 3.0 2.0 FT Mccoy WI 44.02 -90.98 4.7 1.8 1+ 3.0 2.0 Ft Meade MD 39.11 -76.75 4.7 1.8 1+ 3.0 2.0 FT Pickett VA 37.10 -77.88 4.7 1.8 1+ 3.0 2.0 FT Polk - JRTC LA 31.35 -93.17 4.7 1.8 2+ 6.0 2.0 FT Riley KS 39.05 -96.77 4.7 1.8 1+ 3.0 2.0 FT Rucker AL 31.32 -85.70 4.7 1.8 1+ 3.0 2.0 FT Sill OK 34.66 -98.42 4.7 1.8 1+ 3.0 2.0 FT Stewart GA 31.85 -81.60 4.7 1.8 1+ 3.0 2.0 MCGregor NM 32.09 -106.08 4.7 1.8 1+ 3.0 2.0 Muldrow Field OK 35.03 -97.23 4.7 1.8 1+ 3.0 2.0 Patuxent River (Webster Field) MD 38.15 -76.43 4.7 1.8 2+ 6.0 2.0 Pinon Canyon CO 37.54 -103.91 4.7 1.8 1+ 3.0 2.0 Pohakuloa HI 19.73 -155.60 4.7 1.8 1+ 3.0 2.0 Ravenna OH 41.20 -81.09 4.7 1.8 1+ 3.0 2.0 Redstone Arsenal AL 34.65 -86.71 4.7 1.8 1+ 3.0 2.0 Schofield Barracks HI 21.53 -158.15 4.7 1.8 1+ 3.0 2.0 Simi Valley CA 34.28 -118.72 4.7 1.8 1+ 3.0 2.0 Smokey Hill KS 38.75 -97.76 4.7 1.8 1+ 3.0 2.0 Taft CA 35.13 -119.40 4.7 1.8 1+ 3.0 2.0 Warren Grove Range NJ 39.75 -74.38 4.7 1.8 1+ 3.0 2.0 Whitesands Missile Range NM 32.43 -106.18 4.7 1.8 2+ 6.0 2.0 Yakima WA 46.66 -120.46 4.7 1.8 1+ 3.0 2.0 Yuma Proving Grounds AZ 32.87 -114.12 4.7 1.8 1+ 3.0 2.0 Atlantic Field NC 34.89 -76.35 4.7 1.8 1+ 3.0 2.0 Dam Neck VA 36.73 -75.95 4.7 1.8 1+ 3.0 2.0

33
Fallon NV 39.23 -118.15 4.7 1.8 1+ 3.0 2.0 Mayport FL 30.39 -81.42 4.7 1.8 1+ 3.0 2.0 SAN Clemente IS CA 32.92 -118.49 4.7 1.8 1+ 3.0 2.0 SAN Nicolas IS CA 33.24 -119.50 4.7 1.8 1+ 3.0 2.0 Stennis MS 30.37 -89.60 4.7 1.8 1+ 3.0 2.0 Albert Whitted FL 27.77 -82.63 4.7 1.8 1+ 3.0 2.0 Avon Park FL 27.60 -81.51 4.7 1.8 1+ 3.0 2.0 Camp Edwards MA 41.69 -70.53 4.7 1.8 1+ 3.0 2.0 CP Rilea OR 46.12 -123.93 4.7 1.8 1+ 3.0 2.0 Edwards CA 34.92 -117.92 4.7 1.8 1+ 3.0 2.0 Eglin FL 30.49 -86.51 4.7 1.8 1+ 3.0 2.0 Fort Carson CO 38.44 -104.89 4.7 1.8 1+ 3.0 2.0 FT Pickett VA 37.07 -77.96 4.7 1.8 1+ 3.0 2.0 Hancock Field NY 43.12 -76.12 4.7 1.8 1+ 3.0 2.0 Hanscom MA 42.46 -71.27 4.7 1.8 1+ 3.0 2.0 Point Bravo NV 36.54 -115.57 4.7 1.8 1+ 3.0 2.0 Smokey Hill KS 38.70 -97.85 4.7 1.8 1+ 3.0 2.0 South Ranges NV 36.56 -115.43 4.7 1.8 1+ 3.0 2.0 USAF Academy CO 39.03 -104.84 4.7 1.8 1+ 3.0 2.0 UT Test Training Range UT 40.00 -113.50 4.7 1.8 1+ 3.0 2.0 Vandenberg CA 34.73 -120.58 4.7 1.8 1+ 3.0 2.0 Whitesands Missile Range NM 32.97 -106.40 4.7 1.8 1+ 3.0 2.0 Bellows HI 21.36 -157.75 4.7 1.8 1+ 3.0 2.0 Bridgeport CA 38.40 -119.52 4.7 1.8 1+ 3.0 2.0 CP Lejeune NC 34.59 -77.33 4.7 1.8 1+ 3.0 2.0 CP Pendleton CA 33.39 -117.35 4.7 1.8 1+ 3.0 2.0 Quantico VA 38.56 -77.49 4.7 1.8 1+ 3.0 2.0 Stoval AZ 32.73 -113.63 4.7 1.8 1+ 3.0 2.0 Twentynine Palms CA 34.44 -116.12 4.7 1.8 1+ 3.0 2.0
III.A.2.c. NASA TDRS Forward Link Parameters For this analysis the sample TDRS Forward links listed in Table 11 were used.
Table 11. NASA Forward Link Parameters
Transmit TDRS Long. (deg.)
Receive Spacecraft
Name Bandwidth (MHz)
Alt. (km)
Inc. (deg.) Ecc.
Ant. Gain. (dBi)
Ant. Temp.
(K) 174 W GPM 6.16 407 65.0 0.000 23.0 226.0

34
41 W GPM 6.16 407 65.0 0.000 23.0 226.0 174 W ISS 6.16 400 51.6 0.000 12.9 589.0 41 W ISS 6.16 400 51.6 0.000 12.9 589.0
III.A.2.d. Interference Criteria Note that ITU-R SA.1155 which applies to protection of Data Relay Satellite (DRS) forward links states that the received interference level from all sources should not exceed a threshold of Io/No = -10 dB for more than 0.1% of the time which corresponds to a link margin degradation of 0.4 dB.
III.A.2.e. Simulation Approach Simulations were used to calculate long-term interference statistics to the NASA forward links. Each simulation was run for 30,000 sample points (time step = 86.4 seconds) for a period of 1 month.
Results were obtained for aggregate ACTS, TRR Army, TRR Navy, TRR U.S. Marine Corps, UAS interference cases separately and finally the aggregate of all these systems combined.
III.A.2.f. Assumptions 1. DoD and NASA systems operate co-frequency. 2. All DoD emission power falls within the NASA victim receiver bandwidth. 3. Transmitter (linear) to Receiver (elliptical) polarization mismatch is 2 dBi.
4. DoD transmit system passive loss (line loss between transmitter and antenna) is 2 dBi.
5. NASA receive system passive loss (line loss between antenna and LNA) is 2 dBi. 6. NASA TDRS victim user receive antenna pattern is based on ITU-R F.672 Annex 1 with
Ls = -25 dB side-lobe level and beamwidth = 12° (for GPM) and 38° (for ISS) 7. NASA TDRS victim user receive interference and corresponding statistics are calculated
at all times during the period of simulation for which the user satellite is visible to TDRS. Interference exceedance percentages are based on all 30,000 time samples in this simulation.
III.A.2.g. Results A. Interference Results
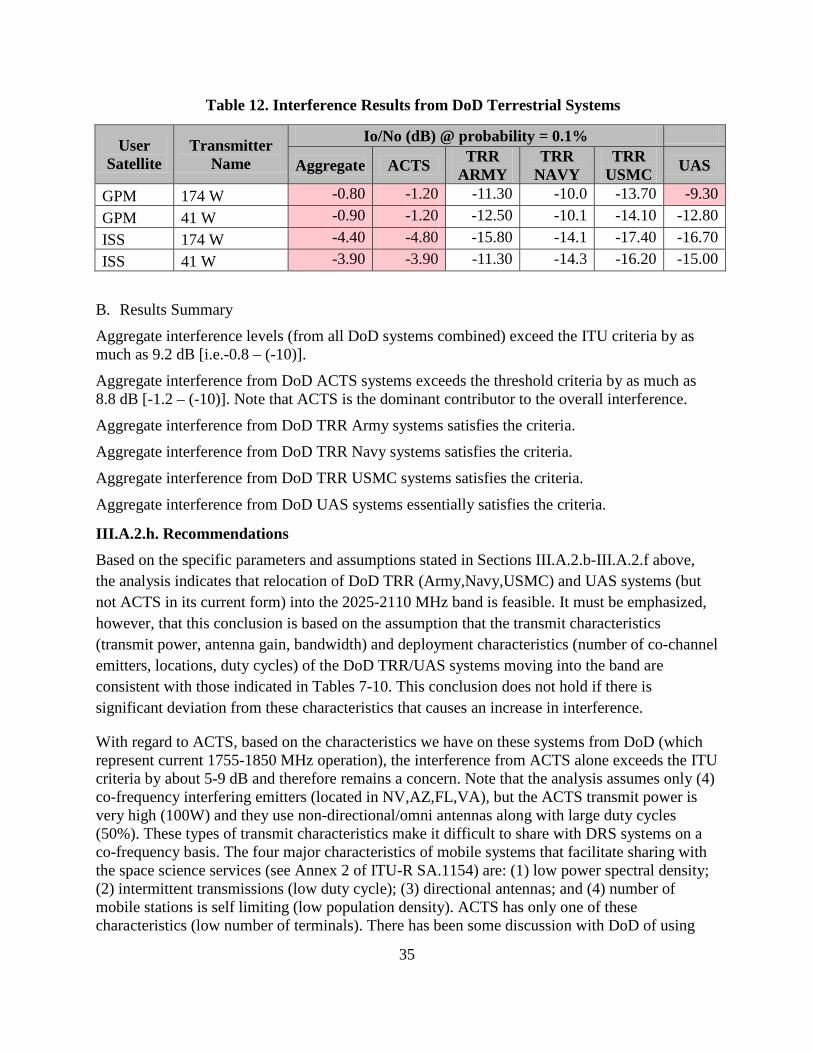
The results of the interference simulations from the aggregate of all DoD systems, ACTS, TRR Navy, TRR USMC, and UAS are summarized in Table 12. It is assumed that all DoD systems except UAS operate at 50% duty cycle while UAS operates at 25% duty cycle. Cases where the interference criterion is exceeded are highlighted in Table 12.
35
Table 12. Interference Results from DoD Terrestrial Systems
User Satellite
Transmitter Name
Io/No (dB) @ probability = 0.1%
Aggregate ACTS TRR ARMY
TRR NAVY
TRR USMC UAS
GPM 174 W -0.80 -1.20 -11.30 -10.0 -13.70 -9.30 GPM 41 W -0.90 -1.20 -12.50 -10.1 -14.10 -12.80 ISS 174 W -4.40 -4.80 -15.80 -14.1 -17.40 -16.70 ISS 41 W -3.90 -3.90 -11.30 -14.3 -16.20 -15.00
B. Results Summary
Aggregate interference levels (from all DoD systems combined) exceed the ITU criteria by as much as 9.2 dB [i.e.-0.8 – (-10)].
Aggregate interference from DoD ACTS systems exceeds the threshold criteria by as much as 8.8 dB [-1.2 – (-10)]. Note that ACTS is the dominant contributor to the overall interference.
Aggregate interference from DoD TRR Army systems satisfies the criteria.
Aggregate interference from DoD TRR Navy systems satisfies the criteria.
Aggregate interference from DoD TRR USMC systems satisfies the criteria.
Aggregate interference from DoD UAS systems essentially satisfies the criteria.
III.A.2.h. Recommendations Based on the specific parameters and assumptions stated in Sections III.A.2.b-III.A.2.f above, the analysis indicates that relocation of DoD TRR (Army,Navy,USMC) and UAS systems (but not ACTS in its current form) into the 2025-2110 MHz band is feasible. It must be emphasized, however, that this conclusion is based on the assumption that the transmit characteristics (transmit power, antenna gain, bandwidth) and deployment characteristics (number of co-channel emitters, locations, duty cycles) of the DoD TRR/UAS systems moving into the band are consistent with those indicated in Tables 7-10. This conclusion does not hold if there is significant deviation from these characteristics that causes an increase in interference.
With regard to ACTS, based on the characteristics we have on these systems from DoD (which represent current 1755-1850 MHz operation), the interference from ACTS alone exceeds the ITU criteria by about 5-9 dB and therefore remains a concern. Note that the analysis assumes only (4) co-frequency interfering emitters (located in NV,AZ,FL,VA), but the ACTS transmit power is very high (100W) and they use non-directional/omni antennas along with large duty cycles (50%). These types of transmit characteristics make it difficult to share with DRS systems on a co-frequency basis. The four major characteristics of mobile systems that facilitate sharing with the space science services (see Annex 2 of ITU-R SA.1154) are: (1) low power spectral density; (2) intermittent transmissions (low duty cycle); (3) directional antennas; and (4) number of mobile stations is self limiting (low population density). ACTS has only one of these characteristics (low number of terminals). There has been some discussion with DoD of using

36
frequency avoidance for ACTS so that they do not operate co-frequency with TDRSS forward links, but DoD has stated that at this point it is not a primary option. NASA will continue to work with DoD as it investigates modifications/improvements to the current ACTS (e.g. different modulations, spread spectrum, power, antenna characteristics, etc.) to ensure compatibility with NASA systems as these systems move into the band.
III.B. 2200-2290 MHz Band NASA has coordinated with a number of agencies that are considering moving operations from the 1755-1850 MHz band to the 2200-2290 MHz band and, based on information from these agencies, performed interference analysis to assess impact to NASA operations in the 2200-2290 MHz band. The following federal agencies were considered:
a. Department of Defense (DoD) b. Department of Treasury (T) c. Department of Justice (DOJ) d. Department of Homeland Security (DHS) e. Department of Interior (DOI) f. United States Postal Service (USPS)
NASA is concerned about (3) interference scenarios in this band:
(1) Interference into NASA earth stations receiving satellite telemetry/mission data since the band is used for satellite downlinks;
(2) Interference into NASA ground stations receiving aeronautical telemetry data from test aircraft, unmanned aircraft, and launch vehicles since the band is used for aeronautical flight test telemetry;
(3) Aggregate interference into receivers onboard TDRS satellites in GEO since the band is used for TDRS space-to-space return links (user satellite-to-TDRS satellite).
The first and second of these scenarios will require one-on-one coordination as systems come into operation in areas near NASA receive sites. To facilitate this, NASA has developed coordination contours based on anticipated interfering transmit power levels and NASA station sensitivity. The third scenario will need to consider the long term growth and development of the band by incoming services. NASA is working with the various agencies and departments to obtain this information. In many cases, current usage in 1755-1850 MHz is indicative of the growth. However, not all relocated equipment from a given agency will be moved to the 2200-2290 MHz band. Interference scenarios were developed for each agency based on the information provided in their Phase III Reports and also data they sent directly to NASA. Details of the analysis and resulting conclusions are given in the following sections.
III.B.1 Interference Scenario 1: Coordination Contours around NASA Earth Stations

37
NASA uses the 2200-2290 MHz band for satellite-to-Earth downlink communications. This spectrum provides data, telemetry, and tracking information necessary for successful mission communications. In some cases, mission data is relayed to the ground via the geostationary Tracking and Data Relay Satellite System (TDRSS). The TDRSS return links (LEO-to- GEO TDRS) also use the 2200-2290 MHz band.
In the case of satellite-to-Earth transmissions, NASA earth stations must work with very weak signals transmitted from satellites that often use low gain omni-directional antennas and limited transmit power. Earth stations track the LEO satellites using relatively high gain antennas down to elevation angles of about 5°. The earth station antennas are capable of pointing 0°-360° in azimuth. Consequently, RFI sources in the vicinity of these earth station sites can disrupt signal reception, particularly when the earth station antenna is oriented towards the interfering source as it tracks the LEO. Section 8.3.15 in the NTIA manual contains the list of coordinated 2200-2290 MHz earth stations.
For the protection of earth stations against incoming systems, NASA has generated coordination contours based on the following considerations:
• A worst case interference geometry is assumed in which the NASA earth station receive antenna is pointed at a minimum elevation angle of 5° and is oriented in azimuth towards the interferer. In this case, the earth station antenna gain towards the interferer is assumed to be 14.3 dBi based on the ITU-RR Appendix 8 antenna pattern and 5° off-boresight angle (i.e. 32-25log(5°) = 14.3 dBi);
• For purposes of developing contours, based on data provided by DHS and DOJ, it is assumed that EIRP in the direction of the earth station will range from -10 dBW to +15 dBW. Multiple coordination contours can be drawn. Transmitters with higher EIRP toward the earth stations will need to coordinate when within 125 km of the station;
• The noise temperature of the earth station is dependent on application and location;
• ITM Propagation Model is used to determine propagation loss with the confidence setting set at 5% for the interference path;
• Contour distance is found when I/N calculation into the NASA earth station from the interferer is less than a threshold of I/N = - 10 dB;
• Contour distance is calculated along every 1 degree azimuth, 360 degrees around the NASA earth Station and smoothed with a moving average over every 5 degrees of azimuth.
Example contours are shown in Figures 5 to 8 for Goldstone, CA; White Sands, NM; Greenbelt, Md; and Wallops Island, Va. Once the analysis procedure is finalized and full data is received

38
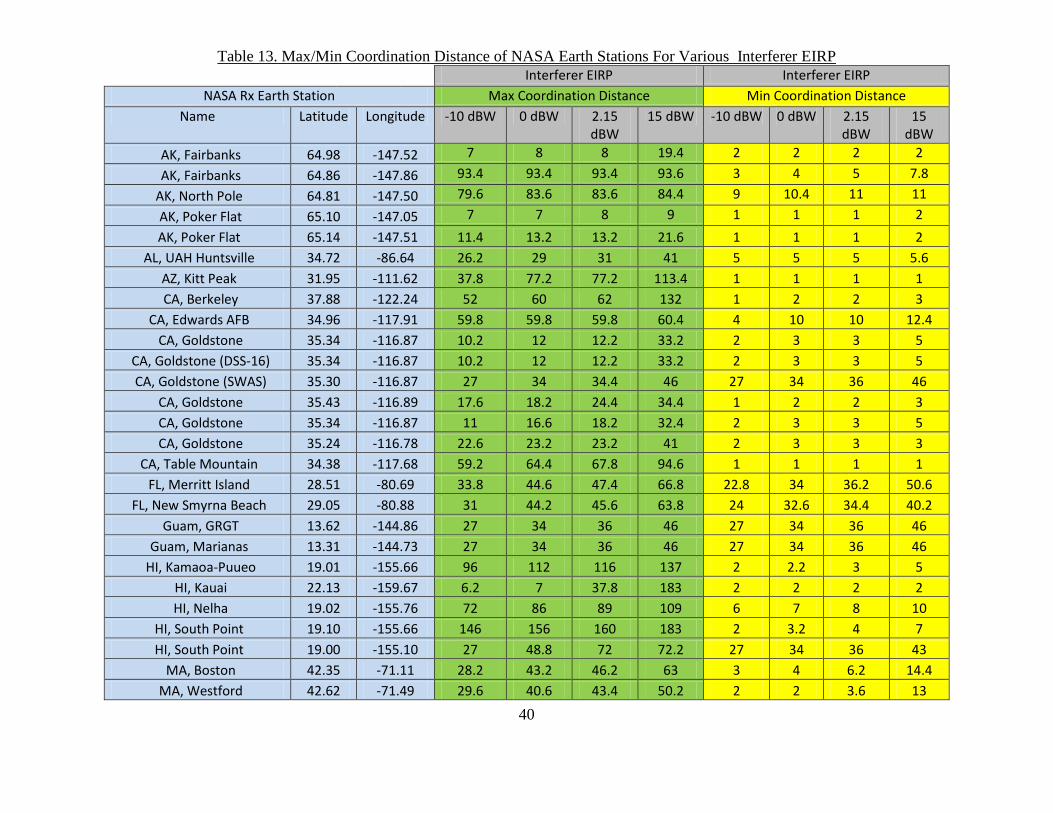
from all agencies moving into this band, these contours will be updated. These contours represent the locus of points within which coordination of a transmitter with an EIRP of 2.15 dBW toward the earth station is required. The value of 2.15 dBW EIRP is based on data received from DOJ and DHS for typical video surveillance transmitters with 1 W transmit power and 2.15 dBi omni (dipole) antenna. The contours are irregular in shape due to the nature of the terrain. Although not shown here, NASA has generated additional contours for each of its earth stations assuming interfering EIRP values of -10, 0, 2.15, and 15 dBW. A tentative set of coordination values is given in Table 13.

39
Figure 5. 2.15 dBW Coordination contour around Goldston, CA
Figure 6. 2.15 dBW Coordination contour arounds white Sands, NM
Figure 7. 2.15 dBW Contour around Greenbelt, Md
Figure 8. 2.15 dBW Contour around Wallops Island Earth Station
40
Table 13. Max/Min Coordination Distance of NASA Earth Stations For Various Interferer EIRP Interferer EIRP Interferer EIRP
NASA Rx Earth Station Max Coordination Distance Min Coordination Distance Name Latitude Longitude -10 dBW 0 dBW 2.15
dBW 15 dBW -10 dBW 0 dBW 2.15
dBW 15
dBW AK, Fairbanks 64.98 -147.52 7 8 8 19.4 2 2 2 2
AK, Fairbanks 64.86 -147.86 93.4 93.4 93.4 93.6 3 4 5 7.8
AK, North Pole 64.81 -147.50 79.6 83.6 83.6 84.4 9 10.4 11 11
AK, Poker Flat 65.10 -147.05 7 7 8 9 1 1 1 2
AK, Poker Flat 65.14 -147.51 11.4 13.2 13.2 21.6 1 1 1 2 AL, UAH Huntsville 34.72 -86.64 26.2 29 31 41 5 5 5 5.6
AZ, Kitt Peak 31.95 -111.62 37.8 77.2 77.2 113.4 1 1 1 1 CA, Berkeley 37.88 -122.24 52 60 62 132 1 2 2 3
CA, Edwards AFB 34.96 -117.91 59.8 59.8 59.8 60.4 4 10 10 12.4 CA, Goldstone 35.34 -116.87 10.2 12 12.2 33.2 2 3 3 5
CA, Goldstone (DSS-16) 35.34 -116.87 10.2 12 12.2 33.2 2 3 3 5 CA, Goldstone (SWAS) 35.30 -116.87 27 34 34.4 46 27 34 36 46
CA, Goldstone 35.43 -116.89 17.6 18.2 24.4 34.4 1 2 2 3 CA, Goldstone 35.34 -116.87 11 16.6 18.2 32.4 2 3 3 5 CA, Goldstone 35.24 -116.78 22.6 23.2 23.2 41 2 3 3 3
CA, Table Mountain 34.38 -117.68 59.2 64.4 67.8 94.6 1 1 1 1 FL, Merritt Island 28.51 -80.69 33.8 44.6 47.4 66.8 22.8 34 36.2 50.6
FL, New Smyrna Beach 29.05 -80.88 31 44.2 45.6 63.8 24 32.6 34.4 40.2 Guam, GRGT 13.62 -144.86 27 34 36 46 27 34 36 46
Guam, Marianas 13.31 -144.73 27 34 36 46 27 34 36 46 HI, Kamaoa-Puueo 19.01 -155.66 96 112 116 137 2 2.2 3 5
HI, Kauai 22.13 -159.67 6.2 7 37.8 183 2 2 2 2 HI, Nelha 19.02 -155.76 72 86 89 109 6 7 8 10
HI, South Point 19.10 -155.66 146 156 160 183 2 3.2 4 7 HI, South Point 19.00 -155.10 27 48.8 72 72.2 27 34 36 43
MA, Boston 42.35 -71.11 28.2 43.2 46.2 63 3 4 6.2 14.4 MA, Westford 42.62 -71.49 29.6 40.6 43.4 50.2 2 2 3.6 13

41
MD, Blossom Point 38.43 -77.09 31 42.4 43.4 60.6 6 9.6 10.2 22.6 MD, Blossom Point (12W) 38.43 -77.08 31.6 42.6 44.6 61.2 7.2 9.4 12.8 23.6
MD, Greenbelt 39.00 -76.84 27 34.4 34.4 66.2 9 11.8 15.6 20.2 MD, Laurel 39.18 -76.90 24.2 44.4 47.2 75.8 5 6 6.2 14.6
NM, Las Cruces 32.27 -106.75 46.6 54.2 56.2 66.2 6 6 6 6 NM, White Sands (STGT) 32.54 -106.61 68 73 73 83.4 3 4 4 6 NM, White Sands (WSGT) 32.50 -106.61 61.8 74.2 75.8 87.6 4 4 4 4 NM, White Sands (WSGT-
TDRS East) 32.35 -106.61 79.6 94.2 95 116 4 4 4 4 PA, Horsham 40.20 -75.17 21 35 35 44 6 9 9 9
PTR, Mayaguez 18.21 -67.14 42 52 55 68 2 2 2 7 VA, Chantilly 38.89 -77.84 26.2 31.8 35.4 37 2 2.4 3.2 8
VA, Dulles 39.01 -77.43 29.6 32.2 32.2 33 6 9 9 10 VA, Wallops Island 37.93 -75.48 37.2 47.2 53.6 61.8 25.6 34.8 11 51.2
VA, Wallops Island (SWAS) 37.93 -75.30 31.8 44.8 49.4 57.6 24 33 37.6 45 VA, Wallops Island 37.93 -75.48 37.4 47.2 49.2 61.8 25.6 35 37.8 48.8
WV, Fairmont 39.26 -80.11 7 9 10.4 10.8 2 2 2 2

42
III.B.2 Interference Scenario 2: Coordination Contours around NASA Aero-Telemetry Sites
NASA also uses the 2200-2290 MHz band for aeronautical telemetry from test aircraft at selected test ranges. Telemetry spectrum is required for the transmission of real-time data from a test vehicle to ground. It allows the testers to conduct safe, effective, and efficient tests by displaying and analyzing data in real time. The band supports aerospace flight research and technology integration, space exploration concepts, airborne remote sensing, and a wide variety of science missions. Coordination contours can be generated with similar considerations as in III.B.1. In this case, however, since the telemetry receiving ground station may point down to the horizon while tracking an aircraft, the antenna main beam gain rather than sidelobe gain is used to determine the maximum coordination contours.
To protect telemetry receiving stations, NASA generated coordination contours based on the receive parameters given in Table 14 for various power levels. Sample sites are shown in Figures 9 and 10 for Edwards, CA and White Sands, NM. Table 15 shows representative maximum and minimum coordination values for various interfering EIRP levels directed at the telemetry sites.
Table 14. Parameters for Aero-Telemetry Ground Station Coordination Contours
Name Rx Latitude (deg N)
Rx Longitude (deg E)
Noise temperature (deg K)
Antenna Gain (dBi)
Merritt Island, FL 28.3578 -80.7033 150 44
White Sands 32.4178 -106.3194 150 38
EDWARDS, CA 34.9608 -117.9114 150 42
Wallops Island, VA 37.8508 -75.4706 150 43
Fairbanks, Alaska 65.1172 -147.4592 150 43

43
Figure 9. 2.15 dBW Coordination contour around Edwards, CA Telemetry Station
Figure 10. 2.15 Coordination contour around White Sands, NM Telemetry Station

44
Table 15. Max/Min Coordination Distances of NASA Telemetry Stations versus Interferer EIRP
Interferer EIRP Max Coordination Distance
NASA Rx Aero-Telemetry Station
-10 dBW 0 dBW 2.5 dBW
Merrit Island, FL 64.8 92.4 111.2 White Sands, NM 91 91.3 91.5
Edwards, CA 59.2 74.8 74.8 Wallops Island, VA 32.4 41.8 43.7
Fairbanks, AK 39.2 40.6 40.8
III.B.3 Interference Scenario 3: Aggregate Interference into TDRS System
III.B.3a Impact from DoD Systems
DoD has indicated that this band is an alternate band for relocation of TRR (Tactical Radio Relay) systems used by the Army, Navy, and Marine Corps (the primary band selected by DoD for these systems is 2025-2110 MHz as discussed in Section III.A).
The technical parameters and deployment were provided by DoD and are the same as used in the 2025-2110 MHz analysis (see Tables 7-9 in Section III.A). However, instead of interference into the TDRS user satellite on the TDRS forward link, here we are concerned with interference into the TDRS satellite itself on the TDRS return link. Note that for TRR/Army systems, 52 sites are listed with two (2) co-channel interfering emitters per site; for TRR/USMC, 17 sites are listed with two (2) co-channel interfering emitters per site; and for TRR/NAVY, 5 sites are listed with (1) co-channel interfering emitter per site. TRR/Army and TRR/USMC transmitters are assumed to have identical characteristics. Note also that the -8 dBW (22 dBm) transmit power for TRR Army/MC and 13 dBW (43 dBm) transmit power for TRR NAVY are nominal power levels for these devices assuming they have automatic transmit power control (ATPC). The peak power is 2 dBW (32 dBm) and 20 dBW (50 dBm), respectively. Further, it is assumed that the DoD/TRR systems operate with a 50% duty cycle. As in the 2025-2110 MHz analysis, the ITU-R SA.1155 interference criterion (i.e. I/N = -10 dB not to be exceeded more than 0.1% of the time) is applied.

45
The TDRS SSA (S-band Single Access) tracking antenna (4.8 meter diameter) has a relatively high gain of 36.8 dBi (2.4° beamwidth) at S-band and so is very sensitive to interference. In addition, TDRSS space-to-space links (both forward and return) generally operate on tight link margins (typically 2-4 dB or less) due to limited power on both ends of the link. As such the raising of the noise floor by even 1 dB (i.e. I/N=-10 dB) is critical. The TDRS satellite system noise temperature is assumed to be 410K in this analysis.
Figures 11a-11d give the results of the analysis for four cases: (1) TDRS 41W tracking ISS (International Space Station) in a 400 km altitude orbit inclined 51.6°; (2) TDRS 41W tracking the Aura satellite in a 705 km altitude orbit inclined 98.2°; (3) TDRS 174W tracking ISS; and (4) TDRS 174W tracking Aura. Note that in each case, the combined 143 TRR emitters (i.e. 104 Army + 34 USMC + 5 NAVY) satisfies the ITU-R criterion. The assumptions and results are summarized in Table 16.
Table 16. Interference from DoD Systems into TDRS Satellite Receiver
ISS/TDRS 41W ISS/TDRS 174W Aura/TDRS 41W Aura/TDRS 174W Army/MC Navy Army/MC Navy Army/MC Navy Army/MC Navy
Duty Cycle % 50% 50% 50% 50% 50% 50% 50% 50% Power (dBW) -8 13 -8 13 -8 13 8 13 Elevation angle random
+-5 deg 0 deg +-5 deg 0 deg +-5 deg 0 deg +-5 deg 0 deg
Azimuth -random 360 360 360 360 Ant Gain (dBi) 24.5 6 dBi 24.5 6 dBi 24.5 6 dBi 24.5 6 dBi Ant Pattern ITU-R 1245-1 1336-2 1245-1 1336-2 1245-1 1336-2 1245-1 1336-2 I/N @ 0.1% (dB) -10.8 -17.3 -13 -14.1 -12 -18.0 -14.1 -15

46
Figure 11a.
Figure 11b.

47
Figure 11c.
Figure 11d.

48
III.B.3b Impact from Department of Justice Systems
The following is an assessment of the aggregate interference from DOJ emitters into TDRS satellites located at 41W and 174W when tracking the non-GSO satellites AURA and ISS space station.
Interference Parameters
The Department of Justice has provided its plans for the use of the 2200 MHz band in its Phase II Report. DOJ already operates video surveillance systems in the 2200-2290 MHz band and they plan to relocate additional video surveillance into the band. This is indicated in Table 17. These video surveillance systems are comprised of the following:
a. Miniature concealment devices, analog: 200 mW, 25 MHz transmitters; b. Miniature concealment devices, digital: TBD; c. Small concealment devices: analog: 50 mW, 5-10 MHz; d. Remote control analog or SD or HD Camera: 200 mW , 5-10 MHz; e. Antenna gain = 2.15dBi.
Table 17. Proposed Destination Bands for DOJ Operations
Based on Table 17, the DOJ interference across the United States is modeled to include (10) 10 MHz channels working 6 hours per day with 50 mW of power and (68) 5 MHz channels working 24 hours per day across the entire band. Assuming operations occur in the ten top cities (Table 18), this is modeled as 8.8 channels per city. As there is about 90 MHz available, it is estimated that at any given instant there
(Law Enforcement Sensitive - please handle appropriately) Operation Types of Systems Current Technical Parameters (1) Anticipated Technical Parameters (2) # of Ops /
Duration (3) Proposed Destination Band (MHz) Miniature Concealment Analog, FM, 200 mW, 17 Mhz BW, omni radiator Digital, COFDM, 50 mW, 10 Mhz BW, omni Ant 10 / 6 hrs 2200 - 2290; 1675 - 1695 Airborne Downlink, Digital, COFDM, 5 W, 10 MHz BW, Blade
Ant Downlink, Digital, COFDM, 2 W, 5 MHz BW, Blade Ant 8 / 6 hrs 4800 - 4940
Audio Surveillance Covert Digital, CQPSK, 100 mW, 12.5 khz BW, Omni Ant Digital, CQPSK, 100 mW, 6.25 khz BW, Omni Ant 20 / 2 hrs 1435 - 1525 UAS Downlink, Digital, COFDM, 200 mW, 10 MHz BW,
Blade Ant Downlink, Digital, COFDM, 200 mW, 5 MHz BW, Blade Ant 1 / 6 hrs 1435 - 1525
Robotics Analog, FM, 3 W, 22 Mhz BW, omni radiator Digital, COFDM, <3 W, 10 Mhz BW, omni Ant (4) 3 / 6 hrs 1435 - 1525 Small Concealment Analog, FM, 2 W, 17 Mhz BW, omni radiator Digital, COFDM, 200 mW, 5 Mhz BW, omni Ant 34 /24-7 (5) 2200 - 2290; 1675 - 1695 Large Concealment Analog, FM, 1-3 W, 17 Mhz BW, directional patch
Ant Digital, COFDM, 200mW, 5 Mhz BW, directional patch Ant 34 /24-7 (5) 2200 - 2290; 1675 - 1695
MESH Networks Digital, COFDM, 200mW, 10Mhz BW, Omni Ant, 6-8 Tx nodes/network Digital. COFDM, 200mW, 5 Mhz BW, Omni Ant, 6-12
Tx nodes/network 3 / 24-7 1675 - 1695; 4400 - 4800 Video Repeaters (in-band and X-band) Analog, FM, 1-3 W, 17 Mhz BW, parabolic or
directional patch Ant Digital, COFDM, 200mW, 5 Mhz BW, directional patch Ant (+ potential broadband compliment) 12 / 24-7 1435 - 1525
Fixed Point-to-Point Analog, FM, 3 W, 17 Mhz BW, parabolic Ant Digital, COFDM, 2 W, 10 Mhz BW, parabolic Ant (+ potential broadband compliment) 5 / 24-7 4400 - 4800; 8100 - 8500
Central Receiver (6) Digital, COFDM, 5 W, 5 Mhz BW, Omni Ant (+ potential broadband compliment) (6) 3 / 24-7 (7) 1435 - 1525
NOTES :
(Law Enforcement Sensitive - please handle appropriately) PROPOSED DESTINATION BANDS FOR DOJ OPERATIONS
Transportable Surveillance
Fixed Surveillance
(6) Current operation "Recieves" signals within 1700 Band; Future state will incorporate return "control" path capability (5) Cumulative figure for all fixed concealment devices (7) # of Devices/Ops may reduce with consolidation initiatives between DOJ Components
(2) Assumes successful deployment of narrower bandwidth technology, with appropriate funding, and equitable access status to the destination bands (1) Characteristics represent mazimum device operating parameters (3) Estimates based on typical operational tempo experienced in Top Metroplitan areas, per month, throughout US (rural/remote ares are dramatically less) (4) Surveillance activities will typically be in the 200 mW range, while Bomb Squad activities exploit heavier devices capable of higher power levels

49
will be one co-channel video surveillance transmitter per city in each of the top 10 cities. So interference into a single TDRS channel (6.16 MHz bandwidth) is assumed to consist of a total of 10 simultaneous DOJ emitters operating at 100% duty cycle (i.e. 24/7).
Table 18. Top Ten Urban Areas Census 2009
City Longitude (W) Latitude (N))
New York city 73.9179 40.70423
Los Angeles city 118.376 34.08616
Chicago city 87.6794 41.84068
Houston city 95.3832 29.7629
Philadelphia city 75.1448 39.99801
Phoenix city 112.076 33.52837
San Diego city 117.146 32.77954
Dallas city 96.7872 32.79953
San Antonio city 98.5127 29.45153
Detroit city 83.1026 42.38714
Like the DoD analysis, two GEO TDRS satellites are considered (41W and 174W) and two user satellites are considered (ISS and Aura). The relevant parameters are given in Table 19.
Table 19. LEO and TDRS Parameters
Parameter Units Value
TDRS
TDRS satellite Longitude deg -41 or -174
Antenna Gain dBi 36.8
Antenna Pattern ITU-R Rec 672-4 Rec 1 circular beam pattern

50
Carrier Frequency Range MHz 2200-2290
Signal Bandwidth MHz 6.16
Noise temperature K 410
Thermal Noise dBW/Hz -202.47
Interference Criteria
ITU-R Criteria Rec. ITU-R SA.1155 (s-s links)
I/N exceeded less than 0.1% of the time (dB)
-10
Aura satellite
Apogee km 705
Perigee km 705
Inclination deg 98.2
ISS
Apogee km 400
Perigee km 400
Inclination deg 51.6
Results of Simulation Exercises
Visualyse software was used to calculate the interference statistics. Since the majority of video surveillance operations are carried out in urban/suburban areas, interference from these units to the satellite will often be mitigated by clutter losses (buildings, walls, floors, signs, bodies, etc). Due to the difficulty in accurately modeling these losses, this analysis assumes a worst case assumption of no clutter loss (i.e. unobstructed LOS between DOJ emitters and TDRS satellite). Figure 12 shows that even under this worst case assumption, the ITU protection threshold is satisfied since the I/N does not exceed -24 dB and this is 14 dB below the -10 dB ITU threshold.

51
Figure 12.
III.B.3c. Impact from Department of Homeland Security Systems
Like DOJ, DHS intends to move additional video surveillance into the 2200-2290 MHz band. Therefore similar analysis was performed. Deployment and technical information was based on material included in the DHS Reports and direct correspondence with DHS. It is estimated that there would be 100-500 simultaneously transmitting DHS emitters nationwide at any given time across the entire band (11 partially overlapping channels each 8 MHz wide). Thus for a given 8 MHz channel, 9 emitters (100/11) to 46 emitters (500/11) are anticipated. Of these, 80% are expected to be located outdoors while the rest are body-worn indoor devices that will not be a significant threat due to low power and clutter loss. Therefore, in the TDRS channel bandwidth of 6.16 MHz, a maximum of 37 (0.8 x 46) simultaneous DHS emitters operating at 100% duty cycle is assumed. These 37 emitters are assumed to be located in the 37 most populated cities. From DHS information, each emitter is assumed to operate at 1 Watt transmit power; 7.5 MHz emission bandwidth; and omni/dipole antenna (2.15 dBi gain and pattern modeled using the omni pattern in ITU-R Rec F.1336-2/Recommends 2.2).
DOJ 10 Cities into ISS and Aura links to TDRS 41W
ISS-TDRS41W Aura-TDRS41W
% Time I/N Exceeded
I/N Aggregate (dB)
0.1
1
10
100
-24 -25 -26 -27 -28 -29 -30 -31 -32 -33 -34 -35 -36 -37 -38 -39 -40 -41 -42 -43 -44 -45 -46 -47 -48 -49 -50 -51 -52 -53 -54 -55 -56 -23
Aura to TDRS 41W

52
The impact of this deployment on the TDRS satellite receiver is shown in Figure 13. The results show that the maximum I/N = -15 dB which satisfies the ITU threshold.
Figure 13.
III.B.3.d. Impact from Department of Treasury Systems
Treasury has similar video surveillance equipment as DOJ and DHS. It currently has 120 units at 1755-1850 MHz for indoor and outdoor use. According to their Phase II Report, the outdoor webcam units will be transferred to IP related transmissions, so most of the outdoor units may not require use of 2200-2290 MHz radio. Notwithstanding this possibility, interference was modeled similar to that used for DOJ (i.e. 10 simultaneous co-frequency emitters nationwide in top 10 cities operating 24/7). Therefore, like DOJ, interference impact is expected to be negligible (i.e. I/N = -24 dB).
III.B.3.e. Impact from Department of Interior Systems
Based on their Reports, DOI’s planned usage of the 2200-2290 MHz band is to support downlink video transmissions from helicopters in the Washington DC area during major events. The transmitters would typically be 10 watts; omni (3 dBi) antennas; and 18 MHz bandwidth. The helicopter altitude is typically 1000 feet in the Washington, D.C. area (centered around 38.52N,
DHS 37 Cities into ISS and Aura links to TDRS 41W
% T
ime
I/N E
xcee
ded
1
10
100
ISS to TDRS 41W
Aura to TDRS 41W

53
76.59W). For the interference analysis, a single interfering co-channel DOI emitter operating in DC at 100% duty cycle was assumed. This results in a maximum I/N = -22.2 dB which satisfies the ITU threshold.
III.B.3.f Impact from USPS
The USPS has advised that they have similar but considerably less extensive video surveillance operations as DOJ. Since DOJ is expected to have negligible impact (I/N = -24 dB), USPS is also expected to be negligible.
III.B.3.g Impact from Combined Systems
Additional analysis was performed to estimate the combined aggregate interference impact to TDRS from the systems described above. A total of 201 interfering emitters was assumed (i.e. 5 Navy/TRR + 104 Army/TRR + 34 USMC/TRR + 37 DHS + 10 DOJ + 10 Treasury + 1 DOI) using their respective transmit characteristics as described in the previous sections. The analysis showed a net I/N = -8.6 dB (exceeded for no more than 0.1% of the time) and that the threshold level of I/N = -10 dB is exceeded only 0.24% of the time. Although, strictly speaking, this exceeds the ITU limit by 1.4 dB, this interference is considered acceptable given that it is based on several conservative assumptions (e.g. DHS/DOJ/DOI/DOT transmitters operate continuously 24/7 with no building or clutter losses included and maximum expected number of co-channel emitters). The DoD and DHS systems are the main contributors to the overall interference.
III.B.4 Conclusion
With regard to systems being relocated to the 2200-2290 MHz band, NASA satellite receiving earth stations and aircraft telemetry receiving ground stations will require protection from incoming transmitters using appropriate coordination contours around its earth stations and telemetry sites. This Report provided sample coordination contours based on the expected EIRP levels of some incoming video surveillance systems. Additional coordination contours may be required for protection from DoD TRR systems if they move into the band. Based on the system characteristics of DoD, DHS, DOJ, DOI, and Treasury systems described in the previous sections, it appears that interference from these systems into the NASA TDRSS return links is acceptable. Like the 2025-2110 MHz band, however, this conclusion is only valid as long as there is no significant deviation of these agency system characteristics from those used in the above analyses.

54
III.C. 2360-2395 MHz Band In accordance with US2761, mobile service use of this band is limited to aeronautical telemetry and associated telecommand operations. Table 20 shows the 13 NASA RFAs in the band – most of them supporting WFF high altitude scientific balloon air-to-ground telemetry and WFF sounding rocket/launch vehicle telemetry. As indicated in Section II, NASA WFF plans to relocate (3) additional balloon telemetry channels from the 1755-1850 MHz band into this band. The band also has a primary allocation for the radiolocation service and NASA has one RFA (NASA105581) for the Lunar Reconnaissance Orbiter (LRO) radar.
Table 20. NASA RFAs in the 2360-2395 MHz Band
III.D. 4400-4940 MHz Band This band has a (G-only) FIXED allocation and (G-only) MOBILE allocation and it is heavily used for Federal fixed and mobile systems including aero-telemetry (and associated telecommand); point-to-point microwave; ACTS; tactical data links; and UAV command and control systems. As shown in Table 21, NASA has 11 RFAs in the band, most of them supporting video/data air-to-ground (A/G) telemetry for high performance aircraft and UAVs at DFRC (7 RFAs) and WFF (3 RFAs). KSC also has an RFA for UWB (Ultra WideBand) experimental testing. As indicated in Section II, NASA LaRC intends to relocate all (7) of its RFAs in 1755-1850 MHz supporting aero telemetry/telecommand to this band. Also, NASA DFRC plans to relocate its (3) aero telemetry/telecommand RFAs in 1755-1850 MHz to this band.
1 US276 Except as otherwise provided for herein, use of the band 2360-2395 MHz by the mobile service is limited to aeronautical telemetering and associated telecommand operations for flight testing of aircraft, missiles or major components thereof. The following three frequencies are shared on a co-equal basis by Federal and non-Federal stations for telemetering and associated telecommand operations of expendable and reusable launch vehicles, whether or not such operations involve flight testing: 2364.5 MHz, 2370.5 MHz, and 2382.5 MHz. All other mobile telemetering uses shall not cause harmful interference to, or claim protection from interference from, the above uses.

55
According to the most recent NTIA comparable band chart, this band is a DoJ preferred band for relocating their fixed PTP microwave systems and UAS systems from the 1755-1850 MHz band. The DoD has also indicated that this is a preferred band for A/G telemetry and possibly also UAS systems. With regard to relocation of 1755-1850 MHz aero telemetry/telecommand operations and UAS operations to this band, it should be noted again that US implementation of ITU FN 5.440A (and the associated ITU Resolution 416) without modification would actually exclude telecommand (ground-to-air) transmissions in the 4400-4940 MHz band and the disposition of existing telecommand ops in the band would also need to be considered.
Table 21. NASA RFAs in the 4400-4940 MHz Band
III.E. 5091-5250 MHz Band According to the most recent NTIA comparable band chart, this band is a DoD preferred band for relocating their A/G telemetry operations and possibly also some UAS systems. NASA and DoD are in detailed discussions about all of the DoD Systems that will be moving into 5091-5250 MHz from 1755-1850 MHz.
As explained in Section II, NASA has also selected this band as a potential relocation band for telemetry/UAS systems, but there are complicating factors as described previously and noted again below. As shown in Table 22, NASA GRC currently has 7 RFAs in the 5091-5150 MHz band supporting experimental wireless airport surface networks at Cleveland Hopkins Airport.
Relocation of telemetry/UAS operations into the 5091-5150 MHz portion would require adoption of ITU FN 5.444B. Again, note that like 5.440A for the 4400-4940 MHz band, 5.444B (and the associated WRC-07 Resolution 418) limits aeronautical use to only the telemetry (air-to-ground) direction and prohibits telecommand (ground-to-air) transmissions. A large influx of aero-telemetry systems into this band would also likely raise concern from Globalstar, which operates feederlink uplinks to its NGSO constellation of satellites over the 5091-5250 MHz band. The impact to Globalstar feeder links will depend on the aggregate interference across CONUS from all transmitters operating simultaneously in the band. Even though the small number of NASA operations would likely not pose a problem, the contribution from all users of the band must be considered. It should also be noted that there is an AMS(R)S (i.e. safety-of-life) allocation in 5091-5150 MHz (FN 5.367) and although there is currently no AMS(R)S system

56
using the band, it is being considered for UAS satellite command and control links under WRC-12 Agenda Item 1.3. Furthermore, besides aero-telemetry use, FN 5.444B also allows AM(R)S applications such as airport surface broadband comm/surveillance networks (ASDE-X) and aeronautical security communications in the 5091-5150 MHz band. This will require that aero-telemetry users operating near major airports coordinate with these (safety-of-life) aviation systems. The AM(R)S use may also be extended to also allow terrestrial UAS command and control as part of WRC-12 AI 1.3.
Relocation of aero-telemetry/UAS ops into the 5150-5250 MHz portion will also require regulatory action since there is currently no aero telemetry service allocation. FN 5.444B only covers the 5091-5150 MHz portion – not 5150-5250 MHz. There is an ITU FN (5.446C) that permits aero-telemetry in the band, but only in Region 1 (Europe). Aero-telemetry users would again be constrained by the need to protect Globalstar feederlinks which span the entire 5091-5250 MHz. The 5150-5350 MHz band is also a UNII (Unlicensed National Information Infrastructure) band used in wireless LANs (i.e. 802.11a/h/j/n).
Table 22. NASA RFAs in the 5091-5250 MHz Band
III.F. 7125-8500 MHz Band According to the NTIA comparable band chart, a number of agencies have proposed to relocate their fixed PTP microwave systems from the 1755-1850 MHz band to this band. These agencies are DHS, DOJ, DOE, USCG, DOI, DOD, and FAA. In the US Table of Allocations, this band consists of a number of sub-bands as shown in Table 23. Most of these sub-bands have a primary FIXED service allocation. NASA currently has a total of 115 RFAs throughout the 7125-8500 MHz band and the distribution of these RFAs is also shown in Table 23. A detailed listing of these 115 RFAs is shown in Table 24. The two most important NASA sub-bands are 7145-7190 MHz where high-power uplinks (up to 20 kW) are operated from the Deep Space Network (DSN) in Goldstone, CA; and 8400-8500 MHz which is used for Goldstone DSN downlinks. Agencies relocating systems to 7125-8500 MHz should therefore avoid operating in these two sub-bands near the Goldstone, California DSN complex. NASA reviewed the Phase II/III Reports from the above agencies and although they identified the 7125-8500 MHz band as a

57
potential relocation band for fixed point-to-point microwave systems, specific sub-bands were not identified.

58
Table 23. Breakdown of 7125-8500 MHz Band and NASA Usage in the Band

59
Table 24. NASA RFAs in 7125-8500 MHz Band

60
Table 24. NASA RFAs in 7125-8500 MHz Band (cont.)

61
Table 24. NASA RFAs in 7125-8500 MHz Band (cont.)