NASA · INTRODUCTION Failures in composite structures often develop as delaminations between plies....
42
NASA TECHNICAL MEMORANDUM 100662 |bA_A-_lq-1000(::_) _ MI](I_I;-MCI:]; E_.hDING AE.I:::A_A'IL5 FGiX D_.tt_EibA'llt...b 'I_._'I.II_G (NASA) _C Io CSCL 11D N89-1CS_5 Unclaz 01593E4 A MIXED-MODE BENDING APPARATUS FOR DELAMINATION TESTING John H. Crews, Jr. and James R. Reeder AUGUST 1988 NASA NationaJ Aeronaul_cs and Space Admmislrat_on Langley Research Center Hampton, Virg,nia 23665-5225 https://ntrs.nasa.gov/search.jsp?R=19890001574 2018-09-02T16:01:35+00:00Z
Transcript of NASA · INTRODUCTION Failures in composite structures often develop as delaminations between plies....

NASA TECHNICAL MEMORANDUM 100662
|bA_A-_lq-1000(::_) _ MI](I_I;-MCI:]; E_.hDING
AE.I:::A_A'IL5 FGiX D_.tt_EibA'llt...b 'I_._'I.II_G (NASA)_C Io CSCL 11D
N89-1CS_5
Unclaz
01593E4
A MIXED-MODE BENDING APPARATUS
FOR DELAMINATION TESTING
John H. Crews, Jr. and James R. Reeder
AUGUST 1988
NASANationaJ Aeronaul_cs and
Space Admmislrat_on
Langley Research Center
Hampton, Virg,nia 23665-5225
https://ntrs.nasa.gov/search.jsp?R=19890001574 2018-09-02T16:01:35+00:00Z

SUMMARY
A mixed-mode delaminatlon test procedure was developed combining double
cantilever beam (DCB) mode I loading and end notch flexure (ENF) mode II
loading on a split unidirectional laminate. By loading the specimen with a
lever, a single applied load simultaneously produces mode I and mode II
bending loads on the specimen. This mlxed-mode bending (MMB) test was
analyzed using both finite element procedures and beam theory to calculate the
mode I and mode II components of strain energy release rate, G I and Gll,
respectively. The analyses showed that a wide range of GI/GII ratios could
be produced by varying the applied load position on the loading lever. As the
delamination extended, the GI/GII ratios varied by less than five percent.
The simple beam theory equations were modified to account for the elastic
interaction between the two arms of the specimen and to account for shear
deformations. The resulting equations agreed closely with the finite element
results and provide a basis for selection of GI/GII test ratios and a basis
for computing the mode I and mode II components of measured delamination
toughness. The MMB specimen analysis and test procedures were demonstrated
using AS4/PEEK (APC2) unidirectional laminates. The MMB delamination test
introduced in this paper is rather simple and is believed to offer several
advantages over most current mlxed-mode test procedures.
INTRODUCTION
Failures in composite structures often develop as delaminations between
plies. Typically, such delamlnations initiate and propagate under the
combined influence of normal and shear stresses. Therefore, tests of
delamlnation resistance should account for the effects of combined stresses.
The present study addresses delamlnation testing with combined tensile normal
stress (mode I) and sliding shear stress (modeII). Various approaches have
been used to develop test specimenswith such combined normal and shear
stresses on the delamination plane. Unfortunately, however, several different
types of specimens are often needed to generate delamination toughness data
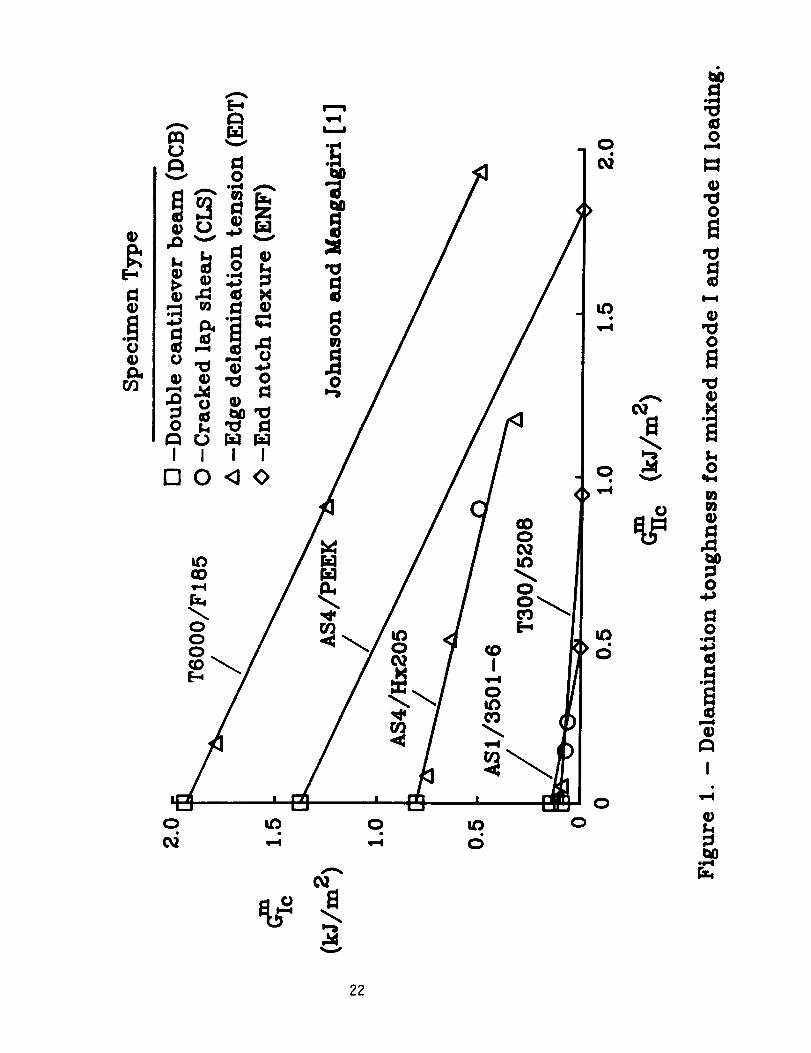
over a desired range of mlxed-modecombinations. For example, figure i shows
interlaminar fracture toughness curves measuredusing three different specimen
types [I]. The pure modeI values for delaminatlon fracture toughness Glc
were obtained using a split unidirectional laminate loaded as a double
cantilever beam (DCB). The pure modeII values GII c were found using the
same type of specimen, but subjected to three point bending; this type of test
is called an end notch flexure (ENF) test [2]. However, the mode I and mode
m m respectively)II components of mlxed-mode fracture toughness (Glc and Gllc,
were generated using cracked lap shear (CLS) and edge delamination tension
(EDT) specimens [3]. The use of different test configurations can involve
different test variables and analysis procedures that can influence test
results in ways that are difficult to predict. The purpose of this paper is
to introduce a new test apparatus that can be used to measure delamination
toughness over a wide range of mode I/II ratios as well as pure mode I and
mode II.

First, the current methods for mlxed-mode delamlnation testing will be
briefly reviewed. Next, the proposed mixed-mode bending (MMB) test is
described. Then the total strain energy release rate G and its mode I (GI)
and mode II (GII) components will be evaluated for the MMB test specimen using
a finite element analysis. In addition, closed form equations for G I and
GII will be developed using simple beam theory with modifications to improve
their accuracy. Finally, the MMB test method is demonstrated by testing
graphlte/PEEK (APC2) specimens over a wide range of GI/GII ratios.
Delamination toughness data are presented in terms of the mode I and mode II
components of delamination fracture toughness.
NOMENCLATURE
a
b
c
Ell
E22
G
Gc
G12
GI3
G I
GII
Glc
Gllc
G mIc
delamlnation length, m
specimen width, m
position of applied load on lever, m
lamina longitudinal modulus, GPa
lamina transverse modulus, GPa
total mixed-mode strain energy release rate, J/m 2
total mixed-mode delaminatlon fracture toughness, J/m 2
lamina longitudinal shear modulus, GPa
lamina transverse shear modulus, GPa
mode I strain energy release rate, J/m 2
mode II strain energy release rate, J/m 2
delaminatlon fracture toughness for mode I loading, J/m 2
delamination fracture toughness for mode II loading, J/m 2
mode I component of G for mlxed-mode loading, J/m 2c

m
GIIc
h
k
L
P
PI
PII
6
v12
mode II component of G for mlxed-mode loading J/m 2C
specimen half-thlckness, m
stiffness of elastic foundation, N/m 2
specimen half-span, m
applied load, N
mode I load, N
mode II bending load, N
load-point displacement, m
elastic foundation parameter, I/m
lamina Polsson's ratio
CURRENT MIXED-MODE DELAMINATION TESTS
This section briefly reviews current approaches for mlxed-mode
delaminatlon testing. This review provides background for the new approach
presented in the next section. Combined mode I and mode II delamination
fracture toughness tests usually employ a specimen containing an artificially
introduced delaminatlon. The specimen is loaded until the delamlnatlon grows.
Measured load and delamlnatlon length can then be substituted into strain
energy release rate equations to calculate the delamination toughness.
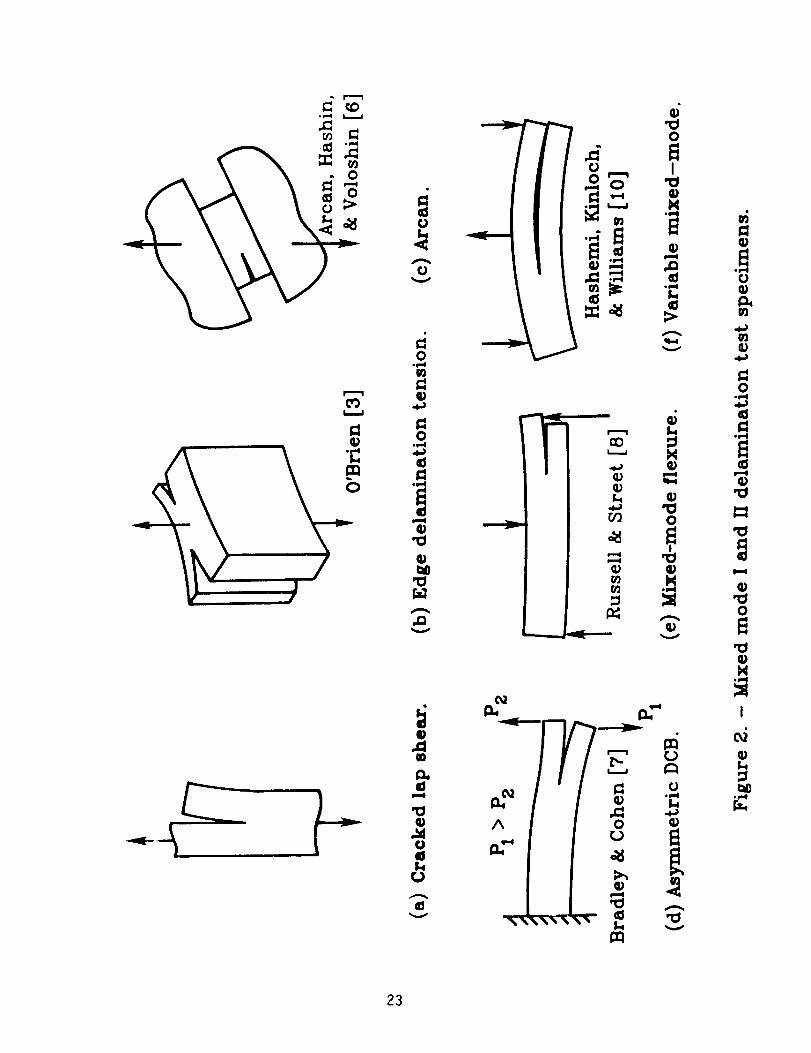
A sketch of the cracked lap shear (CLS) specimen is shown in figure
2(a). Unlaxial loading is applied to one arm of a split unidirectional
laminate. The load transfer to the other arm causes interlaminar normal
stresses (mode I) and interlaminar shear stresses (mode II). Although the CLS
specimen can be tested in conventional tension test machines, it has several
serious limitations. First, the mode I/II ratios cannot be calculated by
simple closed form stress analyses, and therefore, a numerical analysis is

required. Further, because large rotations can result from the load
eccentricity at the delamination front, a geometrically nonlinear numerical
analysis may be required to evaluate G I and GII [4]. Also, different ply
layups are required to create different mode I/II combinations, and only a
rather narrow range of ratios is attainable.
The edge delaminatlon tension (EDT) specimen, shown in figure 2(b), was
_ isdeveloped by O'Brien [3]. A specimen with a layup such as (+35/0/90) s
loaded in tension and the mismatch in the Poisson's ratios of the plies causes
high edge stresses at the 0/90 ply interfaces. The load-induced mode I and
mode II stresses at these interfaces can initiate edge delaminations.
Unfortunately, however, hygrothermal interlaminar stresses also exist at this
interface and can seriously reduce the measured delamlnation toughness [5].
Also, numerical analyses are required to calculate the interlaminar G I and
Gll components in the EDT test.
In the Arcan test configuration [6], figure 2(c), a split unidirectional
laminate is bonded between two metal fixtures that can be loaded to produce
various mixed-mode conditions at the delamination front. But, as with the CLS
and EDT tests, the mode I/II ratio must be determined by a numerical analysis.
Also, bond failures can limit the Arcan test use, especially for tough
laminates.
The asymmetric DCB test, proposed by Bradley and Cohen [7], avoids most
of the problems found with the first three methods. As shown in figure 2(d),
this approach involves loading the arms of a unidirectional DCB specimen with
two different loads. The loads can be selected to produce the full range of
mode I/II ratios. Equal and opposite loads produce a pure mode I
delamlnation, and equal loads produce a pure mode II delamination.
Unfortunately, the asymmetric DCB approach requires a complex loading system
to simultaneously control the two applied loads.
The mlxed-mode flexure test, proposed by Russell and Street [8], is shown
in figure 2(e). This test specimen is similar to the CLS specimen but is
loaded in three point bending. Unfortunately, different arm thicknesses are
required to produce different mode I/II ratios. This requires that specimens
be fabricated with the delaminatlon starter at different ply interfaces. Also
different arm thicknesses can influence the stress distribution ahead of the
delamination [9] and, therefore, may influence toughness measurements.
The variable mixed-mode test in figure 2(f) was proposed by Hashemi,
Kinloch, and Williams [i0]. A pure mode II condition is created when the
delamination tip is centered under the mid-span tension load. The mode I/II
ratio increases as the delamlnation extends toward the left load point. A
pure mode I condition exists when the delaminatlon is under the left load
point. As a result, the full range of mode I/II ratios can be produced.
However, the ratio changes as the delamination grows. This could complicate
the data analysis, especially for large increments of unstable growth. Also,
when the delamination tip is near either load point, simple closed form
equations for G I and GII will not account for the complex effects of load
concentrations or loading fixture stiffness.
MIXED-MODE BENDING TEST
The mixed-mode bending (MMB) test simply combines the mode I DCB and the
mode II ENF tests. This is achieved by adding an opening-mode load to a mid-
span loaded ENF specimen, as shown in figure 3(a). This additional load
separates the arms of the split unidirectional laminate as in a DCB test. The

relative magnitudes of the two applied loads determines the mlxed-mode ratio
at the delamlnatlon front. By applying these two loads through a lever and
hinge apparatus as shown in figure 3(b), the test can be conducted by applying
a single load. The loading position c determines the relative magnitude of
the two resulting loads on the specimen and, therefore, determines the mixed-
mode delamlnation ratio. Pure mode II loading occurs when the applied load is
directly above the beam mid-span (c - 0). Pure mode I loading can be achieved
by removing the beam and pulling up on the hinge.
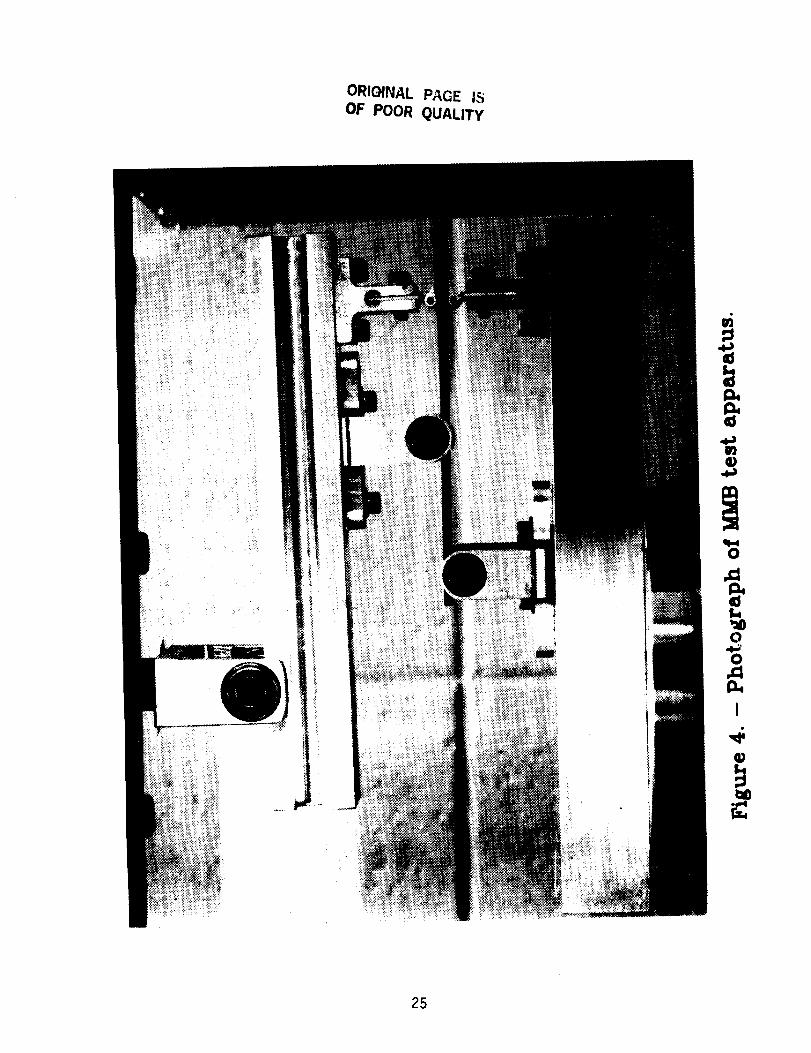
A photograph of the MMB test apparatus is shown in figure 4. The loading
lever is an aluminum I-beam weighing only 6 N, which was assumed to be a
negligible weight. The lever is several orders of magnitude stiffer than the
specimen and therefore, was assumed to be rigid. The lever load, the mid-span
load, and the left support reaction are applied through bearing-mounted
rollers to reduced frictional forces. The right end of the specimen is loaded
through hlgh-quallty, extruded aluminum hinges bonded to the specimen arms.
The specimen in this photograph is a 24-ply graphite/PEEK unidirectional
laminate, 25 mm wide and 102 mm long. The apparatus is mounted on a thick
steel base.
STRESS ANALYSIS
This section presents the stress analysis of the MMB test specimen
and focuses on the calculation of strain energy release rates. The GI/GII
ratio is needed to resolve the measured mixed-mode delamination fracture
toughness Gc into its mode I and mode II components, Gmlc and Gllc,m
respectively. First, a finite element analysis was used to provide a basic
understanding of the strain energy release rate during MMB testing. Next, a

more convenient beam theory analysis is presented and its results are compared
with those from the finite element analysis. Finally, the simple beam theory
analysis was modified to improve its accuracy.
Finite Element Analysis
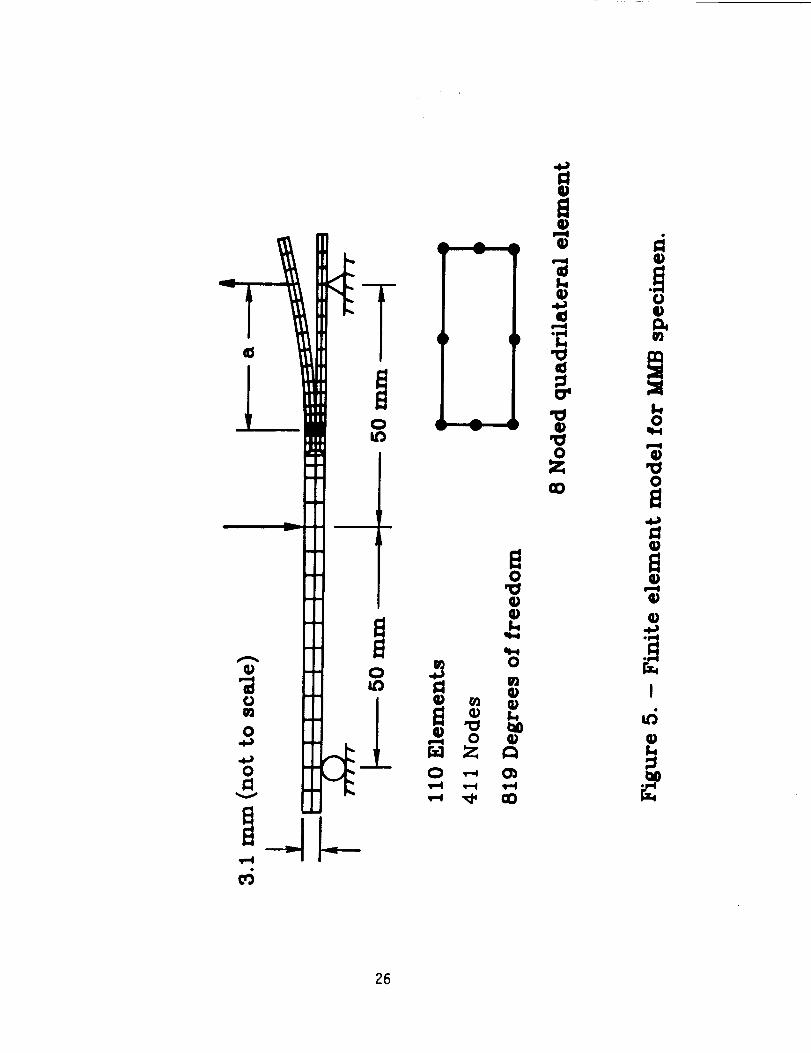
The MMB specimen was modeled and loaded as shown in figure 5. Eight-
noded quadrilateral elements were used with the MSC NASTRAN finite element
code [II]. To account for the effect of an uneven fiber distribution through
the specimen thickness, an effective modulus was calculated from a 3-point
bend test [12]. Measured mid-span displacements and loads were used with
beam theory to calculate the longitudinal modulus Eli for the laminate. An
effective Eli of 116 GPa was determined by this approach, compared to the
uniaxial tension value of 129 GPA from [13]. A transverse modulus E22 of
i0.i GPA, a Poisson's ratio v12 of 0.329, and shear modulus GI2 of 5.5 MPa
were used [13].
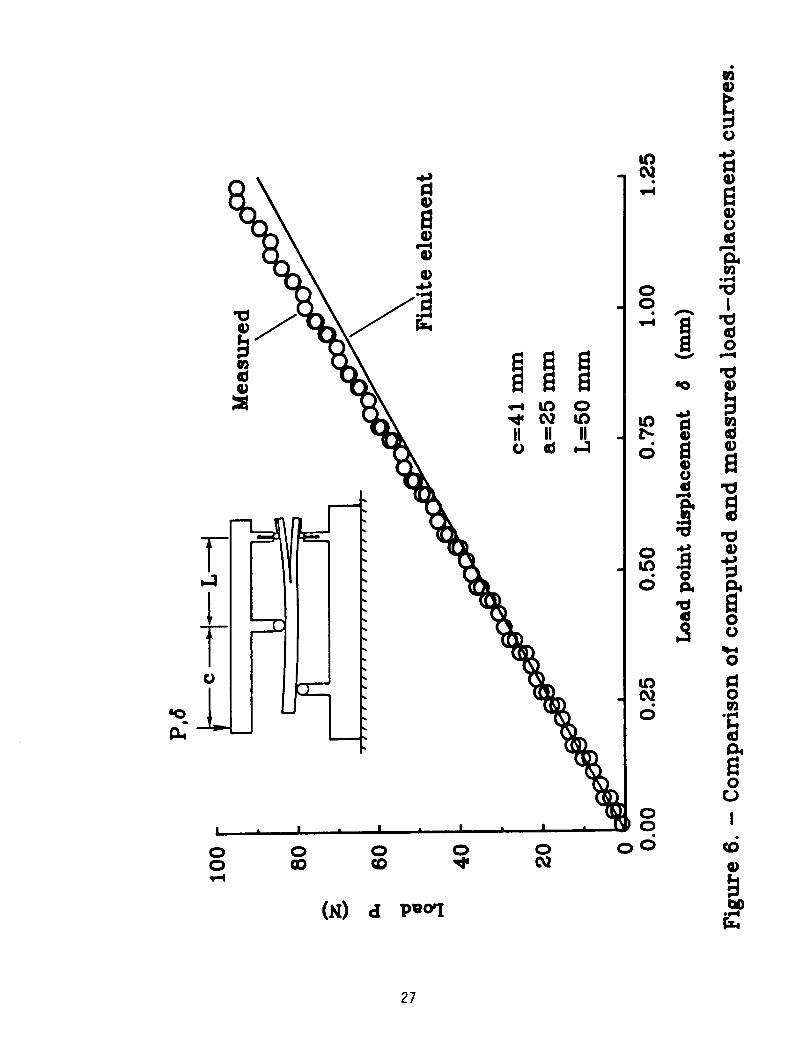
The finite element modeling was evaluated by comparing the computed load-
displacement results with measured results. The solid line in figure 6
represents the computed finite element results and the symbols show
measurements taken during loading and unloading of the MMB apparatus. The
load-polnt displacement was determined from the crosshead position. The solid
curve agrees with the test data very well in the lower load range and slightly
over estimates the displacements in the upper range. The discrepancy may be
caused by geometric nonlinearity which was not accounted for by the finite
element analysis. However, the correlation in this figure does suggests that
the finite element model is sufficiently accurate to analyze the MMB specimen.
Crack tip forces and displacements were used in the virtual crack closure
technique [14] to calculate G I and GII for the MMB specimen.

As previously mentioned, the load position c determines the ratio of
the mode I and mode If. To establish a relationship between c and the
GI/GII ratio, the finite element analysis was repeated for several values of
c. This relationship is shown in figure 7 where the symbols are the computed
values and the solid llne is a best fit curve. The test data shown previously
in figure i suggest that a mixed-mode toughness curve could be established
reasonably well using five test cases: three mlxed-mode and the two pure mode
toughness tests. In the present study, mixed-mode ratios of 4/1, i/i, and 1/4
were selected. As shown in figure 7, the three corresponding c values are
95 mm, 41 mm, and 27 mm, respectively. Although the present study was limited
to three mlxed-mode ratios, the MMB apparatus can be used to measure any
GI/GII ratio from zero to approximately five. Notice that GI/GII is zero
for c less than about 18 mm. Below this value, the mode I loading is not
large enough to overcome the crack-face normal stresses produced by the mode
II loading. Hence, the delaminatlon does not open, and G I must be zero
within this range, despite the nonzero c values. As previously mentioned,
the mode II tests were conducted with c equal to zero.
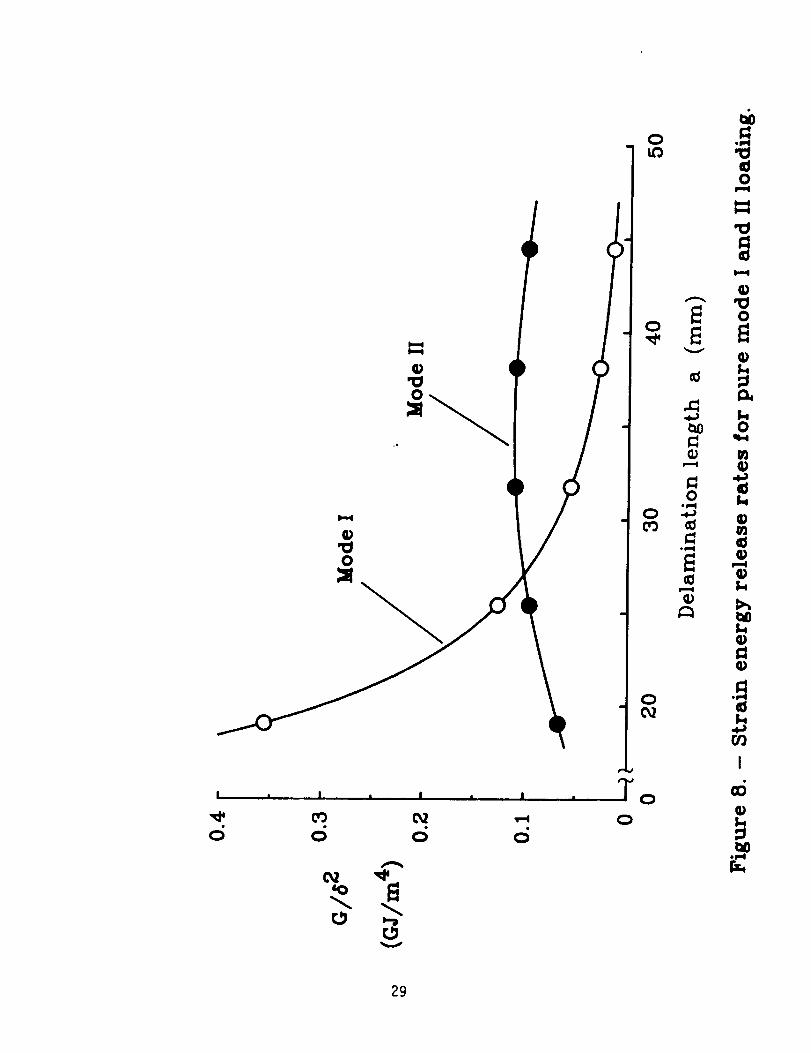
Finite element analyses of the MMB specimen were conducted to determine
the variation of the strain energy release rate during delamination. A half-
span length of 50 mm was used and analyses were conducted for delamination
lengths from about 20 mm to 45 mm. Figure 8 shows computed values of total
strain energy release rate G for the pure mode I and mode II cases, plotted
over a range of delamination lengths. The two curves in this figure represent
limits for the mixed-mode cases. For convenience, G values are normalized
by the square of the load-point displacement. If the curves are interpreted
as G variations during delaminatlon growth under constant displacement 6,
then they can be compared with toughness G c to predict if delaminatlon

growth is unstable (G continues to equal or exceed G as the delaminationc
grows) or is stable (G falls below Ge) requiring additional loading for
subsequent growth. The negative slope of the modeI curve shows that
delamination growth in a DCBtest should be stable. In contrast, the peak of
the modeII curve at 35 nun suggests delamination growth would be unstable for
delamination lengths less than this value but stable for longer lengths.
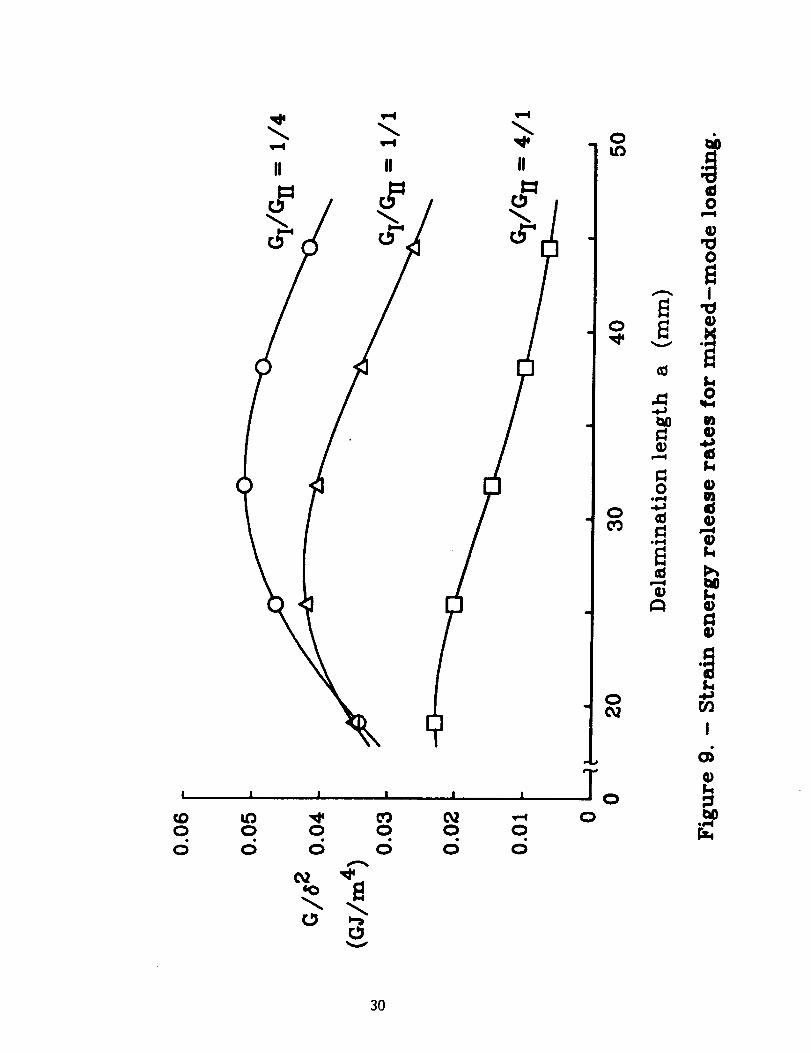
The G/62 curves for the three mixed-mode loading cases are shown in
figure 9. The case where mode I is dominant (GI/GII - 4/1) has a curve with a
negative slope, which indicates stable delamination growth as in the pure mode
I case shown in figure 8. The i/I and the 1/4 curve both indicate a region of
unstable growth below delamination lengths of 25 mm and 30 mm, respectively.
As expected, a higher mode II component in the mixed-mode test results in a
larger region of instability. Figure i0 shows the G I and GII component
curves for the three mixed-mode eases. These curves have the same trends as
the total G curves in figure 9.
The G I and GII values shown in figure I0 were used to calculate the
GI/GII ratios which are plotted versus delamination length in figure ii.
Preferably, this ratio should be constant throughout the test range of
delamination lengths. The horizontal lines in figure ii represent the 4/1,
I/i, and 1/4 mixed-mode ratios and pass through the computed values for the 25
mm delamlnation length. (Recall that a 25 mm delamination length was used in
figure 7 to establish the load position c for each of the three mixed-mode
cases). Within the useful test range (delamination lengths from 25 mm to
45 nun), the GI/GII ratios deviated from the nominal values by only about 5
percent. This small deviation shows that the GI/GII ratio can be assumed to
be constant during delamination growth for the MMB test.
I0
Beam Theory Analysis
Although the finite element analysis provided an accurate strain energy
release rate analysis of the MMB specimen, a closed form analysis offers many
advantages in setting up MMB tests and evaluating test results. A closed form
analysis also shows the functional relationships among the test parameters,
which improves the basic understanding of the MMB test. This section presents
strain energy release rate equations based on beam theory. The MMB loading
was represented by a superposltion of simple mode I and mode II loadings,
equivalent to those used with DCB and ENF tests, respectively. Thus, strain
energy release rate equations from the literature on DCB and ENF tests could
be combined to obtain the desired equations for the MMB test.
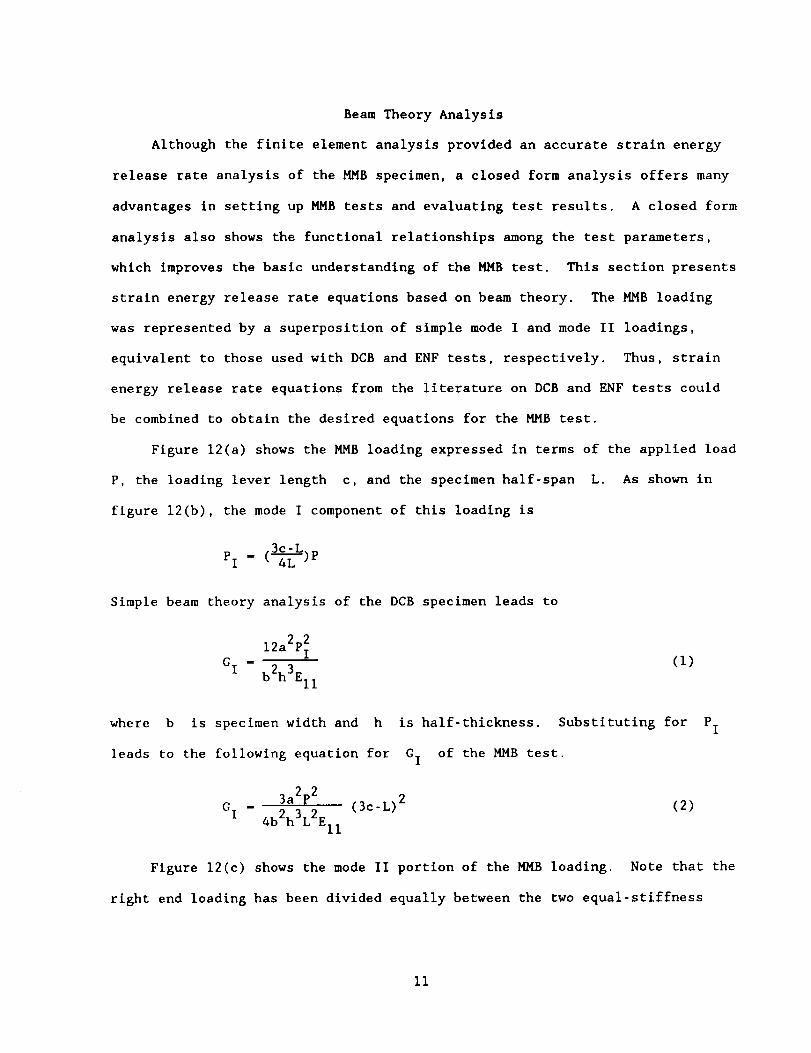
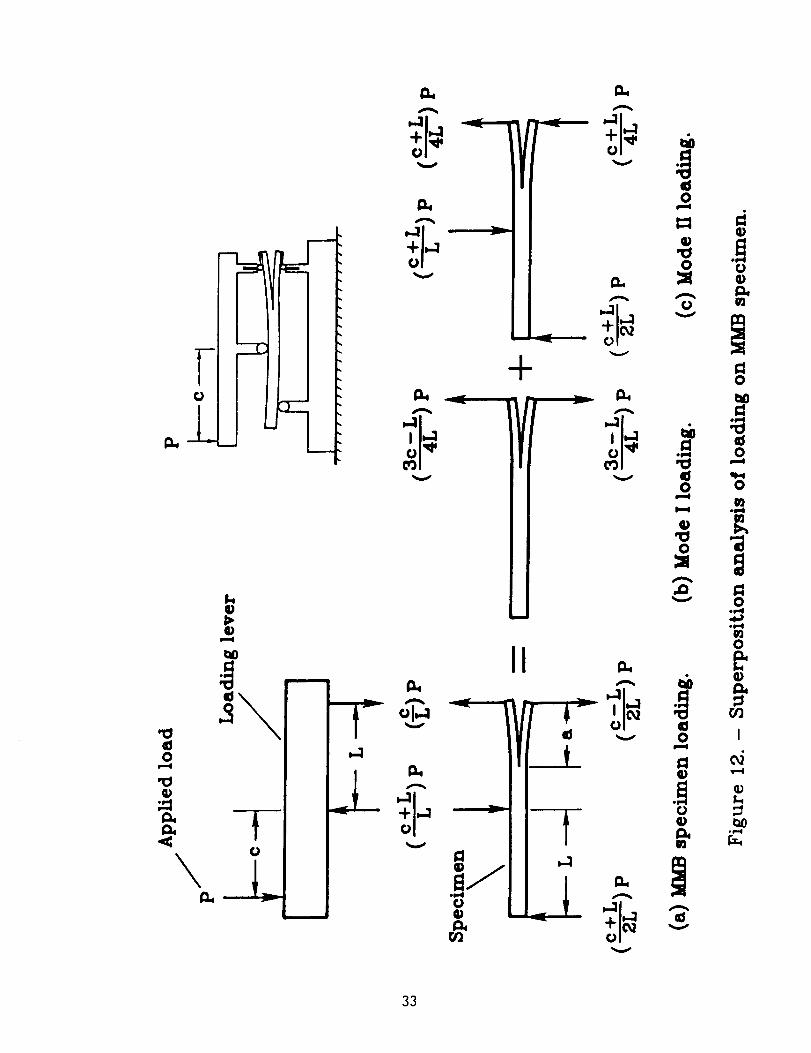
Figure 12(a) shows the MMB loading expressed in terms of the applied load
P, the loading lever length c, and the specimen half-span L. As shown in
figure 12(b), the mode I component of this loading is
.3c-L.PI - (-_--)P
Simple beam theory analysis of the DCB specimen leads to
12a2p_
C I = (I)b2h3Ell
where b is specimen width and h is half-thickness. Substituting for PI
leads to the following equation for G I of the MMB test.
3a2p 2(3c-L) 2 (2)
G I - 4b2h3L2Ell
Figure 12(c) shows the mode II portion of the MMB loading. Note that the
right end loading has been divided equally between the two equal-stiffness
Ii

arms of the specimen. This is equivalent to the conventional loading of the
ENF test. For the ENF test, the mode II bending load is
eii - ( +_-LL)p
as shown in figure 12(c). The following equation for
was presented in [2].
2 29a PII
GII - 16b2h3E11
GIIof the ENF test
(3)
Substituting for
test Is
PII' the corresponding equation for GII of the MMB
9a2p 2 2= (c+L) (4)
GII 16b2h3L2El I
By dividing equation (2) by equation (4), the GI/GII
test can be expressed as
ratio for the MMB
CI/ClI - 3[ (c+L)J c _> L3 (5)
Notice that GI/GII is only a function of load position c and half-span
length L. The GI/GII ratio is zero for c - L/3 (c - 17 mm for the
present study), and equation (5) Is invalid for smaller c values because
this model does not account for contact between the two arms of the specimen.
The total strain energy release rate for the MMB test is obtained by adding
equations (2) and (4).
3a2p2 [4(3c-L) 2+3 (c+L) 2 ] (6)G - 16b2h3L2El I
12

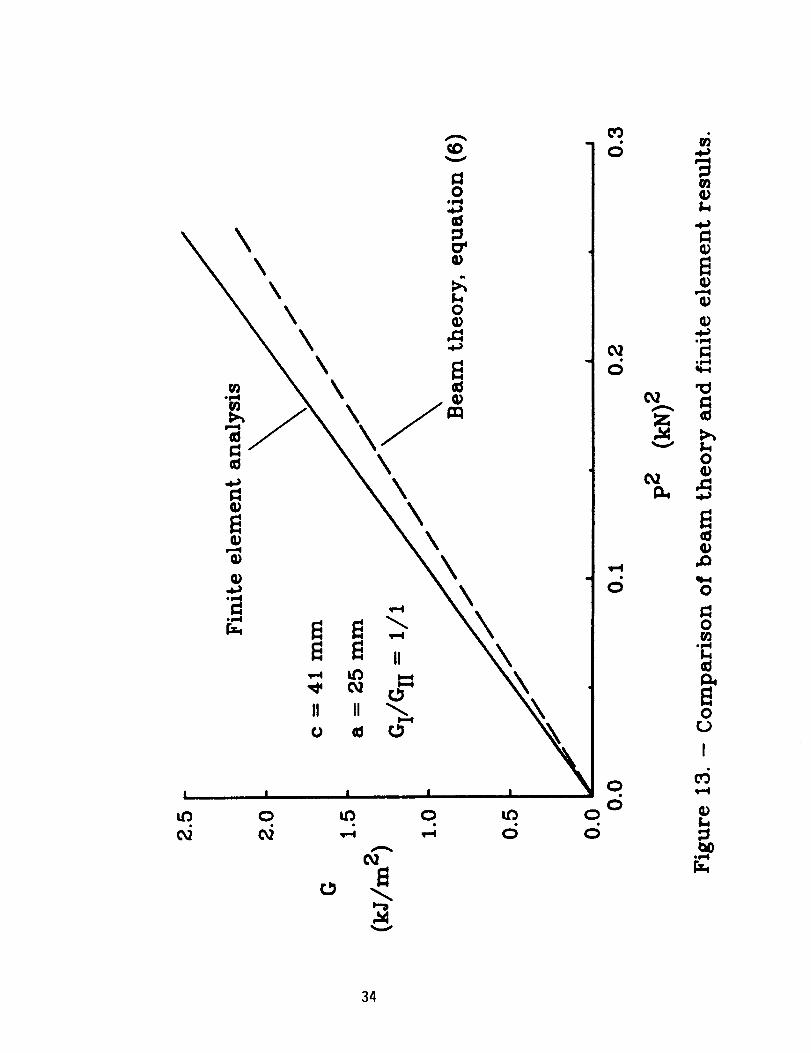
Equation (6) is compared with the finite element results in figure 13.
These results for a 25 mm delamlnation with GI/GII equal to unity show that
equation (6) underestimates G by about 15 percent. To analyze this
discrepancy, G I and GII were calculated using equations (2) and (4) and
are compared with the corresponding finite element results in figure 14. The
G I values are 18 percent low while the GII values are only 6 percent low.
This indicates that most of the error in equation (6) can be attributed to the
G I component and, therefore, to the beam theory equation for the DCB test.
Kannlnen [15] introduced an improved beam theory equation for the DCB
test. He recognized that simple beam theory did not properly model the
interaction between the two arms of the DCB specimen. The two arms are not
fixed against rotation at the delamination tip as assumed in simple beam
theory. Instead, they rotate slightly due to the elastic support that they
provide one another. To account for this, Kanninen assumed that each arm was
a beam supported by an elastic foundation. His analysis of an isotropic DCB
specimen was extended to an orthotropic DCB specimen by replacing E with
Eli and E22 (Personal communication with K. N. Shivakumar, Analytical
Services & Materials, Inc., 28 Research Drive, Hampton, VA. 23666).
12P_ 1
b2h3Ell
whereA - (3k/bh3Ell)I/4
and k - 2bE22/h
The beam theory equations for strain energy release rate can be further
improved by accounting for the shear deformation energy associated with
13

bending. Adding the shear deformation component of strain energy release rate
[16} to equation (7) leads to the following modified beam theory equation for
G in the MMB test.I
+ h2E]_l
4b2h3L2Ell
(8)
Similarly, adding the shear deformation term from [17] to equation (4) results
in a modified beam theory equation for GII in the MMB test.
0.2h2Ell "9p2(c+L)2 [a2 + ]
GII - 16b2h3L2El I GI 3(9)
Assuming the unidirectional composite specimens used in the present study are
transversely isotropic, the shear modulus GI3 in these two equations can be
replaced by GI2.
The total G values for the MMB test were recalculated using the
modified beam theory equations (8) and (9). Figure 15 compares the G
calculations for the three beam theory equations with the finite element
results. For the earlier case of GI/GII equal to unity, G calculated with
the elastic foundation correction (dash-dot curve) agreed with the finite
element values (solid curve) with an error of about 8 percent compared to the
14 percent error for the simple beam theory (dashed curve). The additional
modification for shear deformation led to the dash-double dot curve, which is
within about 6 percent of the finite element results. The corresponding
errors for the 4/1 and 1/4 cases were also only about 6 percent.
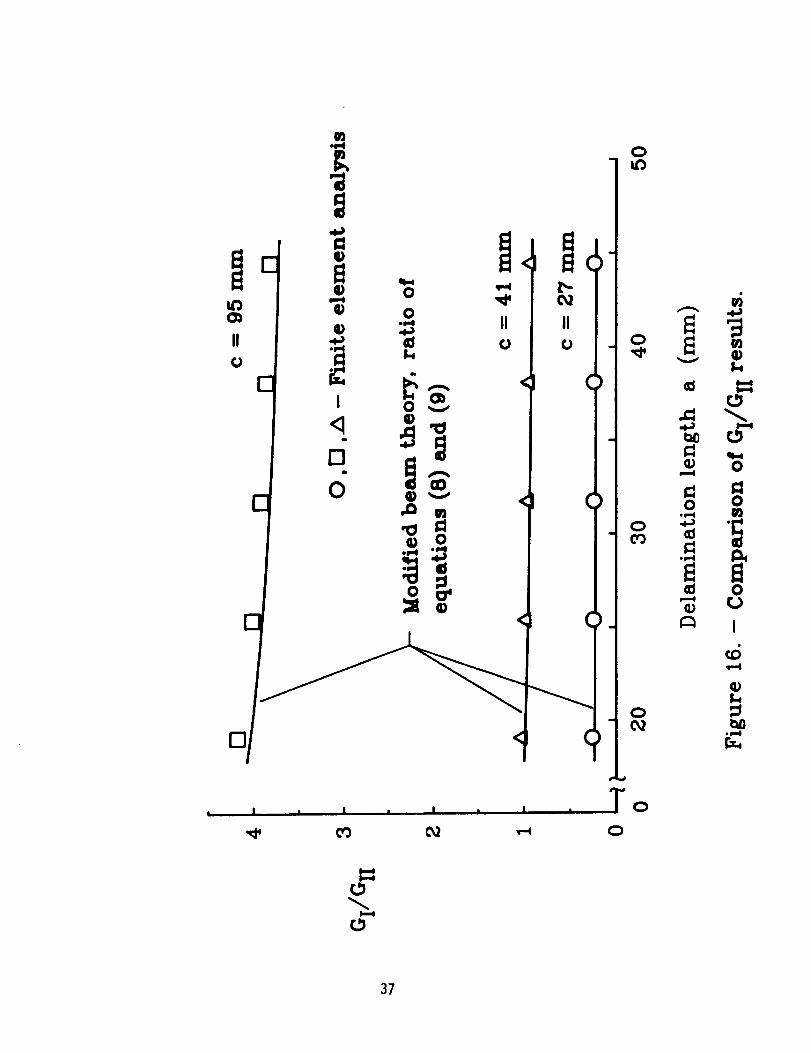
Next, equations (8) and (9) were used to recalculate the GI/GII ratios
for the three mlxed-mode test cases. Recall that the values of c for the
14

three GI/GII ratios of 4/1, i/I, and 1/4 were selected earlier using finite
element results for a 25 mmdelamination (see figure 7). The recalculated
GI/GII ratios are shownas the solid curves in figure 16 and are compared
with the discrete finite element values, shownby symbols. These curves agree
very well with the finite element values. Within the 25 mmto 45 mmrange of
delamination lengths, the modified beamtheory ratios vary by about 3, 5, and
8 percent from the finite element results for the 4/1, i/i and 1/4 cases,
respectively.
Comparedto the finite element analysis, the modified beam theory
equation (8) and (9) appear to provide acceptably accurate values of GI and
GII for the MMBtest. Before testing, equations (8) and (9) can be used to
select the loading positions that produce desired GI/GII test ratios. After
testing, measuredvalues of delamination length and the corresponding MMB
specimen loads can be substituted into these equations to calculate the modeI
and modeII delamination fracture toughness components, Gmlc and Gllc.m
TESTRESULTS
As previously mentioned, tests were conducted with 24-ply unidirectional
AS4/PEEK (APC2) specimens. These specimens were 25 mm wide and contained a
Kapton film delamination starter at one end of the specimen. The Kapton film
was 25 man wide, 35 mm long, 13 _m thick and located at the specimen mid-plane.
To produce a initial delamlnation, each specimen was precracked to about 30 mm
using the 4/1 mlxed-mode ratio. GI/GII mixed-mode ratios of 4/1, I/I, and
1/4 were produced by selecting the load positions from figure 7. Pure mode II
tests were conducted by applying the load at the specimen mid-span (c - 0).
For the pure mode I case, the loading lever was removed and an upward load was
15

applied directly through the upper hinge on the specimen. Each specimen was
loaded under displacement control at a rate of 0.5 mm/mln until the
delamination grew. The maximum load was recorded and the delamination length
was measured visually at the specimen edges. The edges had been coated with
white water soluble typewriter correction fluid to make the delamination
easier to see.
The delamination growth was usually stable, and delamination growth
increments were about 5 m_. The tests were stopped when the delaminatlon
reached 45 nun length and specimens were split apart to examine the markings
usually produced by the loading-unloading sequence. These markings provided
accurate measurements of delamination length and were used to verify the
measurements taken during testing. The recorded values for load and
delamination length were used in equations (8) and (9) to calculate G mIc and
Gllc,m respectively.
mTest results are presented in figure 17 with Gmlc plotted against Gllc.
Each symbol represents a toughness measurement corresponding to growth from
the precrack. The solid curve fitted through the data can be viewed as a
delamination failure criterion for mixed-mode loading. The curve is nearly
horizontal in the region where GI/GII > i indicating that the toughness is
nearly independent of GII and, therefore, that delamination growth was
controlled by mode I loading. In the region where GI/GII < I, the curve is
sloped indicating that both mode I and mode II loading influence the
delamination toughness. The test results are tabulated in Table i.
Table i also shows the fracture toughness data obtained during specimen
precracking. Recall that all specimens were precracked by extending the
delamination from the starter insert using a GI/GII ratio of 4/1. The average
toughness for delamination growth from the insert was only about 2 percent
16

lower than growth from the precrack with the 4/1 loading. This suggests that
the precracking was unnecessary. However, a comprehensive study of
precracking was beyond the scope of this initial demonstration of the MMB
test.
CONCLUDINGREMARKS
A mixed-modebending (MMB)delamination test procedure has been presented
for a split unidirectional laminate. The mixed-modeloading was created by
combining the modeI loading for the double cantilever beam (DCB) test with
that for the modeII end notch flexure (ENF) test. This combined loading was
produced using a loading lever, and the ratio of modeI to mode II was varied
by changing the load position on the lever. Both finite element analysis and
beamtheory analyses were conducted to determine the modeI and mode II
componentsof strain energy release rate, GI and GII , respectively. The
MMBtest procedure was demonstrated by measuring the mixed-modedelamination
fracture toughness of AS4/PEEK(APC2)unidirectional laminates.
Finite element analyses were conducted to determine the loading lever
lengths necessary to produce the desired mixed-moderatios of 4/1 i/i, and
1/4. The finite element analysis showed that these ratios varied by less than
5 percent over a 20 mmtest range of delamination lengths. Therefore, the
GI/GII ratio can be assumedto be independent of delamination length.
Beamtheory equations from the literature for double cantilever beam
(DCB) and end notch flexure (ENF) tests were used with a superposition
procedure to develop equations for the GI and GII for the MMBtest. These
equations were then modified using elastic foundation and shear deformation
analyses. The resulting modified equations for GI and GII were within
17
about six percent of the finite element results. Measured delamination
lengths and loads from the MMB tests were substituted into these equations to
determine the mode I and mode II components of delamlnation toughness during
mixed-mode delamlnation. Pure mode I and mode II tests were also conducted by
simplifying the MMB test to produce DCB and ENF loadings, respectively. This
approach provided delamination fracture toughness data over a wide range of
GI/GII ratios using identical test specimens and procedures.
The MMB test is a rather simple and direct combination of DCB and ENF
tests and seems to offer several advantages over most current mixed-mode
delamination tests. Many of the data reduction procedures that have been
developed for the DCB and ENF tests should be applicable to the MMB test
because of its similarities with these pure-mode tests. Also, DCB and ENF
studies of test parameters such as insert thickness and precracking may be
applicable to the MMB test. Therefore, it should be relatively easy to
use MMB testing beyond the initial procedures of the present study.
18

.
.
.
.
5 .
.
o
.
°
REFERENCES
Johnson, W. S.J and Mangalglri, P. D.: "Influence of the Resin on
Interlamlnar Mixed-Mode Fracture," Toughened Composites, ASTM STP 937,
Norman J. Johnston, Ed., American Society for Testing and Materials, 1987,
pp. 295-315.
Russell, A. J.: "On the Measurement of Mode II Interlaminar Fracture
Energies," DREP Materials Report 82-0, December 1982.
O'Brien, T. K.: "Mixed-Mode Strain-Energy-Release Rate Effects on Edge
Delamination of Composites," Effects of Defects in Composite Materials,
ASTM STP 836, American Society for Testing and Materials, 1984, pp. 125-
142.
Johnson, W. S.: "Stress Analysis of the Cracked-Lap-Shear Specimen: An
ASTM Round-Robin," Journal of Testing and Evaluation, JTEVA, Vol. 15, No.
6, November 1987, pp. 303-324.
O'Brien, T. K.; Raju, I. S.; and Garber, D. P.: "Residual Thermal and
Moisture Influences on the Strain Energy Release Rate Analysis of Edge
Delamination," Journal of Composites Technology & Research, Vol. 8, No. 2,
Summer 1986, pp. 37-47.
Arcan, M.; Hashin, Z.; and Voloshin, A.: "A Method to Produce Uniform
Plane-Stress States with Applications to Fiber-Reinforced Materials,"
Experimental Mechanics, April 1978, pp. 141-146.
Bradley, W. L.: and Cohen, R. N.: "Matrix Deformation and Fracture in
Graphite-Reinforced Epoxies," Delamination and Debonding of Materials,
ASTM STP 876, W. S. Johnson, Ed., American Society for Testing and
Materials, 1985, pp. 389-410.
Russell, A. J.; and Street, K. N.: "Moisture and Temperature Effects on
the Mixed-Mode Delamination Fracture of Unidirectional Graphite/Epoxy,"
Delamination and Debonding of Materials, ASTM STP 876, W. S. Johnson, Ed.,
American Society for Testing and Materials, 1985, pp. 349-370.
Crews, J. H., Jr.: Shivakumar, K. N.; and Raju, I. S.: "Factors
Influencing Elastic Stresses in Double Cantilever Beam Specimens," NASA
TM-89033, November, 1986.
i0. Hashemi, S._ Kinloch, A. J.; and Williams J. G.: "Interlaminar Fracture
of Composite Materials," 6th ICCM & 2nd ECCM Conference Proceedings, Vol.
3, July 1987, pp. 3.254-3.264.
II. MSC NASTRAN User's Manual, Version 64, The MacNeal-Schwendler Corporation,
Los Angeles, CA, November 1985.
12. O'Brien, T. K.; Murri, G. B.; and Salpekar S. A.: "Interlaminar Shear
Fracture Toughness and Fatigue Thresholds for Composite Materials," NASA
TM-89157, USAAVSCCOM TM 87-B-9, August, 1987.
19
13. O'Brien, T. K.: "Interlaminar Fracture ToughnessTesting of Composites,"ASTMSTP(to be published). Supporting data available from ASH
Headquarters, request RR D30.02.02.
14. Raju, I. S.: "Calculation of Strain-Energy Release Rates with Higher
Order and Singular Finite Elements," Engineering Fracture Mechanics, Vol.
28, No. 3, 1987, pp. 251-274.
15. Kannlnen, M. F.: "An Augmented Double Cantilever Beam Model for Studying
Crack Propagation and Arrest," International Journal of Fracture, Vol. 9,
No. I, March 1973, pp. 83-92.
16. Allyu, A. A.; and Daniel, I.M.: "Effects of Strain Rate on Delamination
Fracture Toughness of Graphlte/Epoxy," Delaminaton and Debondlng of
Materials, ASTM STP 876, W. S. Johnson, Ed., American Society for Testing
and Materials, 1985, pp. 336-348.
17. Carlsson, L. A.; Gillespie, J. W.; and Pipes, R. B.: "On the Analysis and
Design of the End Notched Flexure (ENF) Specimen for Mode II Testing,"
Journal of Composite Materials, Vol. 20, November 1986, pp. 594-604.
2O

Table I. - Delamination fracture toughness data for
AS4/PEEK (APC2).
Test
type
DCB
4/1
i/I
1/4
ENF
Specimen
number
12
28
31
46
52
17
35
37
53
23
25
26
27
28
31
32
Delamination
a
Type
P
P
P
P
P
Length (mm)
37.1
34.0
31.8
33.4
35.3
30.7
32.1
32.2
32.5
25.7
25.7
25.4
25.4
25.0
25.7
24.8
GmI¢
(kJ/m 2)
1.63
i. 24
i .08
0.88
1.31
1.25
0,99
I.ii
1.50
1.13
0.96
1.14
1.15
1.31
I. 14
1.07
C' lc
(kJ/m 2)
0.00
0.00
0.00
0.00
0.00
0
0
0
0
.33
.26
.29
.39
34
35
36
37
38
26
25
24
22
21
.8
.9
.6
.6
.4
1.21
1.13
1.29
1.24
1.30
45
46
52
53
16
27
34
36
18
25
26
32
45
14
22
23
38
P
P
P
P
P
P
P
P
P
25.4
25.4
25.4
25.4
33.7
32.0
31.8
36.8
33.3
32.9
38.1
30.9
38.5
38.9
33.3
32.5
33,4
1.17
I.ii
1.42
1.29
1.18
i .47
1.33
1.33
0.55
O. 44
0.54
0.52
0.46
0.00
0.00
0.00
0.00
0.29
0,25
0.29
0.30
0.34
0.29
0.27
0.31
0.29
0.33
0.31
0.33
0.30
0.29
0.36
0.33
1.27
1.57
i .42
i .44
2.49
1.98
2.44
2.34
2.09
2.382.88
2.38
2.50
a -- P - Growth from 4/1 precrack; I - Growth from delamination insert.
Z]
E_
_D
v
22
Q_
oln_
c_G_
_s_0
olm_
23

(a) Test specimen and loading.
P
Specimen\
c
-I /Loading lever
Hinge
/
Apparatus base
(b) Schematic diagram of apparatus.
Figure 3. - Mixed-mode bending specimen and test apparatus.
24
ORIGINAL PAGE 15
OF POOR QUALITY
q,-iO
,¢:1
O
O,el13.,
I
25
26
o
o
I
oF,4
27

I
It)
i • i • J • J i
001-1
o "_4.1
OO
c_ Io .I:1
© °_ "i4.a
w ;.40 0
,_ I::10 e 0op,,I
*p,410O
0
z-:
°p,4
0
28
d
I.==,I
I , I
C_
0
r_r_
v
C_0
0
I
d
o ._
29
II U H
(
! ! ! I
0 0 Q 0 0 QQ 0 0 0 0
,o E!r_
r3v
¢I
o= =
00
°e=l
3O

| , !
0
_ 0F,,I
Et
V
31

LL_
II
°10O
L_
II ' II
I
I-1
17
"-1 I
C)
I I i I
"" 't ( )
. i, (,)
!
I
I
i
0
0
,.el I._ ,_l
• 0
_ _ o*F,,I
!-0
I
op,4
O
r_
32
V
33
v
i \\\
II
II II
I ! I I I
A
q0 o
c_
o
0
o
vo
0
0
°a,._
0_)
I
34

q _. o. _. o.o
35

C_
E_
36
/ /o _ l i
1 1 i
I . I . I i I
f _
0
0
37

V
38

Report Documentation Page
1 R_port No.
NASA TM-1006624 Title and Subtitle
2, Government Accession No.
A MIXED-MODE BENDING APPARATUS FOR DELAMINATION TESTING
7 Author(s)
John H. Crews, Jr. and James R. Reeder
9. Pedormmg Organization Name and Address
National Aeronautics and Space AdministrationLangley Research Center
Hampton, VA 23665-5225
I 12 Sponsoring Agency Name and Address
t National Aeronautics and Space AdministrationWashington, DC 20546
3 Recipient's Catalog No.
5. Report Date
August 1988
6 Performing Organization Code
8. Performing Organization Report No.
10. Work Unit No,
505-63-01-05
11. Contract or Grant No.
13. Type of Report and Period Covered
Technical Memorandum
15 Supplementary Notes
14. Sponsoring _,gency Code
/
......... %,__
16 Abstract
A mixed-mode delamination test procedure was developed combining double cantilever
beam (DCB) mode I loading and end notch flexure (ENF) mode It loading on a split
_nidirectional laminate. By loading the specimen with a lever, a single applied
load simultaneously produces mode I and mode It bending loads on the specimen. This
_ixed-mode bending (MMB) test was analyzed using both finite element procedures and
beam theory to calculate the mode I and mode It components of strain energy release
rate, GI and GII, respectively. The analyses showed that a wide range of GI/GII
ratios could be preduced by varying the applied load position on the loading lever.
A_ the delamination extended, the GI/GII ratios varied by less than five percent.
The simple beam theory equations were modified to account for the elastic interac-
tion between the two arms of the specimen and to account for shear deformations.
The resulting equations agreed closely with the finite element results and provide a
basis for selection of GI/GII test ratios and a basis for computing the mode I and
mode It components of measured delamination toughness. The MMB specimen analysis
and test procedures were demonstrated using AS4/PEEK (APC2) unidirectional laminates
17 Key Words (Suggested by Author(s))
Stress Composites
Analysis
Strain energy release ratesMixed-mode delamination
._To_ughness testing19 Security Cla_if. (of thts report)
Unclassified
NASA FORM 1626 oc_ _6
18. Distribut_n Statement
Unclassified - Unlimited
Subject Category - 24
20, SecuriW Cle_if. (of this page)
Unclassified
No, of pages 22. Price
A03