NASA Data lesson, Investigating Factors that Influence...
14
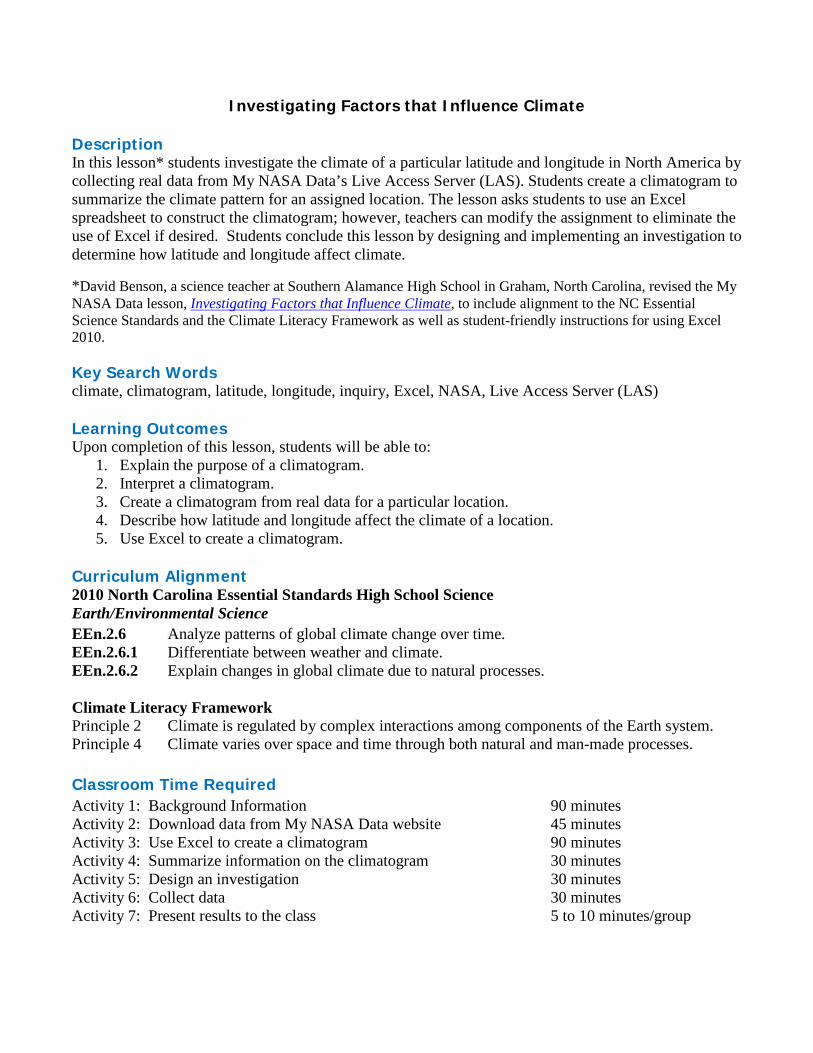
Investigating Factors that Influence Climate Description In this lesson* students investigate the climate of a particular latitude and longitude in North America by collecting real data from My NASA Data’s Live Access Server (LAS). Students create a climatogram to summarize the climate pattern for an assigned location. The lesson asks students to use an Excel spreadsheet to construct the climatogram; however, teachers can modify the assignment to eliminate the use of Excel if desired. Students conclude this lesson by designing and implementing an investigation to determine how latitude and longitude affect climate. *David Benson, a science teacher at Southern Alamance High School in Graham, North Carolina, revised the My NASA Data lesson, Investigating Factors that Influence Climate, to include alignment to the NC Essential Science Standards and the Climate Literacy Framework as well as student-friendly instructions for using Excel 2010. Key Search Words climate, climatogram, latitude, longitude, inquiry, Excel, NASA, Live Access Server (LAS) Learning Outcomes Upon completion of this lesson, students will be able to: 1. Explain the purpose of a climatogram. 2. Interpret a climatogram. 3. Create a climatogram from real data for a particular location. 4. Describe how latitude and longitude affect the climate of a location. 5. Use Excel to create a climatogram. Curriculum Alignment 2010 North Carolina Essential Standards High School Science Earth/Environmental Science EEn.2.6 Analyze patterns of global climate change over time. EEn.2.6.1 Differentiate between weather and climate. EEn.2.6.2 Explain changes in global climate due to natural processes. Climate Literacy Framework Principle 2 Climate is regulated by complex interactions among components of the Earth system. Principle 4 Climate varies over space and time through both natural and man-made processes. Classroom Time Required Activity 1: Background Information 90 minutes Activity 2: Download data from My NASA Data website 45 minutes Activity 3: Use Excel to create a climatogram 90 minutes Activity 4: Summarize information on the climatogram 30 minutes Activity 5: Design an investigation 30 minutes Activity 6: Collect data 30 minutes Activity 7: Present results to the class 5 to 10 minutes/group
Transcript of NASA Data lesson, Investigating Factors that Influence...
Investigating Factors that Influence Climate
Description In this lesson* students investigate the climate of a particular latitude and longitude in North America by collecting real data from My NASA Data’s Live Access Server (LAS). Students create a climatogram to summarize the climate pattern for an assigned location. The lesson asks students to use an Excel spreadsheet to construct the climatogram; however, teachers can modify the assignment to eliminate the use of Excel if desired. Students conclude this lesson by designing and implementing an investigation to determine how latitude and longitude affect climate.
*David Benson, a science teacher at Southern Alamance High School in Graham, North Carolina, revised the My NASA Data lesson, Investigating Factors that Influence Climate, to include alignment to the NC Essential Science Standards and the Climate Literacy Framework as well as student-friendly instructions for using Excel 2010. Key Search Words climate, climatogram, latitude, longitude, inquiry, Excel, NASA, Live Access Server (LAS) Learning Outcomes Upon completion of this lesson, students will be able to:
1. Explain the purpose of a climatogram. 2. Interpret a climatogram. 3. Create a climatogram from real data for a particular location. 4. Describe how latitude and longitude affect the climate of a location. 5. Use Excel to create a climatogram.
Curriculum Alignment 2010 North Carolina Essential Standards High School Science Earth/Environmental Science EEn.2.6 Analyze patterns of global climate change over time. EEn.2.6.1 Differentiate between weather and climate. EEn.2.6.2 Explain changes in global climate due to natural processes. Climate Literacy Framework Principle 2 Climate is regulated by complex interactions among components of the Earth system. Principle 4 Climate varies over space and time through both natural and man-made processes. Classroom Time Required Activity 1: Background Information 90 minutes Activity 2: Download data from My NASA Data website 45 minutes Activity 3: Use Excel to create a climatogram 90 minutes Activity 4: Summarize information on the climatogram 30 minutes Activity 5: Design an investigation 30 minutes Activity 6: Collect data 30 minutes Activity 7: Present results to the class 5 to 10 minutes/group
Overview of Lesson Components Activity 1: Background Information Invite students to use the My NASA Data website to answer the following questions:
1. What is the difference between climate and weather? 2. Define the following: average temperature, temperature range, and precipitation. 3. List at least three possible forms of precipitation. 4. What information can be found on a climatogram? 5. Sketch an example of a climatogram. 6. What variables are plotted on each axis of a climatogram? 7. Why are there two y (vertical) axes in a climatogram? 8. What information do you need in order to make our own climatogram? 9. Use words to describe the climate illustrated by your climatogram example.
Activity 2: Download data from My NASA Data website Students will be assigned a specific latitude and longitude to research. The latitudes and longitudes for the class will be in a grid covering the majority of North America. The exact number of locations can be adjusted based on the size of the class. For their assigned location, students will download temperature data and precipitation data. Activity 3: Use Excel to create a climatogram Students will import downloaded data into an Excel spreadsheet, and use Excel* to:
1. Average the precipitation and temperature data by month. 2. Construct a climatogram from the average data. 3. Properly format the graph.
*NOTE: These instructions are for Excel 2010. If students have a different version, the teacher will need to modify the instructions. As an alternate activity, students could manually calculate monthly averages, and then manually graph the data. Teachers would need to provide alternative instructions on creating the graphs. Care should be taken so that all graphs are plotted on the same scales so results can be compared. Activity 4: Summarize information on the climatogram Students will summarize the climate represented by their climatogram in writing and will calculate the following information from their climatogram:
a. Maximum and minimum temperature b. Temperature range c. Average temperature for the year d. Maximum and minimum precipitation e. Average precipitation for the year
Activity 5: Design an investigation Students will work in groups to design an investigation into the effects of latitude or longitude on climate. Teachers can give more direction to groups to ensure that all factors affecting climate are investigated. Activity 6: Collect data Students will use the climatograms that the entire class created to collect data. They will determine whether their hypothesis from Activity #4 is supported by these data. Activity 7: Present results to the class Each group will present a brief summary of their hypothesis, data, and conclusions.

Materials Needed • Computer with Internet access, one per student • Access to Microsoft Excel or alternate spreadsheet program • Copies of student instructions, Investigating Factors that Influence Climate, one per student • [optional] Smart board or LCD Projector for presentations
Student Preparation for Activity 1. Students should be familiar with the following vocabulary prior to beginning this lesson:
• Celsius • Climate • Kelvin • Latitude • Longitude • Precipitation • Temperature • Weather
2. Familiarity with Excel is helpful, but not required.
Procedure Activity 1: Background Information 1. Provide each student with a computer with Internet access. 2. Give each student a copy of the student instructions, Investigating Factors that Influence Climate. 3. Inform students that they will use the My NASA Data website to conduct this activity. 4. Have the students hold onto their work. They will turn in everything at the end of Activity 7.
Activity 2: Download data from My NASA Data website 1. Assign each student a latitude and longitude for a North American location.
1.1. A wall map can be used to determine the locations. 1.2. Locations should be spaced 10º apart in both latitude and longitude. 1.3. There are about 30 possible locations in North America that can be used. 1.4. Depending on the size of the class, more than one student may be assigned to a given location. 1.5. The teacher can either assign locations, allow students to select locations, or assign them
randomly. 2. Assist students with using My NASA Data’s Live Access Server (LAS) to download temperature
and precipitation data for their location. 3. Assist students as they follow the step-by-step instructions on their instruction sheet for downloading
the datasets. 4. Allow students to assist each other in following the steps, however, each student will be responsible
for downloading their own dataset, and creating their own climatogram.
Activity 3: Use EXCEL to create a climatogram 1. Students will use Excel spreadsheets to make a climatogram of their data. 2. If using a version of Excel other than Excel 2010, you may need to modify the instructions. 3. Students who are not familiar with Excel may need more assistance to complete this activity. 4. When the climatograms are complete, have students print them so they can be posted.
Activity 4: Summarize information on the climatogram 1. Students will make a table on their climatogram to summarize the climate of their assigned location.
Activity 5: Design an investigation 1. Make a grid in the classroom for students to post their completed climatograms. The latitudes and
longitudes need to be marked on the grid. 2. Have students post their climatograms in the proper location on the grid. 3. Students need to work in groups for Activities #5 – 7. 4. Groups can consist of two to four students depending on the size of the class and level of the
students, etc. 5. Ask students to work within their group to create a question based on these climatogram data.
5.1. The independent variable must be latitude or longitude. 5.2. The dependent variable will be the data that was collected. 5.3. For example: “How does a change in latitude affect the maximum temperature of a location?”
6. Next, instruct students to create a hypothesis based on their question. 6.1. For example: “As longitude increases, the maximum temperature will decrease.”
7. Review each hypothesis as the groups bring them to you. 7.1. You could make suggestions to some groups so that a variety of questions are asked by the class.
Activity 6: Collect data 1. Groups will use the posted climatograms to collect data to test their hypothesis. 2. They will use data across a particular latitude, or up and down a particular longitude, depending on
their hypothesis. 3. Ask groups to use at least three different latitudes or longitudes in their analysis. 4. Data should be recorded into a table. 5. Each group will be asked to create a graph to summarize their results. 6. Groups may need assistance writing a conclusion. 7. Care should be taken to point out that this data will not “prove” or “disprove” the hypothesis. The
conclusion should be stated as “supporting the hypothesis” or “not supporting the hypothesis”.
Activity 7: Present results to the class 1. Groups will present a short summary of their results. 2. A SmartBoard, or projector could be used, if available. 3. All members of the group should have a role in the presentation. 4. The presentations should clearly state their question, hypothesis, data collected, and conclusion.
Differentiation The teacher may assign groups so that students who struggle with following detailed instructions can be assisted by their peers. Students may be permitted to assist each other with following the steps, but each student is still responsible for producing their own climatogram.

Evaluation/Assessment A suggested grading rubric is included below:
Component Description Value
Activity 1 All questions answered. 10%
Activity 2 and 3 Data correctly imported into Excel, climatogram constructed correctly. 40%
Activity 4 Summary of climatogram (in table format) is provided and is accurate. 10%
Activity 5 Hypothesis is clearly stated and able to be tested based on available data. 10%
Activity 6 Adequate analysis of data to support or refute hypothesis. 20%
Activity 7 Presentation clearly states the hypothesis, summarizes the data collected, and states conclusions with explanations. Students answer questions posed by the teacher and classmates.
10%

Investigating Factors that Influence Climate Student Instructions
Student Name ______________ _ Date _______________
My group members: _____________________________ _
Assigned latitude _________ _; longitude ___________
Purpose: In this project, you will work in small groups to investigate how latitude and longitude affect the climate of an area. You will use the website “My NASA Data” to collect data and research vocabulary terms. You will construct a climatogram for your location. Then, you will examine all of the climatograms to make an investigation and collect data. Finally, you will present your results to the class.
Activity 1: Background Information This activity will provide you with background information that you will need to construct a climatogram of your assigned location.
A. Visit the link below: http://mynasadata.larc.nasa.gov/lesson-plans/climate-change-lessons/?page_id=615?&passid=76
B. Follow the step-by-step instructions listed below, instead of the instructions on the website. The links on the website may be accessed for reference.
C. Use the My NASA Data (MND) glossary as a reference to answer the following questions on a separate sheet of paper:
1. What is the difference between climate and weather? 2. Define the following: average temperature, temperature range, and precipitation. 3. List at least three possible forms of precipitation. 4. What information can be found on a climatogram? 5. Sketch an example of a climatogram. 6. What variables are plotted on each axis of a climatogram? 7. Why are there two y (vertical) axes in a climatogram? 8. What information do you need in order to make our own climatogram? 9. Use words to describe the climate illustrated by your sample climatogram.
Activity 2: Download data from NASA’s Live Access Server (LAS) A. Import precipitation data.
1. Open the link above for the My NASA Data website. 2. Your teacher will assign a latitude and longitude to you. Record your latitude and
longitude at the top of this page. 3. Open the Intermediate Edition of the Live Access Server (LAS) from the lesson link on
the MND website. 4. Click “Choose dataset” on the top left of the page. 5. Click the “Water” link. 6. Choose “Monthly Precipitation”. 7. Under Line Plots, choose “Time Series”.

8. Directly below the map on the left side of the page, enter your latitude and longitude. Make sure the same latitude is shown in the top and bottom boxes. Make sure the same longitude is shown in the left and right boxes.
9. Change the Date Range to Jan 1995 to Dec 2006. 10. Click on “Update Plot” at the top of the page. 11. After a moment, the screen should show a graph of your data. 12. At the top of the page, choose “Save As”. 13. When the new window appears, change “Select Format” to ASCII. 14. Click OK. 15. A new window will appear with the dataset. 16. From the File menu, select “save page as”. 17. Change the file name to “precip data”. 18. Save the text file to a location on your computer where you will be able to find it 19. Save the dataset 20. Close both windows that opened (with the data list, and the Download Data page).
B. Import temperature data.
1. Go back to the LAS. 2. Click “Choose dataset” on the top left of the page. 3. Click the “Land” link. 4. Choose “Monthly Surface Clear Sky Temperature (ISCCP)”. 5. Under Line Plots, choose “Time Series”. 6. Directly below the map on the left side of the page, enter your latitude and longitude.
Make sure the same latitude is shown in the top and bottom boxes. Make sure the same longitude is shown in the left and right boxes.
7. Change the Date Range to Jan 1995 to Dec 2006. 8. Click on “Update Plot” at the top of the page. 9. After a moment, the screen should show a graph of your data. 10. At the top of the page, choose “Save As”. 11. When the new window appears, change “Select Format” to ASCII. 12. Click OK. 13. A new window will appear with the dataset. 14. From the File menu select “save page as”. 15. Change the file name to “temp data”. 16. Change to location to the same place you saved the precipitation data. 17. Save the dataset. 18. Close both windows that opened (with the data list, and the Download Data page).
Activity 3: Construct the Climatogram in Excel A. Import the precip and temp data files that you saved from Activity 2.
1. Open Excel. 2. NOTE: Remember to Save your work as you go. 3. Click on the Data tab at the top. 4. Choose “Get External Data”, and then “From Text”. 5. Find your precipitation data file 6. When the Text Import Wizard opens, click Finish. 7. When the Import Data window opens, click OK.

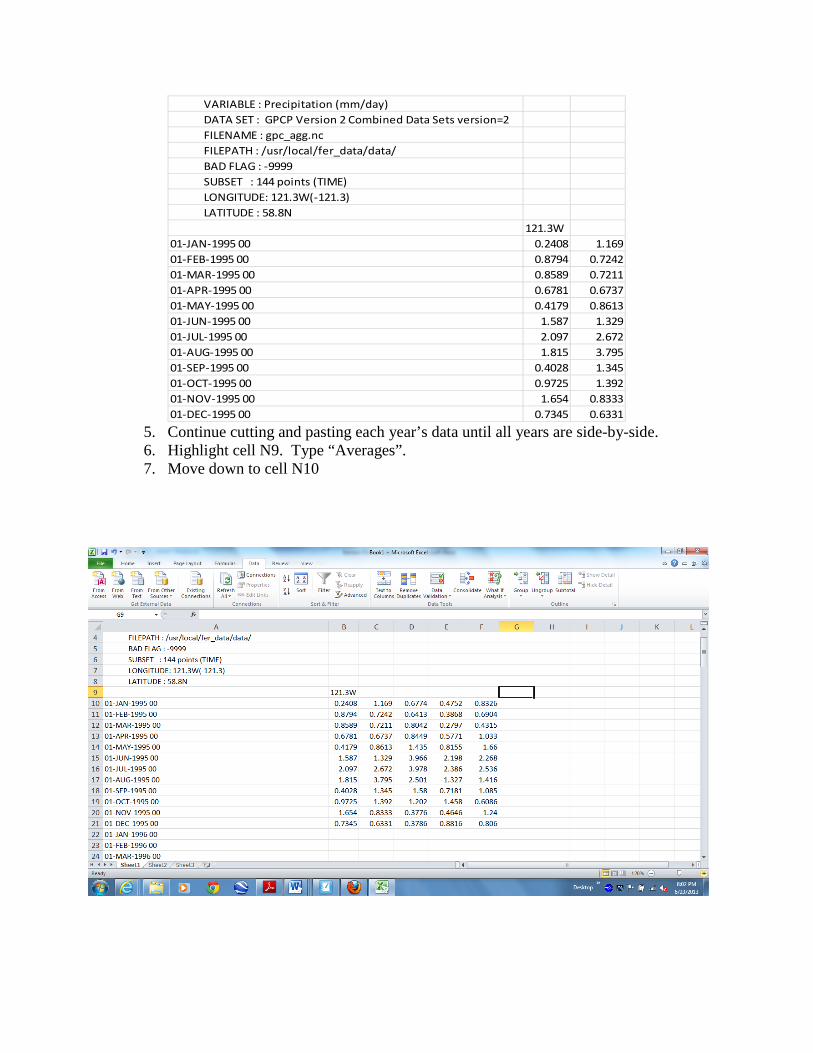
8. You should see Precipitation in cell A1. You will have months and years in column A, and precipitation amounts in column B. (See below) VARIABLE : Precipitation (mm/day) DATA SET : GPCP Version 2 Combined Data Sets version=2 FILENAME : gpc_agg.nc FILEPATH : /usr/local/fer_data/data/ BAD FLAG : -9999 SUBSET : 144 points (TIME) LONGITUDE: 121.3W(-121.3) LATITUDE : 58.8N 121.3W 01-JAN-1995 00 0.240801-FEB-1995 00 0.879401-MAR-1995 00 0.858901-APR-1995 00 0.678101-MAY-1995 00 0.417901-JUN-1995 00 1.58701-JUL-1995 00 2.09701-AUG-1995 00 1.81501-SEP-1995 00 0.402801-OCT-1995 00 0.972501-NOV-1995 00 1.65401-DEC-1995 00 0.7345
9. At the bottom of the Excel worksheet, select Sheet2. 10. Choose “Get External Data”, then “From Text”. 11. Find your temperature data. 12. When the Text Import Wizard opens, click Finish. 13. When the Import Data window opens, click OK. 14. You should see Temperature in cell A1. You will have months and years in column A,
and temperatures in column B. 15. At the bottom of worksheet, select the tab labeled “Sheet1”. 16. Rename the tab “Precip”.
B. Average the precipitation data by month. You will need to cut and paste the precipitation values so
that all the data are organized by month: 1. Select the precipitation value next to Jan 1996 (cell B22). Hold down the Shift key, and
use the down arrow to select 12 months (Jan through Dec). 2. Press [ctrl] +X to cut the selected values. 3. Select the empty cell to the right of the first precipitation value (cell C10). 4. Press [ctrl] +V to paste the cut values. See below for an example.
VARIABLE : Precipitation (mm/day) DATA SET : GPCP Version 2 Combined Data Sets version=2 FILENAME : gpc_agg.nc FILEPATH : /usr/local/fer_data/data/ BAD FLAG : -9999 SUBSET : 144 points (TIME) LONGITUDE: 121.3W(-121.3) LATITUDE : 58.8N 121.3W 01-JAN-1995 00 0.2408 1.16901-FEB-1995 00 0.8794 0.724201-MAR-1995 00 0.8589 0.721101-APR-1995 00 0.6781 0.673701-MAY-1995 00 0.4179 0.861301-JUN-1995 00 1.587 1.32901-JUL-1995 00 2.097 2.67201-AUG-1995 00 1.815 3.79501-SEP-1995 00 0.4028 1.34501-OCT-1995 00 0.9725 1.39201-NOV-1995 00 1.654 0.833301-DEC-1995 00 0.7345 0.6331
5. Continue cutting and pasting each year’s data until all years are side-by-side. 6. Highlight cell N9. Type “Averages”. 7. Move down to cell N10
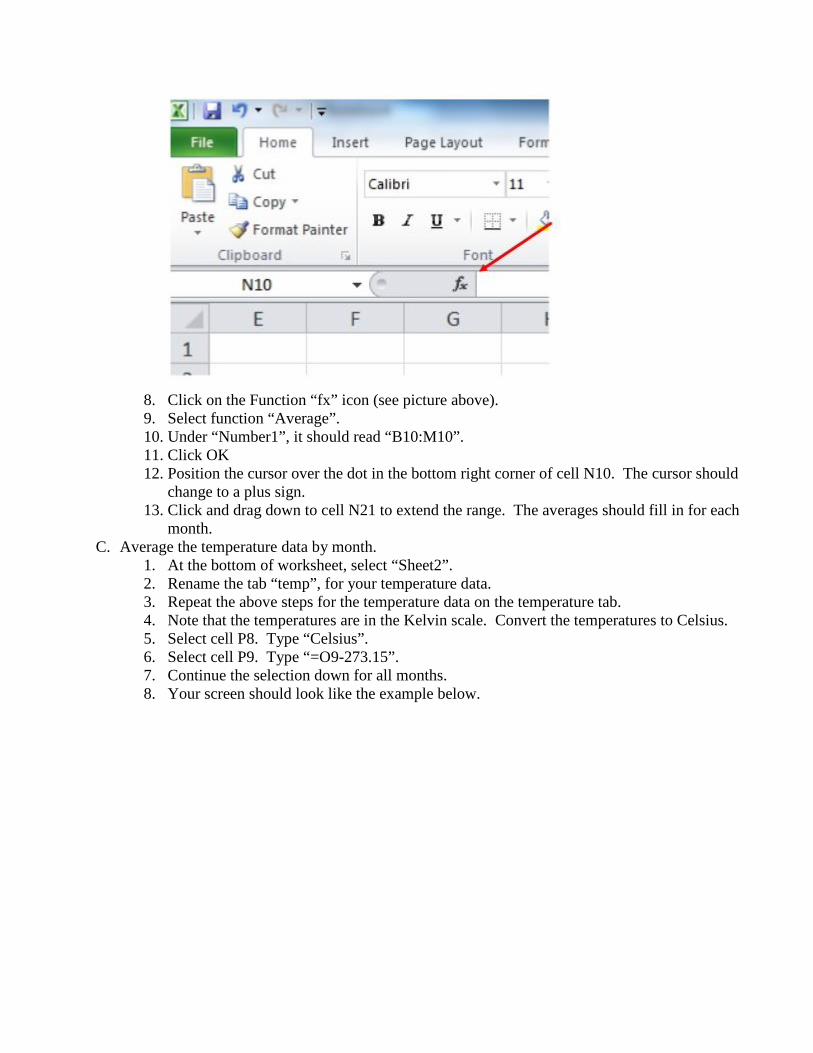
8. Click on the Function “fx” icon (see picture above). 9. Select function “Average”. 10. Under “Number1”, it should read “B10:M10”. 11. Click OK 12. Position the cursor over the dot in the bottom right corner of cell N10. The cursor should
change to a plus sign. 13. Click and drag down to cell N21 to extend the range. The averages should fill in for each
month. C. Average the temperature data by month.
1. At the bottom of worksheet, select “Sheet2”. 2. Rename the tab “temp”, for your temperature data. 3. Repeat the above steps for the temperature data on the temperature tab. 4. Note that the temperatures are in the Kelvin scale. Convert the temperatures to Celsius. 5. Select cell P8. Type “Celsius”. 6. Select cell P9. Type “=O9-273.15”. 7. Continue the selection down for all months. 8. Your screen should look like the example below.

D. Copy all the averages to a third worksheet.
1. Select “Sheet3”. Rename it “Monthly”. 2. Select cell A1. Type “Months”. 3. Type the three letter abbreviations of the months in the column below. For example,
“Jan, “Feb”, Mar”, etc. 4. Select cell B1. Type “Precip”. 5. Select cell C1. Type “Temp”. 6. Go to the “Precip” tab. Select cells N10:N21. Use Ctrl + C to copy the data. 7. Go to the “Monthly” tab. Select cell B2. Choose Paste Special. Copy the Values only.
E. Construct the Climatogram.
1. Highlight all the data on the Monthly tab. 2. Click on Insert, Column, and then choose the first option, 2-D column. 3. A climatogram should appear. 4. Right-click on the chart. On the menu that appears, choose Move Chart. Select New
Sheet. Type “Climatogram”.
F. Format the Climatogram. 1. Under Chart Tools, select the Layout tab. 2. On the left, under the File tab, is a drop-down box. Choose “series Temp” from the box. 3. On the Design tab, choose Change Chart Type. Choose the fourth type beside Line. This
will create a line chart with data points shown. 4. Click on Format Selection. Then choose Plot Series on Secondary Axis. 5. On the Layout tab, choose Chart Title. Choose Above Chart. Highlight the title, and
then change it to your latitude and longitude. 6. Select Axis Titles, Primary Horizontal Axis Title, then Below Axis. Rename this
“Months”. 7. Select Axis Titles, Primary Vertical Axis, then Rotated Title. Rename this “Precipitation
(mm/day)”. 8. Select Axis Titles, Secondary Axis, then Rotated Title. Rename this “Temperature (C)”. 9. Choose Vertical (Value) Axis, then Format Selection. Set the Minimum Value to Fixed
at 0. Set the Maximum Value to Fixed at 5. 10. Choose Secondary Vertical (Value) Axis, then Format Selection. Set the Minimum
Value to Fixed at -10. Set the Maximum Value to Fixed at 90. 11. See example of completed climatogram.
Activity 4: Summarize the Climatogram A. Make a table on the side of your climatogram that looks like this:
Maximum Temperature Minimum Temperature Temperature Range Average Yearly Temperature
Average Yearly Precipitation
B. Observe your climatogram and record the information below on your table. Be sure to include proper units on all calculations.
C. Find the temperature range: 1. Find the month with the highest average temperature. 2. Record it as Maximum Temperature. 3. Find the month with the lowest average temperature. 4. Record it as Minimum Temperature. 5. Subtract the minimum from the maximum to get the temperature range. 6. Record the difference as Temperature Range.
D. Find the average yearly temperature for your location. 1. Use the Excel spreadsheet, or a calculator, to calculate the average yearly temperature for
your region. 2. Record this as Average Yearly Temperature.
E. Find the average yearly precipitation for your location. 1. Use the Excel spreadsheet, or a calculator, to calculate the average yearly precipitation
for your region.
2. Record this as Average Yearly Precipitation. F. Summarize the climate of your location in writing.
1. Underneath your data table on your climatogram, write one or two complete sentences that describe the temperature and precipitation of your location.
2. Use descriptions like “hot summers”, “cold winters”, “little change in temperature throughout the seasons”, “wet summers”, “dry all year”, etc.
Activity 5: Design an investigation A. Tape your completed climatogram with accompanying data table in the proper location on the
grid that your teacher has laid out. B. Once all the climatograms are posted, look at the entire grid. Look for patterns. C. In your group, determine one question that could be answered by looking these climatogram
data. 1. The question must use latitude or longitude as the independent variable. 2. The dependent variable could be any data that was collected.
D. State your question in the form of a hypothesis (therefore it will include a predicted answer). E. Take your question and hypothesis to your teacher for approval prior to conducting Activity 6.
Activity 6: Collect data to investigate hypothesis A. Once your question and hypothesis are approved, you need to collect data to support or reject
your hypothesis. B. Use the climatogram data for a particular latitude or longitude (depending on your hypothesis). C. Record the data in a table. D. Repeat the data collection and recording for at least two other latitudes or longitudes. E. Summarize your data into a graph. F. Determine whether these data support your hypothesis or not. G. Write a conclusion based on the data collected. H. Neatly write up the question, hypothesis, data, graph, and conclusions to turn in.
Activity 7: Present the results to the class A. Present a short (5 – 10 minute) summary of your findings to the class. B. Clearly state the question and hypothesis that guided your investigation. C. Summarize the data that you collected. D. State your conclusion. Did the data support your hypothesis? Why or why not?
Resources
Original lesson, Investigating Factors that Influence Climate, My NASA Data http://mynasadata.larc.nasa.gov/lesson-plans/climate-change-lessons/?page_id=474?&passid=76
-10
40
90
0
2
4
Jan Mar May Jul Sep Nov
Tem
pera
ture
(C)
Prec
ipita
tion
(mm
/day
)
Months
50N 120W
Precip
Temp
Activity #1 Questions KEY
1. What is the difference between climate and weather? Weather describes the immediate condition of the atmosphere. Climate describes long-term patterns of weather for a given location.
2. Describe what an average temperature, temperature range, and precipitation are.
Average temperature refers to the daily temperature of a location averaged over at least 25 years. Temperature range describes the difference between the highest average monthly temperature and the lowest average monthly temperature. Precipitation is a measurement of the average total precipitation by month for that location.
3. List at least three possible forms of precipitation.
Possible answers include: rain, sleet, hail, snow, freezing rain. 4. What information can be found on a climatogram?
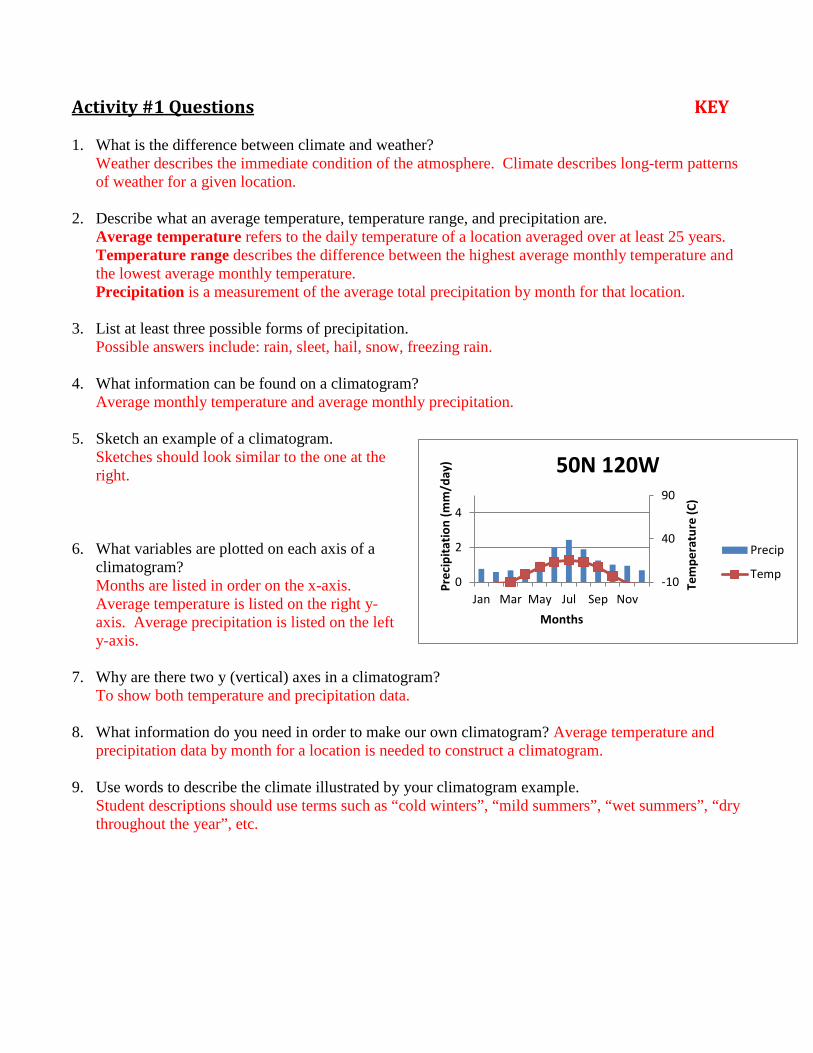
Average monthly temperature and average monthly precipitation. 5. Sketch an example of a climatogram.
Sketches should look similar to the one at the right.
6. What variables are plotted on each axis of a
climatogram? Months are listed in order on the x-axis. Average temperature is listed on the right y-axis. Average precipitation is listed on the left y-axis.
7. Why are there two y (vertical) axes in a climatogram? To show both temperature and precipitation data.
8. What information do you need in order to make our own climatogram? Average temperature and precipitation data by month for a location is needed to construct a climatogram.
9. Use words to describe the climate illustrated by your climatogram example. Student descriptions should use terms such as “cold winters”, “mild summers”, “wet summers”, “dry throughout the year”, etc.