NAS and operating performance FINAL - University of … · [email protected] W....
60
1 Non-Audit Services and Improvements in Clients’ Operating Performance and Risk Management William A. Ciconte III University of Florida [email protected] W. Robert Knechel ‡ University of Florida [email protected] Michael A. Mayberry University of Florida [email protected] August 2014 _____________________________________________________________________________________ ‡ Corresponding author: P.O. Box 117166, 325 Gerson Hall, Gainesville, FL 32611-7166. The authors appreciate the helpful comments of Matthew Ege, Devin Williams, Ying Zhou, and participants of the 2013 EARNet Symposium Ph.D. round table.
Transcript of NAS and operating performance FINAL - University of … · [email protected] W....

1
Non-Audit Services and Improvements in Clients’ Operating Performance and Risk
Management
William A. Ciconte III University of Florida
W. Robert Knechel‡ University of Florida
Michael A. Mayberry University of Florida
August 2014 _____________________________________________________________________________________ ‡Corresponding author: P.O. Box 117166, 325 Gerson Hall, Gainesville, FL 32611-7166. The authors appreciate the helpful comments of Matthew Ege, Devin Williams, Ying Zhou, and participants of the 2013 EARNet Symposium Ph.D. round table.
2
Non-Audit Services and Improvements in Clients’ Operating Performance and Risk
Management
Abstract
We examine whether, and when, non-audit services (NAS) purchased jointly with the audit
provide economic value to clients through improvements in operating performance and risk
management. Our investigation is important as it contributes to the ongoing debate between
critics and proponents of the joint provision of auditing and NAS. Using DuPont analysis, we
find NAS are positively related to subsequent increases in operating performance, consistent
with NAS providing access to human capital and other organizational resources. We further find
that NAS are negatively related to future operating risk, indicating that NAS enhance client
firms’ risk management. We find no evidence of NAS that are related to improvements in
operating performance increasing earnings management. Regulators considering whether to
further restrict NAS provided by a client’s auditor should exercise caution as restrictions could
result in unintended, negative consequences as they would be forcing firms to unbundle the
purchase of such services.
Key words: non-audit services; operating performance; risk; audit quality
JEL Classification: M41; M42; L84
3
Non-Audit Services and Improvements in Clients’ Operating Performance and Risk
Management
I. Introduction
The topic of auditor-provided non-audit services (NAS) is one of the most highly studied
issues affecting the audit profession (Simunic [1984], Palmrose [1986]). While the volume of
research is large, the focus has primarily been on one of two aspects of NAS that might influence
the audit directly: (1) economic bonding that reduces auditor independence (a cost) or (2)
knowledge spillovers that improve the quality or efficiency of the audit (a benefit). While it is
certainly valid to consider the cost and benefits of NAS as they influence the audit itself, little
research has addressed the benefits of NAS to the organization purchasing those services
independent of the effect on the audit.1 An audit firm’s expertise could have benefits to the
client that go beyond knowledge spillovers during the audit itself. To the extent that auditor-
provided NAS are the subject of regulation, a full cost/benefit tradeoff should consider the effect
of NAS on the organization as well as the effect on the audit process.2
In this paper, we take the perspective that economically-beneficial NAS may lead to at
least two positive and related outcomes: (1) improvements in overall performance and (2) a
reduction of future risk. The former connects NAS to the operations of an organization, while
the latter connects NAS to the risk management and internal control function of an organization.
Improvements in operating performance can arise because the company has improved access to
1 Theory also states that there are potential benefits that will accrue to the NAS production process from the provision of the audit (Simunic [1984]). However, we do not perform such an analysis due to data limitations. 2 We focus on NAS purchased from a firm’s auditor because we cannot observe purchases of NAS provided by firms other than the auditor. Our focus is not on the decision whether or not to purchase NAS from the auditor. Instead, we examine the costs and benefits of the NAS given their joint production. With respect to the decision to purchase multiple services from a single provider, extant literature posits that obtaining additional services from a firm with which the client is familiar can lead to the selection of higher quality services because the client has more information about the provider (Gustafson and Di Marco [1973], Gallouj [1997]). Another potential reason for a firm to purchase multiple services from a single provider is that by bundling the services together the provider can offer a discount relative to other service providers, increasing consumer surplus (Guiltinan [1987]).

4
reliable and precise information on which to make investment decisions,3 better access to human
capital and expertise not available internally, or increased tax-efficiency in the firm’s supply
chain. Improvements in risk management can flow from experience navigating unfamiliar
markets, compliance consulting, more effective information collection and dissemination, and
greater protection from downside risk due to enhanced internal controls. On the latter point,
while the Public Company Accounting Oversight Board (PCAOB) requires an audit opinion on
the internal control over financial reporting for SEC registrants, the benefits of NAS for internal
control are likely to extend significantly beyond the PCAOB’s focus.
Since the Foreign Corrupt Practices Act of 1977, and reinvigorated by the Committee on
Sponsoring Organizations (“COSO”) Framework in 1992 and the Sarbanes-Oxley Act of 2002
(“SOX”), both client organizations and their public accounting firms have increasingly been
cognizant of the need to manage business risk (Knechel [2007]). Risk management, through
differing types of assurance, information collection, and controls shields firms from downside
outcomes and improves the allocation of resources towards strategic objectives within the firm,
thus potentially improving performance and smoothing volatility (Baxter et al. [2013]). We
therefore expect that the incremental assurance, better information, access to technical experts,
identification of risks, and improvements in control systems arising from NAS should lead to
subsequent improvements in operating performance and decreases in operating risk. For
example, assurance provided by NAS with respect to acquisitions or pension plans can provide
better information to managers so they can better forecast future funds flows. Similarly, tax
consulting can yield a greater understanding of international operations and the tax and reporting
3 This point refers to the general information environment of an organization in contrast to the actual accounting system used by a client. Management advisory services can be related to either the context or quality of information (AICPA [1992]). Examples include supply chain strategies or methods for evaluating internal investments. Prior research documents a similar link between the audit and a client’s investment opportunity set (Cahan et al. [2008]).
5
consequences of repatriating funds allowing managers to improve international expansion
decisions while decreasing the risk of failure. While assessing control risk and considering
business risk are part of the financial statement audit, it is unlikely that the audit process alone
fully complements a client firm’s risk management function because the audit is highly-
structured, compliance-driven, and commoditized (Knechel [2007]). However, an organization’s
discretionary choices related to assurance-, control-, and information system-related NAS
represent deliberate choices beyond the mandated audit framework.4
While we argue that NAS are likely to be embedded in a firm’s risk management
function and framework, there are also reasons to question whether auditor-provided NAS will
result in a net economic benefit to an organization. First, NAS may be sold as part of a bundle of
services with the audit engagement. Bundling is defined as packaging two or more services
together for a single price (Guiltinan [1987]). If the objective of the bundle is to only improve
audit efficiency then it is less likely that NAS will lead to future improvements in operating
performance or subsequent reductions in risk for the client. Second, the potential for rent-
extraction by public accounting firms could result in the cost of services exceeding the benefit
(Schneider [2012], Wolinsky [1993]). Third, even if NAS are an effective mechanism for risk
management, to the extent that NAS compromise the independence of the audit decreased levels
of core financial-statement assurance could offset any potential benefits that accrue to client
firms from resource flexibility and improved risk management.
4 For example, Marathon Petroleum Corporation maintains a policy statement that outlines permissible audit-related, tax, and other NAS. Examples of audit-related services include due diligence related to pre-business combinations, employee benefit plan audits, and audits of pools of assets. Tax services include advice on restructuring, transfer pricing assistance, and customs audits. Lastly, the firm lists assistance with statutory and governmental filings among its permissible other services. Many of these types of services can have a direct impact on future operating performance and risk management.
6
Using a sample of publicly-traded firms from the post-SOX time period (2003-2013) that
purchase non-audit services from their auditor,5 we use DuPont Analysis models (Soliman
[2008], Patatoukas [2012], Dickinson [2011]) to forecast improvements in return on net
operating assets (RNOA), controlling for the underlying, fundamental changes in operations
arising from changes in after-tax profit margin (PM) and asset turnover (ATO).6 We supplement
these models with the dollar-value of NAS purchased by clients. We document a positive and
significant relation between current period NAS and subsequent improvements in operating
performance (RNOA) and asset turnover (ATO). We provide further evidence that risk
management is one mechanism linking NAS with improvements in operating performance by
examining how improvements vary with preexisting risk. We find that improvements in
operating performance due to NAS are greater for firms with relatively greater cash flow
volatility or stock return volatility, suggesting that when the opportunity for auditors to improve
risk management is greatest, the increase in performance is similarly greater. We also consider
whether firms benefit from purchasing NAS through improvements in risk management. We
document a negative relation between NAS and subsequent operating risk proxies, consistent
with NAS facilitating more effective risk management. Moreover, the negative relation suggests
that NAS’ relation to increases in operating performance does not arise as a result of clients
taking on more operating risk and, in fact, NAS fees are associated with improved risk
management in the future.
5 We limit our sample to the post-SOX time period to ensure consistent and reliable reporting of NAS. We omit firms that do not purchase any NAS to decrease the likelihood that our results are due to self-selection issues. We consider self-selection issues in Section V. 6 Focusing on operating performance allows us to abstract away from any financing effects that NAS may have. NAS have been related to increased costs of equity capital (Nam and Ronen [2012]), potentially influencing how firms rely on debt vs. equity financing. Our DuPont analysis omits financing effects from performance (Soliman [2008], Patatoukas [2012], Dickinson [2011]).
7
While improvements in operating performance are arguably beneficial to client firms,
such benefits must be offset against any potential costs or negative effects that might arise.
Specifically, we consider whether the positive relation between NAS and subsequent operating
performance represents a loss of audit quality. We thus examine the association between NAS
and subsequent earnings management, proxying for earnings management with signed
discretionary accruals. If the provision of NAS leads to an impairment of auditor independence
then the positive relation we find between NAS and future operating performance could be
driven by income-increasing earnings management. Holding constant the determinants of
operating performance, we fail to find any evidence consistent with NAS compromising audit
quality and resulting in greater income-increasing earnings management in subsequent periods.
Our results indicate that a client's decision to purchase NAS from their auditor yields
benefits that extend beyond the audit production process and we do not find any evidence that
the client's decision is driven by a desire (or ability) to reduce the quality of the audit by
undermining the independence of the auditor. Rather, our evidence clearly shows that some
clients can obtain demonstrable economic benefits by acquiring NAS from their auditor. While
similar benefits might be obtainable from other service providers, the fact that these firms
voluntarily choose their auditor for such services indicates that such transactions are
economically beneficial to the client organization. Obviously, firms that do not expect to benefit
in a similar fashion can choose to not purchase NAS from their auditors. In short, the voluntary
purchase of NAS suggests an economically informed decision that benefits the client
organization without damaging the auditor-client relationship or undermining audit quality.

8
To shed additional light on our results, we decompose NAS into three types: audit-related
fees, tax service fees, and other fees (SEC [2000]).7 We find that the positive relation been NAS
and subsequent improvements in operating performance are a function of audit-related services
improving asset turnover and tax services improving after-tax profit margins. As a supplemental
analysis, we allow the effect that NAS have on improvements in operating performance and
reductions in risk to vary by client-firm size. We estimate our models by asset-tercile and find
that the NAS purchased by smaller and midsize firms generally result in performance
improvements whereas the NAS obtained by midsize and larger firms result in reductions in
future risk.
Our findings are important for several reasons. First, standard-setters and regulators are
concerned that NAS may undermine audit quality. While much of the previous research on NAS
has failed to find a negative association between such services and audit quality (Kinney et al.
[2004], Paterson and Valencia [2011], Ashbaugh et al. [2003], DeFond et al. [2002], Chung and
Kallapur [2003], Hay et al. [2006]), our findings provide evidence that client firms appear to
benefit from the joint provision of NAS and that further restrictions on the currently permissible
bundle of NAS may have unintended, negative consequences. Second, our study is important to
academics seeking to understand the underlying costs and benefits of NAS. Previously, research
has primarily focused on outcomes such as tax avoidance (Cook et al. [2008]), audit efficiency
(Simunic [1984]), and earnings management (Kinney et al. [2004]). We offer a broader
perspective in which all costs and benefits are netted out through overall firm performance.
7 The SEC defines audit-related fees as “assurance and related services (e.g., due diligence services) that traditionally are performed by the independent accountant… employee benefit plan audits, due diligence related to mergers and acquisitions, accounting consultations and audits in connection with acquisitions, internal control reviews, attest services that are not required by statute or regulation and consultation concerning financial accounting and reporting standards.” Tax fees are “fees for tax compliance, tax planning, and tax advice.” Other fees capture any services not fitting into the above two-categories (Asthana and Krishnan [2006]).

9
Third, our research is important to managers of firms as we document the viability of NAS as a
mechanism to address gaps in human capital and improve risk management especially for firms
with high preexisting risk.8
The remainder of the paper is structured as follows: First, we develop our hypotheses in
Section II and elaborate on our research design in Section III. We then present our main findings
in Section IV and discuss additional analysis in Section V. Section VI summarizes our results
and conclusions.
II. Hypothesis Development
Organizations create value when they strategically identify and place into service
resources that can be leveraged to their advantage (Hitt and Ireland [1986]). Resources can be
broadly classified as physical capital, organizational capital, or human capital (Barney [1991]).
Physical capital resources include property, plant, and equipment, as well as raw materials, that
the firm possesses and uses in conducting its operations (Williamson [1975]). Organizational
capital resources include a firm’s control systems, the structure of the organization, and informal
interactions among divisions within the firm (Tomer [1987]). Human capital resources are
composed of the knowledge, experience, education, and perspective of each manager or worker
(Becker [1964]). NAS provide a potential source of organizational or human capital that could
be economically beneficial to an organization.
Hypothesis 1: NAS and Future Performance
The success of any organization depends on its ability to marshal and utilize appropriate
resources given its objectives and strategic plans. Fundamental to achieving success is the need
8 The potential for an audit firm to benefit a client in various ways beyond fundamental assurance over financial statements has been previously documented in the small and medium enterprises (SME) market where most companies are not publicly listed (Knechel et al. [2008]).

10
for effective decision making and resource management by the managers of the organization.
Many organizational failures can be directly traced to failures in management planning and
decision making (Denis and Denis [1995], Perez-Gonzalez [2006]). Consequently, all
organizations seek to acquire and develop the best human capital, consistent with the resource
based view of the firm (Conner [1991]). However, decisions about human capital often are based
on implicit tradeoffs between the costs and benefits of adding human resources to an
organization, as well as alternatives that may be available for gaining access to needed labor
(e.g., outsourcing). For example, the cost of some labor may be high due to short-term frictions
in labor markets. Labor market frictions that create inefficiencies when hiring new employees
include labor unions (Earle and Pencavel [1990]), wage rigidity (Gali et al. [2007]), supplier
market power or preferences (Hall [1997]; Chang and Kim [2007]), and inefficiencies in the
search for qualified candidates (Sterling [2014]). Further, once an employee is hired into an
organization, the cost associated with that individual becomes “sticky” (Anderson et al. [2003]).
One option for supplementing internal skills and expertise is to hire outside consultants
for specific tasks, especially if the task is highly technical such that obtaining the necessary skill
level via internal hires may not be cost effective. Nippa and Petzold [2002] note that hiring a
consultant with specific expertise facilitates knowledge transfer in a manner that may be less
costly than the client firm hiring and training employees to gain specialized knowledge. Further,
an internal solution may not be as effective as that provided by a consultant because the external
consultant is likely to have more experience in specific, highly technical areas. Thus, consulting
firms deliver value through improvements in the organizational resources of the firm and the
efficient deployment of human capital. The professionals that comprise a consulting engagement
team have generally obtained a considerable amount of formal education and training in order to

11
enter their field (Hitt et al. [2001]). The overall high level of auditor provided NAS in the
economy clearly indicates that the independent auditor is one possible source of external
expertise that a company can access.
The breadth and depth of NAS offered by public accounting firms continues to expand
consistent with the diversification of their human capital. These services are broadly classified as
audit-related, tax, and other. Audit-related services are assurance and associated services not
specifically required by statute such as due diligence pertaining to a merger or acquisition or
employee benefit plan audit (SEC [2000]).9 Tax services are performed by an accounting firm’s
tax department and include tax compliance or planning but do not include assurance work done
in conjunction with the audit (Kinney et al. [2004]). Lastly, other services are any services which
are not classified as audit-related or tax (SEC [2000]). Examples of other services include
consulting that improves information reporting, accuracy, and security; risk and compliance
services; and forensic accounting.10 Many of these services are sold to non-audit clients but
many are also actively marketed to audit clients as evidenced by the high average NAS fee
observed in our sample ($627,000).
NAS not only provide firms with resource flexibility in order to address operational
challenges, they can also improve a firm’s risk management. Risk management is important
because it facilitates a firm achieving its strategic objectives (COSO [2004]). Firms must
evaluate the risk and return on their investment options in order to ensure that they allocate
9 Note that if the employee benefit plan is large enough there is a statutory requirement that it be audited. Per the U.S. Department of Labor, a plan with fewer than 100 participants can receive a small pension plan audit waiver. If a plan is subject to a mandatory audit requirement, however, such an audit does not have to be conducted by the same auditor. 10 While SOX has imposed restrictions on the types of NAS that can be provided to public companies, there are still several types of permissible services that may be purchased to address clients’ needs subject to audit committee approval. SOX prohibits audit firms from providing bookkeeping, financial information systems design and implementation, appraisal or valuation, actuarial, internal audit outsourcing, management function or human resource, broker or dealer, legal, or expert services to their audit clients (Messier et al. [2014]).
12
capital efficiently across lines of business (Nocco and Stulz [2006], McShane et al. [2011]).
Consistent with expectations, Baxter et al. [2013] find that high quality enterprise risk
management is positively related to future operating performance. NAS addressing a firm’s risks
should similarly result in subsequent increases in firms’ operating performance. For example,
improved accuracy in information should allow managers to tailor strategies to their particular
competitive environment more effectively and with shorter response times. Tax consulting can
allow firms to better structure and source their supply chain in a manner that minimizes taxes
(e.g., via transfer prices), potentially freeing up resources for investment that would have
otherwise been remitted to taxing authorities. Assurances provided about pension plans and
acquisitions should allow managers to form better estimates of future financial needs and
payoffs, allowing managers to better allocate resources within the firm and minimize
unnecessary resource slack.
While the ability of NAS to provide resource flexibility and improve risk management
suggests a positive relation between NAS and subsequent improvements in operating
performance, there are at least four reasons why such an association may not occur. First, NAS
could be sold as a bundle of services with the audit solely to gain efficiencies in the audit.
Second, NAS could be purchased in order to improve financial reporting quality or to ensure
regulatory compliance. Neither of these two outcomes would necessarily lead to an improvement
in operating performance for the client. Third, the sale of NAS can be the result of rent extraction
by the audit firm due to a lack of bargaining power for the client or significant information
asymmetry between the audit firm and the client (Chen et al. [2010]). Fourth, the provision of
NAS can result in auditor independence impairment which reduces the value of the audit and

13
lowers audit quality (Simunic [1984]).11 A company could choose to purchase NAS from any of
a number of suppliers. The fact that they purchase specific NAS from their auditor suggests that
they perceive a net economic value in the services. Therefore, it follows that for public
accounting firms to maintain their NAS practices over the long term, they must provide value to
their clients (Klein and Leffler [1981]). This leads to our first hypothesis:
H1: There is a positive relationship between auditor-provided NAS and subsequent
changes in performance.
For the purposes of this paper, we proxy for future operating performance using the change in
the return on net operating assets. We also decompose our performance measure into its DuPont
components—asset turnover and after-tax profit margin—in our supplemental analysis to
provide a greater understanding as to the types of performance improvements provided by NAS.
Hypothesis 2: NAS and Risk
Services focusing on risk management are a significant component of NAS marketed to
audit clients (KPMG [2012], EY [2013]). Such services can have a beneficial effect on
mitigation of a firm’s future risk. Specifically, NAS that facilitate more effective risk
management can aid a firm in avoiding riskier investments and more accurately measuring the
potential for downside outcomes including the tax consequences of expanding into new
jurisdictions. For example, firms that engage in complex transactions such as mergers and
acquisitions are likely to benefit from due diligence work performed by the advisory practice of
their current auditor.12
11 The level of audit quality can have a significant impact on an organization’s cost of capital because high quality financial reporting is associated with lower cost of debt (Pittman and Fortin [2004]) and improved investment efficiency (Biddle and Hilary [2006]). 12 The assurance provided by NAS with regard to mergers and acquisitions (typically through audit-related fees) are particularly relevant in this setting as empirical evidence indicates that most acquisitions suffer from a winner’s curse where the acquiring firm experiences a loss in value after completing the transaction (Harford [1999], Gilberto and Varaiya [1989], Moeller et al. [2004]).

14
Risk management has been formally established as an important element of
management’s responsibilities since the Foreign Corrupt Practices Act of 1977 set forth that
managers must implement an effective system of internal control. Risk management was greatly
broadened by COSO in 1992 by establishing a framework for evaluating internal control. The
1992 COSO framework was subsequently extended to reflect a much more comprehensive
approach to enterprise risk management (COSO [2004]). Following the framework of COSO,
managers and auditors have placed a greater emphasis on a broad understanding of business risk
(Knechel [2007]). Risk management has also moved to the forefront of the agenda for audit
committees (KPMG [2012]). Such a change in focus toward risk management among corporate
officers and directors has led to substantial changes in auditing practice (IFAC [2009], PCAOB
[2010]). It has also served as an impetus for the further development of NAS that focus on
identifying and addressing risk.13
While some NAS have been developed to assist firms in their risk management, whether
purchases of NAS by audit clients actually influences the level of subsequent client risk is an
open question. First, following the implementation of SOX, firms changed the level and types of
NAS that they obtained from their auditors (Gaynor et al. [2006], Abbott et al. [2011]). Such
shifts in the demand for NAS could mitigate any association if valuable services were statutorily
prohibited or those charged with governance (i.e. the audit committee) opted not to purchase
NAS due to a perceived impairment of independence. Second, consistent with the discussion of
the impact of NAS on future operating performance, NAS could be the result of bundling these
services with the sale of the audit only to obtain audit efficiencies as opposed to reducing a
13 For example, in their 2012 Global Annual Review, PwC discussed the importance of providing assistance with risk management for several clients. The audit firm emphasizes that risk management will continue to be an important consideration for its clients going forward and that it will continue to work to serve client needs in this area.

15
client’s future risk. Given that specific types of NAS are sold to explicitly improve a firm’s risk
management, and that managers and board members are increasingly concerned with reducing
risk, it is more likely that NAS will be negatively related to future firm risk. We, therefore, state
our second hypothesis as follows:
H2: There is a negative relationship between auditor-provided NAS and subsequent
client risk.
We proxy for future risk using the standard deviation of operating cash flows for years t+1
through t+5 and daily stock return volatility for the subsequent calendar year.
Hypothesis 3: Effect of Different Types of NAS
Our first two hypotheses make no distinction between different types of NAS. Initial
theory proposed in the auditing literature treated NAS as essentially homogenous (Simunic
[1984]). Empirical research that has not accounted for potential differences across various types
of NAS has produced mixed results when examining the impact of the joint provision of audit
and NAS on financial reporting quality (Prawitt et al. [2012]). Recent research has begun to
consider the heterogeneous effects that different types of NAS have on audit quality and auditor
effort (Kinney et al. [2004], Davis et al. [1993], Bell et al. [2014]). Such findings are likely to
influence our analysis as well. For example, assurance services, such as audit-related services,
could improve a firm’s risk management processes so we might expect a positive (negative)
relation between audit-related services and future operating performance (risk). On the other
hand, such services may simply improve audit efficiency or yield a higher level of assurance on
the financial statements. Similarly, tax services could be positively (negatively) related to future
operating performance (risk) if they pertain to tax planning which reduces the likelihood of
negative unintended consequences from expansion into a new tax jurisdiction. However, tax
services focused solely on tax compliance may not have any future benefit for a client. While we

16
expect that there will be differences between the different types of NAS (i.e. audit-related, tax
and other), we do not have a priori expectations as to the effect of different types of NAS on
operating performance and future risk, leading to our third hypothesis:
H3: The effect of auditor-provided NAS on future operating performance and risk will
depend on the type of NAS provided by an audit firm.
III. Research Design
Subsequent Performance Model
To test our first hypothesis, we model subsequent improvements in operating
performance using a DuPont model based on prior literature (Soliman [2008], Patatoukas [2012],
Dickinson [2011], Fairfield and Yohn [2001]) which we supplement with measures of non-audit
fees and audit-fees. We estimate the following OLS regression, clustering standard errors by firm
and including year and industry fixed effects (two digit SIC) (Petersen [2009]):14
∆RNOAt+1 = β0 +β1 TOTNASt + β2 AUD_FEESt + β3 RNOAt + β4 ∆RNOAt + β5 ∆ATOt +
β6∆PMt + β7 GrNOAt +e (1)
The dependent variable is the change in the return on net operating asset (∆RNOAt+1) and is
measured as the difference between operating income after depreciation and amortization
(OIADP) scaled by lagged net operating assets from year t to year t+1. We define net operating
assets as the difference between operating assets and operating liabilities.15 The advantage of
using return on net operating assets is that we can analyze performance after removing the
effects of financing such as leverage or the cost of equity.
14 In additional analysis we make modifications to rule out two alternative explanations. First, we rule out the remediation of internal control weaknesses by removing all observations where a firm has an internal control weakness according to Audit Analytics. Second, we split our sample into three terciles by client size to ensure that our results are not driven solely by size. 15 Following Soliman [2008], we measure operating assets as total assets (AT) less cash (CHE) and short term investments (IVA). Operating liabilities are total assets less interest bearing debt (DLTT, DLC), common equity (CEQ), preferred stock (PSTK), and minority interest (MIB).

17
Our variable of interest is total non-audit fees which includes all non-statutory fees paid
to the independent auditor (TOTNAS), captured from Audit Analytics. To ease interpretation, we
rank TOTNAS into deciles and scale such that it varies between zero and unity.16 Consistent with
Hypothesis H1, we expect a positive and significant coefficient for TOTNAS (β1 > 0). We also
include the decile-rank of AUD_FEES in Equation (1) in order to accommodate any potential
cross-determination of audit and non-audit fees (Simunic [1984], Whisenant et al. [2003]) as
well as to control for any assurance or risk-reduction associated with a financial statement audit
(Simunic [1980]).
Our control variables are identified from prior literature (Soliman [2008]). We include
contemporaneous operating performance (RNOAt) as well as the change in operating
performance (∆RNOAt) to control for persistence of profitability and mean reversion over time.
We also include the contemporaneous changes in RNOA’s two components: asset turnover
(ATO) and after-tax profit margin (PM). Both serve as fundamental signals of operating
performance (Soliman [2008]). Asset turnover, sales divided by lagged net operating assets,
captures the extent to which firms are able to utilize assets to generate operating profits, with
changes indicating increases in efficiency of production or asset utilization. After-tax profit
margin, operating income divided by sales, captures the extent to which a firm is able to contain
costs within its sales as well as to set prices above marginal cost. We include growth in net
operating assets (GrNOA) to control for changes in the denominator of our performance measure
arising from differential growth rates across firms.
16 Unlike prior auditing literature (with the exception of Ferguson et al. [2004]), we rely on the decile-rank of non-audit fees and audit-fees rather than their natural log. This is to facilitate economic interpretation consistent with non-auditing studies that have variables of interest with significant skewness (Affleck-Graves and Mendenhall [1992], Battalio et al. [2012]). In Section V, we replicate all results, in direction and significance, using the natural log of non-audit fees and audit-fees as well as the ratio of NAS to total fees. We find qualitatively similar results using both measures.

18
We also employ Equation (1) in the test of our third hypothesis. Specifically, we
disaggregate TOTNAS into its three types: AR_FEES, TAX_FEES, and OTH_FEES (SEC [2000],
Asthana and Krishnan [2006]), which are the decile-ranks for audit-related, tax, and other fees,
respectively.17
Decomposing NAS into its three types allows us to determine which type(s) of
NAS are economically beneficial to clients. Hypothesis H3 predicts the coefficients on each type
of NAS will be different from one another, suggesting that each type of NAS has a unique
impact on firms’ subsequent operating performance.
Finally, we also provide evidence as to how NAS improves subsequent performance.
DuPont analysis suggests that operating performance can be driven by two components, asset
turnover and after-tax profit margin. We therefore replace the dependent variable of Equation (1)
with subsequent changes in ATO and PM.
Subsequent Operating Risk Model
To test our second hypothesis, we model the relation between subsequent operating risk
and NAS using the following OLS regression:
Riskt+k = γ0 +γ1 TOTNASt + γ2 AUD_FEESt + γ3 Riskt + γk CONTROLSj +e (2)
We employ two proxies of future operating risk: (1) the future five-year volatility of operating
cash flows (STDCFO) and (2) daily stock return volatility for the following year (STDRET). We
measure STDCFO as the five-year, rolling-window standard deviation of operating cash flows
scaled by total assets for years t+1 to t+5 (Minton and Schrand [1999], McGuire et al. [2012]).
We measure STDRET as the standard deviation of daily returns over the following calendar year
(Callen et al. [2010], Lara et al. [2011], Comprix et al. [2011]).
17 Note that when we form the deciles we assign all observations with a zero dollar value for a specific type of service into a single decile and then split the remaining observations across the nine remaining deciles. This is done to ensure that all observations with a zero dollar amount are treated the same.

19
Consistent with Hypothesis H2, we expect negative and significant coefficients for
TOTNAS (γ1 < 0). We also include contemporaneous levels of risk (RISK) to ensure TOTNAS is
not simply capturing firms with preexisting high or low levels of operating risk. We include the
same control variables as in Equation (1) to determine whether the subsequent increases in
operating performance related to NAS are related to subsequent increases in risk, which would
call into question the potential value of NAS to risk-averse shareholders, or subsequent decreases
in risk, enhancing the value of NAS. As with our analysis of operating performance, we also
explore the extent to which the relation between NAS and subsequent risk holds for the three
types of NAS (i.e., H3). Again, we cluster standard errors by firm and include year and industry
fixed effects (two digit SIC) (Petersen [2009]).
Sample Selection and Descriptive Statistics
We initially draw our sample from the intersection of Compustat’s Annual File, Audit
Analytics, and CRSP for the years 2003-2013. We begin in 2003 to ensure consistent reporting of
non-audit fees as well as a consistent set of SOX-allowed NAS. We end in 2013 because of the
requirement of one year of subsequent operating performance and risk. Next, we remove firms
in the financial industry or utilities because these firms operate in a highly regulated
environment. We then exclude any firm-year without the necessary data to estimate Equation (1),
requiring that observations have the data necessary to calculate current levels of, and future
changes in, RNOA, PM, and ATO. Next, we remove observations where denominators (lagged
net operating assets, sales) are less than one million to avoid small denominator problems. We
further restrict our sample by requiring firm-years to purchase a positive, nonzero amount of
NAS to decrease self-selection issues arising from the decision to purchase or not to purchase

20
NAS.18 Our final sample consists of 22,775 firm-year observations for our performance analysis
and 18,898 for our cash-flow (12,846 for our returns) based risk tests. We winsorize all
continuous variables by year at the 1% level.
Table 1 contains descriptive statistics of our sample. Consistent with mean reversion of
performance, we find the average change in subsequent RNOA, ATO, and PM are all negative
(Fairfield and Yohn [2001], Soliman [2008]). Audit fees average $2.2 million while total non-
audit fees average $627 thousand. Tax fees are the largest type of non-audit fees, followed
closely by audit-related fees. Other fees are the smallest type of non-audit fees. Table 2 contains
the correlation matrix for the variables in our models. We find insignificant correlations between
non-audit fees and subsequent ∆RNOA and ∆PM. We find a modestly negative, but statistically
significant, correlation between TOTNAS and subsequent changes in asset turnover. Variance
inflation factors do not indicate any problems arising from multicollinearity.
<<<<< Insert Tables 1 and 2 about here >>>>>
IV. Main Results
Hypothesis 1: Subsequent Performance
Table 3 presents the results of estimating Equation (1). The dependent variable in
Columns (1) and (2) is ∆RNOA. Columns (3) and (4) present the results for ∆ATO, while the
dependent variable for Columns (5) and (6) is ∆PM. Odd numbered columns contain TOTNAS
and even numbered columns contain the three types of TOTNAS. We find that AUD_FEES are
positively related to subsequent increases in operating performance (0.062, p<.01), suggesting 18 Consistent with Donohoe and Knechel [2013], we also confirm our findings are robust to removing firms purchasing a de minimis amount of NAS, where de minimis is defined as less than $10,000. Imposing these additional screens removes an additional 1,670 firm-years. We continue to find NAS are related to subsequent improvements in operating performance and subsequent reductions in operating risk. In untabulated additional analysis, we reperform all of our tests including all observations that do not purchase NAS (i.e. purchase a zero value). Our results continue to hold, namely we find NAS is positively and significantly related to subsequent increases in operating performance and negatively and significantly related to future reductions in operating risk.

21
that the improvements in organizational resources and assurances provided by the audit create
economic value for clients that also purchase NAS.19 Consistent with H1, the coefficient for
TOTNAS is positive and significant (0.053, p<.01) in Column (1), suggesting that NAS are
related to subsequent improvements in operating performance. A one-decile increase in fees is
associated with a 0.5% increase in return on net operating assets.20 Given that the average
subsequent change in operating performance is -2.6 percent, a one-decile increase in non-audit
fees results in about a 20% change in performance. The coefficients for AUD_FEES and
TOTNAS are statistically indistinguishable, suggesting the economic value provided by audits
and NAS are, on average, similar in magnitude. We also find that the coefficient for TOTNAS is
positive and significant in Column (3) (0.169, p<.01) while the coefficient for TOTNAS is
insignificant in Column (5), suggesting that the improvement in operating performance is
primarily attributable to improvements in asset turnover rather than after-tax profit margins.21
<<<<< Insert Table 3 about here >>>>>
Hypothesis 2: Subsequent Risk
Table 4 presents the results of estimating Equation (2). The dependent variable in
Columns (1) and (2) is the subsequent standard deviation of operating cash flows, while the
dependent variable in Columns (3) and (4) is the subsequent standard deviation of daily stock
returns. The coefficient for TOTNAS is negative and significant in both Columns (1) (-0.012,
p<.01) and (3) (-0.002, p<.01) consistent with Hypothesis H2 and suggests that NAS are related
to lower levels of future operating risk. Moreover, the negative coefficient is also evidence that
19 We also consider clients that do not purchase NAS in a supplemental analysis below. 20 Given that we decile-rank and transform such that NAS range from zero to one, a one unit increase in our context equals 0.1. 21 We confirm that improvements in operating performance and asset turnover persist into the second year. Namely, when replacing the dependent variable in Equation (1) with the average change in RNOA from year t+1 to t+2, we continue to find a positive and significant coefficient on TOTNAS.

22
the subsequent improvements in operating performance among firms that purchase NAS
documented in Table 3 does not simply occur because of increases in risk eliciting an
improvement in return. A one decile increase in NAS decreases subsequent operating cash flow
volatility by 0.12% (0.02%), or 2.1% (0.6%) of the average firm’s future cash flow volatility
(daily return volatility). Auditing services are also related to lower levels of future operating risk
as we find a negative and significant coefficient for AUD_FEES in Columns (1) and (3) (-0.034,
p<.01; -0.006, p<.01, respectively). This result is encouraging as it suggests that the statutorily-
mandated audit creates economic value by reducing future risk. Comparing the coefficients on
TOTNAS with AUD_FEES reveals that the assurances provided by auditing have a significantly
greater influence on reducing subsequent operating risk (p<.01 in Column (1) and p<.05 in
Column (3)). While the audit provides benefits in risk reduction, the joint provision of NAS
augments these benefits. In combination, our results suggest that NAS are related to subsequent
improvements in operating performance and decreases in operating risk, consistent with auditor-
provided NAS providing economic value to a client.
<<<<< Insert Table 4 about here >>>>>
Hypothesis H3: Analysis by Type of NAS
We report the results of tests of Hypothesis H3 relating to subsequent operating
performance in the even-numbered columns of Table 3. Disaggregating TOTNAS into its three
types reveals that audit-related services are positively related to subsequent improvements in
operating performance (Column (2), 0.018, p<.10). This finding suggests that the assurance
provided by audit-related services is beneficial to future operating performance via
improvements in asset turnover (Column (4), 0.102, p<.01). Tax services are also positively
related to subsequent improvements in operating performance (Column (2), 0.038, p<.01) via

23
improved after-tax profit margins (Column (6), 0.010, p<.05). Other types of NAS do not appear
to be related to improvements in firm performance, i.e., the coefficient for OTH_FEES is
insignificant in all three specifications.22 Taken together, the evidence is consistent with
hypothesis H3 which proposes that different types of NAS have different relations with client’s
future operating performance.
We present the results concerning the relation between types of NAS and subsequent
reductions in future risk in the even-numbered columns of Table 4. We find that audit-related
services are negatively and significantly related to future volatility in operating cash flows
(Column (2), -0.005, p<.01) and the future standard deviation of daily stock returns (Column (4),
-0.001, p<.01). We find a similar significantly negative relation between tax fees and firm risk
(Column (2), -0.009, p<.01; Column (4), -0.001, p<.01). Consistent with our analysis of future
operating performance, we do not find a significant association between other fees and future
risk. The collective evidence supports hypothesis H3 that different types of NAS have different
relations with future client risk.
Analysis of NAS based on Company Size
We do not explicitly control for client size in our primary analysis consistent with the
prior literature using DuPont Analysis (Soliman [2008], Patatoukas [2012], Dickinson [2011],
Fairfield and Yohn [2001]).23 However, we now consider the possibility that NAS can be related
to firm-size (Hay et al. [2006]). In order to examine the influence of size on our findings, we
estimate Equations (1) and (2) by yearly asset tercile. Table 5 presents the results of our analysis
concerning size and subsequent operating performance for small (Panel A), medium (Panel B)
22 We acknowledge that the frequency of non-zero other fees is significantly lower than for audit-related or tax fees as evidenced by the median amount of other fees being $0 in our sample. We cannot rule out the alternative explanation that the failure to find an association for other fees is driven by this lack of variation. 23 We implicitly control for size differences in Equations (1) and (2) by scaling RNOA by net operating assets.

24
and large (Panel C) firms. A pattern emerges suggesting that small firms primarily reap
improvements in operating performance from NAS as TOTNAS is significant and positive in
Column (1) in Panel A (0.104, p<.01) and Column (3) in Panel A (0.295, p<.05).24 Table 6
presents the results of our analysis concerning size and cash flow volatility (Panel A) and return
volatility (Panel B). Reductions in risk primarily occur among the midsize and large firms as
TOTNAS is negative and significant in Panel A, Column (3) (-0.012, p<.01) and Column (5) (-
0.007, p<.01), and in Panel B, Column (3) (-0.007, p<.05) and Column (5) (-0.008, p<.05).25
Overall, the results in Tables 5 and 6 suggest that smaller firms that have fewer resources
primarily gain from purchases of auditor-provided NAS through increases in performance (i.e.,
by obtaining access to external expertise), while larger firms benefit from NAS through reduced
risk which suggests that their issues have more to do with complex systems of risk management.
<<<<< Insert Tables 5 and 6 about here >>>>>>
V. Additional Analysis
Additional Risk Management Evidence
Our argument assumes that NAS influences subsequent performance and risk. We
provide further evidence that risk management is one mechanism through which this occurs by
examining the extent the relative magnitude of preexisting operating risk influences the relation
between operating performance increases and NAS. We assume that relatively higher levels of
operating risk reflect poorer firm-level risk management and greater opportunities for NAS to
improve risk management. Therefore, to the extent that risk management is a mechanism through
24 We obtain qualitatively similar (0.053, p<.01) results when we conditionally rank NAS into deciles within separate asset size quintiles rather than terciles. Following Kubick et al. [2014], we first sort all firms by total assets into five distinct quintiles. Next, within each size quintile, we form decile ranks of NAS purchases. By measuring NAS in this manner we treat observations in the highest decile of NAS in the highest quintile of asset size as equivalent to observations in the highest decile rank of NAS in the lowest quintile of asset size. Thus, we effectively remove the influence of size from the analysis. 25 We find qualitatively similar results (-0.012, p<.01) when we follow Kubick et al. [2014] to form decile ranks of NAS within asset quintiles.

25
which NAS work, we expect significantly greater improvements in operating performance
among firms with the greatest preexisting risk.
To test this, we augment Equation (1) with one of two risk proxies. For our first risk
proxy, we create an indicator variable (HIGH CF RISK) equaling one when a firm has above-
median operating cash flow volatility over the five years prior to the purchase of NAS. For our
second risk proxy, we create an indicator variable (HIGH RET RISK) equaling one when a firm
has above-median daily return volatility in the year prior to the purchase of NAS. We include the
main effect in Equation (1) (i.e., either HIGH CF RISK or HIGH RET RISK) and interact it with
TOTNAS.26 Table 7 presents these results. The first two columns use HIGH CF RISK as our risk
proxy while the last two use HIGH RET RISK. We find a significant coefficient for TOTNAS in
Column (1) (0.022, p<.042) and an insignificant coefficient in Column (3) (0.006, p<.328),
providing some evidence that among firms that already have relatively low levels of operating
risk, NAS provides future improvement in operating performance. In contrast, we find robust
evidence of a positive and significant relationship of the interaction of TOTNAS and HIGH CF
RISK in Column (1) (0.058, p<.01) and TOTNAS and HIGH RET RISK in Column (3) (0.060,
p<.01), consistent with firms operating in relatively high risk environments benefiting the most
from their purchase of NAS.
<<<<< Insert Table 7 about here >>>>>
Audit Quality
Whether, and the extent to which, NAS may impair auditor independence and audit
quality is a contentious issue among researchers and regulators. There is mixed evidence within
prior literature as studies have documented a positive relation between NAS and audit quality
(Kinney et al. [2004], Paterson and Valencia [2011]), a negative relation (Frankel et al. [2002],
26 In both models, we cluster standard errors by firm and include year and industry fixed effects (Petersen [2009]).
26
Ferguson et al. [2004]), or no relation (Ashbaugh et al. [2003], DeFond et al. [2002], Chung and
Kallapur [2003]). In this paper, a concern may arise that the improvements in future
performance may simply be the result of earnings management. If the provision of NAS leads to
impaired auditor independence, then the auditor may be more willing to allow the client to book
positive accruals which could appear to be superior future performance (DeAngelo [1981],
Simunic [1984], Ashbaugh et al. [2003]). Given our hypotheses concern subsequent operating
performance, we test for evidence of earnings management in subsequent periods.27 We use
discretionary accruals (Jones [1991], Kothari et al. [2005]) as our proxy for earnings
management.28 We modify Equation (1) in two important ways in order to examine whether
earnings management drives our results. First, we substitute subsequent period discretionary
accruals at t+1 for our dependent variable ∆RNOAt+1. Second, we include current period
discretionary accruals at time t to control for any persistence in firm-specific accrual policies
unrelated to earnings management.
We report our results for discretionary accruals in subsequent periods in Table 8. Odd
numbered columns include the variable IMPPERF, an indicator variable equaling one when a
firm’s subsequent performance as measured by ∆RNOAt+1 is above the median for its given year,
and zero otherwise. We interact IMPPERF with non-audit fees to investigate the extent to which
firms with increased operating performance differ from those whose performance is below the
median. Panel A’s dependent variable is discretionary accruals for year t+1, while Panel B
27 There also remains the possibility that our results are an artifact of compromised audit quality leading to cookie jarring in year t. For this to be the case, however, the negative discretionary accruals of year t would need to reverse as positive discretionary accruals in year t+1 or later. Therefore, our subsequent period tests address this scenario and provide no evidence in support of it. In untabulated analysis, we find that current period discretionary accruals are also negatively and significantly related to NAS among firms with subsequent improvements in operating performance. 28 We calculate discretionary accruals as the residual from a cross-sectional, performance-adjusted modified Jones [1991] model estimated cross-sectionally by industry-year (McGuire et al. [2012], DeFond and Jiambalvo [1994], Dechow et al. [1995]). We use two-digit SIC for our industry-definition.

27
reports our results for the year t+2. The dependent variable in Columns (3) and (4) of both panels
is positive discretionary accruals. We therefore estimate a truncated regression in these columns,
rather than an OLS regression.
<<<<< Insert Table 8 about here >>>>>
We find an insignificant coefficient for TOTNAS when we use subsequent discretionary
accruals (year t+1) as our dependent variable in Column (1) of Table 8. When conditioning on
subsequent improvements in operating performance in Column (2), we find a positive coefficient
on TOTNAS among firms without subsequent improvements in operating performance (0.016;
p<.01), suggesting that NAS are related to increased discretionary accruals among firms that lack
improvements in operating performance. However, when summing the coefficients on TOTNAS
(0.016) and IMPPERF*TOTNAS (-0.037), we find current NAS are negative and significantly
related to subsequent discretionary accruals (p<.01) in year t+1, suggesting that the relation
between NAS and subsequent period’s discretionary accruals is negative among firms that
experience an increase in subsequent operating performance. We find a similar pattern of
coefficients when examining subsequent positive discretionary accruals at time t+1. Namely, the
coefficient for IMPPERF*TOTNAS is negative and significant (-0.017, p<.05). When we
examine discretionary accruals at time t+2, we find a negative and significant coefficient for
TOTNAS in Columns (1), (3), and (4) (p<.05) and insignificant coefficients on the IMPPERF by
TOTNAS interactions.
Taken together, these findings suggest there is a negative relation between NAS and
future, positive discretionary accruals. The negative association is even more pronounced for
firms with subsequent improvements in operating performance in year t+1. Overall, our evidence
from examining subsequent (positive) discretionary accruals is not consistent with firms’

28
improvements in operating performance arising from greater earnings management in future
periods.
Analysis of Self-selection
In our primary analysis, we exclude all firms that do not purchase NAS from their auditor
because of the endogeneity inherent in the choice to buy additional services. Prior literature
documents that the purchase of NAS along with the audit is likely jointly determined (Whisenant
et al. [2003]). To test for the effect of endogeneity, we perform additional analysis where we
include all observations that had zero NAS and that have the requisite data to calculate Equations
(1) and (2). To control for the selection issue, we employ a Heckman procedure (Heckman
[1979]) and specify the following probit model consistent with Ruddock et al. [2006]:29
PURCHASEt = ν0 + ν1BIG4t + ν2 NEGt + ν3 MRETt + ν4 CFOt + ν5 LEVt + ν4 INVRECt
+ ν4 LMVEt + ν4 MKTBKt + ν4 MERGERt + Σνj INDt +e (3)
where PURCHASE is an indicator variable taking a value of one if a firm engages its auditor for
NAS, zero otherwise. Our instruments are the auditor’s size (BIG4) as well as the client’s choice
of financing (LEV) as, a priori, there is no reason to expect that these variables should be related
to ∆RNOAt+1. We include controls for the client’s financial health (NEG, CFO), growth
prospects (MRET, MKTBK), size (LMVE), acquisition activity (MERGER), and industry
membership. All variables are defined in the Appendix.
We obtain the inverse-Mills ratio from Equation (3) and include this when we re-estimate
Equation (1). All other variables in the second stage are as previously defined. The inverse-Mills
ratio is significant (-0.098, p<.01) indicating that controlling for self-selection of firms that do
29 We exclude return on assets from our model because it is significantly correlated with our dependent variable ∆RNOA in the second stage of the Heckman procedure.
29
not purchase NAS is important when they are included in the analysis.30 In untabulated analysis,
we find that our results hold after controlling for self-selection. Namely, TOTNAS is positively
and significantly related to future return on net operating assets (0.049, p<.01). Similarly, when
we re-estimate Equation (2) after controlling for self-selection we find that TOTNAS is
negatively and significantly related to future cash flow volatility (-0.01, p<.01) and future stock
return volatility (-0.001, p<.10).
Analysis by Firm Life-Cycle
In our primary analysis, we follow prior DuPont analysis literature in building a
parsimonious empirical model (Soliman [2008], Patatoukas [2012], Dickinson [2011], Fairfield
and Yohn [2001]). This is particularly appealing as we are able to efficiently control for the key
determinants of the change in the return on net operating assets, our measure of operating
performance. In this section, we perform additional untabulated analysis to examine whether a
firm’s life cycle stage influences the relation between future operating performance (risk) and
NAS. We follow Dickinson [2011] and classify firms into one of five mutually exclusive life
cycle stages based on the signs of operating, investing, and financing cash flows.31 We then re-
estimate Models (1) and (2) for each unique life cycle stage.
An interesting pattern emerges from this analysis. First, we find that TOTNAS is
positively and significantly related to future RNOA only for firms in the introductory (0.168,
p<.01) or growth (0.051, p<.05) stages of the life cycle. We do not find any relation between
30 In untabulated analysis, we also test the validity of our instruments consistent with Larcker and Rusticus [2010] by regressing the residual from our second-stage estimation on all the explanatory variables in the first and second stages, including our instruments. We find that BIG4 is a valid instrument as it is insignificant (-0.003, p=.718) while LEV is significantly related to the residual (0.072, p<.01). Evidence of a valid instrument provides some assurance that our methodology addresses endogeneity concerns. 31 The five life cycle stages are defined by Dickinson [2011] as “(1) introduction where innovation is first produced; (2) growth where the number of producers increases dramatically; (3) maturity where the number of producers reaches a maximum; (4) shake-out where the number of producers begins to decline; and (5) decline where there is essentially a zero net entry.”
30
TOTNAS and future RNOA for the remaining three life cycle stages. These results are consistent
with our previously reported analysis of the influence of firm size in that we observe firms that
likely have the greatest need for external resources (relative to mature firms) obtain the greatest
operating performance benefits from their NAS purchases.
Second, we find consistent evidence that mature firms benefit from NAS purchases
through future decreases in risk as the coefficient on TOTNAS is negative and significantly
related to future cash flow volatility (-0.010, p<.01) and future stock return volatility (-0.002,
p<.01). Additionally, TOTNAS is negative and significantly related to future cash flow volatility
(-0.012, p<.01) and future stock return volatility (-0.005, p<.01) for growth and shake-out firms,
respectively. The results of our re-estimation of Equation (2) are largely consistent with our
analysis by firm size in that as firms mature and face increasingly complex operations they
benefit from the purchase of NAS in the form of a reduction in operating risk.32
Internal Control Weaknesses
Prior research has documented that the remediation of weaknesses in internal controls
over financial reporting disclosed under Section 404 of SOX are associated with improvements
in investment quality (Cheng et al. [2013]) and the purchase of NAS (Elder et al. [2008]). To
verify the extent to which our findings are attributable to the subsequent improvements arising
from the remediation of internal control weaknesses related to financial reporting, we exclude
from our sample the firm-year (t) and the following year (t+1) for all observations which Audit
Analytics identifies as having an internal control weakness and re-estimate Equations (1) and
32 We also find a weakly significant negative association between TOTNAS and future stock return volatility (-0.005, p<.10) for firms in the introduction life cycle stage. Thus there is some evidence that the purchase of NAS by immature firms can yield reductions in future operating risk as well.

31
(2).33 As this subsample lacks internal control weaknesses, results cannot be attributed to the
remediation of internal control weaknesses. In untabulated analysis, we continue to find positive
and significant coefficients for TOTNAS (p<.01) in Equation (1). This is consistent with the
benefits provided through NAS leading to subsequent increases in operating performance and
inconsistent with our findings being the result of internal control weakness remediation. We also
find a negative and significant coefficient for TOTNAS when re-estimating Equation (2),
suggesting that the negative relation between current NAS and future operating risk is not
attributable to internal control weaknesses. Overall, our results appear distinct from the
previously documented effects of internal control remediation.
Analysis using Other Measures of NAS Fee
For our primary analysis, we utilize the decile rank of NAS purchases in order to
facilitate interpretation of the economic significance of the coefficients from our tests. We
perform several robustness tests to ensure that our measure of NAS does not lead to spurious
inference. First, consistent with prior literature that examines NAS, we re-estimate Equations (1)
and (2), substituting the natural log of one plus the dollar value of non-audit fees in lieu of our
decile rank measure of NAS (Ashbaugh et al. [2003]).34 Our results are qualitatively similar to
our primary analysis with NAS being positively and significantly related to the future return on
net operating assets (0.011, p<.01) and negatively and significantly related to future changes in
cash flow volatility (-0.002, p<.01) as well as future changes in the standard deviation of stock
returns (-0.002, p<.01).
33 Remediation is defined as the process of fixing a material weakness or a significant deficiency during management’s assessment of internal controls (Messier et al. [2014]). Prior literature finds that internal control deficiencies are related to lower financial reporting quality, that remediation of previously reported internal control deficiencies is associated with improvements in accrual quality (Ashbaugh-Skaife et al. [2008]), and that the failure to remediate material weaknesses is related to increased abnormal accruals (Bedard et al. [2012]). 34 We also substitute the natural log of one plus the dollar value of audit fees paid as opposed to the decile rank of audit fees.

32
Second, we examine the relation between total fees paid to the auditor and future
operating performance and risk. In order to examine total fees, we modify Equations (1) and (2)
by removing our measures for audit fees (AUD_FEES) and NAS (TOTNAS) and including the
decile-rank of total fees (TOTAL_FEES) and scale so that it varies between zero and unity. Our
untabulated analysis shows that TOTAL_FEES are positively and significantly related to future
changes in return on net assets (0.107, p<.01) and negatively and significantly related to future
standard deviation of cash flows (-0.043, p<.01) and future standard deviation of returns (-0.032,
p<.01). These results are consistent with our primary analysis (Tables 3 and 4).
Lastly, we measure the relationship between NAS and future operating performance
(risk) using the ratio of NAS to total fees consistent with some prior literature (Frankel et al.
[2002], Ashbaugh et al. [2003]). We modify and re-estimate Equations (1) and (2) by
substituting the ratio of non-audit fees to total fees as our variable of interest and exclude audit
fees. We report the results of this analysis in Tables 9 and 10. We find that the ratio of non-audit
fees to total fees is positively and significantly associated with future return on net operating
assets (0.078, p<.01). We also document a negative and significant association between the ratio
of non-audit fees and future cash flow volatility (-0.008, p<.05) or future standard deviation in
returns (-0.011, p<.05). These results are consistent with our primary analysis. Additionally, we
find results for audit-related fees and tax fees consistent with our primary analysis. However, we
do find one notable difference from our primary results: the ratio of other fees to total fees now
has a positive and significant association with future cash flow volatility (0.041, p<.01) and
future standard deviation of returns (0.031, p<.05). Other services was not significant in our
primary analysis and this result may suggest that a large proportion of services that are unrelated

33
to the core services of an accounting firm—assurance and tax—may not have a positive impact
on risk management for the client.
<<<<< Insert Tables 9 and 10 about here >>>>>
VI. Conclusion
Numerous parties, such as regulators, investors, and corporate boards, must evaluate the
costs and benefits of the joint provision of auditing and NAS as part of the role that each plays in
the capital market. Prior academic research into NAS has considered the potential trade-off
between economic bonding reducing audit quality via independence impairment (cost) and
knowledge spillovers enhancing audit quality or efficiency (benefit). We expand the prior
literature’s exploration of the costs and benefits of NAS by considering two potential economic
benefits accruing to the client firm, namely improvements in operating performance and risk
management.
In general, we find that total NAS purchased in conjunction with the audit are positively
related to subsequent increases in operating performance and asset turnover. More specifically,
we find that audit-related fees are positively associated with future improvements in asset
turnover and tax fees are positively associated with future changes in after-tax profit margin.
These results suggest NAS provide economic benefits to client firms through operating
performance. We also find that total NAS fees, audit-related fees, and tax fees are negatively
related with future risk, suggesting that NAS also provide economic value to client firms through
improved risk management. In supplemental analysis, we provide evidence that firms with high
preexisting levels of operating risk appear to benefit the most from the purchase of NAS.
Additionally, we find that NAS purchased by firms that have fewer resources available (i.e.
smaller firms) are positively associated with future performance while NAS purchased by firms
that likely have more human capital available (i.e. larger firms) are associated with reductions in

34
future risk. We fail to find evidence of NAS compromising audit quality, suggesting the joint
provision of NAS and audit services do not appear to systemically impair audit quality
In spite of extensive sensitivity testing and supplemental analyses, our paper is still
subject to some limitations. First, our analysis of operating performance does not preclude NAS
impairing independence in appearance. If shareholders and debt-holders believe NAS
compromises audit quality, they may increase the financing costs of firms that purchase NAS.
Therefore, overall performance, net of financing costs, may not increase to the same extent as
operating performance. Second, we are only able to observe services purchased from auditors as
part of a bundle. We are therefore unable to comment on the economic benefits of the assurance-
related, internal control-related, tax, and other services purchased from other professional firms.
Lastly, we use common empirical proxies, such as discretionary accruals, to measure the
constructs we are interested in studying and to the extent that these proxies are measured with
error this may introduce bias into our analysis.
Overall, our study provides evidence that NAS provide economic benefits to client firms.
Our results are of interest to several stakeholders. Regulators that are currently weighing whether
or not to further restrict the bundling of NAS by audit firms should consider whether such
restrictions could have unintended, negative consequences for client firms. Those charged with
firm governance will be interested in our results that suggest that certain types of NAS can
improve firm operations and lower risk without sacrificing financial reporting quality. Lastly,
academics interested in studying the relation between auditing and NAS will be interested in our
study as it underscores the importance of more broadly considering the potential costs and
benefits to the client firm of the joint provision of audit and NAS in future research.
35
Appendix
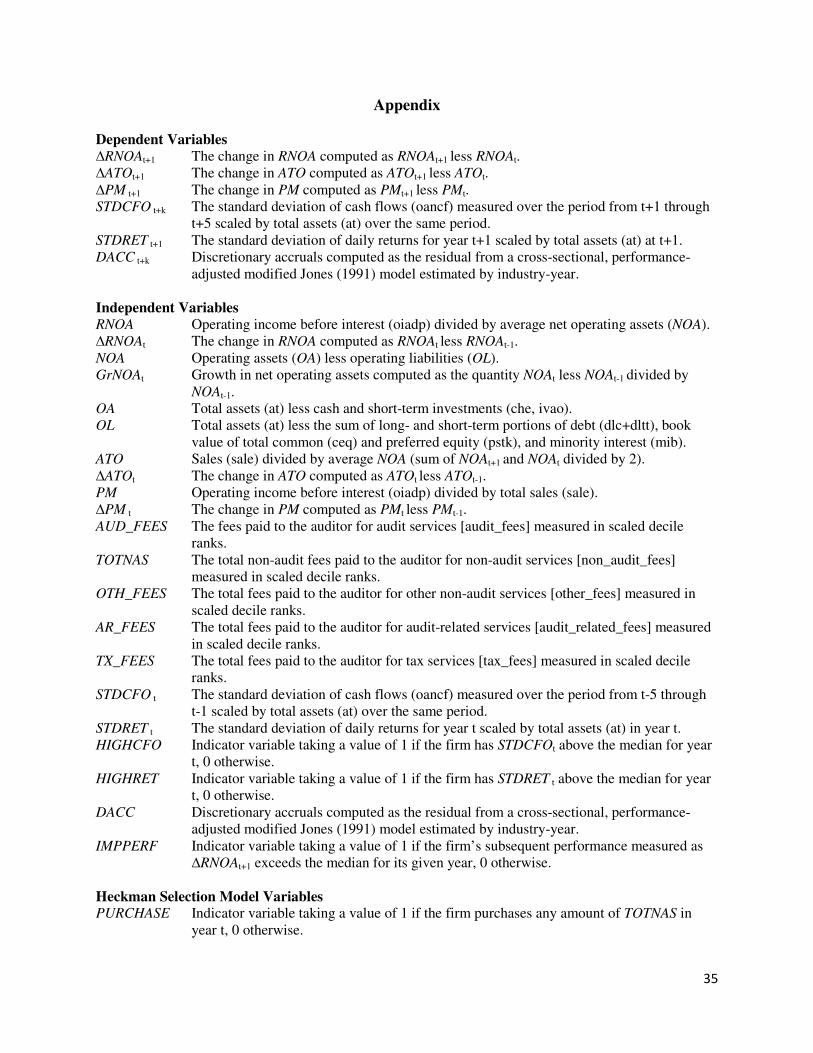
Dependent Variables
∆RNOAt+1 The change in RNOA computed as RNOAt+1 less RNOAt. ∆ATOt+1 The change in ATO computed as ATOt+1 less ATOt. ∆PM t+1 The change in PM computed as PMt+1 less PMt. STDCFO t+k The standard deviation of cash flows (oancf) measured over the period from t+1 through
t+5 scaled by total assets (at) over the same period. STDRET t+1 The standard deviation of daily returns for year t+1 scaled by total assets (at) at t+1. DACC t+k Discretionary accruals computed as the residual from a cross-sectional, performance-
adjusted modified Jones (1991) model estimated by industry-year. Independent Variables
RNOA Operating income before interest (oiadp) divided by average net operating assets (NOA). ∆RNOAt The change in RNOA computed as RNOAt less RNOAt-1. NOA Operating assets (OA) less operating liabilities (OL). GrNOAt Growth in net operating assets computed as the quantity NOAt less NOAt-1 divided by
NOAt-1. OA Total assets (at) less cash and short-term investments (che, ivao). OL Total assets (at) less the sum of long- and short-term portions of debt (dlc+dltt), book
value of total common (ceq) and preferred equity (pstk), and minority interest (mib). ATO Sales (sale) divided by average NOA (sum of NOAt+1 and NOAt divided by 2). ∆ATOt The change in ATO computed as ATOt less ATOt-1. PM Operating income before interest (oiadp) divided by total sales (sale). ∆PM t The change in PM computed as PMt less PMt-1. AUD_FEES The fees paid to the auditor for audit services [audit_fees] measured in scaled decile
ranks. TOTNAS The total non-audit fees paid to the auditor for non-audit services [non_audit_fees]
measured in scaled decile ranks. OTH_FEES The total fees paid to the auditor for other non-audit services [other_fees] measured in
scaled decile ranks. AR_FEES The total fees paid to the auditor for audit-related services [audit_related_fees] measured
in scaled decile ranks. TX_FEES The total fees paid to the auditor for tax services [tax_fees] measured in scaled decile
ranks. STDCFO t The standard deviation of cash flows (oancf) measured over the period from t-5 through
t-1 scaled by total assets (at) over the same period. STDRET t The standard deviation of daily returns for year t scaled by total assets (at) in year t. HIGHCFO Indicator variable taking a value of 1 if the firm has STDCFOt above the median for year
t, 0 otherwise. HIGHRET Indicator variable taking a value of 1 if the firm has STDRET t above the median for year
t, 0 otherwise. DACC Discretionary accruals computed as the residual from a cross-sectional, performance-
adjusted modified Jones (1991) model estimated by industry-year. IMPPERF Indicator variable taking a value of 1 if the firm’s subsequent performance measured as
∆RNOAt+1 exceeds the median for its given year, 0 otherwise. Heckman Selection Model Variables PURCHASE Indicator variable taking a value of 1 if the firm purchases any amount of TOTNAS in
year t, 0 otherwise.

36
BIG4 Indicator variable taking a value of 1 if the firm engages an auditor identified as one of the Big 4 in year t, 0 otherwise.
NEG Indicator variable taking a value of 1 if firm reports a net loss (ib) in year t, 0 otherwise. MRET The market-adjusted annual stock return in year t. CFO The cash from operations (oancf) in year t deflated by beginning-of-year total assets (at). LEV The ratio of total liabilities (dlc + dltt) to total assets (at) in year t. INVREC The ratio of inventory (invt) plus accounts receivable (rect) in year t divided by
beginning-of-year total assets (at). LMVE The natural log of the market value of equity in year t computed as the price per share at
the end of the fiscal year (prcc_f) multiplied by the number of common shares outstanding (csho).
MKTBK The ratio of the market value of equity (LMVE) to the book value of equity (at – dlc – dltt) in year t.
MERGER Indicator variable taking a value of 1 if the firm engaged in an acquisition in year t (sale_fn = ‘AA’), 0 otherwise.
_____________________________________________________________________________________ Note: Compustat (Audit Analytics) data items are indicated in parentheses (brackets).

37
References
Abbott, L. J., S. Parker, and G. F. Peters. “Does mandated disclosure induce a structural change in the determinants of nonaudit service purchases?” Auditing: A Journal of Practice &
Theory 30 (2011): 51 – 76. Affleck-Graves, J., and R. R. Mendenhall. “The relation between the Value Line enigma and
post-earnings-announcement drift.” Journal of Financial Economics 31 (1992): 75 – 96. Anderson, M. C., R. D. Banker, and S. N. Janakiraman. “Are selling, general, and administrative
costs “sticky”?” Journal of Accounting Research 41 (2003): 47 – 63. American Institute of Certified Public Accountants (AICPA). Statement on standards for
consulting services no. 1. New York, NY: AICPA, 1992. Ashbaugh, H., R. LaFond, and B. W. Mayhew. “Do nonaudit services compromise auditor
independence? Further evidence.” The Accounting Review 78 (2003): 611 – 639. Ashbaugh-Skaife, H., D. W. Collins, W. R. Kinney, and R. LaFond. “The effect of SOX internal
control deficiencies and their remediation on accrual quality.” The Accounting Review 83 (2008): 217 – 250.
Asthana, S., and J. Krishnan. “Factors associated with the early adoption of the SEC’s revised auditor fee disclosure rules.” Auditing: A Journal of Practice & Theory 25 (2006): 41 – 51.
Barney, J. “Firm resources and sustained competitive advantage.” Journal of Management 17 (1991): 99 – 120.
Battalio, R. H., A. Lerman, J. Livnat, and R. R. Mendenhall. “Who, if anyone, reacts to accrual information?” Journal of Accounting and Economics 53 (2012): 205 – 224.
Baxter, R., J. C. Bedard, R. Hoitash, and A. Yezegel. “Enterprise risk management program quality: Determinants, value relevance, and the financial crisis.” Contemporary
Accounting Research 30 (2013): 1264 – 1295. Becker, G. S. Human capital. New York: Columbia, 1964. Bedard, J. C., R. Hoitash, U. Hoitash, and K. Westermann. “Material weakness remediation and
earnings quality: A detailed examination by type of control deficiency.” Auditing: A
Journal of Practice & Theory 31 (2012.): 57 – 78. Bell, T., M. Causholli, and W. R. Knechel. “Audit firm tenure, non-audit services and internal
assessments of audit quality.” Working paper, University of North Florida, University of Kentucky, University of Florida, 2014.
Biddle, G. C., and G. Hilary. “Accounting quality and firm-level capital investment.” The
Accounting Review 81 (2006): 963 – 982. Bonroy, O., and C. Constantatos. “On the use of labels in credence goods markets.” Journal of
Regulatory Economics 33 (2008): 237 – 252. Bolton, P., X. Freixas, and J. Shapiro. “Conflicts of interest, information provision, and
competition in the financial services industry.” Journal of Financial Economics 85 (2007): 297 – 330.
Bushee, B. J., and C. F. Noe. “Corporate disclosure practices, institutional investors, and stock return volatility.” Journal of Accounting Research 38 (2000): 171 – 202.
Cahan, S. F., J. M. Godfrey, J. Hamilton, and D. C. Jeter. “Auditor specialization, auditor dominance, and audit fees: The role of investment opportunities.” The Accounting
Review 83 (2008): 1393 – 1423.

38
Callen, J. L., D. Segal, and O. Hope. “The pricing of conservative accounting and the measurement of conservatism at the firm-year level.” Review of Accounting Studies 15 (2010): 145 – 178.
Causholli, M., and W. R. Knechel. “An examination of the credence attributes of an audit.” Accounting Horizons 26 (2012): 631 – 656.
Chang, K., D. Chichernea, and H. Hassab. “On the DuPont analysis in the healthcare industry.” Journal of Accounting and Public Policy 33 (2014): 83-103
Chang, Y., and S. Kim. “Heterogeneity and aggregation: Implications for labor-market fluctuations.” The American Economic Review 97 (2007): 1939 – 1956.
Chen, S., S. Y. J. Sun, and D. Wu. “Client importance, institutional improvements, and audit quality in China: An office and individual auditor level analysis.” The Accounting
Review 85 (2010): 127 – 158. Cheng, M., D. Dhaliwal, and Y. Zhang. “Does investment efficiency improve after the disclosure
of material weaknesses in internal control over financial reporting?” Journal of
Accounting and Economics 56 (2013): 1 – 18. Chung, H., and S. Kallapur. “Client importance, nonaudit services, and abnormal accruals.” The
Accounting Review 78 (2003): 931 – 955. Ciconte, W. C., M. P. Donohoe, P. Lisowsky, and M. A. Mayberry. “Predictable uncertainty:
The relation between unrecognized tax benefits and future income tax cash outflows.” Working Paper, University of Florida, University of Illinois at Urbana-Champaign, 2014.
Collins, D. L., F. J. Roman, and H. C. Chan. “An empirical investigation of the relationship between profitability persistence and firms’ choice of business model: Evidence from the US airline industry.” Journal of Management Accounting Research 23 (2011): 37 – 70.
Committee on Sponsoring Organizations of the Treadway Commission. COSO report: Internal
control – an integrated framework. New York: AICPA, 1992. Committee on Sponsoring Organizations of the Treadway Commission. Executive summary:
Enterprise risk management – integrated framework. New York: AICPA, 2004. Comprix, J., R. C. Graham, and J. A. Moore. “Empirical evidence on the impact of book-tax
differences on divergence of opinion among investors.” Journal of the American
Taxation Association 33 (2011): 51 – 78. Conner, K. “A historical comparison of resource-based theory and five schools of thought within
industrial organization economics: Do we have a new theory of the firm?” Journal of
Management 17 (1991): 121 – 154. Cook, K. A., G. R. Huston, and T. C. Omer. “Earnings management through effective tax rates:
The effects of tax-planning investment and the Sarbanes-Oxley Act of 2002.” Contemporary Accounting Research 25 (2008): 447 – 471.
Darby, M. R., and E. Karni. “Free competition and the optimal amount of fraud.” Journal of Law
and Economics 16 (1973): 67 – 88. Davis, L. R., D. N. Ricchiute, and G. Trompeter. “Audit effort, audit fees, and the provision of
nonaudit services to audit clients.” The Accounting Review 68 (1993): 135 – 150. DeAngelo, L. E. “Auditor size and audit quality.” Journal of Accounting and Economics 3
(1981): 183 – 199. Dechow, P., R. Sloan, and A. Sweeney. “Detecting Earnings Management.” Accounting Review
70 (1995): 193-225 DeFond, M. L., and J. Jiambalvo. “Debt Covenant Violation and Manipulation of Accruals.”
Journal of Accounting & Economics 17 (1994): 145-176

39
DeFond, M. L., K. Raghunandan, and K. R. Subramanyam. “Do non-audit service fees impair auditor independence? Evidence from going concern audit opinions.” Journal of
Accounting Research 40 (2002): 1247 – 1274. Denis, D. J., and D. K. Denis. “Performance changes following top management dismissals.”
The Journal of Finance 50 (1995): 1029 – 1057. Dickinson, V. “Cash flow patterns as a proxy for firm life cycle.” The Accounting Review 86
(2011): 1969 – 1994. Drucker, P. F. Management. New York: Harper & Row, 1973. Donohoe, M. P., and W. R. Knechel. “Does corporate tax aggressiveness influence audit
pricing?” Contemporary Accounting Research (2013): forthcoming. Dulleck, U., and R. Kerschbamer. “On doctors, mechanics, and computer specialists: The
economics of credence goods.” Journal of Economic Literature 44 (2006): 5 – 42. Earle, J. S., and J. Pencavel. “Hours of work and trade unionism.” Journal of Labor Economics 8
(1990): 150 – 174. Elder, R., D. Harris, and J. Zhou. “The Effects of Auditor Tax Consulting on Firms’ Tax
Internal Controls.” Working Paper, University of Syracuse, 2008. Ernst & Young (EY). Global Review. (2013)
http://www.ey.com/Publication/vwLUAssets/EY_Global_review_2013/$FILE/EY_Global_review_2013.pdf . April 30, 2014.
Fairfield, P. M., and T. L. Yohn. “Using asset turnover and profit margin to forecast changes in profitability.” Review of Accounting Studies 6 (2001): 371 – 385.
Ferguson, M. J., G. S. Seow, and D. Young. “Nonaudit services and earnings management: UK evidence.” Contemporary Accounting Research 21 (2004): 813 – 841.
Francis, J. R. “Are auditors compromised by nonaudit services? Assessing the evidence.” Contemporary Accounting Research 23 (2006): 747 – 760.
Francis, J. R., and M. Yu. “Big 4 office size and audit quality.” The Accounting Review 84 (2009): 1521 – 1552.
Francis, J. R., E. Maydew, and C. Sparks. “The role of Big 6 auditors in the credible reporting of accruals.” Auditing: A Journal of Practice & Theory 18 (1999): 17 – 34.
Frankel, R. M., M. F. Johnson, K. K. Nelson. “The relation between auditors’ fees for nonaudit services and earnings management.” The Accounting Review 77 (2002): 71 – 105.
Gali, J., M. Gertler, and J. D. Lopez-Salido. “Markups, gaps, and the welfare costs of business fluctuations.” The Review of Economics and Statistics 89 (2007): 44 – 59.
Gallouj, C. “Asymmetry of information and the service relationship: Selection and evaluation of the service provider.” International Journal of Service Industry Management 8 (1997): 42 – 64.
Lara, J. M. G., B. C. Osma, and F. Penalva. “Conditional conservatism and cost of capital.” Review of Accounting Studies 16 (2011): 247 – 271.
Gaynor, L. M., L. S. McDaniel, and T. L. Neal. “The effects of joint provision and disclosure of nonaudit services on audit committee members’ decisions and investors’ preferences.” The Accounting Review 81 (2006): 873 – 896.
Gilberto, S. M., and N. P. Varaiya. “The winner’s curse and bidder competition in acquisitions: Evidence from failed bank auctions.” The Journal of Finance 44 (1989): 59 – 75.
Goldman, A., and B. Barlev. “The auditor-firm conflict of interests: Its implications for independence.” The Accounting Review 49 (1974): 707 – 718.

40
Guiltinan, J. P. “The price bundling of services: A normative framework.” Journal of Marketing 51 (1987): 74 – 85.
Gustafson, D. P., and N. J. Di Marco. “The management consultant selection process.” Academy
of Management Proceedings (1973): 166 – 172. Hall, R. E. “Macroeconomic fluctuations and the allocation of time.” Journal of Labor
Economics 15 (1997): 223 – 250. Harford, J. “Corporate cash reserves and acquisitions.” The Journal of Finance 54 (1999): 1969
– 1997. Hay, D. C., W. R. Knechel, and N. Wong. “Audit Fees: A meta-analysis of the effect of supply
and demand attributes.” Contemporary Accounting Research 23 (2006): 141 – 191. Heckman, J. J. “Sample selection bias as a specification error.” Econometrica: Journal of the
econometric society 47 (1979): 153 – 161. Hitt, M. A., L. Bierman, K. Shimizu, and R. Kochhar. “Direct and moderating effects of human
capital on strategy and performance in professional service firms: A resource-based perspective.” Academy of Management Journal 44 (2001): 13 – 28.
Hitt, M. A., and R. D. Ireland. “Relationships among corporate level distinctive competencies, diversification strategy, corporate structure and performance.” Journal of Management
Studies 23 (1986): 401 – 416. International Federation of Accountants (IFAC). International standard on auditing 315
Identifying and assessing the risks of material misstatement through understanding the
entity and its environment. New York, NY: IFAC, 2009. Jones, J. “Earnings Management During Import Relief Investigation.” Accounting Review 29
(1991): 193-228 Khurana, I. K., and K. K. Raman. “Do investors care about the auditor’s economic dependence
on the client?” Contemporary Accounting Research 23 (2006): 977 – 1016. Kinney, W. R., Z. Palmrose, and S. Scholz. “Auditor independence, non-audit services, and
restatements: Was the U.S. government right?” Journal of Accounting Research 42 (2004): 561 – 588.
Klein, B., and K. B. Leffler. “The role of market forces in assuring contractual performance.” Journal of Political Economy 89 (August 1981): 615-641.
Knechel, W. R. “The business risk audit: Origins, obstacles and opportunities.” Accounting,
Organizations and Society 32 (2007): 383 – 408. Knechel, W. R., and D. S. Sharma. “Auditor-provided nonaudit services and audit effectiveness
and efficiency: Evidence from pre- and post-SOX audit report lags.” Auditing: A Journal of
Practice & Theory 31 (2012): 85 – 114. Knechel, W. R., G. V. Krishnan, M. Pevzner, L. B. Shefchik, and U. K. Velury. “Audit Quality:
Insights from the Academic Literature.” Auditing: A Journal of Practice & Theory 32 (2013): 385 – 421.
Knechel, W. R., L. Niemi, and S. Sundgren. “Determinants of auditor choice: Evidence from a small client market.” International Journal of Auditing 12 (2008): 65 – 88.
Knechel, W. R., D. S. Sharma, and V. D. Sharma. “Non-audit services and knowledge spillovers: Evidence from New Zealand.” Journal of Business Finance & Accounting 39 (2012): 60 – 81.
Kothari, S. P., A. Leone, and C. Wasley. “Performance matched discretionary accrual measures.” Journal of Accounting & Economics 39 (2005): 201-301
KPMG. International Annual Review. (2012)

41
http://www.kpmg.com/Global/en/about/international-annual-review/previous/Documents/kpmg-international-annual-review-2012.pdf. April 30, 2014.
KPMG Audit Committee Institute. Audit Committee Priorities for 2013. (2012) www.kpmg.com/aci. April 21, 2014.
Kubick, T., D. Lynch, M. Mayberry, and T. Omer. “Product Market Power and Tax Avoidance: Market Leaders, Mimicking Strategies, and Stock Returns.” Working Paper, Kansas University, University of Wisconsin-Madison, University of Florida, University of Nebraska, 2014.
Larcker, D. F., and T. O. Rusticus. “On the use of instrumental variables in accounting research.” Journal of Accounting and Economics 49 (2010): 186 – 205.
Levitt, A. “Renewing the covenant with investors.” Speech at the New York University Center for Law and Business, New York, May 10, 2000.
McGuire, S. T., T. C. Omer, and D. Wang. “Tax Avoidance: Does Tax-Specific Industry Expertise Make a Difference?” The Accounting Review 87 (2012): 975–1003.
McShane, M. K., A. Nair, and E. Rustambekov. “Does enterprise risk management increase firm value?” Journal of Accounting, Auditing and Finance 26 (2011): 641 – 658.
Messier, W. F., S. M. Glover, and D. F. Prawitt. Auditing and Assurance Services: A Systematic
Approach (9th ed.). New York, NY: McGraw Hill/Irwin, 2014. Minton, B. A., and C. Schrand. “The impact of cash flow volatility on discretionary investment
and the costs of debt and equity financing.” Journal of Financial Economics 54 (1999): 425 – 460.
Moeller, S., F. Schlingemann, and R. Stulz. “Firm size and the gains from acquisitions.” Journal
of Financial Economics 73 (2004): 201 – 228. Nam, S. and J. Ronen. “The Impact of Nonaudit Services on Capital Markets.” Journal of
Accounting, Auditing & Finance 27 (2012): 32-60 Nippa, M. C., and K. Petzold. “Economic functions of management consulting firms – an
integrative theoretical framework.” Academy of Management Proceedings (2002): B1 – B6. Nocco, B. W., and R. M. Stulz. “Enterprise risk management: Theory and practice.” Journal of
Applied Corporate Finance 18 (2006): 8 – 20. Omer, T. C., J. C. Bedard, and D. Falsetta. “Auditor-Provided Tax Services: The Effects of a
Changing Regulatory Environment.” The Accounting Review 81 (2006): 1095–1117. Palmrose, Z. “The Effect of Nonaudit Services on the Pricing of Audit Services: Further
Evidence.” Journal of Accounting Research 24 (1986): 405–411. Patatoukas, P. N. “Customer-base concentration: Implications for Firm Performance and Capital
Markets.” The Accounting Review 87 (2012): 363 – 392. Paterson, J. S., and A. Valencia. “The effects of recurring and nonrecurring tax, audit-related,
and other nonaudit services on auditor independence.” Contemporary Accounting
Research 28 (2011): 1510 – 1536. Perez-Gonzalez, F. “Inherited control and firm performance.” The American Economic Review
96 (2006): 1559 – 1588. Pesendorfer, W., and A. Wolinsky. “Second opinions and price competition: Inefficiency in the
Market for Expert Advice.” Review of Economic Studies 70 (2003): 417 – 437. Petersen, M.A. “Estimating Standard Errors in Finance Panel Data Sets: Comparing
Approaches.” Review of Financial Studies 22 (2009): 435-480. Piotroski, J. D. “Value investing: The use of historical financial statement information to
separate winners from losers.” Journal of Accounting Research 38 (2000): 1 – 41.
42
Pittman, J. A., and S. Fortin. “Auditor choice and the cost of debt capital for newly public firms.” Journal of Accounting and Economics 37 (2004): 113 – 136.
Prawitt, D. F., N. Y. Sharp, and D. A. Wood. “Internal audit outsourcing and the risk of misleading or fraudulent financial reporting: Did Sarbanes-Oxley get it wrong?” Contemporary Accounting Research 29 (2012): 1109 – 1136.
Public Company Accounting Oversight Board (PCAOB). Auditing standard no. 12 Identifying
and assessing risks of material misstatement. New York, NY: PCAOB, 2010. Ruddock, C., S. J. Taylor, and S. L. Taylor. “Nonaudit services and earnings conservatism: Is
auditor independence impaired?” Contemporary Accounting Research 23 (2006): 701 – 746.
Salop, S., and J. Stiglitz. “Bargains and ripoffs: A model of monopolistically competitive price dispersion.” Review of Economic Studies 44 (1977): 493 – 510.
Sarbanes-Oxley Act of 2002. Pub. L. no 107-204. 2002. Schmidt, J. J. “Perceived auditor independence and audit litigation: The role of nonaudit service
fees.” The Accounting Review 87 (2012): 1033 – 1065. Schneider, H. S. “Agency problems and reputation in expert services: Evidence from auto
repair.” The Journal of Industrial Economics 60 (2012): 406 – 433. Schulte, A. A. “Management services: A challenge to audit independence?” The Accounting
Review 41 (1966): 721 – 728. Securities and Exchange Commission (SEC). Revision of the Commission’s Auditor
Independence Requirements. Release Nos. 33-7919; 34-43602; 35-27279; IC-24744; IA-1911; FR-56; file no. S7-13-00. Washington, DC: SEC, 2000.
Simunic, D. “The pricing of audit services: Theory and evidence.” Journal of Accounting
Research 18 (1980): 161 – 190. -----. “Auditing, consulting, and audit independence.” Journal of Accounting Research 22
(1984): 679 – 702. Slater, S. F. “Developing a customer value-based theory of the firm.” Journal of the Academy of
Marketing Sciences 25 (1997): 162 – 167. Soliman, M. T. “The use of DuPont analysis by market participants.” The Accounting Review 83
(2008): 823 – 853. Stanley, J. D. “Is the audit fee disclosure a leading indicator of clients’ business risk?” Auditing:
A Journal of Practice and Theory 30 (2011): 157 – 179. Sterling, A. D. “Friendships and search behavior in labor markets.” Management Science (2014):
forthcoming. Suddaby, R., Y. Gendron, and H. Lam. “The organizational context of professionalism in
accounting.” Accounting, Organizations and Society 34 (2009): 409 – 427. Swartz, T. A., and S. W. Brown. “Consumer and provider expectations and experiences in
evaluating professional service quality.” Journal of the Academy of Marketing Science 17 (1989): 189 – 195.
Tomer, J. F. Organizational capital: The path to higher productivity and well-being. New York: Praeger, 1987.
Whisenant, S., S. Sankaraguruswamy, and K. Raghunandan. “Evidence on the joint determination of audit and non-audit fees.” Journal of Accounting Research 41 (2003): 721 – 744.
Williamson, O. Markets and hierarchies. New York: Free Press, 1975.

43
Wolinsky, A. “Competition in a market for informed experts’ services.” The RAND Journal of
Economics 24 (1993) 380 – 398.
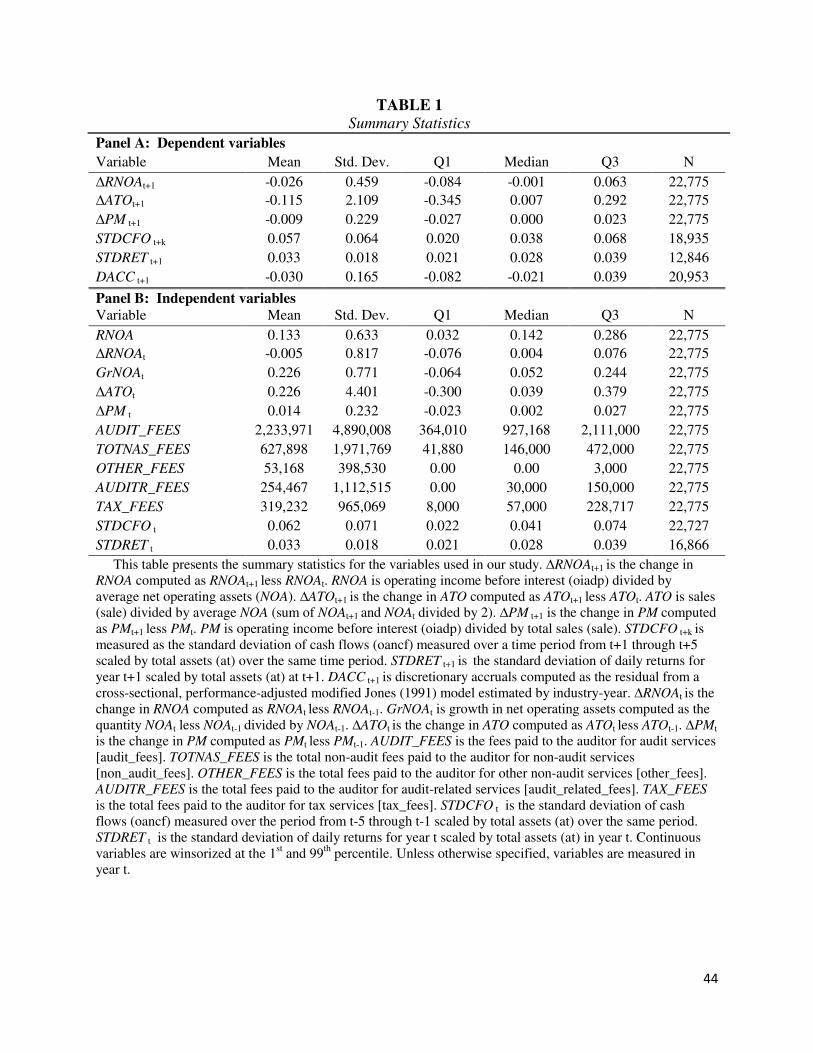
44
TABLE 1
Summary Statistics
Panel A: Dependent variables
Variable Mean Std. Dev. Q1 Median Q3 N
∆RNOAt+1 -0.026 0.459 -0.084 -0.001 0.063 22,775
∆ATOt+1 -0.115 2.109 -0.345 0.007 0.292 22,775
∆PM t+1 -0.009 0.229 -0.027 0.000 0.023 22,775
STDCFO t+k 0.057 0.064 0.020 0.038 0.068 18,935
STDRET t+1 0.033 0.018 0.021 0.028 0.039 12,846
DACC t+1 -0.030 0.165 -0.082 -0.021 0.039 20,953
Panel B: Independent variables
Variable Mean Std. Dev. Q1 Median Q3 N
RNOA 0.133 0.633 0.032 0.142 0.286 22,775
∆RNOAt -0.005 0.817 -0.076 0.004 0.076 22,775
GrNOAt 0.226 0.771 -0.064 0.052 0.244 22,775
∆ATOt 0.226 4.401 -0.300 0.039 0.379 22,775
∆PM t 0.014 0.232 -0.023 0.002 0.027 22,775
AUDIT_FEES 2,233,971 4,890,008 364,010 927,168 2,111,000 22,775
TOTNAS_FEES 627,898 1,971,769 41,880 146,000 472,000 22,775
OTHER_FEES 53,168 398,530 0.00 0.00 3,000 22,775
AUDITR_FEES 254,467 1,112,515 0.00 30,000 150,000 22,775
TAX_FEES 319,232 965,069 8,000 57,000 228,717 22,775
STDCFO t 0.062 0.071 0.022 0.041 0.074 22,727
STDRET t 0.033 0.018 0.021 0.028 0.039 16,866
This table presents the summary statistics for the variables used in our study. ∆RNOAt+1 is the change in RNOA computed as RNOAt+1 less RNOAt. RNOA is operating income before interest (oiadp) divided by average net operating assets (NOA). ∆ATOt+1 is the change in ATO computed as ATOt+1 less ATOt. ATO is sales (sale) divided by average NOA (sum of NOAt+1 and NOAt divided by 2). ∆PM t+1 is the change in PM computed as PMt+1 less PMt. PM is operating income before interest (oiadp) divided by total sales (sale). STDCFO t+k is measured as the standard deviation of cash flows (oancf) measured over a time period from t+1 through t+5 scaled by total assets (at) over the same time period. STDRET t+1 is the standard deviation of daily returns for year t+1 scaled by total assets (at) at t+1. DACC t+1 is discretionary accruals computed as the residual from a cross-sectional, performance-adjusted modified Jones (1991) model estimated by industry-year. ∆RNOAt is the change in RNOA computed as RNOAt less RNOAt-1. GrNOAt is growth in net operating assets computed as the quantity NOAt less NOAt-1 divided by NOAt-1. ∆ATOt is the change in ATO computed as ATOt less ATOt-1. ∆PMt
is the change in PM computed as PMt less PMt-1. AUDIT_FEES is the fees paid to the auditor for audit services [audit_fees]. TOTNAS_FEES is the total non-audit fees paid to the auditor for non-audit services [non_audit_fees]. OTHER_FEES is the total fees paid to the auditor for other non-audit services [other_fees]. AUDITR_FEES is the total fees paid to the auditor for audit-related services [audit_related_fees]. TAX_FEES is the total fees paid to the auditor for tax services [tax_fees]. STDCFO t is the standard deviation of cash flows (oancf) measured over the period from t-5 through t-1 scaled by total assets (at) over the same period. STDRET t is the standard deviation of daily returns for year t scaled by total assets (at) in year t. Continuous variables are winsorized at the 1
st and 99
th percentile. Unless otherwise specified, variables are measured in
year t.

45
TABLE 2
Correlations
(1) (2) (3) (4) (5) (6) (7) (8) (9) (10) (11) (12) (13) (14) (15) (16) (17) (18)
(1) ∆RNOAt+1 1.00 0.34 0.28 -0.29 -0.14 -0.17 -0.09 0.01 0.01 0.02 0.01 0.01 0.01 -0.03 -0.07 0.00 0.02 0.08
(2) ∆ATOt+1 0.53 1.00 0.13 -0.19 -0.05 -0.65 -0.22 -0.02 0.01 0.01 0.01 0.02 0.01 -0.06 0.00 -0.03 0.04 0.07
(3) ∆PM t+1 0.73 0.35 1.00 -0.12 -0.04 -0.04 -0.01 -0.02 0.01 0.00 0.00 0.00 0.01 0.01 -0.04 -0.01 0.02 0.12
(4) RNOA -0.23 -0.21 -0.21 1.00 0.28 0.13 0.08 -0.07 0.08 0.06 0.04 0.02 0.06 -0.23 -0.33 -0.25 -0.25 -0.17
(5) ∆RNOAt -0.02 -0.02 -0.02 0.27 1.00 0.07 0.29 0.17 0.01 0.00 0.00 0.00 0.00 0.01 -0.07 -0.05 -0.02 -0.02
(6) GrNOAt -0.28 -0.70 -0.15 0.32 0.11 1.00 0.19 0.07 -0.03 -0.02 -0.01 0.00 -0.03 0.12 0.00 0.00 -0.06 -0.07
(7) ∆ATOt 0.00 -0.07 0.03 0.12 0.53 0.15 1.00 0.08 0.00 -0.01 0.00 -0.01 -0.01 0.03 0.01 -0.01 0.00 0.00
(8) ∆PM t 0.02 0.02 0.00 0.20 0.71 0.07 0.34 1.00 -0.02 -0.01 -0.01 0.00 -0.01 0.11 0.06 0.00 0.04 0.02
(9) AUD_FEES 0.02 -0.01 0.01 0.21 0.00 -0.01 -0.02 -0.02 1.00 0.71 0.62 0.20 0.64 -0.16 -0.17 -0.18 -0.20 -0.03
(10) TOTNAS 0.01 -0.03 0.01 0.21 0.01 0.04 0.00 -0.01 0.67 1.00 0.88 0.36 0.87 -0.12 -0.12 -0.15 -0.16 -0.02
(11) AR_FEES 0.00 -0.03 0.01 0.14 0.02 0.05 0.01 0.00 0.51 0.68 1.00 0.20 0.55 -0.09 -0.09 -0.11 -0.11 -0.01
(12) OTH_FEES 0.00 -0.01 0.00 0.04 0.00 0.02 0.00 0.01 0.12 0.17 0.02 1.00 0.20 -0.03 -0.03 -0.04 -0.05 0.00
(13) TX_FEES 0.01 0.00 0.01 0.18 0.01 -0.01 0.00 0.00 0.51 0.80 0.31 0.07 1.00 -0.13 -0.12 -0.15 -0.16 -0.03
(14) STDCFO t -0.02 -0.03 0.00 -0.15 -0.02 0.03 0.00 0.02 -0.31 -0.28 -0.24 -0.03 -0.24 1.00 0.36 0.26 0.28 0.04
(15) STDCFO t+k -0.06 -0.01 -0.04 -0.19 -0.05 -0.05 0.00 -0.02 -0.33 -0.28 -0.22 -0.04 -0.22 0.37 1.00 0.29 0.27 0.06
(16) STDRET t+1 -0.07 -0.05 -0.04 -0.34 -0.06 -0.06 -0.04 -0.04 -0.31 -0.32 -0.26 -0.06 -0.28 0.35 0.32 1.00 0.55 0.07
(17) STDRET t 0.02 0.04 0.04 -0.38 -0.06 -0.16 -0.04 -0.02 -0.36 -0.34 -0.29 -0.05 -0.28 0.36 0.31 0.65 1.00 0.11
(18) DACC t+1 0.14 0.14 0.17 -0.22 -0.02 -0.13 0.02 0.00 -0.08 -0.08 -0.04 -0.02 -0.07 0.02 0.07 0.08 0.09 1.00
This table reports Pearson (Spearman) correlations above (below) the diagonal. All correlations significant at the 0.01 level are bolded. ∆RNOAt+1 is the change in RNOA computed as RNOAt+1 less RNOAt. RNOA is operating income before interest (oiadp) divided by average net operating assets (NOA). ∆ATOt+1 is the change in ATO computed as ATOt+1 less ATOt. ATO is sales (sale) divided by average NOA (sum of NOAt+1 and NOAt divided by 2). ∆PM t+1 is the change in PM computed as PMt+1 less PMt. PM is operating income before interest (oiadp) divided by total sales (sale). ∆RNOAt is the change in RNOA computed as RNOAt less RNOAt-1. GrNOAt is growth in net operating assets computed as the quantity NOAt less NOAt-1 divided by NOAt-1. ∆ATOt is the change in ATO computed as ATOt less ATOt-1. ∆PMt is the change in PM computed as PMt less PMt-1. AUD_FEES is the fees paid to the auditor for audit services [audit_fees] measured in scaled decile ranks. TOTNAS is the total non-audit fees paid to the auditor for non-audit services [non_audit_fees] measured in scaled decile ranks. OTH_FEES is the total fees paid to the auditor for other non-audit services [other_fees] measured in scaled decile ranks. AR_FEES is the total fees paid to the auditor for audit-related services [audit_related_fees] measured in scaled decile ranks. TX_FEES is the total fees paid to the auditor for tax services [tax_fees] measured in scaled decile ranks. STDCFO t is the standard deviation of cash flows (oancf) measured over the period from t-5 through t-1 scaled by total assets (at) over the same period. STDCFO t+k is measured as the standard deviation of cash flows (oancf) measured over a time period from t+1 through t+5 scaled by total assets (at) over the same time period. STDRET t+1 is the standard deviation of daily returns for year t+1 scaled by total assets (at) at t+1. STDRET t is the standard deviation of daily returns for year t scaled by total assets (at) in year t. DACC t+1 is discretionary accruals computed as the residual from a cross-sectional, performance-adjusted modified Jones (1991) model estimated by industry-year.

46
TABLE 3
OLS Regression of Operating Performance on Non-audit Fees and Controls
(1) (2) (3) (4) (5) (6) ∆RNOAt+1 ∆RNOAt+1 ∆ATOt+1 ∆ATOt+1 ∆PM t+1 ∆PM t+1
Coefficient Coefficient Coefficient Coefficient Coefficient Coefficient
Variables p-value p-value p-value p-value p-value p-value
RNOA -0.216*** -0.216*** -0.372*** -0.369*** -0.041*** -0.041*** (-14.751) (-14.716) (-10.052) (-9.948) (-6.061) (-6.074) ∆RNOAt -0.025** -0.025** 0.060* 0.060* -0.002 -0.002 (-2.307) (-2.310) (1.934) (1.922) (-0.400) (-0.397) GrNOAt -0.057*** -0.056*** -1.676*** -1.676*** -0.005 -0.005 (-5.867) (-5.776) (-39.251) (-39.157) (-1.482) (-1.409) ∆ATOt -0.002 -0.002 -0.050*** -0.051*** 0.000 0.000 (-1.376) (-1.392) (-7.681) (-7.687) (0.808) (0.799) ∆PM t 0.039 0.039 0.159** 0.158** -0.028 -0.028 (1.257) (1.248) (2.490) (2.474) (-1.068) (-1.070) AUD_FEES 0.062*** 0.070*** -0.047 0.013 0.035*** 0.034*** (4.809) (5.788) (-1.028) (0.299) (5.344) (5.303) TOTNAS 0.053*** 0.169*** 0.005 (4.085) (3.673) (0.812) OTH_FEES -0.007 0.010 0.000 (-0.866) (0.367) (0.092) AR_FEES 0.018* 0.102*** -0.002 (1.872) (2.824) (-0.315) TX_FEES 0.038*** -0.009 0.010** (3.665) (-0.211) (2.060) Constant -0.041 -0.043 0.351*** 0.361*** -0.015 -0.017 (-1.490) (-1.544) (2.649) (2.775) (-0.755) (-0.818) Year FE Included Included Included Included Included Included Industry FE Included Included Included Included Included Included Observations 22,775 22,775 22,775 22,775 22,775 22,775 Adj. R2 0.118 0.118 0.436 0.436 0.0233 0.0233 This table presents ordinary least squares regressions of equation (1). The dependent variable ∆RNOAt+1 is the change in RNOA computed as RNOAt+1 less RNOAt. RNOA is operating income before interest (oiadp) divided by average net operating assets (NOA). The dependent variable ∆ATOt+1 is the change in ATO computed as ATOt+1 less ATOt. ATO is sales (sale) divided by average NOA (sum of NOAt+1 and NOAt divided by 2). The dependent variable ∆PM t+1 is the change in PM computed as PMt+1 less PMt. PM is operating income before interest (oiadp) divided by total sales (sale). We define all other variables in Table 1 and the Appendix. Industry fixed-effects (not tabulated) are estimated using 2-digit SIC codes. All t-statistics are presented below the coefficients in parentheses. We estimate all test statistics with robust standard errors clustered by firm consistent with Petersen [2009]. The symbols *, **, and *** denote statistical significance at the 0.10, 0.05, and 0.01 levels, respectively.

47
TABLE 4
OLS Regression of Operating Risk on Non-audit Fees and Controls
(1) (2) (3) (4) STDCFO t+k STDCFO t+k STDRET t+1 STDRET t+1 Coefficient Coefficient Coefficient Coefficient
Variables p-value p-value p-value p-value
STDCFO t 0.219*** 0.219*** (13.711) (13.695) STDRET t 0.527*** 0.527*** (28.263) (28.184) RNOA -0.023*** -0.023*** -0.004*** -0.004*** (-11.860) (-11.849) (-11.908) (-11.898) ∆RNOAt 0.000 0.000 0.000 0.000 (0.154) (0.170) (0.509) (0.525) GrNOAt -0.002** -0.002*** 0.000*** 0.000*** (-2.434) (-2.627) (2.812) (2.799) ∆ATOt 0.000 0.000 0.000 0.000 (1.552) (1.563) (1.549) (1.521) ∆PM t -0.001 -0.001 -0.002*** -0.003*** (-0.270) (-0.262) (-2.591) (-2.614) AUD_FEES -0.034*** -0.035*** -0.006*** -0.006*** (-11.925) (-12.269) (-11.367) (-11.410) TOTNAS -0.012*** -0.002*** (-5.098) (-3.820) OTH_FEES 0.001 0.000 (1.002) (0.272) AR_FEES -0.005*** -0.001*** (-3.058) (-3.183) TX_FEES -0.009*** -0.001*** (-4.760) (-3.317) Constant 0.069*** 0.070*** 0.014*** 0.014*** (11.025) (11.275) (6.529) (6.601) Year FE Included Included Included Included Industry FE Included Included Included Included Observations 18,898 18,898 12,846 12,846 Adj. R2 0.273 0.273 0.559 0.560 This table presents ordinary least squares regressions of equation (2). The dependent variable STDCFO t+k is measured as the standard deviation of cash flows (oancf) measured over a time period from t+1 through t+5 scaled by total assets (at) over the same time period. The dependent variable STDRET t+1 is the standard deviation of daily returns for year t+1 scaled by total assets (at) at t+1. We define all other variables in Table 1 and the Appendix. Industry fixed-effects (not tabulated) are estimated using 2-digit SIC codes. All t-statistics are presented below the coefficients in parentheses. We estimate all test statistics with robust standard errors clustered by firm consistent with Petersen [2009]. The symbols *, **, and *** denote statistical significance at the 0.10, 0.05, and 0.01 levels, respectively.

48
TABLE 5
OLS Regression of Operating Performance on Non-audit Fees and Controls by Firm Size
Panel A: Small Firms (Lowest Tercile of Firm Size) (1) (2) (3) (4) (5) (6) ∆RNOAt+1 ∆RNOAt+1 ∆ATOt+1 ∆ATOt+1 ∆PM t+1 ∆PM t+1
Coefficient Coefficient Coefficient Coefficient Coefficient Coefficient
Variables p-value p-value p-value p-value p-value p-value
RNOA -0.197*** -0.198*** -0.338*** -0.334*** -0.041*** -0.041*** (-10.669) (-10.653) (-7.344) (-7.232) (-4.639) (-4.662) ∆RNOAt -0.025* -0.024* 0.054 0.053 -0.006 -0.006 (-1.819) (-1.811) (1.472) (1.456) (-0.765) (-0.752) GrNOAt 0.047*** 0.049*** -2.025*** -2.029*** -0.007 -0.007 (2.711) (2.784) (-29.054) (-28.999) (-1.083) (-0.992) ∆ATOt -0.005** -0.005** -0.056*** -0.056*** 0.000 0.000 (-2.141) (-2.162) (-6.687) (-6.675) (0.120) (0.100) ∆PM t 0.041 0.041 0.182** 0.184** -0.018 -0.018 (1.039) (1.030) (2.289) (2.319) (-0.553) (-0.557) AUD_FEES -0.069 -0.060 0.254* 0.319** 0.063*** 0.060** (-1.378) (-1.264) (1.663) (2.183) (2.584) (2.533) TOTNAS 0.104*** 0.295** 0.014 (2.600) (2.306) (0.774) OTH_FEES -0.029 -0.013 0.003 (-1.309) (-0.182) (0.251) AR_FEES 0.038 0.288*** -0.003 (1.232) (2.899) (-0.202) TX_FEES 0.088** 0.034 0.030* (2.442) (0.302) (1.833) Constant -0.068 -0.069 0.737** 0.714** -0.029 -0.032 (-0.847) (-0.844) (2.380) (2.411) (-0.533) (-0.583) Year FE Included Included Included Included Included Included Industry FE Included Included Included Included Included Included Observations 7,616 7,616 7,616 7,616 7,616 7,616 Adj. R2 0.0861 0.0861 0.455 0.455 0.0213 0.0214

49
Panel B: Midsize Firms (Middle Tercile of Firm Size) (1) (2) (3) (4) (5) (6) ∆RNOAt+1 ∆RNOAt+1 ∆ATOt+1 ∆ATOt+1 ∆PM t+1 ∆PM t+1
Coefficient Coefficient Coefficient Coefficient Coefficient Coefficient
Variables p-value p-value p-value p-value p-value p-value
RNOA -0.273*** -0.273*** -0.544*** -0.543*** -0.050*** -0.050*** (-8.272) (-8.278) (-6.289) (-6.306) (-3.809) (-3.798) ∆RNOAt -0.034* -0.034* 0.048 0.049 0.009 0.009 (-1.689) (-1.696) (0.690) (0.704) (0.859) (0.854) GrNOAt -0.107*** -0.106*** -1.481*** -1.480*** -0.001 -0.001 (-7.756) (-7.693) (-23.740) (-23.639) (-0.241) (-0.245) ∆ATOt 0.001 0.001 -0.044*** -0.044*** -0.000 -0.000 (0.291) (0.286) (-3.190) (-3.202) (-0.074) (-0.072) ∆PM t 0.010 0.010 0.377*** 0.375*** -0.039 -0.039 (0.165) (0.163) (2.930) (2.919) (-0.650) (-0.655) AUD_FEES 0.076*** 0.079*** -0.148 -0.105 0.025* 0.024* (3.131) (3.210) (-1.562) (-1.075) (1.865) (1.734) TOTNAS 0.023 0.117* 0.010 (1.275) (1.675) (1.037) OTH_FEES 0.003 0.080* 0.001 (0.295) (1.651) (0.185) AR_FEES -0.008 0.003 0.010 (-0.595) (0.050) (1.463) TX_FEES 0.021 -0.042 0.009 (1.290) (-0.691) (1.037) Constant 0.030 0.034 0.336** 0.357** 0.020 0.016 (0.859) (0.930) (2.029) (2.259) (0.665) (0.540) Year FE Included Included Included Included Included Included Industry FE Included Included Included Included Included Included Observations 7,565 7,565 7,565 7,565 7,565 7,565 Adj. R2 0.227 0.227 0.472 0.472 0.0236 0.0236
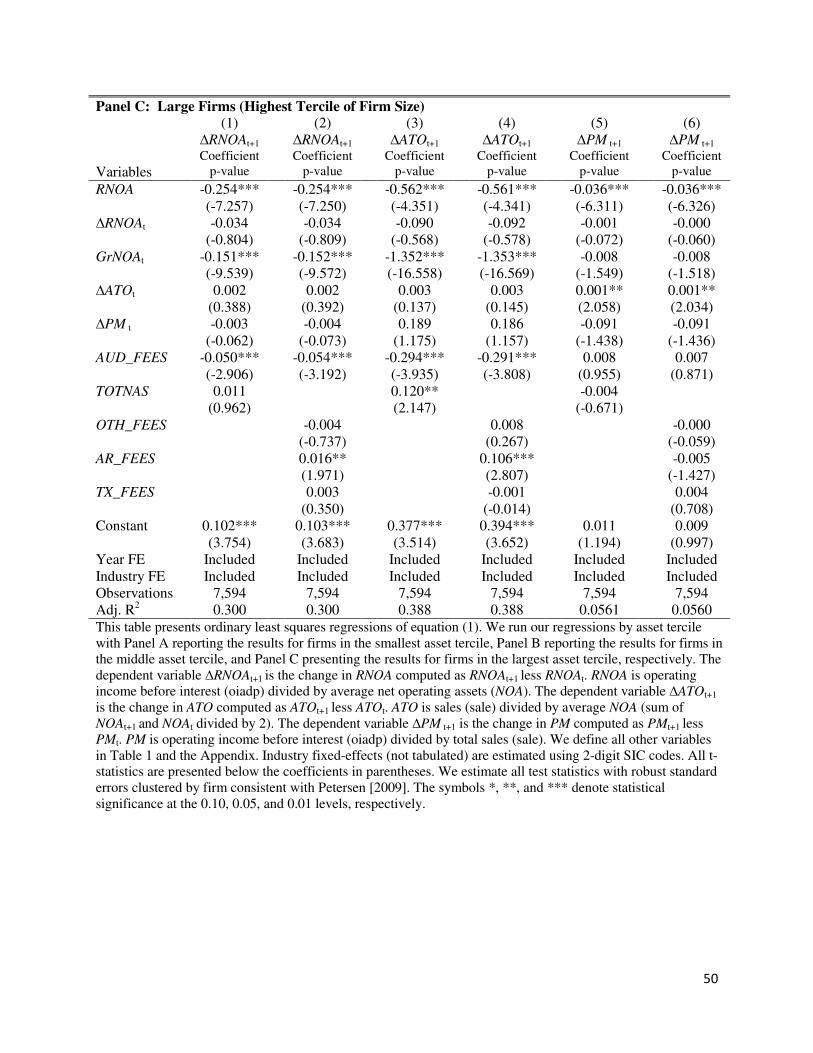
50
Panel C: Large Firms (Highest Tercile of Firm Size) (1) (2) (3) (4) (5) (6) ∆RNOAt+1 ∆RNOAt+1 ∆ATOt+1 ∆ATOt+1 ∆PM t+1 ∆PM t+1
Coefficient Coefficient Coefficient Coefficient Coefficient Coefficient
Variables p-value p-value p-value p-value p-value p-value
RNOA -0.254*** -0.254*** -0.562*** -0.561*** -0.036*** -0.036*** (-7.257) (-7.250) (-4.351) (-4.341) (-6.311) (-6.326) ∆RNOAt -0.034 -0.034 -0.090 -0.092 -0.001 -0.000 (-0.804) (-0.809) (-0.568) (-0.578) (-0.072) (-0.060) GrNOAt -0.151*** -0.152*** -1.352*** -1.353*** -0.008 -0.008 (-9.539) (-9.572) (-16.558) (-16.569) (-1.549) (-1.518) ∆ATOt 0.002 0.002 0.003 0.003 0.001** 0.001** (0.388) (0.392) (0.137) (0.145) (2.058) (2.034) ∆PM t -0.003 -0.004 0.189 0.186 -0.091 -0.091 (-0.062) (-0.073) (1.175) (1.157) (-1.438) (-1.436) AUD_FEES -0.050*** -0.054*** -0.294*** -0.291*** 0.008 0.007 (-2.906) (-3.192) (-3.935) (-3.808) (0.955) (0.871) TOTNAS 0.011 0.120** -0.004 (0.962) (2.147) (-0.671) OTH_FEES -0.004 0.008 -0.000 (-0.737) (0.267) (-0.059) AR_FEES 0.016** 0.106*** -0.005 (1.971) (2.807) (-1.427) TX_FEES 0.003 -0.001 0.004 (0.350) (-0.014) (0.708) Constant 0.102*** 0.103*** 0.377*** 0.394*** 0.011 0.009 (3.754) (3.683) (3.514) (3.652) (1.194) (0.997) Year FE Included Included Included Included Included Included Industry FE Included Included Included Included Included Included Observations 7,594 7,594 7,594 7,594 7,594 7,594 Adj. R2 0.300 0.300 0.388 0.388 0.0561 0.0560 This table presents ordinary least squares regressions of equation (1). We run our regressions by asset tercile with Panel A reporting the results for firms in the smallest asset tercile, Panel B reporting the results for firms in the middle asset tercile, and Panel C presenting the results for firms in the largest asset tercile, respectively. The dependent variable ∆RNOAt+1 is the change in RNOA computed as RNOAt+1 less RNOAt. RNOA is operating income before interest (oiadp) divided by average net operating assets (NOA). The dependent variable ∆ATOt+1
is the change in ATO computed as ATOt+1 less ATOt. ATO is sales (sale) divided by average NOA (sum of NOAt+1 and NOAt divided by 2). The dependent variable ∆PM t+1 is the change in PM computed as PMt+1 less PMt. PM is operating income before interest (oiadp) divided by total sales (sale). We define all other variables in Table 1 and the Appendix. Industry fixed-effects (not tabulated) are estimated using 2-digit SIC codes. All t-statistics are presented below the coefficients in parentheses. We estimate all test statistics with robust standard errors clustered by firm consistent with Petersen [2009]. The symbols *, **, and *** denote statistical significance at the 0.10, 0.05, and 0.01 levels, respectively.

51
TABLE 6
OLS Regression of Operating Risk on Non-audit Fees and Controls by Firm Size
Panel A: Standard Deviation of Historical Cash Flows (STDCFOt) Smallest Asset Tercile Middle Asset Tercile Largest Asset Tercile
(1) (2) (3) (4) (5) (6) STDCFO t+k STDCFO t+k STDCFO t+k STDCFO t+k STDCFO t+k STDCFO t+k
Coefficient Coefficient Coefficient Coefficient Coefficient Coefficient
Variables p-value p-value p-value p-value p-value p-value
STDCFO t 0.194*** 0.193*** 0.166*** 0.165*** 0.182*** 0.180*** (9.287) (9.284) (7.172) (7.112) (7.235) (7.207) RNOA -0.028*** -0.028*** -0.014*** -0.014*** 0.006*** 0.006*** (-11.463) (-11.358) (-3.730) (-3.759) (3.386) (3.457) ∆RNOAt 0.001 0.001 -0.003 -0.003 0.001 0.001 (0.866) (0.878) (-1.443) (-1.422) (1.142) (1.156) GrNOAt -0.007*** -0.007*** 0.002 0.002 -0.001 -0.001 (-4.490) (-4.602) (1.271) (1.215) (-0.791) (-0.921) ∆ATOt 0.000 0.000 0.000** 0.000** -0.000* -0.000* (0.538) (0.563) (2.061) (2.044) (-1.872) (-1.900) ∆PM t -0.003 -0.003 0.005 0.005 -0.002 -0.002 (-0.653) (-0.648) (0.702) (0.735) (-0.782) (-0.772) AUD_FEES -0.045*** -0.044*** 0.000 0.000 -0.004 -0.004 (-5.402) (-5.356) (0.081) (0.051) (-1.276) (-1.216) TOTNAS -0.001 -0.012*** -0.007*** (-0.165) (-3.908) (-3.314) OTH_FEES 0.007* -0.001 -0.001 (1.659) (-0.295) (-1.005) AR_FEES 0.003 -0.008*** -0.002 (0.502) (-3.607) (-1.117)
(Continued)

52
TABLE 6 Panel A - Continued
TX_FEES -0.006 -0.009*** -0.006*** (-0.896) (-3.163) (-3.433) Constant 0.081*** 0.080*** 0.057*** 0.059*** 0.030*** 0.030*** (4.739) (4.768) (3.904) (3.963) (6.699) (6.616) Year FE Included Included Included Included Included Included Industry FE Included Included Included Included Included Included Observations 6,176 6,176 6,230 6,230 6,492 6,492 Adj. R2 0.221 0.222 0.139 0.139 0.187 0.189

53
Panel B: Standard Deviation of Historical Stock Returns (STDRETt+1) Smallest Asset Tercile Middle Asset Tercile Largest Asset Tercile
(1) (2) (3) (4) (5) (6) STDRETt+1 STDRETt+1 STDRETt+1 STDRETt+1 STDRETt+1 STDRETt+1
Coefficient Coefficient Coefficient Coefficient Coefficient Coefficient
Variables p-value p-value p-value p-value p-value p-value
STDRET t 0.226*** 0.227*** 0.356*** 0.355*** 0.394*** 0.394*** (7.979) (7.978) (15.186) (15.151) (9.409) (9.411) RNOA -0.019*** -0.019*** -0.016*** -0.016*** -0.021*** -0.021*** (-8.785) (-8.697) (-6.884) (-6.889) (-6.997) (-7.104) ∆RNOAt 0.002 0.002 0.005** 0.005** -0.002 -0.002 (1.224) (1.213) (2.369) (2.348) (-0.868) (-0.830) GrNOAt -0.002 -0.002 0.004*** 0.003*** 0.002 0.002 (-1.055) (-1.115) (2.918) (2.806) (1.223) (1.269) ∆ATOt 0.000 0.000 -0.000 -0.000 0.000 0.000 (0.399) (0.412) (-0.069) (-0.052) (1.643) (1.643) ∆PM t -0.004 -0.004 -0.010 -0.010 -0.013 -0.013 (-0.574) (-0.576) (-0.886) (-0.875) (-0.961) (-0.961) AUD_FEES 0.001 0.001 0.014** 0.014** -0.007 -0.006 (0.171) (0.109) (2.377) (2.414) (-1.291) (-1.014) TOTNAS -0.006 -0.007** -0.008* (-0.869) (-1.975) (-1.818) OTH_FEES 0.000 -0.004 -0.000 (0.084) (-1.485) (-0.162) AR_FEES -0.001 -0.001 -0.006* (-0.199) (-0.311) (-1.901)
(Continued)

54
TABLE 6 Panel B - Continued
TX_FEES -0.005 -0.006** -0.005 (-0.830) (-2.023) (-1.513) Constant 0.055*** 0.056*** 0.040*** 0.042*** 0.073*** 0.073*** (3.731) (3.631) (4.551) (4.715) (5.325) (5.504) Year FE Included Included Included Included Included Included Industry FE Included Included Included Included Included Included Observations 3,891 3,891 4,265 4,265 4,653 4,653 Adj. R2 0.195 0.195 0.341 0.342 0.392 0.392
This table presents ordinary least squares regressions of equation (2). We run our regressions by asset tercile with columns (1) and (2) of Panels A and B presenting the results for firms in the smallest asset tercile. Columns (3) and (4) of Panels A and B report the results for firms in the middle asset tercile while columns (5) and (6) of Panels A and B report the results for firms in the largest asset tercile. The dependent variable STDCFO t+k is measured as the standard deviation of cash flows (oancf) measured over a time period from t+1 through t+5 scaled by total assets (at) over the same time period. The dependent variable STDRET t+1 is the standard deviation of daily returns for year t+1 scaled by total assets (at) at t+1. We define all other variables in Table 1 and the Appendix. Industry fixed-effects (not tabulated) are estimated using 2-digit SIC codes. All t-statistics are presented below the coefficients in parentheses. We estimate all test statistics with robust standard errors clustered by firm consistent with Petersen [2009]. The symbols *, **, and *** denote statistical significance at the 0.10, 0.05, and 0.01 levels, respectively.
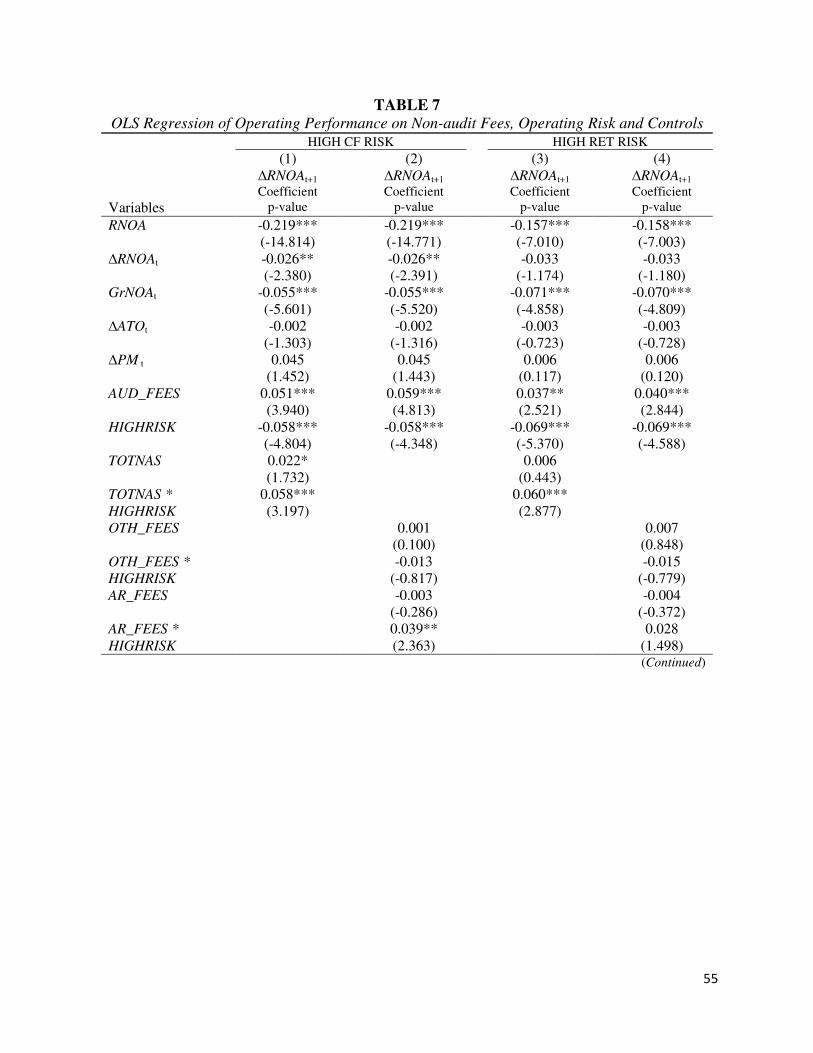
55
TABLE 7
OLS Regression of Operating Performance on Non-audit Fees, Operating Risk and Controls
HIGH CF RISK HIGH RET RISK
(1) (2) (3) (4) ∆RNOAt+1 ∆RNOAt+1 ∆RNOAt+1 ∆RNOAt+1 Coefficient Coefficient Coefficient Coefficient
Variables p-value p-value p-value p-value
RNOA -0.219*** -0.219*** -0.157*** -0.158*** (-14.814) (-14.771) (-7.010) (-7.003) ∆RNOAt -0.026** -0.026** -0.033 -0.033 (-2.380) (-2.391) (-1.174) (-1.180) GrNOAt -0.055*** -0.055*** -0.071*** -0.070*** (-5.601) (-5.520) (-4.858) (-4.809) ∆ATOt -0.002 -0.002 -0.003 -0.003 (-1.303) (-1.316) (-0.723) (-0.728) ∆PM t 0.045 0.045 0.006 0.006 (1.452) (1.443) (0.117) (0.120) AUD_FEES 0.051*** 0.059*** 0.037** 0.040*** (3.940) (4.813) (2.521) (2.844) HIGHRISK -0.058*** -0.058*** -0.069*** -0.069*** (-4.804) (-4.348) (-5.370) (-4.588) TOTNAS 0.022* 0.006 (1.732) (0.443) TOTNAS * 0.058*** 0.060*** HIGHRISK (3.197) (2.877) OTH_FEES 0.001 0.007 (0.100) (0.848) OTH_FEES * -0.013 -0.015 HIGHRISK (-0.817) (-0.779) AR_FEES -0.003 -0.004 (-0.286) (-0.372) AR_FEES * 0.039** 0.028 HIGHRISK (2.363) (1.498) (Continued)

56
TABLE 7 - Continued
TX_FEES 0.021** 0.009 (2.012) (0.742) TX_FEES * 0.033* 0.046** HIGHRISK (1.690) (2.000) Constant -0.000 -0.003 -0.018 -0.025 (-0.006) (-0.122) (-0.948) (-1.269) Year FE Included Included Included Included Industry FE Included Included Included Included Observations 22,728 22,728 12,853 12,853 Adj. R2 0.120 0.119 0.081 0.081 This table presents ordinary least squares regressions of equation (1) modified to include a measure of high ex ante operating risk (HIGHRISK). HIGHRISK is an indicator variable measured as HIGHCFO in
columns (1) and (2) and as HIGHRET in columns (3) and (4), respectively. The dependent variable ∆RNOAt+1
is the change in RNOA computed as RNOAt+1 less RNOAt. RNOA is operating income before interest (oiadp) divided by average net operating assets (NOA). The dependent variable ∆ATOt+1 is the change in ATO computed as ATOt+1 less ATOt. ATO is sales (sale) divided by average NOA (sum of NOAt+1 and NOAt divided by 2). The dependent variable ∆PM t+1 is the change in PM computed as PMt+1 less PMt. PM
is operating income before interest (oiadp) divided by total sales (sale). We define all other variables in Table 1 and the Appendix. Industry fixed-effects (not tabulated) are estimated using 2-digit SIC codes. All t-statistics are presented below the coefficients in parentheses. We estimate all test statistics with robust standard errors clustered by firm consistent with Petersen [2009]. The symbols *, **, and *** denote statistical significance at the 0.10, 0.05, and 0.01 levels, respectively.

57
TABLE 8
OLS Regression of Future Discretionary Accruals on Nonaudit Fees and Controls
Panel A: Signed discretionary accruals at time t+1
All Accruals Income Increasing Only
(1) (2) (3) (4)
DACC t+1 DACC t+1 DACC t+1 DACC t+1
Coefficient Coefficient Coefficient Coefficient
Variables p-value p-value p-value p-value RNOA -0.031*** -0.027*** -0.055*** -0.052***
(-12.498) (-10.767) (-22.255) (-20.956)
∆RNOAt 0.001 0.001 0.007*** 0.007***
(0.449) (0.348) (3.803) (3.727)
GrNOAt -0.018*** -0.016*** -0.017*** -0.016***
(-9.341) (-8.189) (-7.699) (-6.937)
∆ATOt 0.001** 0.001** 0.001*** 0.001***
(2.447) (2.252) (3.114) (2.982)
∆PM t -0.029*** -0.028*** -0.008 -0.008
(-3.473) (-3.421) (-1.346) (-1.275)
DACCt 0.351*** 0.353*** 0.072*** 0.074***
(9.785) (9.918) (6.575) (6.724)
IMPPERFt 0.048*** 0.032***
(10.763) (7.604)
AUD_FEES -0.005 -0.007 -0.061*** -0.062***
(-0.867) (-1.257) (-11.368) (-11.686)
TOTNAS -0.003 0.016*** -0.019*** -0.011**
(-0.588) (2.762) (-3.854) (-1.714)
IMPPERFt * -0.037*** -0.017**
TOTNAS (-5.498) (-2.415)
Constant 0.001 -0.026 0.055*** 0.037***
(0.036) (-1.584) (6.478) (4.188)
Year FE Included Included Included Included
Industry FE Included Included Included Included
Observations 20,953 20,953 8,358 8,358
Adj. R2 0.161 0.170 0.447 0.447

58
Panel B: Signed discretionary accruals at time t+2
All Accruals Income Increasing Only
(1) (2) (3) (4)
DACC t+2 DACC t+2 DACC t+2 DACC t+2
Coefficient Coefficient Coefficient Coefficient
Variables p-value p-value p-value p-value RNOA -0.026*** -0.027*** -0.059*** -0.061***
(-7.285) (-7.229) (-17.183) (-17.504)
∆RNOAt 0.001 0.001 0.007*** 0.008***
(0.181) (0.186) (2.680) (2.692)
GrNOAt -0.012*** -0.012*** -0.011*** -0.013***
(-4.836) (-4.893) (-4.075) (-4.467)
∆ATOt -0.000 -0.000 0.000 0.000
(-0.267) (-0.240) (0.950) (1.023)
∆PM t -0.025* -0.025* -0.017** -0.017**
(-1.942) (-1.938) (-1.994) (-2.007)
DACCt 0.415*** 0.415*** 0.160*** 0.159***
(11.033) (11.005) (11.807) (11.687)
IMPPERFt -0.001 -0.015***
(-0.112) (-2.651)
AUD_FEES -0.000 0.000 -0.068*** -0.066***
(-0.024) (0.014) (-9.929) (-9.765)
TOTNAS -0.010* -0.007 -0.024*** -0.022***
(-1.821) (-1.004) (-3.762) (-2.853)
TOTNAS* -0.006 -0.004
IMPPERFt (-0.775) (-0.466)
Constant 0.001 0.002 0.056*** 0.065***
(0.046) (0.087) (4.990) (5.648)
Year FE Included Included Included Included
Industry FE Included Included Included Included
Observations 17,297 17,297 6,965 6,965
Adj. R2 0.152 0.152 0.304 0.309
This table presents ordinary least squares regressions of equation (1) modified with discretionary accruals as the dependent variable. DACC t+k is firm i’s discretionary accruals computed as the residual from a cross-sectional, performance-adjusted modified Jones [1991] model estimated by industry-year. Panel A reports the results for discretionary accruals measured at t+1 while Panel B reports the results for discretionary accruals measured at t+2. Columns (1) and (2) of Panels A and B include all observations regardless of the sign of the firm’s discretionary accruals while columns (3) and (4) include only observations with income increasing accruals in the analysis. We define all other variables in Table 1 and the Appendix. Industry fixed-effects (not tabulated) are estimated using 2-digit SIC codes. All t-statistics are presented below the coefficients in parentheses. We estimate all test statistics with robust standard errors clustered by firm consistent with Petersen [2009]. The symbols *, **, and *** denote statistical significance at the 0.10, 0.05, and 0.01 levels, respectively.
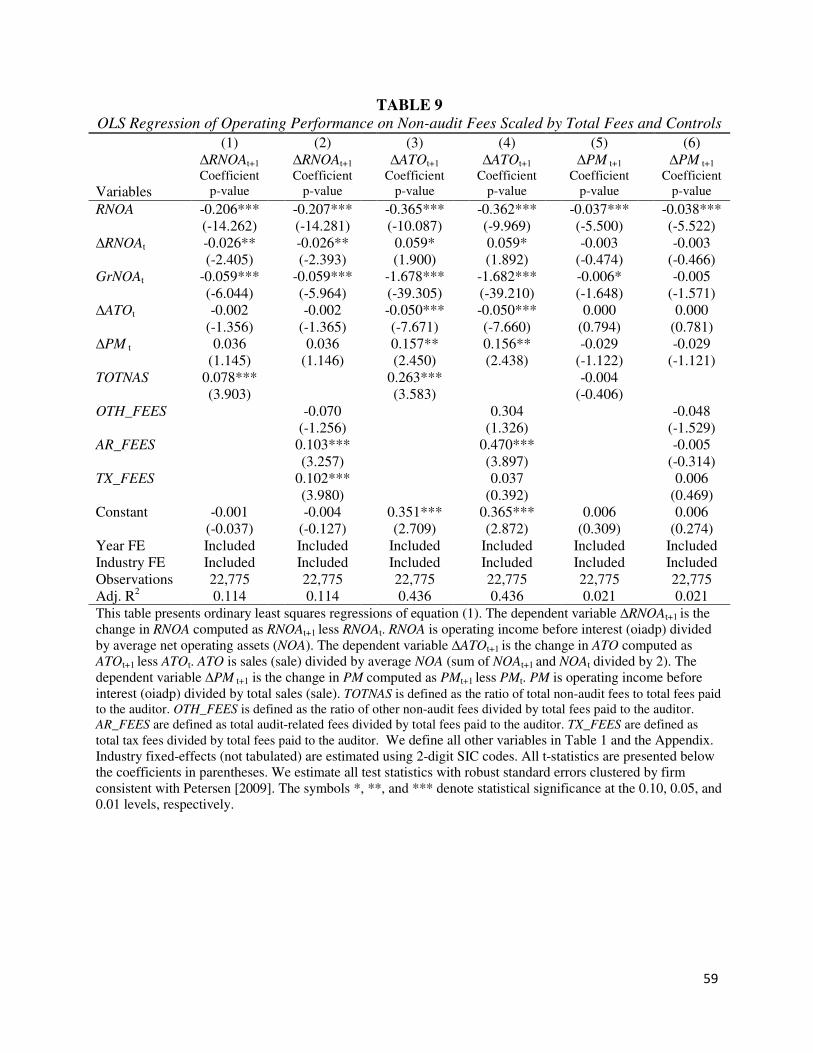
59
TABLE 9
OLS Regression of Operating Performance on Non-audit Fees Scaled by Total Fees and Controls
(1) (2) (3) (4) (5) (6) ∆RNOAt+1 ∆RNOAt+1 ∆ATOt+1 ∆ATOt+1 ∆PM t+1 ∆PM t+1
Coefficient Coefficient Coefficient Coefficient Coefficient Coefficient
Variables p-value p-value p-value p-value p-value p-value
RNOA -0.206*** -0.207*** -0.365*** -0.362*** -0.037*** -0.038*** (-14.262) (-14.281) (-10.087) (-9.969) (-5.500) (-5.522) ∆RNOAt -0.026** -0.026** 0.059* 0.059* -0.003 -0.003 (-2.405) (-2.393) (1.900) (1.892) (-0.474) (-0.466) GrNOAt -0.059*** -0.059*** -1.678*** -1.682*** -0.006* -0.005 (-6.044) (-5.964) (-39.305) (-39.210) (-1.648) (-1.571) ∆ATOt -0.002 -0.002 -0.050*** -0.050*** 0.000 0.000 (-1.356) (-1.365) (-7.671) (-7.660) (0.794) (0.781) ∆PM t 0.036 0.036 0.157** 0.156** -0.029 -0.029 (1.145) (1.146) (2.450) (2.438) (-1.122) (-1.121) TOTNAS 0.078*** 0.263*** -0.004 (3.903) (3.583) (-0.406) OTH_FEES -0.070 0.304 -0.048 (-1.256) (1.326) (-1.529) AR_FEES 0.103*** 0.470*** -0.005 (3.257) (3.897) (-0.314) TX_FEES 0.102*** 0.037 0.006 (3.980) (0.392) (0.469) Constant -0.001 -0.004 0.351*** 0.365*** 0.006 0.006 (-0.037) (-0.127) (2.709) (2.872) (0.309) (0.274) Year FE Included Included Included Included Included Included Industry FE Included Included Included Included Included Included Observations 22,775 22,775 22,775 22,775 22,775 22,775 Adj. R2 0.114 0.114 0.436 0.436 0.021 0.021 This table presents ordinary least squares regressions of equation (1). The dependent variable ∆RNOAt+1 is the change in RNOA computed as RNOAt+1 less RNOAt. RNOA is operating income before interest (oiadp) divided by average net operating assets (NOA). The dependent variable ∆ATOt+1 is the change in ATO computed as ATOt+1 less ATOt. ATO is sales (sale) divided by average NOA (sum of NOAt+1 and NOAt divided by 2). The dependent variable ∆PM t+1 is the change in PM computed as PMt+1 less PMt. PM is operating income before interest (oiadp) divided by total sales (sale). TOTNAS is defined as the ratio of total non-audit fees to total fees paid to the auditor. OTH_FEES is defined as the ratio of other non-audit fees divided by total fees paid to the auditor. AR_FEES are defined as total audit-related fees divided by total fees paid to the auditor. TX_FEES are defined as
total tax fees divided by total fees paid to the auditor. We define all other variables in Table 1 and the Appendix. Industry fixed-effects (not tabulated) are estimated using 2-digit SIC codes. All t-statistics are presented below the coefficients in parentheses. We estimate all test statistics with robust standard errors clustered by firm consistent with Petersen [2009]. The symbols *, **, and *** denote statistical significance at the 0.10, 0.05, and 0.01 levels, respectively.

60
TABLE 10
Regression of Operating Risk on Non-audit Fees Scaled by Total Fees and Controls
(1) (2) (3) (4) STDCFO t+k STDCFO t+k STDRET t+1 STDRET t+1 Coefficient Coefficient Coefficient Coefficient
Variables p-value p-value p-value p-value
STDCFO t 0.278*** 0.276*** (17.127) (17.056) STDRET t 0.353*** 0.352*** (17.227) (17.138) RNOA -0.025*** -0.025*** -0.021*** -0.021*** (-12.701) (-12.661) (-13.166) (-13.165) ∆RNOAt 0.001 0.001 0.002** 0.003** (0.527) (0.519) (2.076) (2.098) GrNOAt -0.002** -0.002*** 0.002* 0.002* (-2.566) (-2.765) (1.875) (1.763) ∆ATOt 0.000 0.000 0.000 0.000 (1.208) (1.233) (0.862) (0.867) ∆PM t -0.001 -0.001 -0.007 -0.007 (-0.212) (-0.207) (-1.494) (-1.524) TOTNAS -0.008** -0.011** (-1.983) (-2.315) OTH_FEES 0.041*** 0.031** (3.586) (2.336) AR_FEES -0.012** -0.014* (-1.968) (-1.879) TX_FEES -0.018*** -0.016*** (-3.542) (-2.707) Constant 0.044*** 0.045*** 0.056*** 0.057*** (5.430) (5.534) (6.511) (6.415) Year FE Included Included Included Included Industry FE Included Included Included Included Observations 18,898 18,898 12,809 12,809 Adj. R2 0.234 0.236 0.313 0.314 This table presents ordinary least squares regressions of equation (2). The dependent variable STDCFO t+k is measured as the standard deviation of cash flows (oancf) measured over a time period from t+1 through t+5 scaled by total assets (at) over the same time period. The dependent variable STDRET t+1 is the standard deviation of daily returns for year t+1 scaled by total assets (at) at t+1. TOTNAS is defined as the ratio of total non-audit fees to total fees paid to the auditor. OTHER_FEES
is defined as the ratio of other non-audit fees divided by total fees paid to the auditor. AR_FEES are defined as total audit-related fees divided by total fees paid to the auditor. TX_FEES are defined as total tax fees divided by total fees paid to the auditor. We define all other variables in Table 1 and the Appendix. Industry fixed-effects (not tabulated) are estimated using 2-digit SIC codes. All t-statistics are presented below the coefficients in parentheses. We estimate all test statistics with robust standard errors clustered by firm consistent with Petersen [2009]. The symbols *, **, and *** denote statistical significance at the 0.10, 0.05, and 0.01 levels, respectively.