NARMS final report 1999 INTRO · isolates, 1999 13 Table 4. Submission of isolates by site a nd by...
127
la * Shingella * E. Coli 0157 * Campylobacter * Salmonella * Shingella * E. Coli 0157 * Campylobacter * Salmonella * Shingella * E. Coli 0157 * Campylobacter * Salm * E. Coli 0157 * Campylobacter * Salmonella * Shingella * E. Coli 0157 * Campylobacter * Salmonella * Shingella * E.Coli0157 * Campylobacter * Salmonella * Shing * Campylobacter * Salmonella * Shingella * E. Coli 0157 * Campylobacter * Salmonella * Shingella * E. Coli 0157 * Campylobacter * Salmonella * Shingella * E. Coli acter * Salmonella * Shingella * E. Coli 0157 * Campylobacter * Salmonella * Shingella * E. Coli 0157 * Campylobacter * Salmonella * Shingella * E. Coli 0157 * Camp la * Shingella * E. Coli 0157 * Campylobacter * Salmonella * Shingella * E. Coli 0157 * Campylobacter * Salmonella * Shingella * E. Coli 0157 * Campylobacter * Salmo * E. Coli 0157 * Campylobacter * Salmonella * Shingella * E. Coli 0157 * Campylobacter * Salmonella * Shingella * E. Coli 0157 * Campylobacter * Salmonella * Shin * Campylobacter * Salmonella * Shingella * E.Coli0157 * Campylobacter * Salmonella * Shingella * E. Coli 0157 * Campylobacter * Salmonella * Shingella * E. Coli 0 acter * Salmonella * Shingella * E. Coli 0157 * Campylobacter * Salmonella * Shingella * E. Coli 0157 * Campylobacter * Salmonella * Shingella * E. Coli 0157 * Cam nella * Shingella * E. Coli 0157 * Campylobacter * Salmonella * Shingella * E. Coli 0157 * Campylobacter * Salmonella * Shingella * E. Coli 0157 * Campylobacter * Sa * E. Coli 0157 * Campylobacter * Salmonella * Shingella * E. Coli 0157 * Campylobacter * Salmonella * Shingella * E.Coli0157 * Campylobacter * Salmonella * Shing * Campylobacter * Salmonella * Shingella * E. Coli 0157 * Campylobacter * Salmonella * Shingella * E. Coli 0157 * Campylobacter * Salmonella * Shingella * E. Coli acter * Salmonella * Shingella * E. Coli 0157 * Campylobacter * Salmonella * Shingella * E. Coli 0157 * Campylobacter * Salmonella * Shingella * E. Coli 0157 * Camp la * Shingella * E. Coli 0157 * Campylobacter * Salmonella * Shingella * E. Coli 0157 * Campylobacter * Salmonella * Shingella * E. Coli 0157 * Campylobacter * Salmo * E. Coli 0157 * Campylobacter * Salmonella * Shingella * E. Coli 0157 * Campylobacter * Salmonella * Shingella * E. Coli 0157 * Campylobacter * Salmonella * Shin * Campylobacter * Salmonella * Shingella * E.Coli0157 * Campylobacter * Salmonella * Shingella * E. Coli 0157 * Campylobacter * Salmonella * Shingella * E. Coli 0 acter * Salmonella * Shingella * E. Coli 0157 * Campylobacter * Salmonella * Shingella * E. Coli 0157 * Campylobacter * Salmonella * Shingella * E. Coli 0157 * Cam nella * Shingella * E. Coli 0157 * Campylobacter * Salmonella * Shingella * E. Coli 0157 * Campylobacter * Salmonella * Shingella * E. Coli 0157 * Campylobacter * Sa * E. Coli 0157 * Campylobacter * Salmonella * Shingella * E. Coli 0157 * Campylobacter * Salmonella * Shingella * E.Coli0157 * Campylobacter * Salmonella * Shing 7 * Campylobacter * Salmonella * Shingella * E.Coli0157 * Campylobacter * Salmonella * Shingella * E. Coli 0157 * Campylobacter * Salmonella * Shingella * E. Coli acter * Salmonella * Shingella * E. Coli 0157 * Campylobacter * Salmonella * Shingella * E. Coli 0157 * Campylobacter * Salmonella * Shingella * E. Coli 0157 * Camp monella * Shingella * E. Coli 0157 * Campylobacter * Salmonella * Shingella * E. Coli 0157 * Campylobacter Salmonella * Shingella * E. Coli 0157 * Campylobacter * bacter * Salmonella * Shingella * E. Coli 0157 * Campylobacter * Salmonella * Shingella * E. Coli 0157 * Campylobacter * Salmonella * Shingella * E. Coli 0157 * Camp 0157 * Campylobacter * Salmonella * Shingella * E. Coli 0157 * Campylobacter * Salmonella * Shingella * E. Coli 0157 * Campylobacter * Salmonella * Shingella * E. lla * E. Coli 0157 * Campylobacter * Salmonella * Shingella * E. Coli 0157 * Campylobacter * Salmonella * Shingella * E.Coli0157 * Campylobacter * Salmonella * Sh Shingella * E. Coli 0157 * Campylobacter * Salmonella * Shingella * E. Coli 0157 * Campylobacter * Salmonella * Shingella * E. Coli 0157 * Campylobacter * Salmone monella * Shingella * E. Coli 0157 * Campylobacter * Salmonella * Shingella * E. Coli 0157 * Campylobacter * Salmonella * Shingella * E. Coli 0157 * Campylobacter * bacter * Salmonella * Shingella * E. Coli 0157 * Campylobacter * Salmonella * Shingella * E. Coli 0157 * Campylobacter * Salmonella * Shingella * E. Coli 0157 * Camp 0157 * Campylobacter * Salmonella * Shingella * E. Coli 0157 * Campylobacter * Salmonella * Shingella * E. Coli 0157 * Campylobacter * Salmonella * Shingella * E. lla * E. Coli 0157 * Campylobacter * Salmonella * Shingella * E. Coli 0157 * Campylobacter * Salmonella * Shingella * E.Coli0157 * Campylobacter * Salmonella * Sh Shingella * E. Coli 0157 * Campylobacter * Salmonella * Shingella * E. Coli 0157 * Campylobacter * Salmonella * Shingella * E. Coli 0157 * Campylobacter * Salmone monella * Shingella * E. Coli 0157 * Campylobacter * Salmonella * Shingella * E. Coli 0157 * Campylobacter * Salmonella * Shingella * E. Coli 0157 * Campylobacter * bacter * Salmonella * Shingella * E. Coli 0157 * Campylobacter * Salmonella * Shingella * E. Coli 0157 * Campylobacter * Salmonella * Shingella * E. Coli 0157 * Camp monella * Shingella * E. CColi 0157 * Campylobacter * Salmonella * Shingella * E. Coli 0157 * Campylobacter * Salmonella * Shingella * E. Coli 0157 * Campylobacter * la * Shingella * E. Coli 0157 * Campylobacter * Salmonella * Shingella * E. Coli 0157 * Campylobacter * Salmonella * Shingella * E. Coli 0157 * Campylobacter * Salmo * Salmonella * Shingella * E. Coli 0157 * Campylobacter * Salmonella * Shingella * E. Coli 0157 * Campylobacter * Salmonella * Shingella * E. Coli 0157 * Campylobac Campylobacter * Salmonella * Shingella * E. Coli 0157 * Campylobacter * Salmonella * Shingella * E. Coli 0157 * Campylobacter * Salmonella * Shingella * E. Coli 01 E. Coli 0157 * Campylobacter * Salmonella * Shingella * E. Coli 0157 * Campylobacter * Salmonella * Shingella * E.Coli0157 * Campylobacter * Salmonella * Shingella ella * E. Coli 0157 * Campylobacter * Salmonella * Shingella * E. Coli 0157 * Campylobacter * Salmonella * Shingella * E. Coli 0157 * Campylobacter * Salmonella * S a * Shingella * E. Coli 0157 * Campylobacter * Salmonella * Shingella * E. Coli 0157 * Campylobacter * Salmonella * Shingella * E. Coli 0157 * Campylobacter * Salmo * Salmonella * Shingella * E. Coli 0157 * Campylobacter * Salmonella * Shingella * E. Coli 0157 * Campylobacter * Salmonella * Shingella * E. Coli 0157 * Campylobac Campylobacter * Salmonella * Shingella * E. Coli 0157 * Campylobacter * Salmonella * Shingella * E. Coli 0157 * Campylobacter * Salmonella * Shingella * E. Coli 01 E. Coli 0157 * Campylobacter * Salmonella * Shingella * E. Coli 0157 * Campylobacter * Salmonella * Shingella * E.Coli0157 * Campylobacter * Salmonella * Shingella ella * E. Coli 0157 * Campylobacter * Salmonella * Shingella * E. Coli 0157 * Campylobacter * Salmonella * Shingella * E. Coli 0157 * Campylobacter * Salmonella * S a * Shingella * E. Coli 0157 * Campylobacter * Salmonella * Shingella * E. Coli 0157 * Campylobacter * Salmonella * Shingella * E. Coli 0157 * Campylobacter * Salmo * Salmonella * Shingella * E. Coli 0157 * Campylobacter * Salmonella * Shingella * E. Coli 0157 * Campylobacter * Salmonella * Shingella * E. Coli 0157 * Campylobac * Campylobacter * Salmonella * Shingella * E.Coli0157 * Campylobacter * Salmonella * Shingella * E. Coli 0157 * Campylobacter * Salmonella * Shingella * E. Coli 01 E. Coli 0157 * Campylobacter * Salmonella * Shingella * E. Coli 0157 * Campylobacter * Salmonella * Shingella * E.Coli0157 * Campylobacter * Salmonella * Shingella ella * E. Coli 0157 * Campylobacter * Salmonella * Shingella * E. Coli 0157 * Campylobacter * Salmonella * Shingella * E. Coli 0157 * Campylobacter * Salmonella * S a * Shingella * E. Coli 0157 * Campylobacter * Salmonella * Shingella * E. Coli 0157 * Campylobacter * Salmonella * Shingella * E. Coli 0157 * Campylobacter * Salmo * Salmonella * Shingella * E. Coli 0157 * Campylobacter * Salmonella * Shingella * E. Coli 0157 * Campylobacter * Salmonella * Shingella * E. Coli 0157 * Campylobac pylobacter * Salmonella * Shingella * E. Coli 0157 * Campylobacter * Salmonella * Shingella * E. Coli 0157 * Campylobacter * Salmonella * Shingella * Salmonella * la * Shingella * E. Coli 0157 * Campylobacter * Salmonella * Shingella * E. Coli 0157 * Campylobacter * Salmonella * Shingella * E. Coli 0157 * Campylobacter * Salm * Salmonella * Shingella * E. Coli 0157 * Campylobacter * Salmonella * Shingella * E. Coli 0157 * Campylobacter * Salmonella * Shingella * E. Coli 0157 * Campyloba Campylobacter * Salmonella * Shingella * E.Coli0157 * Campylobacter * Salmonella * Shingella * E. Coli 0157 * Campylobacter * Salmonella * Shingella * E. Coli 015 . Coli 0157 * Campylobacter * Salmonella * Shingella * E. Coli 0157 * Campylobacter * Salmonella * Shingella * E. Coli 0157 * Campylobacter * Salmonella * Shingella gella * E. Coli 0157 * Campylobacter * Salmonella * Shingella * E. Coli 0157 * Campylobacter * Salmonella * Shingella * E.Coli0157 * Campylobacter * Salmonella * S * Shingella * E. Coli 0157 * Campylobacter * Salmonella * Shingella * E. Coli 0157 * Campylobacter * Salmonella * Shingella * E. CColi 0157 * Campylobacter * Salmo ella * E. Coli 0157 * Campylobacter * Salmonella * Shingella * E. Coli 0157 * Campylobacter * Salmonella * Shingella * E. Coli 0157 * Campylobacter * Salmonella * S a * Shingella * E. Coli 0157 * Campylobacter * Salmonella * Shingella * E. Coli 0157 * Campylobacter * Salmonella * Shingella * E. Coli 0157 * Campylobacter * Salmo * E. Coli 0157 * Campylobacter * Salmonella * Shingella * E. Coli 0157 * onella * Shingella * E. Coli 0157 * Campylobacter * Salmonella * Shingella * E. Coli Salmonella * Shingella * E.Coli0157 * Campylobacter * Salmonella * Shingella * bacter * Salmonella * Shingella * E. Coli 0157 * Campylobacter * Salmonella * * Campylobacter * Salmonella * Shingella * E. Coli 0157 * Campylobacter * * E. Coli 0157 * Campylobacter * Salmonella * Shingella * E. Coli 0157 * onella * Shingella * E. Coli 0157 * Campylobacter * Salmonella * Shingella * E. Coli Salmonella * Shingella * E.Coli0157 * Campylobacter * Salmonella * Shingella * bacter * Salmonella * Shingella * E. Coli 0157 * Campylobacter * Salmonella * * Campylobacter * Salmonella * Shingella * E. Coli 0157 * Campylobacter * * E. Coli 0157 * Campylobacter * Salmonella * Shingella * E. Coli 0157 * onella * Shingella * E. Coli 0157 * Campylobacter * Salmonella * Shingella * E. Coli Salmonella * Shingella * E.Coli0157 * Campylobacter * Salmonella * Shingella * bacter * Salmonella * Shingella * E. Coli 0157 * Campylobacter * Salmonella * * Campylobacter * Salmonella * Shingella * E. Coli 0157 * Campylobacter * * E. Coli 0157 * Campylobacter * Salmonella * Shingella * E. Coli 0157 * onella * Shingella * E. Coli 0157 * Campylobacter * Salmonella * Shingella * E. Coli Salmonella * Shingella * E.Coli0157 * Campylobacter * Salmonella * Shingella * bacter * Salmonella * Shingella * E. Coli 0157 * Campylobacter * Salmonella * * Campylobacter * Salmonella * Shingella * E. Coli 0157 * Campylobacter * * E. Coli 0157 * Campylobacter * Salmonella * Shingella * E. Coli 0157 * C Shingella * E. Coli 0157 * Campylobacter * Salmonella * Shingella * E. Co Salmonella * Shingella * E.Coli0157 * Campylobacter * Salmonella * Shin Campylobacter * Salmonella * Shingella * E.Coli0157 * Campylobacter * 0157 * Campylobacter * Salmonella * Shingella * E. Coli 0157 * Campylob E. Coli 0157 * Campylobacter * Salmonella * Shingella * E. Coli 0157 * Cam Shingella * E. Coli 0157 * Campylobacter * Salmonella * Shingella * E. Co Salmonella * Shingella * E.Coli0157 * Campylobacter * Salmonella * Shin Campylobacter * Salmonella * Shingella * E.Coli0157 * Campylobacter * 0157 * Campylobacter * Salmonella * Shingella * E. Coli 0157 * Campylob E. Coli 0157 * Campylobacter * Salmonella * Shingella * E. Coli 0157 * Cam Shingella * E. Coli 0157 * Campylobacter * Salmonella * Shingella * E. Co Salmonella * Shingella * E.Coli0157 * Campylobacter * Salmonella * Shin Campylobacter * Salmonella * Shingella * E.Coli0157 * Campylobacter * 0157 * Campylobacter * Salmonella * Shingella * E. Coli 0157 * Campylob E. Coli 0157 * Campylobacter * Salmonella * Shingella * E. Coli 0157 * Cam Shingella * E. Coli 0157 * Campylobacter * Salmonella * Shingella * E. Co Salmonella * Shingella * E.Coli0157 * Campylobacter * Salmonella * Shin Campylobacter * Salmonella * Shingella * E.Coli0157 * Campylobacter * 0157 * Campylobacter * Salmonella * Shingella * E. Coli 0157 * Campylob National Antimicrobial Resistance Monitoring System: Enteric Bacteria National Antimicrobial Resistance Monitoring System: Enteric Bacteria 1999 Annual Report NARMS 1999 Annual Report NARMS
Transcript of NARMS final report 1999 INTRO · isolates, 1999 13 Table 4. Submission of isolates by site a nd by...

la * Shingella * E. Coli 0157 * Campylobacter * Salmonella * Shingella * E. Coli 0157 * Campylobacter * Salmonella * Shingella * E. Coli 0157 * Campylobacter * Salm* E. Coli 0157 * Campylobacter * Salmonella * Shingella * E. Coli 0157 * Campylobacter * Salmonella * Shingella * E. Coli 0157 * Campylobacter * Salmonella * Shing* Campylobacter * Salmonella * Shingella * E. Coli 0157 * Campylobacter * Salmonella * Shingella * E. Coli 0157 * Campylobacter * Salmonella * Shingella * E. Coli
acter * Salmonella * Shingella * E. Coli 0157 * Campylobacter * Salmonella * Shingella * E. Coli 0157 * Campylobacter * Salmonella * Shingella * E. Coli 0157 * Campla * Shingella * E. Coli 0157 * Campylobacter * Salmonella * Shingella * E. Coli 0157 * Campylobacter * Salmonella * Shingella * E. Coli 0157 * Campylobacter * Salmo* E. Coli 0157 * Campylobacter * Salmonella * Shingella * E. Coli 0157 * Campylobacter * Salmonella * Shingella * E. Coli 0157 * Campylobacter * Salmonella * Shin* Campylobacter * Salmonella * Shingella * E. Coli 0157 * Campylobacter * Salmonella * Shingella * E. Coli 0157 * Campylobacter * Salmonella * Shingella * E. Coli 0
acter * Salmonella * Shingella * E. Coli 0157 * Campylobacter * Salmonella * Shingella * E. Coli 0157 * Campylobacter * Salmonella * Shingella * E. Coli 0157 * Camnella * Shingella * E. Coli 0157 * Campylobacter * Salmonella * Shingella * E. Coli 0157 * Campylobacter * Salmonella * Shingella * E. Coli 0157 * Campylobacter * Sa
* E. Coli 0157 * Campylobacter * Salmonella * Shingella * E. Coli 0157 * Campylobacter * Salmonella * Shingella * E. Coli 0157 * Campylobacter * Salmonella * Shing* Campylobacter * Salmonella * Shingella * E. Coli 0157 * Campylobacter * Salmonella * Shingella * E. Coli 0157 * Campylobacter * Salmonella * Shingella * E. Coli
acter * Salmonella * Shingella * E. Coli 0157 * Campylobacter * Salmonella * Shingella * E. Coli 0157 * Campylobacter * Salmonella * Shingella * E. Coli 0157 * Campla * Shingella * E. Coli 0157 * Campylobacter * Salmonella * Shingella * E. Coli 0157 * Campylobacter * Salmonella * Shingella * E. Coli 0157 * Campylobacter * Salmo* E. Coli 0157 * Campylobacter * Salmonella * Shingella * E. Coli 0157 * Campylobacter * Salmonella * Shingella * E. Coli 0157 * Campylobacter * Salmonella * Shin* Campylobacter * Salmonella * Shingella * E. Coli 0157 * Campylobacter * Salmonella * Shingella * E. Coli 0157 * Campylobacter * Salmonella * Shingella * E. Coli 0
acter * Salmonella * Shingella * E. Coli 0157 * Campylobacter * Salmonella * Shingella * E. Coli 0157 * Campylobacter * Salmonella * Shingella * E. Coli 0157 * Camnella * Shingella * E. Coli 0157 * Campylobacter * Salmonella * Shingella * E. Coli 0157 * Campylobacter * Salmonella * Shingella * E. Coli 0157 * Campylobacter * Sa
* E. Coli 0157 * Campylobacter * Salmonella * Shingella * E. Coli 0157 * Campylobacter * Salmonella * Shingella * E. Coli 0157 * Campylobacter * Salmonella * Shing7 * Campylobacter * Salmonella * Shingella * E. Coli 0157 * Campylobacter * Salmonella * Shingella * E. Coli 0157 * Campylobacter * Salmonella * Shingella * E. Coliacter * Salmonella * Shingella * E. Coli 0157 * Campylobacter * Salmonella * Shingella * E. Coli 0157 * Campylobacter * Salmonella * Shingella * E. Coli 0157 * Camp
lmonella * Shingella * E. Coli 0157 * Campylobacter * Salmonella * Shingella * E. Coli 0157 * Campylobacter * Salmonella * Shingella * E. Coli 0157 * Campylobacter *bacter * Salmonella * Shingella * E. Coli 0157 * Campylobacter * Salmonella * Shingella * E. Coli 0157 * Campylobacter * Salmonella * Shingella * E. Coli 0157 * Camp
0157 * Campylobacter * Salmonella * Shingella * E. Coli 0157 * Campylobacter * Salmonella * Shingella * E. Coli 0157 * Campylobacter * Salmonella * Shingella * E.lla * E. Coli 0157 * Campylobacter * Salmonella * Shingella * E. Coli 0157 * Campylobacter * Salmonella * Shingella * E. Coli 0157 * Campylobacter * Salmonella * ShiShingella * E. Coli 0157 * Campylobacter * Salmonella * Shingella * E. Coli 0157 * Campylobacter * Salmonella * Shingella * E. Coli 0157 * Campylobacter * Salmone
monella * Shingella * E. Coli 0157 * Campylobacter * Salmonella * Shingella * E. Coli 0157 * Campylobacter * Salmonella * Shingella * E. Coli 0157 * Campylobacter *bacter * Salmonella * Shingella * E. Coli 0157 * Campylobacter * Salmonella * Shingella * E. Coli 0157 * Campylobacter * Salmonella * Shingella * E. Coli 0157 * Camp
monella * Shingella * E. CColi 0157 * Campylobacter * Salmonella * Shingella * E. Coli 0157 * Campylobacter * Salmonella * Shingella * E. Coli 0157 * Campylobacter *
la * Shingella * E. Coli 0157 * Campylobacter * Salmonella * Shingella * E. Coli 0157 * Campylobacter * Salmonella * Shingella * E. Coli 0157 * Campylobacter * Salmo* Salmonella * Shingella * E. Coli 0157 * Campylobacter * Salmonella * Shingella * E. Coli 0157 * Campylobacter * Salmonella * Shingella * E. Coli 0157 * CampylobacCampylobacter * Salmonella * Shingella * E. Coli 0157 * Campylobacter * Salmonella * Shingella * E. Coli 0157 * Campylobacter * Salmonella * Shingella * E. Coli 01
E. Coli 0157 * Campylobacter * Salmonella * Shingella * E. Coli 0157 * Campylobacter * Salmonella * Shingella * E. Coli 0157 * Campylobacter * Salmonella * Shingellaella * E. Coli 0157 * Campylobacter * Salmonella * Shingella * E. Coli 0157 * Campylobacter * Salmonella * Shingella * E. Coli 0157 * Campylobacter * Salmonella * Sa * Shingella * E. Coli 0157 * Campylobacter * Salmonella * Shingella * E. Coli 0157 * Campylobacter * Salmonella * Shingella * E. Coli 0157 * Campylobacter * Salmo* Salmonella * Shingella * E. Coli 0157 * Campylobacter * Salmonella * Shingella * E. Coli 0157 * Campylobacter * Salmonella * Shingella * E. Coli 0157 * CampylobacCampylobacter * Salmonella * Shingella * E. Coli 0157 * Campylobacter * Salmonella * Shingella * E. Coli 0157 * Campylobacter * Salmonella * Shingella * E. Coli 01
E. Coli 0157 * Campylobacter * Salmonella * Shingella * E. Coli 0157 * Campylobacter * Salmonella * Shingella * E. Coli 0157 * Campylobacter * Salmonella * Shingellaella * E. Coli 0157 * Campylobacter * Salmonella * Shingella * E. Coli 0157 * Campylobacter * Salmonella * Shingella * E. Coli 0157 * Campylobacter * Salmonella * Sa * Shingella * E. Coli 0157 * Campylobacter * Salmonella * Shingella * E. Coli 0157 * Campylobacter * Salmonella * Shingella * E. Coli 0157 * Campylobacter * Salmo* Salmonella * Shingella * E. Coli 0157 * Campylobacter * Salmonella * Shingella * E. Coli 0157 * Campylobacter * Salmonella * Shingella * E. Coli 0157 * Campylobac* Campylobacter * Salmonella * Shingella * E. Coli 0157 * Campylobacter * Salmonella * Shingella * E. Coli 0157 * Campylobacter * Salmonella * Shingella * E. Coli 01
E. Coli 0157 * Campylobacter * Salmonella * Shingella * E. Coli 0157 * Campylobacter * Salmonella * Shingella * E. Coli 0157 * Campylobacter * Salmonella * Shingellaella * E. Coli 0157 * Campylobacter * Salmonella * Shingella * E. Coli 0157 * Campylobacter * Salmonella * Shingella * E. Coli 0157 * Campylobacter * Salmonella * Sa * Shingella * E. Coli 0157 * Campylobacter * Salmonella * Shingella * E. Coli 0157 * Campylobacter * Salmonella * Shingella * E. Coli 0157 * Campylobacter * Salmo* Salmonella * Shingella * E. Coli 0157 * Campylobacter * Salmonella * Shingella * E. Coli 0157 * Campylobacter * Salmonella * Shingella * E. Coli 0157 * Campylobac
pylobacter * Salmonella * Shingella * E. Coli 0157 * Campylobacter * Salmonella * Shingella * E. Coli 0157 * Campylobacter * Salmonella * Shingella * Salmonella *la * Shingella * E. Coli 0157 * Campylobacter * Salmonella * Shingella * E. Coli 0157 * Campylobacter * Salmonella * Shingella * E. Coli 0157 * Campylobacter * Salm* Salmonella * Shingella * E. Coli 0157 * Campylobacter * Salmonella * Shingella * E. Coli 0157 * Campylobacter * Salmonella * Shingella * E. Coli 0157 * CampylobaCampylobacter * Salmonella * Shingella * E. Coli 0157 * Campylobacter * Salmonella * Shingella * E. Coli 0157 * Campylobacter * Salmonella * Shingella * E. Coli 015
. Coli 0157 * Campylobacter * Salmonella * Shingella * E. Coli 0157 * Campylobacter * Salmonella * Shingella * E. Coli 0157 * Campylobacter * Salmonella * Shingellagella * E. Coli 0157 * Campylobacter * Salmonella * Shingella * E. Coli 0157 * Campylobacter * Salmonella * Shingella * E. Coli 0157 * Campylobacter * Salmonella * S
* Shingella * E. Coli 0157 * Campylobacter * Salmonella * Shingella * E. Coli 0157 * Campylobacter * Salmonella * Shingella * E. CColi 0157 * Campylobacter * Salmoella * E. Coli 0157 * Campylobacter * Salmonella * Shingella * E. Coli 0157 * Campylobacter * Salmonella * Shingella * E. Coli 0157 * Campylobacter * Salmonella * Sa * Shingella * E. Coli 0157 * Campylobacter * Salmonella * Shingella * E. Coli 0157 * Campylobacter * Salmonella * Shingella * E. Coli 0157 * Campylobacter * Salmo
* E. Coli 0157 * Campylobacter * Salmonella * Shingella * E. Coli 0157 *onella * Shingella * E. Coli 0157 * Campylobacter * Salmonella * Shingella * E. Coli* Salmonella * Shingella * E. Coli 0157 * Campylobacter * Salmonella * Shingella *bacter * Salmonella * Shingella * E. Coli 0157 * Campylobacter * Salmonella ** Campylobacter * Salmonella * Shingella * E. Coli 0157 * Campylobacter ** E. Coli 0157 * Campylobacter * Salmonella * Shingella * E. Coli 0157 *
onella * Shingella * E. Coli 0157 * Campylobacter * Salmonella * Shingella * E. Coli* Salmonella * Shingella * E. Coli 0157 * Campylobacter * Salmonella * Shingella *bacter * Salmonella * Shingella * E. Coli 0157 * Campylobacter * Salmonella ** Campylobacter * Salmonella * Shingella * E. Coli 0157 * Campylobacter ** E. Coli 0157 * Campylobacter * Salmonella * Shingella * E. Coli 0157 *
onella * Shingella * E. Coli 0157 * Campylobacter * Salmonella * Shingella * E. Coli* Salmonella * Shingella * E. Coli 0157 * Campylobacter * Salmonella * Shingella *bacter * Salmonella * Shingella * E. Coli 0157 * Campylobacter * Salmonella ** Campylobacter * Salmonella * Shingella * E. Coli 0157 * Campylobacter ** E. Coli 0157 * Campylobacter * Salmonella * Shingella * E. Coli 0157 *
onella * Shingella * E. Coli 0157 * Campylobacter * Salmonella * Shingella * E. Coli* Salmonella * Shingella * E. Coli 0157 * Campylobacter * Salmonella * Shingella *bacter * Salmonella * Shingella * E. Coli 0157 * Campylobacter * Salmonella ** Campylobacter * Salmonella * Shingella * E. Coli 0157 * Campylobacter *
* E. Coli 0157 * Campylobacter * Salmonella * Shingella * E. Coli 0157 * CShingella * E. Coli 0157 * Campylobacter * Salmonella * Shingella * E. CoSalmonella * Shingella * E. Coli 0157 * Campylobacter * Salmonella * ShingCampylobacter * Salmonella * Shingella * E. Coli 0157 * Campylobacter *0157 * Campylobacter * Salmonella * Shingella * E. Coli 0157 * CampylobE. Coli 0157 * Campylobacter * Salmonella * Shingella * E. Coli 0157 * CamShingella * E. Coli 0157 * Campylobacter * Salmonella * Shingella * E. CoSalmonella * Shingella * E. Coli 0157 * Campylobacter * Salmonella * ShingCampylobacter * Salmonella * Shingella * E. Coli 0157 * Campylobacter *0157 * Campylobacter * Salmonella * Shingella * E. Coli 0157 * CampylobE. Coli 0157 * Campylobacter * Salmonella * Shingella * E. Coli 0157 * CamShingella * E. Coli 0157 * Campylobacter * Salmonella * Shingella * E. CoSalmonella * Shingella * E. Coli 0157 * Campylobacter * Salmonella * ShingCampylobacter * Salmonella * Shingella * E. Coli 0157 * Campylobacter *0157 * Campylobacter * Salmonella * Shingella * E. Coli 0157 * CampylobE. Coli 0157 * Campylobacter * Salmonella * Shingella * E. Coli 0157 * CamShingella * E. Coli 0157 * Campylobacter * Salmonella * Shingella * E. CoSalmonella * Shingella * E. Coli 0157 * Campylobacter * Salmonella * ShingCampylobacter * Salmonella * Shingella * E. Coli 0157 * Campylobacter *0157 * Campylobacter * Salmonella * Shingella * E. Coli 0157 * Campylob
National Antimicrobial Resistance Monitoring System: Enteric BacteriaNational Antimicrobial Resistance Monitoring System: Enteric Bacteria
1999 Annual Report
NARMS
1999 Annual Report
NARMS

1999 National Antimicrobial Resistance Monitoring System (NARMS) For Enteric Bacteria Participants (Human Isolates)*
Centers for Disease Control and Prevention Frederick J. Angulo, Nina Marano, Shannon Rossiter, Jennifer McClellan, Thomas J. Van Gilder, Karen Stamey, Kevin Joyce, Richard Bishop, Tim Barrett, Joy Wells, Foodborne and Diarrheal Diseases Branch, Division of Bacterial and Mycotic Diseases; National Center for Infectious Diseases US Food and Drug Administration Marcia Headrick, Kathy Hollinger, Linda Tollefson, Office of Surveillance and Compliance, Center for Veterinary Medicine Participating Local and State Health Departments California Department of Health Services Sharon Abbott, Paul Kimsey, Sue Shallow, Duc Vugia, Jim Ware Colorado Department of Public Health and Environment Mike Rau, David Butcher, Carol Hoff, Richard Hoffman Connecticut Department of Public Health Bob Howard, Don Mayo, Terry Fiorentino Florida Department of Health Jody Baldy, Rima Farah, Ronald Baker, Richard Hopkins Georgia Division of Public Health Marsha Ray, Mahin Park, Suzanne Segler, Elizabeth Franko, Paul Blake Kansas Department of Health and Environment Robert Flahart, June Sexton, Roger Carlson, Gianfranco Pezzino Los Angeles County Department of Health Services Liga Kilman, Elizabeth Cordero, Joan Sturgeon, Mary Dorado, Deborah Brown, Laurene Mascola Massachusetts Department of Public Health Joseph Peppie, Alfred DeMaria, John Fontana, Robert Goldbaum Maryland Department of Health and Mental Hygiene Yongyu Wang, Judy Johnson, Glenn Morris Minnesota Department of Health

Fe Leano, Julie Wicklund, John Besser, New Jersey Department of Health Keith Pilot, Sylvia Matiuck, John Brook New York City Department of Health Alice Agasan, Wydenia Perry, Mel Backer, Marci Layton New York State Department of Health Tim Root, Shelley Zansky, Amy Davignon, Dale Morse Oregon Department of Human Resources Steve Mauvais, Maureen Cassidy, Theresa McGivern, Beletsachew Shiferaw, Paul Cieslak Tennessee Department of Health Henrietta Hardin, Cynthia Graves Washington Public Health Laboratories Jay Lewis, Donna Green, Jon Counts, Craig Columbel West Virginia Department of Health and Human Resources Doug McElfresh, Loretta Haddy, Mary Connie Smith * Information on animal isolates is available at www.nps.ars.usda.gov/projects/projects.htm?accession=402399

Page Number Tables 10 Table 1. Population size and number of isolates received and tested, by site, 1999 11 Table 2. Antimicrobial agents used for susceptibility testing for Salmonella, Shigella, E. coli O157, and Campylobacter isolates 12 Table 3. Antimicrobial resistance of Salmonella, Shigella, and E. coli O157 isolates, 1999 13 Table 4. Submission of isolates by site and by month of collection, 1999 18 Table 5. Frequency of non-Typhi Salmonella serotypes, 1999 19 Table 6. Frequency of non-Typhi Salmonella serotypes / Frequency of pansusceptibility among serotypes, 1996-1999 21 Table 7. Frequency of non-Typhi Salmonella serotypes / Frequency of multiresistance among serotypes, 1999 22 Table 8. Percentage of S. Typhimurium isolates with ACSSuT, ACKSSuT, or AKSSuT resistance patterns, by site, 1999 23 Table 9. Additional antimicrobial resistance for S. Typhimurium isolates with ACSSuT or AKSSuT patterns, 1999 24 Table 10. Clinical source of non-Typhi Salmonella isolates, 1999 25 Table 11. Serotypes of non-Typhi Salmonella with reduced susceptibility or resistance to ciprofloxacin, 1999 26 Table 12. Serotypes of non-Typhi Salmonella with reduced susceptibility or resistance to ceftriaxone, 1999 27 Table 13. Frequency of Shigella species, 1999 28 Table 14. Antimicrobial susceptibility of Shigella isolates, 1999 29 Table 15. Frequency of Campylobacter species, 1999 30 Table 16. Antimicrobial susceptibility of Campylobacter isolates, 1999

Page Number Figures
31 Figure 1. Number of isolates submitted, by site, 1999 32 Figure 2. Resistance among non-Typhi Salmonella isolates, 1996-1999 33 Figure 3. Non-Typhi Salmonella MICs, by antimicrobial agent, 1996-1999 50 Figure 4. Resistance among non-Typhi Salmonella serotypes, 1996-1999 65 Figure 5. Percent of non-Typhi Salmonella isolates which are serotype Typhimurium, by site, 1996-1999 66 Figure 6. Percent of Salmonella Typhimurium isolates that are resistant to Ampicillin, Chloramphenicol, Streptomycin, Sulfamethoxazole, and Tetracycline (ACSSuT), by site, 1996-1999 67 Figure 7. Percentage of Salmonella Typhimurium isolates that are resistant to Ampicillin, Kanamycin, Streptomycin, Sulfamethoxazole, and Tetracycline (AKSSuT), by site, 1996-1999 68 Figure 8. Resistance among Salmonella Typhi isolates, 1999 69 Figure 9. Salmonella Typhi MICs, by antimicrobial agent, 1999 74 Figure 10. Resistance among Shigella isolates, 1999 75 Figure 11. Resistance among Shigella sonnei and Shigella flexneri isolates, 1999 76 Figure 12. Shigella sonnei MICs, by antimicrobial agent, 1999 81 Figure 13. Shigella flexneri MICs, by antimicrobial agent , 1999 86 Figure 14. Resistance among E. coli O157 isolates, 1996-1999 87 Figure 15. E. coli O157 MICs, by antimicrobial agent, 1996-1999 104 Figure 16. Resistance among Campylobacter isolates, 1997-1999 105 Figure 17. Resistance among Campylobacter jejuni and Campylobacter coli isolates, 1997-1999 107 Figure 18. Campylobacter jejuni MICs, by antimicrobial agent, 1997-1999 115 Figure 19. Campylobacter coli MICs, by antimicrobial agent ,
1997-1999

National Antimicrobial Resistance Monitoring System For Enteric Bacteria
1999 Annual Report
Summary
In 1999, 1499 non-Typhi Salmonella isolates, 166 Salmonella Typhi isolates, 375 Shigella,
292 E. coli O157 isolates, and 319 Campylobacter isolates from humans were tested by the
National Antimicrobial Resistance Monitoring System (NARMS) for Enteric Bacteria. Twenty-six
percent of non-Typhi Salmonella isolates were resistant to one or more antimicrobial agents.
Among Salmonella serotype Typhimurium isolates, 49% were resistant to one or more
antimicrobial agents. Twenty-eight percent of Salmonella Typhimurium isolates had the multidrug-
resistant pattern characteristic of DT104; resistant to ampicillin, chloramphenicol, streptomycin,
sulfamethoxazole, and tetracycline (ACSSuT). One Salmonella isolate was resistant to
ciprofloxacin (S. Senftenberg). The percentage of non-Typhi Salmonella isolates with ciprofloxacin
minimum inhibitory concentrations (MICs) >0.25 µg/ml increased from 0.4% in 1996 to 1.0% in
1999. The percentage of non-Typhi Salmonella isolates with a ceftriaxone MIC > 16 µg/ml
increased from 0.1% in 1996 to 2% in 1999. Among S. Typhi isolates, 29% were resistant to one or
more antimicrobial agents. Among Shigella isolates, 91% were resistant to one or more
antimicrobial agents. Among E. coli O157 isolates, 10% were resistant to one or more
antimicrobial agents. Among all Campylobacter isolates, 53% were resistant to one or more
antimicrobial agents. Among Campylobacter jejuni isolates, 54% were resistant to one or more
antimicrobial agents; 18% were resistant to ciprofloxacin.

Methods
NARMS was launched in 1996, within the framework of CDC’s Emerging Infections
Program’s Epidemiology and Laboratory Capacity Program and the Foodborne Disease Active
Surveillance Network (FoodNet) as a collaboration among CDC, the U.S. Food and Drug
Administration (FDA)-Center for Veterinary Medicine, U. S. Department of Agriculture (USDA)-
Food Safety and Inspection Service and Agricultural Research Service, and state and local health
departments to monitor prospectively the antimicrobial resistance of human non-Typhi Salmonella
and Escherichia coli O157 isolates. Testing of Campylobacter isolates was added in 1997, and
testing of Salmonella Typhi and Shigella isolates was added in 1999. In 1999, there were 17
NARMS health department participants (CA, CO, CT, FL, GA, KS, Los Angeles County, MD, MN,
MA, NJ, New York City, NY, OR, TN, WA, and WV), representing approximately 103 million
persons (38% of the United States population), and 7 of the 9 U.S. regions [Table 1]. In 1999,
seven states (CA, CT, GA, MD, MN, NY, and OR) also monitored antimicrobial resistance among
human Campylobacter isolates.
In 1999, NARMS participating public health laboratories have selected every tenth non-
Typhi Salmonella, every Salmonella Typhi, every tenth Shigella, and every fifth E. coli O157 isolate
received at their laboratory, and forwarded the isolates to CDC for susceptibility testing. Although
we requested that participating laboratories send every S. Typhi isolate, analysis was restricted to
one isolate per patient. At CDC, a semiautomated system (Sensititre, Trek Diagnostics, Westlake,
OH) is used to determine the MICs for 17 antimicrobial agents: amikacin, ampicillin,
amoxicillin-clavulanic acid, apramycin, ceftiofur, ceftriaxone, cephalothin, chloramphenicol,
ciprofloxacin, florfenicol, gentamicin, kanamycin, nalidixic acid, streptomycin, sulfamethoxazole,
tetracycline, and trimethoprim-sulfamethoxazole [Table 2].

Public health laboratories from eight states also select and forward the first Campylobacter
isolate received each week to CDC for susceptibility testing. For Campylobacter, the E-test system
(AB BIODISK, Solna, Sweden) is used to determine the MICs for 8 antimicrobial agents:
azithromycin, chloramphenicol, ciprofloxacin, clindamycin, erythromycin, gentamicin, nalidixic acid,
and tetracycline [Table 2]. After confirmation to genus level, identification of Campylobacter to
species level is performed using the hippurate test, and, for hippurate-negative Campylobacter
isolates, and polymerase chain reaction to identify the hippuricase gene, diagnostic of
Campylobacter jejuni.
For all pathogens in this report, MIC results are dichotomized: isolates with intermediate
susceptibility are categorized as sensitive. Breakpoints are determined using, when available,
National Committee for Clinical Laboratory Standards (NCCLS) [Table 2].
Results
Non-Typhi Salmonella
A total of 1514 non-Typhi Salmonella isolates were received at CDC in 1999; 1499/1514
(99%) were viable upon receipt and tested for antimicrobial susceptibility [Table 4a, Figure 1]. Non-
Typhi Salmonella refers to all Salmonella serotypes except serotype Typhi. The antimicrobial
agents to which Salmonella demonstrated the highest prevalence of resistance were tetracycline,
sulfamethoxazole, streptomycin, and ampicillin: 292/1499 (19%) were resistant to tetracycline,
272/1499 (18%) isolates were resistant to sulfamethoxazole, 254/1499 (17%) were resistant to
streptomycin, and 234/1499 (16%) were resistant to ampicillin [Figure 2]. Figure 3 provides MIC
results for each of the 17 antimicrobials tested. One (0.1%) isolate (S. serotype Senftenberg) was
resistant to ciprofloxacin; 16 (1%) isolates were resistant to nalidixic acid. Six (0.4%) isolates were
resistant to ceftriaxone.

Among non-Typhi Salmonella isolates, 388/1499 (26%) were resistant to one or more
agents, and 315/1499 (21%) were resistant to two or more agents. Among Salmonella isolates
tested, 269/1499 (18%) were serotype Enteritidis and 362/1499 (24%) were serotype Typhimurium
(includes serotype Typhimurium var. Copenhagen) [Table 5]. In 1999, the serotypes with the
highest proportion of isolates which were pansusceptible were Javiana (98%), Thompson (97%),
and Braenderup (96%) [Table 6]. Figure 4 provides the resistance among non-Typhi Salmonella
serotypes from 1996-1999. Among S. Enteritidis isolates, 44/269 (16%) were resistant to one or
more antimicrobial agents. Among S. Typhimurium isolates, 179/362 (49%) were resistant to one
or more antimicrobial agents [Table 7]. Figure 5 provides the percent of S. Typhimurium by site.
In recent years, a multidrug-resistant strain of S. Typhimurium has been identified. This
strain is characterized not only by the multidrug-resistant pattern, but also by the phage type –
DT104 [Table 8]. Although none of 362 S. Typhimurium isolates tested were phage typed, 102
(28%) were resistant to the five antimicrobial agents, ampicillin, chloramphenicol, streptomycin,
sulfamethoxazole, and tetracycline (ACSSuT), to which S. Typhimurium DT104 is commonly
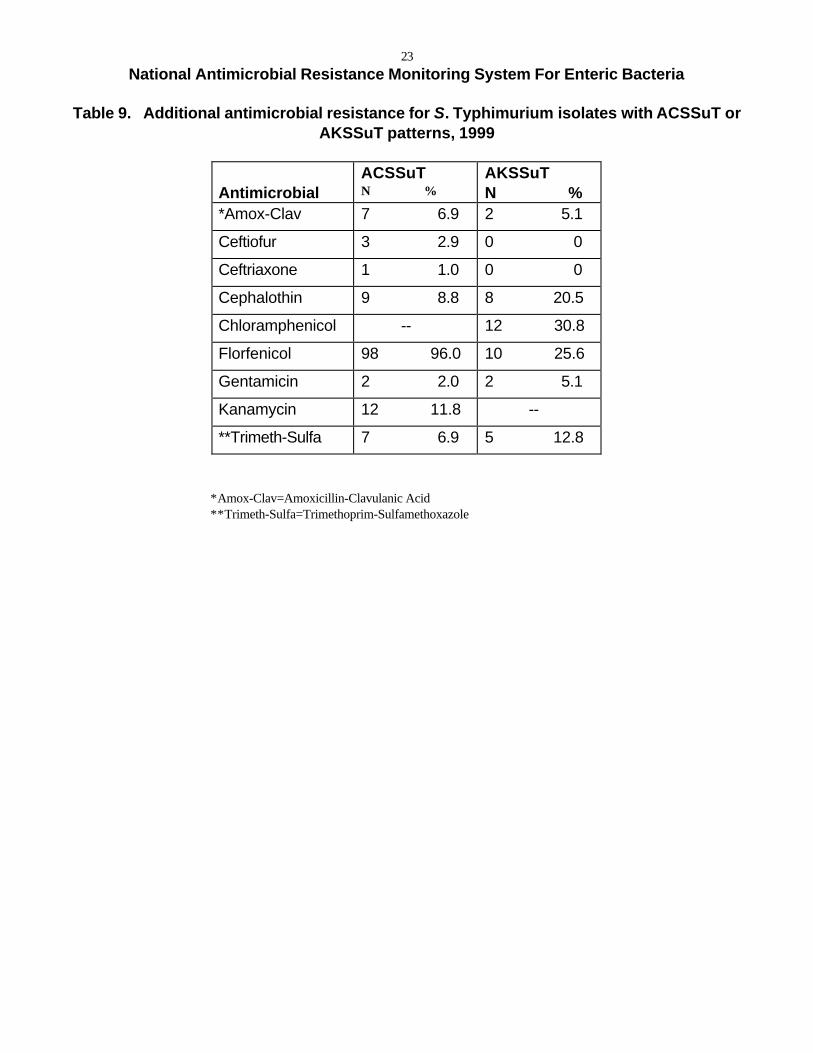
resistant [Figure 6]. Of the 102 S. Typhimurium isolates with the ACSSuT resistance pattern, 12
(12%) were also resistant to kanamycin, 9 (9%) were also resistant to cephalothin, 7 (7%) were
also resistant to amoxicillin-clavulanic acid, 3 (3%) were also resistant to ceftiofur, and 1 (1%) was
also resistant to ceftriaxone [Table 9].
A second penta-resistant pattern, resistance to ampicillin, kanamycin, streptomycin,
sulfamethoxazole, and tetracycline (AKSSuT), also has emerged among Salmonella Typhimurium
[Table 8]. Strains with this resistance pattern are not DT104 by phage typing. Among 362
Salmonella Typhimurium isolates tested, 39/362 (11%) had the AKSSuT resistance pattern [Figure
7]. Of the 39 S. Typhimurium isolates with the AKSSuT resistance pattern, 12 (31%) were also
resistant to chloramphenicol, 8 (20%) were also resistant to cephalothin, and 2 (5%) were also

resistant to amoxicillin-clavulanic acid [Table 9]. Table 10 describes the clinical source of all non-
Typhi isolates tested in 1999.
One Salmonella isolate (0.1%) was resistant to ciprofloxacin [Figure 3i]. The percentage of
Salmonella isolates with ciprofloxacin MICs >0.25 increased from 0.4% (5/1326) in 1996 to 1%
(15/1499) in 1999 [Table 11]. The percentage of Salmonella isolates resistant to nalidixic acid (MIC
>32) increased from 0.4% (5/1326) in 1996 to 1% (16/1499) in 1999 [Figure 3m]. The percentage
of Salmonella isolates with decreased susceptibility to ceftriaxone (MIC >16) increased from 0.1%
(1/1326) in 1996 to 2% (28/1499) in 1999 [Table 12, Figure 3f]. Seventeen of the 97 (18%) S.
Newport isolates were highly multidrug-resistant, resistant to amoxicillin-clavulanic acid, ampicillin,
ceftiofur, cephalothin, chloramphenicol, streptomycin, sulfamethoxazole, and tetracycline as well as
having decreased susceptibility to ceftriaxone [Figure 4j].
Salmonella Typhi
A total of 249 S. Typhi isolates were received at CDC in 1999; 207/249 (83%) were viable
upon receipt and tested for antimicrobial sensitivity [Table 4b, Figure 1]. Of these 207 isolates,
forty-one S. Typhi isolates were eliminated from analysis because they were duplicate
submissions. Among S. Typhi isolates, 49/166 (29%) were resistant to one or more antimicrobial
agents and 25/166 (15%) were resistant to two or more agents. The most common resistances
among S. Typhi isolates were to nalidixic acid 31/166 (19%), sulfamethoxazole 28/166 (17%), or
streptomycin 23/166 (14%) [Table 3, Figure 8]. Twenty-one (13%) isolates were resistant to
ampicillin; 20 (12%) isolates were resistant to chloramphenicol. Figure 9 provides data on
Salmonella Typhi MICs by antimicrobial agent. None of the S. Typhi isolates tested were resistant
to amikacin, apramycin, ciprofloxacin, florfenicol, gentamicin, or kanamycin.

Shigella
A total of 377 Shigella isolates were received at CDC in 1999; 375/377 (99%) were viable
upon receipt and tested for antimicrobial sensitivity [Table 4c, Figure 1]. Among Shigella isolates,
341/375 (91%) were resistant to one or more antimicrobial agents and 244/375 (65%) were
resistant to two or more agents. The most common resistances among all Shigella isolates were to
ampicillin 288/375 (77%), tetracycline 215/375 (57%), streptomycin 209/375 (56%), or
sulfamethoxazole 206/375 (55%) [Table 3, Figure 10]. One hundred ninety-three (51%) isolates
were resistant to trimethoprim-sulfamethoxazole. Shigella sonnei isolates were most frequently
resistant to ampicillin 219/275 (80%), sulfamethoxazole 150/275 (54%), or streptomycin 143/275
(52%) [Figure 11]. Figure 12 provides data on Shigella sonnei MICs by antimicrobial agent. The
most common resistances among Shigella flexneri isolates were to tetracycline 80/87 (92%),
ampicillin 67/87 (77%), or chloramphenicol 56/87 (64%) [Figure 11]. Figure 13 provides data on
Shigella flexneri MICs by antimicrobial agent. None of the Shigella isolates tested were resistant
to amikacin, apramycin, ceftiofur, ceftriaxone, ciprofloxacin, or florfenicol.
E. coli O157
A total of 296 E. coli O157 isolates were received at CDC in 1999; 292/296 (99%) were
viable upon receipt and tested for antimicrobial sensitivity [Table 4d, Figure 1]. Among E. coli O157
isolates, 30/292 (10%) were resistant to one or more antimicrobial agents and 12/292 (4%) were
resistant to two or more agents. The most common resistances among E. coli O157 isolates were
to sulfamethoxazole 24/292 (8%), tetracycline 10/292 (3%), and streptomycin 8/292 (3%) [Table 3,
Figure 14]. Figure 15 provides data on E. coli O157 MICs by antimicrobial agent. None of the E.
coli O157 isolates tested were resistant to amikacin, apramycin, ceftiofur, ceftriaxone,
chloramphenicol, ciprofloxacin, or florfenicol.

Campylobacter
A total of 393 Campylobacter isolates were collected in 1999 and forwarded to CDC;
319/398 (80%) were viable upon receipt and tested for antimicrobial susceptibility [Table 4e, Figure
1]. Of the isolates tested, 295/319 (92%) were C. jejuni, 20/319 (6%) were C. coli, 2 were C.
upsaliensis, and 2 were C. fetus [Table 15].
Among Campylobacter jejuni isolates, 158/295 (54%) were resistant to one or more
antimicrobial agents, and 60/295 (20%) were resistant to two or more agents. The most common
resistances among Campylobacter jejuni isolates was to tetracycline 135/295 (46%) followed by
nalidixic acid 59/295 (20%), and ciprofloxacin 52/295 (18%) [Table 16, Figure 17a]. Figure 18
provides data on C. jejuni MICs by antimicrobial agent.
Among Campylobacter coli isolates, 10/20 (50%) were resistant to one or more antimicrobial
agents, and 7/20 (35%) were resistant to two or more agents. The most common resistances
among C. coli isolates was to nalidixic acid 6/20 (30%), tetracycline 6/20 (30%), or ciprofloxacin
6/20 (30%) [Table 16, Figure 17b]. Figure 19 provides data on C. coli MICs by antimicrobial
agent.
The NARMS 1997-1999 Annual Reports are posted on the NARMS Website. The address is
www.cdc.gov./ncidod/dbmd/narms

National Antimicrobial Resistance Monitoring System: Enteric Bacteria
1999 Publications and Presentations
Publications 1. Zirnstein G, Li Y, Swaminathan B, Angulo F. Ciprofloxacin resistance in Campylobacter
jejuni isolates: Dectection of gyrA resistance mutations by MAMA PCR and DNA sequence analysis. Journal of Clinical Microbiology 1999; 37: 3276-3280.
Abstracts 1. Dunne E, Fey P, Shillam P, Kludt P, Keene W, Harvey E, Stamey K, Barrett T, Marano N,
Angulo F. Emergence of domestically acquired AmpC-mediated ceftriaxone-resistant Salmonella serotype Typhimurium (ST) infections. In Program and Abstracts of 39th Interscience Conference on Antimicrobial Agents and Chemotherapy, 1999 September,
San Francisco, CA. 2. Fiorentino T, Howard R, Kinney A, Marcus R, Mshar P, Marano N, Westerman J, Reddy S,
Angulo F. Routine subtyping of Salmonella serotype Typhimurium by PFGE facilitates focused epidemiological investigations in Connecticut. In Program and Abstracts of 39th Interscience Conference on Antimicrobial Agents and Chemotherapy, 1999 September, San Francisco, CA.
3. Fontana J, Bagshaw J, Angulo F, Marano N, Shea D, Goddard A, George H. Plasmid DNA
associated with specific bands in PFGE patterns of antibiotic-resistant Salmonella serotype Enteritidis. In Program and Abstracts of 39th Interscience Conference on Antimicrobial Agents and Chemotherapy, 1999 September, San Francisco, CA.
4. Hollinger K, Bager F, Marano N, Angulo F, Aaerestrup F, Tollefson L, Gerner-Smidt,
Wegener H. Aminoglycoside (AG) resistance in the United States and Denmark: an association between resistance and AG use in food animals, particularly in US poultry sources. In Program and Abstracts of 39th Interscience Conference on Antimicrobial Agents and Chemotherapy, 1999 September, San Francisco, CA.
5. Hollinger K, Silvers L, Marano N, Fedorka-Cray P, Angulo F, Tollefson L, Stamey K.
Antibiotic resistance in Salmonella enterica Serotypes Heidelberg, Kentucky, and Thompson isolated from human and broiler chicken sources. In Program and Abstracts of 39th Interscience Conference on Antimicrobial Agents and Chemotherapy, 1999 September, San Francisco, CA.
6. Marano N, Benson J, Koehler J, MacKinson C, Wang Y, Madden J, Debess E, Hill B,
Archibald L, Boel J, Wegener H, Angulo F. Presence of high-level gentamicin-resistant (HLGR) enterococci in humans and retail chicken products in the US, but not Denmark. In Program and Abstracts of 39th Interscience Conference on Antimicrobial Agents and Chemotherapy, 1999 September, San Francisco, CA.

7. Marano N, Stamey K, Barrett T, Angulo F. High prevalence of gentamicin resistance among selected Salmonella serotypes in the US: associated with heavy use of gentamicin in poultry? In Program and Abstracts of Infectious Disease Society of America 37th Annual Meeting, 1999 November, Philadelphia, PA.
8. Marano N, Stamey K, Barrett TJ, Angulo FJ and NARMS: Enteric Bacteria Working Group.
The national antimicrobial resistance monitoring system (NARMS): trends in antimicrobial resistance. Emerging Antibiotic Resistance in Foodborne Enteric Pathogens Conference,1999 August, Athens, GA.
9. Marano N, Stamey K, Barrett TJ, Bopp C, Dabney P, Angulo FJ and the NARMS Working
Group. Emerging quinolone-and-extended spectrum cephalosporin-resistant Salmonella in the United States.. In Program and Abstracts of American Society for Microbiology, 99th General Meeting, 1999 May, Chicago, IL.
10. Marano N, Stamey K, Barrett TJ, Angulo FJ and NARMS: Enteric Bacteria Working Group.
Antibiotic resistance among human Campylobacter isolates in the United States, 1997-1998. Campylobacter, Helicobacter and Related Organisms Conference, 1999 September, Baltimore, MD.

10
National Antimicrobial Resistance Monitoring System For Enteric Bacteria
Table 1. Population size and number of isolates received and tested, by site, 1999
Site Pop. Size*
No. (%)
Non-TyphiSalmonella
No. (%)
Salmonella Typhi
No. (%)
Shigella
No. (%)
E. coli
No. (%)
Campylobacter **
No. (%)California (1) 2,162,359 (2) 54 (4) 6 (4) 5 (1) 6
(2)48 (15)
Colorado 4,056,133 (4) 79 (5) 2 (1) 18 (5) 15 (5)
Connecticut 3,282,031 (3) 63 (4) 6 (4) 7 (2) 20 (7) 53 (16)
Florida 15,111,244 (15) 100 (7) 19 (11) 14 (4) 13 (4)
Georgia 7,788,240 (8) 126 (8) 2 (1) 19 (5) 14 (5) 52 (16)
Kansas 2,654,052 (3) 27 (2) 1 (1) 5 (1) 4(1)
Los Angeles (2) 9,329,989 (9) 134 (9) 25 (15) 19 (5) 3(1)
Maryland 5,171,634 (5) 48 (3) 3 (2) 2 (1) 5(2)
22 (7)
Massachusetts 6,175,169 (6) 123 (8) 17 (10) 80 (21) 40 (14)
Minnesota 4,775,508 (5) 62 (4) 4 (2) 19 (5) 32 (11) 42 (13)
New Jersey 8,143,412 (8) 133 (9) 22 (13) 34 (9) 22 (8)
New York City (3) 7,428,524 (7) 174 (12) 37 (22) 50 (13) 1(0)
New York State (4) 10,768,077 (10) 146 (10) 10 (6) 12 (3) 58 (20) 54 (17)
Oregon 3,316,154 (3) 44 (3) 4 (2) 9 (2) 12 (4) 34 (11)
Tennessee 5,483,535 (5) 70 (5) 1 (1) 65 (17) 12 (4) 14 (4)
Washington 5,756,361 (6) 96 (6) 7 (4) 13 (4) 31 (11)
West Virginia 1,806,928 (2) 20 (1) 0 (0) 4 (1) 4(1)
Totals 103,209,350 (100) 1499 (100) 166 (100) 375 (100) 292 (100) 319 (100)
* County population 1999, U.S. Census Bureau, post-census estimates** Campylobacter isolates are submitted only from FoodNet sites, population size of FoodNet sites is 25.6million persons (see http://www.cdc.gov/ncidod/dbmd/foodnet/default.htm)(1) San Francisco and Alameda Counties(2) Los Angeles County(3) Five boroughs of New York City (Bronx, Brooklyn, Manhattan, Queens, Staten Island)(4) Excluding New York City

11
National Antimicrobial Resistance Monitoring System For Enteric Bacteria
Table 2. Antimicrobial agents used for susceptibility testing for Salmonella, Shigella, E.coli O157, and Campylobacter isolates
Antimicrobial Agent Antimicrobial AgentConcentration Range (µg/ml)
Breakpoints[R] [I] [S]
Code
Amikacin 4 - 32 > 64 32 < 16 Ak
Amoxicillin – Clavulanic Acid 0.5/0.25 – 32/16 > 32 16 < 8 Cv
Ampicillin 2 – 64 > 32 16 < 8 A
Apramycin** 2 – 16 > 32 16 < 8 Ap
Azithromycin* 0.016 – 256 > 2 0.5-1 < 0.25 Az
Ceftiofur** 0.5 – 16 > 8 4 < 2 Cf
Ceftriaxone 0.25 – 64 > 64 32 < 8 Cx
Cephalothin 1 – 32 > 32 16 < 8 Ce
ChloramphenicolChloramphenicol*
4 – 320.125 – 256
> 32 16 < 8> 32 16 < 8
C
CiprofloxacinCiprofloxacin*
0.015 – 20.016 – 32
> 4 2 < 1> 4 2 < 1
Cp
Clindamycin* 0.032 – 256 > 4 1-2 < 0.5 Cl
Erythromycin* 0.047 – 256 > 8 1-4 < 0.5 E
Florfenicol** 2-16 > 16 F
GentamicinGentamicin*
0.25 – 160.025 – 16
> 16 8 < 4> 16 8 < 4
G
Kanamycin 16 – 64 > 64 32 < 16 K
Nalidixic AcidNalidixic Acid*
4 – 640.047 - 256
> 32 < 16> 32 < 16
Na
Streptomycin 32 – 356 > 64 < 32 S
Sulfamethoxazole 128 – 512 > 512 < 256 Su
TetracyclineTetracycline*
4 – 640.023 – 32
> 16 8 < 4> 16 8 < 4
T
Trimethoprim - Sulfamethoxazole 0.12/2.4 – 4/76 > 4/76 < 2/38 Tm
* Campylobacter antimicrobial agents and concentration ranges used
** No NCCLS interpretive standards for this antimicrobial agent (veterinary use only)

12
National Antimicrobial Resistance Monitoring System For Enteric Bacteria
Table 3. Antimicrobial resistance of Salmonella, Shigella, and E. coli O157 isolates, 1999
Antimicrobial Agent Non-TyphiSalmonella(N=1499)
N %
SalmonellaTyphi(N=166)
N %
Shigella(N=375)
N %
E. coli O157(N=292)
N%
Amikacin 0 0 0 0 0 0 00
Amoxicillin – Clavulanic Acid 36 2 1 0.6 4 1 10.3
Ampicillin 234 16 21 13 291 77 41
Apramycin 5 0.3 0 0 0 0 00
Ceftiofur 31 2 2 1 0 0 00
Ceftriaxone 6 0.4 1 0.6 0 0 00
Cephalothin 55 4 4 2 12 3 21
Chloramphenicol 138 9 20 12 65 17 00
Ciprofloxacin 1 0.1 0 0 0 0 00
Florfenicol 128 8 0 0 0 0 00
Gentamicin 34 2 0 0 1 0.3 10.3
Kanamycin 66 4 0 0 2 0.5 21
Nalidixic Acid 16 1 31 19 6 2 21
Streptomycin 254 17 23 14 209 56 83
Sulfamethoxazole 272 18 28 17 210 55 248
Tetracycline 292 19 15 9 215 57 103
Trimethoprim - Sulfamethoxazole 31 2 21 13 193 51 41

13
National Antimicrobial Resistance Monitoring System For Enteric Bacteria
Table 4a. Non-Typhi Salmonella submissions by site and by month of collection, 1999
Site Total Jan Feb Mar Apr May Jun Jul Aug Sep Oct Nov Dec
CA 54 2 4 3 4 3 5 7 5 7 4 5 5
CO 79 4 6 8 7 9 9 7 9 7 3 5 5
CT 64 3 3 4 3 5 7 9 7 7 7 3 6
FL 100 2 7 6 4 5 10 8 7 15 13 15 8
GA 130 9 7 10 7 8 12 17 11 16 14 10 9
KS 27 1 1 2 2 2 3 3 4 4 2 2 1
LX 134 8 5 8 8 8 11 21 18 13 14 11 9
MA 130 7 5 9 6 11 15 16 15 16 8 12 10
MD 48 3 0 2 1 3 1 11 7 7 5 4 4
MN 62 3 4 4 6 4 5 11 8 6 4 4 3
NJ 134 9 9 7 8 9 11 14 17 18 10 10 12
NYC 176 13 11 10 10 8 16 23 20 21 15 14 15
NYS 146 8 5 7 7 14 13 32 16 11 11 11 11
OR 44 3 4 2 2 3 8 6 4 3 2 3 4
TN 70 6 2 4 2 7 7 11 11 4 7 5 4
WA 96 5 7 7 4 5 16 14 10 6 6 6 10
WV 20 1 2 1 1 1 4 0 3 3 2 1 1
Total 1514 87 82 94 82 105 153 210 172 164 127 121 117

14
National Antimicrobial Resistance Monitoring System For Enteric Bacteria
Table 4b. Salmonella Typhi submissions by site and by month of collection, 1999
Site Total Jan Feb Mar Apr May Jun Jul Aug Sep Oct Nov Dec
CA 11 0 3 2 2 1 0 1 0 0 1 0 1
CO 2 0 0 0 0 0 2 0 0 0 0 0 0
CT 8 0 0 1 1 0 2 2 1 0 0 0 1
FL 20 7 8 0 3 1 0 0 0 1 0 0 0
GA 3 0 0 0 0 0 1 0 0 1 0 0 1
KS 1 0 0 0 0 0 0 0 1 0 0 0 0
LX 59 13 14 6 1 3 1 2 1 5 5 1 7
MA 18 0 3 3 1 0 0 7 0 0 0 3 1
MD 3 0 0 0 0 1 0 1 1 0 0 0 0
MN 4 0 0 0 2 0 0 1 1 0 0 0 0
NJ 36 0 4 4 1 7 1 2 3 9 3 1 1
NYC 52 2 6 2 3 1 4 4 12 1 5 6 6
NYS 14 2 4 0 0 3 0 0 1 3 1 0 0
OR 7 0 0 1 1 2 1 2 0 0 0 0 0
TN 1 0 0 1 0 0 0 0 0 0 0 0 0
WA 10 1 0 4 0 1 0 1 0 0 0 3 0
WV 0 0 0 0 0 0 0 0 0 0 0 0 0
Total 249 25 42 24 15 20 12 23 21 20 15 14 18

15
National Antimicrobial Resistance Monitoring System For Enteric Bacteria
Table 4c. Shigella submissions by site and by month of collection, 1999
Site Total Jan Feb Mar Apr May Jun Jul Aug Sep Oct Nov Dec
CA 5 0 0 0 0 0 0 0 3 0 1 1 0
CO 18 1 1 0 2 0 0 2 2 4 1 3 2
CT 7 0 0 0 1 1 1 0 1 1 0 1 1
FL 14 1 0 3 2 4 1 1 1 0 0 1 0
GA 19 1 1 1 2 1 1 3 2 1 3 2 1
KS 5 0 0 0 0 1 0 1 1 0 0 2 0
LX 19 3 1 2 1 1 1 1 2 2 2 1 2
MA 80 1 3 2 1 1 3 6 20 15 14 10 4
MD 2 0 1 0 0 0 0 1 0 0 0 0 0
MN 19 1 0 1 1 2 4 2 2 1 2 2 1
NJ 34 2 3 4 3 2 2 3 3 4 3 3 2
NYC 51 4 4 6 3 0 5 6 6 5 4 4 4
NYS 12 3 1 1 1 0 0 1 2 2 1 0 0
OR 9 1 0 1 0 0 1 0 2 1 1 1 1
TN 65 10 4 4 2 8 15 2 3 2 3 3 9
WA 14 1 1 1 1 1 1 1 1 2 1 1 2
WV 4 0 1 0 0 0 1 0 0 1 1 0 0
Total 377 29 21 26 20 22 36 30 51 41 37 35 29

16
National Antimicrobial Resistance Monitoring System For Enteric Bacteria
Table 4d. E. coli O157 submissions by site and by month of collection, 1999
Site Total Jan Feb Mar Apr May Jun Jul Aug Sep Oct Nov Dec
CA 6 1 0 0 0 0 1 1 0 1 1 1 0
CO 15 1 0 1 0 1 1 4 1 5 0 0 1
CT 20 2 0 1 1 1 0 6 4 2 2 1 0
FL 13 1 0 0 1 0 3 2 3 1 1 1 0
GA 14 1 0 0 2 0 1 2 1 1 1 2 3
KS 4 0 0 0 0 0 0 1 1 1 0 0 1
LX 3 0 0 0 1 0 0 1 0 0 1 0 0
MA 40 1 2 1 1 4 2 10 4 8 4 2 1
MD 5 0 0 0 0 1 0 1 0 2 1 0 0
MN 32 1 1 0 1 1 5 7 6 3 5 1 1
NJ 22 0 1 0 1 2 3 3 3 3 2 2 2
NYC 1 0 0 0 0 0 0 1 0 0 0 0 0
NYS 61 1 0 0 3 2 9 8 4 26 4 2 2
OR 12 1 1 0 0 1 1 2 2 3 1 0 0
TN 12 1 0 0 0 1 2 1 1 2 2 2 0
WA 31 0 0 1 2 0 2 4 8 6 5 2 1
WV 5 1 0 0 0 0 1 0 0 2 0 1 0
Total 296 12 5 4 13 14 31 54 38 66 30 17 12

17
National Antimicrobial Resistance Monitoring System For Enteric Bacteria
Table 4e. Campylobacter submissions by site and by month of collection, 1999
Site Total Jan Feb Mar Apr May Jun Jul Aug Sep Oct Nov Dec
CA 48 4 4 4 4 4 4 4 4 4 4 4 4
CT 53 4 6 4 5 5 3 4 4 4 5 3 6
GA 52 4 5 3 4 4 5 4 0 9 5 4 5
MD 22 4 0 2 1 2 5 0 0 0 0 6 2
MN 42 4 4 5 4 0 4 4 5 3 0 5 4
NYS 54 5 3 4 2 5 6 7 6 5 5 2 4
OR 34 3 1 0 3 7 6 4 3 0 1 3 3
TN 14 2 1 0 0 2 4 0 0 0 2 0 3
Total 319 30 24 22 23 29 37 27 22 25 22 27 31

18
National Antimicrobial Resistance Monitoring System For Enteric Bacteria
Table 5. Frequency of non-Typhi Salmonella Serotypes, 1999
Serotype N %
Typhimurium 362 24.2
Enteritidis 269 17.9
Newport 97 6.5
Heidelberg 89 5.9
Montevideo 52 3.5
Muenchen 51 3.4
Javiana 42 2.8
St. Paul 35 2.3
Agona 33 2.2
Thompson 32 2.1
Braenderup 24 1.6
Oranienburg 24 1.6
Hadar 21 1.4
Infantis 17 1.1
Stanley 17 1.1
Not Serotyped 17 1.1
All Others 317 21.1
Total 1499 100

19National Antimicrobial Resistance Monitoring System For Enteric Bacteria
Table 6. Frequency of non-Typhi Salmonella Serotypes /
Frequency of Pansusceptibility* Among Serotypes, 1996-1999
Selected Salmonella Serotypes: NARMS 1996-1999 1999
Total Isolates Pansusceptible Isolates Serotype # % of Salmonella # % of Serotype
Javiana 42 3.6 41 97.6 Thompson 32 2.8 31 96.9 Braenderup 24 2.1 23 95.8 Oranienburg 24 2.1 23 95.8 Infantis 17 1.5 16 94.1 Muenchen 51 4.4 47 92.2 Montevideo 52 4.5 47 90.4 Enteritidis 269 23.1 225 83.6 St. Paul 35 3.0 29 82.9 Newport 97 8.3 74 76.3 Stanley 17 1.5 12 70.6 Heidelberg 89 7.6 61 68.5 Agona 33 2.8 21 63.6 Typhimurium 362 31.1 183 50.6 Hadar 21 1.8 0 0
1998
Total Isolates Pansusceptible Isolates Serotype # % of Salmonella # % of Serotype
Braenderup 23 1.6 23 100 Miami 10 0.7 10 100 Mississippi 16 1.1 16 100 Poona 12 0.8 12 100 Thompson 24 1.7 24 100 Oranienburg 33 2.3 32 96.7 Javiana 54 3.7 52 96.3 Newport 79 5.5 73 92.4 Montevideo 33 2.3 30 91.0 Infantis 22 1.5 20 90.9 Muenchen 30 2.1 27 90 Enteritidis 245 16.9 214 87.3 Brandenburg 10 0.7 8 80 St. Paul 31 2.1 24 77.4 Stanley 10 0.7 6 60 Agona 39 2.7 23 59.0 Heidelberg 103 7.1 58 56.3 Schwarzengrund 14 1.0 7 50 Typhimurium 378 26.0 176 46.6 Hadar 26 1.8 0 0
*Pansusceptible to antimicrobial agents tested all 4 years: amoxicillin-clavulanic acid, ampicillin, apramycin, ceftiofur, ceftriaxone, cephalothin, chloramphenicol, ciprofloxacin, gentamicin, kanamycin, nalidixic acid, streptomycin, sulfamethoxazole, tetracycline, trimethoprim-sulfamethoxazole

20National Antimicrobial Resistance Monitoring System For Enteric Bacteria
1999 Annual Report
Table 6. Frequency of non-Typhi Salmonella Serotypes / Frequency of Pansusceptibility* Among Serotypes, 1996-1999 (continued)
1997
Total Isolates Pansusceptible isolates Serotype # % of Salmonella # % of Serotype
Javiana 19 1.5 19 100 Thompson 32 2.5 31 96.9 Infantis 29 2.3 28 96.6 Montevideo 27 2.1 26 96.3 Braenderup 17 1.3 16 94.1 Oranienburg 27 2.1 25 92.6 Newport 48 2.7 42 87.5 Poona 13 1.0 11 84.6 St. Paul 19 1.5 16 84.2 Adelaide 10 0.8 8 80.0 Enteritidis 301 23.5 223 74.1 Muenchen 17 1.3 11 64.7 Heidelberg 75 5.9 48 64.0 Agona 25 2.0 13 52.0 Typhimurium 326 25.4 122 37.4 Hadar 30 2.3 1 3.3
1996
Total Isolates Pansusceptible isolates Serotype # % of Salmonella # % of Serotype
Braenderup 22 1.7 22 100 Montevideo 37 2.8 33 89.2 Javiana 27 2.0 24 88.9 Oranienburg 18 1.4 16 88.9 Java 12 0.9 10 83.3 Muenchen 17 1.3 14 82.4 Newport 51 3.8 42 82.4 Anatum 11 0.8 9 81.8 Thompson 24 1.8 19 79.2 Paratyphi-B 11 0.8 8 72.7 Infantis 18 1.4 13 72.2 Enteritidis 357 26.9 247 69.2 St. Paul 17 1.3 11 64.7 Heidelberg 74 5.6 38 51.4 Agona 12 0.9 5 41.7 Typhimurium 305 23.0 110 36.1 Hadar 38 2.9 1 2.6
*Pansusceptible to antimicrobial agents tested all 4 years: amoxicillin-clavulanic acid, ampicillin, apramycin, ceftiofur, ceftriaxone, cephalothin, chloramphenicol, ciprofloxacin, gentamicin, kanamycin, nalidixic acid, streptomycin, sulfamethoxazole, tetracycline, trimethoprim-sulfamethoxazole

21National Antimicrobial Resistance Monitoring System For Enteric Bacteria
Table 7. Frequency of non-Typhi Salmonella Serotypes /
Frequency of Multiresistance Among Serotypes, 1999
Serotype Total
N %
Number resistant to > 1 antimicrobial
N %
Number resistant to > 2 antimicrobials N %
Typhimurium 362 24.4 179 49.5 166 45.9 Enteritidis 269 18.2 44 16.4 26 9.7 Newport 97 6.5 23 23.7 17 17.5 Heidelberg 89 6.0 28 31.5 25 28.1 Montevideo 52 3.5 5 9.6 5 9.6 Muenchen 51 3.4 4 7.8 4 7.8 Javiana 42 2.8 1 2.4 0 0 St. Paul 35 2.4 6 17.1 5 14.3 Agona 33 2.2 12 36.4 9 27.3 Thompson 32 2.2 1 3.1 1 3.1 Braenderup 24 1.6 1 4.2 0 0 Oranienburg 24 1.6 1 4.2 0 0 Hadar 21 1.4 21 100 18 93.3 Infantis 17 1.1 1 5.9 0 0 Stanley 17 1.1 5 29.4 5 29.4

22
National Antimicrobial Resistance Monitoring System For Enteric Bacteria
Table 8. Percentage of S. Typhimurium isolates with ACSSuT, ACKSSuT, or AKSSuTresistance patterns, by site, 1999
Site Total #TyphimuriumN %
ACSSuTTyphimuriumN %
ACKSSuTTyphimuriumN %
AKSSuTTyphimuriumN %
California 6 1.7 3 50.0 1 16.7 1 16.7
Colorado 29 8.0 4 13.8 0 0 1 3.4
Connecticut 20 5.5 5 25.0 1 5.0 4 20.0
Florida 14 3.9 6 42.9 0 0 1 7.1
Georgia 24 6.6 6 25.0 0 0 2 8.3
Kansas 14 3.9 3 21.4 1 7.1 1 7.1
Los Angeles 18 5.0 8 44.4 0 0 2 11.1
Maryland 12 3.3 2 16.7 0 0 1 8.3
Massachusetts 40 11.1 6 15.0 1 2.5 4 10.0
Minnesota 19 5.3 8 42.1 1 5.2 1 5.2
New Jersey 29 8.0 11 37.9 1 3.4 2 6.9
New York City 13 3.6 4 30.8 0 0 1 7.7
New York State 49 13.5 13 26.5 1 2.0 5 10.2
Oregon 10 2.8 3 30.0 0 0 0 0
Tennessee 17 4.7 4 23.5 1 5.9 3 17.6
Washington 35 9.7 13 37.1 4 11.4 9 25.7
West Virginia 13 3.6 3 23.1 0 0 1 7.7
Totals 362 100 102 28.2 12 3.3 39 10.8
23
National Antimicrobial Resistance Monitoring System For Enteric Bacteria
Table 9. Additional antimicrobial resistance for S. Typhimurium isolates with ACSSuT orAKSSuT patterns, 1999
AntimicrobialACSSuTN %
AKSSuTN %
*Amox-Clav 7 6.9 2 5.1
Ceftiofur 3 2.9 0 0
Ceftriaxone 1 1.0 0 0
Cephalothin 9 8.8 8 20.5
Chloramphenicol -- 12 30.8
Florfenicol 98 96.0 10 25.6
Gentamicin 2 2.0 2 5.1
Kanamycin 12 11.8 --
**Trimeth-Sulfa 7 6.9 5 12.8
*Amox-Clav=Amoxicillin-Clavulanic Acid**Trimeth-Sulfa=Trimethoprim-Sulfamethoxazole

24
National Antimicrobial Resistance Monitoring System for Enteric Bacteria
Table 10. Clinical source of non-Typhi Salmonella isolates, 1999
IsolateBlood
N %Stool
N %Other
N %Unknown
N %Total
N %S. Typhimurium -- ACSSuT 3
2.99189.2
65.9
22.0
1026.8
S. Typhimurium -- AKSSuT 25.1
3692.3
12.6
00
392.6
All other S. Typhimurium 94.1
19990.0
115.0
20.9
221 14.7
S. Enteritidis 217.8
23185.9
124.5
51.9
269 17.9
S. Heidelberg 910.1
7179.8
89.0
11.1
895.9
Other Salmonella 354.5
68087.3
506.4
141.8
779 52.0
Total 795.2
1308 87.3 885.9
241.6
1499 100

25
National Antimicrobial Resistance Monitoring System For Enteric Bacteria
Table 11. Serotypes of non-Typhi Salmonella with reduced susceptibility to ciprofloxacin[MIC > 0.25 µµg/ml]
1999 (N=15)
Serotype # (%) Total received
Enteritidis 6 40 269
Berta 2 13 10
Typhimurium 1 7 362
Choleraesuis 1 7 1
Virchow 1 7 7
Montevideo 1 7 52
Heidelberg 1 7 89
Senftenberg* 1 7 3
Skansen 1 7 1
* S. Senftenberg was resistant to ciprofloxacin (MIC > 4.00 µg/ml)

26
National Antimicrobial Resistance Monitoring System For Enteric Bacteria
Table 12. Serotypes of non-Typhi Salmonella with reduced susceptibility to ceftriaxone[MIC > 16 µµg/ml]
1999 (N=28)
Serotype # (%) Total received
Newport* 17 60 97
Typhimurium* 7 25 362
Agona 1 4 33
Enteritidis 1 4 269
Skansen 1 4 1
Worthington* 1 4 4
* Three S. Newport, 2 S. Typhimurium, and 1 S. Worthington isolates were resistant to ceftriaxone(MIC > 64.00 µg/ml)

27
National Antimicrobial Resistance Monitoring System For Enteric Bacteria
Table 13. Frequency of Shigella Species, 1999
Species N %
sonnei 275 73.3
flexneri 87 23.2
boydii 7 1.9
dysenteriae 2 0.5
not identified 4 1.1
Total 375 100

28
National Antimicrobial Resistance Monitoring System For Enteric Bacteria
Table 14. Antimicrobial Susceptibility of Shigella isolates, 1999
Antibiotic All Shigella(N=375)
Shigella sonnei(N=275)
Shigella flexneri(N=87)
Shigella boydii(N=7)
# Resist % Resist # Resist % Resist # Resist % Resist # Resist % Resist
Amikacin 0 0 0 0 0 0 0 0Amoxicillin – Clavulanic Acid 4 1 1 0.4 3 3 0 0Ampicillin 291 77 219 80 67 77 0 0Apramycin 0 0 0 0 0 0 0 0Ceftiofur 0 0 0 0 0 0 0 0Ceftriaxone 0 0 0 0 0 0 0 0Cephalothin 12 3 8 3 4 4 0 0Chloramphenicol 65 17 5 2 56 64 0 0Ciprofloxacin 0 0 0 0 0 0 0 0Florfenicol 0 0 0 0 0 0 0 0Gentamicin 1 0.3 1 0.4 0 0 0 0Kanamycin 2 0.5 2 1 0 0 0 0Nalidixic Acid 6 2 4 1 1 1 1 14Streptomycin 209 56 143 52 55 63 6 86Sulfamethoxazole 210 55 150 54 51 59 6 86Tetracycline 215 57 127 46 80 92 4 57Trimethoprim - Sulfamethoxazole 193 51 146 53 42 48 2 29

29
National Antimicrobial Resistance Monitoring System For Enteric Bacteria
Table 15. Frequency of Campylobacter Species, 1999
Species N %
Jejuni 295 92.5
Coli 20 6.3
Fetus 2 0.6
Upsaliensis 2 0.6
Total 319 100

30
National Antimicrobial Resistance Monitoring System For Enteric Bacteria
Table 16. Antimicrobial Susceptibility of Campylobacter isolates, 1999
AntibioticAll Campylobacter
(N=319)Campylobacter jejuni
(N=295)Campylobacter coli
(N=20)# Resist % Resist # Resist % Resist # Resist % Resist
Azithromycin 10 3 8 3 2 10
Chloramphenicol 1 0.3 1 0.3 0 0
Ciprofloxacin 58 18 52 18 6 30
Clindamycin 5 1 3 1 2 10
Erythromycin 8 2 6 2 2 10
Gentamicin 0 0 0 0 0 0
Nalidixic Acid 65 21 59 20 6 30
Tetracycline 141 44 135 46 6 30

National Antimicrobial Resistance Monitoring System For Enteric Bacteria
Figure 1. Number of isolates submitted, by site, 1999
LX=Los Angeles County NYC=New York City
13
CA CO CT FL GA KS LX MA MD MN NJ NYC NY OR TN WA WV0
50
100
150
200
250
Site
Number of Isolates
Non-Typhi Salmonella S. Typhi Shigella E. coli O157 (N=1514) (N=249) (N=377) (N=296)

National Antimicrobial Resistance Monitoring System For Enteric Bacteria
Figure 2. Resistance among non-Typhi Salmonella isolates, 1996-1999
Amikacin*Amox-Clav
AmpicillinApramycin
CeftiofurCeftriaxone
CephalothinChloramphenicol
CiprofloxacinFlorfenicol
GentamicinKanamycin
Nalidixic AcidStreptomycin
SulfamethoxazoleTetracycline
Ticarcillin**Trimeth-Sulfa
0 20 40 60 80 100
121
0.24
311
55
0.421
2324
4
Antimicrobial
Percent of Isolates Resistant
1996 (N=1326)Amikacin
*Amox-ClavAmpicillin
ApramycinCeftiofur
CeftriaxoneCephalothin
ChloramphenicolCiprofloxacin
FlorfenicolGentamicinKanamycin
Nalidixic AcidStreptomycin
SulfamethoxazoleTetracycline
Ticarcillin**Trimeth-Sulfa
0 20 40 60 80 100
219
30.4
310
35
122
2522
182
Antimicrobial
Percent of Isolates Resistant
1997 (N=1301)
Amikacin*Amox-Clav
AmpicillinApramycin
CeftiofurCeftriaxone
CephalothinChloramphenicol
CiprofloxacinFlorfenicol
GentamicinKanamycin
Nalidixic AcidStreptomycin
SulfamethoxazoleTetracycline
Ticarcillin**Trimeth-Sulfa
0 20 40 60 80 100
216
0.1112
100.1
36
1191920
162
Antimicrobial
Percent of Isolates Resistant
1998 (N=1466)
Amikacin*Amox-Clav
AmpicillinApramycin
CeftiofurCeftriaxone
CephalothinChloramphenicol
CiprofloxacinFlorfenicol
GentamicinKanamycin
Nalidixic AcidStreptomycin
SulfamethoxazoleTetracycline
Ticarcillin**Trimeth-Sulfa
0 20 40 60 80 100
216
0.32
0.44
90.1
82
41
171819
2
Antimicrobial
Percent of Isolates Resistant
1999 (N=1499)
*Amox-Clav=Amoxicillin-Clavulanic Acid **Trimeth-Sulfa=Trimethoprim-Sulfamethoxazole
Not Tested
Not Tested
Not Tested
Not Tested
Not Tested
Not Tested
23

National Antimicrobial Resistance Monitoring System For Enteric Bacteria
Figure 3a. MICs for Amikacin among non-Typhi Salmonella isolates, 1996 - 1999
1997 (N=1301)
1998 (N=1466)
Resistant:>640/1301=0%
Resistant:>640/1466=0%
>
>
<
1999 (N=1499)
Resistant:>640/1499=0%
<>
Not tested in 1996
4 8 16 32 640
20
40
60
80
100 99
0.8 0.2 0 0
Minimum Inhibitory Concentration
Percent of Isolates
4 8 16 32 640
20
40
60
80
100 99.9
0.1 0 0 0
Minimum Inhibitory Concentration
Percent of Isolates
4 8 16 32 640
20
40
60
80
100 99.2
0.5 0.2 0.1 0
Minimum Inhibitory Concentration
Percent of Isolates
<
33

National Antimicrobial Resistance Monitoring System For Enteric Bacteria
Figure 3b. MICs for Amoxicillin-Clavulanic Acid among non-Typhi Salmonella isolates, 1996 - 1999
1996 (N=1326) 1997 (N=1301)
1998 (N=1466)
Resistant:>32/1620/1326=1%
Resistant:>32/1619/1301=1%
Resistant:>32/1624/1466=2%
>
>
><
<
<
Resistant:>32/1636/1499=2%
1999 (N=1499)
< >2/1 4/2 8/4 16/8 32/16 64/320
20
40
60
80
100
78
1.56.6
12.3
1.4 0.1
Minimum Inhibitory Concentration
Percent of Isolates
2/1 4/2 8/4 16/8 32/16 64/320
20
40
60
80
100
81.2
0.45.7
11.3
1.2 0.2
Minimum Inhibitory Concentration
Percent of Isolates
2/1 4/2 8/4 16/8 32/16 64/320
20
40
60
80
100
83.1
0.94.5
9.8
0.9 0.7
Minimum Inhibitory Concentration
Percent of Isolates
2/1 4/2 8/4 16/8 32/16 64/320
20
40
60
80
100
83.7
0.84.3
8.8
0.5 1.9
Minimum Inhibitory Concentration
Percent of Isolates
43

National Antimicrobial Resistance Monitoring System For Enteric Bacteria
Figure 3c. MICs for Ampicillin among non-Typhi Salmonella isolates, 1996 - 1999
1996 (N=1326) 1997 (N=1301)
1998 (N=1466)
Resistant:>32 279/1326=21%
Resistant:>32241/1301=18%
Resistant:>32241/1466=16%
>>
><
< <
1999 (N=1499)*
Resistant:>32234/1499=16%
><
2 4 8 16 32 64 1280
20
40
60
80
100
76.8
1.5 0.4 0.2 0 0.1
21
Minimum Inhibitory Concentration
Percent of Isolates
2 4 8 16 32 64 1280
20
40
60
80
100
79.7
1.7 0.1 0 0.4 1.8
16.4
Minimum Inhibitory Concentration
Percent of Isolates
2 4 8 16 32 64 1280
20
40
60
80
100
82.8
0.4 0.2 0.1 0.1 0.1
16.3
Minimum Inhibitory Concentration
Percent of Isolates
2 4 8 16 32 64 1280
20
40
60
80
100
83.5
0.6 0.3 0 0
15.6
0
Minimum Inhibitory Concentration
Percent of Isolates
* Maximum MIC dilution for 1999 was 32 ug/ml. All resistant isolates had a MIC >32 ug/ml.
53

National Antimicrobial Resistance Monitoring System For Enteric Bacteria
Figure 3d. MICs for Apramycin among non-Typhi Salmonella isolates, 1996 - 1999
1996 (N=1326) 1997 (N=1301)
1998 (N=1466)
Resistant:>32 0/1326=0%
Resistant:>320/1301=0%
Resistant:>321/1466=0.1%
>>
><
< <
1999 (N=1499)
Resistant:>325/1499=0.3%
><
2 4 8 16 320
20
40
60
80
100
45.6 45.3
8.20.7 0.2
Minimum Inhibitory Concentration
Percent of Isolates
2 4 8 16 320
20
40
60
80
100
51
40.8
7.80.5 0
Minimum Inhibitory Concentration
Percent of Isolates
2 4 8 16 320
20
40
60
80
100
57.7
40.8
1.3 0.1 0.1
Minimum Inhibitory Concentration
Percent of Isolates
2 4 8 16 320
20
40
60
80
100
60.8
34.9
3.80.2 0.3
Minimum Inhibitory Concentration
Percent of Isolates
63

National Antimicrobial Resistance Monitoring System For Enteric Bacteria
Figure 3e. MICs for Ceftiofur among non-Typhi Salmonella isolates, 1996 - 1999
1996 (N=1326) 1997 (N=1301)
1998 (N=1466)
Resistant:>8 53/1326=4%
Resistant:>844/1301=3%
Resistant:>814/1466=1%
>>
><
< <
1999 (N=1499)
Resistant:>831/1499=2%
><
.5 1 2 4 8 16 320
20
40
60
80
100
40.2
54
1.4 0.3 1.1 1.5 1.5
Minimum Inhibitory Concentration
Percent of Isolates
.5 1 2 4 8 16 320
20
40
60
80
100
66.9
24.9
2.8 1.9 1.8 0.3 1.3
Minimum Inhibitory Concentration
Percent of Isolates
.5 1 2 4 8 16 320
20
40
60
80
10087.7
10.7
0.5 0 0.2 0.1 0.7
Minimum Inhibitory Concentration
Percent of Isolates
.5 1 2 4 8 16 320
20
40
60
80
100
86.3
11.5
0.1 0.1 0.1 0.1 1.9
Minimum Inhibitory Concentration
Percent of Isolates
73

National Antimicrobial Resistance Monitoring System For Enteric Bacteria
Figure 3f. MICs for Ceftriaxone among non-Typhi Salmonella isolates, 1996 - 1999
1996 (N=1326) 1997 (N=1301)
1998 (N=1466)
*MIC:>161/1326=0.1%
Resistant:>64 1/1326=0.1%
*MIC:>165/1301=0.4%
Resistant:>645/1301=0.4%
*MIC:>1610/1466=0.7%
Resistant:>6410/1466=0.7%
>>
><
< <
1999 (N=1499)
*MIC:>1628/1499=1.9%
Resistant:>646/1499=0.4%
><
.25 .5 1 2 4 8 16 32 640
20
40
60
80
100 94.8
1.2 1.2 1.1 1.1 0.5 0 0 0.1
Minimum Inhibitory Concentration
Percent of Isolates
.25 .5 1 2 4 8 16 32 640
20
40
60
80
100 96.2
2.1 0.7 0.5 0.2 0 0 0 0.4
Minimum Inhibitory Concentration
Percent of Isolates
.25 .5 1 2 4 8 16 32 640
20
40
60
80
100 98.9
0.1 0 0.1 0.1 0.1 0 0 0.7
Minimum Inhibitory Concentration
Percent of Isolates
.25 .5 1 2 4 8 16 32 640
20
40
60
80
100 97.8
0 0 0.1 0 0.3 0.7 0.8 0.4
Minimum Inhibitory Concentration
Percent of Isolates
*MIC:>16 is decreased susceptibility.
83

National Antimicrobial Resistance Monitoring System For Enteric Bacteria
Figure 3g. MICs for Cephalothin among non-Typhi Salmonella isolates, 1996 - 1999
1996 (N=1326) 1997 (N=1301)
1998 (N=1466)
Resistant:>32 47/1326=3%
Resistant:>3243/1301=3%
Resistant:>3233/1466=2%
>>
><
< <
1999 (N=1499)
Resistant:>3255/1499=4%
><
1 2 4 8 16 32 640
20
40
60
80
100
2.5
50.2
29
11.4
3.4 2.3 1.3
Minimum Inhibitory Concentration
Percent of Isolates
1 2 4 8 16 32 640
20
40
60
80
100
2.8
57.3
23.1
10.72.8 1.6 1.7
Minimum Inhibitory Concentration
Percent of Isolates
1 2 4 8 16 32 640
20
40
60
80
100
1.9
68.1
20.2
4.6 2.5 0.9 1.7
Minimum Inhibitory Concentration
Percent of Isolates
1 2 4 8 16 32 640
20
40
60
80
100
0.7
48.9
37.7
7.41.6 0.7 2.9
Minimum Inhibitory Concentration
Percent of Isolates
93

National Antimicrobial Resistance Monitoring System For Enteric Bacteria
Figure 3h. MICs for Chloramphenicol among non-Typhi Salmonella isolates, 1996 - 1999
1996 (N=1326) 1997 (N=1301)
1998 (N=1466)
Resistant:>32 141/1326=11%
Resistant:>32131/1301=10%
Resistant:>32145/1466=10%
>>
><
< <
1999 (N=1499)
Resistant:>32138/1499=9%
><
4 8 16 32 640
20
40
60
80
100
75.6
13.6
0.3 0.1
10.5
Minimum Inhibitory Concentration
Percent of Isolates
4 8 16 32 640
20
40
60
80
10088.2
1.6 0.1 0.8
9.2
Minimum Inhibitory Concentration
Percent of Isolates
4 8 16 32 640
20
40
60
80
10088.7
1.1 0.2 0.1
9.8
Minimum Inhibitory Concentration
Percent of Isolates
4 8 16 32 640
20
40
60
80
100
68.7
21.9
0.1 0
9.2
Minimum Inhibitory Concentration
Percent of Isolates
04

National Antimicrobial Resistance Monitoring System For Enteric Bacteria
Figure 3i. MICs for Ciprofloxacin among non-Typhi Salmonella isolates, 1996 - 1999
1996 (N=1326) 1997 (N=1301)
1998 (N=1466)
MICs:>.25 5/1326=0.4%
Resistant:>40/1326=0%
MICs:>.2510/1466=0.7%
Resistant:>41/1466=0.1%
>>
><
< <
.03 .06 .12 .25 .5 1 2 40
20
40
60
80
100 98.5
0.3 0.2 0.7 0.1 0.1 0 0.1
Mininum Inhibitory Concentration
Percent of Isolates 1999 (N=1499)
< >
MICs:>.25 8/1301=0.6%
Resistant:>40/1301=0%
MICs:>.25 15/1499=1%
Resistant:> 41/1499=0.1%
.03 .06 .12 .25 .5 1 2 40
20
40
60
80
100 98.8
0.8 0.1 0.2 0.2 0 0 0
Minimum Inhibitory Concentration
Percent of Isolates
.03 .06 .12 .25 .5 1 2 40
20
40
60
80
100 98.2
0.6 0.6 0.4 0.2 0 0 0
Minimum Inhibitory Concentration
Percent of Isolates
.03 .06 .12 .25 .5 1 2 40
20
40
60
80
100 98.2
0.4 0.8 0.4 0.2 0 0 0.1
Minimum Inhibitory Concentration
Percent of Isolates
14

National Antimicrobial Resistance Monitoring System For Enteric Bacteria
Figure 3j. MICs for Florfenicol among non-Typhi Salmonella isolates, 1996 - 1999
2 4 8 160
20
40
60
80
100
28.8
60.2
2.58.5
Mininum Inhibitory Concentration
Percent of Isolates 1999 (N=1499)
< >
MICs:>16 128/1499=8%
Not tested in 1996 Not tested in 1997
Not tested in 1998
24

National Antimicrobial Resistance Monitoring System For Enteric Bacteria
Figure 3k. MICs for Gentamicin among non-Typhi Salmonella isolates, 1996 - 1999
1996 (N=1326) 1997 (N=1301)
1998 (N=1466)
Resistant:>16 64/1326=5%
Resistant:>1638/1301=3%
Resistant:>1642/1466=3%
>>
><
< <
.25 .5 1 2 4 8 16 320
20
40
60
80
100
46 45.2
5.50.7 0 0.3 0.9 1.3
Minimum Inhibitory Concentration
Percent of Isolates 1999 (N=1499)
Resistant:>1634/1499=2%
< >
.25 .5 1 2 4 8 16 320
20
40
60
80
100
11.2
55
23.5
50.2 0.2 1.5 3.3
Minimum Inhibitory Concentration
Percent of Isolates
.25 .5 1 2 4 8 16 320
20
40
60
80
100
52
31.5
11.7
1.5 0.2 0.2 0.9 2
Minimum Inhibitory Concentration
Percent of Isolates
.25 .5 1 2 4 8 16 320
20
40
60
80
100
25
62.5
9.2
0.1 0.1 0.3 1.1 1.8
Minimum Inhibitory Concentration
Percent of Isolates
34

National Antimicrobial Resistance Monitoring System For Enteric Bacteria
Figure 3l. MICs for Kanamycin among non-Typhi Salmonella isolates, 1996 - 1999
1996 (N=1326) 1997 (N=1301)
1998 (N=1466)
Resistant:>64 65/1326=5%
Resistant:>646/1301=5%
Resistant:>6484/1466=6%
>>
><
< <
1999 (N=1499)
Resistant:>6466/1499=4%
><
16 32 64 1280
20
40
60
80
100 94.6
0.5 0.24.8
Minimum Inhibitory Concentration
Percent of Isolates
16 32 64 1280
20
40
60
80
100 94.5
0.5 0.64.5
Minimum Inhibitory Concentration
Percent of Isolates
16 32 64 1280
20
40
60
80
100 94
0.3 0.25.5
Minimum Inhibitory Concentration
Percent of Isolates
16 32 64 1280
20
40
60
80
100 95.5
0.1 0.14.3
Minimum Inhibitory Concentration
Percent of Isolates
44

National Antimicrobial Resistance Monitoring System For Enteric Bacteria
Figure 3m. MICs for Nalidixic Acid among non-Typhi Salmonella isolates, 1996 - 1999
1996 (N=1326) 1997 (N=1301)
1998 (N=1466)
Resistant:>32 5/1326=0.4%
Resistant:>3211/1301=1%
Resistant:>3220/1466=1%
>>
><
< <
1999 (N=1499)
Resistant:>3216/1499=1%
><
2 4 8 16 32 640
20
40
60
80
100
1.8
85
12.6
0.2 0 0.4
Minimum Inhibitory Concentration
Percent of Isolates
2 4 8 16 32 640
20
40
60
80
100
0
88
9.9
1.2 0.2 0.7
Minimum Inhibitory Concentration
Percent of Isolates
2 4 8 16 32 640
20
40
60
80
100
0
93.7
4.50.4 0.1 1.2
Minimum Inhibitory Concentration
Percent of Isolates
2 4 8 16 32 640
20
40
60
80
100
0
90.7
7.90.3 0.1 1.1
Minimum Inhibitory Concentration
Percent of Isolates
54

National Antimicrobial Resistance Monitoring System For Enteric Bacteria
Figure 3n. MICs for Streptomycin among non-Typhi Salmonella isolates, 1996 - 1999
1996 (N=1326) 1997 (N=1301)
1998 (N=1466)
Resistant:>64 275/1326=21%
Resistant:>64282/1301=22%
Resistant:>64273/1466=19%
>>
><
< <
1999 (N=1499)
Resistant:>64254/1499=17%
><
32 64 128 256 5120
20
40
60
80
100
79.3
10.66.9
1.9 1.3
Minimum Inhibitory Concentration
Percent of Isolates
32 64 128 256 5120
20
40
60
80
100
78.3
6.7 9.13.8 2
Minimum Inhibitory Concentration
Percent of Isolates
32 64 128 256 5120
20
40
60
80
100
81.4
8.1 7.32 1.2
Minimum Inhibitory Concentration
Percent of Isolates
32 64 128 256 5120
20
40
60
80
100
83.1
6.6 5.1 3.1 2.1
Minimum Inhibitory Concentration
Percent of Isolates
64

National Antimicrobial Resistance Monitoring SystemFor Enteric Bacteria
Figure 3o. MICs for Sulfamethoxazole among non-Typhi Salmonella isolates, 1996 - 1999
1996 (N=1326) 1997 (N=1301)
1998 (N=1466)
Resistant:>512 305/1326=23%
Resistant:>512328/1301=25%
Resistant:>512283/1466=19%
>>
><
< <
1999 (N=1499)
Resistant:>512272/1499=18%
><
128 256 512 10240
20
40
60
80
100
75.4
1.6 1.1
21.9
Minimum Inhibitory Concentration
Percent of Isolates
128 256 512 10240
20
40
60
80
100
71.5
3.2 3
22.2
Minimum Inhibitory Concentration
Percent of Isolates
128 256 512 10240
20
40
60
80
100
80.4
0.3 0.1
19.2
Minimum Inhibitory Concentration
Percent of Isolates
128 256 512 10240
20
40
60
80
100
81.8
0.1 0.1
18.1
Minimum Inhibitory Concentration
Percent of Isolates
74

National Antimicrobial Resistance Monitoring System For Enteric Bacteria
Figure 3p. MICs for Tetracycline among non-Typhi Salmonella isolates, 1996 - 1999
1996 (N=1326) 1997 (N=1301)
1998 (N=1466)
Resistant:>16321/1326=24%
Resistant:>16283/1301=22%
Resistant:>16295/1466=20%
>>
><
< <
1999 (N=1499)*
Resistant:>16292/1499=20%
><
4 8 16 32 64 1280
20
40
60
80
100
75.2
0.66.4 6.3
10.9
0.6
Minimum Inhibitory Concentration
Percent of Isolates
4 8 16 32 64 1280
20
40
60
80
100
77.8
0.5 2.46.1 6.8 6.4
Minimum Inhibitory Concentration
Percent of Isolates
4 8 16 32 64 1280
20
40
60
80
100
79.7
0.2 1.26.1 3.9
8.9
Minimum Inhibitory Concentration
Percent of Isolates
4 8 16 32 64 1280
20
40
60
80
100
80.5
0.1 0.24.1
15.2
0
Minimum Inhibitory Concentration
Percent of Isolates
* Maximum MIC dilution for 1999 was 32 ug/ml. All resistant isolates had a MIC >32 ug/ml.
84

National Antimicrobial Resistance Monitoring System For Enteric Bacteria
Figure 3q. MICs for Trimethoprim-Sulfamethoxazole among non-Typhi Salmonella isolates, 1996 - 1999
1996 (N=1326) 1997 (N=1301)
1998 (N=1466)
Resistant:>4/76 51/1326=4%
Resistant:>4/7624/1301=2%
Resistant:>4/7634/1466=2%
>>
><
< <
1999 (N=1499)
Resistant:>4/7631/1499=2%
><
.12/2.38 .25/4.75 .50/9.5 1/19 2/38 4/76 8/1520
20
40
60
80
100
86.3
9
0.5 0.2 0.2 03.8
Minimum Inhibitory Concentration
Percent of Isolates
.12/2.38 .25/4.75 .50/9.5 1/19 2/38 4/76 8/1520
20
40
60
80
100 95.8
1.9 0.3 0.2 0 0.2 1.6
Minimum Inhibitory Concentration
Percent of Isolates
.12/2.38 .25/4.75 .50/9.5 1/19 2/38 4/76 8/1520
20
40
60
80
100 96.5
0.8 0.2 0.1 0.1 0 2.3
Minimum Inhibitory Concentration
Percent of Isolates
.12/2.38 .25/4.75 .50/9.5 1/19 2/38 4/76 8/1520
20
40
60
80
10087.8
9.6
0.5 0 0.1 0 2.1
Minimum Inhibitory Concentration
Percent of Isolates
94

National Antimicrobial Resistance Monitoring System For Enteric Bacteria
Figure 4a. Resistance among Salmonella serotype Agona isolates, 1996-1999
1997 (N=25)
Amikacin*Amox-Clav
AmpicillinApramycin
CeftiofurCeftriaxoneCephalothin
ChloramphenicolCiprofloxacin
FlorfenicolGentamicinKanamycin
Nalidixic AcidStreptomycin
SulfamethoxazoleTetracycline
Ticarcillin**Trimeth-Sulfa
0 20 40 60 80 100
4
4
4
2040
364
8
Antimicrobial
Percent of Isolates Resistant
1998 (N=39)
Amikacin*Amox-Clav
AmpicillinApramycin
CeftiofurCeftriaxoneCephalothin
ChloramphenicolCiprofloxacin
FlorfenicolGentamicinKanamycin
Nalidixic AcidStreptomycin
SulfamethoxazoleTetracycline
Ticarcillin**Trimeth-Sulfa
0 20 40 60 80 100
3
3
53
1036
313
Antimicrobial
Percent of Isolates Resistant
1999 (N=33)
Amikacin*Amox-Clav
AmpicillinApramycin
CeftiofurCeftriaxoneCephalothin
ChloramphenicolCiprofloxacin
FlorfenicolGentamicinKanamycin
Nalidixic AcidStreptomycin
SulfamethoxazoleTetracycline
Ticarcillin**Trimeth-Sulfa
0 20 40 60 80 100
33
3
33
3
327
36
3
Antimicrobial
Percent of Isolates Resistant
1996 (N=12)
Amikacin*Amox-Clav
AmpicillinApramycin
CeftiofurCeftriaxoneCephalothin
ChloramphenicolCiprofloxacin
FlorfenicolGentamicinKanamycin
Nalidixic AcidStreptomycin
SulfamethoxazoleTetracycline
Ticarcillin**Trimeth-Sulfa
0 20 40 60 80 100
8
8
255050
Antimicrobial
Percent of Isolates Resistant
*Amox-Clav=Amoxicillin-Clavulanic Acid **Trimeth-Sulfa=Trimethoprim-Sulfamethoxazole
Not TestedNot Tested
Not Tested
Not Tested
Not Tested
Not Tested
05

National Antimicrobial Resistance Monitoring System For Enteric Bacteria
Figure 4b. Resistance among Salmonella serotype Braenderup isolates, 1996-1999
1996 (N=22)
Amikacin*Amox-Clav
AmpicillinApramycin
CeftiofurCeftriaxoneCephalothin
ChloramphenicolCiprofloxacin
FlorfenicolGentamicinKanamycin
Nalidixic AcidStreptomycin
SulfamethoxazoleTetracycline
Ticarcillin**Trimeth-Sulfa
0 20 40 60 80 100
Antimicrobial
Percent of Isolates Resistant
1997 (N=17)
Amikacin*Amox-Clav
AmpicillinApramycin
CeftiofurCeftriaxoneCephalothin
ChloramphenicolCiprofloxacin
FlorfenicolGentamicinKanamycin
Nalidixic AcidStreptomycin
SulfamethoxazoleTetracycline
Ticarcillin**Trimeth-Sulfa
0 20 40 60 80 100
1
6
6
Antimicrobial
Percent of Isolates Resistant
1998 (N=23)
Amikacin*Amox-Clav
AmpicillinApramycin
CeftiofurCeftriaxoneCephalothin
ChloramphenicolCiprofloxacin
FlorfenicolGentamicinKanamycin
Nalidixic AcidStreptomycin
SulfamethoxazoleTetracycline
Ticarcillin**Trimeth-Sulfa
0 20 40 60 80 100
Antimicrobial
Percent of Isolates Resistant
1999 (N=24)
Amikacin*Amox-Clav
AmpicillinApramycin
CeftiofurCeftriaxoneCephalothin
ChloramphenicolCiprofloxacin
FlorfenicolGentamicinKanamycin
Nalidixic AcidStreptomycin
SulfamethoxazoleTetracycline
Ticarcillin**Trimeth-Sulfa
0 20 40 60 80 100
4
Antimicrobial
Percent of Isolates Resistant
*Amox-Clav=Amoxicillin-Clavulanic Acid **Trimeth-Sulfa=Trimethoprim-Sulfamethoxazole
Not TestedNot Tested
Not Tested
Not Tested
Not Tested
Not Tested
15

National Antimicrobial Resistance Monitoring System For Enteric Bacteria
Figure 4c. Resistance among Salmonella serotype Enteritidis isolates, 1996-1999 1996 (N=357)
Amikacin*Amox-Clav
AmpicillinApramycin
CeftiofurCeftriaxoneCephalothin
ChloramphenicolCiprofloxacin
FlorfenicolGentamicinKanamycin
Nalidixic AcidStreptomycin
SulfamethoxazoleTetracycline
Ticarcillin**Trimeth-Sulfa
0 20 40 60 80 100
121
4
61
5
12
1317
7
Antimicrobial
Percent of Isolates Resistant
1997 (N=301)
Amikacin*Amox-Clav
AmpicillinApramycin
CeftiofurCeftriaxoneCephalothin
ChloramphenicolCiprofloxacin
FlorfenicolGentamicinKanamycin
Nalidixic AcidStreptomycin
SulfamethoxazoleTetracycline
Ticarcillin**Trimeth-Sulfa
0 20 40 60 80 100
112
5
30.3
0.31
414
10
1
Antimicrobial
Percent of Isolates Resistant
1998 (N=245)
Amikacin*Amox-Clav
AmpicillinApramycin
CeftiofurCeftriaxoneCephalothin
ChloramphenicolCiprofloxacin
FlorfenicolGentamicinKanamycin
Nalidixic AcidStreptomycin
SulfamethoxazoleTetracycline
Ticarcillin**Trimeth-Sulfa
0 20 40 60 80 100
6
0.40.4222
76
1
Antimicrobial
Percent of Isolates Resistant
1999 (N=269)
Amikacin*Amox-Clav
AmpicillinApramycin
CeftiofurCeftriaxoneCephalothin
ChloramphenicolCiprofloxacin
FlorfenicolGentamicinKanamycin
Nalidixic AcidStreptomycin
SulfamethoxazoleTetracycline
Ticarcillin**Trimeth-Sulfa
0 20 40 60 80 100
0.410
0.4
21
0.4
0.4333
9
1
Antimicrobial
Percent of Isolates Resistant
*Amox-Clav=Amoxicillin-Clavulanic Acid **Trimeth-Sulfa=Trimethoprim-Sulfamethoxazole
Not TestedNot Tested
Not Tested
Not Tested
Not Tested
Not Tested
25

National Antimicrobial Resistance Monitoring System For Enteric Bacteria
Figure 4d. Resistance among Salmonella serotype Hadar isolates, 1996-1999
1996 (N=38)
Amikacin*Amox-Clav
AmpicillinApramycin
CeftiofurCeftriaxoneCephalothin
ChloramphenicolCiprofloxacin
FlorfenicolGentamicinKanamycin
Nalidixic AcidStreptomycin
SulfamethoxazoleTetracycline
Ticarcillin**Trimeth-Sulfa
0 20 40 60 80 100
26
16
5
845
95
Antimicrobial
Percent of Isolates Resistant
1997 (N=30)
Amikacin*Amox-Clav
AmpicillinApramycin
CeftiofurCeftriaxoneCephalothin
ChloramphenicolCiprofloxacin
FlorfenicolGentamicinKanamycin
Nalidixic AcidStreptomycin
SulfamethoxazoleTetracycline
Ticarcillin**Trimeth-Sulfa
0 20 40 60 80 100
23
7
13
33
9320
973
Antimicrobial
Percent of Isolates Resistant
1998 (N=26)
Amikacin*Amox-Clav
AmpicillinApramycin
CeftiofurCeftriaxoneCephalothin
ChloramphenicolCiprofloxacin
FlorfenicolGentamicinKanamycin
Nalidixic AcidStreptomycin
SulfamethoxazoleTetracycline
Ticarcillin**Trimeth-Sulfa
0 20 40 60 80 100
442
194
4
431
8100
42
Antimicrobial
Percent of Isolates Resistant
1999 (N=21)
Amikacin*Amox-Clav
AmpicillinApramycin
CeftiofurCeftriaxoneCephalothin
ChloramphenicolCiprofloxacin
FlorfenicolGentamicinKanamycin
Nalidixic AcidStreptomycin
SulfamethoxazoleTetracycline
Ticarcillin**Trimeth-Sulfa
0 20 40 60 80 100
24
14
145
8119
91
Antimicrobial
Percent of Isolates Resistant
*Amox-Clav=Amoxicillin-Clavulanic Acid **Trimeth-Sulfa=Trimethoprim-Sulfamethoxazole
Not TestedNot Tested
Not Tested
Not Tested
Not Tested
Not Tested
35

National Antimicrobial Resistance Monitoring System For Enteric Bacteria
Figure 4e. Resistance among Salmonella serotype Heidelberg isolates, 1996-1999
1996 (N=74)
Amikacin*Amox-Clav
AmpicillinApramycin
CeftiofurCeftriaxoneCephalothin
ChloramphenicolCiprofloxacin
FlorfenicolGentamicinKanamycin
Nalidixic AcidStreptomycin
SulfamethoxazoleTetracycline
Ticarcillin**Trimeth-Sulfa
0 20 40 60 80 100
415
7
71
2313
421820
Antimicrobial
Percent of Isolates Resistant
1997 (N=75)
Amikacin*Amox-Clav
AmpicillinApramycin
CeftiofurCeftriaxoneCephalothin
ChloramphenicolCiprofloxacin
FlorfenicolGentamicinKanamycin
Nalidixic AcidStreptomycin
SulfamethoxazoleTetracycline
Ticarcillin**Trimeth-Sulfa
0 20 40 60 80 100
112
1
4
178
2324
12
Antimicrobial
Percent of Isolates Resistant
1998 (N=103)
Amikacin*Amox-Clav
AmpicillinApramycin
CeftiofurCeftriaxoneCephalothin
ChloramphenicolCiprofloxacin
FlorfenicolGentamicinKanamycin
Nalidixic AcidStreptomycin
SulfamethoxazoleTetracycline
Ticarcillin**Trimeth-Sulfa
0 20 40 60 80 100
116
1
51
1614
130
2120
172
Antimicrobial
Percent of Isolates Resistant
1999 (N=89)
Amikacin*Amox-Clav
AmpicillinApramycin
CeftiofurCeftriaxoneCephalothin
ChloramphenicolCiprofloxacin
FlorfenicolGentamicinKanamycin
Nalidixic AcidStreptomycin
SulfamethoxazoleTetracycline
Ticarcillin**Trimeth-Sulfa
0 20 40 60 80 100
18
1
32
215
9
251919
1
Antimicrobial
Percent of Isolates Resistant
*Amox-Clav=Amoxicillin-Clavulanic Acid **Trimeth-Sulfa=Trimethoprim-Sulfamethoxazole
Not TestedNot Tested
Not Tested
Not Tested
Not Tested
Not Tested
45

National Antimicrobial Resistance Monitoring System For Enteric Bacteria
Figure 4f. Resistance among Salmonella serotype Infantis isolates, 1996-1999
1996 (N=18)
Amikacin*Amox-Clav
AmpicillinApramycin
CeftiofurCeftriaxoneCephalothin
ChloramphenicolCiprofloxacin
FlorfenicolGentamicinKanamycin
Nalidixic AcidStreptomycin
SulfamethoxazoleTetracycline
Ticarcillin**Trimeth-Sulfa
0 20 40 60 80 100
6
6
6
628
6
Antimicrobial
Percent of Isolates Resistant
1997 (N=29)
Amikacin*Amox-Clav
AmpicillinApramycin
CeftiofurCeftriaxoneCephalothin
ChloramphenicolCiprofloxacin
FlorfenicolGentamicinKanamycin
Nalidixic AcidStreptomycin
SulfamethoxazoleTetracycline
Ticarcillin**Trimeth-Sulfa
0 20 40 60 80 100
3
Antimicrobial
Percent of Isolates Resistant
1998 (N=22)
Amikacin*Amox-Clav
AmpicillinApramycin
CeftiofurCeftriaxoneCephalothin
ChloramphenicolCiprofloxacin
FlorfenicolGentamicinKanamycin
Nalidixic AcidStreptomycin
SulfamethoxazoleTetracycline
Ticarcillin**Trimeth-Sulfa
0 20 40 60 80 100
4
44
Antimicrobial
Percent of Isolates Resistant
1999 (N=17)
Amikacin*Amox-Clav
AmpicillinApramycin
CeftiofurCeftriaxoneCephalothin
ChloramphenicolCiprofloxacin
FlorfenicolGentamicinKanamycin
Nalidixic AcidStreptomycin
SulfamethoxazoleTetracycline
Ticarcillin**Trimeth-Sulfa
0 20 40 60 80 100
6
Antimicrobial
Percent of Isolates Resistant
*Amox-Clav=Amoxicillin-Clavulanic Acid **Trimeth-Sulfa=Trimethoprim-Sulfamethoxazole
Not TestedNot Tested
Not Tested
Not Tested
Not Tested
Not Tested
55

National Antimicrobial Resistance Monitoring System For Enteric Bacteria
Figure 4g. Resistance among Salmonella serotype Javiana isolates, 1996-1999
1996 (N=27)
Amikacin*Amox-Clav
AmpicillinApramycin
CeftiofurCeftriaxoneCephalothin
ChloramphenicolCiprofloxacin
FlorfenicolGentamicinKanamycin
Nalidixic AcidStreptomycin
SulfamethoxazoleTetracycline
Ticarcillin**Trimeth-Sulfa
0 20 40 60 80 100
4
4
47
Antimicrobial
Percent of Isolates Resistant
1997 (N=19)
Amikacin*Amox-Clav
AmpicillinApramycin
CeftiofurCeftriaxoneCephalothin
ChloramphenicolCiprofloxacin
FlorfenicolGentamicinKanamycin
Nalidixic AcidStreptomycin
SulfamethoxazoleTetracycline
Ticarcillin**Trimeth-Sulfa
0 20 40 60 80 100
Antimicrobial
Percent of Isolates Resistant
1998 (N=54)
Amikacin*Amox-Clav
AmpicillinApramycin
CeftiofurCeftriaxoneCephalothin
ChloramphenicolCiprofloxacin
FlorfenicolGentamicinKanamycin
Nalidixic AcidStreptomycin
SulfamethoxazoleTetracycline
Ticarcillin**Trimeth-Sulfa
0 20 40 60 80 100
2
222
Antimicrobial
Percent of Isolates Resistant
1999 (N=42)
Amikacin*Amox-Clav
AmpicillinApramycin
CeftiofurCeftriaxoneCephalothin
ChloramphenicolCiprofloxacin
FlorfenicolGentamicinKanamycin
Nalidixic AcidStreptomycin
SulfamethoxazoleTetracycline
Ticarcillin**Trimeth-Sulfa
0 20 40 60 80 100
2
Antimicrobial
Percent of Isolates Resistant
*Amox-Clav=Amoxicillin-Clavulanic Acid **Trimeth-Sulfa=Trimethoprim-Sulfamethoxazole
Not TestedNot Tested
Not Tested
Not Tested
Not Tested
Not Tested
65

National Antimicrobial Resistance Monitoring System For Enteric Bacteria
Figure 4h. Resistance among Salmonella serotype Montevideo isolates, 1996-1999 1996 (N=37)
Amikacin*Amox-Clav
AmpicillinApramycin
CeftiofurCeftriaxoneCephalothin
ChloramphenicolCiprofloxacin
FlorfenicolGentamicinKanamycin
Nalidixic AcidStreptomycin
SulfamethoxazoleTetracycline
Ticarcillin**Trimeth-Sulfa
0 20 40 60 80 100
5
5
311
3
3
Antimicrobial
Percent of Isolates Resistant
1997 (N=27)
Amikacin*Amox-Clav
AmpicillinApramycin
CeftiofurCeftriaxoneCephalothin
ChloramphenicolCiprofloxacin
FlorfenicolGentamicinKanamycin
Nalidixic AcidStreptomycin
SulfamethoxazoleTetracycline
Ticarcillin**Trimeth-Sulfa
0 20 40 60 80 100
4
Antimicrobial
Percent of Isolates Resistant
1998 (N=33)
Amikacin*Amox-Clav
AmpicillinApramycin
CeftiofurCeftriaxoneCephalothin
ChloramphenicolCiprofloxacin
FlorfenicolGentamicinKanamycin
Nalidixic AcidStreptomycin
SulfamethoxazoleTetracycline
Ticarcillin**Trimeth-Sulfa
0 20 40 60 80 100
6
33
66
36
3
Antimicrobial
Percent of Isolates Resistant
1999 (N=52)
Amikacin*Amox-Clav
AmpicillinApramycin
CeftiofurCeftriaxoneCephalothin
ChloramphenicolCiprofloxacin
FlorfenicolGentamicinKanamycin
Nalidixic AcidStreptomycin
SulfamethoxazoleTetracycline
Ticarcillin**Trimeth-Sulfa
0 20 40 60 80 100
22
6
2
6
2222
4
Antimicrobial
Percent of Isolates Resistant
*Amox-Clav=Amoxicillin-Clavulanic Acid **Trimeth-Sulfa=Trimethoprim-Sulfamethoxazole
Not TestedNot Tested
Not Tested
Not Tested
Not Tested
Not Tested
75

National Antimicrobial Resistance Monitoring System For Enteric Bacteria
Figure 4i. Resistance among Salmonella serotype Muenchen isolates, 1996-1999
1996 (N=17)
Amikacin*Amox-Clav
AmpicillinApramycin
CeftiofurCeftriaxoneCephalothin
ChloramphenicolCiprofloxacin
FlorfenicolGentamicinKanamycin
Nalidixic AcidStreptomycin
SulfamethoxazoleTetracycline
Ticarcillin**Trimeth-Sulfa
0 20 40 60 80 100
66
12
Antimicrobial
Percent of Isolates Resistant
1997 (N=17)
Amikacin*Amox-Clav
AmpicillinApramycin
CeftiofurCeftriaxoneCephalothin
ChloramphenicolCiprofloxacin
FlorfenicolGentamicinKanamycin
Nalidixic AcidStreptomycin
SulfamethoxazoleTetracycline
Ticarcillin**Trimeth-Sulfa
0 20 40 60 80 100
66
6
6
122323
Antimicrobial
Percent of Isolates Resistant
1998 (N=30)
Amikacin*Amox-Clav
AmpicillinApramycin
CeftiofurCeftriaxoneCephalothin
ChloramphenicolCiprofloxacin
FlorfenicolGentamicinKanamycin
Nalidixic AcidStreptomycin
SulfamethoxazoleTetracycline
Ticarcillin**Trimeth-Sulfa
0 20 40 60 80 100
33
77
Antimicrobial
Percent of Isolates Resistant
1999 (N=51)
Amikacin*Amox-Clav
AmpicillinApramycin
CeftiofurCeftriaxoneCephalothin
ChloramphenicolCiprofloxacin
FlorfenicolGentamicinKanamycin
Nalidixic AcidStreptomycin
SulfamethoxazoleTetracycline
Ticarcillin**Trimeth-Sulfa
0 20 40 60 80 100
2
2
68
6
2
Antimicrobial
Percent of Isolates Resistant
*Amox-Clav=Amoxicillin-Clavulanic Acid **Trimeth-Sulfa=Trimethoprim-Sulfamethoxazole
Not TestedNot Tested
Not Tested
Not Tested
Not Tested
Not Tested
85

National Antimicrobial Resistance Monitoring System For Enteric Bacteria
Figure 4j. Resistance among Salmonella serotype Newport isolates, 1996-1999
1996 (N=51)
Amikacin*Amox-Clav
AmpicillinApramycin
CeftiofurCeftriaxoneCephalothin
ChloramphenicolCiprofloxacin
FlorfenicolGentamicinKanamycin
Nalidixic AcidStreptomycin
SulfamethoxazoleTetracycline
Ticarcillin**Trimeth-Sulfa
0 20 40 60 80 100
26
4
46
62
812
8
4
Antimicrobial
Percent of Isolates Resistant
1997 (N=48)
Amikacin*Amox-Clav
AmpicillinApramycin
CeftiofurCeftriaxoneCephalothin
ChloramphenicolCiprofloxacin
FlorfenicolGentamicinKanamycin
Nalidixic AcidStreptomycin
SulfamethoxazoleTetracycline
Ticarcillin**Trimeth-Sulfa
0 20 40 60 80 100
26
4
44
4
68
4
4
Antimicrobial
Percent of Isolates Resistant
1998 (N=78)
Amikacin*Amox-Clav
AmpicillinApramycin
CeftiofurCeftriaxoneCephalothin
ChloramphenicolCiprofloxacin
FlorfenicolGentamicinKanamycin
Nalidixic AcidStreptomycin
SulfamethoxazoleTetracycline
Ticarcillin**Trimeth-Sulfa
0 20 40 60 80 100
13
1
33
11
343
11
Antimicrobial
Percent of Isolates Resistant
1999 (N=97)
Amikacin*Amox-Clav
AmpicillinApramycin
CeftiofurCeftriaxoneCephalothin
ChloramphenicolCiprofloxacin
FlorfenicolGentamicinKanamycin
Nalidixic AcidStreptomycin
SulfamethoxazoleTetracycline
Ticarcillin**Trimeth-Sulfa
0 20 40 60 80 100
1818
183
1818
18
1
1922
19
2
Antimicrobial
Percent of Isolates Resistant
*Amox-Clav=Amoxicillin-Clavulanic Acid **Trimeth-Sulfa=Trimethoprim-Sulfamethoxazole
Not TestedNot Tested
Not Tested
Not Tested
Not Tested
Not Tested
95

National Antimicrobial Resistance Monitoring System For Enteric Bacteria
Figure 4k. Resistance among Salmonella serotype Oranienburg isolates, 1996-1999
1996 (N=18)
Amikacin*Amox-Clav
AmpicillinApramycin
CeftiofurCeftriaxoneCephalothin
ChloramphenicolCiprofloxacin
FlorfenicolGentamicinKanamycin
Nalidixic AcidStreptomycin
SulfamethoxazoleTetracycline
Ticarcillin**Trimeth-Sulfa
0 20 40 60 80 100
116
Antimicrobial
Percent of Isolates Resistant
1997 (N=27)
Amikacin*Amox-Clav
AmpicillinApramycin
CeftiofurCeftriaxoneCephalothin
ChloramphenicolCiprofloxacin
FlorfenicolGentamicinKanamycin
Nalidixic AcidStreptomycin
SulfamethoxazoleTetracycline
Ticarcillin**Trimeth-Sulfa
0 20 40 60 80 100
4
47
Antimicrobial
Percent of Isolates Resistant
1998 (N=33)
Amikacin*Amox-Clav
AmpicillinApramycin
CeftiofurCeftriaxoneCephalothin
ChloramphenicolCiprofloxacin
FlorfenicolGentamicinKanamycin
Nalidixic AcidStreptomycin
SulfamethoxazoleTetracycline
Ticarcillin**Trimeth-Sulfa
0 20 40 60 80 100
33
Antimicrobial
Percent of Isolates Resistant
1999 (N=24)
Amikacin*Amox-Clav
AmpicillinApramycin
CeftiofurCeftriaxoneCephalothin
ChloramphenicolCiprofloxacin
FlorfenicolGentamicinKanamycin
Nalidixic AcidStreptomycin
SulfamethoxazoleTetracycline
Ticarcillin**Trimeth-Sulfa
0 20 40 60 80 100
4
Antimicrobial
Percent of Isolates Resistant
*Amox-Clav=Amoxicillin-Clavulanic Acid **Trimeth-Sulfa=Trimethoprim-Sulfamethoxazole
Not TestedNot Tested
Not Tested
Not Tested
Not Tested
Not Tested
06

National Antimicrobial Resistance Monitoring System For Enteric Bacteria
Figure 4l. Resistance among Salmonella serotype Saint Paul isolates, 1996-1999
1998 (N=31)
Amikacin*Amox-Clav
AmpicillinApramycin
CeftiofurCeftriaxoneCephalothin
ChloramphenicolCiprofloxacin
FlorfenicolGentamicinKanamycin
Nalidixic AcidStreptomycin
SulfamethoxazoleTetracycline
Ticarcillin**Trimeth-Sulfa
0 20 40 60 80 100
313
37
37
131919
137
Antimicrobial
Percent of Isolates Resistant
1999 (N=35)
Amikacin*Amox-Clav
AmpicillinApramycin
CeftiofurCeftriaxoneCephalothin
ChloramphenicolCiprofloxacin
FlorfenicolGentamicinKanamycin
Nalidixic AcidStreptomycin
SulfamethoxazoleTetracycline
Ticarcillin**Trimeth-Sulfa
0 20 40 60 80 100
3
33
543
6
614
6
9
Antimicrobial
Percent of Isolates Resistant
*Amox-Clav=Amoxicillin-Clavulanic Acid **Trimeth-Sulfa=Trimethoprim-Sulfamethoxazole
Not Tested
Not Tested
1996 (N=17)
Amikacin*Amox-Clav
AmpicillinApramycin
CeftiofurCeftriaxoneCephalothin
ChloramphenicolCiprofloxacin
FlorfenicolGentamicinKanamycin
Nalidixic AcidStreptomycin
SulfamethoxazoleTetracycline
Ticarcillin**Trimeth-Sulfa
0 20 40 60 80 100
6
12
66
1835
18
12
Antimicrobial
Percent of Isolates Resistant
16
Not Tested
Not Tested
Not Tested
Not Tested
1997 (N=19)
Amikacin*Amox-Clav
AmpicillinApramycin
CeftiofurCeftriaxoneCephalothin
ChloramphenicolCiprofloxacin
FlorfenicolGentamicinKanamycin
Nalidixic AcidStreptomycin
SulfamethoxazoleTetracycline
Ticarcillin**Trimeth-Sulfa
0 20 40 60 80 100
5
5
5
55
5
Antimicrobial
Percent of Isolates Resistant

National Antimicrobial Resistance Monitoring System For Enteric Bacteria
Figure 4m. Resistance among Salmonella serotype Stanley isolates, 1996-1999
1996 (N=4)
Amikacin*Amox-Clav
AmpicillinApramycin
CeftiofurCeftriaxoneCephalothin
ChloramphenicolCiprofloxacin
FlorfenicolGentamicinKanamycin
Nalidixic AcidStreptomycin
SulfamethoxazoleTetracycline
Ticarcillin**Trimeth-Sulfa
0 20 40 60 80 100
25
507575
25
Antimicrobial
Percent of Isolates Resistant
1997 (N=6)
Amikacin*Amox-Clav
AmpicillinApramycin
CeftiofurCeftriaxoneCephalothin
ChloramphenicolCiprofloxacin
FlorfenicolGentamicinKanamycin
Nalidixic AcidStreptomycin
SulfamethoxazoleTetracycline
Ticarcillin**Trimeth-Sulfa
0 20 40 60 80 100
17
3350
33
17
Antimicrobial
Percent of Isolates Resistant
1998 (N=10)
Amikacin*Amox-Clav
AmpicillinApramycin
CeftiofurCeftriaxoneCephalothin
ChloramphenicolCiprofloxacin
FlorfenicolGentamicinKanamycin
Nalidixic AcidStreptomycin
SulfamethoxazoleTetracycline
Ticarcillin**Trimeth-Sulfa
0 20 40 60 80 100
1010
10
10
3030
401010
Antimicrobial
Percent of Isolates Resistant
1999 (N=17)
Amikacin*Amox-Clav
AmpicillinApramycin
CeftiofurCeftriaxoneCephalothin
ChloramphenicolCiprofloxacin
FlorfenicolGentamicinKanamycin
Nalidixic AcidStreptomycin
SulfamethoxazoleTetracycline
Ticarcillin**Trimeth-Sulfa
0 20 40 60 80 100
6
6
24
1266
123030
24
Antimicrobial
Percent of Isolates Resistant
*Amox-Clav=Amoxicillin-Clavulanic Acid **Trimeth-Sulfa=Trimethoprim-Sulfamethoxazole
Not TestedNot Tested
Not Tested
Not Tested
Not Tested
Not Tested
26

National Antimicrobial Resistance Monitoring System For Enteric Bacteria
Figure 4n. Resistance among Salmonella serotype Thompson isolates, 1996-1999
1996 (N=24)
Amikacin*Amox-Clav
AmpicillinApramycin
CeftiofurCeftriaxoneCephalothin
ChloramphenicolCiprofloxacin
FlorfenicolGentamicinKanamycin
Nalidixic AcidStreptomycin
SulfamethoxazoleTetracycline
Ticarcillin**Trimeth-Sulfa
0 20 40 60 80 100
44
8
4
12
1212
4
Antimicrobial
Percent of Isolates Resistant
1997 (N=32)
Amikacin*Amox-Clav
AmpicillinApramycin
CeftiofurCeftriaxoneCephalothin
ChloramphenicolCiprofloxacin
FlorfenicolGentamicinKanamycin
Nalidixic AcidStreptomycin
SulfamethoxazoleTetracycline
Ticarcillin**Trimeth-Sulfa
0 20 40 60 80 100
3
Antimicrobial
Percent of Isolates Resistant
1998 (N=24)
Amikacin*Amox-Clav
AmpicillinApramycin
CeftiofurCeftriaxoneCephalothin
ChloramphenicolCiprofloxacin
FlorfenicolGentamicinKanamycin
Nalidixic AcidStreptomycin
SulfamethoxazoleTetracycline
Ticarcillin**Trimeth-Sulfa
0 20 40 60 80 100
Antimicrobial
Percent of Isolates Resistant
1999 (N=32)
Amikacin*Amox-Clav
AmpicillinApramycin
CeftiofurCeftriaxoneCephalothin
ChloramphenicolCiprofloxacin
FlorfenicolGentamicinKanamycin
Nalidixic AcidStreptomycin
SulfamethoxazoleTetracycline
Ticarcillin**Trimeth-Sulfa
0 20 40 60 80 100
333
Antimicrobial
Percent of Isolates Resistant
*Amox-Clav=Amoxicillin-Clavulanic Acid **Trimeth-Sulfa=Trimethoprim-Sulfamethoxazole
Not TestedNot Tested
Not Tested
Not Tested
Not Tested
Not Tested
36

National Antimicrobial Resistance Monitoring System For Enteric Bacteria
Figure 4o. Resistance among Salmonella serotype Typhimurium isolates, 1996-1999
1996 (N=306)
Amikacin*Amox-Clav
AmpicillinApramycin
CeftiofurCeftriaxoneCephalothin
ChloramphenicolCiprofloxacin
FlorfenicolGentamicinKanamycin
Nalidixic AcidStreptomycin
SulfamethoxazoleTetracycline
Ticarcillin**Trimeth-Sulfa
0 20 40 60 80 100
450
4
240
414
0.35254
49
4
Antimicrobial
Percent of Isolates Resistant
1997 (N=326)
Amikacin*Amox-Clav
AmpicillinApramycin
CeftiofurCeftriaxoneCephalothin
ChloramphenicolCiprofloxacin
FlorfenicolGentamicinKanamycin
Nalidixic AcidStreptomycin
SulfamethoxazoleTetracycline
Ticarcillin**Trimeth-Sulfa
0 20 40 60 80 100
551
51
636
516
15557
53
3
Antimicrobial
Percent of Isolates Resistant
1998 (N=380)
Amikacin*Amox-Clav
AmpicillinApramycin
CeftiofurCeftriaxoneCephalothin
ChloramphenicolCiprofloxacin
FlorfenicolGentamicinKanamycin
Nalidixic AcidStreptomycin
SulfamethoxazoleTetracycline
Ticarcillin**Trimeth-Sulfa
0 20 40 60 80 100
445
2
434
416
0.547
5046
444
Antimicrobial
Percent of Isolates Resistant
1999 (N=362)
Amikacin*Amox-Clav
AmpicillinApramycin
CeftiofurCeftriaxoneCephalothin
ChloramphenicolCiprofloxacin
FlorfenicolGentamicinKanamycin
Nalidixic AcidStreptomycin
SulfamethoxazoleTetracycline
Ticarcillin**Trimeth-Sulfa
0 20 40 60 80 100
341
21
529
282
13
4345
42
3
Antimicrobial
Percent of Isolates Resistant
*Amox-Clav=Amoxicillin-Clavulanic Acid **Trimeth-Sulfa=Trimethoprim-Sulfamethoxazole
Not TestedNot Tested
Not Tested
Not Tested
Not Tested
Not Tested
46

National Antimicrobial Resistance Monitoring SystemFor Enteric Bacteria
Figure 5. Percent of non-Typhi Salmonella isolates that are serotype Typhimurium, by site, 1996 - 1999
LX=Los Angeles County NYC=New York City
56
Percent Typhimurium for all sites:1996 - 306/1326 = 23% 1997 - 326/1301 = 25%1998 - 380/1466 = 26% 1999 - 362/1499 = 24%
CACO
CTFL
GAKS
LXMA
MDMN
NJNYC
NYOR
TNWA
WVTOTAL
0
20
40
60
80
100
Site
Percent of Isolates
1996 1997 1998 1999

National Antimicrobial Resistance Monitoring System For Enteric Bacteria
Figure 6. Percent of Salmonella Typhimurium isolates that are resistant to Ampicillin, Chloramphenicol, Streptomycin, Sulfamethoxazole, and Tetracycline
(ACSSuT), by site, 1996-1999
LX=Los Angeles County NYC=New York City
66
Percent Typhimurium with ACSSuT pattern for all sites:1996 - 103/306 = 34% 1997 - 115/326 = 35%1998 - 120/380 = 32% 1999 - 102/362 = 28%
CACO
CTFL
GAKS
LXMA
MDMN
NJNYC
NYOR
TNWA
WVTOTAL
0
20
40
60
80
100
Site
Percent of Isolates
1996 1997 1998 1999

National Antimicrobial Resistance Monitoring System For Enteric Bacteria
Figure 7. Percent of Salmonella Typhimurium isolates that are resistant to Ampicillin, Kanamycin, Streptomycin, Sulfamethoxazole, and Tetracycline
(AKSSuT), by site, 1996-1999
LX=Los Angeles County NYC=New York City
76
Percent Typhimurium with AKSSuT pattern for all sites:1996 - 27/306 = 9% 1997 - 41/326 = 13%1998 - 46/374 = 12% 1999 - 39/362 = 11%
CACO
CTFL
GAKS
LXMA
MDMN
NJNYC
NYOR
TNWA
WVTOTAL
0
20
40
60
80
100
Site
Percent of Isolates
1996 1997 1998 1999

National Antimicrobial Resistance Monitoring System For Enteric Bacteria
Figure 8. Resistance among Salmonella Typhi isolates, 1999
N=166
Amikacin*Amox-Clav
AmpicillinApramycin
CeftiofurCeftriaxone
CephalothinChloramphenicol
CiprofloxacinFlorfenicol
GentamicinKanamycin
Nalidixic AcidStreptomycin
SulfamethoxazoleTetracycline
**Trimeth-Sulfa
0 20 40 60 80 100
0.613
10.62
12
1914
179
13
Antimicrobial
Percent of Isolates Resistant
*Amox-Clav=Amoxicillin-Clavulanic Acid **Trimeth-Sulfa=Trimethoprim-Sulfamethoxazole
86

National Antimicrobial Resistance Monitoring System For Enteric Bacteria
Figure 9a. MICs among Salmonella Typhi isolates, by antimicrobial agent, 1999
Amikacin Amoxicillin-Clavulanic Acid
Ampicillin Apramycin
4 8 16 32 640
20
40
60
80
100 100
0 0 0 0
Minimum Inhibitory Concentration
Percent of Isolates
Resistant:>640/166=0%
>< 2/1 4/2 8/4 16/8 32/16 64/320
20
40
60
80
100
87.4
1.27.8
30 0.6
Minimum Inhibitory Concentration
Percent of Isolates
Resistant:>321/166=0.6%
><
2 4 8 16 32 64 1280
20
40
60
80
100
86.7
0.6 0 0 0.6
12
0
Minimum Inhibitory Concentration
Percent of Isolates
Resistant:>3221/166=13%
>< 2 4 8 16 320
20
40
60
80
100
64.1
22.9
30 0
Minimum Inhibitory Concentration
Percent of Isolates
Resistant:>320/166=0%
><
96

National Antimicrobial Resistance Monitoring System For Enteric Bacteria
Figure 9b. MICs among Salmonella Typhi isolates, by antimicrobial agent, 1999
Ceftiofur Ceftriaxone
Cephalothin Chloramphenicol
.5 1 2 4 8 16 320
20
40
60
80
100 97
1.2 0.6 0 0 0 1.2
Minimum Inhibitory Concentration
Percent of Isolates
Resistant:>82/166=1%
>< .25 .5 1 2 4 8 16 32 640
20
40
60
80
100 98.8
1 0.6 0 0 0 0 0 0.6
Minimum Inhibitory Concentration
Percent of Isolates
Resistant:>641/166=0.6%
><
1 2 4 8 16 32 640
20
40
60
80
100
24.7
33.1
22.9
124.8
1.2 1.2
Minimum Inhibitory Concentration
Percent of Isolates
Resistant:>324/166=2%
>< 4 8 16 32 640
20
40
60
80
100
80.7
7.20 0
12
Minimum Inhibitory Concentration
Percent of Isolates
Resistant:>32 20/166=12%
><
07

National Antimicrobial Resistance Monitoring System For Enteric Bacteria
Figure 9c. MICs among Salmonella Typhi isolates, by antimicrobial agent, 1999
2 4 8 160
20
40
60
80
100
78.9
19.9
1.2 0
Minimum Inhibitory Concentration
Percent of IsolatesCiprofloxacin Florfenicol
Gentamicin
><
Kanamycin
.03 .06 .12 .25 .5 1 2 40
20
40
60
80
100
75.3
1.87.8
13.9
1.2 0 0 0
Minimum Inhibitory Concentration
Percent of Isolates
MICs:>.25 25/166=15%
><
MICs:>160/166=0%
.25 .5 1 2 4 8 16 320
20
40
60
80
100
70.5
27.1
2.4 0 0 0 0 0
Minimum Inhibitory Concentration
Percent of Isolates
Resistant:>16 0/166=0%
>< 16 32 64 1280
20
40
60
80
100 100
0 0 0
Minimum Inhibitory Concentration
Percent of Isolates
Resistant:>640/166=0%
><
17

National Antimicrobial Resistance Monitoring System For Enteric Bacteria
Figure 9d. MICs among Salmonella Typhi isolates, by antimicrobial agent, 1999
Nalidixic Acid Streptomycin
Sulfamethoxazole Tetracycline
2 4 8 16 32 64 128 2560
20
40
60
80
100
0
73.5
6.61.2 0 1.2 1.8
15.6
Minimum Inhibitory Concentration
Percent of Isolates
Resistant:>3231/166=19%
>< 32 64 128 256 5120
20
40
60
80
100
86.1
1.8 0 0
12
Minimum Inhibitory Concentration
Percent of Isolates
Resistant:>6423/166=14%
><
128 256 512 10240
20
40
60
80
100
83.1
0 0
16.9
Minimum Inhibitory Concentration
Percent of Isolates
Resistant:>51228/166=17%
>< 4 8 16 32 64 1280
20
40
60
80
10091.9
0 0 0
9
0
Minimum Inhibitory Concentration
Percent of Isolates
Resistant:>1615/166=9%
><
27

National Antimicrobial Resistance Monitoring System For Enteric Bacteria
Figure 9e. MICs among Salmonella Typhi isolates, by antimicrobial agent, 1999
Trimethoprim-Sulfamethoxazole
.12/2.38 .25/4.75 .50/9.5 1/19 2/38 4/76 8/1520
20
40
60
80
100
86.7
0.6 0 0 0 0
12.7
Minimum Inhibitory Concentration
Percent of Isolates
Resistant:>4/76 21/166=13%
><
37

National Antimicrobial Resistance Monitoring System For Enteric Bacteria
Figure 10. Resistance among Shigella isolates, 1999
Amikacin*Amox-Clav
AmpicillinApramycin
CeftiofurCeftriaxone
CephalothinChloramphenicol
CiprofloxacinFlorfenicol
GentamicinKanamycin
Nalidixic AcidStreptomycin
SulfamethoxazoleTetracycline
**Trimeth-Sulfa
0 20 40 60 80 100
177
317
0.30.52
565557
51
Antimicrobial
Percent of Isolates Resistant
*Amox-Clav=Amoxicillin-Clavulanic Acid **Trimeth-Sulfa=Trimethoprim-Sulfamethoxazole
N=375
47

National Antimicrobial Resistance Monitoring System For Enteric Bacteria
Figure 11. Resistance among Shigella sonnei and Shigella flexneri isolates, 1999
*Amox-Clav=Amoxicillin-Clavulanic Acid **Trimeth-Sulfa=Trimethoprim-Sulfamethoxazole
Shigella sonnei (N=275) Shigella flexneri (N=87)
Amikacin*Amox-Clav
AmpicillinApramycin
CeftiofurCeftriaxoneCephalothin
ChloramphenicolCiprofloxacin
FlorfenicolGentamicinKanamycin
Nalidixic AcidStreptomycin
SulfamethoxazoleTetracycline
**Trimeth-Sulfa
0 20 40 60 80 100
377
564
163
5992
48
Antimicrobial
Percent of Isolates Resistant
Amikacin*Amox-Clav
AmpicillinApramycin
CeftiofurCeftriaxoneCephalothin
ChloramphenicolCiprofloxacin
FlorfenicolGentamicinKanamycin
Nalidixic AcidStreptomycin
SulfamethoxazoleTetracycline
**Trimeth-Sulfa
0 20 40 60 80 100
0.480
32
0.411
5254
4653
Antimicrobial
Percent of Isolates Resistant
57

National Antimicrobial Resistance Monitoring System For Enteric Bacteria
Figure 12a. MICs among Shigella sonnei isolates, by antimicrobial agent, 1999
4 8 16 32 640
20
40
60
80
100 100
0 0 0 0
Minimum Inhibitory Concentration
Percent of Isolates
2/1 4/2 8/4 16/8 32/16 64/320
20
40
60
80
100
15.312
63.6
8.7
0.4 0
Minimum Inhibitory Concentration
Percent of Isolates
2 4 8 16 32 640
20
40
60
80
100
16
2.2 0 2.2 1.1
78.5
Minimum Inhibitory Concentration
Percent of Isolates
Amikacin Amoxicillin-Clavulanic Acid
Ampicillin
Resistant:>640/275=0%
Resistant:>321/275=0.4%
Resistant:>32219/275=80%
>>
><
< <
2 4 8 16 320
20
40
60
80
100
4
59.3
36.4
0.4 0
Minimum Inhibitory Concentration
Percent of IsolatesApramycin
Resistant:>320/275=0%
><
67

.5 1 2 4 8 16 320
20
40
60
80
100 99.6
0.4 0 0 0 0 0
Minimum Inhibitory Concentration
Percent of Isolates
.25 .5 1 2 4 8 16 32 640
20
40
60
80
100 100
0 0 0 0 0 0 0 0
Minimum Inhibitory Concentration
Percent of Isolates
1 2 4 8 16 32 640
20
40
60
80
100
0.4 1.59.1
55.6
30.5
1.8 1.1
Minimum Inhibitory Concentration
Percent of Isolates
Ceftiofur Ceftriaxone
Cephalothin
Resistant:>80/275=0%
Resistant:>640/275=0%
Resistant:>328/275 =3%
>>
><
< <
4 8 16 32 640
20
40
60
80
100 97.5
0.7 0 1.8 0
Minimum Inhibitory Concentration
Percent of IsolatesChloramphenicol
Resistant:>325/275=2%
><
National Antimicrobial Resistance Monitoring System For Enteric Bacteria
Figure 12b. MICs among Shigella sonnei isolates, by antimicrobial agent, 1999
77

National Antimicrobial Resistance Monitoring System For Enteric Bacteria
Figure 12c. MICs among Shigella sonnei isolates, by antimicrobial agent, 1999
.03 .06 .12 .25 .5 1 2 40
20
40
60
80
100 98.6
0.4 0.4 0.7 0 0 0 0
Minimum Inhibitory Concentration
Percent of IsolatesCiprofloxacin
Resistant:>0.250/275=0%
><
.25 .5 1 2 4 8 16 320
20
40
60
80
100
6.9
56.7
35.3
0.7 0 0 0 0.4
Minimum Inhibitory Concentration
Percent of IsolatesGentamicin
Resistant:>161/275=0.4%
>< 16 32 64 1280
20
40
60
80
100 99.3
0 0.4 0.4
Minimum Inhibitory Concentration
Percent of Isolates Kanamycin
Resistant:>642/275=1%
><
2 4 8 160
20
40
60
80
100
48.451.3
0.4 0
Minimum Inhibitory Concentration
Percent of Isolates Florfenicol
Resistant:>160/275=0%
><
87

National Antimicrobial Resistance Monitoring System For Enteric Bacteria
Figure 12d. MICs among Shigella sonnei isolates, by antimicrobial agent, 1999
2 4 8 16 32 640
20
40
60
80
100
0
97.8
0.7 0 0.4 1.1
Minimum Inhibitory Concentration
Percent of IsolatesNalidixic Acid
Resistant:>324/275=1%
>< 32 64 128 256 5120
20
40
60
80
100
48
4.712 10.5
24.7
Minimum Inhibitory Concentration
Percent of Isolates Streptomycin
Resistant:>64 143/275=52%
><
128 256 512 10240
20
40
60
80
100
45.5
0 0.7
53.8
Minimum Inhibitory Concentration
Percent of Isolates Sulfamethoxazole
Resistant:>512150/275=54%
>< 4 8 16 32 64 1280
20
40
60
80
100
53.5
0.4 0.4
22.2 23.6
0
Minimum Inhibitory Concentration
Percent of IsolatesTetracycline
Resistant:>16127/275=46%
><
97

.12/2.38 .25/4.75 .50/9.5 1/19 2/38 4/76 8/1520
20
40
60
80
100
45.8
0.4 0.4 0.4 0 0
53.1
Minimum Inhibitory Concentration
Percent of IsolatesTrimethoprim-Sufamethoxazole
Resistant:>4/76146/275=53%
><
National Antimicrobial Resistance Monitoring System For Enteric Bacteria
Figure 12e. MICs among Shigella sonnei isolates, by antimicrobial agent, 1999
08

4 8 16 32 640
20
40
60
80
100 97.7
2.3 0 0 0
Minimum Inhibitory Concentration
Percent of Isolates
2/1 4/2 8/4 16/8 32/16 64/320
20
40
60
80
100
20.6
4.69.2
62.1
3.40
Minimum Inhibitory Concentration
Percent of Isolates
2 4 8 16 32 640
20
40
60
80
100
21.8
1.1 0 0 1.1
75.9
Minimum Inhibitory Concentration
Percent of Isolates
Amikacin Amoxicillin-Clavulanic Acid
Ampicillin
Resistant:>640/87=0%
Resistant:>323/87=3%
Resistant:>3267/87=77%
>>
><
< <
2 4 8 16 320
20
40
60
80
100
8
43.7 46
2.3 0
Minimum Inhibitory Concentration
Percent of IsolatesApramycin
Resistant:>320/87=0%
><
National Antimicrobial Resistance Monitoring System For Enteric Bacteria
Figure 13a. MICs among Shigella flexneri isolates, by antimicrobial agent, 1999
18

.5 1 2 4 8 16 320
20
40
60
80
100 100
0 0 0 0 0 0
Minimum Inhibitory Concentration
Percent of Isolates
.25 .5 1 2 4 8 16 32 640
20
40
60
80
100 100
0 0 0 0 0 0 0 0
Minimum Inhibitory Concentration
Percent of Isolates
1 2 4 8 16 32 640
20
40
60
80
100
06.9
29.9
42.5
16.1
3.4 1.1
Minimum Inhibitory Concentration
Percent of Isolates
Ceftiofur Ceftriaxone
Cephalothin
Resistant:>80/87=0%
Resistant:>640/87=0%
Resistant:>324/87=5%
>>
><
< <
4 8 16 32 640
20
40
60
80
100
31
2.3 2.3
28.735.6
Minimum Inhibitory Concentration
Percent of IsolatesChloramphenicol
Resistant:>3256/87=64%
><
National Antimicrobial Resistance Monitoring System For Enteric Bacteria
Figure 13b. MICs among Shigella flexneri isolates, by antimicrobial agent, 1999
28

National Antimicrobial Resistance Monitoring System For Enteric Bacteria
Figure 13c. MICs among Shigella flexneri isolates, by antimicrobial agent, 1999
.03 .06 .12 .25 .5 1 2 40
20
40
60
80
100 98.9
0 0 0 0 1.1 0 0
Minimum Inhibitory Concentration
Percent of IsolatesCiprofloxacin
><
.25 .5 1 2 4 8 16 320
20
40
60
80
100
9.2
44.8 46
0 0 0 0 0
Minimum Inhibitory Concentration
Percent of IsolatesGentamicin
>< 16 32 64 1280
20
40
60
80
100 100
0 0 0
Minimum Inhibitory Concentration
Percent of Isolates Kanamycin
><
2 4 8 160
20
40
60
80
10093.1
6.90 0
Minimum Inhibitory Concentration
Percent of Isolates Florfenicol
><
Resistant:>0.250/87=0%
Resistant:>160/87=0%
Resistant:>640/87=0%
Resistant:>160/87=0%
38

National Antimicrobial Resistance Monitoring System For Enteric Bacteria
Figure 13d. MICs among Shigella flexneri isolates, by antimicrobial agent, 1999
2 4 8 16 32 640
20
40
60
80
100
0
97.7
1.1 0 0 1.1
Minimum Inhibitory Concentration
Percent of IsolatesNalidixic Acid
Resistant:>321/87=1%
>< 32 64 128 256 5120
20
40
60
80
100
36.8
20.7
9.214.9
18.4
Minimum Inhibitory Concentration
Percent of Isolates Streptomycin
Resistant:>64 55/87=63%
><
128 256 512 10240
20
40
60
80
100
41.4
0 0
58.6
Minimum Inhibitory Concentration
Percent of Isolates Sulfamethoxazole
Resistant:>51251/87=59%
>< 4 8 16 32 64 1280
20
40
60
80
100
8
0 0
11.5
80.5
0
Minimum Inhibitory Concentration
Percent of IsolatesTetracycline
Resistant:>1680/87=92%
><
48

.12/2.38 .25/4.75 .50/9.5 1/19 2/38 4/76 8/1520
20
40
60
80
100
50.6
1.1 0 0 0 0
48.3
Minimum Inhibitory Concentration
Percent of IsolatesTrimethoprim-Sufamethoxazole
Resistant:>4/7642/87=48%
><
National Antimicrobial Resistance Monitoring System For Enteric Bacteria
Figure 13e. MICs among Shigella flexneri isolates, by antimicrobial agent, 1999
58

National Antimicrobial Resistance Monitoring System For Enteric Bacteria
Figure 14. Resistance among E. coli O157 isolates, 1996-1999
Amikacin*Amox-Clav
AmpicillinApramycin
CeftiofurCeftriaxone
CephalothinChloramphenicol
CiprofloxacinFlorfenicol
GentamicinKanamycin
Nalidixic AcidStreptomycin
SulfamethoxazoleTetracycline
Ticarcillin**Trimeth-Sulfa
0 20 40 60 80 100
1
5
30.5
214
5
Antimicrobial
Percent of Isolates Resistant
1996 (N=201)Amikacin
*Amox-ClavAmpicillin
ApramycinCeftiofur
CeftriaxoneCephalothin
ChloramphenicolCiprofloxacin
FlorfenicolGentamicinKanamycin
Nalidixic AcidStreptomycin
SulfamethoxazoleTetracycline
Ticarcillin**Trimeth-Sulfa
0 20 40 60 80 100
4
211
3
Antimicrobial
Percent of Isolates Resistant
1997 (N=161)
Amikacin*Amox-Clav
AmpicillinApramycin
CeftiofurCeftriaxone
CephalothinChloramphenicol
CiprofloxacinFlorfenicol
GentamicinKanamycin
Nalidixic AcidStreptomycin
SulfamethoxazoleTetracycline
Ticarcillin**Trimeth-Sulfa
0 20 40 60 80 100
3
0.3
0.3
26
43
1
Antimicrobial
Percent of Isolates Resistant
1998 (N=313)
Amikacin*Amox-Clav
AmpicillinApramycin
CeftiofurCeftriaxone
CephalothinChloramphenicol
CiprofloxacinFlorfenicol
GentamicinKanamycin
Nalidixic AcidStreptomycin
SulfamethoxazoleTetracycline
Ticarcillin**Trimeth-Sulfa
0 20 40 60 80 100
0.31
1
0.311
38
3
1
Antimicrobial
Percent of Isolates Resistant
1999 (N=292)
*Amox-Clav=Amoxicillin-Clavulanic Acid **Trimeth-Sulfa=Trimethoprim-Sulfamethoxazole
Not Tested
Not Tested
Not Tested
Not Tested
Not Tested
Not Tested
68

National Antimicrobial Resistance Monitoring System For Enteric Bacteria
Figure 15a. MICs for Amikacin among E. coli O157 isolates, 1996 - 1999
4 8 16 32 640
20
40
60
80
100 99.4
0.6 0 0 0
Minimum Inhibitory Concentration
Percent of Isolates
4 8 16 32 640
20
40
60
80
100 99.7
0.3 0 0 0
Minimum Inhibitory Concentration
Percent of Isolates
1997 (N=161)
1998 (N=313)
Resistant:>640/161=0%
Resistant:>640/313=0%
>
><
<
4 8 16 32 640
20
40
60
80
100 98.6
1.4 0 0 0
Minimum Inhibitory Concentration
Percent of Isolates 1999 (N=292)
Resistant:>640/292=0%
<>
Not tested in 1996
78

National Antimicrobial Resistance Monitoring System For Enteric Bacteria
Figure 15b. MICs for Amoxicillin-Clavulanic Acid among E. coli O157 isolates, 1996 - 1999
1 2 4 8 16 320
20
40
60
80
100
0 3
92
4.50.5 0
Minimum Inhibitory Concentration
Percent of Isolates
1 2 4 8 16 320
20
40
60
80
100
2.5
14.9
82
0.6 0 0
Minimum Inhibitory Concentration
Percent of Isolates
1 2 4 8 16 320
20
40
60
80
100
1.3
19.2
76.7
2.6 0.3 0
Minimum Inhibitory Concentration
Percent of Isolates
1996 (N=201) 1997 (N=161)
1998 (N=313)
Resistant:>320/201=0%
Resistant:>320/161=0%
Resistant:>320/313=0%
>
>
><
<
< 1 2 4 8 16 320
20
40
60
80
100
0.35.8
92.1
1 0.3 0.3
Minimum Inhibitory Concentration
Percent of Isolates
Resistant:>321/292=0.3%
1999 (N=292)
< >
88

National Antimicrobial Resistance Monitoring System For Enteric Bacteria
Figure 15c. MICs for Ampicillin among E. coli O157 isolates, 1996 - 1999
2 4 8 16 32 64 1280
20
40
60
80
100
28.4
70.1
0 0 0 0 1.5
Minimum Inhibitory Concentration
Percent of Isolates
2 4 8 16 32 64 1280
20
40
60
80
100
19.3
80.7
0 0 0 0 0
Minimum Inhibitory Concentration
Percent of Isolates
2 4 8 16 32 64 1280
20
40
60
80
100
37.7
59.4
0.3 0 0 0 2.6
Minimum Inhibitory Concentration
Percent of Isolates
1996 (N=201) 1997 (N=161)
1998 (N=313)
Resistant:>32 3/201=1%
Resistant:>320/161=0%
Resistant:>328/313=3%
>>
><
< <
2 4 8 16 32 64 1280
20
40
60
80
100
26.7
71.9
0 0 0 1.4 0
Minimum Inhibitory Concentration
Percent of Isolates 1999 (N=292)*
Resistant:>324/292=1%
><
* Maximum MIC dilution for 1999 was 32 ug/ml. All resistant isolates had a MIC >32 ug/ml.
98

National Antimicrobial Resistance Monitoring System For Enteric Bacteria
Figure 15d. MICs for Apramycin among E. coli O157 isolates, 1996 - 1999
2 4 8 16 320
20
40
60
80
100
27.4
47.3
24.9
0.5 0
Minimum Inhibitory Concentration
Percent of Isolates
2 4 8 16 320
20
40
60
80
100
69.6
23.6
5.61.2 0
Minimum Inhibitory Concentration
Percent of Isolates
2 4 8 16 320
20
40
60
80
100
57.2
39
3.80 0
Minimum Inhibitory Concentration
Percent of Isolates
1996 (N=201) 1997 (N=161)
1998 (N=313)
Resistant:>32 0/201=0%
Resistant:>320/161=0%
Resistant:>320/313=0%
>>
><
< <
2 4 8 16 320
20
40
60
80
100
59.9
33.9
5.11 0
Minimum Inhibitory Concentration
Percent of Isolates 1999 (N=292)
Resistant:>320/292=0%
><
09

National Antimicrobial Resistance Monitoring System For Enteric Bacteria
Figure 15e. MICs for Ceftiofur among E. coli O157 isolates, 1996 - 1999
.5 1 2 4 8 16 320
20
40
60
80
100
87.6
70.5 0 2 2 1
Minimum Inhibitory Concentration
Percent of Isolates
.5 1 2 4 8 16 320
20
40
60
80
100 97.7
0.7 0 1.4 0 0 0
Minimum Inhibitory Concentration
Percent of Isolates
.5 1 2 4 8 16 320
20
40
60
80
100 99.4
0.6 0 0 0 0 0
Minimum Inhibitory Concentration
Percent of Isolates
1996 (N=201) 1997 (N=161)
1998 (N=313)
Resistant:>8 10/201=5%
Resistant:>80/161=0%
Resistant:>80/313=0%
>>
><
< <
.5 1 2 4 8 16 320
20
40
60
80
100 100
0 0 0 0 0 0
Minimum Inhibitory Concentration
Percent of Isolates 1999 (N=292)
Resistant:>80/292=0%
><
19

National Antimicrobial Resistance Monitoring System For Enteric Bacteria
Figure 15f. MICs for Ceftriaxone among E. coli O157 isolates, 1996 - 1999
.25 .5 1 2 4 8 16 32 640
20
40
60
80
10093
2 2.5 2.5 0 0 0 0 0
Minimum Inhibitory Concentration
Percent of Isolates
.25 .5 1 2 4 8 16 32 640
20
40
60
80
100 98.1
1.2 0 0 0.6 0 0 0 0
Minimum Inhibitory Concentration
Percent of Isolates
.25 .5 1 2 4 8 16 32 640
20
40
60
80
100 100
0 0 0 0 0 0 0 0
Minimum Inhibitory Concentration
Percent of Isolates
1996 (N=201) 1997 (N=161)
1998 (N=313)
Resistant:>64 0/201=0%
Resistant:>640/161=0%
Resistant:>640/313=0%
>>
><
< <
.25 .5 1 2 4 8 16 32 640
20
40
60
80
100 100
0 0 0 0 0 0 0 0
Minimum Inhibitory Concentration
Percent of Isolates 1999 (N=292)
Resistant:>640/292=0%
><
29

National Antimicrobial Resistance Monitoring System For Enteric Bacteria
Figure 15g. MICs for Cephalothin among E. coli O157 isolates, 1996 - 1999
1 2 4 8 16 32 640
20
40
60
80
100
0 06
61.7
29.4
3 0
Minimum Inhibitory Concentration
Percent of Isolates
1 2 4 8 16 32 640
20
40
60
80
100
1.2 1.9
25.5
61.5
6.2 3.70
Minimum Inhibitory Concentration
Percent of Isolates
1 2 4 8 16 32 640
20
40
60
80
100
0.3 0.6
22
72.2
4.80 0
Minimum Inhibitory Concentration
Percent of Isolates
1996 (N=201) 1997 (N=161)
1998 (N=313)
Resistant:>32 6/201=3%
Resistant:>326/161=4%
Resistant:>320/313=0%
>>
><
< <
1 2 4 8 16 32 640
20
40
60
80
100
0 0.37.5
85.6
5.80.3 0.3
Minimum Inhibitory Concentration
Percent of Isolates 1999 (N=292)
Resistant:>322/292=1%
><
39

National Antimicrobial Resistance Monitoring System For Enteric Bacteria
Figure 15h. MICs for Chloramphenicol among E. coli O157 isolates, 1996 - 1999
4 8 16 32 640
20
40
60
80
100
22.4
77.1
0 0.5 0
Minimum Inhibitory Concentration
Percent of Isolates
4 8 16 32 640
20
40
60
80
100 94.4
5.60 0 0
Minimum Inhibitory Concentration
Percent of Isolates
4 8 16 32 640
20
40
60
80
100
84.3
15
0.3 0 0.3
Minimum Inhibitory Concentration
Percent of Isolates
1996 (N=201) 1997 (N=161)
1998 (N=313)
Resistant:>32 1/201=0.5%
Resistant:>320/161=0%
Resistant:>321/313=0.3%
>>
><
< <
4 8 16 32 640
20
40
60
80
100
58.9
41.1
0 0 0
Minimum Inhibitory Concentration
Percent of Isolates 1999 (N=292)
Resistant:>320/292=0%
><
49

National Antimicrobial Resistance Monitoring System For Enteric Bacteria
Figure 15i. MICs for Ciprofloxacin among E. coli O157 isolates, 1996 - 1999
.03 .06 .12 .25 .5 1 2 40
20
40
60
80
100 99
1 0 0 0 0 0 0
Minimum Inhibitory Concentration
Percent of Isolates
.03 .06 .12 .25 .5 1 2 40
20
40
60
80
100 98.7
0 0 1.2 0 0 0 0
Minimum Inhibitory Concentration
Percent of Isolates
.03 .06 .12 .25 .5 1 2 40
20
40
60
80
100 100
0 0 0 0 0 0 0
Minimum Inhibitory Concentration
Percent of Isolates
1996 (N=201) 1997 (N=161)
1998 (N=313)
Resistant:>4 0/201=0%
Resistant;>40/313=0%
>>
><
< <
.03 .06 .12 .25 .5 1 2 40
20
40
60
80
100 99.3
0 0 0.3 0.3 0 0 0
Mininum Inhibitory Concentration
Percent of Isolates 1999 (N=292)
< >
Resistant:>4 0/161=0%
Resistant:>4 0/292=0%
59

2 4 8 160
20
40
60
80
100
5.8
67.5
26.7
0
Mininum Inhibitory Concentration
Percent of Isolates
< >
Not tested in 1996 Not tested in 1997
Not tested in 1998
National Antimicrobial Resistance Monitoring System For Enteric Bacteria
Figure 15j. MICs for Florfenicol among E. coli O157 isolates, 1996 - 1999
1999 (N=292)
MICs:>16 0/292=0%
69

National Antimicrobial Resistance Monitoring System For Enteric Bacteria
Figure 15k. MICs for Gentamicin among E. coli O157 isolates, 1996 - 1999
.25 .5 1 2 4 8 16 320
20
40
60
80
100
10.4
46.3
33.8
9.5
0 0 0 0
Minimum Inhibitory Concentration
Percent of Isolates
.25 .5 1 2 4 8 16 320
20
40
60
80
100
59
26.1
13
1.2 0.6 0 0 0
Minimum Inhibitory Concentration
Percent of Isolates
.25 .5 1 2 4 8 16 320
20
40
60
80
100
31.9
49.2
17.6
1.3 0 0 0 0
Minimum Inhibitory Concentration
Percent of Isolates
1996 (N=201) 1997 (N=161)
1998 (N=313)
Resistant:>16 0/201=0%
Resistant:>160/161=0%
Resistant:>160/313=0%
>>
><
< <
.25 .5 1 2 4 8 16 320
20
40
60
80
100
40.4
50.7
6.52.1 0 0 0 0.3
Minimum Inhibitory Concentration
Percent of Isolates 1999 (N=292)
Resistant:>161/292=0.3%
< >
79

National Antimicrobial Resistance Monitoring System For Enteric Bacteria
Figure 15l. MICs for Kanamycin among E. coli O157 isolates, 1996 - 1999
16 32 64 1280
20
40
60
80
100 100
0 0 0
Minimum Inhibitory Concentration
Percent of Isolates
16 32 64 1280
20
40
60
80
100 100
0 0 0
Minimum Inhibitory Concentration
Percent of Isolates
16 32 64 1280
20
40
60
80
100 99.4
0.3 0 0.3
Minimum Inhibitory Concentration
Percent of Isolates
1996 (N=201) 1997 (N=161)
1998 (N=313)
Resistant:>64 0/201=0%
Resistant:>640/161=0%
Resistant:>641/313=0.3%
>>
><
< <
16 32 64 1280
20
40
60
80
100 99.3
0 0 0.7
Minimum Inhibitory Concentration
Percent of Isolates 1999 (N=292)
Resistant:>642/292=1%
><
89

National Antimicrobial Resistance Monitoring System For Enteric Bacteria
Figure 15m. MICs for Nalidixic Acid among E. coli O157 isolates, 1996 - 1999
2 4 8 16 32 640
20
40
60
80
100
6
90.1
40 0 0
Minimum Inhibitory Concentration
Percent of Isolates
2 4 8 16 32 640
20
40
60
80
100
0
98.8
0.6 0.6 0 0
Minimum Inhibitory Concentration
Percent of Isolates
2 4 8 16 32 640
20
40
60
80
100
0
97.8
1.9 0.3 0 0
Minimum Inhibitory Concentration
Percent of Isolates
1996 (N=201) 1997 (N=161)
1998 (N=313)
Resistant:>32 0/201=0%
Resistant:>320/161=0%
Resistant:>320/313=0%
>>
><
< <
2 4 8 16 32 640
20
40
60
80
100
0
99
0 0.3 0 0.7
Minimum Inhibitory Concentration
Percent of Isolates 1999 (N=292)
Resistant:>322/292=1%
><
99

National Antimicrobial Resistance Monitoring System For Enteric Bacteria
Figure 15n. MICs for Streptomycin among E. coli O157 isolates, 1996 - 1999
32 64 128 256 5120
20
40
60
80
100 98
1.5 0.5 0 0
Minimum Inhibitory Concentration
Percent of Isolates
32 64 128 256 5120
20
40
60
80
100 97.5
0.6 1.2 0.6 0
Minimum Inhibitory Concentration
Percent of Isolates
32 64 128 256 5120
20
40
60
80
100 98.1
0.3 1.3 0.3 0
Minimum Inhibitory Concentration
Percent of Isolates
1996 (N=201) 1997 (N=161)
1998 (N=313)
Resistant:>64 4/201=2%
Resistant:>644/161=2%
Resistant:>646/313=2%
>>
><
< <
32 64 128 256 5120
20
40
60
80
100 97.3
2.4 0 0.3 0
Minimum Inhibitory Concentration
Percent of Isolates 1999 (N=292)
Resistant:>648/292=3%
><
001

National Antimicrobial Resistance Monitoring System For Enteric Bacteria
Figure 15o. MICs for Sulfamethoxazole among E. coli O157 isolates, 1996 - 1999
128 256 512 10240
20
40
60
80
100
79.6
6.51
12.9
Minimum Inhibitory Concentration
Percent of Isolates
128 256 512 10240
20
40
60
80
100
87
2.5 3.17.5
Minimum Inhibitory Concentration
Percent of Isolates
128 256 512 10240
20
40
60
80
100 94.2
0 05.8
Minimum Inhibitory Concentration
Percent of Isolates
1996 (N=201) 1997 (N=161)
1998 (N=313)
Resistant:>512 28/201=14%
Resistant:>51217/161=11%
Resistant:>51218/313=6%
>>
><
< <
128 256 512 10240
20
40
60
80
10091.8
0 0
8.2
Minimum Inhibitory Concentration
Percent of Isolates1999 (N=292)
Resistant:>51224/292=8%
><
101

National Antimicrobial Resistance Monitoring System For Enteric Bacteria
Figure 15p. MICs for Tetracycline among E. coli O157 isolates, 1996 - 1999
4 8 16 32 64 1280
20
40
60
80
100 94
1 0 04.5
0.5
Minimum Inhibitory Concentration
Percent of Isolates
4 8 16 32 64 1280
20
40
60
80
100 96.9
0 0 0.6 0.6 1.9
Minimum Inhibitory Concentration
Percent of Isolates
4 8 16 32 64 1280
20
40
60
80
100 95.5
0 0 0.6 1.6 2.2
Minimum Inhibitory Concentration
Percent of Isolates
1996 (N=201) 1997 (N=161)
1998 (N=313)
Resistant:>1610/201=5%
Resistant:>165/161=3%
Resistant:>1614/313=4%
>>
><
< <
4 8 16 32 64 1280
20
40
60
80
100 96.6
0 0 03.4
0
Minimum Inhibitory Concentration
Percent of Isolates 1999 (N=292)*
Resistant:>1610/292=3%
><
* Maximum MIC dilution for 1999 was 32 ug/ml. All resistant isolates had a MIC >32 ug/ml.
201

National Antimicrobial Resistance Monitoring System For Enteric Bacteria
Figure 15q. MICs for Trimethoprim-Sulfamethoxazole among E. coli O157 isolates, 1996 - 1999
.12/2.38 .25/4.75 .50/9.5 1/19 2/38 4/76 8/1520
20
40
60
80
100 99.5
0.5 0 0 0 0 0
Minimum Inhibitory Concentration
Percent of Isolates
.12/2.38 .25/4.75 .50/9.5 1/19 2/38 4/76 8/1520
20
40
60
80
100 100
0 0 0 0 0 0
Minimum Inhibitory Concentration
Percent of Isolates
.12/2.38 .25/4.75 .50/9.5 1/19 2/38 4/76 8/1520
20
40
60
80
100 99.4
0 0 0 0 0 0.6
Minimum Inhibitory Concentration
Percent of Isolates
1996 (N=201) 1997 (N=161)
1998 (N=313)
Resistant:>4/76 0/201=0%
Resistant:>4/760/161=0%
Resistant:>4/762/313=1%
>>
><
< <
.12/2.38 .25/4.75 .50/9.5 1/19 2/38 4/76 8/1520
20
40
60
80
100 98.3
0.3 0 0 0 0 1.4
Minimum Inhibitory Concentration
Percent of Isolates 1999 (N=292)
Resistant:>4/764/292=1%
><
301

Azithromycin
Chloramphenicol
Ciprofloxacin
Clindamycin
Erythromycin
Gentamicin
Nalidixic Acid
Tetracycline
0 20 40 60 80 100
6
13
7
8
24
48
Antimicrobial
Percent of Isolates Resistant
1997 (N=217)
Azithromycin
Chloramphenicol
Ciprofloxacin
Clindamycin
Erythromycin
Gentamicin
Nalidixic Acid
Tetracycline
0 20 40 60 80 100
2
2
13
1
3
17
46
Antimicrobial
Percent of Isolates Resistant
1998 (N=345)
Azithromycin
Chloramphenicol
Ciprofloxacin
Clindamycin
Erythromycin
Gentamicin
Nalidixic Acid
Tetracycline
0 20 40 60 80 100
3
0.3
18
1
2
21
44
Antimicrobial
Percent of Isolates Resistant
1999 (N=319)
Not Tested
Not Tested
Not Tested
National Antimicrobial Resistance Monitoring System For Enteric Bacteria
Figure 16. Resistance among Campylobacter isolates, 1997- 1999
401

Azithromycin
Chloramphenicol
Ciprofloxacin
Clindamycin
Erythromycin
Gentamicin
Nalidixic Acid
Tetracycline
0 20 40 60 80 100
6
13
6
8
24
48
Antimicrobial
Percent of Isolates Resistant
1997 (N=209)
Azithromycin
Chloramphenicol
Ciprofloxacin
Clindamycin
Erythromycin
Gentamicin
Nalidixic Acid
Tetracycline
0 20 40 60 80 100
2
1
13
1
3
15
46
Antimicrobial
Percent of Isolates Resistant
1998 (N=330)
Azithromycin
Chloramphenicol
Ciprofloxacin
Clindamycin
Erythromycin
Gentamicin
Nalidixic Acid
Tetracycline
0 20 40 60 80 100
3
0.3
18
1
2
20
46
Antimicrobial
Percent of Isolates Resistant
1999 (N=295)
Not Tested
Not Tested
Not Tested
National Antimicrobial Resistance Monitoring System For Enteric Bacteria
Figure 17a. Resistance among Campylobacter jejuni isolates, 1997- 1999
501

Azithromycin
Chloramphenicol
Ciprofloxacin
Clindamycin
Erythromycin
Gentamicin
Nalidixic Acid
Tetracycline
0 20 40 60 80 100
25
25
75
Antimicrobial
Percent of Isolates Resistant
1997 (N=4)
Azithromycin
Chloramphenicol
Ciprofloxacin
Clindamycin
Erythromycin
Gentamicin
Nalidixic Acid
Tetracycline
0 20 40 60 80 100
11
22
11
11
11
55
44
Antimicrobial
Percent of Isolates Resistant
1998 (N=9)
Azithromycin
Chloramphenicol
Ciprofloxacin
Clindamycin
Erythromycin
Gentamicin
Nalidixic Acid
Tetracycline
0 20 40 60 80 100
10
30
10
10
30
30
Antimicrobial
Percent of Isolates Resistant
1999 (N=20)
Not Tested
Not Tested
Not Tested
National Antimicrobial Resistance Monitoring System For Enteric Bacteria
Figure 17b. Resistance among Campylobacter coli isolates, 1997- 1999
601

National Antimicrobial Resistance Monitoring System For Enteric Bacteria
Figure 18a. MICs for Azithromycin among Campylobacter jejuni isolates, 1997 - 1999
.016 .032 .064 .125 .25 .5 1 2 4 8 16 32 64 1280
20
40
60
80
100
0.9 0.3 0.6 1.54.6
13.7
24.121
15.8
8.54.6
0.9 0.9 0.6 0.6 0.3 0 0 0 0 0 0 0 0 0 0 0 0.9
Minimum Inhibitory Concentration
Percent of Isolates1998 (N=330)
1999 (N=295)
Resistant:>26/330=2%
Resistant:>28/295=3%
> 256
> 256
<
<
Not tested in 1997
.016 .032 .064 .125 .25 .5 1 2 4 8 16 32 64 1280
20
40
60
80
100
0 0 0.7 2
8.5
13.6
26.8
19.7
12.57.5
2.4 1.7 1.4 0.7 0.3 0.3 0.7 0 0 0 0 0 0 0 0 0 0 1.3
Minimum Inhibitory Concentration
Percent of Isolates
701

National Antimicrobial Resistance Monitoring System For Enteric Bacteria
Figure 18b. MICs for Chloramphenicol among Campylobacter jejuni isolates, 1997 - 1999
1997 (N=209)
Resistant:>3212/209=6%
.125 .38 .75 1 2 4 8 16 32 64 128 2560
20
40
60
80
100
0.5 1 14.3 3.3
0.5
1114.4 14.8
12 12.4
5.7 4.82.9 2.4 3.3
1 0 0.5 0 0 04.3
Minimum Inhibitory Concentration
Percent of Isolates
.125 .38 .75 1 2 4 8 16 32 64 128 2560
20
40
60
80
100
0 0.3 0 0.3 2.10
6.1
13.6
19.724.5
10.97.9 7.3
4.51.2 0.9 0.3 0 0.3 0 0 0 0
Minimum Inhibitory Concentration
Percent of Isolates 1998 (N=330)
1999 (N=295)
Resistant:>322/330=1%
Resistant:>321/295=0.3%
<
<
>
>
><
.125 .38 .75 1 2 4 8 16 32 64 128 2560
20
40
60
80
100
0.3 0.3 0.3 02
0
12.2
27.8
20.316.9
9.8
4.4 3.1 1.4 0.3 0.3 0 0.3 0 0 0 0 0
Minimum Inhibitory Concentration
Percent of Isolates
801

National Antimicrobial Resistance Monitoring System For Enteric Bacteria
Figure 18c. MICs for Ciprofloxacin among Campylobacter jejuni isolates, 1997 - 1999
.016 .047 .094 .19 .38 .75 1.5 3 6 12 240
20
40
60
80
100
0.5 1.43.8
9.6
17.714.4 14.8
11.5
3.8 5.31 1 1 1 0.5 0 0 0 0 0 0
12.9
Minimum Inhibitory Concentration
Percent of Isolates1997 (N=209)
Resistant:>427/209=13%
> 32< .016 .047 .094 .19 .38 .75 1.5 3 6 12 240
20
40
60
80
100
0.64.8
7.9
19.717.3 18.5
8.5
3.3 3 1.5 0 0.9 0.3 0 0 0 0 0 0 0.3 0
13.1
Minimum Inhibitory Concentration
Percent of Isolates1998 (N=330)
Resistant:>444/330=13%
> 32<
.016 .047 .094 .19 .38 .75 1.5 3 6 12 240
20
40
60
80
100
1
16.9 15.918.6
12.59.8
3.40.6 1 1 0.3 0.7 0.3 0 0 0 0 0.7 0.3 0 0
16.6
Minimum Inhibitory Concentration
Percent of Isolates1999 (N=295)
Resistant:>452/295=18%
< > 32
901

National Antimicrobial Resistance Monitoring System For Enteric Bacteria
Figure 18d. MICs for Clindamycin among Campylobacter jejuni isolates, 1997 - 1999
.032 .064 .125 .25 .5 1 2 4 8 16 32 96 1920
20
40
60
80
100
1.4 2.9 1.94.8
10 10.5
19.614.412.4
3.8 5.72.9 2.4 1.4 1 0 0.5 0 0 0 0.5 0.5 0 0 0 0
3.3
Minimum Inhibitory Concentration
Percent of Isolates1997 (N=209)
Resistant:>412/209=6%
> 256< .032 .064 .125 .25 .5 1 2 4 8 16 32 96 1920
20
40
60
80
100
1.5 2.47
3.9
19.118.515.515.8
6.1 4.9 2.7 0.9 0.3 0.3 0 0 0.6 0 0 0 0.3 0 0 0 0 0 0
Minimum Inhibitory Concentration
Percent of Isolates1998 (N=330)
Resistant:>43/330=1%
> 256<
.032 .064 .125 .25 .5 1 2 4 8 16 32 96 1920
20
40
60
80
100
0.6 0.7 2.46.8
13.6
22 21.4
14.99.5
3.7 1.7 1.4 0.3 0 0.3 0 0.3 0 0 0 0 0 0 0 0 0 0.3
Minimum Inhibitory Concentration
Percent of Isolates 1999 (N=295)
Resistant:>43/295=1%
> 256<
01
1

National Antimicrobial Resistance Monitoring System For Enteric Bacteria
Figure 18e. MICs for Erythromycin among Campylobacter jejuni isolates, 1997 - 1999
.047 .094 .19 .38 .75 1.5 3 6 12 24 48 1280
20
40
60
80
100
1.4 0.5 1 1.9 1 2.97.2 8.1
17.219.6
13.4
7.24.8 5.3
1 1.4 1 0.5 0 0 0 0 04.8
Minimum Inhibitory Concentration
Percent of Isolates1997 (N=209)
Resistant:>816/209=8%
> 256< .047 .094 .19 .38 .75 1.5 3 6 12 24 48 1280
20
40
60
80
100
0 0.6 0.3 0.6 1.5 2.1
9.4
18.5 18.5
25.1
11.56.7
1.2 0.9 0.3 0.3 0.6 0.6 0 0 0 0 0 1.2
Minimum Inhibitory Concentration
Percent of Isolates1998 (N=330)
Resistant:>89/330=3%
> 256<
1999 (N=295)
Resistant:>86/295=2%
> 256< .047 .094 .19 .38 .75 1.5 3 6 12 24 48 1280
20
40
60
80
100
0 0 0 0 0.33.1
8.5
18.3
24.4 23.4
13.6
4.71 0.3 0.3 0.3 0 0.3 0 0 0 0 0 1.4
Minimum Inhibitory Concentration
Percent of Isolates
11
1

National Antimicrobial Resistance Monitoring System For Enteric Bacteria
Figure 18f. MICs for Gentamicin among Campylobacter jejuni isolates, 1997 - 1999
.025 .064 .125 .25 .5 1 2 4 8 160
20
40
60
80
100
0.6 0.3 0.3 0.9
6.7
13.7
20.4 21.3 21
7.94
1.5 0.9 0 0 0 0.3 0 0
Minimum Inhibitory Concentration
Percent of Isolates1998 (N=330)
Resistant:>160/330=0%
><
.025 .064 .125 .25 .5 1 2 4 8 160
20
40
60
80
100
02 3.1
9.2
21.719.7 18.3
16.2
4.71.7 1.7 0 1 0.3 0.3 0 0 0 0
Minimum Inhibitory Concentration
Percent of Isolates1999 (N=295)
Resistant:>160/295=0%
><
Not tested in 1997
21
1

National Antimicrobial Resistance Monitoring System For Enteric Bacteria
Figure 18g. MICs for Nalidixic Acid among Campylobacter jejuni isolates, 1997 - 1999
.047 .094 .19 .38 .75 1.5 3 6 12 24 48 96 1920
20
40
60
80
100
0.5 0 0 0 0 0 0 0 0 0.5 04.3
6.710.5
14.812
14.8
6.7 5.71 0.5 1 1.4 0 0
19.6
Minimum Inhibitory Concentration
Percent of Isolates1997 (N=209)
Resistant:>3249/209=23%
< > 256 .047 .094 .19 .38 .75 1.5 3 6 12 24 48 96 1920
20
40
60
80
100
0 0 0 0 0 0 0 0.3 0 0.65.5
10.6
19.518.815.2
9.1
2.4 2.1 0.6 0.3 0 0 0 0 0
14.9
Minimum Inhibitory Concentration
Percent of Isolates1998 (N=330)
Resistant:>3250/330=15%
< > 256
.047 .094 .19 .38 .75 1.5 3 6 12 24 48 96 1920
20
40
60
80
100
0 0 0 0 0.3 0.3 0.74.4 5.1
12.58.1
12.5
18.3
11.5
3.1 1.4 1 0.7 0 0 0.7 0 0 0 0
19.3
Minimum Inhibitory Concentration
Percent of Isolates1999 (N=295)
Resistant:>3259/295=20%
< > 256
31
1

National Antimicrobial Resistance Monitoring System For Enteric Bacteria
Figure 18h. MICs for Tetracycline among Campylobacter jejuni isolates, 1997 - 1999
.023 .047 .094 .19 .38 .75 1.5 3 6 12 24 48 96 1920
20
40
60
80
100
0.5 1.9 1.4 1.44.8 6.7 8.1 8.2
4.81.4
3.3 3.31.4 1 1 0 1.4 0.5 1 0 0 0.5 0
2.4 1 1 0
43.1
Minimum Inhibitory Concentration
Percent of Isolates1997 (N=209)
Resistant:>16102/209=49%
> 256< .023 .047 .094 .19 .38 .75 1.5 3 6 12 24 48 96 1920
20
40
60
80
100
0 0.9 2.1 36.4
9.4 8.8 7 5.5 4.2 2.7 1.5 0.6 0.3 0.3 0.3 0.3 0.3 0 0.3 0 0.9 0 0.9 0.9 1.2 0
42.1
Minimum Inhibitory Concentration
Percent of Isolates1998 (N=330)
Resistant:>16153/330=46%
> 256<
.023 .047 .094 .19 .38 .75 1.5 3 6 12 24 48 96 1920
20
40
60
80
100
0 0 0.35.4 5.4
15.310.1
6.13.7 3.7
1 0.7 1.4 1 0 0 0 0 0 0 0.7 0.3 1.7 1 0 0 0
42
Minimum Inhibitory Concentration
Percent of Isolates1999 (N=295)
Resistant:>16135/295=46%
> 256<
41
1

National Antimicrobial Resistance Monitoring System For Enteric Bacteria
Figure 19a. MICs for Azithromycin among Campylobacter coli isolates, 1997 - 1999
.016 .032 .064 .125 .25 .5 1 2 4 8 16 32 64 1280
20
40
60
80
100
0 0 0
11.1
0 0
22.2
0
22.2
11.1
0 0 0
22.2
0 0 0 0 0 0 0 0 0 0 0 0 0
11.1
Minimum Inhibitory Concentration
Percent of Isolates1998 (N=9)
1999 (N=20)
Resistant:>22/20=10%
> 256
> 256
<
<
Not tested in 1997
.016 .032 .064 .125 .25 .5 1 2 4 8 16 32 64 1280
20
40
60
80
100
0 0 0 0 0
1520
1520
510
50 0 0 0 0 0 0 0 0 0 0 0 0 0 0
10
Minimum Inhibitory Concentration
Percent of Isolates
Resistant:>21/9=11%
51
1

National Antimicrobial Resistance Monitoring System For Enteric Bacteria
Figure 19b. MICs for Chloramphenicol among Campylobacter coli isolates, 1997 - 1999
1997 (N=4)
.125 .38 .75 1 2 4 8 16 32 64 1280
20
40
60
80
100
0 0 0 0 0 0 0 0
25
0 0
25
0 0 0
25
0 0 0 0 0 0
25
Minimum Inhibitory Concentration
Percent of Isolates
.125 .38 .75 1 2 4 8 16 32 64 1280
20
40
60
80
100
0 0 0 0 0 0 0
11.1 11.1
0
33.3
0 0 0
11.1 11.1 11.1 11.1
0 0 0 0 0
Minimum Inhibitory Concentration
Percent of Isolates 1998 (N=9)
1999 (N=20)
<
<
>256
>256
>256<
.125 .38 .75 1 2 4 8 16 32 64 1280
20
40
60
80
100
0 0 0 0 0 0 05
1015
45
10 105
0 0 0 0 0 0 0 0 0
Minimum Inhibitory Concentration
Percent of Isolates
Resistant:>321/4=25%
Resistant:>322/9=22%
Resistant:>320/20=0%
61
1

National Antimicrobial Resistance Monitoring System For Enteric Bacteria
Figure 19c. MICs for Ciprofloxacin among Campylobacter coli isolates, 1997 - 1999
.016 .047 .094 .19 .38 .75 1.5 3 6 12 240
20
40
60
80
100
0 0
25
0 0
25
0 0 0 0 0
50
0 0 0 0 0 0 0 0 0 0
Minimum Inhibitory Concentration
Percent of Isolates1997 (N=4)
> 32 < .016 .047 .094 .19 .38 .75 1.5 3 6 12 240
20
40
60
80
100
11.1
0 0
11.1 11.1 11.1 11.1
33.3
0 0 0 0 0 0 0 0 0 0 0 0 0
11.1
Minimum Inhibitory Concentration
Percent of Isolates1998 (N=9)
> 32<
.016 .047 .094 .19 .38 .75 1.5 3 6 12 240
20
40
60
80
100
0 05
30
1510
50 0 0 0
50 0 0 0 0 0 0 0 0
30
Minimum Inhibitory Concentration
Percent of Isolates1999 (N=20)
< > 32
Resistant:>40/4=0%
Resistant:>41/9=11%
Resistant:>46/20=30%
71
1

National Antimicrobial Resistance Monitoring System For Enteric Bacteria
Figure 19d. MICs for Clindamycin among Campylobacter coli isolates, 1997 - 1999
.032 .064 .125 .25 .5 1 2 4 8 16 32 96 1920
20
40
60
80
100
0 0 0 0
25
0
25
0
25
0 0
25
0 0 0 0 0 0 0 0 0 0 0 0 0 0 0
Minimum Inhibitory Concentration
Percent of Isolates1997 (N=4)
>256< .032 .064 .125 .25 .5 1 2 4 8 16 32 96 1920
20
40
60
80
100
11.1
0 0 0 0
22.2
11.1
0 0 0
22.222.2
0 0 0 0 0 0 0 0 0 0 0 0 0 0
11.1
Minimum Inhibitory Concentration
Percent of Isolates1998 (N=9)
>256<
.032 .064 .125 .25 .5 1 2 4 8 16 32 96 1920
20
40
60
80
100
0 0 0 0 05
10
30 30
105
0 0 0 0 0 0 0 0 0 05
0 0 0 05
Minimum Inhibitory Concentration
Percent of Isolates 1999 (N=20)
>256<
Resistant:>40/4=0%
Resistant:>41/9=11%
Resistant:>42/20=10%
81
1

National Antimicrobial Resistance Monitoring System For Enteric Bacteria
Figure 19e. MICs for Erythromycin among Campylobacter coli isolates, 1997 - 1999
.047 .094 .19 .38 .75 1.5 3 6 12 24 48 1280
20
40
60
80
100
0 0 0 0 0
25
0 0 0
50
0 0 0
25
0 0 0 0 0 0 0 0 0 0
Minimum Inhibitory Concentration
Percent of Isolates1997 (N=4)
> 256< .047 .094 .19 .38 .75 1.5 3 6 12 24 48 1280
20
40
60
80
100
0 0.6 0.3 0.6 1.5 2.1
9.4
18.5 18.5
25.1
11.56.7
1.2 0.9 0.3 0.3 0.6 0.6 0 0 0 0 0 1.2
Minimum Inhibitory Concentration
Percent of Isolates1998 (N=9)
> 256<
1999 (N=20)
> 256 <.047 .094 .19 .38 .75 1.5 3 6 12 24 48 1280
20
40
60
80
100
0 0 0 0 0 0
15 15 1520
10 10
50 0 0 0 0 0 0 0 0 0
10
Minimum Inhibitory Concentration
Percent of Isolates
Resistant:>80/4=0%
Resistant:>81/9=11%
Resistant:>82/20=10%
91
1

National Antimicrobial Resistance Monitoring System For Enteric Bacteria
Figure 19f. MICs for Gentamicin among Campylobacter coli isolates, 1997 - 1999
.025 .064 .125 .25 .5 1 2 4 8 160
20
40
60
80
100
0 0 0 0 0
11.1
0
33.3
11.1 11.1 11.1
22.2
0 0 0 0 0 0 0
Minimum Inhibitory Concentration
Percent of Isolates1998 (N=9)
><
.025 .064 .125 .25 .5 1 2 4 8 160
20
40
60
80
100
0 0 0 0 0
15
25
30
15
510
0 0 0 0 0 0 0 0
Minimum Inhibitory Concentration
Percent of Isolates1999 (N=20)
><
Not tested in 1997
Resistant:>160/9=0%
Resistant:>160/20=0%
021

National Antimicrobial Resistance Monitoring System For Enteric Bacteria
Figure 19g. MICs for Nalidixic Acid among Campylobacter coli isolates, 1997 - 1999
.047 .094 .19 .38 .75 1.5 3 6 12 24 48 96 1920
20
40
60
80
100
0 0 0 0 0 0 0 0 0 0 0 0 0 0 0 0
50
0
25
0 0
25
0 0 0 0
Minimum Inhibitory Concentration
Percent of Isolates1997 (N=4)
< > 256 .047 .094 .19 .38 .75 1.5 3 6 12 24 48 96 1920
20
40
60
80
100
0 0 0 0 0 0 0 0 0 0 0 0 0
22.2
11.1
0 0
11.1
0 0
11.1
0 0 0 0
44.4
Minimum Inhibitory Concentration
Percent of Isolates1998 (N=9)
< > 256
.047 .094 .19 .38 .75 1.5 3 6 12 24 48 96 1920
20
40
60
80
100
0 0 0 0 0 0 0 0 0 05
15
5
2015
50
50 0 0 0 0 0 0
30
Minimum Inhibitory Concentration
Percent of Isolates1999 (N=20)
< > 256
Resistant:>321/4=25%
Resistant:>325/9=56%
Resistant:>326/20=30%
121

National Antimicrobial Resistance Monitoring System For Enteric Bacteria
Figure 19h. MICs for Tetracycline among Campylobacter coli isolates, 1997 - 1999
.023 .047 .094 .19 .38 .75 1.5 3 6 12 24 48 96 1920
20
40
60
80
100
0 0 0 0 0 0 0 0 0 0 0
25
0 0 0 0 0 0 0 0 0 0 0 0 0 0 0
75
Minimum Inhibitory Concentration
Percent of Isolates1997 (N=4)
> 256< .023 .047 .094 .19 .38 .75 1.5 3 6 12 24 48 96 1920
20
40
60
80
100
0 0
11.1
0 0 0
11.1
22.2
11.1
0 0 0 0 0 0 0 0 0 0 0 0 0 0 0 0 0 0
44.4
Minimum Inhibitory Concentration
Percent of Isolates1998 (N=9)
> 256<
.023 .047 .094 .190 .380 .750 1.5 3 6 12 24 48 96 1920
20
40
60
80
100
0 0 0 0
5
20
10 10 10 10
0
5
0 0 0 0 0 0 0 0 0 0 0 0 0 0 0
30
Minimum Inhibitory Concentration
Percent of Isolates1999 (N=20)
> 256<
Resistant:>163/4=75%
Resistant:>164/9=44%
Resistant:>166/20=30%
221