Napa Valley Hydrologic Model Introduction
47
Napa Valley Hydrologic Model Introduction July 25, 2019
Transcript of Napa Valley Hydrologic Model Introduction

Napa Valley Hydrologic Model IntroductionJuly 25, 2019
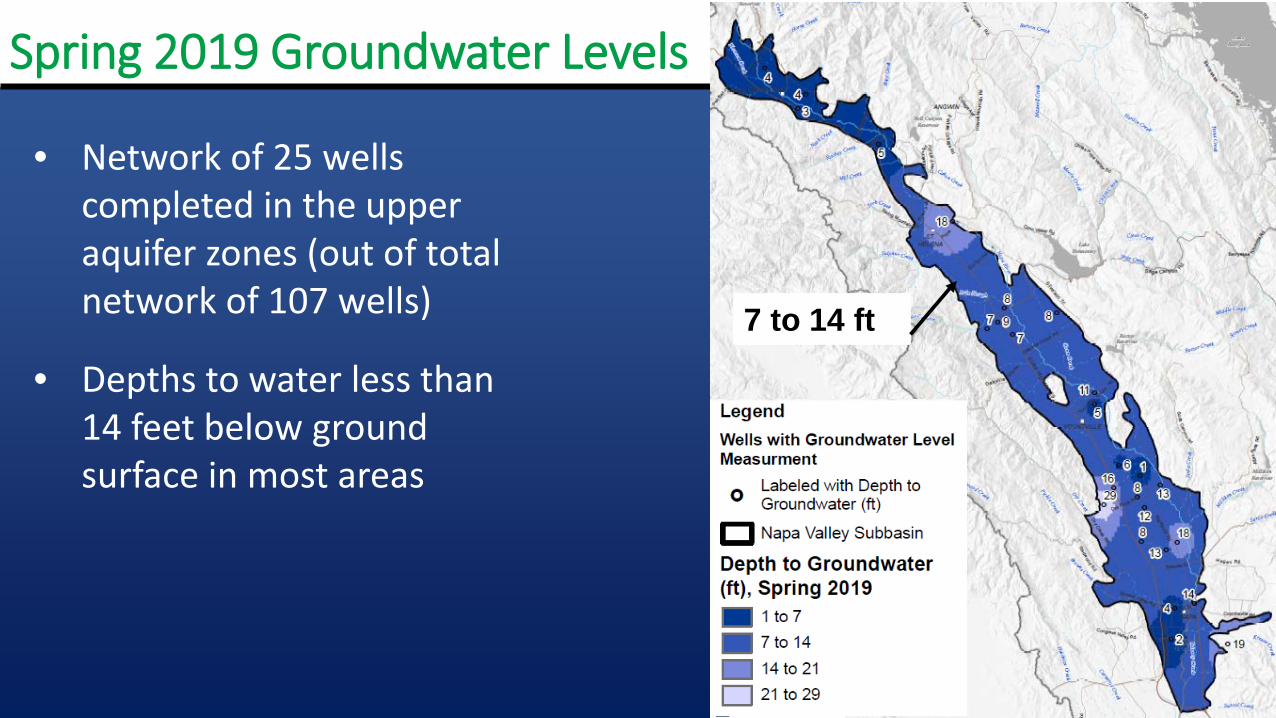
Spring 2019 Groundwater Levels
• Network of 25 wells completed in the upper aquifer zones (out of total network of 107 wells)
• Depths to water less than 14 feet below ground surface in most areas
7 to 14 ft
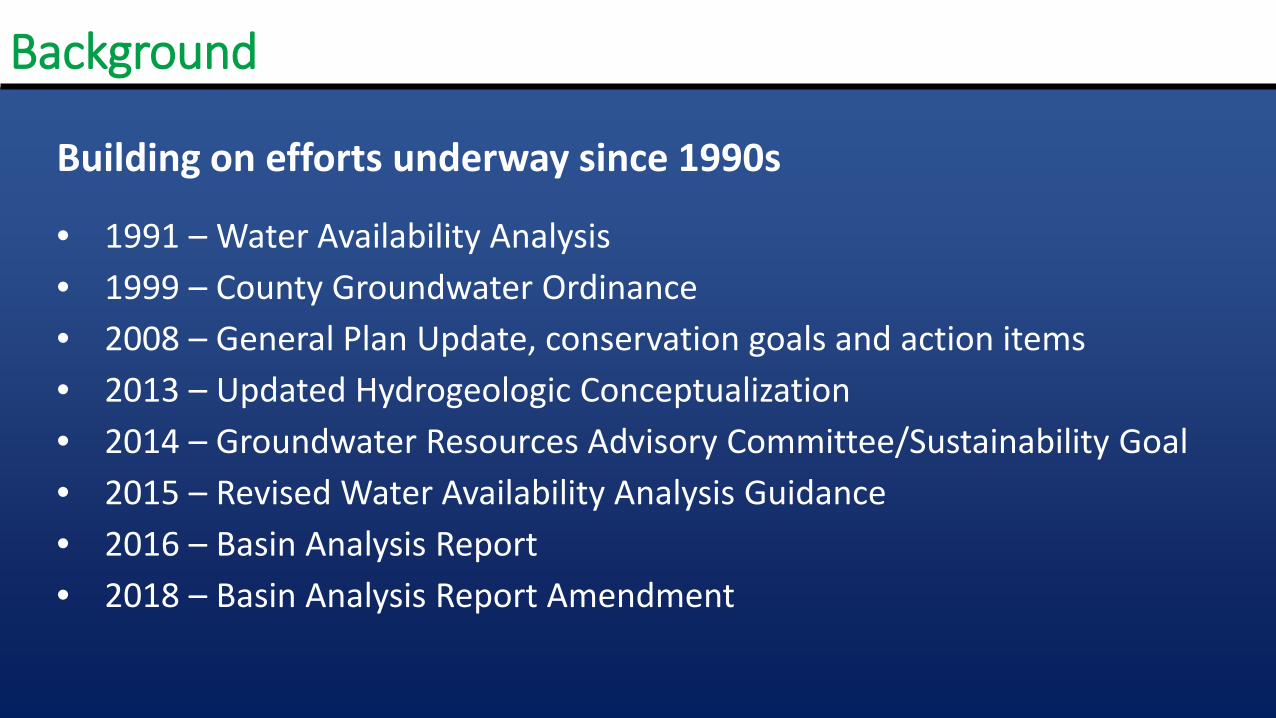
Building on efforts underway since 1990s
• 1991 – Water Availability Analysis • 1999 – County Groundwater Ordinance• 2008 – General Plan Update, conservation goals and action items • 2013 – Updated Hydrogeologic Conceptualization• 2014 – Groundwater Resources Advisory Committee/Sustainability Goal• 2015 – Revised Water Availability Analysis Guidance• 2016 – Basin Analysis Report• 2018 – Basin Analysis Report Amendment
Background
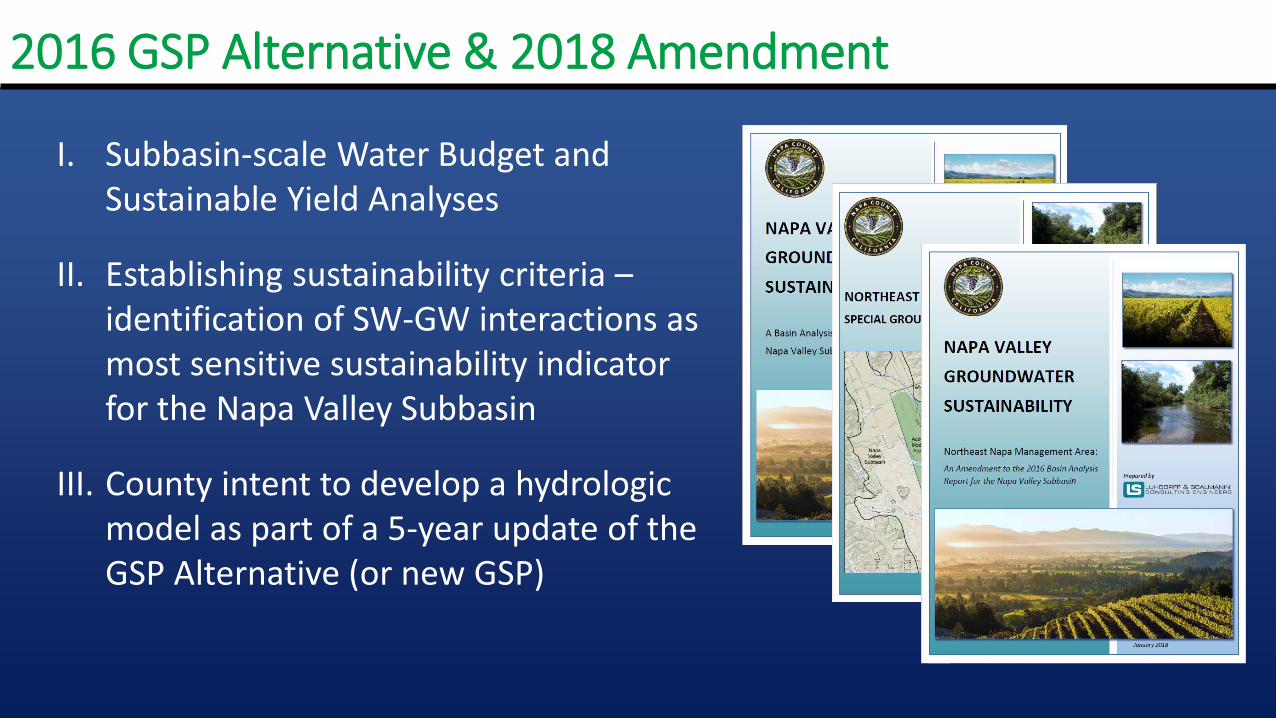
I. Subbasin-scale Water Budget and Sustainable Yield Analyses
II. Establishing sustainability criteria –identification of SW-GW interactions as most sensitive sustainability indicator for the Napa Valley Subbasin
III. County intent to develop a hydrologic model as part of a 5-year update of the GSP Alternative (or new GSP)
2016 GSP Alternative & 2018 Amendment
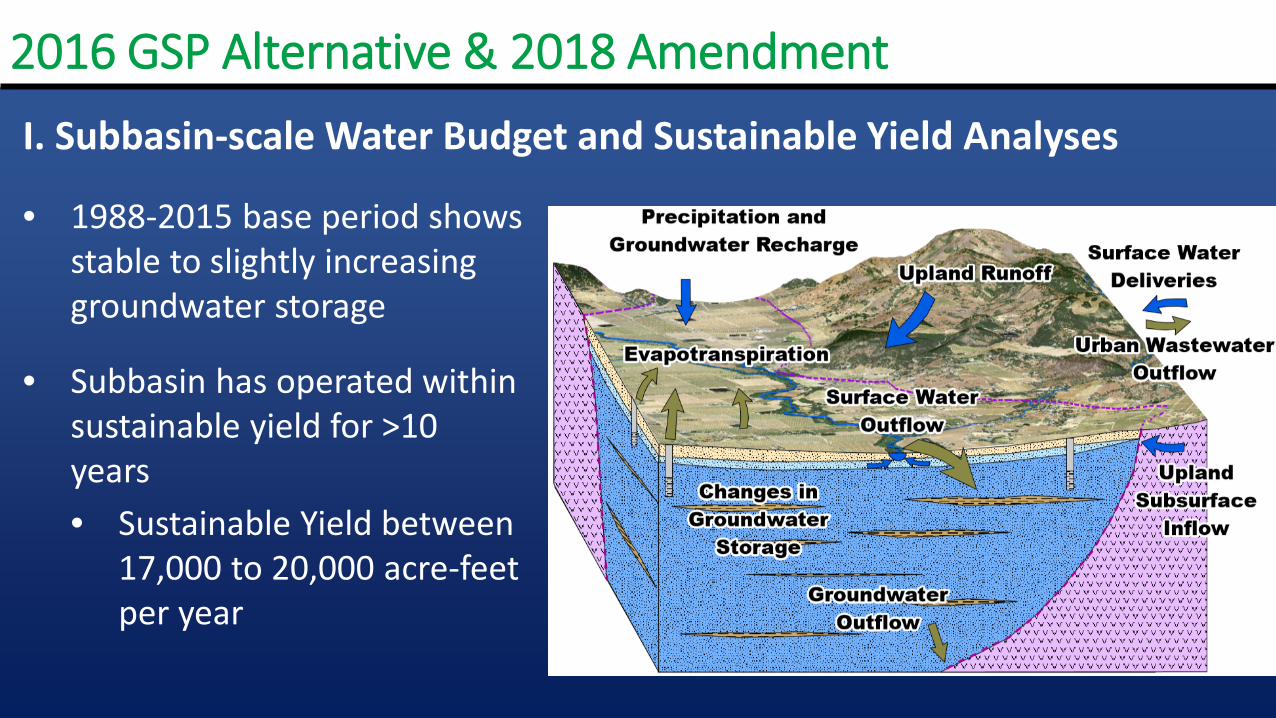
• 1988-2015 base period shows stable to slightly increasing groundwater storage
• Subbasin has operated within sustainable yield for >10 years• Sustainable Yield between
17,000 to 20,000 acre-feet per year
2016 GSP Alternative & 2018 AmendmentI. Subbasin-scale Water Budget and Sustainable Yield Analyses
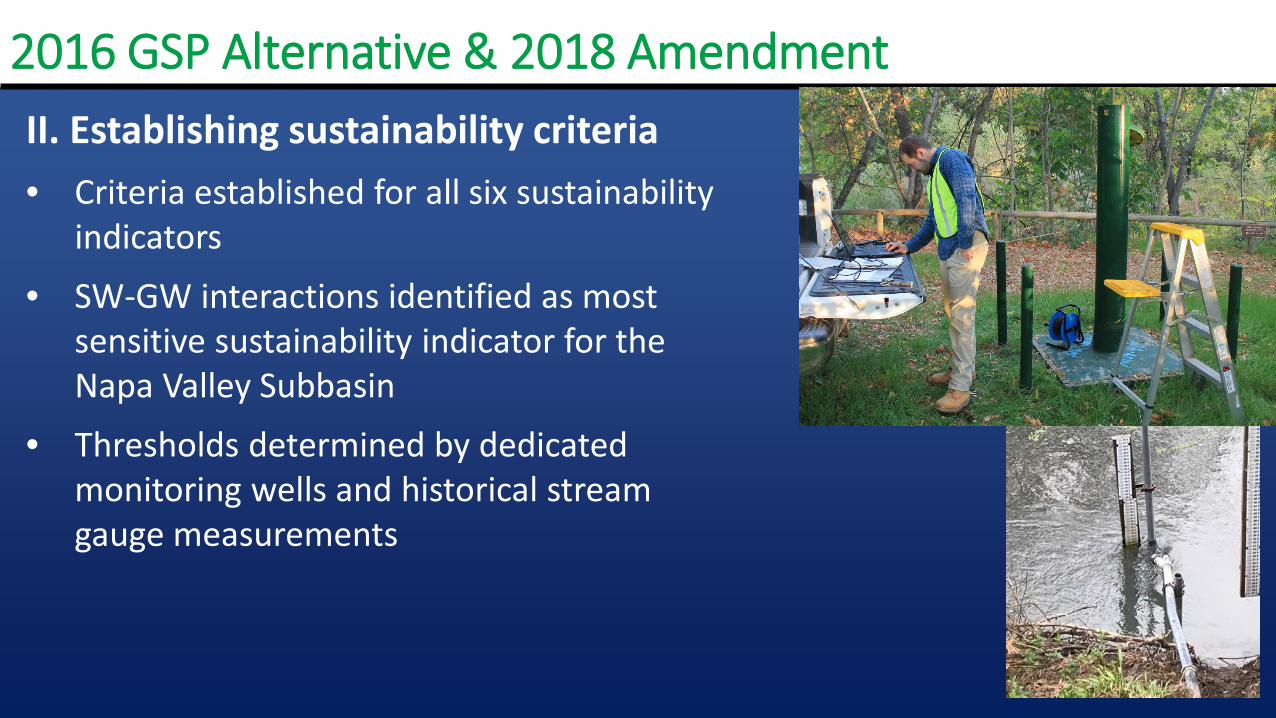
II. Establishing sustainability criteria• Criteria established for all six sustainability
indicators
• SW-GW interactions identified as most sensitive sustainability indicator for the Napa Valley Subbasin
• Thresholds determined by dedicated monitoring wells and historical stream gauge measurements
2016 GSP Alternative & 2018 Amendment

III. Intent to develop a hydrologic model as part of a 5-year update of the GSP Alternative (or new GSP)
• Develop water budgets with biweekly time steps to reflect historical and modern hydrologic conditions
• Evaluate local scale conditions within the Subbasin and affects on six sustainability indicators
• Refine simulations of future conditions and evaluate options for maintaining sustainability
2016 GSP Alternative & 2018 Amendment

Napa Valley Hydrologic Model Extent
• Preliminary Model Extent includes the Napa Valley Subbasin and Napa-Sonoma Lowlands Subbasin
• Model will account for hydrologic inputs from the larger Napa River Watershed
Hydrologist and President of One-Water Hydrologic, LLCFormerly a Research Hydrologist with the USGS for 38 years
• Developed the open-source MODFLOW One-water Hydrologic Flow Model (MF-OWHM) known as “One-Water”
• Collaborated on projects across California (and beyond) on cooperative management of water resources
• Advocate for providing open-source water management software to foster sustainable resource management
• Currently assists consultants in analyzing conjunctive water use and related modeling projects
Randy Hanson
NAPA’s SGMA GSP with the New Integrated Hydrologic Model, “One-Water”
Randall T. HansonOne-Water Hydrologic, LLC
www.one-waterhydrologic.com([email protected])
Napa County Groundwater Sustainability PlanningJuly 25, 2019

Todays Update
1. What is the “One-Water” model?
2. How Can One-Water Support NAPA- GSP for SGMA?
3. Water Budgets and Sustainability for SGMA
4. Undesirable Results and Thresholds
5. Reporting, Maintenance, & Updates
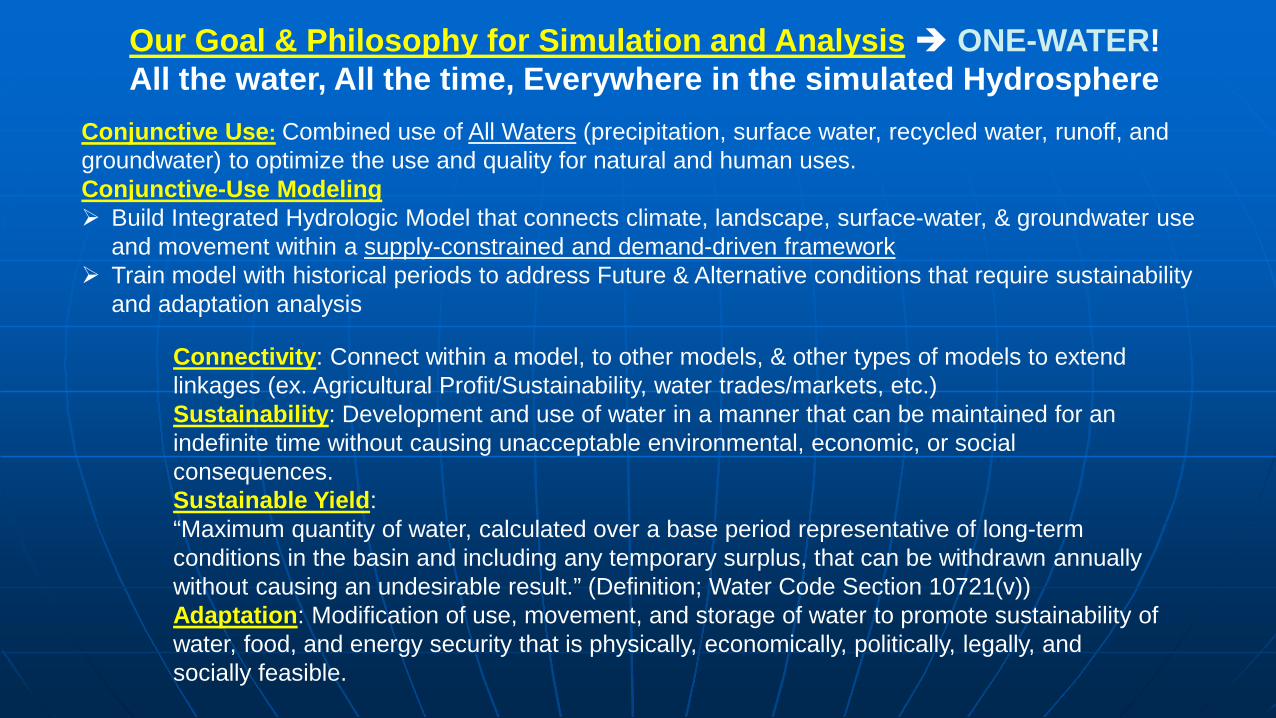
Connectivity: Connect within a model, to other models, & other types of models to extend linkages (ex. Agricultural Profit/Sustainability, water trades/markets, etc.)Sustainability: Development and use of water in a manner that can be maintained for an indefinite time without causing unacceptable environmental, economic, or social consequences.Sustainable Yield: “Maximum quantity of water, calculated over a base period representative of long-term conditions in the basin and including any temporary surplus, that can be withdrawn annually without causing an undesirable result.” (Definition; Water Code Section 10721(v))Adaptation: Modification of use, movement, and storage of water to promote sustainability of water, food, and energy security that is physically, economically, politically, legally, and socially feasible.
Our Goal & Philosophy for Simulation and Analysis ONE-WATER!All the water, All the time, Everywhere in the simulated Hydrosphere
Conjunctive Use: Combined use of All Waters (precipitation, surface water, recycled water, runoff, and groundwater) to optimize the use and quality for natural and human uses.Conjunctive-Use Modeling Build Integrated Hydrologic Model that connects climate, landscape, surface-water, & groundwater use
and movement within a supply-constrained and demand-driven framework Train model with historical periods to address Future & Alternative conditions that require sustainability
and adaptation analysis
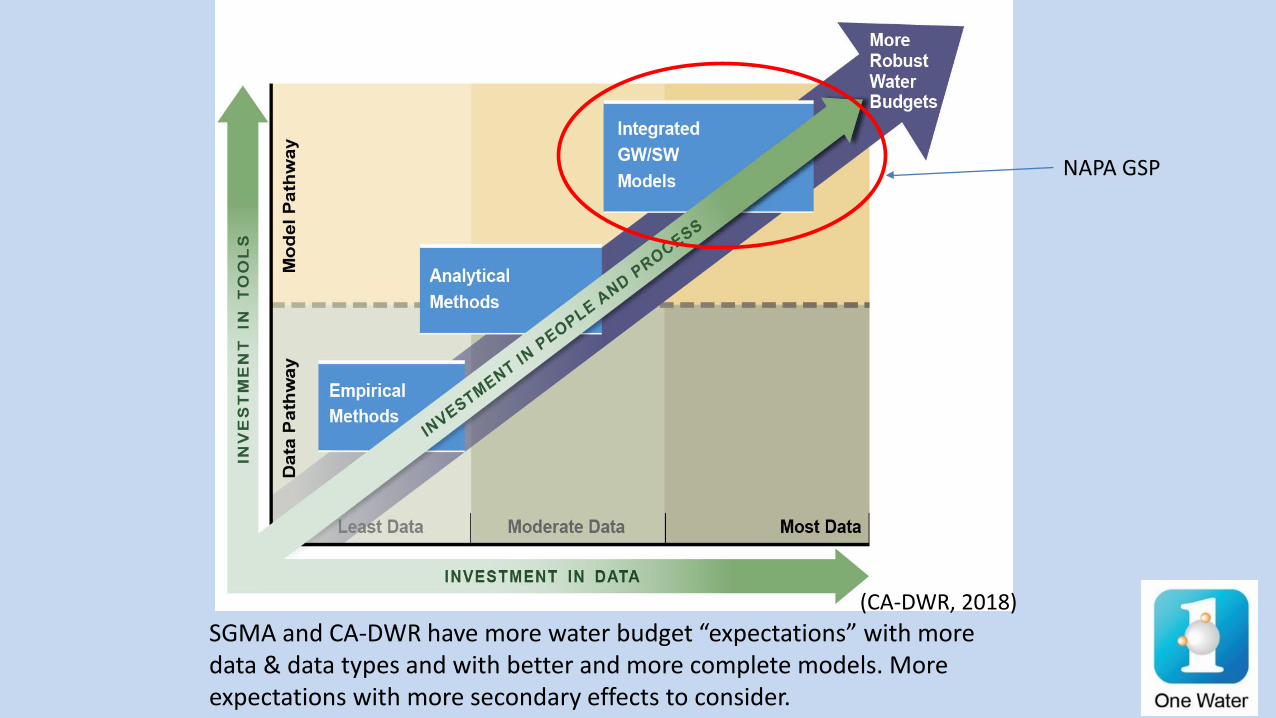
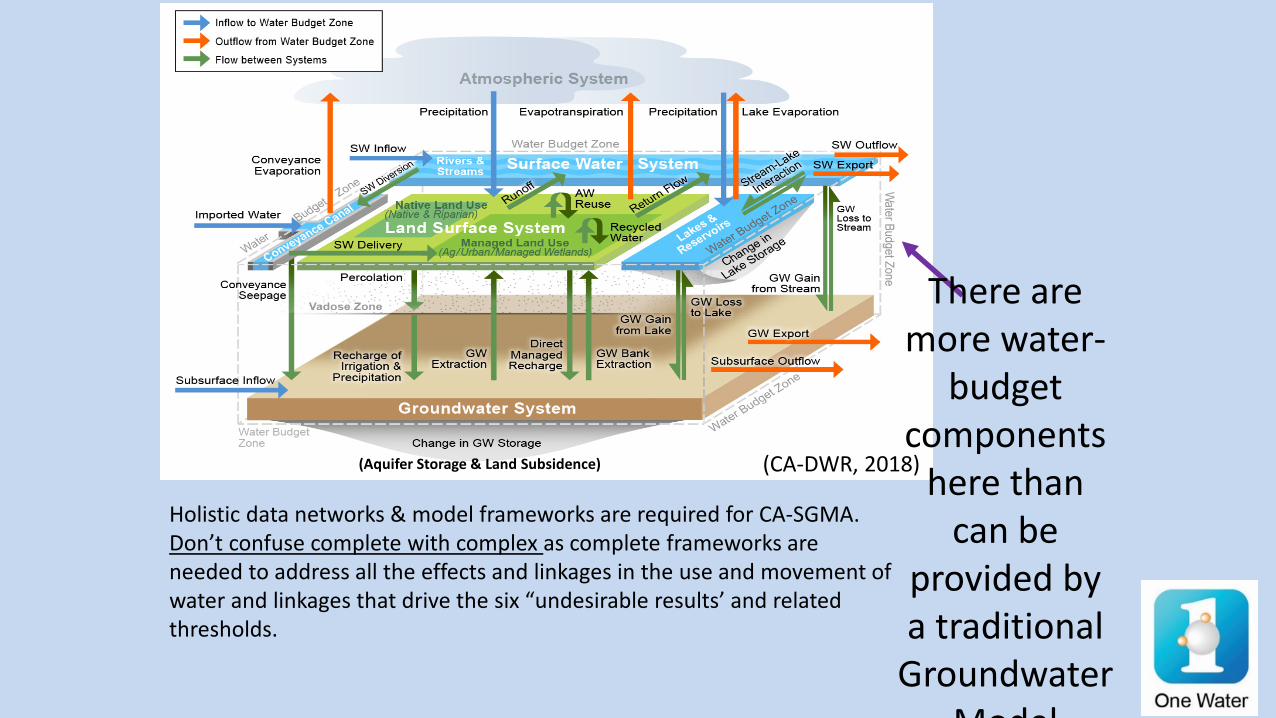
SGMA and CA-DWR have more water budget “expectations” with more data & data types and with better and more complete models. More expectations with more secondary effects to consider.
(CA-DWR, 2018)
NAPA GSP
(Aquifer Storage & Land Subsidence)
There are more water-
budget components
here than can be
provided by a traditional
Groundwater Model
Holistic data networks & model frameworks are required for CA-SGMA. Don’t confuse complete with complex as complete frameworks are needed to address all the effects and linkages in the use and movement of water and linkages that drive the six “undesirable results’ and related thresholds.
(CA-DWR, 2018)

MODFLOW And Its Children
• The MODFLOW-2005 (MF) diverged into multiple versions designed for specific needs. Model divergence created more options but also more limitations.
– Selection of one version meant features of another were not available.
– Most versions are not current and can’t address agriculture supply and demand

MODFLOW-OWHMOne-Water Hydrologic Flow Model
• The One-Water Hydrologic Flow Model, MF-OWHM, is an enhanced fusion of multiple MODFLOW versions to serve as a new integrated hydrologic flow modeling software. Second version now available!!
• Provides historical and future water-flow budgets under different hydrologic and land use regimes as expected by DWR under SGMA
• Over 13 years of experience developing Integrated Hydrologic Models/Codes
• Public Domain free and open-source software as required by SGMA
• Used in biggest Agricultural Areas of CA Central Valley, Salinas, Pajaro, Borrego, San Diego, Cuyama, Paso Robles, Sonoma,
OWHM (version 2) “One-Water”

QgwQineff
QpQet
Qsw
Farm Mass Balance (Farm Budget):
Farm Inflow – Farm Outflows
= Change in Farm Water Storage
Recharge
Runoff
Supply & Demand features of Farm Process within One-WaterMass Balances
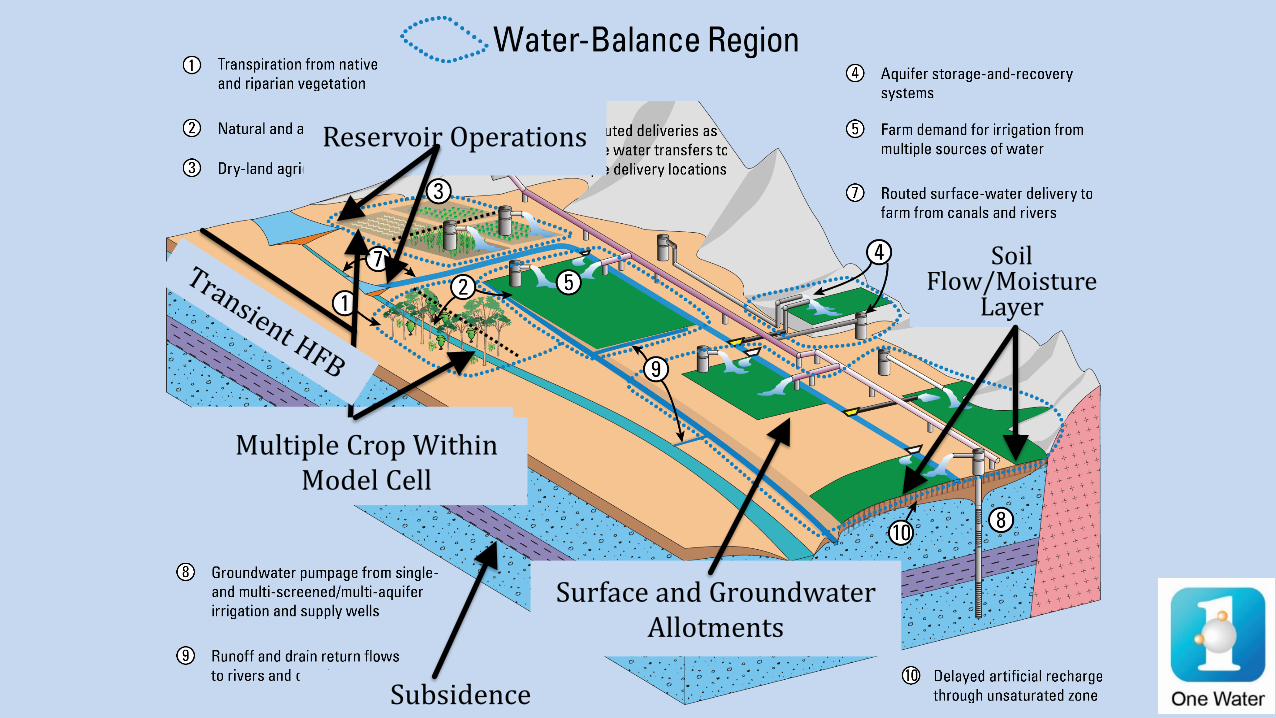
VariableWater Balance Regions
Surface and Groundwater Allotments
Multiple Crop Within Model Cell
Soil Flow/Moisture
Layer
Reservoir Operations
Subsidence
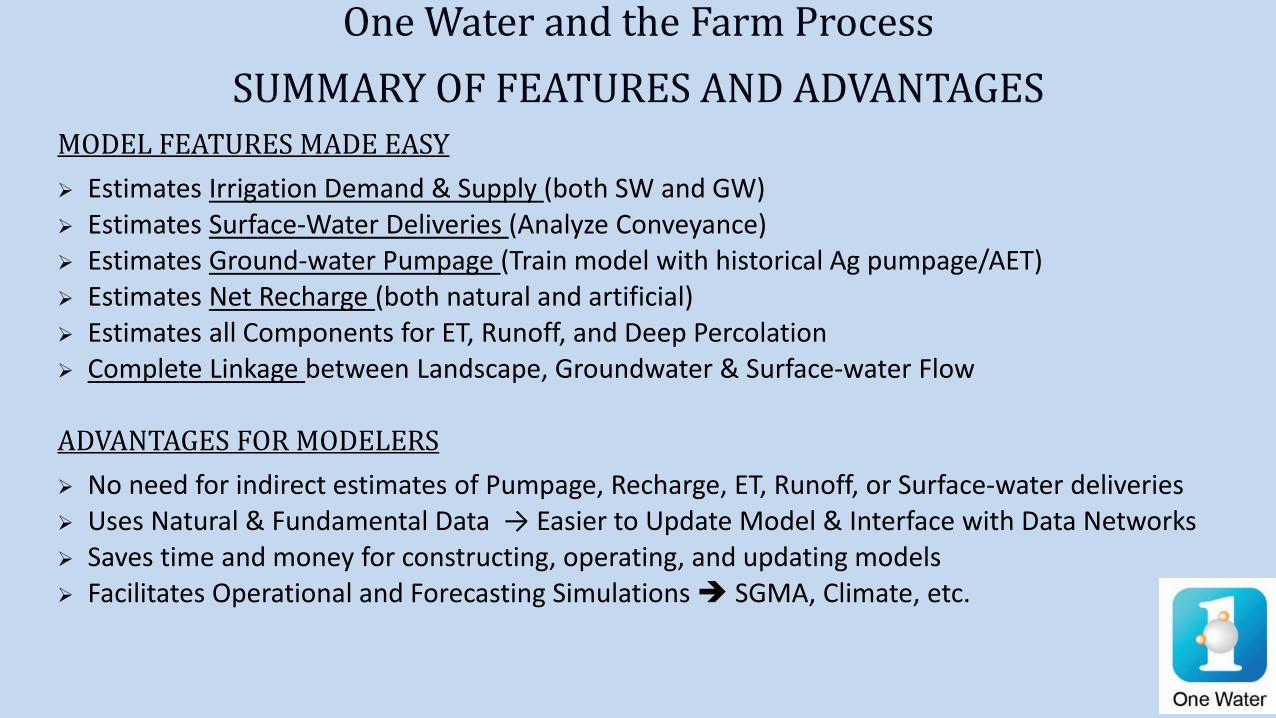
One Water and the Farm Process SUMMARY OF FEATURES AND ADVANTAGES
MODEL FEATURES MADE EASY Estimates Irrigation Demand & Supply (both SW and GW) Estimates Surface-Water Deliveries (Analyze Conveyance) Estimates Ground-water Pumpage (Train model with historical Ag pumpage/AET) Estimates Net Recharge (both natural and artificial) Estimates all Components for ET, Runoff, and Deep Percolation Complete Linkage between Landscape, Groundwater & Surface-water Flow
ADVANTAGES FOR MODELERS No need for indirect estimates of Pumpage, Recharge, ET, Runoff, or Surface-water deliveries Uses Natural & Fundamental Data → Easier to Update Model & Interface with Data Networks Saves time and money for constructing, operating, and updating models Facilitates Operational and Forecasting Simulations SGMA, Climate, etc.
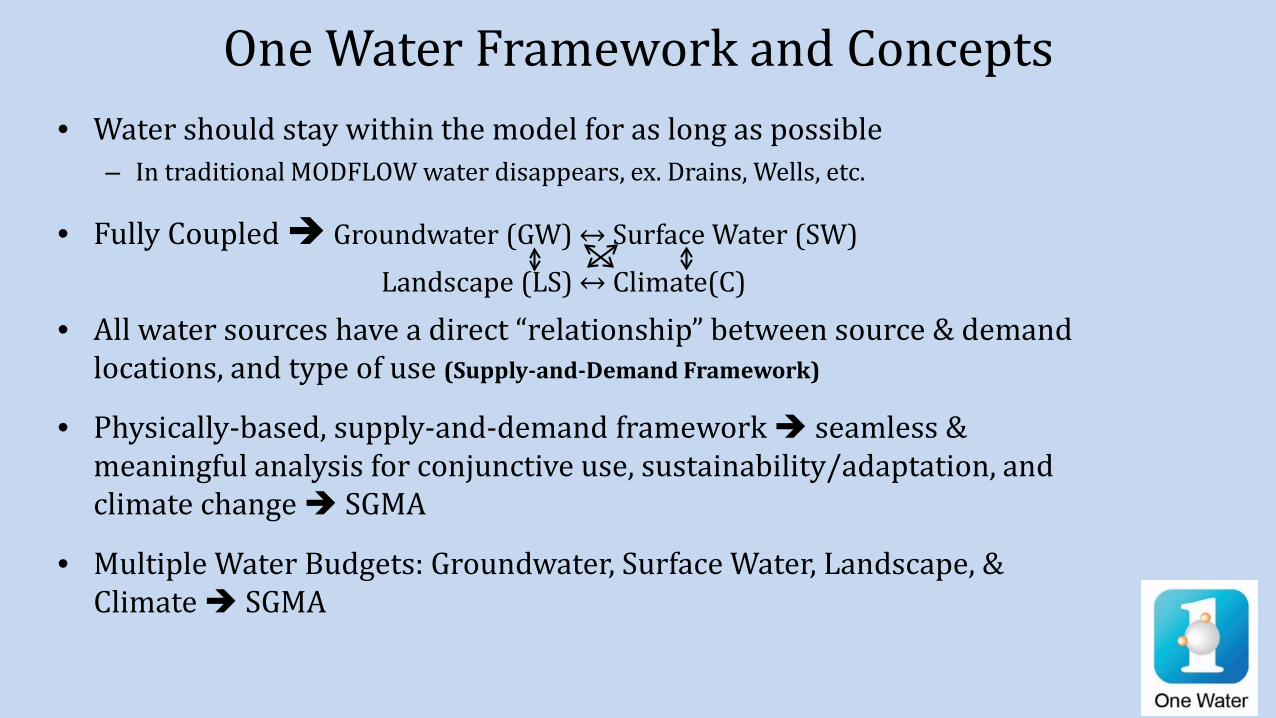
One Water Framework and Concepts • Water should stay within the model for as long as possible
– In traditional MODFLOW water disappears, ex. Drains, Wells, etc.
• Fully Coupled Groundwater (GW) ↔ Surface Water (SW) Landscape (LS) ↔ Climate(C)
• All water sources have a direct “relationship” between source & demand locations, and type of use (Supply-and-Demand Framework)
• Physically-based, supply-and-demand framework seamless & meaningful analysis for conjunctive use, sustainability/adaptation, and climate change SGMA
• Multiple Water Budgets: Groundwater, Surface Water, Landscape, & Climate SGMA
Todays Update1. What is the “One-Water” model?
2. How Can One-Water Support NAPA-GSP for SGMA?
3. Water Budgets and Sustainability for SGMA
4. Undesirable Results and Thresholds
5. Reporting, Maintenance, & Updates

One-Water SGMA Support• Supply-and-Demand Framework and Water Balance subregion
design (Pajaro Example – shown later)• Water Budgets, undesirable results metrics, and thresholds
(Pajaro Example)• Projections of Sustainability and Adaptation (Cuyama Example –
shown later)

Example of Future Analysis of Current Mitigation Projects using One-Water in Pajaro Valley
Used to develop a new Basin Management Plan that includes additional projects to reduce overdraft & increase capture/use of local runoff, recycled water, ASR, & MAR
Dashed Lines are Potential Thresholds Equivalent Fresh-water Head for that aquifer as an indicator of potential seawater intrusion.
Projections of Sustainability and Adaptation
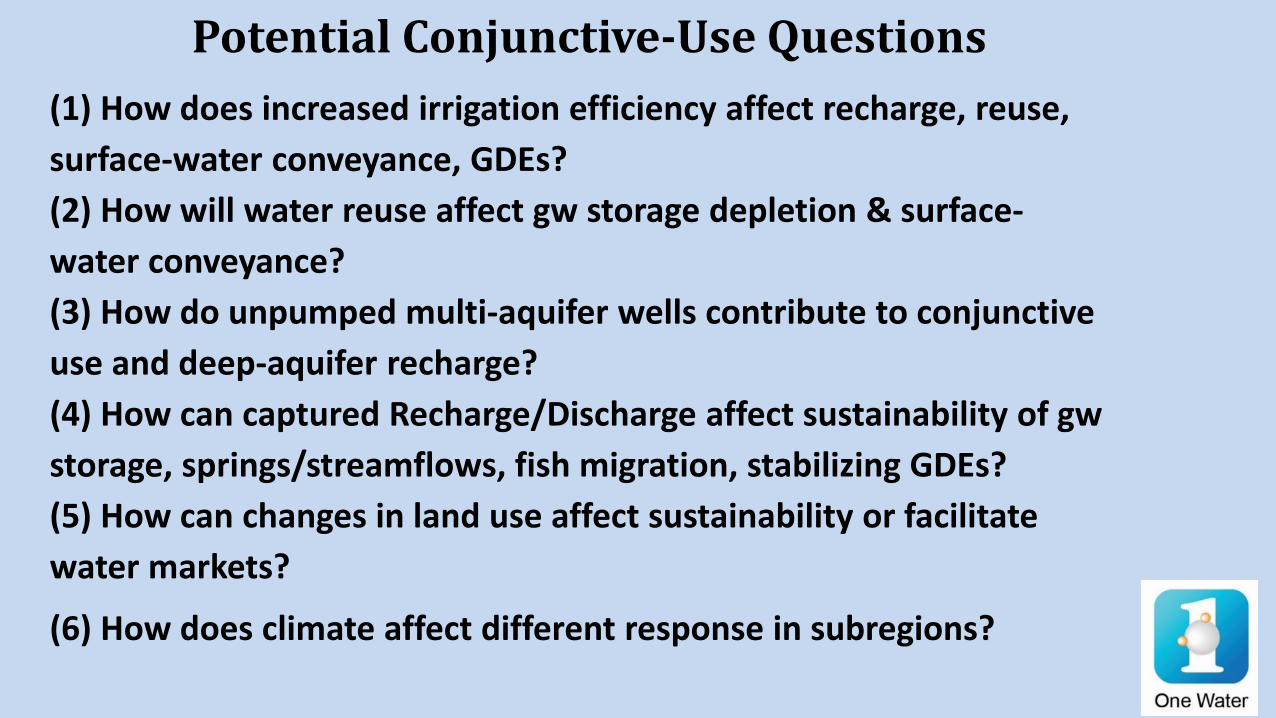
Potential Conjunctive-Use Questions(1) How does increased irrigation efficiency affect recharge, reuse, surface-water conveyance, GDEs?(2) How will water reuse affect gw storage depletion & surface-water conveyance?(3) How do unpumped multi-aquifer wells contribute to conjunctive use and deep-aquifer recharge?(4) How can captured Recharge/Discharge affect sustainability of gwstorage, springs/streamflows, fish migration, stabilizing GDEs? (5) How can changes in land use affect sustainability or facilitate water markets?
(6) How does climate affect different response in subregions?

Todays Update1. What is the “One-Water” model?
2. How Can One-Water Support NAPA- GSP for SGMA?
3. Water Budgets and Sustainability for SGMA
4. Undesirable Results and Thresholds
5. Reporting, Maintenance, & Updates

Model Design/Build Workflow Process
Determine Model Extent(Watershed/Basin/Subregion?)
Determine Water-Balance Subregions & Super Groups (SubWatersheds, /Farms/Political or Jusidictional subregions?) Static or Transient?
Determine Land-Use & Crop Groups (Individual Crops, or Types of Land-Use subregions?)
Build Hydrologic Model Grid in GIS as polygon shape file for the area of interest
Build Geologic Model Grid in GIS as polygon shape file for the area of interest
Major Supply-&-Demand Questions Past & Future
Identify Sources of water and relate them to sources of demand for water
Design sources of water:NoneSurface-WaterGroundwaterNon-Routed Deliveries
Estimate ClimateLand Use (& Attributes)
Estimate Layers tops/bottoms and hydraulic properties of aquifers
Develop Observations of surface flows, gw heads, etc.(Calibration/Thresholds)
Develop Surface-water Networks and Wells with attributes in GIS/spreadsheets
Develop Parameter Estimation Input and Control
1) Design starts with final questions/analysis criteria2) Outreach to Local Stakeholders3) Define Supply and Demand Framework(s)4) Identify/Estimate Components of this framework(MODEL Development: Top Down & Outside In)
Design Build Estimate Input & Observations
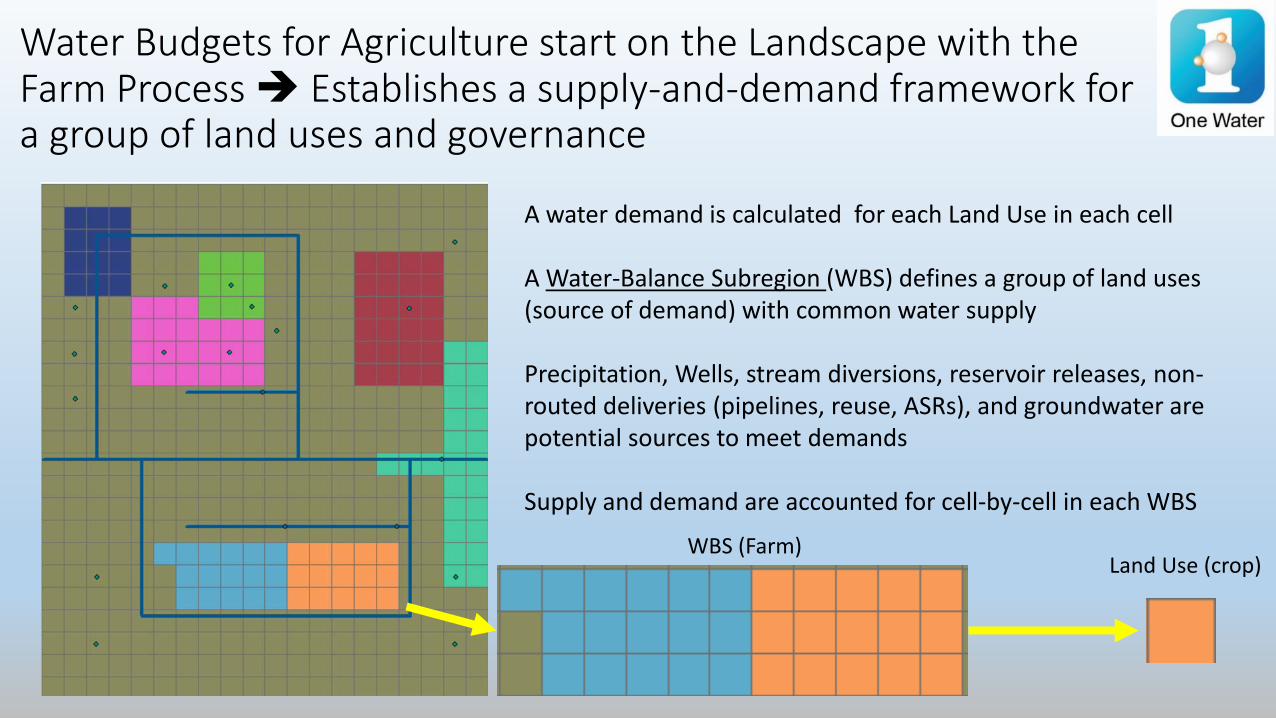
Water Budgets for Agriculture start on the Landscape with the Farm Process Establishes a supply-and-demand framework for a group of land uses and governance
WBS (Farm)Land Use (crop)
A water demand is calculated for each Land Use in each cell
A Water-Balance Subregion (WBS) defines a group of land uses (source of demand) with common water supply
Precipitation, Wells, stream diversions, reservoir releases, non-routed deliveries (pipelines, reuse, ASRs), and groundwater are potential sources to meet demands
Supply and demand are accounted for cell-by-cell in each WBS
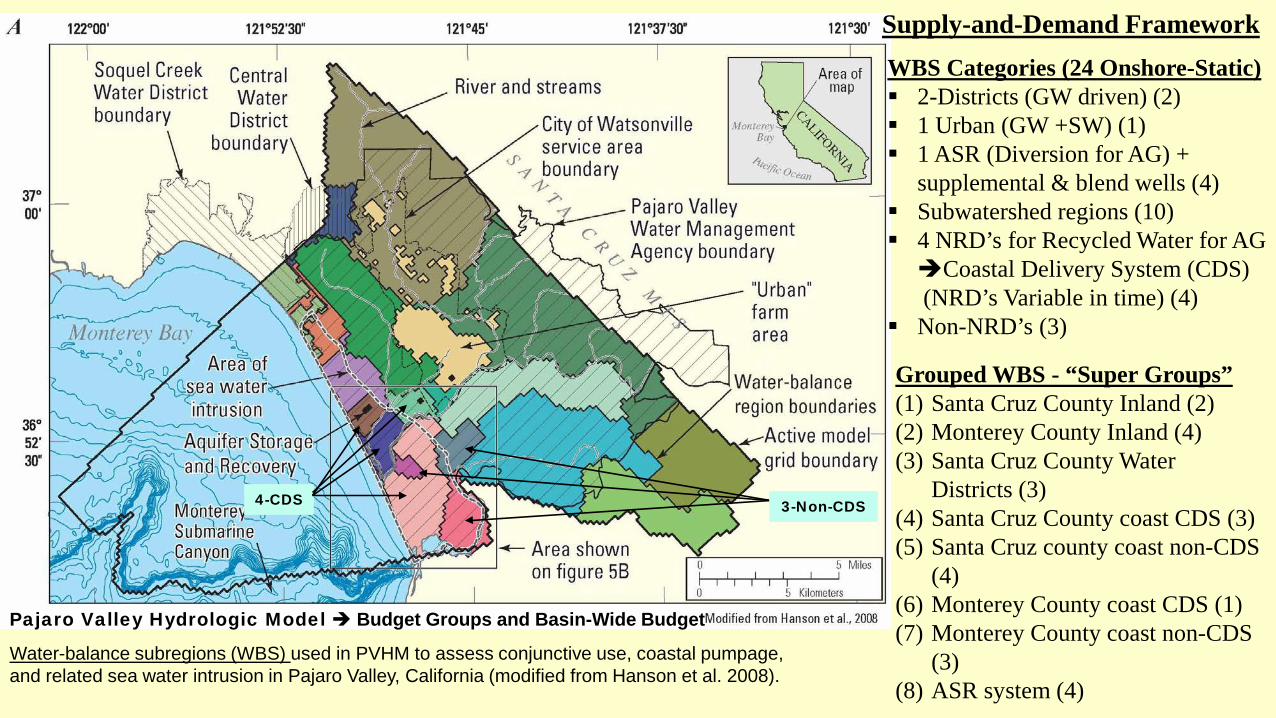
3-Non-CDS4-CDS
Pajaro Valley Hydrologic Model Budget Groups and Basin-Wide Budget
Water-balance subregions (WBS) used in PVHM to assess conjunctive use, coastal pumpage, and related sea water intrusion in Pajaro Valley, California (modified from Hanson et al. 2008).
WBS Categories (24 Onshore-Static) 2-Districts (GW driven) (2) 1 Urban (GW +SW) (1) 1 ASR (Diversion for AG) +
supplemental & blend wells (4) Subwatershed regions (10) 4 NRD’s for Recycled Water for AG Coastal Delivery System (CDS)(NRD’s Variable in time) (4)
Non-NRD’s (3)
Grouped WBS - “Super Groups”(1) Santa Cruz County Inland (2)(2) Monterey County Inland (4)(3) Santa Cruz County Water
Districts (3)(4) Santa Cruz County coast CDS (3)(5) Santa Cruz county coast non-CDS
(4)(6) Monterey County coast CDS (1)(7) Monterey County coast non-CDS
(3)(8) ASR system (4)
Supply-and-Demand Framework

Increased Water Demand and “Hardening of Demand” with more Pecan Orchards (permanent crops)
Increased TFDR and Groundwater use in dry years with less surface-water allocations
PECANS
COTTON
FORAGE CROPS
Lower Rio Grande Supply-and-Demand Budget: TFDR - TOTAL FARM DELIVERY REQUIREMENT (IRRIGATION DEMAND)
TFDR

Example Landscape Budget, Pajaro Valley, CA
Flows into & out of Landscapeshow large portions ofInflow PrecipitationOutflow Runoff
With large amounts of potential runoff (Precipitation, Tile Drain Capture, Excess NRD’s) PVWMA has implemented a Recharge credit program separate from their pump augmentation fee
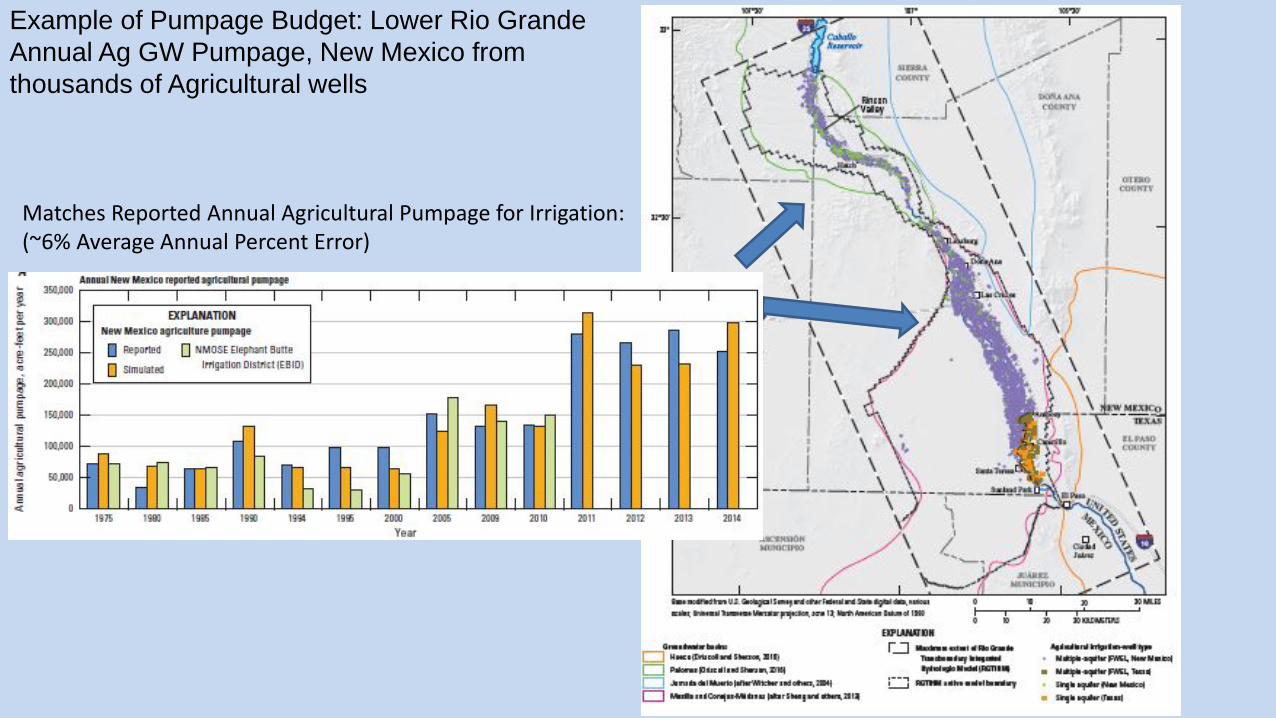
Example of Pumpage Budget: Lower Rio Grande Annual Ag GW Pumpage, New Mexico from thousands of Agricultural wells
Matches Reported Annual Agricultural Pumpage for Irrigation: (~6% Average Annual Percent Error)

Sustainability Analysis Pathways
Sustainability Analysis
Does Not Meets Thresholds
Meets Thresholds
Supply Management
Demand Management
Supply Augmentation
Supply Enhancement
Demand Reduction
Demand Enhancement
Adaptation Analysis
Manage to plan for remaining sustainability Analysis Pathway
Supply Reuse Land-Use Changes

Example of Agricultural Sustainability Projections:Modeled Changes in Projected Groundwater Storage in Cuyama Valley
“Business as Usual” from 2010
“Pumpage = Long-term Annual Average Recharge”
“Cessation of Agriculture in the Main zone”
No Supply or Demand Management: Not
Sustainable Continued Storage Depletion into
Future
Demand Management (Adjudication
Scenario): Overall Sustainable with
Accretion and Depletion in
Subregions into Future
Demand Management (Land-Use Change):
Overall Storage Recovery of about ¼ of
Historical Depletion into Future
Todays Update
1. What is the “One-Water” model?
2. How Can One-Water Support NAPA- GSP for SGMA?
3. Water Budgets and Sustainability for SGMA
4. Undesirable Results and Thresholds
5. Reporting, Maintenance, & Updates

Unexpected Result Seepage in vineyard on right bank of San Joaquin River during high flow releases (4/13/11)
San Joaquin River Restoration Project
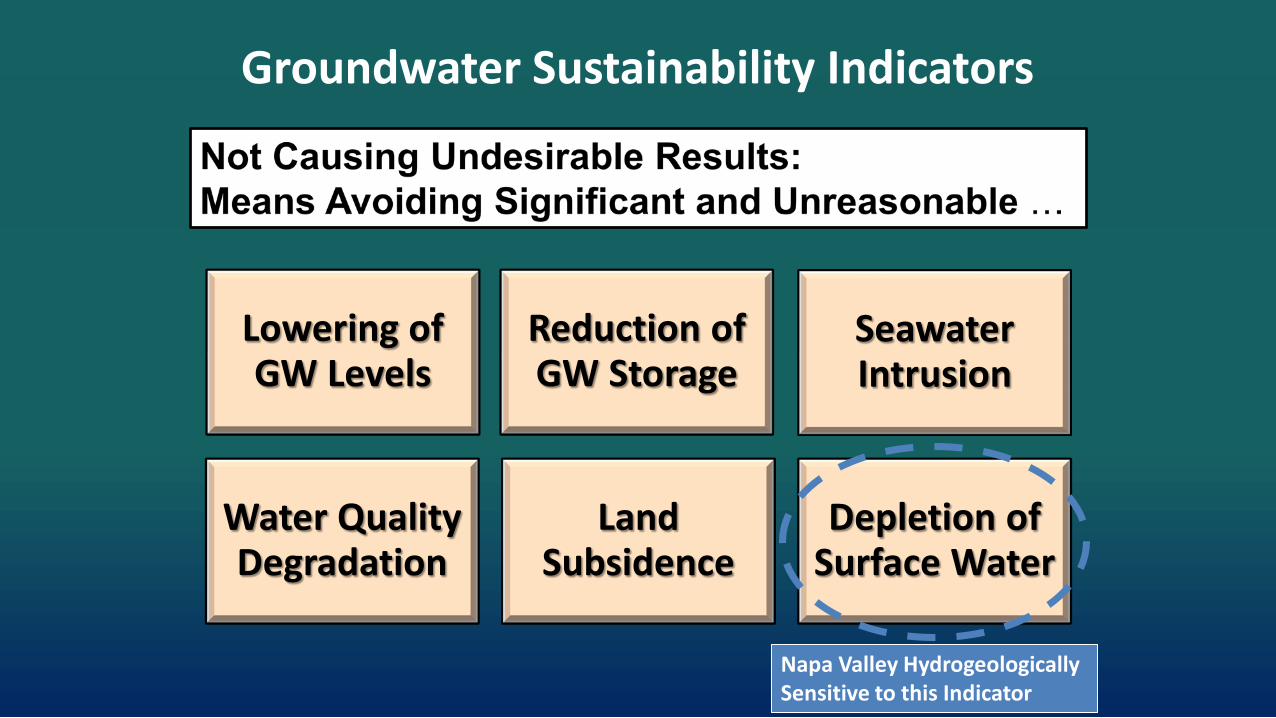
Groundwater Sustainability Indicators
Lowering of GW Levels
Reduction of GW Storage
Seawater Intrusion
Water Quality Degradation
Land Subsidence
Depletion of Surface Water
Napa Valley Hydrogeologically Sensitive to this Indicator

Minimum Thresholds and Measurable Objectives
• Minimum Threshold (MT)“a numeric value for each sustainability indicator used to define undesirable results” (Sec 351)
• Measurable Objective (MO)“specific, quantifiable goals for the maintenance or improvement of specified groundwater conditions” (Section 351)
Measurable objectives and minimum thresholds are established to ensure GW sustainability or improve GW conditions.
MO
MT
(DWR, March 2016)

Lower Rio Grande (NM, TX, MX) -- Beginning in 2003, surface-water shortages (Surface-water drought conditions) have also contributed to increases in
supplemental groundwater use.
Changes in Supply = Changes in Surface-Water Availability
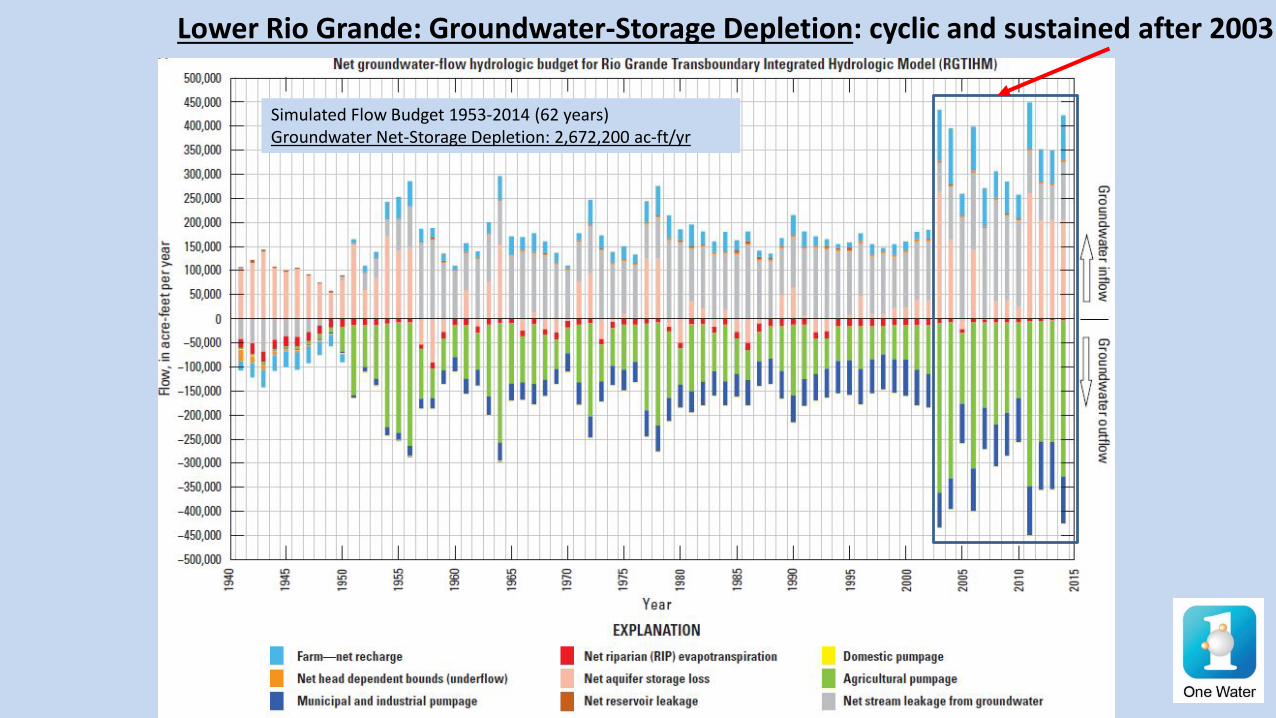
Lower Rio Grande: Groundwater-Storage Depletion: cyclic and sustained after 2003
Simulated Flow Budget 1953-2014 (62 years)Groundwater Net-Storage Depletion: 2,672,200 ac-ft/yr
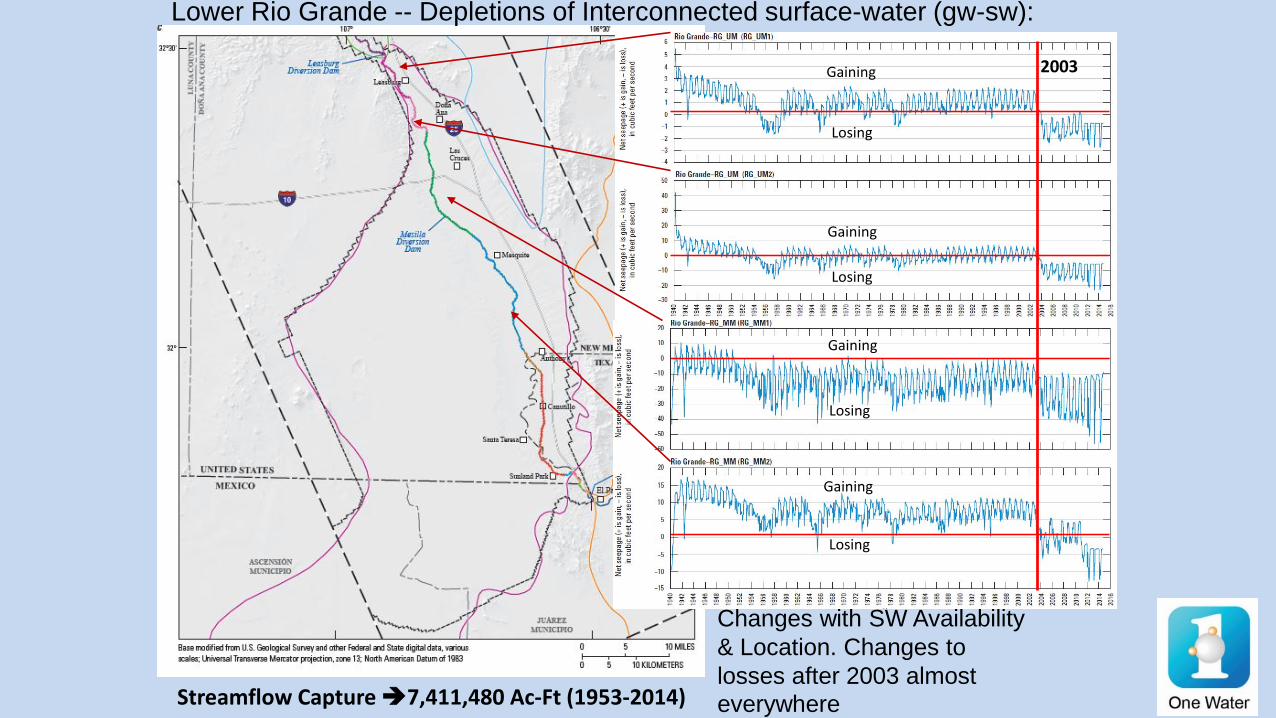
Lower Rio Grande -- Depletions of Interconnected surface-water (gw-sw):
Gaining
Losing
Gaining
Losing
Gaining
Losing
Gaining
Losing
2003
Changes with SW Availability & Location. Changes to losses after 2003 almost everywhereStreamflow Capture 7,411,480 Ac-Ft (1953-2014)
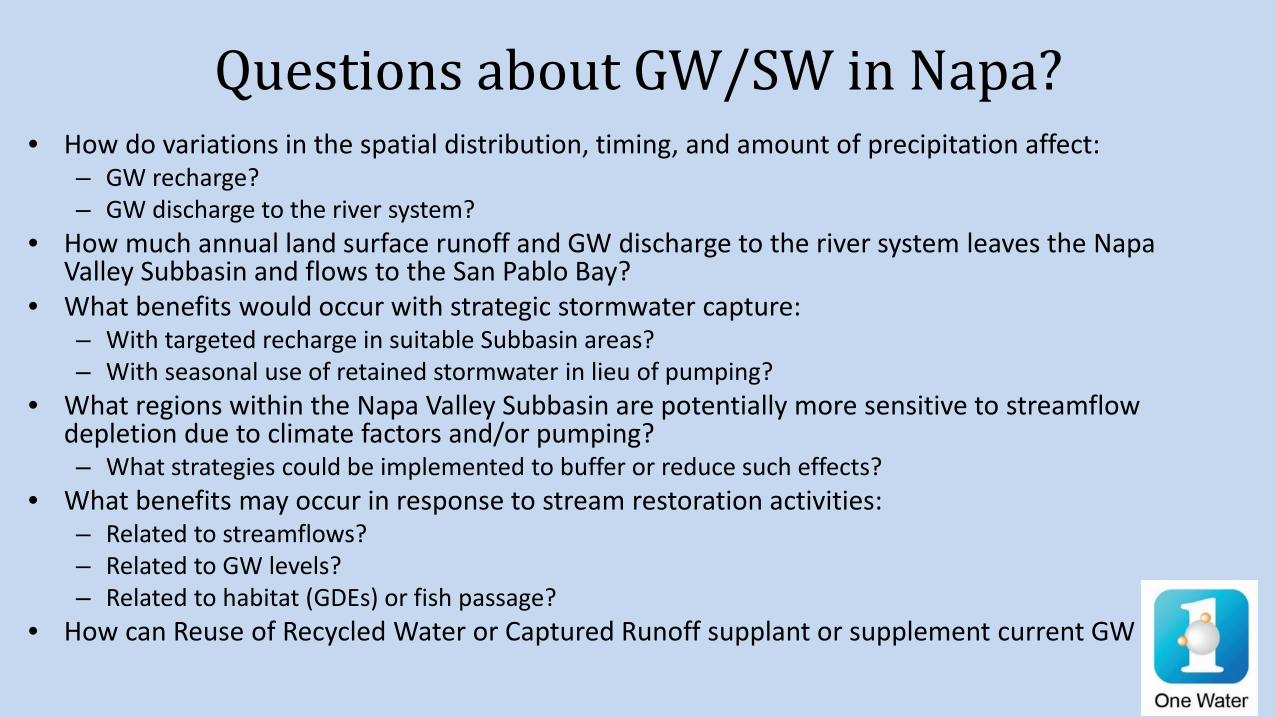
Questions about GW/SW in Napa?• How do variations in the spatial distribution, timing, and amount of precipitation affect:
– GW recharge?– GW discharge to the river system?
• How much annual land surface runoff and GW discharge to the river system leaves the Napa Valley Subbasin and flows to the San Pablo Bay?
• What benefits would occur with strategic stormwater capture:– With targeted recharge in suitable Subbasin areas?– With seasonal use of retained stormwater in lieu of pumping?
• What regions within the Napa Valley Subbasin are potentially more sensitive to streamflow depletion due to climate factors and/or pumping?– What strategies could be implemented to buffer or reduce such effects?
• What benefits may occur in response to stream restoration activities:– Related to streamflows?– Related to GW levels?– Related to habitat (GDEs) or fish passage?
• How can Reuse of Recycled Water or Captured Runoff supplant or supplement current GW use?
Todays Update
1. What is the “One-Water” model?
2. How Can One-Water Support NAPA- GSP for SGMA?
3. Water Budgets and Sustainability for SGMA
4. Undesirable Results and Thresholds
5. Reporting, Maintenance, & Updates
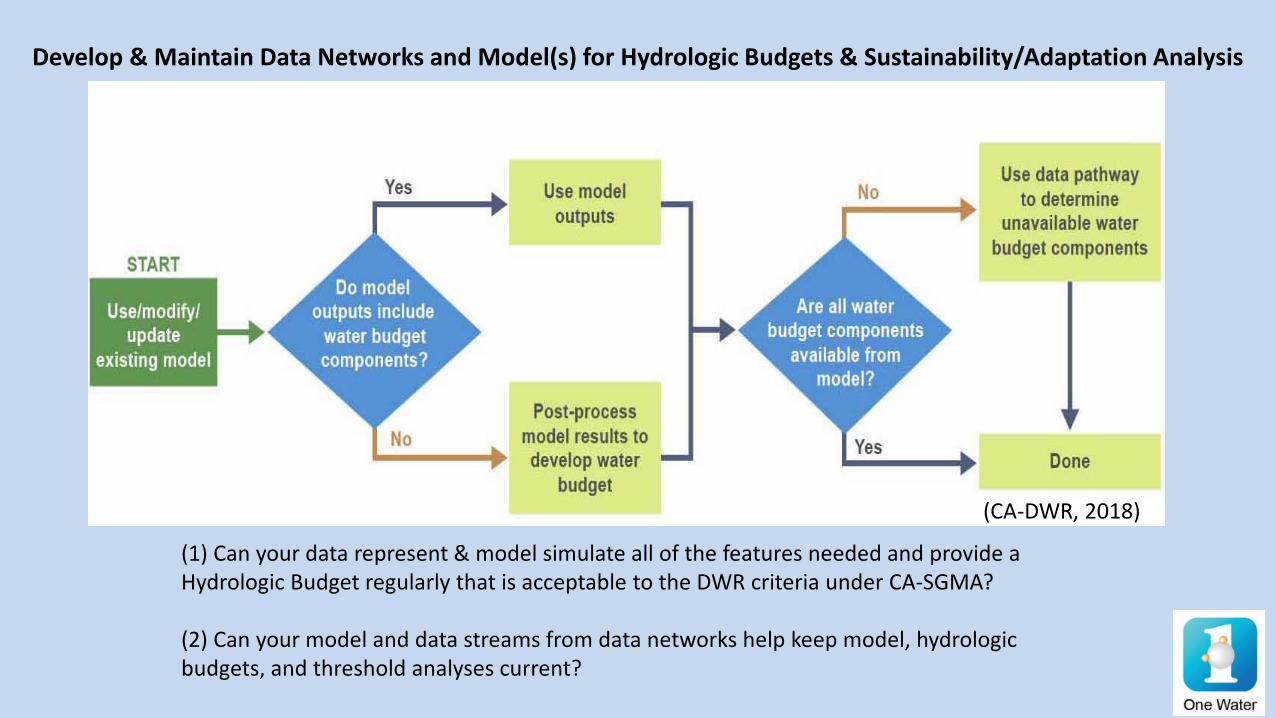
(1) Can your data represent & model simulate all of the features needed and provide a Hydrologic Budget regularly that is acceptable to the DWR criteria under CA-SGMA?
(2) Can your model and data streams from data networks help keep model, hydrologic budgets, and threshold analyses current?
Develop & Maintain Data Networks and Model(s) for Hydrologic Budgets & Sustainability/Adaptation Analysis
(CA-DWR, 2018)
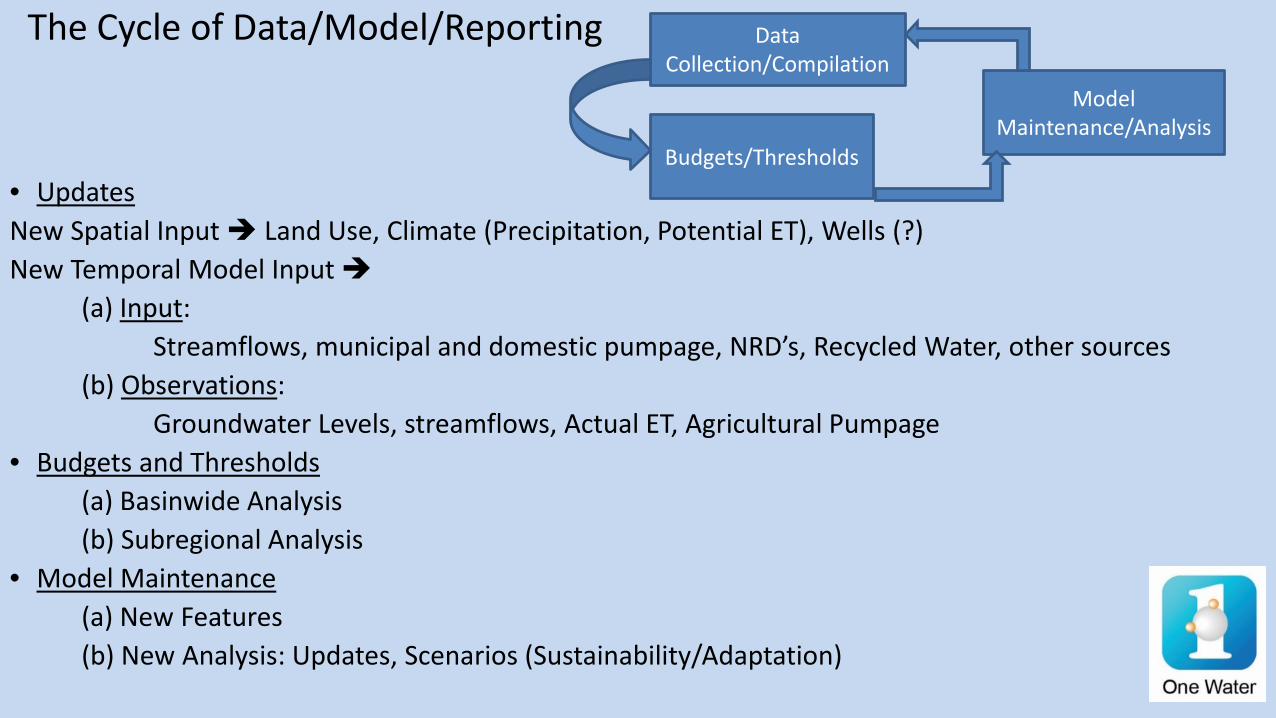
The Cycle of Data/Model/Reporting
• UpdatesNew Spatial Input Land Use, Climate (Precipitation, Potential ET), Wells (?)New Temporal Model Input
(a) Input: Streamflows, municipal and domestic pumpage, NRD’s, Recycled Water, other sources
(b) Observations: Groundwater Levels, streamflows, Actual ET, Agricultural Pumpage
• Budgets and Thresholds(a) Basinwide Analysis(b) Subregional Analysis
• Model Maintenance(a) New Features(b) New Analysis: Updates, Scenarios (Sustainability/Adaptation)
Data Collection/Compilation
Budgets/Thresholds
Model Maintenance/Analysis
THE END - THANKS !
QUESTIONS & DISCUSSION ?
GROUNDWATER SUSTAINABILITY = VINEYARDS FOREVER ?Napa Valley, California

Updated Spatial Water Demand Datasets
Production well locations (known and inferred locations)
Merging SWRCB and CADFW diversion location Info
Public water system production and delivery data
Expanded Spatial Geologic Datasets
Alluvium thickness and geologic characteristics in southern Napa Valley
Next Steps for the Napa Valley Hydrologic Model
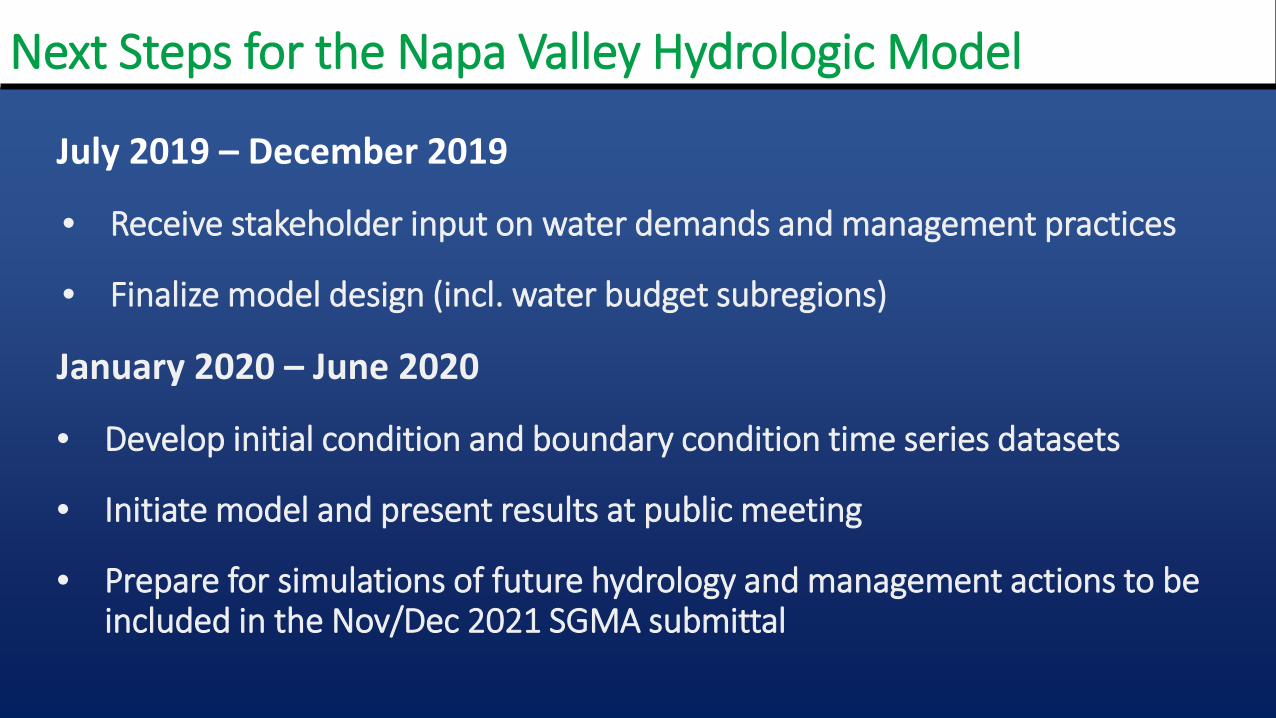
July 2019 – December 2019
• Receive stakeholder input on water demands and management practices
• Finalize model design (incl. water budget subregions)
January 2020 – June 2020
• Develop initial condition and boundary condition time series datasets
• Initiate model and present results at public meeting
• Prepare for simulations of future hydrology and management actions to be included in the Nov/Dec 2021 SGMA submittal
Next Steps for the Napa Valley Hydrologic Model