Nanotechnology: A Policy Primer
29
Nanotechnology: A Policy Primer John F. Sargent Jr. Specialist in Science and Technology Policy September 15, 2016 Congressional Research Service 7-5700 www.crs.gov RL34511
Transcript of Nanotechnology: A Policy Primer
Nanotechnology: A Policy Primer
John F. Sargent Jr.
Specialist in Science and Technology Policy
September 15, 2016
Congressional Research Service
7-5700
www.crs.gov
RL34511
Nanotechnology: A Policy Primer
Congressional Research Service
Summary Nanoscale science, engineering, and technology—commonly referred to collectively as
“nanotechnology”—is believed by many to offer extraordinary economic and societal benefits.
Congress has demonstrated continuing support for nanotechnology and has directed its attention
particularly to three topics that may affect the realization of this hoped for potential: federal
research and development (R&D) in nanotechnology; U.S. competitiveness in the field; and
environmental, health, and safety (EHS) concerns. This report provides an overview of these
topics and two others: nanomanufacturing and public attitudes toward nanotechnology.
The development of nanotechnology has been fostered by significant and sustained public
investments in R&D. Nanotechnology R&D is directed toward the understanding and control of
matter at dimensions of roughly 1 to 100 nanometers. (One nanometer is equal to a billionth of a
meter. A human hair is 80,000 to 100,000 nanometers wide.) At this size, the properties of matter
can differ in fundamental and potentially useful ways from the properties both of individual atoms
and molecules, on the one hand, and of bulk matter, on the other. Since the launch of the National
Nanotechnology Initiative (NNI) in 2000, Congress has appropriated approximately $21.8 billion
for nanotechnology R&D through FY2016. President Obama has requested $1.443 billion in NNI
funding for FY2017, little changed from the FY2016 level of $1.435 billion, but down $478.2
million (25.0%) from its regular appropriation peak of $1.913 billion in FY2010.
According to one estimate, worldwide public sector investment in nanotechnology R&D in 2014
was $7.9 billion and private sector investment was an estimated $9.8 billion. The United States is
estimated to account for approximately one-third of total global nanotechnology R&D funding.
Data on economic outputs used to assess competitiveness in mature technologies and industries,
such as revenues and market share, are also not broadly available for nanotechnology. As an
alternative, data on inputs (e.g., R&D expenditures) and non-economic outputs (e.g., scientific
papers or patents) may provide insight into the current U.S. position and serve as bellwethers of
future competitiveness. By these criteria, the United States appears to be the overall global leader
in nanotechnology, though some believe the U.S. lead may not be as large as it was for previous
emerging technologies. In recent years, China and the countries of the European Union have
surpassed the United States in the publication of nanotechnology papers.
Some research has raised concerns about the safety of nanoscale materials. There is general
agreement that more information on EHS implications is needed to assess and manage risks to the
public and the environment; and to create a regulatory environment that fosters prudent
investment in nanotechnology-related innovation. Nanomanufacturing—the bridge between basic
nanoscience and nanotechnology products—may require the development of new technologies,
tools, instruments, measurement science, and standards to enable safe, effective, and affordable
commercial-scale production of nanotechnology products. Public attitudes may also affect the
environment for R&D, regulation, and market acceptance of nanotechnology products.
In 2003, Congress enacted the 21st Century Nanotechnology Research and Development Act (P.L.
108-153), providing a legislative foundation for some of the activities of the NNI, addressing
concerns, establishing programs, assigning agency responsibilities, and setting authorized funding
levels for some agencies. Certain provisions of this act authorizing specific appropriations have
expired; other provisions have not expired. In the 114th Congress, Subtitle B of the America
Competes Reauthorization Act of 2015 (H.R. 1898) would reauthorize the NNI. The American
Innovation and Competitiveness Act (S. 3084) would modify certain NNI statutory reporting
requirements. Efforts to enact comprehensive NNI reauthorization legislation in the 110th
Congress, 111th Congress, and 113
th Congress were unsuccessful.
Nanotechnology: A Policy Primer
Congressional Research Service
The products that emerge from these efforts may bring significant economic and social benefits to
the United States and to the world; however, substantial research, development, and innovation-
related hurdles remain before many of these benefits might be realized. Congress may play an
active role in addressing some or all of these hurdles. The issues Congress may opt to consider
include budget authorization levels for the covered agencies; R&D funding levels, priorities, and
balance across the program component areas; administration and management of the NNI;
translation of research results and early-stage technology into commercially viable applications;
environmental, health, and safety issues; ethical, legal, and societal implications; education and
training for the nanotechnology workforce; metrology (the science of measurement), standards,
and nomenclature; public understanding; and international dimensions.
Nanotechnology: A Policy Primer
Congressional Research Service
Contents
Overview ......................................................................................................................................... 1
What Is Nanotechnology? ............................................................................................................... 2
The National Nanotechnology Initiative ......................................................................................... 6
Structure .................................................................................................................................... 7 Funding ..................................................................................................................................... 8
Funding by Agency ............................................................................................................. 8 Funding by Program Component Area ............................................................................. 10
Selected Issues ................................................................................................................................ 11
U.S. Competitiveness ............................................................................................................... 11 Global Funding ................................................................................................................. 13 Scientific Papers ............................................................................................................... 14 Patents ............................................................................................................................... 15
Environmental, Health, and Safety Implications..................................................................... 18 Nanomanufacturing ................................................................................................................. 20 Public Attitudes and Understanding ........................................................................................ 22
Concluding Observations .............................................................................................................. 23
Source: NSET Subcommittee, NSTC, EOP, The National Technology Initiative:
Supplement to the President’s FY2017 Budget, March 2016,
http://www.nano.gov/sites/default/files/pub_resource/nni_fy17_budget_supplement.pdfError! Bookmark not defined.
Figures
Figure 1. NNI Funding in Current Dollars, FY2001-FY2017 ......................................................... 8
Figure 2. Number of Published Nanotechnology Papers for Selected Countries .......................... 15
Tables
Table 1. NNI Funding by Agency, FY2001-FY2017 ...................................................................... 9
Table 2. Funding by Program Component Area, FY2013-FY2017 (Request) ............................... 11
Table 3. U.S. Patent and Trademark Office Nanoscale Science and Engineering Patents
Awarded, Top 20 Countries, 1991-2012 ..................................................................................... 17
Appendixes
Appendix. Members of the NSET Subcommittee ......................................................................... 24
Contacts
Author Contact Information .......................................................................................................... 25
Nanotechnology: A Policy Primer
Congressional Research Service 1
Overview Congress continues to demonstrate interest in and support for nanotechnology due to what many
believe is its extraordinary potential for delivering economic growth, high-wage jobs, and other
societal benefits to the nation. To date, Congress has directed its attention particularly to three
topics that may affect the United States’ realization of this hoped for potential: federal research
and development (R&D) investments under the National Nanotechnology Initiative (NNI); U.S.
international competitiveness in nanotechnology; and environmental, health, and safety (EHS)
concerns. This report provides a brief overview of these topics and two others of interest to
Congress: nanomanufacturing and public attitudes toward, and understanding of,
nanotechnology.1
Nanotechnology R&D is directed toward the understanding and control of matter at dimensions
of roughly 1 to 100 nanometers.2 At this size, the physical, chemical, and biological properties of
materials can differ in fundamental and potentially useful ways from both the properties of
individual atoms and molecules, on the one hand, and bulk matter, on the other hand.
In 2000, President Clinton launched the NNI to coordinate federal R&D efforts and promote U.S.
competitiveness in nanotechnology. Congress first supported the NNI in FY2001 and provided
increased regular appropriations for nanotechnology R&D for each year through FY2010.3 From
FY2010 to FY2016, however, overall NNI funding has declined by $478 million (25.0%); during
the same period, overall federal R&D funding fell by less than 1%. President Obama’s proposed
funding of $1.443 billion for nanotechnology R&D for FY2017 is little changed from the FY2016
level.
In 2003, Congress enacted the 21st Century Nanotechnology Research and Development Act (P.L.
108-153). The act provided a statutory foundation for the NNI, established programs, assigned
agency responsibilities, and authorized agency funding levels for FY2005 through FY2008.
Though no funding has been explicitly authorized for the NNI beyond FY2008, Congress has
continued to appropriate funds to agencies for nanotechnology R&D, and the executive branch
continues to operate and report on the NNI, as coordinated by the Nanoscale Science,
Engineering, and Technology (NSET) subcommittee of the National Science and Technology
Council (NSTC).
Federal R&D investments are focused on advancing understanding of fundamental nanoscale
phenomena and on developing nanomaterials, nanoscale devices and systems, instrumentation,
standards, measurement science, and the tools and processes needed for nanomanufacturing. NNI
appropriations also fund the construction and operation of major research facilities and the
acquisition of instrumentation. The NNI also supports research directed at identifying and
managing potential environmental, health, and safety impacts of nanotechnology, as well as its
ethical, legal, and societal implications.
1 For additional analysis of these issues, see CRS Report RL34401, The National Nanotechnology Initiative: Overview,
Reauthorization, and Appropriations Issues; CRS Report RL34493, Nanotechnology and U.S. Competitiveness: Issues
and Options; and CRS Report RL34614, Nanotechnology and Environmental, Health, and Safety: Issues for
Consideration, all by John F. Sargent; and CRS Report RL34332, Engineered Nanoscale Materials and Derivative
Products: Regulatory Challenges, by Linda-Jo Schierow. 2 One nanometer is equal to a billionth of a meter. A human hair is 80,000 to 100,000 nanometers wide. 3 Funding under the American Recovery and Reinvestment Act of 2009 (P.L. 111-5) provided, among other things, a
one-year boost in NNI funding, bringing total funding to $2.213 billion in FY2009.
Nanotechnology: A Policy Primer
Congressional Research Service 2
What Is Nanotechnology? Most current applications of nanotechnology are evolutionary in nature, offering incremental
improvements to existing products and generally modest economic and societal benefits. For
example, nanotechnology has been used in display screens to improve picture quality, color, and
brightness, provide wider viewing angles, reduce power consumption and extend product lives; in
automobile bumpers, cargo beds, and step-assists to reduce weight, increase resistance to dents
and scratches, and eliminate rust; in clothes to increase resistance to staining, wrinkling, and
bacterial growth and to provide lighter-weight body armor; and in sporting goods, such as
baseball bats and golf clubs, to improve performance.4
Nanotechnology plays a central role in some current applications with substantial economic
value. For example, nanotechnology is a fundamental enabling technology in nearly all
microchips and is fundamental to improvements in chip speed, size, weight, and energy use.
Similarly, nanotechnology has substantially increased the storage density of non-volatile flash
memory and computer hard drives.
In the longer term, proponents of nanotechnology believe it may deliver revolutionary advances
with profound economic and societal implications. The applications they discuss involve various
degrees of speculation and varying time-frames. The examples below suggest a few of the areas
where revolutionary advances may emerge, and for which early R&D efforts may provide
insights into how such advances might be achieved.
Detection and treatment of diseases. A wide range of nanotechnology
applications are being developed to detect and treat diseases:
Cancer. Current nanotechnology disease detection efforts include the
development of sensors that can identify biomarkers—such as altered genes,5
receptor proteins that are indicative of newly-developing blood vessels
associated with early tumor development,6 and prostate specific antigens
(PSA)7—that may provide an early indicator of cancer.
8 Some of these
approaches are currently in clinical trials or have been approved for use by
the Food and Drug Administration.9 One approach uses carbon nanotubes
and nanowires to identify the unique molecular signals of cancer biomarkers.
Another approach uses nanoscale cantilevers—resembling a row of diving
boards—treated with molecules that bind only with cancer biomarkers. When
these molecules bind, the additional weight alters the resonant frequency of
the cantilevers indicating the presence and concentration of these biomarkers.
4 National Nanotechnology Initiative, “Benefits and Applications,” http://www.nano.gov/you/nanotechnology-benefits,
last accessed on August 5, 2016. 5 See, for example, National Institutes of Health, U.S. National Library of Medicine website, “Multiplexed
Fluorescence Imaging of Tumor Biomarkers in Gene Expression and Protein Levels for Personalized and Predictive
Medicine,” Mark Q. Smith et al., March 12, 2013, http://www.ncbi.nlm.nih.gov/pmc/articles/PMC3594694/, last
accessed on August 5, 2016. 6 National Cancer Institute, “Nanotechnology in Clinical Trials,” http://nano.cancer.gov/learn/now/clinical-trials.asp,
last accessed on August 5, 2016. 7 Ibid. 8 National Institutes of Health, U.S. National Library of Medicine, “Biomarkers in Cancer Screening, Research and
Detection: Present and Future: A Review,” S. Kumar et al., September-October 2006, http://www.ncbi.nlm.nih.gov/
pubmed/16966157, last accessed on August 5, 2016. 9 National Cancer Institute, “Nanotechnology in Clinical Trials.”
Nanotechnology: A Policy Primer
Congressional Research Service 3
Nanotechnology also holds promise for showing the presence, location,
and/or contours of cancer, cardiovascular disease, or neurological disease.
Current R&D efforts employ metallic, magnetic, and polymeric nanoparticles
with strong imaging characteristics attached to an antibody or other agent
that binds selectively with targeted cells. The imaging results can be used to
guide surgical procedures and to monitor the effectiveness of non-surgical
therapies in killing the disease or slowing its growth. Nanotechnology may
also offer new cancer treatment approaches. For example, researchers have
developed a chemically engineered adenovirus nanoparticle to deliver a
molecule that stimulates the immune system10
and a nanoparticle that safely
shuts down a key enzyme in cancer cells.11
Another approach employs
nanoshells with a core of silica and an outer metallic shell that can be
engineered to concentrate at cancer lesion sites. Once at the sites, a harmless
energy source (such as near-infrared light) can be used to cause the
nanoshells to heat, killing the cancer cells they are attached to.12
Yet another
treatment uses a dual cancer-killing approach. A gold nanoshell containing a
chemotherapy drug attaches itself to a cancer cell. The shell is then heated
using a near-infrared light source, killing the cancer cells in the vicinity while
also rupturing the shell, releasing the chemotherapy drug inside the tumor.13
Another approach would employ a nanoparticle to carry three or more
different drugs and release them “in response to three distinct triggering
mechanisms.”14
Ebola. In February 2015, amid the Ebola outbreak in West Africa that began
in 2014, the Food and Drug Administration provided emergency
authorization of a nanotechnology-enabled antigen test for the detection of
Ebola viruses.
Influenza. Medical researchers at the National Institutes for Health are using
nanotechnology in the development of a molecule they intend to serve as a
universal influenza vaccine that “stimulates the production of antibodies to
fight against the ever-changing flu virus.”15
Diabetes. Diabetes is the target of a nano-enabled skin patch that painlessly
delivers insulin using an array of microneedles, each of which contains more
than 100 million vesicles that release insulin in response to the detection of
high glucose levels.16
10 National Cancer Institute, “Nanotechnology in Clinical Trials.” 11 Ibid. 12 National Cancer Institute, “Nanotechnology Animations: Nanoshells,” http://nano.cancer.gov/learn/understanding/
nanotech_nanoshells.asp, last accessed on August 5, 2016. 13 Lu Wanga, Yuanyuan Yuana, and Shudong Lin, "Photothermo-chemotherapy of Cancer Employing Drug Leakage-
free Gold Nanoshells," Biomaterials, vol. 8, February 2016, pp. 40-49, last accessed on August 4, 2016. 14 Massachusetts Institute of Technology, MIT News, “Targeting Cancer with a Triple Threat,” April 15, 2014,
https://newsoffice.mit.edu/2014/nanoparticles-can-deliver-three-cancer-drugs-at-once-0415, last accessed on August 5,
2016. 15 Nanoscale Science and Engineering Subcommittee, National Science and Technology Council, Executive Office of
the President, The National Nanotechnology Initiative: Supplement to the President’s FY2017 Budget, March 2016. 16 Jicheng Yu, Yuqi Zhang, and Yanqi Ye, “Microneedle-Array Patches Loaded with Hypoxia-Sensitive Vesicles
Provide Fast Glucose-Responsive Insulin Delivery,” Proceedings of the National Academy of Sciences of the United
States of America, vol. 112, no. 27, July 7, 2015, pp. 8260-8265.
Nanotechnology: A Policy Primer
Congressional Research Service 4
Renewable energy. A number of different nanotechnology applications may
deliver important advances in renewable energy. One of the NNI’s Signature
Initiatives17
—Nanotechnology for Solar Energy Collection and Conversion—
seeks to improve photovoltaic solar electricity generation, solar thermal energy
generation and conversion, and solar-to-fuel conversions. The National
Renewable Energy Laboratory has developed a nanoparticle etching process that
creates a texture on photovoltaic cells that gives a black appearance which can
better absorb the sun’s energy. These “black silicon” solar cells set a world record
(18.2%) for energy conversion efficiency. An application developed to improve
solar thermal energy conversion efficiency uses a low-cost, scalable process to
produce high-performance nanostructured coatings that enable thermal
conversion efficiencies of more than 90% and increases the temperature range for
heat-transfer fluids to more than 1200° Fahrenheit. In addition, bio-inspired
applications seek to use nanomaterials to produce fuels or feedstocks for
high-value-added chemical products directly from sunlight.18
Nanoscale
semiconductor catalysts and additives show promise for improving the
production of hydrogen from water using sunlight. The optical properties of these
nanoscale catalysts allow the process to use a wider spectrum of sunlight.
Similarly, nanostructured photovoltaic devices (e.g., solar cells) may improve the
efficiency of converting sunlight into electricity by using a wider spectrum of
sunlight.19
Improved hydrogen storage, a key challenge in fuel cell applications,
may be achieved by tapping the chemical properties and large surface area of
certain nanostructured materials. Nanotechnology offers the potential for
improvements in energy storage, a key enabling technology for renewable
energy, with at least one current prototype exceeding the energy storage of
standard batteries by 40%.20
Water treatment. Nanotechnology approaches—such as nanosorbents,
nanocatalysts, bioactive nanoparticles, nanostructured catalytic membranes, and
nanoparticle enhanced filtration—may enable improved water quality in both
large-scale water treatment plants and point-of-use systems.21
Nanotechnology
water desalination and filtration systems may offer affordable, scalable, and
portable water filtration systems. Filters employing nanoscale pores work by
allowing water molecules to pass through, but preventing larger molecules, such
as salt ions and other impurities (e.g., bacteria, viruses, heavy metals, and organic
17 According to National Science and Technology Council Nanoscale Science and Engineering Subcommittee, the
federal coordinating body for the National Nanotechnology Initiative, Nanotechnology Signature Initiatives (NSIs) are
focused areas of national importance that may be more rapidly advanced through enhanced interagency coordination
and collaboration. NSIs are intended to accelerate research, development, and insertion, and overcome challenges to the
application of nanotechnology-enabled products by combining and integrating the expertise, capabilities, and resources
of federal agencies. A list of NSIs is included in Table 2. 18 National Nanotechnology Initiative, A Progress Review of the NNI Nanotechnology Signature Initiatives, December
2015. 19 See, for example, Phys.org, “New High-Temperature Device Captures a Broader Solar Wavelength Spectrum,
Improves Solar Efficiency,” http://phys.org/news/2016-08-high-temperature-device-captures-broader-solar.html, last
accessed on August 5, 2016. 20 American Association for the Advancement of Science, “How to Build a Better Battery Through Nanotechnology,”
Science, May 26, 2016. 21 See, for example, Anita Street, Richard Sustich, Jeremiah Duncan, Nora Savage, eds., Nanotechnology Applications
for Clean Water: Solutions for Improving Water Quality, 2nd ed., Elsevier, 2014.
Nanotechnology: A Policy Primer
Congressional Research Service 5
material), from doing so.22
Some nanoscale filtration systems also employ a
matrix of polymers and nanoparticles that serve to attract water molecules to the
filter and to repel contaminants.23
Agricultural and food applications. Nanobiosensors capable of monitoring and
detecting the presence of a virus or disease-infecting particle may enable early,
targeted application of pesticides and herbicides increasing crop yield, lowering
costs, and reducing environmental impact; similarly, other nanotechnology
sensors may help to improve nutrient and water management. Reducing health-
promoting bioactive compounds to nanoscale particles can improve delivery
properties, solubility, targetability, and efficient absorption through cells.
Nanotechnology can also improve the shelf life of products by incorporating
antimicrobial properties into the packaging to protect food against pathogens.24
Nanotechnology also offers the potential for improved nutrition. Some
companies are exploring the development of nanocapsules that release nutrients
targeted at specific parts of the body at specific times.25
Self-healing materials. Nanotechnology may offer approaches that enable
materials to “self-heal” by incorporating, for example, nanocontainers of a repair
substance (e.g., an epoxy) throughout the material. When a crack or corrosion
reaches a nanocontainer, the nanocontainer could be designed to open and release
its repair material to fill the gap and seal the crack.26
Toxin and pathogen sensors. Microfluidic and nanocantilever sensors
(discussed earlier) may be engineered to detect specific pathogens (e.g., bacteria,
virus) or toxins (e.g., sarin gas, hydrogen cyanide) by detecting their unique
molecular signals or through selective binding with an engineered nanoparticle.27
Environmental remediation. The high surface-to-volume ratio, high reactivity,
and small size of some nanoscale particles (e.g., nanoscale iron) may offer more
effective and less costly solutions for remediation of environmental
contamination. By injecting engineered nanoparticles into the ground, these
characteristics can be employed to enable the particles to move more easily
through a contaminated site and bond more readily with targeted contaminants.
22 See, for example, presentation made by Rohit Karnik, Massachusetts Institute of Technology, “Novel Nanostructured
Materials for Water Purification,” April 27, 2016. 23 National Nanotechnology Initiative, “Benefits and Applications,” http://www.nano.gov/you/nanotechnology-
benefits, last accessed on August 5, 2016. 24 Caroline E. Handford, Moira Dean, and Maeve Henchion, et al., “Implications of Nanotechnology for the Agri-food
Industry: Opportunities, Benefits and Risks,” Trends in Food Science & Technology, vol. 40, no. 2, December 2014,
pp. 226-239. 25 Chittaranjan Kole, Phullara Kole, K.M. Randunu et al., “Nanobiotechnology Can Boost Crop Production and
Quality: First Evidence from Increased Plant Biomass, Fruit Yield and Phytomedicine Content in Bitter Melon,” BMC
Biotechnology, PubMed, April 26, 2013, http://www.ncbi.nlm.nih.gov/pubmed/23622112?dopt=Abstract&holding=
f1000,f1000m,isrctn. 26 Antoni P. Tomsia, Maximilien E. Launey, Janice S. Lee et al., “Nanotechnology Approaches for Better Dental
Implants,” International Journal of Oral Maxillofac Implants, 2011, pp. 25-49.White, Scott R. and Geubelle, Philippe
H., “Self-Healing Materials: Get Ready for Repair-and-Go,” Nature Nanotechnology, Vol. 5, 2010, pp. 247-248,
http://www.nature.com/nnano/journal/v5/n4/abs/nnano.2010.66.html; Michael Berger, “Nanomaterial Heal Thyself,”
Nanowerk Spotlight, June 13, 2007, http://www.nanowerk.com/spotlight/spotid=2067.php. 27 Nanoscale Science, Engineering, and Technology Subcommittee, National Science and Technology Council, The
White House, “Nanotechnology for Sensors and Sensors for Nanotechnology,” July 9, 2012, http://www.nano.gov/
sites/default/files/pub_resource/sensors_nsi_2012_07_09_final_for_web.pdf.
Nanotechnology: A Policy Primer
Congressional Research Service 6
EPA notes, however, that site-specific conditions (e.g., site location and layout,
geologic conditions, concentration of contaminants, types of contaminants) may
limit the effectiveness of nanoparticles.28
Nanotechnology is also expected by some to make substantial contributions to federal missions
such as national defense,29
homeland security, and space exploration30
and commercialization.
Estimates of U.S. private-sector nanotechnology R&D funding range from two times the amount
of U.S. public funding31
to more than nine times as much.32
In general, the private sector’s efforts
focus on translating fundamental knowledge and prototypes into commercial products;
developing new applications incorporating nanoscale materials; and developing technologies,
methods, and systems for commercial-scale manufacturing. Many other nations and firms around
the world are also making substantial investments in nanotechnology.
The National Nanotechnology Initiative President Clinton launched the National Nanotechnology Initiative in 2000, establishing a multi-
agency program33
to coordinate and expand federal efforts to advance the state of nanoscale
science, engineering, and technology, and to position the United States to lead the world in
nanotechnology research, development, and commercialization. In FY2016, the NNI includes 11
federal departments and independent agencies and commissions with budgets dedicated to
nanotechnology R&D, as well as nine other federal departments and independent agencies and
commissions with responsibilities for health, safety, and environmental regulation; trade;
education; training; intellectual property; international relations; and other areas that might affect
nanotechnology.34
The Environmental Protection Agency, Food and Drug Administration, and
28 Environmental Protection Agency, Nanotechnology for Site Remediation Fact Sheet, EPA 542-F-08-009, October
2008, https://www.epa.gov/sites/production/files/2015-04/documents/nano_tech_remediation_542-f-08-009.pdf. 29 For example, Lockheed Martin asserts that the F-35 Lightning II fighter aircraft is the “first mass-produced aircraft to
integrate structural nanocomposites in non-load bearing airframe components.” Lux Research, Inc., LuxPopuli,
“Lockheed Martin Using Structural Nanocomposites in F-35 Aircraft,” July 8, 2011,
http://blog.luxresearchinc.com/blog/2011/07/lockheed-martin-using-structural-nanocomposites-in-f-35-aircraft, last
accessed on August 15, 2016. 30 For example, Lockheed Martin incorporated carbon nanostructured materials in construction of NASA’s Juno
spacecraft. Lockheed Martin, “Juno,” http://lockheedmartin.com/us/products/juno.html, last accessed on August 15,
2016. 31 Lux Research, Inc., Nanotechnology Update: U.S. Leads in Government Spending Amidst Increased Spending
Across Asia, December 2015 (revised January 2016). 32 The Business Research and Development and Innovation Survey (BRDIS), conducted by Census Bureau in
cooperation with the National Science Foundation, reported $14.9 billion in total company paid-and-performed
nanotechnology R&D for 2013. It should be noted that the BRDS survey allows companies to report R&D spending in
more than one technology focus area. National Science Foundation, “Business Research and Development and
Innovation: 2013,” Detailed Statistical Tables, Table 34, https://www.nsf.gov/statistics/2016/nsf16313/#chp2, last
accessed on August 15, 2016. 33 The original six NNI agencies were the National Science Foundation, Department of Defense, Department of
Energy, National Institute of Standards and Technology, National Aeronautics and Space Administration, and National
Institutes of Health. 34 Previously the NNI counted more than 20 participating agencies, however departments with multiple participating
agencies are now counted as a single participant. For example, four agencies of the Department of Commerce
participate in the NSET subcommittee—the National Institute of Standards and Technology, Economic Development
Administration, Bureau of Industry and Security, and U.S. Patent and Trademark Office—but are only counted as a
single participating department.
Nanotechnology: A Policy Primer
Congressional Research Service 7
Consumer Product Safety Commission conduct nanotechnology R&D and have regulatory
responsibilities.
Congress has played a central role in the NNI, providing appropriations for the conduct of
nanotechnology R&D, establishing programs, and creating a legislative foundation for some of
the activities of the NNI through enactment of the 21st Century Nanotechnology Research and
Development Act of 2003. The act authorized appropriations for FY2005 through FY2008 for
NNI activities at five agencies: the National Science Foundation (NSF), Department of Energy
(DOE), National Aeronautics and Space Administration (NASA), Department of Commerce
(DOC) National Institute of Standards and Technology (NIST), and Environmental Protection
Agency (EPA).
Congress has continued its active engagement in the NNI through hearings, proposed authorizing
legislation, and annual appropriations. While many provisions of the 21st Century
Nanotechnology Research and Development Act have no sunset provision, FY2008 was the last
year for which it authorized appropriations.
Legislation to amend and reauthorize the act was introduced in the 114th Congress, 113
th
Congress, 111th Congress, and 110
th Congress.
35 In the 114
th Congress, Subtitle B of H.R. 1898,
the America COMPETES Reauthorization Act of 2015, would reauthorize the NNI. The
American Innovation and Competitiveness Act (S. 3084) would modify certain NNI statutory
reporting requirements. H.R. 1898 was introduced on April 21, 2015, and referred to the House
Committee on Science, Space, and Technology, and subsequently referred to two subcommittees.
No further action has been taken. S. 3084 was introduced on June 22, 2016, and referred to the
Committee on Commerce, Science, and Transportation. The bill was ordered reported favorably
with an amendment in the nature of a substitute on June 29, 2016. No further action has been
taken.
Efforts to enact comprehensive NNI reauthorization legislation in the 110th Congress, 111
th
Congress, and 113th Congress were unsuccessful. For additional information, see CRS Report
RL34401, The National Nanotechnology Initiative: Overview, Reauthorization, and
Appropriations Issues, by John F. Sargent Jr.
Structure
The NNI is coordinated within the White House through the National Science and Technology
Council’s NSET subcommittee. The NSET subcommittee is comprised of representatives from 20
federal departments and agencies, the Office of Science and Technology Policy (OSTP), and the
Office of Management and Budget. (A list of NSET subcommittee member agencies is provided
in the Appendix.) The NSET subcommittee has two working groups: National Environmental
and Health Implications (NEHI) Working Group; and Nanotechnology Innovation and
Commercialization Ecosystem (NICE) Working Group. Two previous working groups—Global
Issues in Nanotechnology (GIN) Working Group and Nanotechnology Public Engagement and
Communications (NPEC) Working Group—were eliminated.36
Based on a 2010 recommendation
by the President’s Council of Advisors on Science and Technology (PCAST), the NSET
subcommittee has designated coordinators for four broad areas—global issues; standards
35 No comprehensive reauthorization legislation was introduced in the 112th Congress. 36 The NSET subcommittee “periodically reviews the need for existing or new working groups in terms of focus,
intended participation, and scope.” NSET, NSTC, National Nanotechnology Initiative Strategic Plan, February 2014,
p. 52, http://nano.gov/sites/default/files/pub_resource/2014_nni_strategic_plan.pdf.
Nanotechnology: A Policy Primer
Congressional Research Service 8
development; environmental, health, and safety research; and education, engagement, and societal
dimensions—to “track developments, lead in organizing activities, report periodically to the
NSET subcommittee, and serve as central points of contact for NNI information in the
corresponding areas.”37
Among its activities, the National Nanotechnology Coordination Office
(NNCO) provides administrative and technical support to the NSET subcommittee, conducts
public outreach on behalf of the NNI, and maintains the NNI website (www.nano.gov).
Funding
This section provides information on NNI funding by agency and by program component area
(PCA).
Funding by Agency
Funding for the NNI is provided through appropriations to each of the NNI-participating
agencies. The NNI has no centralized funding. Overall NNI funding is calculated by aggregating
the nanotechnology-related expenditures of each agency. Funding remains concentrated in the
original six NNI agencies (see footnote 33), which account for 94.2% of NNI funding in FY2016.
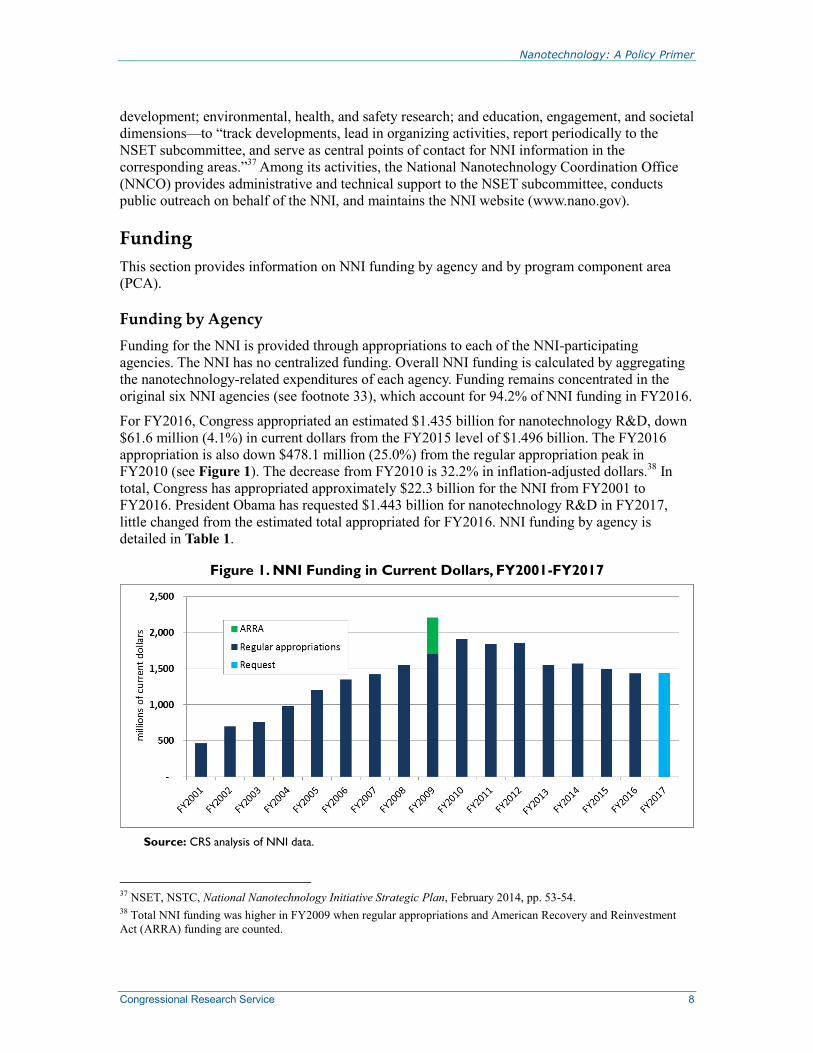
For FY2016, Congress appropriated an estimated $1.435 billion for nanotechnology R&D, down
$61.6 million (4.1%) in current dollars from the FY2015 level of $1.496 billion. The FY2016
appropriation is also down $478.1 million (25.0%) from the regular appropriation peak in
FY2010 (see Figure 1). The decrease from FY2010 is 32.2% in inflation-adjusted dollars.38
In
total, Congress has appropriated approximately $22.3 billion for the NNI from FY2001 to
FY2016. President Obama has requested $1.443 billion for nanotechnology R&D in FY2017,
little changed from the estimated total appropriated for FY2016. NNI funding by agency is
detailed in Table 1.
Figure 1. NNI Funding in Current Dollars, FY2001-FY2017
Source: CRS analysis of NNI data.
37 NSET, NSTC, National Nanotechnology Initiative Strategic Plan, February 2014, pp. 53-54. 38 Total NNI funding was higher in FY2009 when regular appropriations and American Recovery and Reinvestment
Act (ARRA) funding are counted.
Nanotechnology: A Policy Primer
Congressional Research Service 9
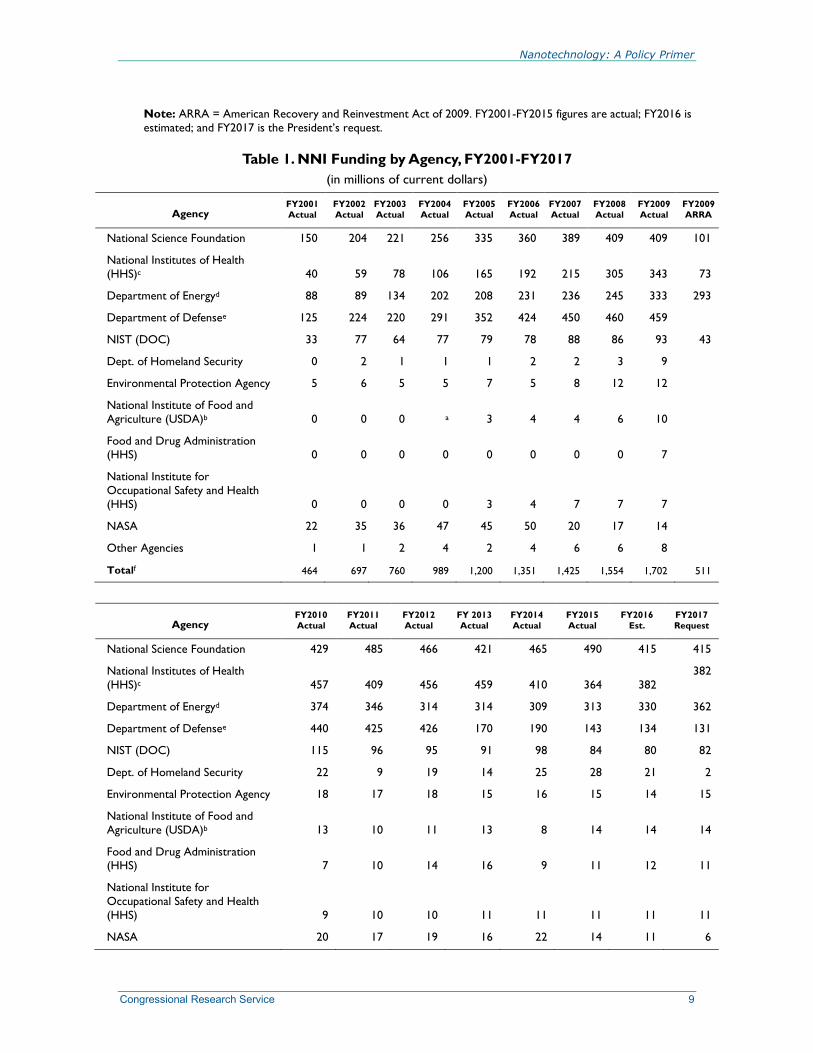
Note: ARRA = American Recovery and Reinvestment Act of 2009. FY2001-FY2015 figures are actual; FY2016 is
estimated; and FY2017 is the President’s request.
Table 1. NNI Funding by Agency, FY2001-FY2017
(in millions of current dollars)
Agency FY2001
Actual
FY2002
Actual
FY2003
Actual
FY2004
Actual
FY2005
Actual
FY2006
Actual
FY2007
Actual
FY2008
Actual
FY2009
Actual
FY2009
ARRA
National Science Foundation 150 204 221 256 335 360 389 409 409 101
National Institutes of Health
(HHS)c 40 59 78 106 165 192 215 305 343 73
Department of Energyd 88 89 134 202 208 231 236 245 333 293
Department of Defensee 125 224 220 291 352 424 450 460 459
NIST (DOC) 33 77 64 77 79 78 88 86 93 43
Dept. of Homeland Security 0 2 1 1 1 2 2 3 9
Environmental Protection Agency 5 6 5 5 7 5 8 12 12
National Institute of Food and
Agriculture (USDA)b 0 0 0 a 3 4 4 6 10
Food and Drug Administration (HHS) 0 0 0 0 0 0 0 0 7
National Institute for
Occupational Safety and Health
(HHS) 0 0 0 0 3 4 7 7 7
NASA 22 35 36 47 45 50 20 17 14
Other Agencies 1 1 2 4 2 4 6 6 8
Totalf 464 697 760 989 1,200 1,351 1,425 1,554 1,702 511
Agency FY2010
Actual
FY2011
Actual
FY2012
Actual
FY 2013
Actual
FY2014
Actual
FY2015
Actual
FY2016
Est.
FY2017
Request
National Science Foundation 429 485 466 421 465 490 415 415
National Institutes of Health
(HHS)c 457 409 456 459 410 364 382
382
Department of Energyd 374 346 314 314 309 313 330 362
Department of Defensee 440 425 426 170 190 143 134 131
NIST (DOC) 115 96 95 91 98 84 80 82
Dept. of Homeland Security 22 9 19 14 25 28 21 2
Environmental Protection Agency 18 17 18 15 16 15 14 15
National Institute of Food and
Agriculture (USDA)b 13 10 11 13 8 14 14 14
Food and Drug Administration (HHS) 7 10 14 16 9 11 12 11
National Institute for
Occupational Safety and Health
(HHS) 9 10 10 11 11 11 11 11
NASA 20 17 19 16 22 14 11 6
Nanotechnology: A Policy Primer
Congressional Research Service 10
Agency FY2010
Actual
FY2011
Actual
FY2012
Actual
FY 2013
Actual
FY2014
Actual
FY2015
Actual
FY2016
Est.
FY2017
Request
Other Agencies 11 13 10 11 12 10 11 13
Totalf 1,913 1,847 1,857 1,550 1,574 1,496 1,435 1,443
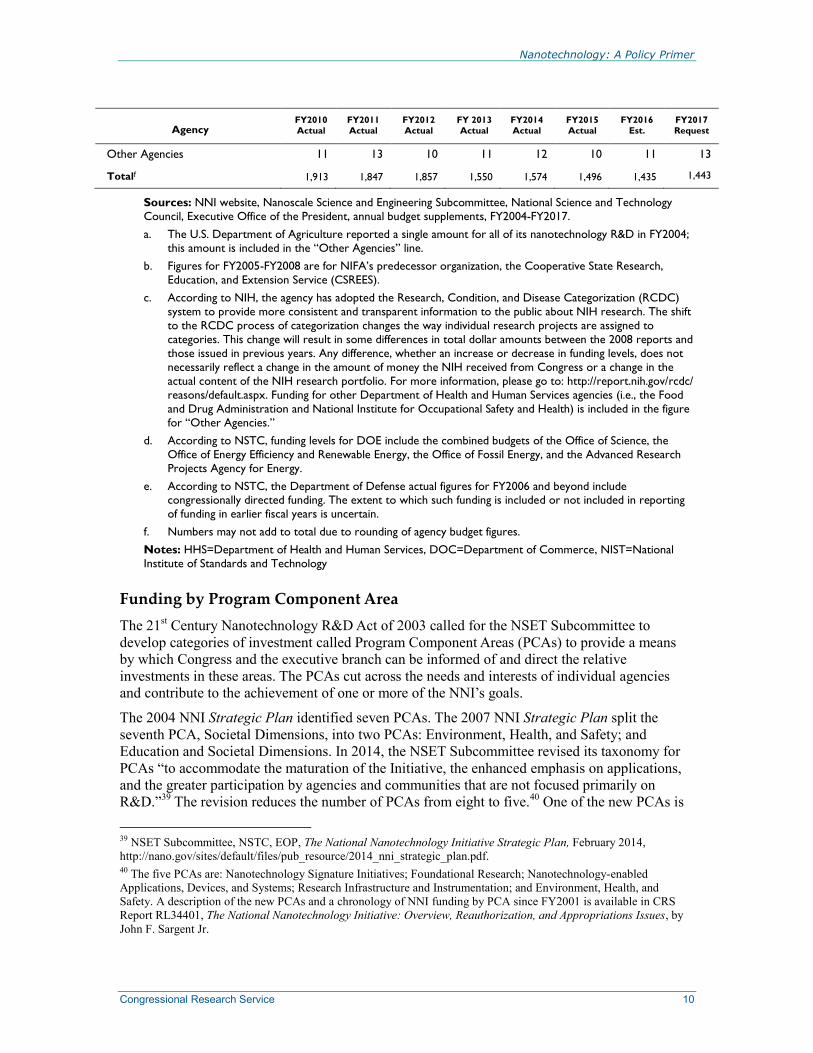
Sources: NNI website, Nanoscale Science and Engineering Subcommittee, National Science and Technology
Council, Executive Office of the President, annual budget supplements, FY2004-FY2017.
a. The U.S. Department of Agriculture reported a single amount for all of its nanotechnology R&D in FY2004;
this amount is included in the “Other Agencies” line.
b. Figures for FY2005-FY2008 are for NIFA’s predecessor organization, the Cooperative State Research,
Education, and Extension Service (CSREES).
c. According to NIH, the agency has adopted the Research, Condition, and Disease Categorization (RCDC)
system to provide more consistent and transparent information to the public about NIH research. The shift
to the RCDC process of categorization changes the way individual research projects are assigned to
categories. This change will result in some differences in total dollar amounts between the 2008 reports and
those issued in previous years. Any difference, whether an increase or decrease in funding levels, does not
necessarily reflect a change in the amount of money the NIH received from Congress or a change in the
actual content of the NIH research portfolio. For more information, please go to: http://report.nih.gov/rcdc/
reasons/default.aspx. Funding for other Department of Health and Human Services agencies (i.e., the Food
and Drug Administration and National Institute for Occupational Safety and Health) is included in the figure
for “Other Agencies.”
d. According to NSTC, funding levels for DOE include the combined budgets of the Office of Science, the
Office of Energy Efficiency and Renewable Energy, the Office of Fossil Energy, and the Advanced Research
Projects Agency for Energy.
e. According to NSTC, the Department of Defense actual figures for FY2006 and beyond include congressionally directed funding. The extent to which such funding is included or not included in reporting
of funding in earlier fiscal years is uncertain.
f. Numbers may not add to total due to rounding of agency budget figures.
Notes: HHS=Department of Health and Human Services, DOC=Department of Commerce, NIST=National
Institute of Standards and Technology
Funding by Program Component Area
The 21st Century Nanotechnology R&D Act of 2003 called for the NSET Subcommittee to
develop categories of investment called Program Component Areas (PCAs) to provide a means
by which Congress and the executive branch can be informed of and direct the relative
investments in these areas. The PCAs cut across the needs and interests of individual agencies
and contribute to the achievement of one or more of the NNI’s goals.
The 2004 NNI Strategic Plan identified seven PCAs. The 2007 NNI Strategic Plan split the
seventh PCA, Societal Dimensions, into two PCAs: Environment, Health, and Safety; and
Education and Societal Dimensions. In 2014, the NSET Subcommittee revised its taxonomy for
PCAs “to accommodate the maturation of the Initiative, the enhanced emphasis on applications,
and the greater participation by agencies and communities that are not focused primarily on
R&D.”39
The revision reduces the number of PCAs from eight to five.40
One of the new PCAs is
39 NSET Subcommittee, NSTC, EOP, The National Nanotechnology Initiative Strategic Plan, February 2014,
http://nano.gov/sites/default/files/pub_resource/2014_nni_strategic_plan.pdf. 40 The five PCAs are: Nanotechnology Signature Initiatives; Foundational Research; Nanotechnology-enabled
Applications, Devices, and Systems; Research Infrastructure and Instrumentation; and Environment, Health, and
Safety. A description of the new PCAs and a chronology of NNI funding by PCA since FY2001 is available in CRS
Report RL34401, The National Nanotechnology Initiative: Overview, Reauthorization, and Appropriations Issues, by
John F. Sargent Jr.
Nanotechnology: A Policy Primer
Congressional Research Service 11
Nanotechnology Signature Initiatives (NSIs). NSIs are areas of particular focus (e.g., solar
energy, next-generation electronics, sustainable manufacturing) in which participating agencies
have identified key opportunities and plan more intensive programmatic collaboration.
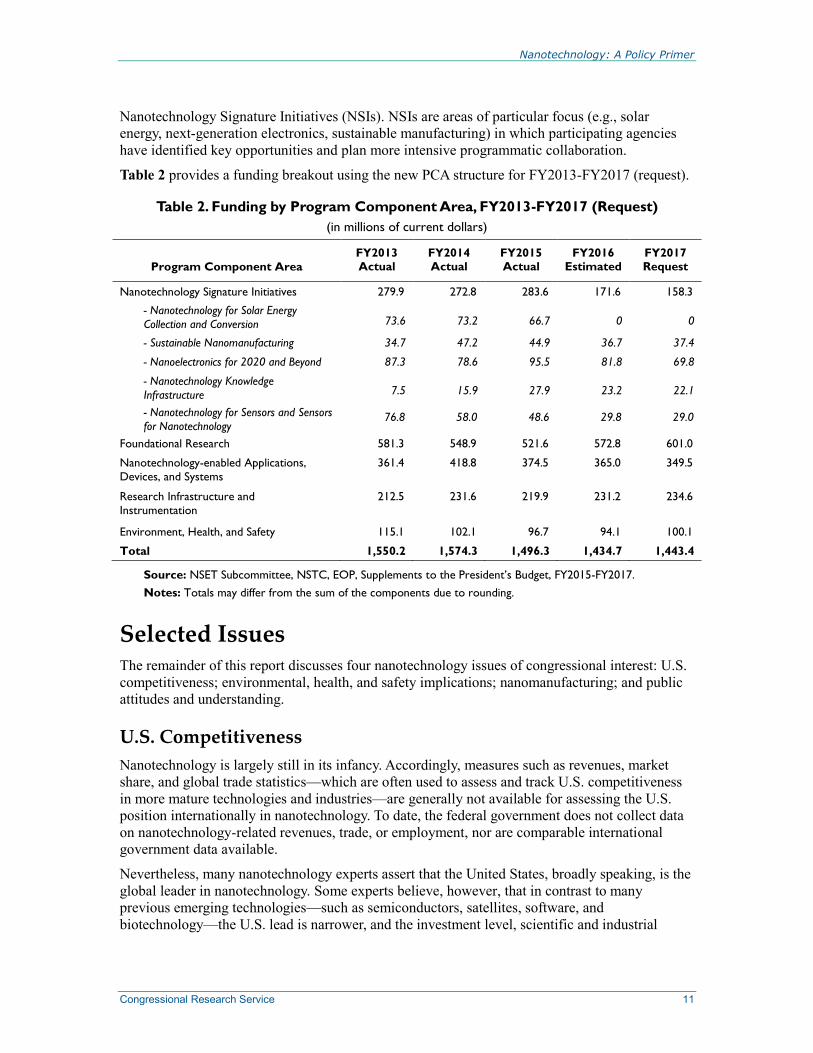
Table 2 provides a funding breakout using the new PCA structure for FY2013-FY2017 (request).
Table 2. Funding by Program Component Area, FY2013-FY2017 (Request)
(in millions of current dollars)
Program Component Area
FY2013 Actual
FY2014 Actual
FY2015 Actual
FY2016 Estimated
FY2017 Request
Nanotechnology Signature Initiatives 279.9 272.8 283.6 171.6 158.3
- Nanotechnology for Solar Energy
Collection and Conversion 73.6 73.2 66.7 0 0
- Sustainable Nanomanufacturing 34.7 47.2 44.9 36.7 37.4
- Nanoelectronics for 2020 and Beyond 87.3 78.6 95.5 81.8 69.8
- Nanotechnology Knowledge
Infrastructure 7.5 15.9 27.9 23.2 22.1
- Nanotechnology for Sensors and Sensors
for Nanotechnology 76.8 58.0 48.6 29.8 29.0
Foundational Research 581.3 548.9 521.6 572.8 601.0
Nanotechnology-enabled Applications,
Devices, and Systems
361.4 418.8 374.5 365.0 349.5
Research Infrastructure and
Instrumentation
212.5 231.6 219.9 231.2 234.6
Environment, Health, and Safety 115.1 102.1 96.7 94.1 100.1
Total 1,550.2 1,574.3 1,496.3 1,434.7 1,443.4
Source: NSET Subcommittee, NSTC, EOP, Supplements to the President’s Budget, FY2015-FY2017.
Notes: Totals may differ from the sum of the components due to rounding.
Selected Issues The remainder of this report discusses four nanotechnology issues of congressional interest: U.S.
competitiveness; environmental, health, and safety implications; nanomanufacturing; and public
attitudes and understanding.
U.S. Competitiveness
Nanotechnology is largely still in its infancy. Accordingly, measures such as revenues, market
share, and global trade statistics—which are often used to assess and track U.S. competitiveness
in more mature technologies and industries—are generally not available for assessing the U.S.
position internationally in nanotechnology. To date, the federal government does not collect data
on nanotechnology-related revenues, trade, or employment, nor are comparable international
government data available.
Nevertheless, many nanotechnology experts assert that the United States, broadly speaking, is the
global leader in nanotechnology. Some experts believe, however, that in contrast to many
previous emerging technologies—such as semiconductors, satellites, software, and
biotechnology—the U.S. lead is narrower, and the investment level, scientific and industrial
Nanotechnology: A Policy Primer
Congressional Research Service 12
infrastructure, technical capabilities, and science and engineering workforces of some other
nations are more substantial.
Some organizations do occasionally produce estimates of global R&D and product revenues for
nanotechnology. In the absence of formal data collection, these figures often depend on subjective
estimates of nanotechnology’s contribution to a particular industry or product. While some
products are defined by their nanotechnology properties (for example, nanoscale silver used for
antibacterial purposes), many products incorporate nanotechnology as only a part of their
functionality (for example, nanoscale gates in semiconductors) thus rendering an assessment of
the value of nanotechnology in a particular product subjective (i.e., what percentage of
semiconductor revenues should be attributed to nanotechnology).
Results published in two reports illustrate the wide range of estimated global nanotechnology
revenues resulting from the use of different methodologies and assumptions. A 2012 estimate by
market forecasting firm BCC Research, estimated the global nanotechnology market at $20.7
billion.41
In contrast, in December 2015, Lux Research, Inc., an emerging technologies consulting
firm, estimated that nano-enabled products generated $1.6 trillion in global revenues in 2014.
According to the Lux Research report, the United States accounted for $370 billion (23%) of
2014 global revenues, while Europe generated $602 billion (37%) and Asia accounted for $524
billion (32%). Other countries—aggregated by Lux Research as “Rest of the World”—accounted
for an estimated $120 billion (7%).42
An alternative mechanism for gauging a nation’s competitive position in emerging
technologies—in the absence of periodic, comprehensive, and reliable economic output data (e.g.,
revenues, market share, trade)—is the use of inputs (e.g., public and private research investments)
and non-financial outputs (e.g., scientific papers, patents).
With the exception of scientific papers, by these measures (discussed below), the United States
appears to lead the world, generally, in nanotechnology. However, R&D investments, scientific
papers, and patents may not provide reliable indicators of the United States’ current or future
competitive position. Scientific and technological leadership may not necessarily result in
commercial leadership or national competitiveness for a variety of reasons:
Basic research in nanotechnology may not translate into viable commercial
applications.
Basic research results are generally available to all competitors.
U.S.-based companies may conduct production and other work outside of the
United States.
U.S.-educated foreign students may return home to conduct research and create
new businesses.
U.S. companies with leading-edge nanotechnology capabilities and/or intellectual
property may be acquired by foreign competitors.
U.S. policies or other factors may restrict or prohibit nanotechnology
commercialization, make it unaffordable, or make it less attractive than foreign
alternatives.
41 BCC Research, Nanotechnology: A Realistic Market Assessment, September 2012. 42 Lux Research, Inc., Nanotechnology Update: U.S. Leads in Government Spending Amidst Increased Spending
Across Asia, December 2015 (revised January 2016).
Nanotechnology: A Policy Primer
Congressional Research Service 13
Aggregate national data may be misleading as countries may establish global
leadership in niche areas of nanotechnology.
With these caveats, the following section reviews input and non-economic output measures as
indicators of the U.S. competitive position in nanotechnology.
Global Funding
The United States has led, and continues to lead, all nations in known total (public and private)
investments in nanotechnology R&D, though the estimated U.S. share of global public
investments has fallen as other nations have established similar programs and increased funding.
In its December 2015 report, Lux Research estimated total global nanotechnology funding by
governments, corporations, and venture capital investors to be approximately $18.1 billion in
2014, of which the United States accounted for approximately $5.9 billion (33%).43
According to
the Lux Research, in 2010 corporate R&D accounted for a majority of global nanotechnology
funding for the first time.44
Lux Research estimated total public nanotechnology R&D funding in 2014 at $7.9 billion. Of this
amount, the United States is estimated to have accounted for $1.7 billion (21%); Europe,
including the European Commission and individual country spending, $2.5 billion (31%); Japan,
$1.1 billion (13%); Russia, 1.1 billion (13%); and China, $590 million (7%).45
While the United
States continues to make greater public investments in nanotechnology than any other single
country when using currency exchange rates, the outcome is different when the spending is
adjusted for purchasing power parity (PPP) which takes into account the price of goods and
services in each nation. Viewed in terms of PPP, Lux Research showed that Russia’s public
funding exceeded that of the United States, and that total public spending by the EC and
individual EC member countries was more than twice that of the United States.46
Private investments in nanotechnology R&D come from two primary sources, corporations and
venture capital (VC) investors. According to Lux Research, corporate nanotechnology R&D in
2014 was $9.8 billion of which the United States accounted for $4.0 billion (41%), Japan for $2.5
billion (25%), and Germany for $0.8 billion (8%). U.S. corporate spending on nanotechnology
R&D grew faster between 2012 and 2014 (9%), than did corporate spending in Europe (7%) and
Asia (3.1%).47
Since peaking at nearly $1.4 billion in 2008, venture capital (VC) funding for nanotechnology has
fallen by more than 75%. In 2014, VC funding was $316 million, its lowest level since 2001,
according to Lux Research. U.S.-based companies received $226 million (72%) of the 2014
global VC investment; United Kingdom-based companies received $62 million (20%).48
43 Lux Research, Inc., December 2015 (revised January 2016). 44 OECD /NNI International Symposium on Assessing the Economic Impact of Nanotechnology, Background Paper 2:
Finance and Investor Models in Nanotechnology, Working Party on Nanotechnology, Organization for Economic
Cooperation and Development, March 16, 2012, p. 4. 45 Lux Research, Inc., December 2015 (revised January 2016). 46 Ibid. 47 Ibid. 48 Ibid.
Nanotechnology: A Policy Primer
Congressional Research Service 14
Scientific Papers
The publication of peer-reviewed scientific papers is considered by some to be an indicator of a
nation’s scientific leadership. A number of different approaches have been taken, each yielding
different results.
In July 2015, the National Science Foundation presented an analysis of global nanotechnology
scientific papers before the National Research Council. The analysis shows very different results
depending on the universe of journals searched.
The analysis identified relevant articles published from 1990 to 2014 by conducting a
title/abstract search of the Web of Science database using nanotechnology-related keywords.49
The analysis showed China with the most publications (with approximately 39,500 publications
in 2014), followed by the European Union 2750
(EU-27, approximately 33,500), the United States
(approximately 24,000), South Korea (approximately 8,000), and Japan (approximately 7,000).
By this measure, the United States accounted for approximately 19% of all nanotechnology
publications, down from approximately 29.5% in the 2001-2005 period. While the number of
U.S. publications has continued to grow from year to year, the reduction in the U.S. share results
from much faster growth in Chinese publications. Between 2009, when China and the United
States had essentially the same number of publications (approximately 16,500 each), and 2014,
the number of Chinese publications more than doubled while the number of U.S. publications
grew by less than 50%.51
A search for nanotechnology citations in 10 specialized journals in the Web of Science database
yields a different picture. In 2010, the latest year for the data presented, the analysis showed the
United States with approximately 33% of publications, China with approximately 22%, and the
EU27 with approximately 21% However, by this metric the U.S. share of publications had fallen
from approximately 51% in 2000.52
The NSF presentation also detailed its search of five countries’ contributions to three of the
leading scientific publications, namely Nature, Science, and the Proceedings of the National
Academies, for which one or more of the authors was from the United States. Using this
methodology, the United States has accounted for 65%-70% of the nanotechnology contributions
since 2006.53
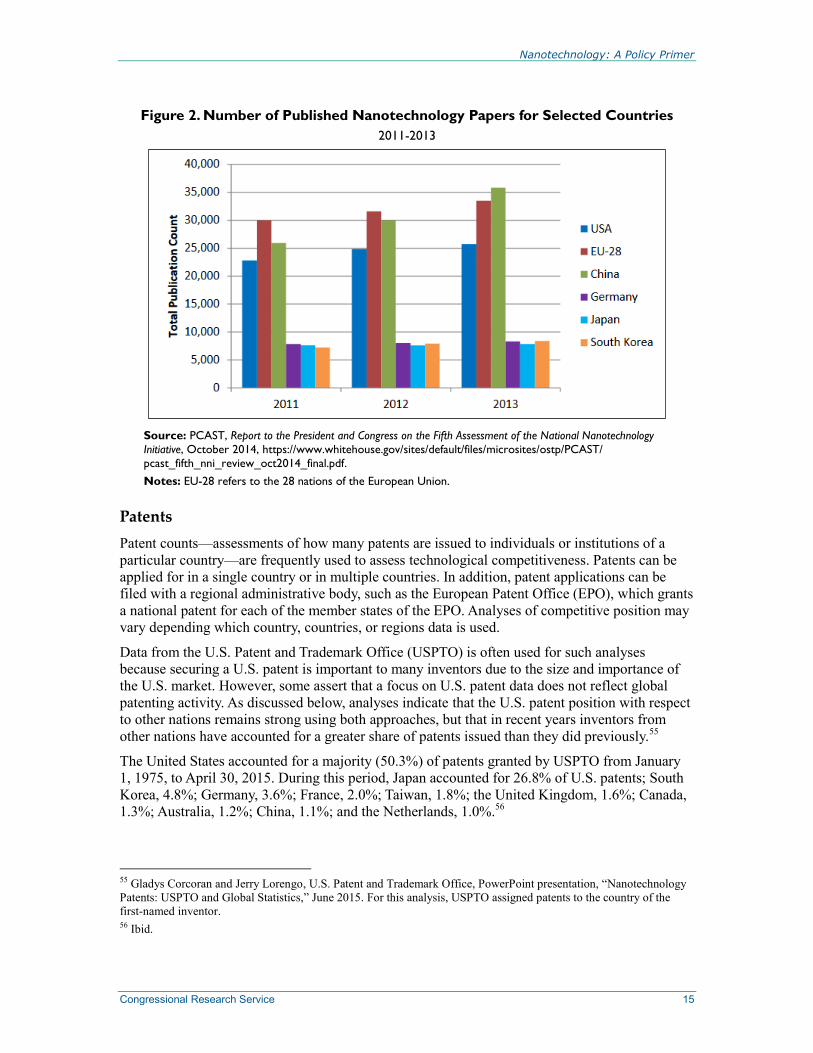
In its fifth assessment of the NNI, the President’s Council of Advisors on Science and Technology
(PCAST) found that between 2011 and 2013, the number of nanotechnology papers published by
China and the European Union exceeded that of the United States. (See Figure 2.)54
49 Web of Science is an online scientific citation indexing service maintained by Thomson Reuters that includes more
than 12,000 journals. 50 The European Union 27 and EU-27 refers to the 27 members of the EU at the time of the report’s publication. 51 Mihail C. Roco, National Science Foundation, “NNI This Far: Building Infrastructure for Nanotechnology,”
presentation before the National Research Council’s Triennial Review of the National Nanotechnology Initiative, July
29, 2015. 52 Ibid. 53 Ibid. 54 PCAST, Report to the President and Congress on the Fifth Assessment of the National Nanotechnology Initiative,
October 2014, https://www.whitehouse.gov/sites/default/files/microsites/ostp/PCAST/
pcast_fifth_nni_review_oct2014_final.pdf.
Nanotechnology: A Policy Primer
Congressional Research Service 15
Figure 2. Number of Published Nanotechnology Papers for Selected Countries
2011-2013
Source: PCAST, Report to the President and Congress on the Fifth Assessment of the National Nanotechnology
Initiative, October 2014, https://www.whitehouse.gov/sites/default/files/microsites/ostp/PCAST/
pcast_fifth_nni_review_oct2014_final.pdf.
Notes: EU-28 refers to the 28 nations of the European Union.
Patents
Patent counts—assessments of how many patents are issued to individuals or institutions of a
particular country—are frequently used to assess technological competitiveness. Patents can be
applied for in a single country or in multiple countries. In addition, patent applications can be
filed with a regional administrative body, such as the European Patent Office (EPO), which grants
a national patent for each of the member states of the EPO. Analyses of competitive position may
vary depending which country, countries, or regions data is used.
Data from the U.S. Patent and Trademark Office (USPTO) is often used for such analyses
because securing a U.S. patent is important to many inventors due to the size and importance of
the U.S. market. However, some assert that a focus on U.S. patent data does not reflect global
patenting activity. As discussed below, analyses indicate that the U.S. patent position with respect
to other nations remains strong using both approaches, but that in recent years inventors from
other nations have accounted for a greater share of patents issued than they did previously.55
The United States accounted for a majority (50.3%) of patents granted by USPTO from January
1, 1975, to April 30, 2015. During this period, Japan accounted for 26.8% of U.S. patents; South
Korea, 4.8%; Germany, 3.6%; France, 2.0%; Taiwan, 1.8%; the United Kingdom, 1.6%; Canada,
1.3%; Australia, 1.2%; China, 1.1%; and the Netherlands, 1.0%.56
55 Gladys Corcoran and Jerry Lorengo, U.S. Patent and Trademark Office, PowerPoint presentation, “Nanotechnology
Patents: USPTO and Global Statistics,” June 2015. For this analysis, USPTO assigned patents to the country of the
first-named inventor. 56 Ibid.
Nanotechnology: A Policy Primer
Congressional Research Service 16
A broader measure used by USPTO to assess global patenting activity yielded different results.
USPTO examined patenting activity in more than 50 countries from 1986 to June 2015.57
Using
this measure, the United States accounted for more nanotechnology patents than any other
country (24.4%), but less than half the share it accounted for in the U.S. patent system alone
(50.3%). China accounted for 17.7% of the patents; Japan, 10.3%; South Korea, 7.9%; Germany,
4.2%; Taiwan, 2.3%; Russia, 2.0%; France, 1.7%; the United Kingdom, 1.4%; and Canada,
1.0%.58
The share of patents attributed to China and South Korea were substantially larger using
this multi-country metric than when measured using only U.S.-granted patents. Viewed over time,
the U.S. share of nanotechnology patents issued by these countries peaked in 2005 at about 35%,
and declined to below 25% by 2015. During the same period, China’s share of nanotechnology
patents grew from about 4% to nearly 18%, while South Korea’s grew from about 2% to 8%. The
number of patents issued to U.S. inventors grew during each of the successive time periods
included in the presentation, while the U.S. share fell during this period due to a relatively faster
rise in the total number of patents earned by inventors from other nations.59
A third measure used by USPTO for analysis identified nanotechnology patents issued in three or
more countries. According to PCAST, this metric is a more representative indicator of patents’
significance than of patents issued in only one or two countries.60
By this measure, between 1986
and June 2011, the United States accounted for 31.3% of patents.61
Japan accounted for 24.3% of
such patents; Germany, 8.3%; South Korea, 7.5%; France, 5.1%; the United Kingdom, 3.1%;
China, 2.0%; Netherlands, 1.8%; Canada, 1.4%; Taiwan, 1.2%; and Switzerland, 1.1% Viewed
over time, the U.S. share fell from a high of about 40% in 2002 to 31% in 2014-2015.62
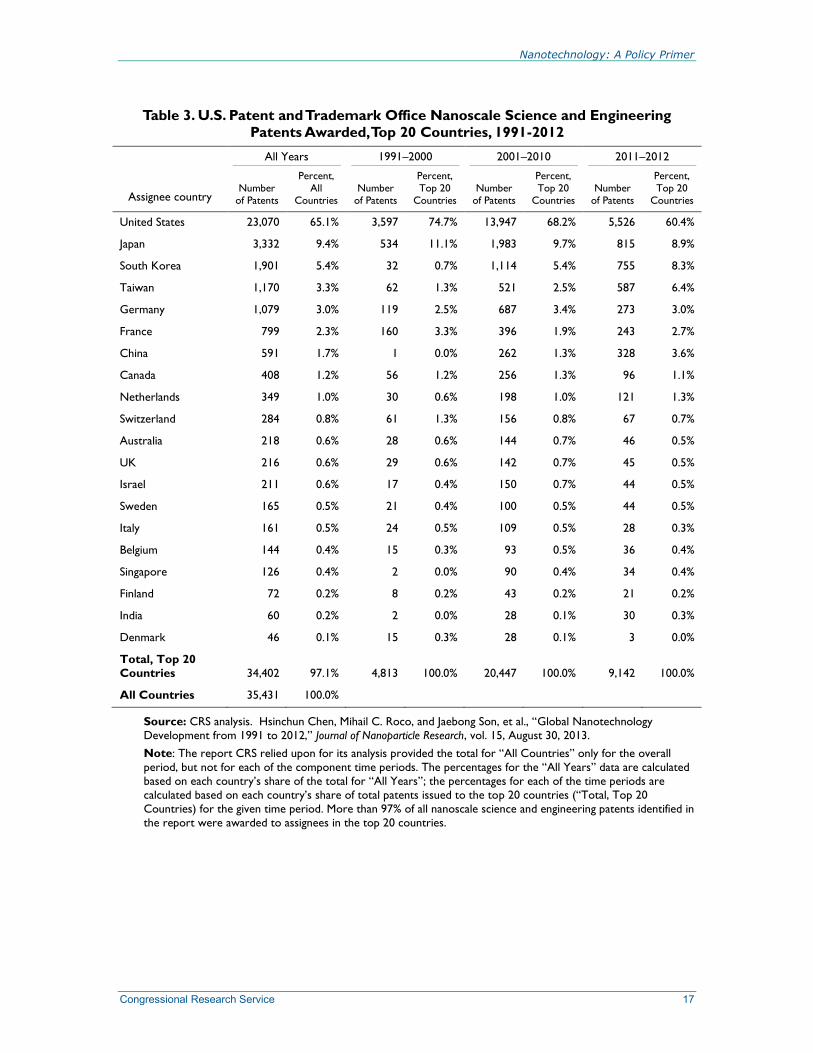
Analysis of the 35,431 nanotechnology patents awarded by USPTO between 1991 and 2012
shows the United States accounted for 65.1%, according to a 2013 analysis by researchers at the
University of Arizona and the National Science Foundation. Japan had the second highest share
with 9.4% of patents, followed by South Korea (5.4%), Taiwan (3.3%), Germany (3.0%), France
(2.3%), and China (1.7%).63
The U.S. share of patents awarded decreased over the time periods
examined in the report, but still accounted for around 60% of patents awarded during 2011 and
2012. Over the same time periods, the number of patents awarded to several Asian countries
increased rapidly. Between 1991 and 2000, South Korea, China, and Taiwan together accounted
for 2.0% of all nano-related patents issued to the top 20 nanotechnology-patenting countries;
these countries’ share grew to 18.3% in 2011 and 2012. During the same periods, the United
States’ share declined from 74.7% to 60.4% and Japan’s share fell from 11.1% to 8.9%. (See
Table 3.)
57 USPTO conducted its search using the Derwent World Patents Index with extension abstracts (WPIX), a database of
worldwide patents covering all areas of technology. 58 For this analysis, USPTO assigned patents to the country of the first-named inventor. 59 Gladys Corcoran and Jerry Lorengo, U.S. Patent and Trademark Office, PowerPoint presentation, “Nanotechnology
Patents: USPTO and Global Statistics,” June 2015. 60 PCAST, Report to the President and Congress on the Fifth Assessment of the National Nanotechnology Initiative,
October 2014, p. 19. 61 For this analysis, USPTO assigned patents to the country of the first-named inventor. 62 Ibid. 63 The report notes that, “Some portion of this difference can be ascribed to the ‘home advantage’: the tendency of
patent filers to file more patents domestically than in foreign patent offices.” Hsinchun Chen, Mihail C. Roco, and
Jaebong Son, et al., “Global Nanotechnology Development from 1991 to 2012,” Journal of Nanoparticle Research,
vol. 15, August 30, 2013.
Nanotechnology: A Policy Primer
Congressional Research Service 17
Table 3. U.S. Patent and Trademark Office Nanoscale Science and Engineering
Patents Awarded, Top 20 Countries, 1991-2012
All Years 1991–2000 2001–2010 2011–2012
Assignee country Number
of Patents
Percent, All
Countries Number
of Patents
Percent, Top 20
Countries Number
of Patents
Percent, Top 20
Countries Number
of Patents
Percent, Top 20
Countries
United States 23,070 65.1% 3,597 74.7% 13,947 68.2% 5,526 60.4%
Japan 3,332 9.4% 534 11.1% 1,983 9.7% 815 8.9%
South Korea 1,901 5.4% 32 0.7% 1,114 5.4% 755 8.3%
Taiwan 1,170 3.3% 62 1.3% 521 2.5% 587 6.4%
Germany 1,079 3.0% 119 2.5% 687 3.4% 273 3.0%
France 799 2.3% 160 3.3% 396 1.9% 243 2.7%
China 591 1.7% 1 0.0% 262 1.3% 328 3.6%
Canada 408 1.2% 56 1.2% 256 1.3% 96 1.1%
Netherlands 349 1.0% 30 0.6% 198 1.0% 121 1.3%
Switzerland 284 0.8% 61 1.3% 156 0.8% 67 0.7%
Australia 218 0.6% 28 0.6% 144 0.7% 46 0.5%
UK 216 0.6% 29 0.6% 142 0.7% 45 0.5%
Israel 211 0.6% 17 0.4% 150 0.7% 44 0.5%
Sweden 165 0.5% 21 0.4% 100 0.5% 44 0.5%
Italy 161 0.5% 24 0.5% 109 0.5% 28 0.3%
Belgium 144 0.4% 15 0.3% 93 0.5% 36 0.4%
Singapore 126 0.4% 2 0.0% 90 0.4% 34 0.4%
Finland 72 0.2% 8 0.2% 43 0.2% 21 0.2%
India 60 0.2% 2 0.0% 28 0.1% 30 0.3%
Denmark 46 0.1% 15 0.3% 28 0.1% 3 0.0%
Total, Top 20
Countries 34,402 97.1% 4,813 100.0% 20,447 100.0% 9,142 100.0%
All Countries 35,431 100.0%
Source: CRS analysis. Hsinchun Chen, Mihail C. Roco, and Jaebong Son, et al., “Global Nanotechnology
Development from 1991 to 2012,” Journal of Nanoparticle Research, vol. 15, August 30, 2013.
Note: The report CRS relied upon for its analysis provided the total for “All Countries” only for the overall
period, but not for each of the component time periods. The percentages for the “All Years” data are calculated
based on each country’s share of the total for “All Years”; the percentages for each of the time periods are
calculated based on each country’s share of total patents issued to the top 20 countries (“Total, Top 20
Countries) for the given time period. More than 97% of all nanoscale science and engineering patents identified in
the report were awarded to assignees in the top 20 countries.
Nanotechnology: A Policy Primer
Congressional Research Service 18
Environmental, Health, and Safety Implications
Nanotechnology has the potential to make important contributions to the environment, health, and
safety (EHS), while at the same time posing potential EHS challenges.
Among the potential EHS benefits of nanotechnology are applications that may reduce energy
consumption, pollution, and greenhouse gas emissions; remediate environmental damage; cure,
manage, or prevent deadly diseases; and offer new materials that can self-repair to prevent
catastrophic failure, or change in ways that provide protection and medical aid to soldiers on the
battlefield.
However, some of the unique properties of nanoscale materials—for example their small size and
high ratio of surface area to volume—have given rise to concerns about their potential
implications for EHS. While nanoscale particles occur naturally and as incidental by-products of
other human activities (e.g., soot from vehicles), EHS concerns have been focused primarily on
nanoscale materials that are intentionally engineered and produced.64
Potential EHS health risks of nanoscale particles in humans and animals depend in part on their
potential to penetrate and accumulate, especially in vital organs such as the lungs and brain. Some
have also expressed concerns about the diffusion of nanoparticles in the environment.65
For
example, several products on the market today contain nanoscale silver, an effective antibacterial
agent used in wound dressings, clothing, cosmetics, and many other consumer products.
However, some scientists have raised concerns that the dispersion of nanoscale silver in the
environment could kill microbes that are vital to ecosystems.
The nanoscale dimensions of some engineered materials may be used for beneficial purposes,
while the size characteristics of other nanoscale materials may render them harmful. For example,
some nanoscale particles have the potential to penetrate the blood-brain barrier, a structure that
protects the brain from harmful substances in the blood. Currently, the barrier hinders the delivery
of therapeutic agents to the brain. The characteristics of some nanoscale materials may allow
pharmaceuticals to be developed to purposefully and beneficially cross the blood-brain barrier
and deliver medicine directly to the brain to treat, for example, a brain tumor. Alternatively, other
nanoscale particles might unintentionally pass through this barrier and harm humans and
animals.66
Many stakeholders believe that concerns about potential detrimental effects of nanoscale
materials and products on EHS—both real and perceived—must be addressed for a variety of
reasons, including the following:
64 Some naturally occurring nanoparticles cause adverse health effects. Studies on the effects of naturally occurring
particles are numerous and inform R&D on engineered nanoparticles. 65 See for example, Lindsay M. Furtado, Mirco Bundschuh, and Chris D. Metcalfe, “Monitoring the Fate and
Transformation of Silver Nanoparticles in Natural Waters,” Bulletin of Environmental Contamination and Toxicology,
July 20, 2016, pp. 1-7; and Gabriele E. Schaumanna, Allan Philippea, and Mirco Bundschuhb, et al., “Understanding
the Fate and Biological Effects of Ag- and TiO2-Nanoparticles in the Environment: The Quest for Advanced Analytics
and Interdisciplinary Concepts,” Science of the Total Environment, Special Issue: Engineered Nanoparticles in Soils
and Waters, vol. 535, December 1, 2015, pp. 3-19. 66 For additional information, see: “Blood-Brain Barrier Breached by New Therapeutic Strategy,” press release,
National Institutes of Health, June 2007; Shahnaz Bakand and Amanda Hayes, “Toxicological Considerations, Toxicity
Assessment, and Risk Management of Inhaled Nanoparticles,” International Journal of Molecular Science, vol. 17, no.
6, June 14, 2016. Seung Rim Hwang and Kwangmeyung Kim, “Nano-Enabled Delivery Systems Across the Blood–
Brain Barrier,” Archives of Pharmacal Research, vol. 37, no. 1, January 2014, pp. 24-30; Malka Shilo, Anat Sharon,
and Koby Baranes, et al., “The Effect of Nanoparticle Size on the Probability to Cross the Blood-Brain Barrier: An In-
vitro Endothelial Cell Model,” The Journal of Nanobiotechnology, November 21, 2014.
Nanotechnology: A Policy Primer
Congressional Research Service 19
protecting and improving human health, safety, and the environment;
enabling accurate and efficient risk assessments, risk management, and cost-
benefit trade-offs;
creating a predictable, stable, and efficient regulatory environment that fosters
investment in nanotechnology-related innovation;
ensuring public confidence in the safety of nanotechnology research,
engineering, manufacturing, and use;
preventing the negative consequences of a problem in one application area of
nanotechnology from harming the use of nanotechnology in other applications
due to public fears, political interventions, or an overly broad regulatory
response; and
ensuring that society can enjoy the widespread economic and societal benefits
that nanotechnology may offer.
Since the initiation of the NNI, public and private research investments have sought to better
characterize nanoscale particles and to better understand their interaction with, and effects on,
living creatures and the environment. Researchers have sought to establish conceptual
frameworks for assessing toxicity risks and informing regulatory decisionmaking given the vast
number of ways that nanoscale particles might interact with biological systems.67
While much
remains unknown and research continues in the field (e.g., the federal government is supporting
$94.1 million in EHS research in FY2016), scientists, engineers, manufacturers, and regulators
now have a broader body of knowledge from which they can draw to minimize potential adverse
effects of nanotechnology. Increasingly precise knowledge of nanoscale characteristics and
interactions in complex systems, and the accumulation of data on exposure to nanoscale materials
under a variety of conditions, combined with the ability to manipulate matter at the nanoscale,
may enable engineers to design around potential dangers to capture the benefits of
nanotechnology while muting its risks.
Nevertheless, leading nanotechnology experts assert that much work remains ahead. A 2014
assessment of the NNI by PCAST criticized the status of nanotechnology EHS as:
(i) a reliance on hazard and risk analysis on a case-by-case basis in spite of the rapid
expansion of the technology; (ii) a paucity of exposure, dosimetry, and lifecycle data
because of the lack of information about materials in the commercial chain, as well as
slow emergence of the instrumentation required to detect [engineered nanomaterial]
exposure under complex biological and environmental conditions; (iii) continued reliance
on descriptive…animal studies (often poorly integrated with cellular and in vitro data) for
regulatory decision making; and (iv) regulations based on [engineered nano materials] as
novel chemical substances which, by way of new use rules and pre-manufacturing
notices, negotiate access to marketplace without a coordinated approach between
Government agencies, industry, and academia.68
67 See, for example, Andre Nel, Tian Xia, and Huan Meng, et al., “Nanomaterial Toxicity Testing in the 21st Century:
Use of a Predictive Toxicological Approach and High-Throughput Screening,” Accounts of Chemical Research, vol.
46, no. 3, January 23, 2012, pp. 607-621; and Hilary Godwin, Catherine Nameth, and David Avery, et al.,
“Nanomaterial Categorization for Assessing Risk Potential To Facilitate Regulatory Decision-Making,” ACSnano, vol.
9, no. 4, March 20, 2015, pp. 3409-3417. 68 Executive Office of the President, President's Council of Advisors on Science and Technology, Report to the
President and Congress on the Fifth Assessment of the National Nanotechnology Initiative, October 2014, pp. 60-61,
https://www.whitehouse.gov/sites/default/files/microsites/ostp/PCAST/pcast_fifth_nni_review_oct2014_final.pdf.
Nanotechnology: A Policy Primer
Congressional Research Service 20
However, PCAST also noted positive trends that may help address current shortcomings:
At the same time, [the current status of nanotechnology EHS] is also characterized by the
emergence of mechanistic and systems-level approaches to assess engineering
nanomaterial safety, instead of just relying only on outdated chemical toxicology study
methods and a growing awareness of the potential utility of alternative test strategies.
These strategies decrease animal use and speed up the rate of discovery and knowledge
generation by relying on more quantitative, mechanistic, and systems-level approaches
that involve high throughput screening, computational modeling, and a variety of
decision analysis approaches to improve regulatory decision-making.69
Policy issues associated with EHS impacts of nanotechnology include the magnitude, timing,
foci, and management of the federal investment in EHS research; the adequacy of the current
regulatory structures to protect public health and the environment; and cooperation with other
nations engaged in nanotechnology R&D to ensure all are doing so in a responsible manner.70
Nanomanufacturing
Securing the potential economic and societal benefits of nanotechnology requires the ability to
translate knowledge of nanoscience into market-ready nanotechnology products.
Nanomanufacturing is the bridge connecting nanoscience and nanotechnology products. Although
some nanotechnology products have already entered the market, these materials and devices have
tended to require only incremental changes in manufacturing processes. Generally, they are
produced in a laboratory environment in limited quantities with a high degree of labor intensity,
high variability, and high costs. To make their way into safe, reliable, effective, and affordable
commercial-scale production in a factory environment may require the development of new and
unique technologies, tools, instruments, measurement science, and standards for
nanomanufacturing.
Several federal agencies support nanomanufacturing R&D focusing on the development of
scalable, reliable, cost-effective manufacturing of nanoscale materials, structures, devices, and
systems. In its FY2014 budget supplement, the NNI reported nanomanufacturing R&D funding of
eight agencies totaling $93.9 million in FY2013, and proposed funding of $100.3 million for
FY2014. In its FY2015 budget supplement, the NNI changed its data collection and reporting
taxonomy, eliminating the Nanomanufacturing program component area. Under the new PCA
taxonomy, nanomanufacturing R&D funding is included in the Nanotechnology Signature
Initiatives PCA under the subcategory “Sustainable Nanomanufacturing: Creating the Industries
of the Futures” and may also be included as part of the figures reported for other PCAs, the
Foundational Research PCA and Nanotechnology-Enabled Applications, Devices, and Systems
PCA in particular. Since the other PCAs are not further parsed, it is not possible to identify total
funding for nanomanufacturing R&D. The President’s FY2017 budget proposes $37.4 million for
the Sustainable Nanomanufacturing initiative in FY2017, an increase of $0.7 million above the
69 Ibid, p. 61. 70 Additional information on nanotechnology EHS research and issues is available at the NNI’s “Environmental,
Health, and Safety Issues” webpage, http://www.nano.gov/you/environmental-health-safety); NSET’s 2014 report,
Progress Review on the Coordinated Implementation of the National Nanotechnology Initiative 2011 Environmental,
Health, and Safety Research Strategy,
http://www.nano.gov/sites/default/files/pub_resource/2014_nni_ehs_progress_review.pdf; and NSET’s 2016 report,
Quantifying Exposure to Engineered Nanomaterials (QEEN) from Manufactured Products—Addressing
Environmental, Health, and Safety Implications,
http://www.nano.gov/sites/default/files/pub_resource/qeen_workshop_report_2016.pdf.
Nanotechnology: A Policy Primer
Congressional Research Service 21
FY2016 level. NSF ($28.4 million, 76% of total proposed funding), NIST ($4.9 million, 13%),
and USDA ($2.5 million, 7%) account for the largest shares of funds requested for the
Sustainable Nanomanufacturing PCA in FY2017.
Nanomanufacturing is also supported by federal agencies through R&D and other activities. For
example, NNI agencies facilitated the establishment of the National Nanomanufacturing Network
(NNN), a network for collaboration and information exchange among the nanomanufacturing
research, development and education community. A partnership between academia, industry, and
government, the NNN seeks to promote U.S. nanomanufacturing through workshops,
roadmapping, inter-institutional collaborations, technology transition, test beds, and information
exchange services. Key elements of the NNN include four NSF-sponsored Nanoscale Science and
Engineering Centers, the DOE Center for Integrated Nanotechnologies, and the NIST Center for
Nanoscale Science and Technology. The NNN is also supported by the University of
Massachusetts (UMass) Amherst Libraries.71
In addition, some agencies seek to advance nanomanufacturing through non-R&D activities. For
example, the National Institute for Occupational Safety and Health is seeking to stave off
potential nanomanufacturing EHS problems by developing and disseminating case studies that
demonstrate the utility of applying “Prevention through Design” principles to
nanomanufacturing.72
In July 2013, the U.S. Government Accountability Office (GAO) held a forum of leading experts
on nanomanufacturing in response to a request from the chairman of the House Committee on
Science, Space and Technology seeking insights on nanomanufacturing’s future, U.S. investments
and competitiveness in nanotechnology R&D, challenges to U.S. competitiveness, ways to
enhance U.S. competitiveness, and EHS implications. In its report on the forum, GAO stated that
participants identified nanomanufacturing as a technological revolution in its formative stages
that many experts believe will bring disruptive innovation, job creation, and diverse societal
benefits, particularly to the nations that are able to compete globally. The report describes
participants views of nanomanufacturing as a megatrend, “affecting many sectors of the economy
and having widely transformative impacts” with economic and societal impact on par with the
digital revolution. Participants identified four areas for federal action: collection and
dissemination of information on international R&D investments; international standards
development; research efforts to address EHS issues; and efforts to advance U.S. competitiveness.
With respect to competitiveness, participants outlined three possible approaches: updating federal
policies aimed at supporting innovation across the economy; use of public-private partnerships to
overcome barriers to innovation; and establishing a national vision and strategy for U.S.
nanomanufacturing.73
71 InterNano, “About the National Nanomanufacturing Network,” http://www.internano.org/nnn, last accessed on
September 9, 2016. 72 For information about Prevention through Design, see the National Institute for Occupational Safety and Health
Prevention through Design website at https://www.cdc.gov/niosh/topics/ptd. 73 U.S. Government Accountability Office, Nanomanufacturing: Emergence and Implications for U.S.
Competitiveness, the Environment, and Human Health, GAO-14-181SP, January 2014,
http://www.gao.gov/assets/670/660591.pdf.
Nanotechnology: A Policy Primer
Congressional Research Service 22
Public Attitudes and Understanding
What the American people know about nanotechnology and their attitudes toward it may affect
the environment for research and development (especially support for public R&D funding),
regulation, market acceptance of products incorporating nanotechnology, and, perhaps, the ability
of nanotechnology to weather a negative event such as an industrial accident.
In the decade following the launch of the NNI in 2000, a number of analyses employed public
opinion surveys, focus groups, and quasi-experimental designs to characterize public
understanding and attitudes toward nanotechnology. In general, the academic research showed a
general consensus that the public believed that the benefits of nanotechnology outweighed the
risks.74
A 2013 analysis concluded that public risk perceptions about nanoparticles are low
compared to other EHS hazards ranking.75
However, during this period, perspectives on nanotechnology risks and the need for regulation
have varied among different groups. For example, a 2015 paper found that while scientists and
the general public were more likely to support regulation of commercial-based nanotechnology
research than academic research, the general public was more supportive of regulating academic
research than were scientists.76
The paper also noted that among the general public, higher levels
of religiosity, a more liberal political ideology, and greater perceptions of risks relative to benefits
correlated to greater levels of support for the regulation of academic and commercial
nanotechnology research. The paper asserted that “media attention had a significant influence on
[public] support for the regulation of commercial nanotechnology research,” and postulated that
this result may be due to increasing media attention to nanotechnology risks versus benefits in the
United States in recent years:
Growing discussions of risk in media, coupled with the increasing number of nano-based
products available on the market, may lead to elevated public concerns over commercial
adaptations of the technology. In turn, lay audiences may see a greater need for regulation
of the industry.77
This finding stands in contrast to a 2007 survey by the Woodrow Wilson International Center for
Scholars Project on Emerging Nanotechnologies (PEN) that found a strong positive correlation
between nanotechnology familiarity/awareness and perceptions that benefits will outweigh risks.
However, the PEN survey also indicated that communicating with the public about
nanotechnology in the absence of clear, definitive answers to EHS questions could create a higher
level of uncertainty, discomfort, and opposition.78
Congress expressed its belief in the importance of public engagement in the 21st Century
Nanotechnology Research and Development Act of 2003 (15 U.S.C. §§7501-7502.). The act calls
for public input and outreach to be integrated into the NNI’s efforts. The NNI has sought to foster
74 David M. Berube, Christopher L. Cummings, and Jordan H. Frith, et al., “Comparing Nanoparticle Risk Perceptions
to Other Known EHS Risks,” Journal of Nanoparticle Research, March 19, 2011. 75 Christopher L. Cummings, David M. Berube, and Mary E. Lavelle, “Influences of Individual-level Characteristics on
Risk Perceptions to Various Categories of Environmental Health and Safety Risks,” Journal of Risk Research, vol. 16,
no. 10, 2013, pp. 1277-1295. 76 Leona Yi-Fan Su, Michael A. Cacciatore, and Dominique Brossard, et al., "Attitudinal Gaps: How Experts and Lay
Audiences Form Policy Attitudes Toward Controversial Science," Science and Public Policy, June 27, 2015, pp. 1-11. 77 Ibid, p. 9. 78 Peter D. Hart Research Associates, Inc., “Awareness of and Attitudes Toward Nanotechnology and Federal
Regulatory Agencies: A Report of Findings,” conducted on behalf of Project on Emerging Nanotechnologies,
Woodrow Wilson International Center for Scholars, September 2007.
Nanotechnology: A Policy Primer
Congressional Research Service 23
public understanding through a variety of mechanisms, including written products, speaking
engagements, a web-based information portal (nano.gov), informal education, and efforts to
establish dialogues with stakeholders and the general public. The NSET subcommittee has
appointed a coordinator for education, engagement, and societal dimensions to track
developments, lead in organizing activities, report periodically to the NSET subcommittee, and
serve as a central point of contact for NNI information on these topics. The NNCO has conducted
webinars for the general public and the nanotechnology research and development community.
Topics covered in the webinars to-date include: NNI activities, roadblocks to nanotechnology
commercialization for small- and medium-size enterprises, nanotechnology and the insurance
industry, teaching nanoscale science and engineering for middle school and high school teachers,
nanotechnology laboratory safety, and technical subjects such as nanoinformatics and
nanosensors.79
Concluding Observations The federal government has made sustained investments in nanotechnology under the NNI since
FY2001. While numerous nanotechnology applications have been incorporated in commercial
products, they have generally offered incremental improvements in product performance.
Proponents assert that nanotechnology has the potential to bring revolutionary products to market,
reshaping existing industries and creating new ones. The federal government’s investments under
the National Nanotechnology Initiative also play important roles in other key science and
technology initiatives as well, including the Advanced Manufacturing Partnership (AMP), the
Networking and Information Technology Research and Development (NITRD) program, and the
Materials Genome Initiative (MGI), the National Cancer Moonshot, and cybersecurity.
The products that emerge from these efforts may bring significant economic and social benefits to
the United States and to the world; however, substantial research, development, and innovation-
related hurdles remain before many of these benefits might be realized. Congress may play an
active role in addressing some or all of these hurdles. The issues Congress may opt to consider
include budget authorization levels for the covered agencies; R&D funding levels, priorities, and
balance across the program component areas; administration and management of the NNI;
translation of research results and early-stage technology into commercially viable applications;
environmental, health, and safety issues; ethical, legal, and societal implications; education and
training for the nanotechnology workforce; metrology, standards, and nomenclature; public
understanding; and international dimensions.
79 The NNCO webinars can be accessed at http://www.nano.gov/PublicWebinars.

Nanotechnology: A Policy Primer
Congressional Research Service 24
Appendix. Members of the NSET Subcommittee As of March 2016, the NSET subcommittee included the following member departments,
agencies, and offices:
Consumer Product Safety Commission†*
Department of Agriculture
Agricultural Research Service†
Forest Service†
National Institute of Food and Agriculture†
Department of Commerce
Bureau of Industry and Security
Economic Development Administration
National Institute of Standards and Technology†
U.S. Patent and Trademark Office
Department of Defense†
Department of Education
Department of Energy†
Department of Health and Human Services
Agency for Toxic Substances and Disease Registry
Food and Drug Administration†
National Institute for Occupational Safety and Health†
National Institutes of Health†
Department of Homeland Security†
Department of the Interior
Department of Justice
Department of Labor
Department of State
Department of Transportation†
Department of Treasury
Environmental Protection Agency†
Intelligence Community
National Aeronautics and Space Administration†
National Science Foundation†
Nuclear Regulatory Commission*
U.S. International Trade Commission*
Office of Science and Technology Policy
Office of Management and Budget
† Indicates a federal department, independent agency, or commission with a budget dedicated
to nanotechnology research and development.
* Indicates an independent commission that is represented on NSET but is non-voting.
Source: NSET Subcommittee, NSTC, EOP, The National Technology Initiative: Supplement to
the President’s FY2017 Budget, March 2016,
http://www.nano.gov/sites/default/files/pub_resource/nni_fy17_budget_supplement.pdf
Nanotechnology: A Policy Primer
Congressional Research Service 25
Author Contact Information
John F. Sargent Jr.
Specialist in Science and Technology Policy
[email protected], 7-9147