Nanostructured Non-oxide Ceramics for Catalytic Applications€¦ · Area Ceramics for Catalytic...
127
Nanostructured Porous High Surface Area Ceramics for Catalytic Applications PhD Thesis In partial fulfillment of the requirements for the academic degree of Doctor rerum naturalium (Dr.rer.nat.) Submitted to The Faculty of Mathematics and Natural Sciences of the Dresden University of Technology by M.Sc.Eng. Piotr Krawiec Born on May 18,1978 in Krasnystaw (Poland) Approved by: Prof. Dr. Stefan Kaskel Prof. Dr. Ferdi Schüth Prof. Dr. Wladimir Reschetilowski Submitted on: August 11,2006. Date of oral examination: December 20, 2006
Transcript of Nanostructured Non-oxide Ceramics for Catalytic Applications€¦ · Area Ceramics for Catalytic...
Nanostructured Porous High Surface
Area Ceramics for Catalytic Applications
PhD Thesis
In partial fulfillment of the requirements
for the academic degree of
Doctor rerum naturalium
(Dr.rer.nat.)
Submitted to
The Faculty of Mathematics and Natural Sciences
of the Dresden University of Technology
by
M.Sc.Eng. Piotr Krawiec
Born on May 18,1978 in Krasnystaw (Poland)
Approved by: Prof. Dr. Stefan Kaskel
Prof. Dr. Ferdi Schüth
Prof. Dr. Wladimir Reschetilowski
Submitted on: August 11,2006.
Date of oral examination: December 20, 2006
Acknowledgements
This work was carried out at the Max-Planck-Institute for Coal Research in Mülheim a.d.
Ruhr in the period of 01.2003 to 03.2004, and at the Dresden University of Technology from
04.2004 to 06.2006. I would like to thank people who have contributed to development of my
work in both institutions:
Prof. Dr. Stefan Kaskel for supervision, discussion and help during the PhD studies
Prof. Dr. Ferdi Schüth and his group for support during my stay in MPI in Mülheim
Prof. Dr. Chia-Min Yang for heplful discussion
Dr. Dorin Geiger, Dr. Paul Simon and Bernd Spliethoff for the TEM measurements
Dr. Claudia Weidenthaler for the XPS measurements
DI Hannelore Dallmann and Inge Schubert for the TG/MS and IR measurements
Alberto Martinez-Joaristi, Michal Sabo, Holger Althues, Emanuel Kockrick and the whole
AK Kaskel for a nice PhD study time both in Dresden and in Mülheim
Special thanks to my Mother and family for their care and support.
2

Contents
Contents Page 1. Motivation 6
2. Introduction 9
2.1. Ordered Mesoporous Materials 9
2.2. Nanocasting of Ordered Mesoporous Materials 18
2.3. Supported Catalysts on Ordered Mesoporous Materials 21
2.4. Silicon Carbide as a Catalyst Support – Advantages and Properties 25
2.5. Transition Metal Nitrides and Carbides - Alternative to Noble Metal Catalysts 27
3. Methods and Experimental Details 30
3.1. Gas Adsorption on Solids as a Tool for the Characterization of Porous Materials 30
3.1.1. Nitrogen Physisorption at 77K 31
3.1.2. Capillary Condensation and Kelvin Equation 32
3.1.3. Isotherm Classification According to IUPAC 34
3.1.4. Specific Surface Area Estimation: Langmuir and BET Theory 36
3.1.5. Statistical Thickness “t-Plot” Method 38
3.2. Low and High Angle X-ray Diffraction 40
3.3. Synthesis Procedures and Experimental Setups 42
3.3.1. Synthesis of Ordered Mesoporous Silica Materials 43
3.3.4. Incorporation of Metals and Metal Oxides into Ordered Mesoporous Silica 46
3.3.2. Chemical Vapor Deposition of SiC in Ordered Mesoporous Silica 44
3.3.3. SiC Inverse Replica of Ordered Mesoporous Silica by Melt Infiltration 45
3.3.5. Nitridation and carbonization of supported vanadium oxides for preparation of supported
nitride and carbide catalysts 47
3.3.6. High Surface Area Nitrides by Foam Procedure 47
3.3.7. Catalytic Tests 48
3

Contents
3.3.8. Instruments and Settings 49
4. Results and Discussion 50
4.1. Nanocasting of SBA-15 for the preparation of Mesoporous Silicon Carbide 51
4.1.1. High Surface Area Mesoporous SiC via Chemical Vapor Infiltration (CVI) 51
4.1.2. Ordered Mesoporous Silicon Carbide (OM-SiC) via Direct Nanocasting of Liquid
Polymer Precursors 64
4.1.3. Conclusions 68
4.2. Incorporation of Metal and Metal Oxide Particles into MCM-41 and SBA-15 via
Efficient In-situ Procedure 70
4.2.1. In-situ Pt-incorporation into MCM-41 Materials 71
4.2.2. In-situ Synthesis of Pd/MCM-41, Pt/SBA-15, and V2O5/MCM-41 75
4.2.3. Pt-catalyzed Template Removal 77
4.2.4. Catalytic Properties: Hydrogenation of Cinnamic Acid 79
4.2.5. Conclusions 80
4.3. Supported Vanadium Nitride and Carbide Catalysts 81
4.3.1. VN/MCM-41 via Nitridation of In-situ Prepared V2O5/MCM-41 Composites 83
4.3.2. Supported VN and VC via Nitridation/Carbonization of V2O5 supported on
Mesoporous Silica and Activated Carbon via Ex-situ Preparation Procedure 88
4.3.3. Propane Dehydrogenation over Supported VN 94
4.3.4. Conclusions 95
4.4. Amine Intercalated Oxide Foams for the Preparation of High Surface Area Transition
Metal Nitride Catalyst 96
4.4.1. High Surface Area Vanadium Nitride 97
4.4.2. Propane Dehydrogenation over High Surface Area Vanadium Nitride Catalysts 100
4.4.3. High Surface Area Ternary V-Mo Nitrides via Foam Procedure 103
4.4.4. Conclusions 109
4

Contents
5. Summary 110
6. Glossary 112
7. References 113
5

Motivation
1. Motivation
Since the discovery of ordered mesoporous silica in 1992[1, 2], many reports were published
on possible applications of those materials in catalysis[3, 4]. One advantage of an ordered pore
structure is a precise control of pore diameter by changing the size of templating molecules, or
addition of swelling agents. Another one is the existence of different pore arrangement
symmetries e.g cubic, lamellar, or hexagonal - affecting the guest molecules mobility and
reactant diffusivity.[3, 5] Before this discovery, ordered porous structures were only known for
crystalline microporous materials like zeolites or macroporous foams with low specific surface
areas. However, the pore size of the M41S family materials (MCM-41 with hexagonal and
MCM-48 with cubic pore symmetry developed by Mobil) was small (2-6 nm) and new
procedures had to be developed to prepare materials with larger pores. Preparation of large
pore silica was especially desired for immobilization of large molecules like enzymes, proteins
and for improving mobility inside the pores.[6] In 1998 Zhao et.al. reported the use of block co-
polymers as templates for the preparation of ordered mesoporous silica materials with 4-30 nm
pore diameter and hexagonal geometry.[7, 8] However, silica is not always considered to be an
optimal support. The low chemical resistance in alkaline conditions, hydrolysis and hydrophilic
surface makes it unattractive for many applications. Therefore similar synthesis procedures
have been developed to prepare other oxides (like TiO2, ZrO2, Al2O3) with ordered
mesoporosity, exhibiting different chemical properties than silica.[9, 10] On the other hand, the
sol-gel syntheses methods are often not suitable for preparation of non-oxide materials. Ryoo
et al. showed that nanocasting of MCM-48 or SBA-15 can be used for preparation of ordered
mesoporous carbons designed as CMK-1 and CMK-3 materials.[11-13] Typically, the source of
carbon is a simple sugar (sucrose) which is carbonized at higher temperatures. The silica
template is removed afterwards by treatment with HF or NaOH and pure carbon material is
obtained. If one goes one step further, also CMK materials can be used as a templates for
nanocasting,[14, 15] especially in the case where silica removal conditions could damage the
product. For example boron nitride can be prepared by nanocasting of CMK-3 and subsequent
removal of carbon matrix in ammonia flow.[16]
This thesis shows that ordered mesoporous silica can be used as hard template for the
preparation of ordered mesoporous silicon carbide (via nanocasting) and as a support for highly
dispersed (catalytically active) species. Ex-situ and in-situ incorporation procedures are also
used in order to incorporate noble metals (like platinum and palladium), vanadium nitride and
vanadium carbide.
6
Motivation
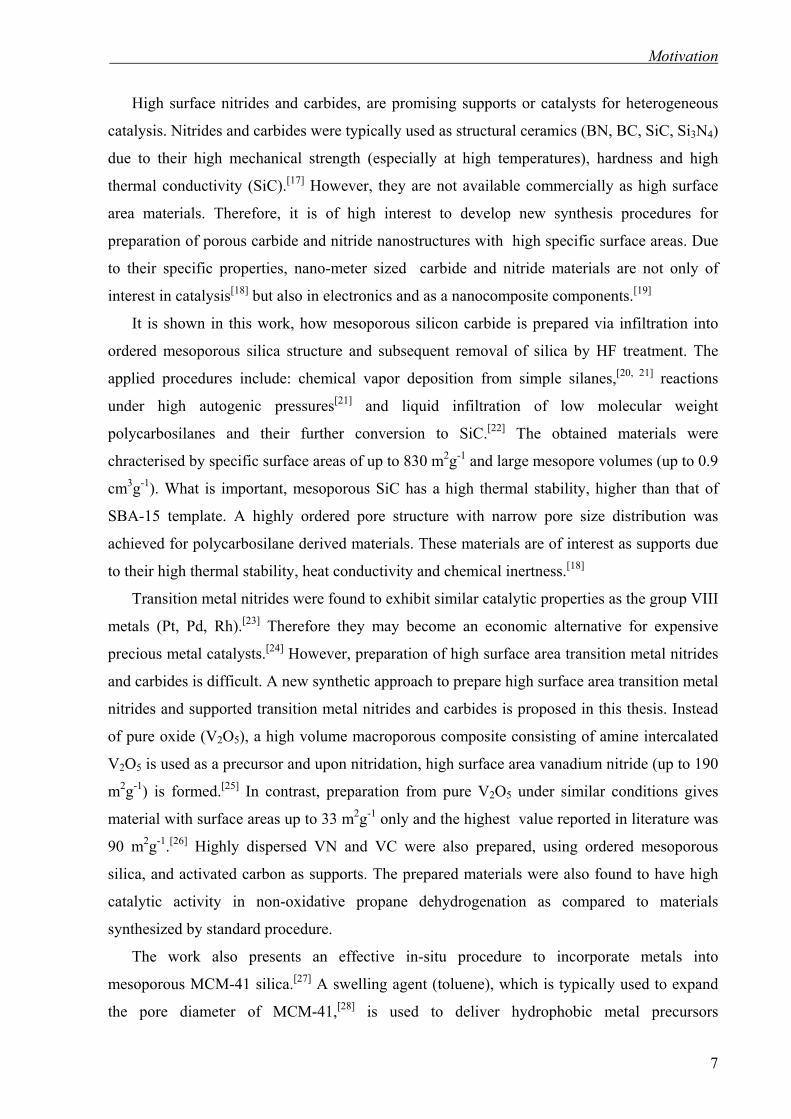
High surface nitrides and carbides, are promising supports or catalysts for heterogeneous
catalysis. Nitrides and carbides were typically used as structural ceramics (BN, BC, SiC, Si3N4)
due to their high mechanical strength (especially at high temperatures), hardness and high
thermal conductivity (SiC).[17] However, they are not available commercially as high surface
area materials. Therefore, it is of high interest to develop new synthesis procedures for
preparation of porous carbide and nitride nanostructures with high specific surface areas. Due
to their specific properties, nano-meter sized carbide and nitride materials are not only of
interest in catalysis[18] but also in electronics and as a nanocomposite components.[19]
It is shown in this work, how mesoporous silicon carbide is prepared via infiltration into
ordered mesoporous silica structure and subsequent removal of silica by HF treatment. The
applied procedures include: chemical vapor deposition from simple silanes,[20, 21] reactions
under high autogenic pressures[21] and liquid infiltration of low molecular weight
polycarbosilanes and their further conversion to SiC.[22] The obtained materials were
chracterised by specific surface areas of up to 830 m2g-1 and large mesopore volumes (up to 0.9
cm3g-1). What is important, mesoporous SiC has a high thermal stability, higher than that of
SBA-15 template. A highly ordered pore structure with narrow pore size distribution was
achieved for polycarbosilane derived materials. These materials are of interest as supports due
to their high thermal stability, heat conductivity and chemical inertness.[18]
Transition metal nitrides were found to exhibit similar catalytic properties as the group VIII
metals (Pt, Pd, Rh).[23] Therefore they may become an economic alternative for expensive
precious metal catalysts.[24] However, preparation of high surface area transition metal nitrides
and carbides is difficult. A new synthetic approach to prepare high surface area transition metal
nitrides and supported transition metal nitrides and carbides is proposed in this thesis. Instead
of pure oxide (V2O5), a high volume macroporous composite consisting of amine intercalated
V2O5 is used as a precursor and upon nitridation, high surface area vanadium nitride (up to 190
m2g-1) is formed.[25] In contrast, preparation from pure V2O5 under similar conditions gives
material with surface areas up to 33 m2g-1 only and the highest value reported in literature was
90 m2g-1.[26] Highly dispersed VN and VC were also prepared, using ordered mesoporous
silica, and activated carbon as supports. The prepared materials were also found to have high
catalytic activity in non-oxidative propane dehydrogenation as compared to materials
synthesized by standard procedure.
The work also presents an effective in-situ procedure to incorporate metals into
mesoporous MCM-41 silica.[27] A swelling agent (toluene), which is typically used to expand
the pore diameter of MCM-41,[28] is used to deliver hydrophobic metal precursors
7

Motivation
(acetylacetonate complexes). The high incorporation (80-100 % yield) of metal and absence of
large particles outside of the pore system makes this short procedure interesting. Moreover, in
the case of Pt containing MCM-41, template removal process was enhanced catalytically by
the metal allowing lower calcinations temperatures.
8
Introduction
2. Introduction
2.1 Ordered Mesoporous Materials
M-41S family
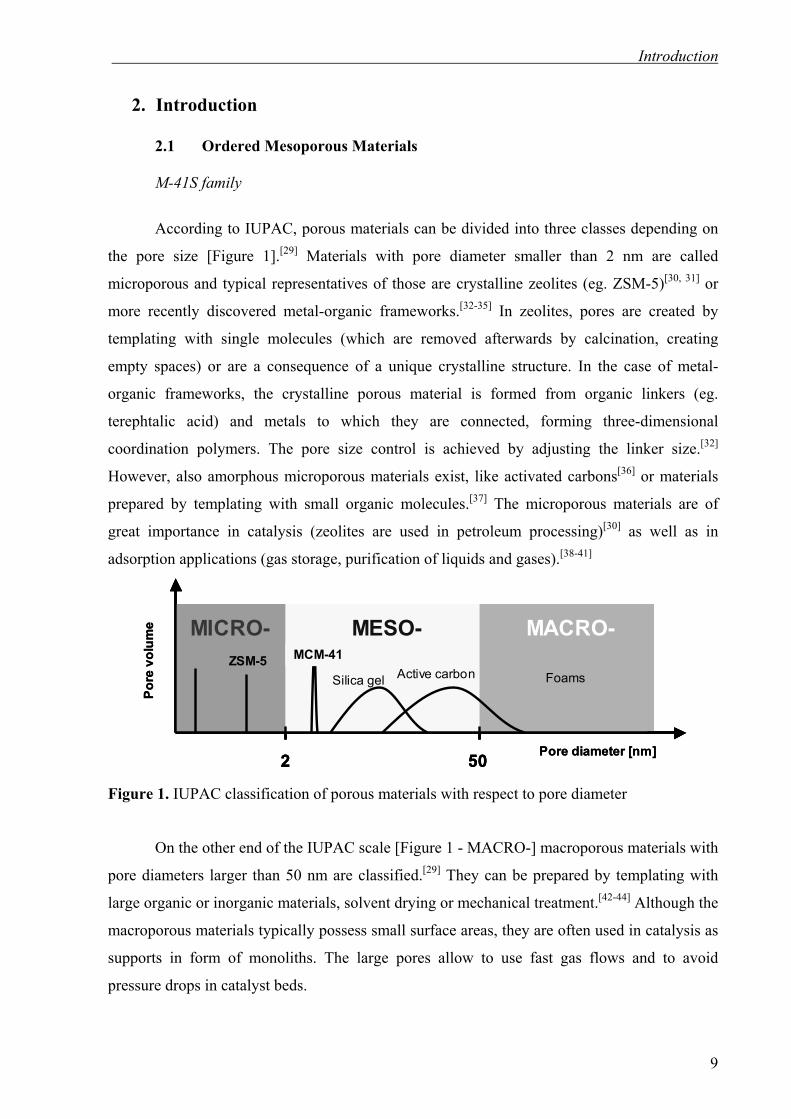
According to IUPAC, porous materials can be divided into three classes depending on
the pore size [Figure 1].[29] Materials with pore diameter smaller than 2 nm are called
microporous and typical representatives of those are crystalline zeolites (eg. ZSM-5)[30, 31] or
more recently discovered metal-organic frameworks.[32-35] In zeolites, pores are created by
templating with single molecules (which are removed afterwards by calcination, creating
empty spaces) or are a consequence of a unique crystalline structure. In the case of metal-
organic frameworks, the crystalline porous material is formed from organic linkers (eg.
terephtalic acid) and metals to which they are connected, forming three-dimensional
coordination polymers. The pore size control is achieved by adjusting the linker size.[32]
However, also amorphous microporous materials exist, like activated carbons[36] or materials
prepared by templating with small organic molecules.[37] The microporous materials are of
great importance in catalysis (zeolites are used in petroleum processing)[30] as well as in
adsorption applications (gas storage, purification of liquids and gases).[38-41]
Pore diameter [nm]
MICRO- MESO- MACRO-
2 50
ZSM-5 MCM-41
Silica gel Active carbon Foams
Pore
vol
ume
Pore diameter [nm]
MICRO- MESO- MACRO-
2 50
ZSM-5 MCM-41
Silica gel Active carbon Foams
MICRO- MESO- MACRO-
2 50
ZSM-5 MCM-41
Silica gel Active carbon Foams
Pore
vol
ume
Figure 1. IUPAC classification of porous materials with respect to pore diameter
On the other end of the IUPAC scale [Figure 1 - MACRO-] macroporous materials with
pore diameters larger than 50 nm are classified.[29] They can be prepared by templating with
large organic or inorganic materials, solvent drying or mechanical treatment.[42-44] Although the
macroporous materials typically possess small surface areas, they are often used in catalysis as
supports in form of monoliths. The large pores allow to use fast gas flows and to avoid
pressure drops in catalyst beds.
9

Introduction
Materials with a pore diameter in between 2 and 50 nm are assigned as mesoporous.
They are of great interest due to their large specific surface areas and larger pore diameters
than in the case of microporous materials. The latter is extremely important in processing or
immobilization of large molecules where microporous substances have often too small pore
diameters to host large molecules (eg. enzymes) or cause diffusion limitations.[6, 45]
Mesoporous materials are typically synthesized as aerogels, xerogels (oxides) or as activated
carbons with disordered pore. The main disadvantage of these methods is that typically
materials with broad pore size distribution [Figure 1 – silica gel, active carbon] and moderate
surface areas are prepared.
In 1992 scientists from Mobil Co. synthesized for the first time ordered mesoporous
silica materials (M41S) with a very narrow pore size distribution.[1] The expression “ordered”
was referred to the 3-dimensional pore ordering, since pore walls of such materials are
amorphous. Unlike in zeolites where single molecules are used as templates, in the case of
M41S family self assembled molecular aggregates or supramolecular assemblies are used as
the structure directing agents. However, different mechanisms of formation are proposed, from
templating of already existing liquid crystal assemblies (true liquid crystal templating) to
formation of ordered structures from disordered surfactant micelles solutions (cooperative self
assembly) [Figure 2].
Figure 2. Two possible pathways for the liquid crystal templating mechanism. (1) True liquid crystal templating (2) Cooperative self assembly[1]
Already in the first report[1, 2] materials with hexagonal, cubic (space group: Ia3d) and
lamellar symmetry of pore ordering were prepared by using ionic surfactants as templates or
structure directing agents [Figure 3]. The influence of chemical composition (surfactant to
silicon ratio, water concentration - Figure 4Figure 4) as well as geometrical dimensions of
10

Introduction
templating molecules were found to play a crucial role in the formation of different 3-
dimensional pore structures [Figure 5].
MCM-41Hexagonal
p6m
MCM-48Cubic
Ia3d
MCM-50Lamellar
p2
MCM-41Hexagonal
p6m
MCM-48Cubic
Ia3d
MCM-50Lamellar
p2
Figure 3. Ordered mesoporous silica materials with different symmetry of pore ordering synthesized by Mobil Co.[1]
Figure 4. Influence of chemical composition for a given synthesis procedure on the symmetry of pore ordering[46]
The so called effective surfactant packing parameter g (g=V/aol) was proposed to
predict the structure formation [Figure 5].[47-49] Different 3D pore arrangements can be easily
identified on the basis of low angle X-ray diffractograms [Chapter 3.2] or by analysis of
crystallographic lattice planes in transmission electron micrographs.
g = V/a0l
Effective packing parameter:
g micelle shape predicted mesophase
<1/3 spherical cubic (Pm3n)1/3-1/2 cylindrical hexagonal (p6m)1/2-2/3 flexible bilayer cubic (Ia3d)2/3-1 planar bilayer lamellar (p2)
g = V/a0l
Effective packing parameter:
g micelle shape predicted mesophase
<1/3 spherical cubic (Pm3n)1/3-1/2 cylindrical hexagonal (p6m)1/2-2/3 flexible bilayer cubic (Ia3d)2/3-1 planar bilayer lamellar (p2)
Figure 5. Surfactant geometry and its influence on the micelle shape as well as on the predicted mesophase ordering (the latter depends also strongly on the synthesis conditions). a0 is a head group surface area (l) hydrophobic chain length and (v) its volume.[47-49]
11
Introduction
Several reviews were published concerning the mechanisms of formation (liquid crystal
templating [Figure 2 – 1] and cooperative self-assembly [Figure 2 – 2])[4, 5, 50] as well as
possible applications of such materials (especially in catalysis as support and for preparation of
other high surface area materials via nanocasting).[3, 51] Recently, also preparation of ordered
mesoporous silica with chiral pore structure by using chiral surfactant molecules as template
was reported.[52]
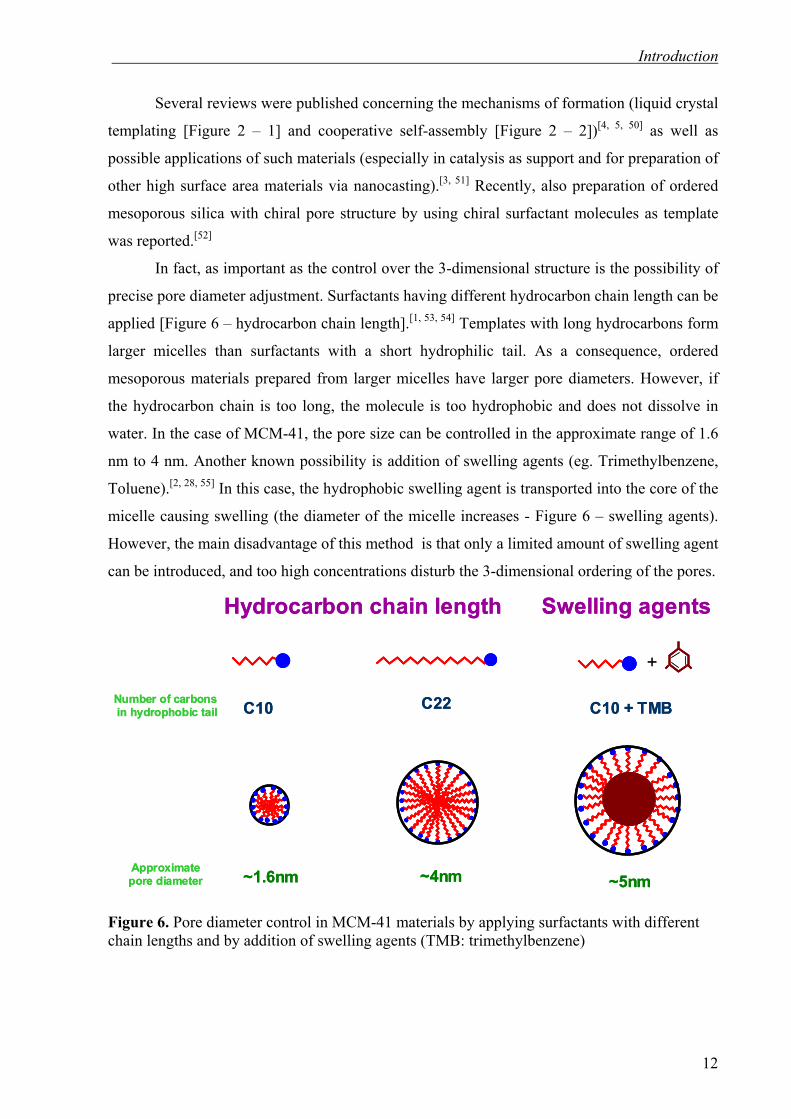
In fact, as important as the control over the 3-dimensional structure is the possibility of
precise pore diameter adjustment. Surfactants having different hydrocarbon chain length can be
applied [Figure 6 – hydrocarbon chain length].[1, 53, 54] Templates with long hydrocarbons form
larger micelles than surfactants with a short hydrophilic tail. As a consequence, ordered
mesoporous materials prepared from larger micelles have larger pore diameters. However, if
the hydrocarbon chain is too long, the molecule is too hydrophobic and does not dissolve in
water. In the case of MCM-41, the pore size can be controlled in the approximate range of 1.6
nm to 4 nm. Another known possibility is addition of swelling agents (eg. Trimethylbenzene,
Toluene).[2, 28, 55] In this case, the hydrophobic swelling agent is transported into the core of the
micelle causing swelling (the diameter of the micelle increases - Figure 6 – swelling agents).
However, the main disadvantage of this method is that only a limited amount of swelling agent
can be introduced, and too high concentrations disturb the 3-dimensional ordering of the pores.
C10 C22 C10 + TMB
~1.6nm ~4nm ~5nm
+
Hydrocarbon chain length Swelling agents
Approximatepore diameter
Number of carbons in hydrophobic tail C10 C22 C10 + TMB
~1.6nm ~4nm ~5nm
+
Hydrocarbon chain length Swelling agents
Approximatepore diameter
Number of carbons in hydrophobic tail
Figure 6. Pore diameter control in MCM-41 materials by applying surfactants with different chain lengths and by addition of swelling agents (TMB: trimethylbenzene)
12

Introduction
SBA-15 type materials synthesized from block copolymers
In 1998 Zhao et al. reported the synthesis of a new ordered mesoporous silica (called
SBA-15) with hexagonal symmetry and large pores of 4 to 30 nm in diameter.[7, 8] Instead of
ionic surfactants, non-ionic block co-polymers were used as templates [Figure 7]. In one
molecule ethylene oxide (EO)n monomer blocks are separated by a block of propylene oxide
(PO)n. The hydrophobic core of the micelles formed from such polymers is composed of
hydrophobic PO part, while hydrophilic EO blocks are pointing outwards. Such micelles have
significantly larger dimensions (4-30 nm diameter) than the ones created from ionic surfactants
(1.5-4 nm) [Figure 7]. Typically a block-copolymer with the composition EO70PO20EO70
(Pluronic P123) was used: and the resulting material with hexagonal arrangement of pores was
called SBA-15.
M41S – familyMCM-41, MCM-48, MCM-50
SBA-15
[EO]n [EO]n[PO]n
CH2
CH2
O* n
* CH2
CH
O* *n
CH3
CH2
CH2
O* *n
Ionic surfactant
N+
CH3
CH3
CH3
Br
Nonionic surfactant
M41S – familyMCM-41, MCM-48, MCM-50
SBA-15
[EO]n [EO]n[PO]n
CH2
CH2
O* n
2-4nm4-30nm
* CH2
CH
O* *n
CH3
CH2
CH2
O* *n C
H2
CH2
O* n
* CH2
CH
O* *n
CH3
CH2
CH2
O* *n
Ionic surfactant
N+
CH3
CH3
CH3
Br
Nonionic surfactant
2-4nm4-30nm
Figure 7. Templating molecules used in M41S family (cationic surfactant) and in SBA-15 (non-ionic block co-polymer) materials syntheses and corresponding shape and size of the micelles.
According to Kleitz et al., one can obtain cubic Ia3d pore symmetry (KIT-6 which is a
large pore analog of MCM-48) by adding co-surfactants like n-butanol [56] or cubic, cagelike
pores (SBA-16) which were also obtained originally by Zhao by employing F127
(EO106PO70EO106) block copolymers.[8] However, beside differences in pore diameter (as
compared to M41S family) these materials had also different pore wall structure. As
13

Introduction
investigated by Galarneau et. al. block copolymer derived mesoporous silica exhibited
significant amount of microporosity.[57] The latter is due to the specific behaviour of non-ionic
surfactants.[58] Non-ionic micelles in water are surrounded by a corona of hydrated
polyethylene oxide (PEO), pointing out around 1 nm from the micelle surface.[59] When
isotropic micellar solution is formed, the repulsion between opposite combs of hydrated PEO
chains separates the micelle to a distance of 3-4 nm [Figure 8]. PEO chains pertaining to
adjacent micelles do not share their hydration shells. However, by increasing the temperature,
the PEO chain becomes less hydrophilic and withdraws on the micelle surface, and
intermicellar attractions arise from PEO-PEO interactions between adjacent micelles [Figure
8].
PPO
T > 80oCPEO
1nm
3-4 nm
PPO
T > 80oCPEO
1nm
3-4 nm
Figure 8. Schematic representation of micelle dehydration upon temperature[57]
The evolution of SBA-15 with the synthesis temperature closely corresponds to this
pattern. In all syntheses, the first performed step is a day-long aging at 35 oC . At this
temperature silica triggers the formation of a composite mesophase from the isotropic
surfactant solution present in the absence of silica.[60] Ordered mesoporous SBA-15 materials
are the result of the restructuring of this precursor formed at low temperature by secondary heat
treatment at higher temperatures . In the case of materials synthesized below 60 oC, there is
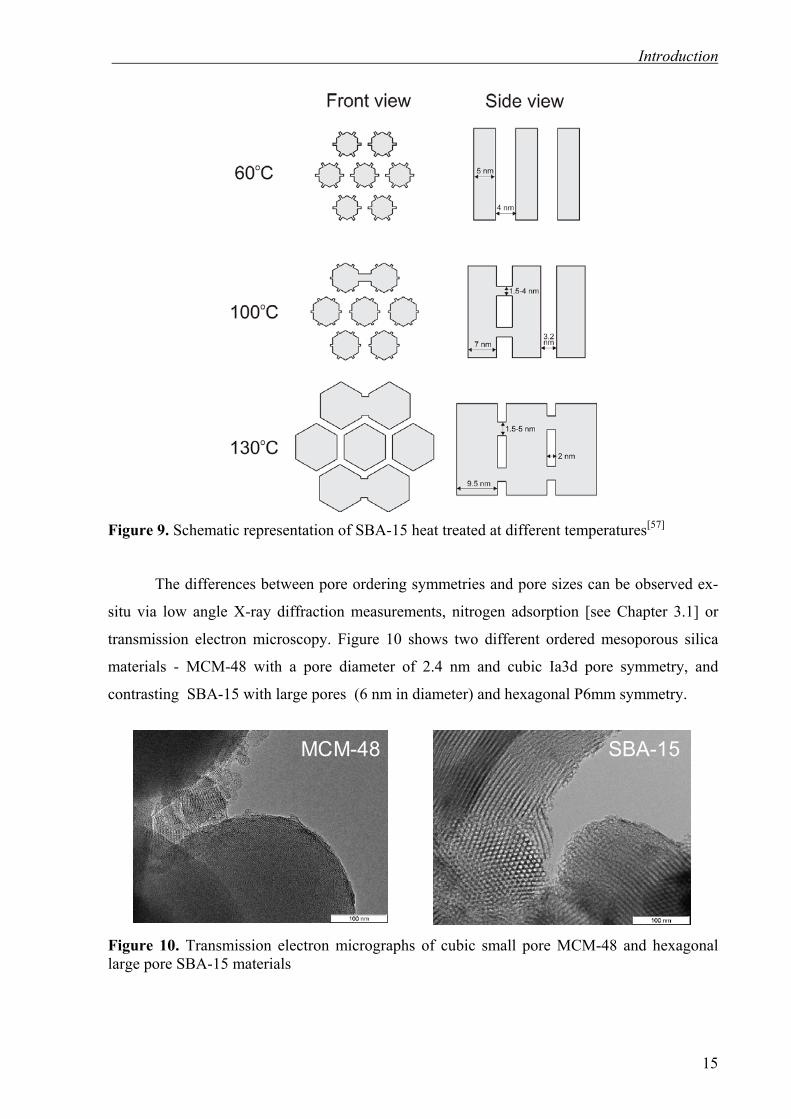
observed microporosity in the pore walls and a wall thickness of around 4 nm [Figure 9]. If the
temperature of treatment is increased to 100 oC or 130 oC, the pore size increases (as the
micelle diameter increases), and pore wall becomes thinner (2 nm). At the same time, the
micropores increase in diameter and form opened connections between the mesopores [Figure
9].[57]
14
Introduction
Figure 9. Schematic representation of SBA-15 heat treated at different temperatures[57]
The differences between pore ordering symmetries and pore sizes can be observed ex-
situ via low angle X-ray diffraction measurements, nitrogen adsorption [see Chapter 3.1] or
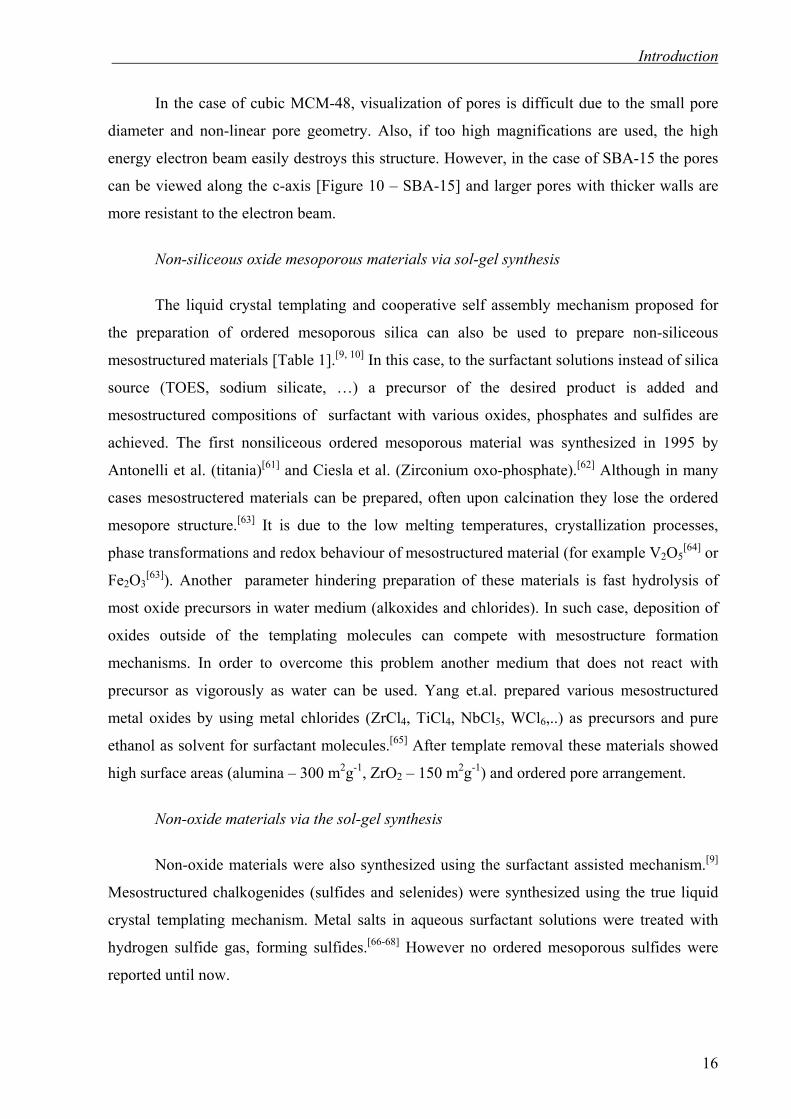
transmission electron microscopy. Figure 10 shows two different ordered mesoporous silica
materials - MCM-48 with a pore diameter of 2.4 nm and cubic Ia3d pore symmetry, and
contrasting SBA-15 with large pores (6 nm in diameter) and hexagonal P6mm symmetry.
MCM-48 SBA-15MCM-48 SBA-15
Figure 10. Transmission electron micrographs of cubic small pore MCM-48 and hexagonal large pore SBA-15 materials
15
Introduction
In the case of cubic MCM-48, visualization of pores is difficult due to the small pore
diameter and non-linear pore geometry. Also, if too high magnifications are used, the high
energy electron beam easily destroys this structure. However, in the case of SBA-15 the pores
can be viewed along the c-axis [Figure 10 – SBA-15] and larger pores with thicker walls are
more resistant to the electron beam.
Non-siliceous oxide mesoporous materials via sol-gel synthesis
The liquid crystal templating and cooperative self assembly mechanism proposed for
the preparation of ordered mesoporous silica can also be used to prepare non-siliceous
mesostructured materials [Table 1].[9, 10] In this case, to the surfactant solutions instead of silica
source (TOES, sodium silicate, …) a precursor of the desired product is added and
mesostructured compositions of surfactant with various oxides, phosphates and sulfides are
achieved. The first nonsiliceous ordered mesoporous material was synthesized in 1995 by
Antonelli et al. (titania)[61] and Ciesla et al. (Zirconium oxo-phosphate).[62] Although in many
cases mesostructered materials can be prepared, often upon calcination they lose the ordered
mesopore structure.[63] It is due to the low melting temperatures, crystallization processes,
phase transformations and redox behaviour of mesostructured material (for example V2O5[64] or
Fe2O3[63]). Another parameter hindering preparation of these materials is fast hydrolysis of
most oxide precursors in water medium (alkoxides and chlorides). In such case, deposition of
oxides outside of the templating molecules can compete with mesostructure formation
mechanisms. In order to overcome this problem another medium that does not react with
precursor as vigorously as water can be used. Yang et.al. prepared various mesostructured
metal oxides by using metal chlorides (ZrCl4, TiCl4, NbCl5, WCl6,..) as precursors and pure
ethanol as solvent for surfactant molecules.[65] After template removal these materials showed
high surface areas (alumina – 300 m2g-1, ZrO2 – 150 m2g-1) and ordered pore arrangement.
Non-oxide materials via the sol-gel synthesis
Non-oxide materials were also synthesized using the surfactant assisted mechanism.[9]
Mesostructured chalkogenides (sulfides and selenides) were synthesized using the true liquid
crystal templating mechanism. Metal salts in aqueous surfactant solutions were treated with
hydrogen sulfide gas, forming sulfides.[66-68] However no ordered mesoporous sulfides were
reported until now.
16

Introduction
Porous nitrides and imides were prepared by employing alkylamines and alkylimides in
non-aqueous medium by ammonia treatment. However, the final material was microporous and
disordered.[69] On the other hand, mesoporous silicon nitride can also be prepared from cheap
silicon halides without the presence of surfactants. Upon the ammonolysis, ammonium halide
nanocrystals are formed and are subsequently removed by calcination in ammonia, causing the
porosity of final silicon nitride product. By proper choice of the hydrocarbon and silicon
halide, the pore sizes can be adjusted in a similar range as for ordered mesoporous silica. [70, 71]
Mesostructured noble metals were prepared by true liquid crystal templating
mechanism by Attard and Goltner.[72] The lyotropic liquid crystalline phase was loaded with
the metal precursor ion and reduced with less noble metals or hydrazine. The surfactant was
removed by washing in acetone, water and HCl. The pore size was found to be of around 3nm
with relatively thick walls, and due to the relatively high density of noble metals, materials
with low specific surface areas were obtained (20 m2g-1).
Table 1. Examples of non-siliceous ordered mesoporous oxide materials synthesized via sol-gel syntheses (mostly based on the review article of Schüth F.)[9]
Composition Structure
Al2O3 H,D TiO2 C,H,L, D Ti-oxophosphate H,D ZrO2 C,H,L,D Zr-oxophosphte H HfO2 D V2O5 H,L,D V-P-oxide C,H,L Nb2O5 H,D Ta2O5 H MoO3 L Mn-oxide H,L ReO2 D Fe2O3 L CoO L NiO L ZnO L HznPO4 L Y2O3 H,L Rare earth metal oxides H,L,D
*C=cubic, H=hexagonal, L=lamellar and D=disordered symmetry of pore ordering. Materials marked in red are
synthesized as mesoporous or otherwise as mesostructured.
17

Introduction
2.2 Nanocasting of Ordered Mesoporous Materials
In the previous chapter, the synthesis of mesostructured materials by liquid crystal
templating was discussed. However, already existing ordered mesoporous hard templates can
also be used for the preparation of other ordered mesoporous structures. In 1999, Ryoo et al.
showed that mesoporous silica can be used as a matrix for preparing ordered mesoporous
carbons.[11] In this procedure sucrose was infiltrated from water solution into the pores,
polymerized (in presence of sulfuric acid) and carbonized at 900 oC to form carbon. After
dissolving the silica in aqueous HF solution, an inverse carbon replica of MCM-48 (named
CMK-1) or SBA-15 (named CMK-3) can be prepared. CMK materials possess even higher
specific surface area (up to 1800 m2g-1) as compared to the matrix (up to 1400 m2g-1). It can be
due to the differences in density of both materials and presence of micropores in the walls of
ordered mesoporous carbons. However, not all materials are suitable for preparation of ordered
inverse carbon replicas. Typically, all cubic 3-dimensional structures can be replicated (MCM-
48,[11] KIT-6,[56] and SBA-16[73]) to give ordered carbon materials. In the case of materials with
one dimensional pore systems (like MCM-41 and SBA-15) the possibility of carbon replica
preparation depends on the mesopore system connectivity through the silica walls. The
mesopores in MCM-41 are not connected and therefore no ordered replica can be synthesized
(only disordered carbon rods can be achieved)[Figure 11].
MCM-48
MCM-41
SBA-15
CMK-1
CMK-3
C
C
C
MCM-48/
MCM-41/
SBA-15/
Silica matrix Matrix / Silicacomposite
Carbon
MCM-48
MCM-41
SBA-15
CMK-1
CMK-3
C
C
C
MCM-48/
MCM-41/
SBA-15/
Silica matrix Matrix / Silicacomposite
Carbon
Figure 11. Preparation of carbon replica of ordered mesoporous silica[13]
18

Introduction
On the other hand, in the case of SBA-15 (with one dimensional hexagonal pore
structure) it is possible to form an inverse replica of this material [Figure 11]. The decisive fact
is the presence of microporous connections between the mesopores of SBA-15 synthesized at
higher temperatures [see Chapter 2.1]. In the nanocasting process these connections (as well as
the mesopores) are filled with carbon and after the removal of silica they connect the rods,
synthesized inside the mesopores [Figure 11]. As in the case of MCM-48 and CMK-1, it can be
seen that the symmetry of the silica matrix does not always correspond to the symmetry of
carbon material prepared from it. This concerns materials with two independent 3-dimensional
pore channels, not connected by micropores. Recently Kim et al. showed how the structural
transformation of CMK-8 carbon replica takes place when pore connectivity decreases in KIT-
6 materials. If one uses KIT-6 prepared at high temperatures (130 oC – where mesopores are
well connected via micropores, as in the case of SBA-15), the carbon replica has the same Ia3d
pore symmetry. However, if the temperature of KIT-6 synthesis is decreased (the wall
thickness increases and micropores are no longer connecting mesopores), the carbon replica
gradually transforms into I4132 symmetry [Figure 12], typical of CMK-1 materials synthesized
from MCM-48.[74]
0.5 1.0 1.5 2.0 2.5 3.00.5 1.0 1.5 2.0 2.5 3.0
Figure 12. Powder XRD patterns of cubic ordered mesoporous carbons prepared from Ia3d cubic KIT-6 silica synthesized at different temperatures. The sample prepared from silica synthesized at 403 K preserves Ia3d symmetry, while the sample prepared from silica synthesized at 308 K transforms into I4132[74]
19

Introduction
Also oxide inverse replicas of ordered mesoporous silica can be obtained. For example,
preparation of mesoporous CeO2, Co3O4 via nanocasting of ordered mesoporous silica was also
reported by the Ryoo and Schüth group.
Another important fact is that carbon replicas can be composed not only of the nano-
rods, but also synthesis of ordered carbon nanotubes inside the pores of ordered mesoporous
silica is possible [Figure 13].[75-77] Such nanotubes possess much higher specific surface areas
up to 2200 m2g-1 and can be used for ultrahigh dispersions of noble metal particles. Preparation
of nanotubes is achieved by aluminium catalyzed furfuryl alcohol polymerization. The
aluminium is first grafted on SBA-15 walls and then furfuryl alcohol is introduced and
polymerized in layers on acidic aluminium sites. In the next step, the polymerized alcohol is
carbonized at high temperature (900 oC) and the silica matrix is removed by HF treatment.
Figure 13. Ordered nanoporous carbon obtained by template synthesis. a) TEM micrograph along the pore b) Schematic model for the carbon structure[75]
Ordered mesoporous carbons can also be used as matrices for preparation of other
ordered mesoporous materials. This was demonstrated first by Kang et.al. and Lu et.al., where
CMK-3 was used for preparation of ordered mesoporous silica NCS-1.[14, 78] In principle, this
approach can also be used for preparation of other oxides (like MgO) and non-oxide
materials.[15] Recently, also ordered mesoporous boron nitride ceramics were prepared by
infiltration of a preceramic precursor into CMK-3 matrix and its subsequent removal in
ammonia flow.[16]
This work investigates preparation of ordered mesoporous silicon carbide using ordered
mesoporous silica as template. The used methods included chemical vapor deposition,[20, 21]
high temperature autogenic pressure reactions[21] and polycarbosilanes infiltration[22]. Silicon
carbide has several interesting properties (hardness, high thermal conductivity and thermal
stability – see Chapter 2.4) rendering SiC as a promising support for catalysts.
20

Introduction
2.3 Supported Catalysts on Ordered Mesoporous Materials
Pt in ordered mesoporous silica as an example of various preparation techniques
In the previous chapters, preparation of ordered mesoporous materials with silica or
carbon composition was discussed. Although silica and carbon materials are relatively inert
and do not act as catalysts they are often used as a support for catalytically active species.[3]
Preparation of supported materials can be in principle divided into in-situ and ex-situ methods.
The differences between both of them are discussed on the example of platinum supported on
MCM-41 or SBA-15. In the ex-situ method [Figure 14 – ex-situ] the porous material is first
synthesized and then subsequently metal particles (or their precursors) are introduced inside
the pores.
Figure 14. Preparation methods of platinum containing MCM-41 catalysts
21

Introduction
This was typically made by the incipient wetness (saturated solution was added in amount
which more or less corresponded to the mesopore volume of the material) or wet impregnation
(mesoporous material suspended in low concentration solution) [Figure 14 – 5], where solution
of metal precursor was introduced on the mesoporous silica powder, followed by solvent
removal and reduction of Pt salt or complex to metallic platinum.[79-81] On the other hand, the
catalyst could also be introduced by surface functionalization [Figure 14 – 6]. In such case, the
catalyst was directly bound to the Si-OH groups on the surface or bi-functional molecules were
used (one active group was bound to the Si-OH groups on the surface while the second group
acted as catalyst).[82-84] Another chemically active group could also be functionalized already
inside the pores via different chemical methods (exchange or chemical reaction). The grafting
method allowed to introduce catalytic species exclusively on the pore walls without their
deposition outside. Also, direct infiltration by CVD or PVD processes was investigated for the
preparation of gold nanoparticles inside mesoporous silica.[85] As prepared platinum
nanoparticles with a proper diameter could also be injected by ultrasonication into mesoporous
silica [Figure 14 – 4].[86]
As an alternative to ex-situ methods, also in-situ preparations were used [Figure 14 –
in-situ]. In this case already during the preparation, platinum or a platinum precursor was
introduced [Figure 14 – In-situ]. Typically, water soluble platinum salts could be dissolved in
the surfactant solution from which porous silica was prepared [Figure 14 – 1]. However, in this
case, low quantities of metal were incorporated and the residues remained in the solution, as
well as large particles could be detected outside the pore system.[81, 87, 88] The nanoparticles
could also be prepared separately, covered with hydrophobic polymer and injected into the
surfactant micelles before addition of silica source [Figure 14 – 2].[89-91] Such process required
multiple preparation steps, and already at 1 wt% loading the pore ordering was significantly
disturbed. In this work, the possibility of injecting a hydrophobic precursor (like Pt(acac)2) into
the micelle core by dissolving in non-polar solvent (toluene) was investigated [Figure 14 – 3].
The main advantage of this method was a high degree of incorporation of the metal (80-100
%), and particles located exclusively inside the MCM pore structure.[27] On the other hand,
only limited amounts of the swelling agent could be used, due to the loss of periodicity or
phase separation.
As shown in the Figure 14, platinum formed particles or rods inside the pores.
However, also coverage of the walls with this metal was possible. Using the same precursor,
Yamada el al. showed how the dispersion of platinum could be controlled by applying different
temperature/radiation treatments [Figure 15].[92] As expected, in the case of high temperature
22

Introduction
aging, nanosized particles with a diameter slightly smaller than the pore diameter were formed
[Figure 15 (a)]. However, if instead of the temperature treatment , γ-radiation was used,
platinum was uniformly dispersed on the mesoporous silica walls and no larger particles were
observed in the pores [Figure 15 (b)].
Aging (a)
Aging (b)
SBA-15
SBA-15Pt-T
SBA-15Pt-R
Pt
Surface Modification
Pt(NH3)4(OH)2solution
γ-ray
Aging (a)
Aging (b)
SBA-15
SBA-15Pt-T
SBA-15Pt-R
Pt
Surface Modification
Pt(NH3)4(OH)2solution
γ-ray
Figure 15 Influence of the postsynthetic treatment on the platinum morphology inside SBA-15. (a) Material is thermally treated and Pt particles are formed, while in (b) material is subjected to γ-radiation covering of SBA-15 walls with a platinum layer is achieved[92]
Metals, metal oxides and metal sulfides particles supported on ordered mesoporous
materials
Ex-situ preparation procedures can be used to support other compounds on the ordered
mesoporous materials. Supported metals like Pd, Rh, Au, Co, Ni as well as their alloys, were
extensively studied for the heterogeneous oxidation or hydrogenation reactions.[3, 84, 93-99] Metal
oxides like ZrO2, Fe2O3, Cs2O, MgO, Ga2O3, In2O3, Y2O3 as well as heteropoly acids and
isoployanions (W10O324-, Mo7O24
6-) were successfully supported on the ordered mesoporous
silica.[3, 100-104] Interestingly, a change in the phase transformation temperatures can be
observed for some of the confined species. For example, tetragonal ZrO2 is typically
transformed into monoclinic ZrO2 at 450 oC. However, in the case of ZrO2 materials confined
in the SBA-15, no phase transformation was observed, even at 900 oC.[105] The size of the
domains has also a large influence on the magnetic properties of compounds.
Superparamegnetic Fe2O3 was synthesized inside MCM-41 materials[106]. Transition metal
23

Introduction
sulfides like WS2 and MoS2 were supported on SBA-15 and found to be catalytically active in
hydrodesulfurization reactions.[107, 108]
The same approach can be used to support particles on ordered mesoporous carbons. In
contrast to silica materials, extraordinary high dispersions of metal were achieved on the nano-
pipe structure of the CMK-5 material. Such materials showed superior performance in the O2
reduction in a fuel cell setup as compared to the standard catalyst.[75]
Highly dispersed species incorporated into the silica network, hybrid materials
Similar to zeolites, ordered mesoporous materials can also incorporate different atoms
into the silica framework.[3] Especially incorporation of Al into MCM-41 in order to obtain
highly acidic materials was of great interest. Theoretically, such materials could be very useful
in the fluidized catalytic cracking catalysis of bulky molecules.[109] However, incorporation of
Al atoms into ordered meosporous silica structure yields materials with the low hydrothermal
stability and acidity lower than that of the zeolites.[3, 110-112] On the other hand, cracking
reactions of bulk molecules under mild conditions and fine chemical syntheses dealing with
large molecules were still found to be effective on this kind of materials. Beside Al also other
heteroatoms like B, Fe, Ga, Ti, V and Sn can modify the silica wall structure or wall surface.[3]
They can be introduced via surface grafting, ion-exchange or during the synthesis via the in-
situ procedure. Grafting procedures allow also to fix larger molecules or complexes inside the
mesopores.
Ordered mesoporous bioactive glasses with the SiO2-P2O5-CaO composition were
prepared by Yan et al.[113-115]. More recently[116] also the group of Stucky reported the synthesis
of mesoporous cements showing rapid formation of apatite.
Periodic mesoporous organosilicas (PMOs) can be prepared by co-condesation of
functionalized alkoxysilanes in presence of surfactants.[117] The organic functional groups, like
methylene, ethylene, phenylene, vinylene or benzene are used.[118-122] After synthesis,
templating molecules are typically removed in mild conditions (solvent extraction) in order to
avoid burning of organic groups during the high temperature calcinations process.
24

Introduction
2.4 Silicon Carbide as a Catalyst Support – Advantages and Properties
Silicon carbide has several interesting properties such as excellent heat conductivity,
hardness and high temperature mechanical stability [Table 2].[17] SiC was widely studied as a
dense ceramic[123, 124] and used for the preparation of composite materials.[125, 126] Especially the
preparation of nano-sized silicon carbide received considerable attention in the context of
preparation of bulk materials with increased plasticity[127] or nano-composites with enhanced
mechanical and tribological properties.[19] Due to its chemical inertness it was also proposed to
be an interesting catalyst support,[18] with unusual high temperature chemical and mechanical
stability as compared to other ceramics. Although the stability of high surface area silicon
carbide under oxidizing conditions at higher temperatures was found to be low due to the
passivation of the surface, under inert conditions the material retained a high surface area for
longer duration.[128] Several reports were published, showing that this material effectively
competes with conventional supports, such as alumina, silica or activated carbons, especially in
exothermic reactions where heat conductivity of the support plays a crucial role.[129-133]
However, commercially available silicon carbide has a low specific surface area (Sg < 25m2g-1)
and is not suitable as a catalyst support. Thus, new methods were developed for the preparation
of the high surface area materials.
Table 2. Physical properties of silicon carbide compared to alumina and silica
Property SiO2 (quartz)
SiO2 (fused silica) Al2O3 SiC
Thermal conductivity (W m-1K-1) 1.4 1.3 16-30 100-200 Thermal expansion coefficient (10-6 K-1) 12.3 0.4 7.2 3.7-4.7 Dielectric constant (at 1Mhz ) - 3.8 9.7 40 Density (g cm-3) 2.65 2.20 3.97 3.20 Melting point (K) 1720-1830 1720-1830 2054 2700 Young modulus (GPa) 70 73 340-410 300-450
One of the first procedures for the manufacture of carbide materials with surface areas
up to 200 m2g-1 was “shape memory synthesis”. High surface area activated carbon was
reacted with silicon monoxide (SiO) at elevated temperatures for the synthesis of silicon
carbide.[129] Reduction of high surface area silica with carbon precursors also gave high surface
area silicon carbide materials. An example was the reduction of high surface area silica
aerogels with carbon precursors for the production of materials with a specific surface area of
112 m2g-1.[134] The same idea of reacting silicon and carbon was used to prepare silicon carbide
25

Introduction
from ordered mesoporous materials, but in this case, surface areas did not exceed 160 m2g-
1.[135-137] Decomposition of simple silane precursors at low pressures was used for the
manufacture of SiC with a surface area of 50 m2g-1[132] or at high autogenic pressures 146 m2g-1
was achieved.[138] Chemical vapor deposition (CVD) and chemical vapor infiltration (CVI)
were also used for the impregnation of ordered porous hosts in order to control the size of the
deposited domains.[139-141] The thesis shows that silicon carbide was directly deposited inside
the MCM-48 and SBA-15 by CVI.[20] CVI allowed to use simple and inexpensive precursors
and gave good control of the product composition.[142] After HF treatment of SiC/SBA-15
composite materials, high surface area (410-830 m2g-1) mesoporous SiC was obtained.[20, 21]
However, low angle X-ray measurements suggested no mesoscopic ordering of the pore
structure. Well-ordered SiC structures were prepared by vapor/liquid condensation/infiltration
with melted low molecular weight polycarbosilanes[22] or by organic solvent assisted process
from polycarbosilanes with higher molecular weights.[143]
26

Introduction
2.5 Transition Metal Nitrides and Carbides - Alternative to Noble Metal
Catalysts Transition metal nitrides and carbides have been studied intensively as electronic and
structural ceramics.[144-146] Compared to oxides they have superior properties in some respects
such as hardness, mechanical strength and high melting points (the melting point of V2O5 is
690 oC while for VN and VC it is 2050 and 2810 oC).[144] As shown in the pioneering work of
Levy and Boudart[23] and, more recently, summarized by Oyama,[24, 147] transition metal
nitrides and carbides can also be efficient catalysts. In particular, compounds such as W2N or
Mo2N have attracted attention as catalysts for hydrotreating reactions.[148-150] In oxidation,
hydrogenation or isomerization reactions, the catalytic properties of the transition metal
nitrides and carbides resemble those of group VIII noble metals [Figure 16].[23, 147] Thus,
transition metal nitrides and carbides may offer a promising economic alternative to
conventional noble metal catalysts.
2H2 + O2 2H2OPt, Pd, Rh
25oC
2H2 + O2 2H2OW2C25oC
2H2 + O2 2H2OW
CH3 – CH – CH3
CH3
750oC
CH3
W2C370oC
CH3 – CH – CH3 CH3
CH3
2H2 + O2 2H2OPt, Pd, Rh
25oC
2H2 + O2 2H2OW2C25oC
2H2 + O2 2H2OW
CH3 – CH – CH3
CH3
750oC
CH3
W2C CH3 – CH – CH3 CH3
CH3
370oC
Figure 16. Transition metal carbides exhibit similar properties as group VIII metals: reacting hydrogen with oxygen (chemisorbed on the surface of carbide) at room temperature as well as showing activity in isomerization reactions[23]
In some reactions, nitrides and carbides show not only higher resistance against
poisoning as compared to noble metals, but also comparable specific reaction rates.[24] Kwon et
al. showed that similar dehydrogenation rates of n-butane can be measured over high surface
area vanadium nitride and a standard supported Pt-Sn catalyst [Figure 17].[151]
253
CH3 – CH – CH3 – CH3
166
350
CH3 – CH – CH3 CH3
Specific reaction rate
[nmol g-1 s-1]29
59
228
Specific surface area
[m2 g-1]
450oC
Catalyst
VN
Pt-Sn/Al2O3
VN
Catalyst=
253
CH3 – CH – CH3 CH3
166
350
CH3 – CH – CH3 CH3
Specific reaction rate
[nmol g-1 s-1]29
59
228
Specific surface area
[m2 g-1]
450oC
Catalyst
–
VN
Pt-Sn/Al2O3
VN
Catalyst=
Figure 17. n-Butane dehydrogenation over vanadium nitride and Pt-Sn catalyst[151]
27
Introduction
The dehydrogenation activity of the vanadium nitride catalyst clearly increases with the
measured specific surface area [Figure 17],[151] therefore a key issue for improving this class of
materials is the development of synthesis methods producing materials with high surface areas
and particle sizes in the nanometer range.[37, 152] Nanoparticles (d < 100 nm) are also crucial in
the preparation of dense materials, since they allow rapid densification at temperatures lower
than required for micrometer-sized powders, and yield materials with enhanced plastic or
superplastic properties.[127, 153, 154]
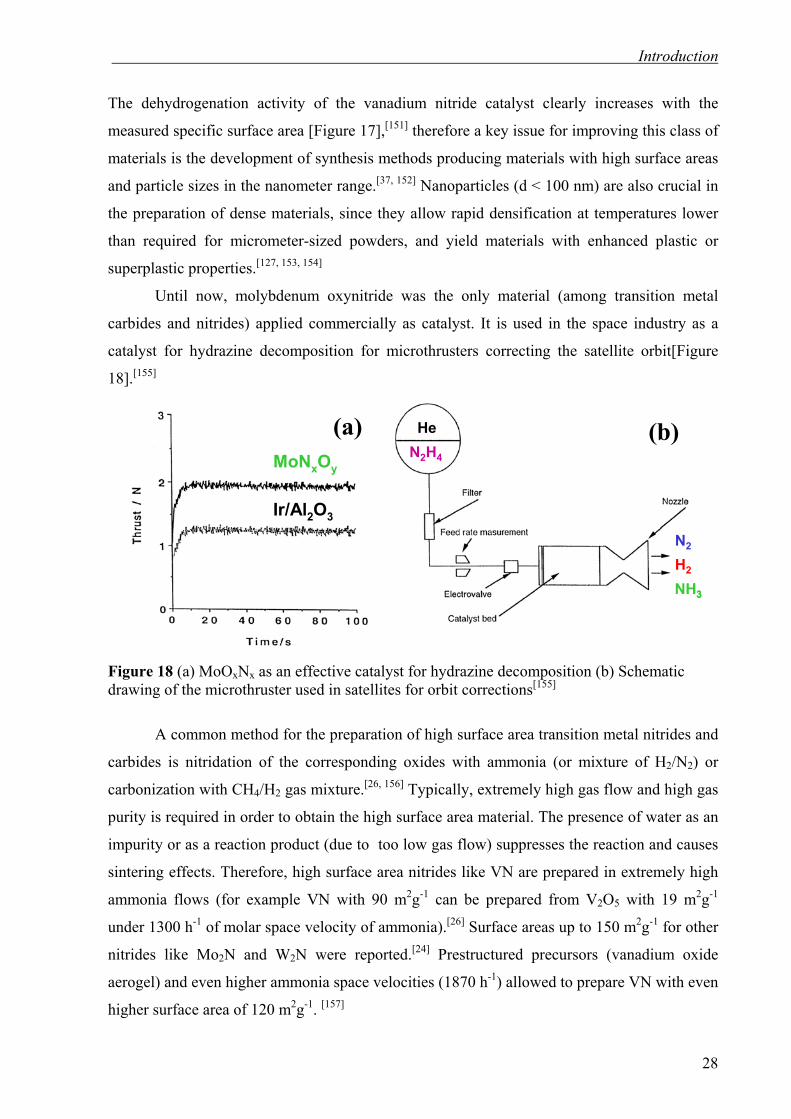
Until now, molybdenum oxynitride was the only material (among transition metal
carbides and nitrides) applied commercially as catalyst. It is used in the space industry as a
catalyst for hydrazine decomposition for microthrusters correcting the satellite orbit[Figure
18].[155]
MoNxOy
Ir/Al2O3
N2H4
He
N2
H2
NH3
(a) (b)MoNxOy
Ir/Al2O3
MoNxOy
Ir/Al2O3
N2H4
He
N2
NH3
(a) (b)
H2
Figure 18 (a) MoOxNx as an effective catalyst for hydrazine decomposition (b) Schematic drawing of the microthruster used in satellites for orbit corrections[155]
A common method for the preparation of high surface area transition metal nitrides and
carbides is nitridation of the corresponding oxides with ammonia (or mixture of H2/N2) or
carbonization with CH4/H2 gas mixture.[26, 156] Typically, extremely high gas flow and high gas
purity is required in order to obtain the high surface area material. The presence of water as an
impurity or as a reaction product (due to too low gas flow) suppresses the reaction and causes
sintering effects. Therefore, high surface area nitrides like VN are prepared in extremely high
ammonia flows (for example VN with 90 m2g-1 can be prepared from V2O5 with 19 m2g-1
under 1300 h-1 of molar space velocity of ammonia).[26] Surface areas up to 150 m2g-1 for other
nitrides like Mo2N and W2N were reported.[24] Prestructured precursors (vanadium oxide
aerogel) and even higher ammonia space velocities (1870 h-1) allowed to prepare VN with even
higher surface area of 120 m2g-1. [157]
28
Introduction
Transition metal nitrides and carbides tend to react on the surface with oxygen present
in the air and form a passivation layer. This is extremely important in the case of high surface
area materials. Due to small particle size and large external surface area such materials can
oxidize in bulk rapidly if directly exposed to air.[158] Therefore, a passivation in inert gas
containing low oxygen amounts (~1%) is necessary before exposing to air. For example, high
surface area Mo2N (150m2g-1)when exposed to air without passivation, oxidizes immediately
(is pyrophoric).
Also supports like zeolites, high surface area alumina and silica were used for the
preparation of highly dispersed molybdenum nitride and carbide.[24, 159, 160] The thesis shows
how vanadium nitride and carbide catalysts can be supported on ordered mesosporous silica
and activated carbon. Amine intercalated oxide was also demonstrated to be a useful precursor
for the preparation of vanadium nitride with surface areas up to 190 m2g-1 under orders of
magnitude lower ammonia flows.[25] Moreover, supported and foam-derived high surface area
vanadium nitride catalysts showed significantly higher conversions and selectivities in propane
dehydrogenation as compared to low surface area VN materials (prepared via direct V2O5
nitridation).
29

Methods and Experimental Details
3. Methods and Experimental Details 3.1. Gas Adsorption on Solids as a Tool for the Characterization of Porous
Materials
The interactions between a gas and a solid are divided into two groups. Reaction of
both phases can take place and a new chemical compound is formed (Figure 19
Generic/Absorption). On the other hand, also adsorption interactions only on the phase
boundary can take place and these are divided into physisorption and chemisorption.[161]
Depending on the nature of the bond formed between the adsorbed gas molecule and the solid,
both phenomena are arbitrarily distinguished (based on the enthalpy of adsorption). In the case
of physisorption, weak physical interactions between adsorbate molecules and adsorbent exist
and such phenomena are typically studied at temperatures close to the boiling point of the
adsorbate. Characteristic of physisorption is the formation of multilayers of the adsorbate on
the surface. However, in the case of chemisorption (which is typically investigated at higher
temperatures), only one strongly bonded monolayer of adsorbate is formed. These two
processes are used to estimate various properties of solids with high specific surface areas.
Physisorption measurements are typically used in heterogeneous catalysis to determine the
specific surface area, pore size distribution and pore volume of catalysts, while chemisorption
of selected gas molecules allows to determine the dispersion of the active phase and nature of
the active sites.
Solid – gas phase interactionSolid – gas phase interaction
Generic / Absorption Adsorption
ChemisorptionPhysisorption
Enthalpy of adsorption: > 20kJ/mol< 20kJ/mol
Activation energy:
Number of adsorbed layers:
0 0 or small
Often more than one Only one
Adsorbent Adsorbent
Generic / Absorption Adsorption
ChemisorptionPhysisorption
Enthalpy of adsorption: > 20kJ/mol< 20kJ/mol
Activation energy:
Number of adsorbed layers:
0 0 or small
Often more than one Only one
AdsorbentAdsorbent AdsorbentAdsorbent
Figure 19 Classification of gas – solid interactions
30

Methods and Experimental Details
3.1.1 Nitrogen Physisorption at 77K
The most common technique to characterize high surface area meso- and microporous
materials is physisorption of nitrogen at liquid nitrogen temperature. It allows precise, non-
destructive analysis of porous materials. However, there are some limitations for nitrogen as an
adsorbate, due to the large dimensions (kinetic diameter of 3.64 Å) especially in
characterization of the microporous materials, but in such cases other gas molecules like argon
(kinetic diameter of 3.41 Å) can be used for characterization. Typically, the sample is
evacuated before measurement, cooled down to 77K and then, known amounts of nitrogen gas
are dosed. Each dose is followed by pressure measurements in the sample cell. The recorded
dose volume as a function of pressure in sample cell at constant temperature is called
adsorption isotherm. Depending on which material adsorption takes place, different shapes of
isotherms are obtained [Chapter 3.1.3]. Typical process of nitrogen adsorption (and
corresponding isotherms) at different stages for mesoporous MCM-41 material is shown in
Figure 20.
r
p/p0
Vol
ume
Ads
orbe
d
A B C D E
p/p0
Vol
ume
Ads
orbe
d
p/p0
Vol
ume
Ads
orbe
d
p/p0
Vol
ume
Ads
orbe
d
p/p0
Vol
ume
Ads
orbe
d
r
1 1 1 1 10 0 0 0 0
rr
p/p0
Vol
ume
Ads
orbe
d
A B C D E
p/p0
Vol
ume
Ads
orbe
d
p/p0
Vol
ume
Ads
orbe
d
p/p0
Vol
ume
Ads
orbe
d
p/p0
Vol
ume
Ads
orbe
d
rr
11 11 11 11 110 0 0 0 0
Figure 20. Nitrogen adsorption on the ordered mesoporous silica MCM-41 at 77K with isotherm shape corresponding to each adsorption step. Y axis: volume of nitrogen adsorbed, X- axis: relative N2 pressure, where p is the N2 pressure measured in cell and po is the saturation pressure of N2 at 77K.
The first dose is made to the sample evacuated before (Figure 20A) and all nitrogen
delivered is adsorbed on the surface (Figure 20B - the pressure remains almost at the vacuum
level). In the next dose the surface coverage with adsorbate increases, multilayers are formed
31

Methods and Experimental Details
and finally, due to higher desorption rate, also the pressure measured in the cell increases.
Since each following multilayer is bound weaker, even small amounts of nitrogen dosed stay
preferentially in the gas phase causing a significant increase of pressure (Figure 20C). The
area of isotherms where multilayer adsorption took place (from 0.05 to 0.3 of relative pressure
P/Po) is suitable for calculation of specific surface area based on the BET theory (chapter
3.1.4). In the next step, a meniscus is formed and capillary condensation takes place (chapter
3.1.2), consuming nitrogen to form a liquid phase in the pores. As much of nitrogen is dosed as
necessary to fill the pore volume (Figure 20D) and further doses cause significant increase of
the measured pressure (Figure 20E).
3.1.2 Capillary Condensation and Kelvin Equation
The relative pressure at which capillary condensation takes place is dependent on the
pore size. The smaller the pore the lower pressure is required for the capillary condensation.
The pressure at which capillary condensation takes place for a given meniscus radius (which
was proportional to the pore radius), can be calculated from the Kelvin equation (eq.1, Figure
21).
ϕγ cos
rRTV2
ppln M
0
−= (1)
Where p/po is the relative pressure of adsorbate (p – pressure of adsorbate measured in sample
cell, po – saturation pressure of adsorbate); VM - molar volume of the liquid adsorbate; R -
universal gas constant; T – temperature; r - meniscus radius; φ – wetting angle (Figure 21)
Meniscus radius r [Å]
Rel
ativ
e pr
essu
re [P
/Po]
20 40 60 80 100
0.2
0.4
0.6
0.8
Meniscus radius r [Å]
Rel
ativ
e pr
essu
re [P
/Po]
20 40 60 80 100
0.2
0.4
0.6
0.8
MENISCUS
φ
r
Figure 21. Graphical plot of Kelvin equation (eq. 1) for nitrogen at 77K.[45]
However for the estimation of the pore diameter (eq. 2 - dpore), not only the diameter of
the meniscus has to be known (eq. 2 – dmeniscus), but also the thickness of already existing
32

Methods and Experimental Details
multilayer of the physisorbed adsorbate (eq. 2 - t) on which the meniscus is formed (eq. 1,
Figure 22). It is calculated from the multilayer adsorption theory discussed in chapter 3.1.4.
This pore size calculation method was proposed by Barrett, Joyner and Halenda and is known
as BJH theory.[162]
tdd meniscuspore 2+= (2)
Where dpore – pore diameter; dmeniscus – meniscus diameter calculated from Kelvin eqation (eq.
1); t – adsorbate multilayer thickness calculated from the BET equation (Chapter 3.1.4) by
dividing the multilayer volume (V) by the volume of monolayer (Vmax) and multiplying by
effective height parameter (eg. σ = 3.6 Å for hexagonal and 4.3 Å for cubic nitrogen molecular
packing).
σmaxVVt = (3)
The film thickness can alternatively be calculated from the Wheeler equation for nitrogen at
77K.[45] 3/1
)/ln(53.4 ⎟⎟
⎠
⎞⎜⎜⎝
⎛=
ppt
o
(4)
r
Multilayer thickness - t Meniscus diameter - dmeniscus
dmenicsust t
r
Multilayer thickness - t Meniscus diameter - dmeniscus
dmenicsust t
Figure 22. Pore size calculation according to the BJH theory.[45, 162]
The Kelvin equation cannot be applied to microporous materials since formation of a
meniscus is not reasonable in such small pores. Also, condensation in the micropores takes
place at much lower pressure due to the overlapping of the Lennard-Jones potentials from the
opposite sides of the pore walls creating low energy minimum.
33
Methods and Experimental Details
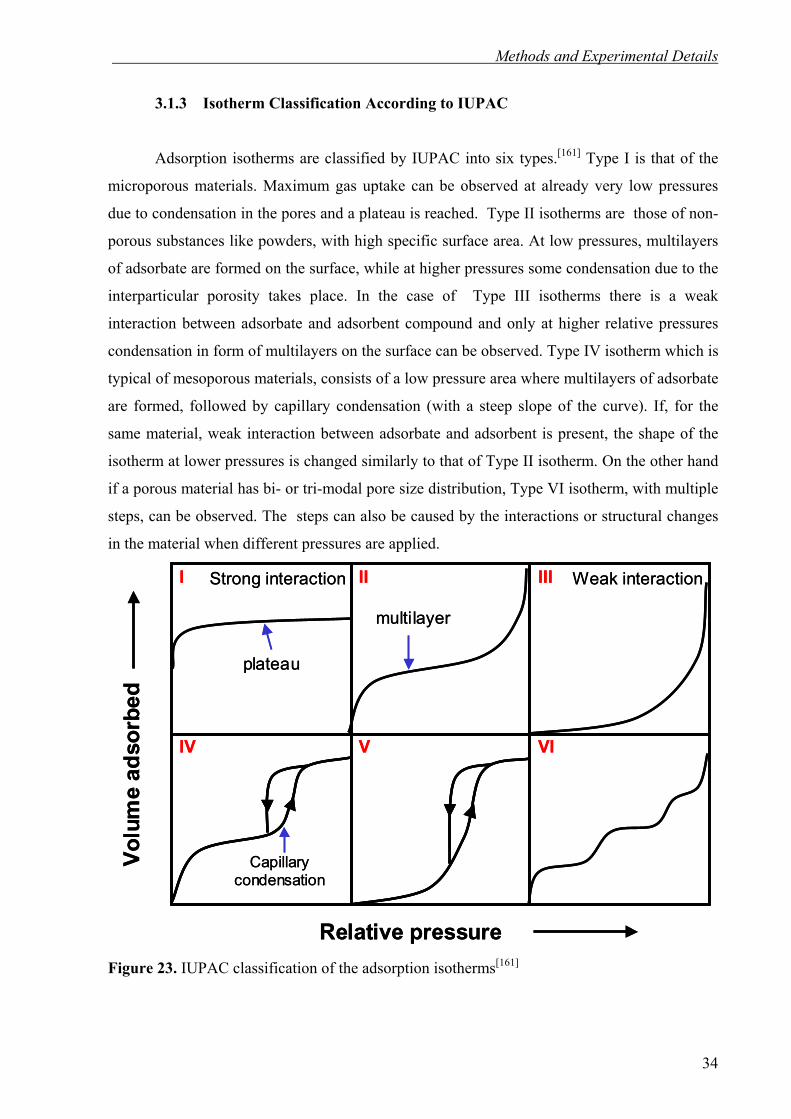
3.1.3 Isotherm Classification According to IUPAC
Adsorption isotherms are classified by IUPAC into six types.[161] Type I is that of the
microporous materials. Maximum gas uptake can be observed at already very low pressures
due to condensation in the pores and a plateau is reached. Type II isotherms are those of non-
porous substances like powders, with high specific surface area. At low pressures, multilayers
of adsorbate are formed on the surface, while at higher pressures some condensation due to the
interparticular porosity takes place. In the case of Type III isotherms there is a weak
interaction between adsorbate and adsorbent compound and only at higher relative pressures
condensation in form of multilayers on the surface can be observed. Type IV isotherm which is
typical of mesoporous materials, consists of a low pressure area where multilayers of adsorbate
are formed, followed by capillary condensation (with a steep slope of the curve). If, for the
same material, weak interaction between adsorbate and adsorbent is present, the shape of the
isotherm at lower pressures is changed similarly to that of Type II isotherm. On the other hand
if a porous material has bi- or tri-modal pore size distribution, Type VI isotherm, with multiple
steps, can be observed. The steps can also be caused by the interactions or structural changes
in the material when different pressures are applied.
multilayer
plateau
I II III
IV V VI
Relative pressure
Volu
me
adso
rbed
Capillarycondensation
trong interaction eak interaction
multilayer
plateau
S WI II III
IV V VI
Relative pressure
Volu
me
adso
rbed
Capillarycondensation
trong interaction eak interactionS W
Figure 23. IUPAC classification of the adsorption isotherms[161]
34

Methods and Experimental Details
Typically, not only adsorption, but also desorption of the adsorbate is measured. The
desorption branch can follow exactly the adsorption or hysteresis loop is observed (desorption
starts at lower pressures than adsorption). This depends on the nature of the adsorbent (in the
case of nitrogen adsorption at 77K a hysteresis loop is always observed for capillary
condensation steps at pressures higher than P/Po = 0.42) as well as on the shape of the pore or
presence of particles in the pore system. If the pores are well defined with a uniform diameter,
the desorption branch is shifted to slightly lower pressures as compared to the adsorption
branch (H1 type of hysteresis loop – Figure 24 - typical of large pore ordered mesoporous silica
SBA-15). If the pore size distribution is broad, or the pores are blocked with particles or with a
bottle-neck like geometry, the hysteresis loop becomes broader (H2 type - Figure 24). H3
loops are typically measured for the aggregates of platy particles or adsorbents containing slit-
shape pores (mesoporous activated carbons). On the other hand, H4 loops are also characteristic
of the slit-shape pores as in many activated carbons consisting mainly of micropores. The
desorption branch should meet adsorption branch at the closure point. This depends on the
adsorbate and the temperature of the measurement (for nitrogen adsorption at 77K the lower
closure point is located at P/Po = 0.42). If the hysteresis loop does not close at the specified
point, the sample was not outgassed properly before the measurement, or sublimed or
alternatively adsorbate molecules were trapped inside the flexible pore structure.
H3 H4H2H1
Volu
me
adso
rbed
Relative pressure
H3 H4H2H1 H3 H4H2H1
Volu
me
adso
rbed
Relative pressure
Figure 24. IUPAC classification of the hysteresis loops[161]
35
Methods and Experimental Details
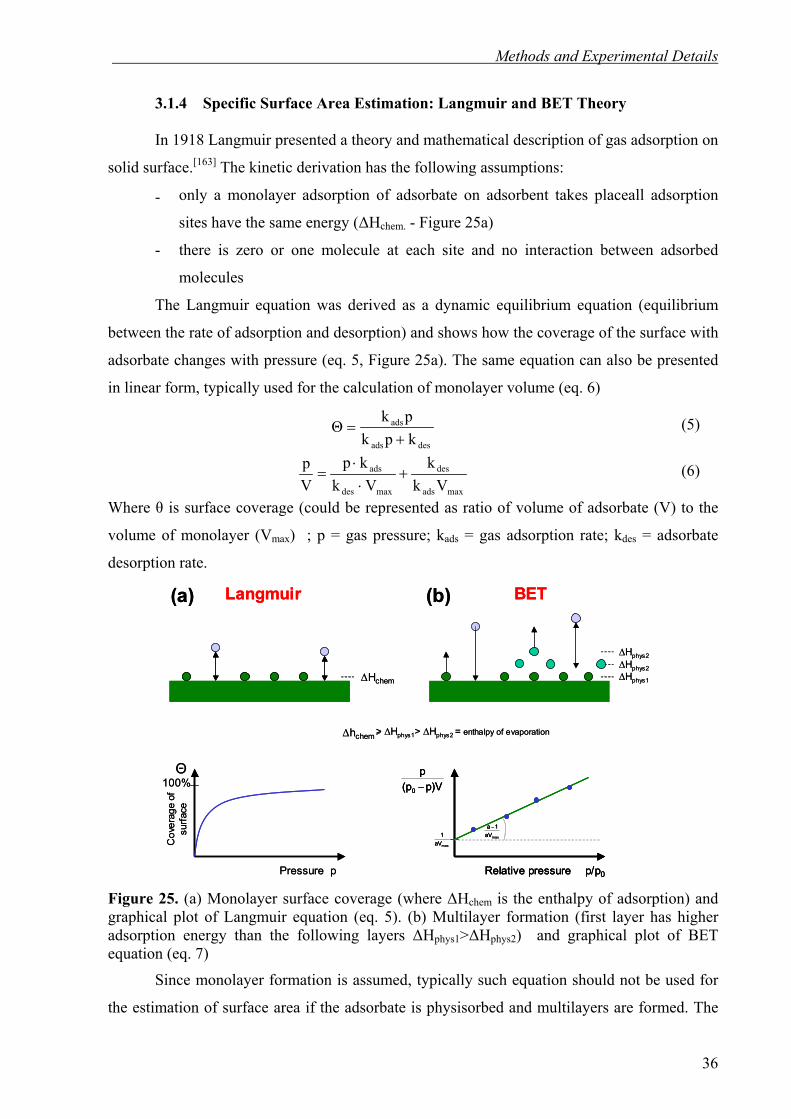
3.1.4 Specific Surface Area Estimation: Langmuir and BET Theory
In 1918 Langmuir presented a theory and mathematical description of gas adsorption on
solid surface.[163] The kinetic derivation has the following assumptions:
- only a monolayer adsorption of adsorbate on adsorbent takes placeall adsorption
sites have the same energy (∆Hchem. - Figure 25a)
- there is zero or one molecule at each site and no interaction between adsorbed
molecules
The Langmuir equation was derived as a dynamic equilibrium equation (equilibrium
between the rate of adsorption and desorption) and shows how the coverage of the surface with
adsorbate changes with pressure (eq. 5, Figure 25a). The same equation can also be presented
in linear form, typically used for the calculation of monolayer volume (eq. 6)
desads
ads
kpkpk
Θ+
= (5)
maxads
des
maxdes
ads
Vkk
Vkk p
Vp
+⋅⋅
= (6)
Where θ is surface coverage (could be represented as ratio of volume of adsorbate (V) to the
volume of monolayer (Vmax) ; p = gas pressure; kads = gas adsorption rate; kdes = adsorbate
desorption rate.
Langmuir BET
Cov
erag
e of
surfa
ce
Θ100%
Pressure p
p)V(pp
0 −
p/p0
maxaV1 maxaV
1a −
Relative pressure
(b)(a)
∆Hchem ∆Hphys1
∆Hphys2
∆Hphys2
> ∆Hphys1> ∆Hphys2 = enthalpy of evaporation∆hchem
Langmuir BET
Cov
erag
e of
surfa
ce
Θ100%
Pressure p
p)V(pp
0 −
p/p0
maxaV1 maxaV
1a −
Relative pressure
p)V(pp
0 −
p/p0
maxaV1 maxaV
1a −
Relative pressure
(b)(a)
∆Hchem ∆Hphys1
∆Hphys2
∆Hphys2
> ∆Hphys1> ∆Hphys2 = enthalpy of evaporation∆hchem
Figure 25. (a) Monolayer surface coverage (where ∆Hchem is the enthalpy of adsorption) and graphical plot of Langmuir equation (eq. 5). (b) Multilayer formation (first layer has higher adsorption energy than the following layers ∆Hphys1>∆Hphys2) and graphical plot of BET equation (eq. 7)
Since monolayer formation is assumed, typically such equation should not be used for
the estimation of surface area if the adsorbate is physisorbed and multilayers are formed. The
36

Methods and Experimental Details
Langmuir estimation of surface area is sometimes used in the case of microporous materials, if
the pores are too small to allow the formation of multilayers of the adsorbate. The Langmuir
model is also widely applied for the description of chemisorption of gas molecules. In that
case, typically only monolayer formation of adsorbate takes place and additional physisorption
effects leading to multilayer formation are weak and can be neglected or extracted by
secondary measurements.
Brunauer, Emmet and Teller (BET) presented in 1938 a new theory describing
multilayer adsorption of gas molecules on solids.[164] The basic assumptions are as follows:
- infinite number of layers are formed
- the first layer is adsorbed stronger than the others (∆Hphys1>∆Hphys2)
The BET theory is a standard tool to calculate specific surface areas of solids via physisorption
of gases. Typically the BET equation is presented in its linear form (eq. 7, Figure 25b):
0maxmax0 pp
aV1a
aV1
p)V(pp −
+=−
(7)
Where p is gas pressure; po = saturation pressure of gas at given temp; V = volume of
multilayer adsorbed; Vmax = volume of monolayer; a = constant
If true multilayer physisorption takes place, the measured points on the BET plot should
fit a line. However, there may be deviations, due to the presence of microporosity or capillary
condensation in small mesopores. Therefore, the points for which the calculation is made
should be chosen carefully in the linear range. It is recommended to use ranges between p/po =
0.05-0.3 in the case of nitrogen physisorption at 77K.[161] If the material has small mesopores
for which capillary condensation takes place in this range, the upper pressure range has to be
excluded, so that exclusively the linear part of the BET plot is taken into account. If only one
measurement point is available, the so called “single point” BET equation can be applied. In
this simplified form linear equation is assumed to cross the origin point of the coordinate
system and the (aVmax)-1 term equals zero. Such method is often used in the case of a flow
adsorption apparatus with defined gas mixtures. For example, in the case of nitrogen
physisorption at 77K, the flowing mixture of 30%N2 with 70%He can be used and thermal
conductivity detector connected to the integrator determines how much nitrogen is adsorbed at
p/po = 0.3 point. For a detailed calculation of a specific surface area, the surface area and
volume occupied by a single gas molecule adsorbed has to be known. From this data and
monolayer capacity (Vmax) calculated from the BET equation, specific surface area is
estimated. With the Langmuir method the known volume of monolayer (Vmax) can be directly
obtained from a linear form of the Langmuir equation (eq. 6).
37

Methods and Experimental Details
3.1.5 Statistical Thickness “t-Plot” Method
The statistical thickness method is a tool for the estimation of pore volume as well as of
the specific surface area. The generalized equation was derived by De Boer (eq. 8, Figure
26A).[161, 165] C
0 B/p)log(pAt ⎥
⎦
⎤⎢⎣
⎡+
= (8)
Where t was statistical thickness; p = gas pressure; p0 = saturation pressure of gas at given
temp; A,B,C = constants
The A,B,C parameters of Equation 8 are optimized by fitting of the isotherms of the
non-porous standard. Such fitting is characteristic for a given adsorbent and adsorbate system
(for example N2 on silica). In ‘t-plot’, the statistical thickness (t) is located on the x-axis while
the y-axis represents the gas volume adsorbed. If the material is non-porous the ‘t-plot’
function is linear and starts from the origin [Figure 26A]. Materials with higher surface areas
require more nitrogen to be adsorbed (the slope of ‘t-plot’ is high) in order to obtain the same
statistical thickness as for the materials with low surface area (the slope of ‘t-plot’ is small).
The main advantage of this method is the possibility of the pore volume estimation. For
microporous materials (with type I adsorption isotherm), the micropore volume estimation is
typically made for the volume of adsorbate physisorbed at p/po = 0.2 (in the case of N2
adsorption at 77K). In the case of the ‘t-plot’ method, the linear function is fitted to the part
where the ‘t-plot’ is linear [Figure 26B]. From the point where this line crosses the y-axis, the
volume of nitrogen adsorbed in the micropores can be calculated. Such method allows to
exclude the amounts of nitrogen forming multilayers outside the micropores. One should also
remember that the volume of nitrogen given on the y-axis is that of gas at room temperature
and therefore has to be converted to the volume of liquid nitrogen at 77K for the estimation of
the specific micropore volume. In the case of a mesoporous material with Type IV isotherm the
‘t-plot’ can be used to distinguish the mesopore and micropore volume [Figure 26C]. If the
material is mesoporous, the ‘t-plot’ starts from the origin of the axial system and maintains a
linear form until the capillary condensation step takes place (deviation from linearity). After
the capillary condensation step, the ‘t-plot’ should become linear again as the multilayer
adsorption takes place outside the filled pores. From the line fitting after the capillary
condensation step [Figure 26C – Fit2] one can estimate the mesopore volume on the y-axis.
From the angles at which both fitted lines cross the x-axis, the specific surface areas inside
[Figure 26C – Fit-1] and outside [Figure 26C- Fit-2] the mesopores are estimated. Thus, the ‘t-
38

Methods and Experimental Details
plot’ method allows to distinguish the micro- and mesopore volume. If the mesoporous sample
has additional micropores (as in the case of ordered mesoporous silica SBA-15), the first linear
fitting of the ‘t-plot’ [Figure 26C – Fit-1] intersects the y-axis above the zero point and
indicates the volume of micropores. Therefore, in such case the mesopore volume measured by
Fit-2 is in reality the sum of meso- and micropore volumes (measured by Fit-1). The true
mesopore volume is then a difference between volume estimated by Fit-1 and Fit-2 [Figure
26C].
p/p0
Isotherm
t – statistical thickness
Vol
ume
Adso
rbed
[cm
3 /g]
t-plot
n
Volu
me
Adso
rbed
[cm
3 /g]
n High surface area
Low surface area
(A) NON-POROUS MATERIAL
High surface area
Low surface area
p/p0 t – statistical thickness
Vol
ume
Adso
rbed
[cm
3 /g]
n n
p/p0
Vol
ume
Adso
rbed
[cm
3 /g]
(B) MICROPOROUS MATERIAL
(C) MESOPOROUS MATERIAL
t – statistical thickness
n
Vmicro
Vmeso
n
Vmicro
Fit-1
Fit-2
1
1
1
p/p0
Isotherm
t – statistical thickness
Vol
ume
Adso
rbed
[cm
3 /g]
t-plot
n
Volu
me
Adso
rbed
[cm
3 /g]
n High surface area
Low surface area
(A) NON-POROUS MATERIAL
High surface area
Low surface area
p/p0 t – statistical thickness
Vol
ume
Adso
rbed
[cm
3 /g]
n n
p/p0
Vol
ume
Adso
rbed
[cm
3 /g]
(B) MICROPOROUS MATERIAL
(C) MESOPOROUS MATERIAL
t – statistical thickness
n
Vmicro
Vmeso
n
Vmicro
Fit-1
Fit-2
1
1
1
Figure 26. t-plot and isotherms for estimation of the surface area and porosity. (a) non porous materials with different surface areas. (b) microporous material and (c) mesoporous material
In the case of such micro- and mesoporous hybrid materials one cannot use directly the
point at p/po = 0.2 for the estimation of micropore volume. It is due to the fact that already at
this pressure multilayer formation of the adsorbate takes place in the mesopores and the
calculated value leads to overestimation of the micropore volume.
39
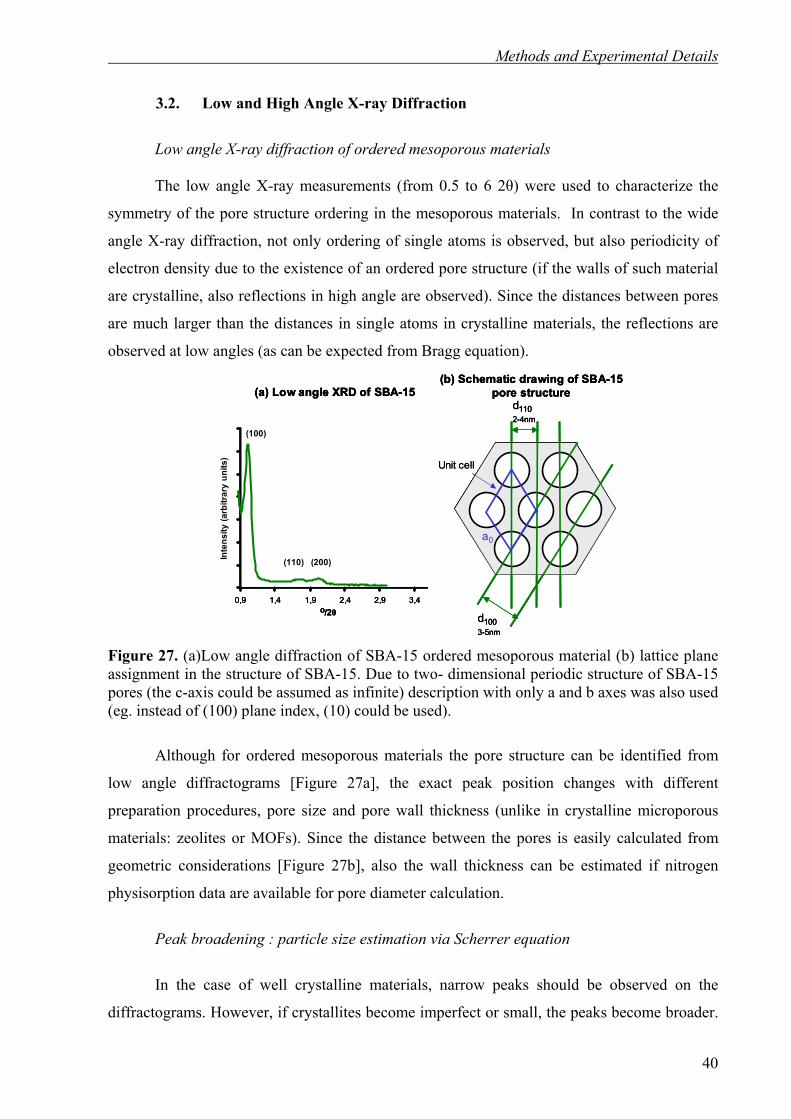
Methods and Experimental Details
3.2. Low and High Angle X-ray Diffraction
Low angle X-ray diffraction of ordered mesoporous materials The low angle X-ray measurements (from 0.5 to 6 2θ) were used to characterize the
symmetry of the pore structure ordering in the mesoporous materials. In contrast to the wide
angle X-ray diffraction, not only ordering of single atoms is observed, but also periodicity of
electron density due to the existence of an ordered pore structure (if the walls of such material
are crystalline, also reflections in high angle are observed). Since the distances between pores
are much larger than the distances in single atoms in crystalline materials, the reflections are
observed at low angles (as can be expected from Bragg equation).
(a) Low angle XRD of SBA-15
d1003-5nm
d1102-4nm
0
5000
10000
15000
20000
25000
30000
35000
0,9 1,4 1,9 2,4 2,9 3,4
(100)
(110) (200)Inte
nsity
(arb
itrar
y un
its)
O/2θ
(b) Schematic drawing of SBA-15pore structure
a0
Unit cell
(a) Low angle XRD of SBA-15
d1003-5nm
d1102-4nm
0
5000
10000
15000
20000
25000
30000
35000
0,9 1,4 1,9 2,4 2,9 3,4
(100)
(110) (200)Inte
nsity
(arb
itrar
y un
its)
O/2θ
(b) Schematic drawing of SBA-15pore structure(a) Low angle XRD of SBA-15
d1003-5nm
d1102-4nm
0
5000
10000
15000
20000
25000
30000
35000
0,9 1,4 1,9 2,4 2,9 3,4
(100)
(110) (200)Inte
nsity
(arb
itrar
y un
its)
O/2θ
(b) Schematic drawing of SBA-15pore structure
a0
Unit cell
Figure 27. (a)Low angle diffraction of SBA-15 ordered mesoporous material (b) lattice plane assignment in the structure of SBA-15. Due to two- dimensional periodic structure of SBA-15 pores (the c-axis could be assumed as infinite) description with only a and b axes was also used (eg. instead of (100) plane index, (10) could be used).
Although for ordered mesoporous materials the pore structure can be identified from
low angle diffractograms [Figure 27a], the exact peak position changes with different
preparation procedures, pore size and pore wall thickness (unlike in crystalline microporous
materials: zeolites or MOFs). Since the distance between the pores is easily calculated from
geometric considerations [Figure 27b], also the wall thickness can be estimated if nitrogen
physisorption data are available for pore diameter calculation.
Peak broadening : particle size estimation via Scherrer equation
In the case of well crystalline materials, narrow peaks should be observed on the
diffractograms. However, if crystallites become imperfect or small, the peaks become broader.
40

Methods and Experimental Details
This is also typical for nanocrystalline materials (where a smaller amount of lattice planes in
single crystal contributes to one reflection).
Figure 28 Powder X-ray diffractograms of (a) well crystalline material, (b) imperfect crystals or nanomaterials
The relation between particle size and peak broadening was first expressed as an
empirical equation by Scherrer:
cosθBλKd
crystecrystallit = (9)
The average crystallite size (dcrystallite) is calculated for a given reflection (at given θ angle), by
measuring its integral half-width (Bcryst (radians)) for a given X-ray wavelength λ. The K shape
factor is in the range between 0.87 and 1.39 (for spherical particles K = 0.9). However, it was
found that not only particle size could cause peak broadening, but also the existence of
stress/strain in the crystallite:
εtanθ2Bstrain = (10)
Where Bstrain is the peak broadening caused by the strain in the crystallite; ε = strain in the
crystallite; θ = peak position for which calculation was made.
Both effects can be distinguished by analysis of how the peak width changes with the θ
angle. In the case of crystallite size broadening, the peak width changes as a function of cos θ
(eq. 9), while for strain dependent broadening, as a function of tan θ (eq. 10). Both effects add
up and are given in the form of linear function (when (Bcryst+Bstrain) cos θ is plotted against sin
θ) known as Williamson-Hall plot. Both stress and strain can be calculated from the plot:
sinθε2d
λKcosθ)B(Becrystallit
straincryst +=+ (11)
However, the observed peak broadening (Bobs) typically measured directly from the
diffractogram, depends also on the instrumental resolution and changes after each time when
slit/collimator configuration is modified. Therefore, before each particle size estimation a
standard (LaB6) composed of large crystals is measured in the same configuration in order to
extract peak width caused by the equipment (Binstr).
41
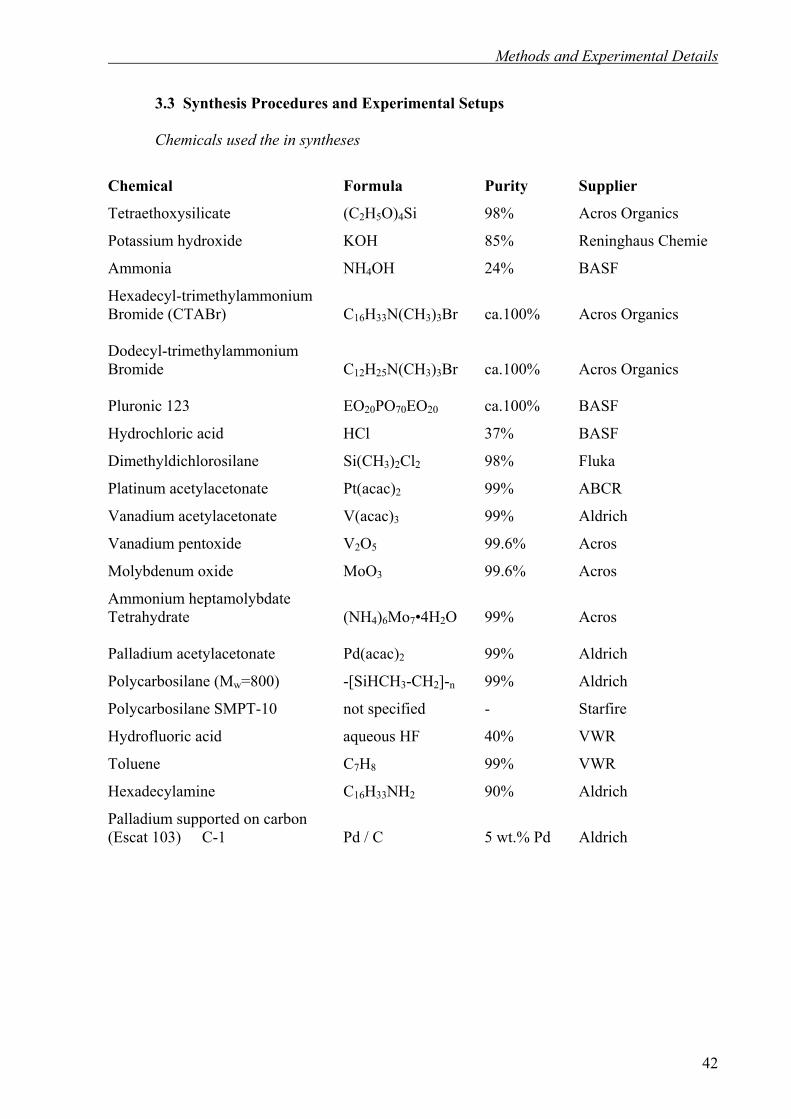
Methods and Experimental Details
3.3 Synthesis Procedures and Experimental Setups
Chemicals used the in syntheses
Chemical Formula Purity Supplier
Tetraethoxysilicate (C2H5O)4Si 98% Acros Organics
Potassium hydroxide KOH 85% Reninghaus Chemie
Ammonia NH4OH 24% BASF
Hexadecyl-trimethylammonium Bromide (CTABr) C16H33N(CH3)3Br ca.100% Acros Organics Dodecyl-trimethylammonium Bromide C12H25N(CH3)3Br ca.100% Acros Organics Pluronic 123 EO20PO70EO20 ca.100% BASF
Hydrochloric acid HCl 37% BASF
Dimethyldichlorosilane Si(CH3)2Cl2 98% Fluka
Platinum acetylacetonate Pt(acac)2 99% ABCR
Vanadium acetylacetonate V(acac)3 99% Aldrich
Vanadium pentoxide V2O5 99.6% Acros
Molybdenum oxide MoO3 99.6% Acros
Ammonium heptamolybdate Tetrahydrate (NH4)6Mo7•4H2O 99% Acros Palladium acetylacetonate Pd(acac)2 99% Aldrich
Polycarbosilane (Mw=800) -[SiHCH3-CH2]-n 99% Aldrich
Polycarbosilane SMPT-10 not specified - Starfire
Hydrofluoric acid aqueous HF 40% VWR
Toluene C7H8 99% VWR
Hexadecylamine C16H33NH2 90% Aldrich
Palladium supported on carbon (Escat 103) C-1 Pd / C 5 wt.% Pd Aldrich
42

Methods and Experimental Details
3.3.1 Synthesis of Ordered Mesoporous Silica Materials
MCM-41
2.4 g of CTABr was dissolved in 120 ml of deionised H2O (200 ml beaker). Then 9.5 g
of 25% ammonia was added and stirred for 15 minutes. 10 g of TEOS was added and the
solution was stirred for 1 hour. The mixture was filtered and washed with 100 ml of water. The
solid product was dried overnight at 90 oC and heated to 550 oC for 5 hours, with a heating rate
of 1 K/min (the silica yield was 98-100%). In order to control the pore diameter, instead of
CTABr, surfactants with different hydrocarbon chain lengths could be used in the same mass
amount as the CTABr (for example 2.4g of dodecyltrimethylammoniumbromide or 2.4 g of
decyltrimethylammoniumbromide). Alternatively, pore size control could also be achieved via
addition of a swelling agent (toluene or trimethylbenzene) to the surfactant/water solution
before TEOS addition.
MCM-48
In a 200 ml glass beaker containing 22.32 g of distilled water 0.56 g KOH was
dissolved. After 10 minutes, 4.74 g of surfactant was added (CTABr). This mixture was stirred
for at least 20 minutes, until it became clear (CTABr was completely dissolved). Then 4.17 g
of TEOS was added to the solution at once (stirring was continued). After 20 minutes a white,
milky liquid product was transferred into a teflon liner and placed into an autoclave for three
days at 115 oC. When the heat treatment was finished, the mixture was filtered and washed
with 1.5 liter of water. The filtered product was dried for 1 day at 90 oC and then heated to 550 oC for 5 hours, with a heating rate of 1 Kmin-1 (the silica yield was 98-100%).
SBA-15[166]
3.46 g of Pluronic P123 was dissolved in 62.8 g of distilled water and 2.0 g conc. HCl
(35%) to which 7.44 g of TEOS was added at once at 35 oC while stirring (SiO2/P123 = 60).
The mixture was then stirred for 24 hours at the same temperature. Afterwards, the temperature
was increased to the desired hydrothermal treatment temperature (from 35 to 130 oC) and left
24 hours under static conditions. After cooling down, the solid was recovered by filtration
(without washing with water) and the resulting product was immediatly calcined (without
drying) at 550 oC for 5 hours (heating rate 1Kmin-1) (the silica yield was 98-100%). In this
43
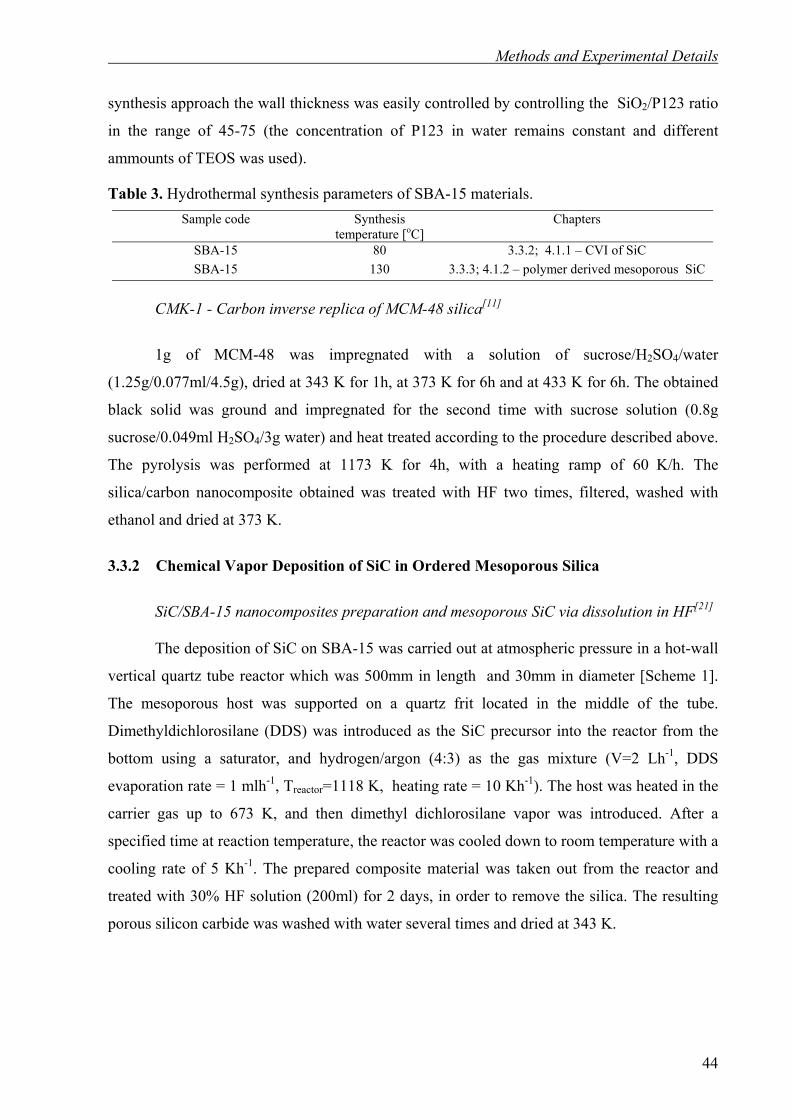
Methods and Experimental Details
synthesis approach the wall thickness was easily controlled by controlling the SiO2/P123 ratio
in the range of 45-75 (the concentration of P123 in water remains constant and different
ammounts of TEOS was used).
Table 3. Hydrothermal synthesis parameters of SBA-15 materials. Sample code Synthesis
temperature [oC] Chapters
SBA-15 80 3.3.2; 4.1.1 – CVI of SiC SBA-15 130 3.3.3; 4.1.2 – polymer derived mesoporous SiC
CMK-1 - Carbon inverse replica of MCM-48 silica[11]
1g of MCM-48 was impregnated with a solution of sucrose/H2SO4/water
(1.25g/0.077ml/4.5g), dried at 343 K for 1h, at 373 K for 6h and at 433 K for 6h. The obtained
black solid was ground and impregnated for the second time with sucrose solution (0.8g
sucrose/0.049ml H2SO4/3g water) and heat treated according to the procedure described above.
The pyrolysis was performed at 1173 K for 4h, with a heating ramp of 60 K/h. The
silica/carbon nanocomposite obtained was treated with HF two times, filtered, washed with
ethanol and dried at 373 K.
3.3.2 Chemical Vapor Deposition of SiC in Ordered Mesoporous Silica
SiC/SBA-15 nanocomposites preparation and mesoporous SiC via dissolution in HF[21] The deposition of SiC on SBA-15 was carried out at atmospheric pressure in a hot-wall
vertical quartz tube reactor which was 500mm in length and 30mm in diameter [Scheme 1].
The mesoporous host was supported on a quartz frit located in the middle of the tube.
Dimethyldichlorosilane (DDS) was introduced as the SiC precursor into the reactor from the
bottom using a saturator, and hydrogen/argon (4:3) as the gas mixture (V=2 Lh-1, DDS
evaporation rate = 1 mlh-1, Treactor=1118 K, heating rate = 10 Kh-1). The host was heated in the
carrier gas up to 673 K, and then dimethyl dichlorosilane vapor was introduced. After a
specified time at reaction temperature, the reactor was cooled down to room temperature with a
cooling rate of 5 Kh-1. The prepared composite material was taken out from the reactor and
treated with 30% HF solution (200ml) for 2 days, in order to remove the silica. The resulting
porous silicon carbide was washed with water several times and dried at 343 K.
44

Methods and Experimental Details
Scheme 1. Chemical vapor deposition reactor for synthesis of SiC/SBA-15 nanocomposites used for preparation of mesoporous SiC
Autogenic pressure synthesis of high surface area SiC via decomposition of TMS in
SBA-15
A ½ inch Swagelok union part was filled with SBA-15 and heated to 523 K under
argon for 1h in order to evaporate physisorbed water. Subsequently tetramethylsilane (TMS)
was added and the vessel was closed (under argon). The closed vessel was placed in a quartz
tube and heated to 1273 K in an argon flow with a heating ramp of 120 Kh-1 and maintained at
this temperature for 6h. Afterwards the oven was cooled for 2 hours to room temperature and
the resulting SiC/SBA-15 composite was treated with 10% HF solution in order to obtain high
surface area SiC.
3.3.3 SiC Inverse Replica of Ordered Mesoporous Silica by Melt Infiltration
In the typical synthesis procedure[22] 1 g of SBA-15 was placed in a glass reactor,
dehydrated at 150 oC in vacuum for 1 h, flushed with argon and cooled down to room
temperature. Subsequently, 1.25 g of polycarbosilane (PCS - Aldrich or SMPT-10 - Starfire)
was added and heated rapidly to 320 oC in an inert atmosphere. The sample was stirred several
times and left at the same temperature for 12h. The infiltrated sample was cooled down,
transferred to a high temperature oven, and heated in argon to 1300 oC with a heating ramp of
50 oCh-1 for 2 hours. Afterwards the obtained SiC/SBA-15 nanocomposite was treated with
125 mL of EtOH/H2O/40% HF solution (volume ratio 1/1/1) and with water several times.
45
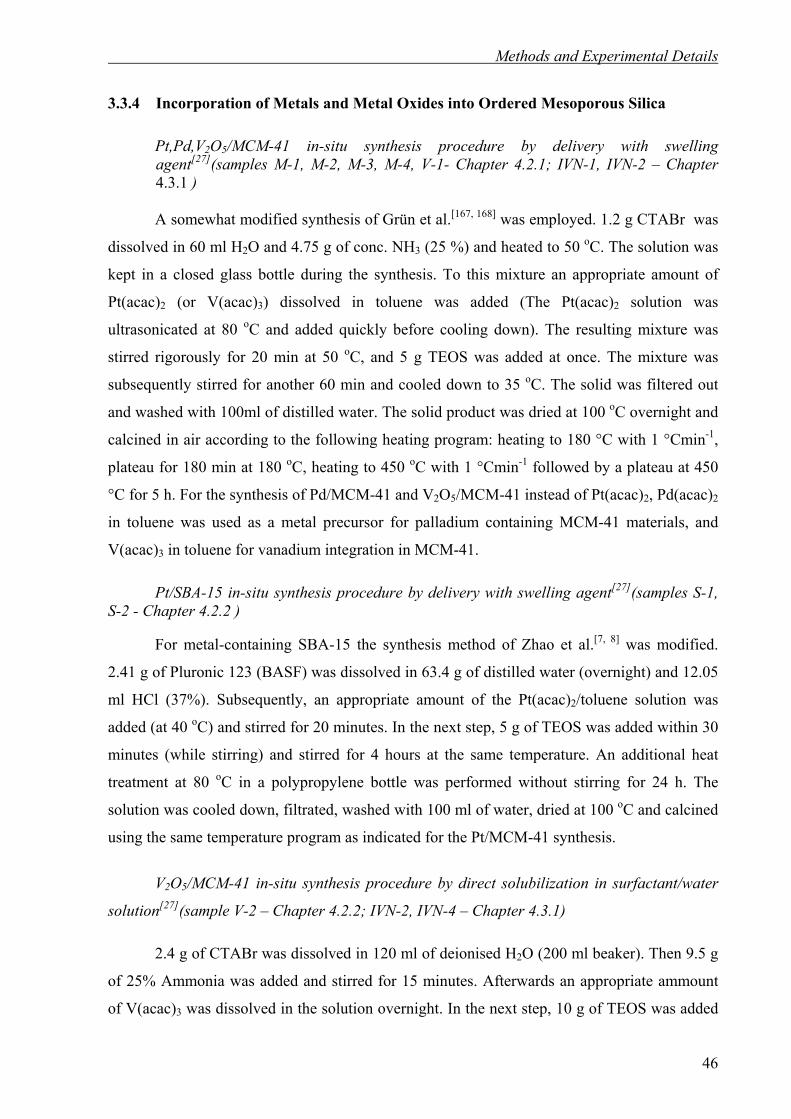
Methods and Experimental Details
3.3.4 Incorporation of Metals and Metal Oxides into Ordered Mesoporous Silica
Pt,Pd,V2O5/MCM-41 in-situ synthesis procedure by delivery with swelling agent[27](samples M-1, M-2, M-3, M-4, V-1- Chapter 4.2.1; IVN-1, IVN-2 – Chapter 4.3.1 )
A somewhat modified synthesis of Grün et al.[167, 168] was employed. 1.2 g CTABr was
dissolved in 60 ml H2O and 4.75 g of conc. NH3 (25 %) and heated to 50 oC. The solution was
kept in a closed glass bottle during the synthesis. To this mixture an appropriate amount of
Pt(acac)2 (or V(acac)3) dissolved in toluene was added (The Pt(acac)2 solution was
ultrasonicated at 80 oC and added quickly before cooling down). The resulting mixture was
stirred rigorously for 20 min at 50 oC, and 5 g TEOS was added at once. The mixture was
subsequently stirred for another 60 min and cooled down to 35 oC. The solid was filtered out
and washed with 100ml of distilled water. The solid product was dried at 100 oC overnight and
calcined in air according to the following heating program: heating to 180 °C with 1 °Cmin-1,
plateau for 180 min at 180 oC, heating to 450 oC with 1 °Cmin-1 followed by a plateau at 450
°C for 5 h. For the synthesis of Pd/MCM-41 and V2O5/MCM-41 instead of Pt(acac)2, Pd(acac)2
in toluene was used as a metal precursor for palladium containing MCM-41 materials, and
V(acac)3 in toluene for vanadium integration in MCM-41.
Pt/SBA-15 in-situ synthesis procedure by delivery with swelling agent[27](samples S-1, S-2 - Chapter 4.2.2 )
For metal-containing SBA-15 the synthesis method of Zhao et al.[7, 8] was modified.
2.41 g of Pluronic 123 (BASF) was dissolved in 63.4 g of distilled water (overnight) and 12.05
ml HCl (37%). Subsequently, an appropriate amount of the Pt(acac)2/toluene solution was
added (at 40 oC) and stirred for 20 minutes. In the next step, 5 g of TEOS was added within 30
minutes (while stirring) and stirred for 4 hours at the same temperature. An additional heat
treatment at 80 oC in a polypropylene bottle was performed without stirring for 24 h. The
solution was cooled down, filtrated, washed with 100 ml of water, dried at 100 oC and calcined
using the same temperature program as indicated for the Pt/MCM-41 synthesis.
V2O5/MCM-41 in-situ synthesis procedure by direct solubilization in surfactant/water
solution[27](sample V-2 – Chapter 4.2.2; IVN-2, IVN-4 – Chapter 4.3.1)
2.4 g of CTABr was dissolved in 120 ml of deionised H2O (200 ml beaker). Then 9.5 g
of 25% Ammonia was added and stirred for 15 minutes. Afterwards an appropriate ammount
of V(acac)3 was dissolved in the solution overnight. In the next step, 10 g of TEOS was added
46
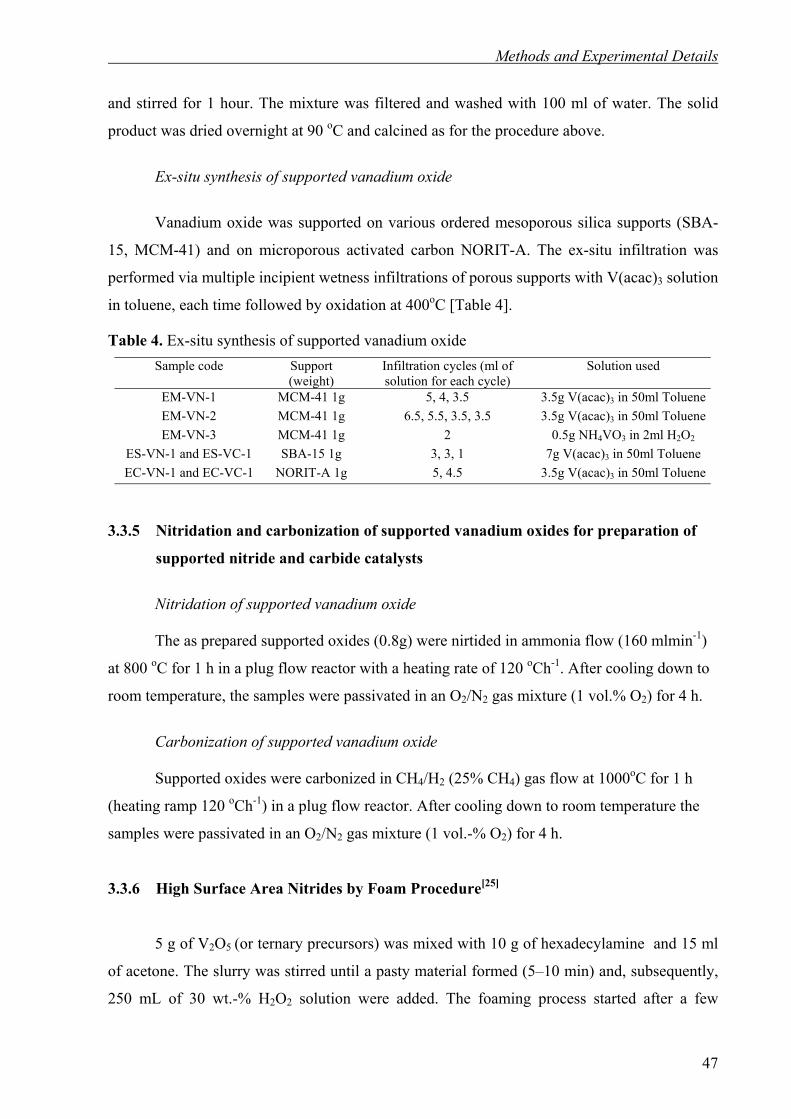
Methods and Experimental Details
and stirred for 1 hour. The mixture was filtered and washed with 100 ml of water. The solid
product was dried overnight at 90 oC and calcined as for the procedure above.
Ex-situ synthesis of supported vanadium oxide
Vanadium oxide was supported on various ordered mesoporous silica supports (SBA-
15, MCM-41) and on microporous activated carbon NORIT-A. The ex-situ infiltration was
performed via multiple incipient wetness infiltrations of porous supports with V(acac)3 solution
in toluene, each time followed by oxidation at 400oC [Table 4].
Table 4. Ex-situ synthesis of supported vanadium oxide Sample code Support
(weight) Infiltration cycles (ml of solution for each cycle)
Solution used
EM-VN-1 MCM-41 1g 5, 4, 3.5 3.5g V(acac)3 in 50ml TolueneEM-VN-2 MCM-41 1g 6.5, 5.5, 3.5, 3.5 3.5g V(acac)3 in 50ml TolueneEM-VN-3 MCM-41 1g 2 0.5g NH4VO3 in 2ml H2O2
ES-VN-1 and ES-VC-1 SBA-15 1g 3, 3, 1 7g V(acac)3 in 50ml Toluene EC-VN-1 and EC-VC-1 NORIT-A 1g 5, 4.5 3.5g V(acac)3 in 50ml Toluene
3.3.5 Nitridation and carbonization of supported vanadium oxides for preparation of
supported nitride and carbide catalysts
Nitridation of supported vanadium oxide
The as prepared supported oxides (0.8g) were nirtided in ammonia flow (160 mlmin-1)
at 800 oC for 1 h in a plug flow reactor with a heating rate of 120 oCh-1. After cooling down to
room temperature, the samples were passivated in an O2/N2 gas mixture (1 vol.% O2) for 4 h.
Carbonization of supported vanadium oxide Supported oxides were carbonized in CH4/H2 (25% CH4) gas flow at 1000oC for 1 h
(heating ramp 120 oCh-1) in a plug flow reactor. After cooling down to room temperature the
samples were passivated in an O2/N2 gas mixture (1 vol.-% O2) for 4 h.
3.3.6 High Surface Area Nitrides by Foam Procedure[25]
5 g of V2O5 (or ternary precursors) was mixed with 10 g of hexadecylamine and 15 ml
of acetone. The slurry was stirred until a pasty material formed (5–10 min) and, subsequently,
250 mL of 30 wt.-% H2O2 solution were added. The foaming process started after a few
47

Methods and Experimental Details
minutes and the product was spread onto a clean glass surface for overnight drying. The as-
prepared foam was placed in a vertical quartz tube reactor (diameter of 3 cm with a quartz frit
in the middle) and heated in an ammonia flow (from bottom to top) at a heating rate of 120 °C
h–1 to 800 °C. This temperature was maintained for 2 hours. After cooling the reactor down to
room temperature, the solid product was passivated in the same tube in an O2/N2 gas mixture (1
vol.-% O2) for 4 hours. The ammonia flow during the synthesis was maintained at the same
level (170 cm3min–1) for all foam-derived samples. The loadings of the foam in the reactor
were as follows: 1.5 g (VN-1), 2.5 g (VN-2), and 7.5 g (VN-3) of foam. In the case of
vanadium nitride prepared by the standard procedure, the ammonia flow from top to bottom
was used (1047 cm3 min–1) and the reactor was loaded with 6 g of sample.
3.3.7 Catalytic Tests
Cinnamic acid hydrogenation
0.4 g of cinnamic acid (99 %; Adlrich) were dissolved in 16 g of ethanol (99 %). To the
substrate 0.24 g of the solid catalyst were added. The mixture was stirred at room temperature
(25 oC) and dynamic hydrogen was used for the reduction (1 bar, 50 mLmin-1) directly without
any pretreatment of the catalyst. Periodically taken samples were analyzed with a GC/MS. For
comparison, the reaction was also carried out using a commercially available Pd/carbon
catalyst with the same substrate/catalyst ratio (5 wt% Pd, Escat 103; Aldrich), which is later
referred to as C-1.
Propane dehydrogenation
Propane dehydrogenation tests were conducted by Patrizia Laura De Cola in Prof.
Weitkamp group at the Institute of Chemical Technology in Stuttgart . The catalytic
experiments were carried out at ambient pressure, a constant reaction temperature of T =
525°C and at a weight hourly space velocity of WHSV = 2h-1 in a flow-type apparatus with a
fixed-bed reactor made from quartz glass. Prior to the experiments, the catalyst powders (mcat.
= 300mg) were loaded into the reactor between two quartz wool plugs and treated with
hydrogen (100cm3 min-1, 525°C, 1h) to remove the oxide passivation layer. Pure propane
(99.95vol.-%, Westfalen) was used as the feed. Samples were periodically taken from the
gaseous reactor effluent and analyzed by capillary gas chromatography. Conversions and
48
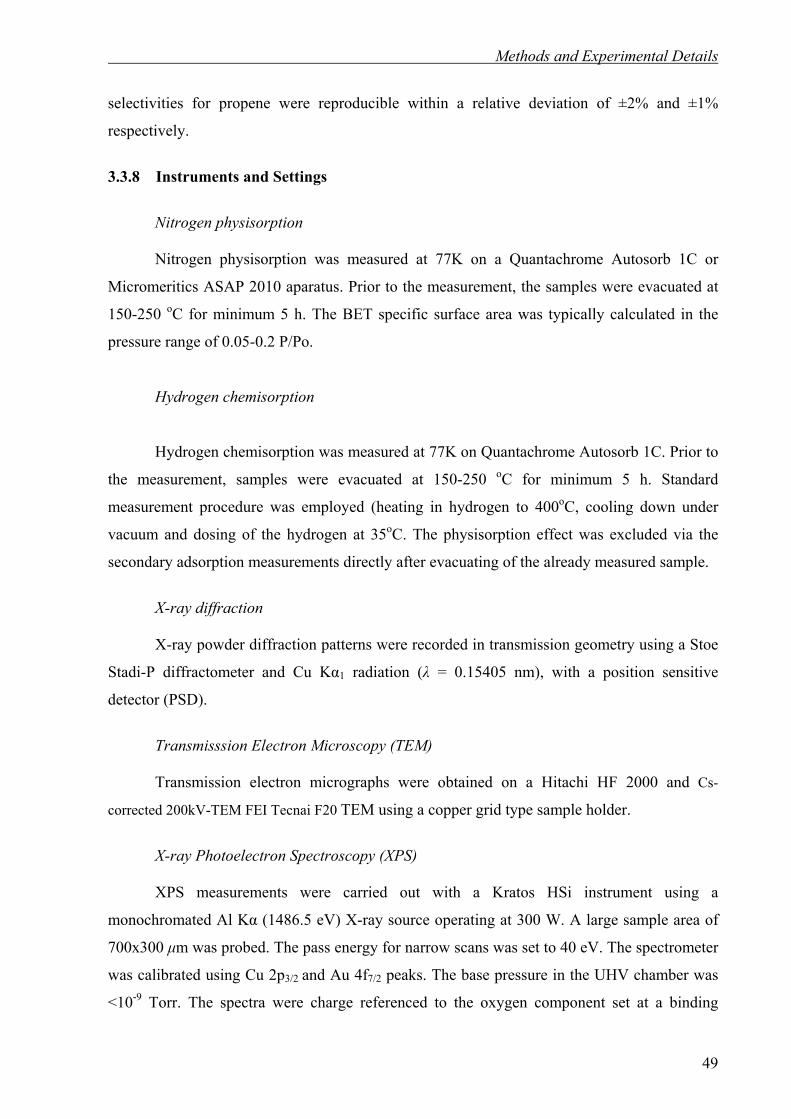
Methods and Experimental Details
selectivities for propene were reproducible within a relative deviation of ±2% and ±1%
respectively.
3.3.8 Instruments and Settings
Nitrogen physisorption
Nitrogen physisorption was measured at 77K on a Quantachrome Autosorb 1C or
Micromeritics ASAP 2010 aparatus. Prior to the measurement, the samples were evacuated at
150-250 oC for minimum 5 h. The BET specific surface area was typically calculated in the
pressure range of 0.05-0.2 P/Po.
Hydrogen chemisorption
Hydrogen chemisorption was measured at 77K on Quantachrome Autosorb 1C. Prior to
the measurement, samples were evacuated at 150-250 oC for minimum 5 h. Standard
measurement procedure was employed (heating in hydrogen to 400oC, cooling down under
vacuum and dosing of the hydrogen at 35oC. The physisorption effect was excluded via the
secondary adsorption measurements directly after evacuating of the already measured sample.
X-ray diffraction
X-ray powder diffraction patterns were recorded in transmission geometry using a Stoe
Stadi-P diffractometer and Cu Kα1 radiation (λ = 0.15405 nm), with a position sensitive
detector (PSD).
Transmisssion Electron Microscopy (TEM)
Transmission electron micrographs were obtained on a Hitachi HF 2000 and Cs-
corrected 200kV-TEM FEI Tecnai F20 TEM using a copper grid type sample holder.
X-ray Photoelectron Spectroscopy (XPS) XPS measurements were carried out with a Kratos HSi instrument using a
monochromated Al Kα (1486.5 eV) X-ray source operating at 300 W. A large sample area of
700x300 µm was probed. The pass energy for narrow scans was set to 40 eV. The spectrometer
was calibrated using Cu 2p3/2 and Au 4f7/2 peaks. The base pressure in the UHV chamber was
<10-9 Torr. The spectra were charge referenced to the oxygen component set at a binding
49

Methods and Experimental Details
energy of 533 eV for O 1s. For the curve fitting, a nonlinear least squares curve fitting
algorithm was used.
Coupled Gas Chromatography and Mass Spectroscopy (GC/MS) Samples taken periodically from the reactor were diluted further with Ethanol (1:1) and
injected into the GC/MS (Shimadzu GCMS-QP5000). Prior to measurements, known standard
mixtures of educt/product in ethanol were used for calibration. Helium was used as a Carrier
gas and capillary column was heated to 350 oC with a heating ramp of 5 oCmin-1.
Elemental analysis The high temperature combustion method was used to analyze carbon content (LECO
C200). For analyses of N,H,O, the hot gas extraction method was used (LECO TCH 600). The
chemical analyses of the content of platinum, palladium and vanadium, respectively, were
carried out with the ICP-OES (Inductively Coupled Plasma-Optical Emission Spectrometer)
Vista (Varian). The samples (amount of about 10 mg) were digested in a mixture of 1.5 ml HCl
(37 %), 0.5 ml HNO3 (65 %) and 1 ml HF (40 %) by heating. Generally, the solutions were
diluted to a volume of 50 mL using a volumetric flask.
Solid state NMR measurements
Solid-state NMR spectra were measured on a Bruker Avance 500WB spectrometer
using a 6-mm MAS (magic angle spinning) probe at a spinning rate of 10 kHz. As reference
Tetramethylsilane was used.
Coupled Thermogravimetry and Mass Spectroscopy (TG/MS) The TG/MS measurements were carried out using a Netzsch STA 409PC
thermobalance coupled with a Netzsch QMS 403C mass spectrometer via a capillary heated to
300 oC. Samples were heated in air up to 700 oC with a heating rate of 2 oCmin-1.
FT-IR-measurements
Samples were measured on the Nicolet MAGMA-IR 550 spectrometer. Prior to the
measurement samples were mixed with KBr and pressed in form of pellets.
50

Results and Discussion
4. Results and Discussion 4.1 Nanocasting of SBA-15 for the preparation of Mesoporous Silicon Carbide
One of the main aims of this PhD work was to find new synthesis methods of the
mesoporous high surface area silicon carbide. Such materials could be interesting high
temperature supports for catalysts due to their specific thermal, mechanical and chemical
properties (Chapter 2.4). For the first time it was shown here how to synthesize a high
surface area mesoporous silicon carbide using ordered mesoporous material as hard inert
template. Three different syntheses approaches were used to infilitrate ordered mesoporous
silica (SBA-15) with silicon carbide [Scheme 2]. Chemical vapor inlitration (CVI) from
simple silanes (dimethyldichlorosilane) in hydrogen (Chapter 0), reaction under autogenic
pressures (Chapter 0), and liquid infiltration of preceramic polycarbosilane precursor and
its subsequent conversion to SiC (Chapter 4.1.2). All these preparation methods differed
significantly and showed their own advantages and disadvantages. For example, in the case
of CVI, good control over the chemical composition of SiC was obtained (Si/C ratio),
while for the polymer derived materials such control was not possible. On the other hand,
polymer derived materials had highly ordered pore structure and a narrow pore size
distribution. In the following two chapters all three methods and their influence on the
properties of mesoporous SiC are presented and discussed.
Scheme 2. Synthetic methods for the preparation of mesoporous high surface area silicon carbide via templating of SBA-15. A - chemical vapor infiltration; B – reaction under autogenic pressure of tetramethyl silane (TMS); C – infiltration with preceramic polycarbosilane precursor
51
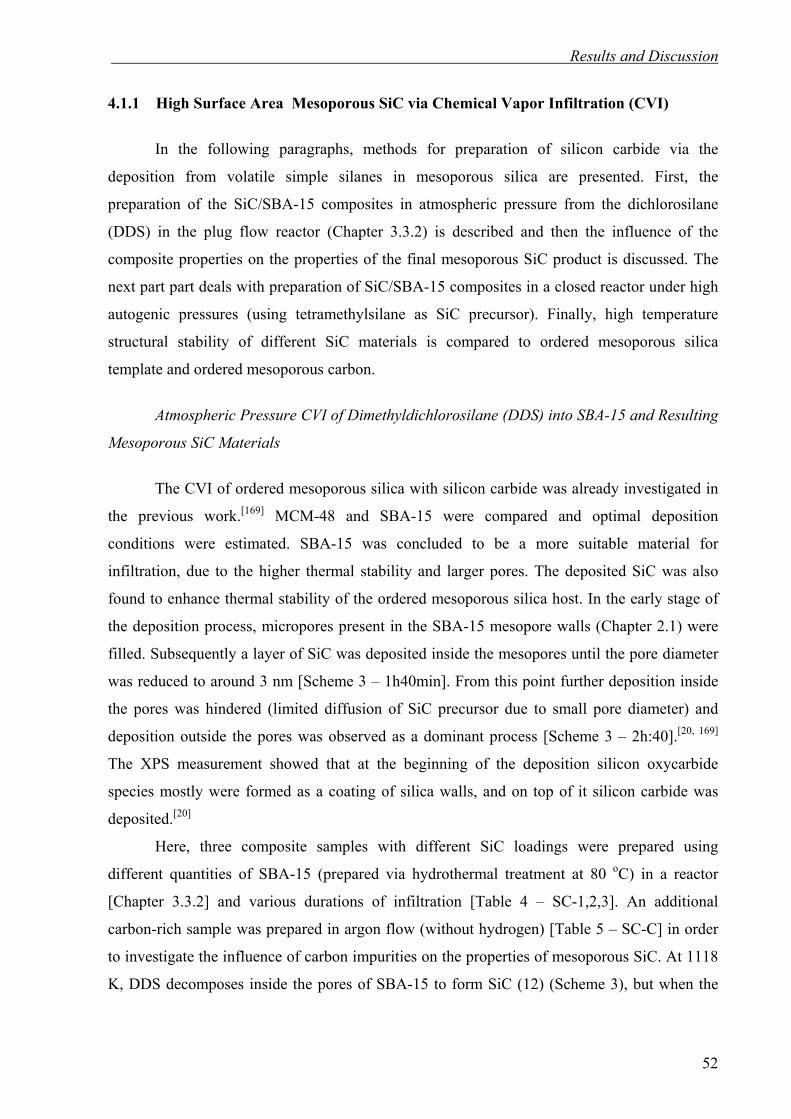
Results and Discussion
4.1.1 High Surface Area Mesoporous SiC via Chemical Vapor Infiltration (CVI)
In the following paragraphs, methods for preparation of silicon carbide via the
deposition from volatile simple silanes in mesoporous silica are presented. First, the
preparation of the SiC/SBA-15 composites in atmospheric pressure from the dichlorosilane
(DDS) in the plug flow reactor (Chapter 3.3.2) is described and then the influence of the
composite properties on the properties of the final mesoporous SiC product is discussed. The
next part part deals with preparation of SiC/SBA-15 composites in a closed reactor under high
autogenic pressures (using tetramethylsilane as SiC precursor). Finally, high temperature
structural stability of different SiC materials is compared to ordered mesoporous silica
template and ordered mesoporous carbon.
Atmospheric Pressure CVI of Dimethyldichlorosilane (DDS) into SBA-15 and Resulting
Mesoporous SiC Materials
The CVI of ordered mesoporous silica with silicon carbide was already investigated in
the previous work.[169] MCM-48 and SBA-15 were compared and optimal deposition
conditions were estimated. SBA-15 was concluded to be a more suitable material for
infiltration, due to the higher thermal stability and larger pores. The deposited SiC was also
found to enhance thermal stability of the ordered mesoporous silica host. In the early stage of
the deposition process, micropores present in the SBA-15 mesopore walls (Chapter 2.1) were
filled. Subsequently a layer of SiC was deposited inside the mesopores until the pore diameter
was reduced to around 3 nm [Scheme 3 – 1h40min]. From this point further deposition inside
the pores was hindered (limited diffusion of SiC precursor due to small pore diameter) and
deposition outside the pores was observed as a dominant process [Scheme 3 – 2h:40].[20, 169]
The XPS measurement showed that at the beginning of the deposition silicon oxycarbide
species mostly were formed as a coating of silica walls, and on top of it silicon carbide was
deposited.[20]
Here, three composite samples with different SiC loadings were prepared using
different quantities of SBA-15 (prepared via hydrothermal treatment at 80 oC) in a reactor
[Chapter 3.3.2] and various durations of infiltration [Table 4 – SC-1,2,3]. An additional
carbon-rich sample was prepared in argon flow (without hydrogen) [Table 5 – SC-C] in order
to investigate the influence of carbon impurities on the properties of mesoporous SiC. At 1118
K, DDS decomposes inside the pores of SBA-15 to form SiC (12) (Scheme 3), but when the
52

Results and Discussion
pore diameter is decreased substantially, also deposition of SiC outside the pore system
takes place due to limited diffusion of precursor molecules into the pore system.
(CH3)2SiCl2 → SiC + 2HCl +CH4 (12)
Scheme 3. Chemical vapor infiltration approach to the synthesis of high surface area SiC
The pore diameter of SBA-15 decreased dramatically from 5.5 nm to 3.5 nm already for
1h:40min of deposition time and 30 % of weight gain [Table 4 – SC-3]. Longer deposition
times and higher weight gains caused severe reduction of mesopore volume, but the pore
diameter did not change further (from 3.5 to around 2.9 and 3.0 nm for 60 and 95 % weight
gain) [Table 4 – SC-2, SC-1; Figure 29A]. This result confirmed that too long infiltration times
and too high weight gains caused deposition outside the mesopores.
Table 5. SiC/SBA-15 composites: preparation parameters and characterization.
Sample Infiltration time
[h:min]
SBA-15
weight
[g]
Weight gain
[wt%]
Surface area
[m2g-1]
Average
pore
diameterb)
[nm]
Mesopore
volumec)
[cm3g-1]
SC-1 3:40 0.6 95% 130 3.0 0.06 SC-2 3:40 2 60% 213 2.9 0.12 SC-3 1:40 2 30% 294 3.5 0.23
SC-Ca) 3:40 0.6 75% 140 3.4 0.12
a) Sample prepared in Ar/DDS flow – without H2, b) Average pore diameter (dp) calculated using total pore volume at 0.95 P/Po (Vp) and measured specific surface area (Sg) according to equation dp=4Vp/Sg c) Mesopore volume calculated using the BJH theory for pore size between 2 and 50 nm
53

Results and Discussion
After removal of silica from the composite material [Scheme 3], the resulting
mesoporous silicon carbide samples had a high specific surface area (higher than that of the
SiC/SBA-15 composite material) [Table 5] and showed Type IV nitrogen physisorption
isotherms, with a broad adsorption step, suggesting a broad pore size distribution [Figure 29B].
Table 6. Mesoporous SiC prepared by HF treatment of SiC/SBA-15 composites.
Sample Composite
used
Surface area
[m2g-1]
Average pore
diametera) [nm]
Mesopore
volumeb)
[cm3g-1]
Carbon content
[wt. %]
SiC-1 SC-1 410 3.1 0.31 25.9 SiC-2 SC-2 578 4.6 0.71 25.2 SiC-3 SC-3 509 7.4 0.96 26.5 SiC-C SC-C 830 3.1 0.52 36.3
a) Average pore diameter (dp)calculated using total pore volume at 0.95 P/Po (Vp) and measured specific surface area (Sg) according to equation dp=4Vp/Sg, b) Mesopore volume calculated using the BJH theory for pore size between 2 and 50 nm
The overall nitrogen adsorption capacities were increased, as compared to the
composite samples and the highest mesopore volume was measured for SiC-3 with Vp = 0.96
cm3g-1 and a surface area of 509 m2g-1. A sample prepared with longer infiltration duration
(SiC-2) showed a significantly lower mesopore volume (0.71 cm3g-1), and slightly higher
surface area (578 m2g-1). SiC-1 prepared from the nanocomposite with the highest SiC loading
has the lowest surface area and lowest mesopore volume (410 m2g-1 and 0.31 cm3g-1). This
clearly indicates, that too long infiltration duration and too high loadings lead to deposition of
SiC outside the pore structure, resulting in agglomerated materials with larger particles.
0
100
200
300
400
500
600
700
0 0,5 1
700
0
100
200
300
400
500
600
0 0.5 1
SBA-15
SC-1
SC-2
SC-3
volu
me
adso
rbed
[cm
3 g-1
]
relative pressure [P/Po]
SC-C
0
100
200
300
400
500
600
700
0 0,5 1
700
0
100
200
300
400
500
600
0 0.5 1
SBA-15
SC-1
SC-2
SC-3
volu
me
adso
rbed
[cm
3 g-1
]
relative pressure [P/Po]
SC-C
0
100
200
300
400
500
600
700
0 0,5 1
700
0
100
200
300
400
500
600
0 0.5 1
SiC-1SiC-2
SiC-3
volu
me
adso
rbed
[cm
3 g-1
]
relative pressure [P/Po]
SiC-C
0
100
200
300
400
500
600
700
0 0,5 1
700
0
100
200
300
400
500
600
0 0.5 1
SiC-1SiC-2
SiC-3
volu
me
adso
rbed
[cm
3 g-1
]
relative pressure [P/Po]
SiC-C
(A) (B)
0
100
200
300
400
500
600
700
0 0,5 1
700
0
100
200
300
400
500
600
0 0.5 1
SBA-15
SC-1
SC-2
SC-3
volu
me
adso
rbed
[cm
3 g-1
]
relative pressure [P/Po]
SC-C
0
100
200
300
400
500
600
700
0 0,5 1
700
0
100
200
300
400
500
600
0 0.5 1
SBA-15
SC-1
SC-2
SC-3
volu
me
adso
rbed
[cm
3 g-1
]
relative pressure [P/Po]
SC-C
0
100
200
300
400
500
600
700
0 0,5 1
700
0
100
200
300
400
500
600
0 0.5 1
SiC-1SiC-2
SiC-3
volu
me
adso
rbed
[cm
3 g-1
]
relative pressure [P/Po]
SiC-C
0
100
200
300
400
500
600
700
0 0,5 1
700
0
100
200
300
400
500
600
0 0.5 1
SiC-1SiC-2
SiC-3
volu
me
adso
rbed
[cm
3 g-1
]
relative pressure [P/Po]
SiC-C
(A) (B)
Figure 29. Nitrogen adsorption isotherms (measured at 77K) (A) of SiC/SBA-15 materials (B) of mesoporous SiC samples derived from SiC-SBA-15 nanocomposites
54

Results and Discussion
However, the highest surface area was measured for the carbon-rich sample SiC-C (830
m2g-1), while the shape of the isotherm was similar to that of SiC-1 (410 m2g-1). The latter
could be due to slightly lower density of carbon materials (1.8-2.2 gcm-3) as compared to the
density of silica (2.2-2.6 gcm-3) or silicon carbide (3.2 gcm-3) as well as to the presence of
microporosity in deposited carbon. Transmission electron micrographs of porous SiC-3 sample
[Figure 30C,D] reveal a slightly ordered structure (short range ordering) in form of one-
dimensional tubes/rods. In the case of samples prepared with higher matrix loadings (SiC-2
and SiC-1) this rod structure is less visible due to the material deposited outside the pores
during the CVI process [Figure 30A, B]. However, the low angle X-ray measurements did not
reveal any long range ordering of all mesoporous SiC samples.
100nm
SiC-1
100nm100nm100nm
SiC-1
100nm
SiC-3
100nm
SiC-3
100nm
SiC-2
100nm100nm100nm
SiC-2
(A) (B)
(C) 100nm
SiC-3
(D)
100nm
SiC-1
100nm100nm100nm
SiC-1
100nm100nm
SiC-3
100nm
SiC-3
100nm
SiC-2
100nm100nm100nm
SiC-2
(A) (B)
(C) 100nm
SiC-3
(D)
Figure 30. TEM micrographs of mesoporous SiC samples
Wide angle X-ray powder diffraction patterns show that mesoporous silicon carbides
prepared with short infiltration duration and low loadings (SiC-2, SiC-3) are X-ray amorphous
(as well as SiC-C sample), while the sample with the highest loading (SiC-1) is crystalline and
reflections of cubic β-SiC (JCPDS: 73-1665) are detected [Figure 31A]. A small shoulder on
the left side of the 111 reflection for SiC-1 sample confirms also the presence of minor
55
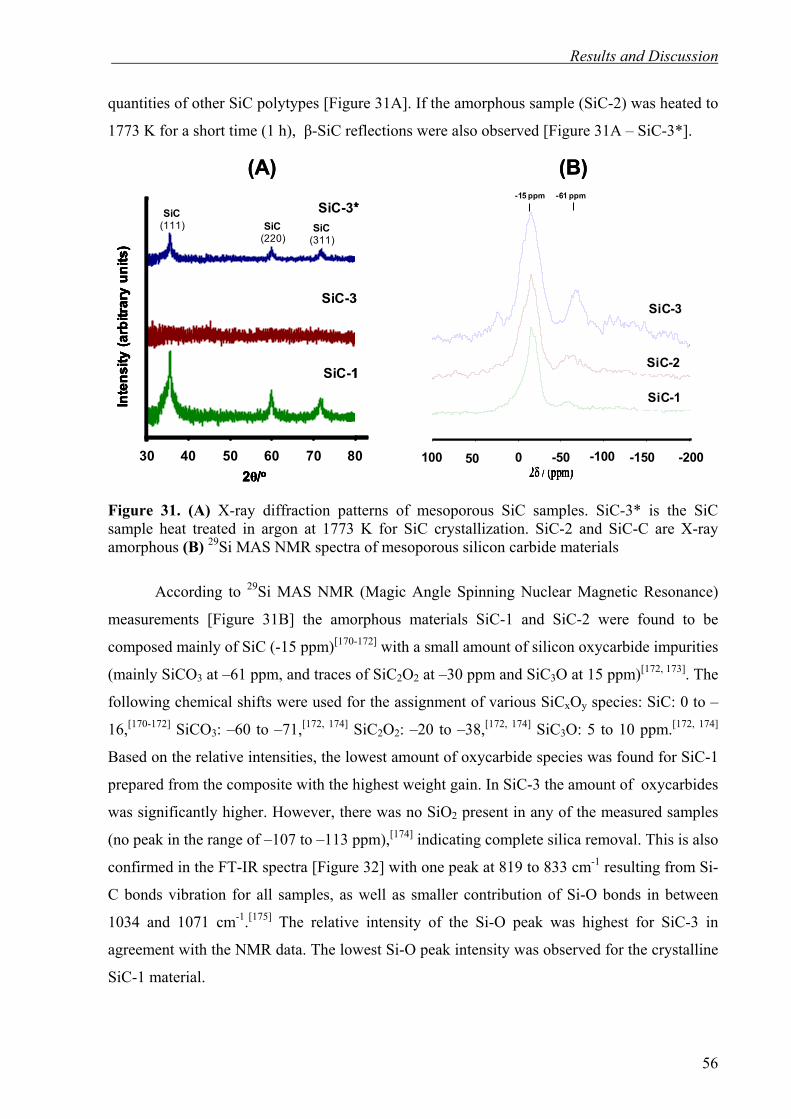
Results and Discussion
quantities of other SiC polytypes [Figure 31A]. If the amorphous sample (SiC-2) was heated to
1773 K for a short time (1 h), β-SiC reflections were also observed [Figure 31A – SiC-3*].
30 40 50 60 70 80
2θ/o30 40 706050 80
Inte
nsity
(arb
itrar
y un
its)
SiC-1
SiC-3
SiC-3*SiC(111) SiC
(220)SiC
(311)
30 40 50 60 70 80
2θ/o30 40 706050 80
Inte
nsity
(arb
itrar
y un
its)
SiC-1
SiC-3
SiC-3*SiC(111) SiC
(220)SiC
(311)
-200-150-100-50050100
SiC-1
SiC-2
SiC-3
2δ / (ppm)
-200-150-100-50050100
SiC-1
SiC-2
SiC-3
-200-150-100-50050100
SiC-1
SiC-2
SiC-3
2δ / (ppm)100 50 0 -50 -100 -150 -200
SiC-1
SiC-2
SiC-3
(A) (B)-15 ppm -61 ppm
30 40 50 60 70 80
2θ/o30 40 706050 80
Inte
nsity
(arb
itrar
y un
its)
SiC-1
SiC-3
SiC-3*SiC(111) SiC
(220)SiC
(311)
30 40 50 60 70 80
2θ/o30 40 706050 80
Inte
nsity
(arb
itrar
y un
its)
SiC-1
SiC-3
SiC-3*SiC(111) SiC
(220)SiC
(311)
-200-150-100-50050100
SiC-1
SiC-2
SiC-3
2δ / (ppm)
-200-150-100-50050100
SiC-1
SiC-2
SiC-3
-200-150-100-50050100
SiC-1
SiC-2
SiC-3
2δ / (ppm)100 50 0 -50 -100 -150 -200
SiC-1
SiC-2
SiC-3
(A) (B)-15 ppm -61 ppm
Figure 31. (A) X-ray diffraction patterns of mesoporous SiC samples. SiC-3* is the SiC sample heat treated in argon at 1773 K for SiC crystallization. SiC-2 and SiC-C are X-ray amorphous (B) 29Si MAS NMR spectra of mesoporous silicon carbide materials
According to 29Si MAS NMR (Magic Angle Spinning Nuclear Magnetic Resonance)
measurements [Figure 31B] the amorphous materials SiC-1 and SiC-2 were found to be
composed mainly of SiC (-15 ppm)[170-172] with a small amount of silicon oxycarbide impurities
(mainly SiCO3 at –61 ppm, and traces of SiC2O2 at –30 ppm and SiC3O at 15 ppm)[172, 173]. The
following chemical shifts were used for the assignment of various SiCxOy species: SiC: 0 to –
16,[170-172] SiCO3: –60 to –71,[172, 174] SiC2O2: –20 to –38,[172, 174] SiC3O: 5 to 10 ppm.[172, 174]
Based on the relative intensities, the lowest amount of oxycarbide species was found for SiC-1
prepared from the composite with the highest weight gain. In SiC-3 the amount of oxycarbides
was significantly higher. However, there was no SiO2 present in any of the measured samples
(no peak in the range of –107 to –113 ppm),[174] indicating complete silica removal. This is also
confirmed in the FT-IR spectra [Figure 32] with one peak at 819 to 833 cm-1 resulting from Si-
C bonds vibration for all samples, as well as smaller contribution of Si-O bonds in between
1034 and 1071 cm-1.[175] The relative intensity of the Si-O peak was highest for SiC-3 in
agreement with the NMR data. The lowest Si-O peak intensity was observed for the crystalline
SiC-1 material.
56

Results and Discussion
Si-O
Si-C
SiC-3
SiC-1
SiC-2
SiC-C
500150025003500Wavenumbers [cm-1]
Tran
smitt
ance
[%]
Si-O
Si-C
SiC-3
SiC-1
SiC-2
SiC-C
500150025003500Wavenumbers [cm-1]
Tran
smitt
ance
[%]
Figure 32. FT-IR spectra of the mesoporous silicon carbide materials
The elemental analysis showed the carbon content in the range of 25-27 wt%, which is slightly
lower than the theoretical value of 30 wt% for pure SiC, due to the presence of silicon
oxycarbide. However, in the case of SiC-C sample, a higher carbon content (36 wt%) was
measured. TG measurements [Figure 33] showed a weight gain of 19 % at 1300 oC in air (SiC-
1) due to the surface oxidation of SiC into SiO2. Although for complete oxidation 50% weight
gain is expected, passivation with silica protects the SiC particles from complete oxidation and
process kinetics become significantly slower. In the case of carbon rich SiC-C, a weight loss of
25 wt% was observed due to the burning of the excess free-carbon. According to X-ray
diffraction pattern, material resulting from SiC-1 oxidation showed presence of large
cristobalite crystallites (JCPDS: 39-1425).
60
70
80
90
100
110
120
0 300 600 900 1200
SiC-1
SiC-C
Temperature (oC)
Sam
ple
wei
ght(
%)
60
70
80
90
100
110
120
0 300 600 900 1200
SiC-C
Temperature (oC)
Sam
ple
wei
ght(
%) SiC-1
Figure 33. Thermogravimetric measurements of SiC-1 and SiC-C silicon carbide samples in air (heating rate 3 oCmin-1)
57

Results and Discussion
CVI of TMS into SBA-15 under autogenic pressure
In addition to atmospheric pressure deposition of SiC, also formation of SiC under high
autogenic pressures in the presence of SBA-15 was studied. The possibility of SiC preparation
from simple silanes in an autoclave heated to 1273 K was reported by Pol et al.[138] However,
the surface area of such materials did not exceed 150 m2g-1. Based on the same principle, liquid
TMS (tetramethylsilane) was used as a precursor and the decomposition was carried out in a
closed Swagelok cell in the presence of SBA-15 [Scheme 4]. TMS has a high vapor pressure
and easily condensed inside the pores of the mesoporous silica network. Upon the heat
treatment to 1273 K it decomposed to form SiC according to reaction (13):
Si(CH3)4 → SiC + 3CH4 (13)
Scheme 4. Preparation of high surface area SiC under autogenic pressure conditions After synthesis at 1273 K, the autoclave was opened and the resulting product was treated with
HF solution in order to dissolve the silica matrix [Scheme 4]. For comparison one sample was
prepared without SBA-15 [Table 7 – sample AP-SiC*] (only TMS was present in the
autoclave). The X-ray powder patterns showed the presence of cubic β-SiC (JCPDS: 73-1665)
[Figure 35] for both samples (AP-SiC: prepared with SBA-15 matrix, and AP-SiC* without
SBA-15). In the case of the sample prepared without SBA-15, narrow peaks were observed,
indicating the presence of large crystallites. In contrast, the sample prepared in the presence of
SBA-15 showed broad peaks, and the crystallite size calculated according to the Scherrer
equation was found to be 4 nm. The FT-IR spectra of AP-SiC showed Si-C vibrations at 820
cm-1, and the absence of Si-O bonds [Figure 34].
58

Results and Discussion
Si-C
AP-SiC
500150025003500Wavenumbers [cm-1]
Tran
smitt
ance
[%]
Si-C
AP-SiC
500150025003500Wavenumbers [cm-1]
Tran
smitt
ance
[%]
Figure 34. FT-IR spectrum of AP-SiC.
Table 7. High surface area SiC prepared under autogenic pressure conditions – parameters of synthesis and textural characteristics.
Sample SBA-15
weight [g]
Volume of
TMS added
[ml]
Surface area
[m2g-1]
Average pore
diameter [nm]
Mesopore
volumed)
[cm3g-1] a)AP-SiC* - 1.50 212 2.3 0.11 b)AP-SiC-SBA-15 0.225 1.75 387 2.8 0.25 c)AP-SiC - - 636 3.0 0.43
a) SiC prepared in the absence of SBA-15, b) Composite of SiC and SBA-15 before dissolving of the silica matrix, c) SiC prepared by HF treatment of SiC/SBA-15 composite material (AP-SiC-SBA-15), d) Mesopore volume calculated using the BJH theory for pore size between 2 and 50 nm
2θ/o30 40 706050 80
Inte
nsity
(arb
itrar
y un
its)
SiC(111)
SiC(220)
SiC(311)
AP-SiC*
AP-SiC
2θ/o30 40 706050 80
Inte
nsity
(arb
itrar
y un
its)
SiC(111)
SiC(220)
SiC(311)
AP-SiC*
AP-SiC
Figure 35. X-ray diffraction patterns of high surface area silicon carbide synthesized under autogenic pressure with (AP-SiC) or without (AP-SiC*) the presence of ordered mesoporous silica SBA-15.
The high specific surface area (636 m2g-1) confirmed that in the case of AP-SiC, small
nanoparticles were synthesized inside the pores of SBA-15. The residual surface area of 387
m2g-1 measured for the composite material AP-SiC-SBA-15, suggested that the pores of SBA-
15 were not completely filled [Table 6]. The AP-SiC* material prepared without SBA-15 as a
59

Results and Discussion
matrix had significantly lower specific surface area of 212 m2g-1, which is in good agreement
with the X-ray diffractograms showing narrow peaks due to the presence of larger particles.
Nitrogen physisorption isotherms [Figure 36] indicated that both the nanocomposite material
and the resulting SiC had a broad pore size distribution.
0
100
200
300
400
500
600
0
100
200
300
400
500
600
0
volu
me
adso
rbed
[cm
3 g-1
]
0.5 1relative pressure [P/Po]
SBA-15
AP-SiC-SBA-15
AP-SiC
0
100
200
300
400
500
600
0
100
200
300
400
500
600
0
volu
me
adso
rbed
[cm
3 g-1
]
0.5 1relative pressure [P/Po]
SBA-15
AP-SiC-SBA-15
AP-SiCPore diameter [Å]
0
0,01
0,02
20 70 120
Por
e v
olum
e (c
m3 g
-1Å
-1)
0
100
200
300
400
500
600
0
100
200
300
400
500
600
0
volu
me
adso
rbed
[cm
3 g-1
]
0.5 1relative pressure [P/Po]
SBA-15
AP-SiC-SBA-15
AP-SiC
0
100
200
300
400
500
600
0
100
200
300
400
500
600
0
volu
me
adso
rbed
[cm
3 g-1
]
0.5 1relative pressure [P/Po]
SBA-15
AP-SiC-SBA-15
AP-SiCPore diameter [Å]
0
0,01
0,02
20 70 120
Por
e v
olum
e (c
m3 g
-1Å
-1)
Figure 36. Nitrogen physisorption isotherms (77 K) of materials prepared via TMS infiltration.
The mesopore size distribution was therefore broad (between 2 and 5 nm according to BJH
theory) and micropores were present as well. Elemental analysis showed a carbon content of 27
wt%, close to the theoretical value for pure SiC (30 %). This was also in good agreement with
TG measurements showing 28 % weight gain due to the oxidation of SiC to SiO2, the highest
value among all samples, confirming that the small particles had only minor impurities of free
carbon.
Thermal Stability of SiC, SBA-15 and CMK-1 at 1573 K
For the investigation of the thermal textural stability, silicon carbide samples were compared
with the ordered mesoporous carbon CMK-1 and the pure SBA-15 template. The stability of
the latter one was already investigated earlier[176], however, for CMK materials only
thermogravimetric data were available[177]. All samples were heated to 1573 K in an inert
atmosphere (Argon) for a given duration [Table 7]. Mesoporous silicon carbide materials had
significantly higher thermal stability in inert conditions [Table 7]. In the first 6 hours of
treatment the specific surface area decreased by 23 % for SiC-2 and by 78% for SiC-1, while
after 24 hour treatment reduction by 63 % (SiC-3) and 99% (SiC-C) was observed. The latter
could be an effect of sintering of nano-sized silicon carbide material, as well as of
60
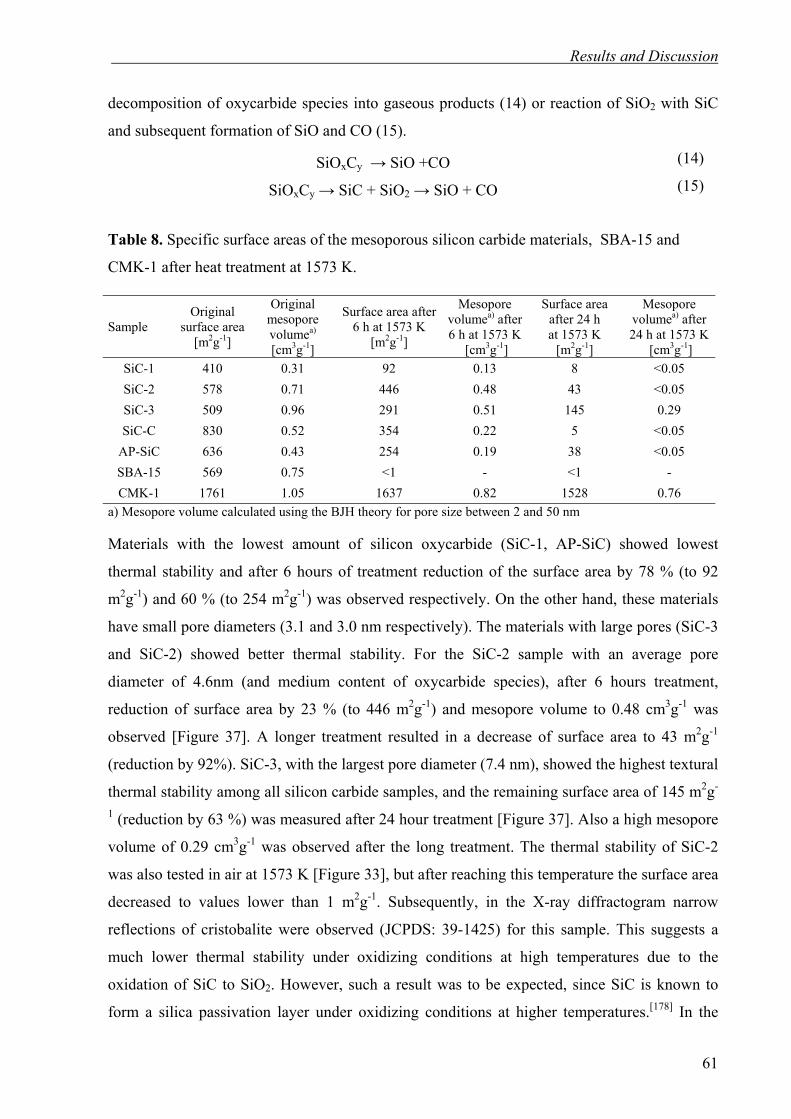
Results and Discussion
decomposition of oxycarbide species into gaseous products (14) or reaction of SiO2 with SiC
and subsequent formation of SiO and CO (15).
SiOxCy → SiO +CO (14)
SiOxCy → SiC + SiO2 → SiO + CO (15)
Table 8. Specific surface areas of the mesoporous silicon carbide materials, SBA-15 and
CMK-1 after heat treatment at 1573 K.
a) Mesopore volume calculated using the BJH theory for pore size between 2 and 50 nm
Sample Original
surface area[m2g-1]
Original mesopore volumea) [cm3g-1]
Surface area after 6 h at 1573 K
[m2g-1]
Mesopore volumea) after 6 h at 1573 K
[cm3g-1]
Surface area after 24 h at 1573 K
[m2g-1]
Mesopore volumea) after 24 h at 1573 K
[cm3g-1] SiC-1 410 0.31 92 0.13 8 <0.05 SiC-2 578 0.71 446 0.48 43 <0.05 SiC-3 509 0.96 291 0.51 145 0.29 SiC-C 830 0.52 354 0.22 5 <0.05
AP-SiC 636 0.43 254 0.19 38 <0.05 SBA-15 569 0.75 <1 - <1 - CMK-1 1761 1.05 1637 0.82 1528 0.76
Materials with the lowest amount of silicon oxycarbide (SiC-1, AP-SiC) showed lowest
thermal stability and after 6 hours of treatment reduction of the surface area by 78 % (to 92
m2g-1) and 60 % (to 254 m2g-1) was observed respectively. On the other hand, these materials
have small pore diameters (3.1 and 3.0 nm respectively). The materials with large pores (SiC-3
and SiC-2) showed better thermal stability. For the SiC-2 sample with an average pore
diameter of 4.6nm (and medium content of oxycarbide species), after 6 hours treatment,
reduction of surface area by 23 % (to 446 m2g-1) and mesopore volume to 0.48 cm3g-1 was
observed [Figure 37]. A longer treatment resulted in a decrease of surface area to 43 m2g-1
(reduction by 92%). SiC-3, with the largest pore diameter (7.4 nm), showed the highest textural
thermal stability among all silicon carbide samples, and the remaining surface area of 145 m2g-
1 (reduction by 63 %) was measured after 24 hour treatment [Figure 37]. Also a high mesopore
volume of 0.29 cm3g-1 was observed after the long treatment. The thermal stability of SiC-2
was also tested in air at 1573 K [Figure 33], but after reaching this temperature the surface area
decreased to values lower than 1 m2g-1. Subsequently, in the X-ray diffractogram narrow
reflections of cristobalite were observed (JCPDS: 39-1425) for this sample. This suggests a
much lower thermal stability under oxidizing conditions at high temperatures due to the
oxidation of SiC to SiO2. However, such a result was to be expected, since SiC is known to
form a silica passivation layer under oxidizing conditions at higher temperatures.[178] In the
61
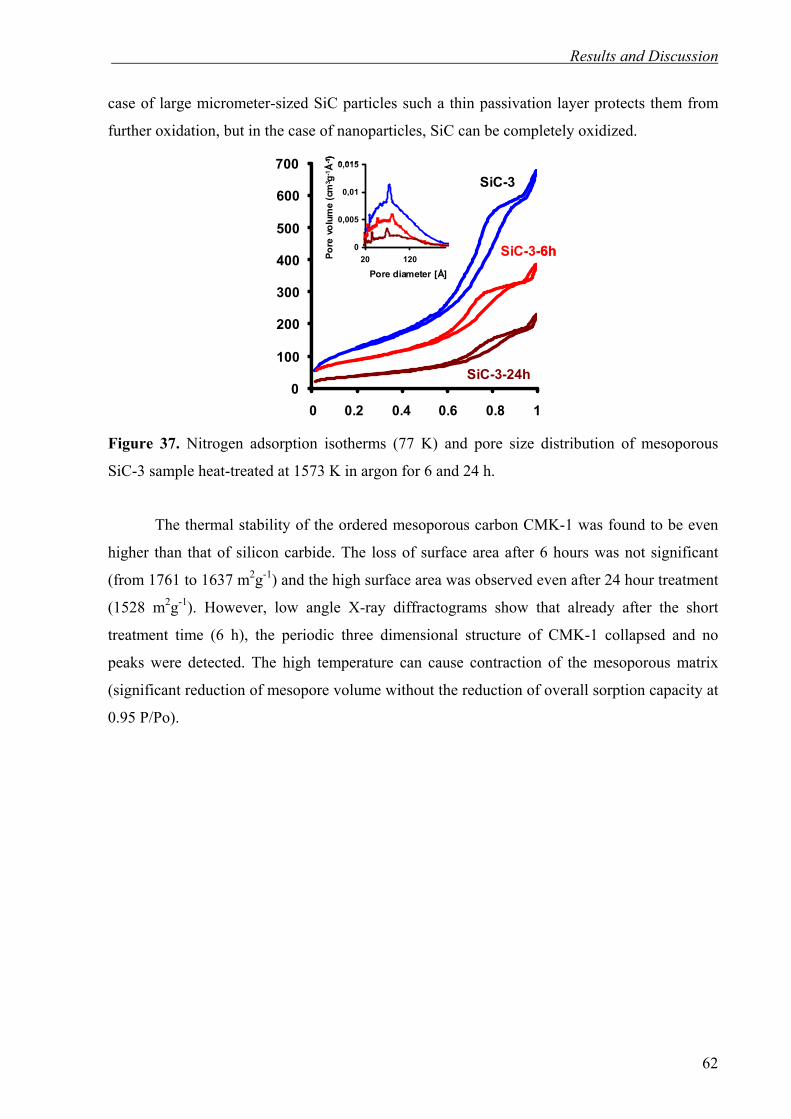
Results and Discussion
case of large micrometer-sized SiC particles such a thin passivation layer protects them from
further oxidation, but in the case of nanoparticles, SiC can be completely oxidized.
0
100
200
300
400
500
600
700
0 0,2 0,4 0,6 0,8 10.2 0.4 0.6 0.8 10
100
200
300
400
500
600
700
0
700SiC-3
SiC-3-6h
SiC-3-24h
0
0,005
0,01
0,015
20 120Pore
vol
ume
(cm
3 g-1Å
-1)
Pore diameter [Å]
0
100
200
300
400
500
600
700
0 0,2 0,4 0,6 0,8 10.2 0.4 0.6 0.8 10
100
200
300
400
500
600
700
0
700SiC-3
0
0,005
0,01
0,015
20 120Pore
vol
ume
(cm
3 g-1Å
-1)
Pore diameter [Å]
SiC-3-6h
SiC-3-24h
Figure 37. Nitrogen adsorption isotherms (77 K) and pore size distribution of mesoporous
SiC-3 sample heat-treated at 1573 K in argon for 6 and 24 h.
The thermal stability of the ordered mesoporous carbon CMK-1 was found to be even
higher than that of silicon carbide. The loss of surface area after 6 hours was not significant
(from 1761 to 1637 m2g-1) and the high surface area was observed even after 24 hour treatment
(1528 m2g-1). However, low angle X-ray diffractograms show that already after the short
treatment time (6 h), the periodic three dimensional structure of CMK-1 collapsed and no
peaks were detected. The high temperature can cause contraction of the mesoporous matrix
(significant reduction of mesopore volume without the reduction of overall sorption capacity at
0.95 P/Po).
62

Results and Discussion
Conclusions for CVI preparation method
It was shown how different precursors, deposition parameters and loadings of SiC/SBA-15
nanocomposites influence the textural properties of mesoporous silicon carbide prepared from
them. High loadings cause deposition outside SBA-15 channels and thus, the obtained SiC
material has a low surface area and mesopore volume. Composites with lowest loading
produce SiC materials with a high mesopore volume but a broad pore size distribution and high
surface area of 510 m2g-1. As an alternative route to the ambient pressure CVD process also
deposition at high autogenic pressures can be employed resulting in materials with even higher
surface area (626 m2g-1). The elemental analysis indicates the formation of silicon oxycarbide
on the surface of high surface area SiC. The amount of free carbon deposited was examined
using thermogravimetric measurements in air and elemental analysis, and was found to
increase the measured specific surface areas if deposited in excess due to lower density of
porous carbon materials. High surface area silicon carbide shows a higher thermal stability at
1573 K as compared to pure SBA-15. The thermal stability of ordered mesoporous carbon
(CMK-1) is even better than that of porous SiC tested under the same conditions. However, the
mesoporous silicon carbide materials prepared via the CVI method did not show any ordering
of the pore system in the low angle X-ray diffraction patterns.
63
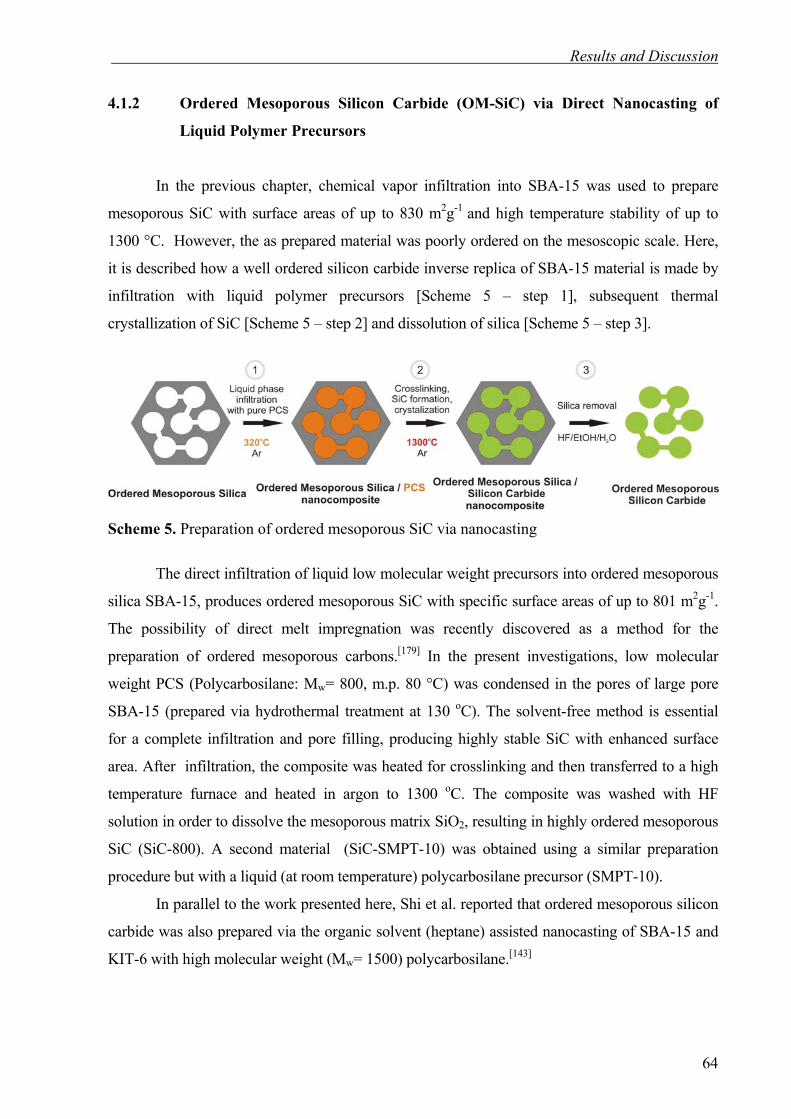
Results and Discussion
4.1.2 Ordered Mesoporous Silicon Carbide (OM-SiC) via Direct Nanocasting of
Liquid Polymer Precursors
In the previous chapter, chemical vapor infiltration into SBA-15 was used to prepare
mesoporous SiC with surface areas of up to 830 m2g-1 and high temperature stability of up to
1300 °C. However, the as prepared material was poorly ordered on the mesoscopic scale. Here,
it is described how a well ordered silicon carbide inverse replica of SBA-15 material is made by
infiltration with liquid polymer precursors [Scheme 5 – step 1], subsequent thermal
crystallization of SiC [Scheme 5 – step 2] and dissolution of silica [Scheme 5 – step 3].
Scheme 5. Preparation of ordered mesoporous SiC via nanocasting
The direct infiltration of liquid low molecular weight precursors into ordered mesoporous
silica SBA-15, produces ordered mesoporous SiC with specific surface areas of up to 801 m2g-1.
The possibility of direct melt impregnation was recently discovered as a method for the
preparation of ordered mesoporous carbons.[179] In the present investigations, low molecular
weight PCS (Polycarbosilane: Mw= 800, m.p. 80 °C) was condensed in the pores of large pore
SBA-15 (prepared via hydrothermal treatment at 130 oC). The solvent-free method is essential
for a complete infiltration and pore filling, producing highly stable SiC with enhanced surface
area. After infiltration, the composite was heated for crosslinking and then transferred to a high
temperature furnace and heated in argon to 1300 oC. The composite was washed with HF
solution in order to dissolve the mesoporous matrix SiO2, resulting in highly ordered mesoporous
SiC (SiC-800). A second material (SiC-SMPT-10) was obtained using a similar preparation
procedure but with a liquid (at room temperature) polycarbosilane precursor (SMPT-10).
In parallel to the work presented here, Shi et al. reported that ordered mesoporous silicon
carbide was also prepared via the organic solvent (heptane) assisted nanocasting of SBA-15 and
KIT-6 with high molecular weight (Mw= 1500) polycarbosilane.[143]
64

Results and Discussion
O/2θ
0 . 0
0 . 0
0.8 1.2 1.6 2.0 2.4
Inte
nsity
(arb
itrar
y un
its)
SiC-800
SiC-SMPT-10
O/2θ
a) b)
SiC-SMPT-10
SiC-800
40 60 80
SiC(111)
SiC(220) SiC
(311)
O/2θ
0 . 0
0 . 0
0.8 1.2 1.6 2.0 2.4
Inte
nsity
(arb
itrar
y un
its)
SiC-800
SiC-SMPT-10
O/2θ
a) b)
SiC-SMPT-10
SiC-800
40 60 80
SiC(111)
SiC(220) SiC
(311)
Figure 38. a) Low angle X-ray diffraction patterns of ordered silicon carbide, b) Wide angle X-ray diffraction patterns
According to low angle XRD patterns SiC-800 is ordered on the mesoscopic scale
(Figure 38a) and one peak was detected (d = 8.3 nm). However, also nano-crystalline cubic β-
SiC was detected in wide angle measurements (Figure 38b). According to nitrogen
physisorption measurements (Figure 39a) the material has a high specific surface area of 648
m2g-1 and a narrow pore size distribution with an average pore diameter of 3 nm (Figure 39b).
Nitr
ogen
vol
ume
adso
rbed
[cm
3 g-1
] SiC-SMPT-10
SiC-800
800
600
200
00 0.2 0.4 0.6 0.8 1 20 60 100 140 160Relative pressure P/Po Pore diameter [Å]
BJH
por
e si
ze d
istri
butio
n(a
.u.)
SiC-SMPT-10
SiC-800
a) b)
Nitr
ogen
vol
ume
adso
rbed
[cm
3 g-1
] SiC-SMPT-10
SiC-800
800
600
200
00 0.2 0.4 0.6 0.8 1 20 60 100 140 160Relative pressure P/Po Pore diameter [Å]
BJH
por
e si
ze d
istri
butio
n(a
.u.)
SiC-SMPT-10
SiC-800
a) b)
Figure 39. a) Nitrogen physisorption isotherms measured for ordered silicon carbide samples with 200 cm3g-1 offset, b) BJH pore size distribution of silicon carbide samples is calculated from the adsorption branch of the isotherms
An even higher surface area was measured for SiC-SMPT-10 (801 m2g-1), also with
narrow pore size distribution and an average pore diameter of 3nm. In contrast to SiC-800, the
65

Results and Discussion
low angle X-ray diffractograms of SiC-SMPT-10 showed two weak peaks at 2θ = 1.06° (d = 8.3
nm, as in the case of SiC-800) and a second one with similar intensity at 2θ = 1.83° (d = 4.8
nm). The presence of the second peak indicated the possibility of tubular structure formation,
similar to that reported for CMK-5 (an inverse replica of SBA-15, with hexagonal ordered
nanopipes).[77, 180, 181] In the host silica matrix SBA-15, the position of the (100) peak was at 2θ =
0.87 (d = 10.2 nm) which was caused by contraction of the silica host (by 18%) due to the high
temperature used in the pyrolysis process. The total pore volumes measured (P/Po = 0.95) for
both samples were also high: 0.48 cm3g-1 for SiC-800 and 0.58 cm3g-1 for SiC-SMPT-10.
Interestingly, the ordered mesoporous SiC-SMPT-10 material was amorphous on atomic scale
and wide angle X-ray measurements [Figure 38b] showed no reflections of a crystalline SiC
phase.
Significant differences with respect to the precursor used were observed for the SBA-
15/SiC composites before HF etching. In the case of SBA-15/SiC-800 composite, the specific
surface area was still high (90 m2 g-1), while for the SBA-15/SiC-SMPT-10 composite material,
the surface area was extremely low (<10 m2g-1) and no residual mesoporosity was present
demonstrating efficient pore filling. Although the specific surface areas of OM-SiC are higher
than for CVD[20]- or autogenic pressure-derived silicon carbides,[21] considerable amounts of
free-carbon may be present in polymer-derived SiC increasing the specific surface area due to a
lower density of the material. Assuming a density of 3.2 gcm-3 for SiC and 2.6 gcm-3 for silica,
an inverse replica of SBA-15 with a surface area of 610 m2g-1 should yield SiC with a surface
area of 496 m2 g-1, which was lower than the observed value.
Thermal gravimetric analysis in air showed that SiC-800 lost 12 wt.% at 600 oC due to
oxidation of free-carbon. Similarly, oxidation of ordered mesoporous carbons took place at
similar temperature.[177] Above this temperature, an additional weight gain of 4 wt% was
observed up to 1300 oC due to silicon carbide oxidation and silica formation giving a final mass
loss of 8 wt.%. Elemental analysis revealed a carbon content of 35 wt.% close to the theoretical
value (30 wt.%), but also considerable amounts of oxygen were detected (14 wt.%). The latter
was caused by the presence of oxycarbide species on the surface of SiC. The oxycarbide can
substantially contribute to the bulk chemical composition in the case of high surface area
materials.[175] In IR spectra Si-C bonds are detected in both materials (833 cm-1), and a less
intensive peak indicating the presence of Si-O bonds (1046 cm-1) as well (Figure 40). For higher
heating rates employed (100 oC h-1) the measured amount of carbon was lower (28 wt.%), but
66

Results and Discussion
also a lower ceramic yield of 54 % was observed as compared to 77% obtained in the 50 oC h-1
heating ramp.
500150025003500
Wavenumbers [cm-1]
Tran
smitt
ance
[%]
SiC-SMPT-10
SiC-800
Si-O
Si-C
500150025003500Wavenumbers [cm-1]
Tran
smitt
ance
[%]
SiC-SMPT-10
SiC-800
Si-O
Si-C
Figure 40. IR spectra of the mesoporous silicon carbide materials
Figure 41. Transmission electron micrographs of the a,b,c,d) SiC-800 sample and e,f) SiC-
SMPT-10 sample. Insets show the corresponding Fourier transformations.
67

Results and Discussion
Transmission electron micrographs reveal an ordered pore structure of the mesoporous
SiC [Figure 41]. Ordering in the SiC-800 sample was detected as being perpendicular [Figure
41a,b,d], and along the pore axis [Figure 41c,d]. The d-spacing was estimated from the Fourier
transformed images to be 8.1 nm [Figure 41b]. Figure 41d and the Fourier transformed image
confirm the hexagonal pore symmetry. In the case of the SiC-SMPT-10 sample the contrast was
low, but in addition to the (100) (Figure 41e) also the (110) d-spacing could be measured (4.6
nm, Figure 41f).
4.1.3 Conclusions
Summarizing, three different methods were developed for the preparation of high surface
area mesoporous silicon carbide via nanocasting of the SBA-15 silica [Table 8]. Each of the
methods applies different synthesis principles and yields mesoporous silicon carbide materials
with different properties and chemical composition.
Table 9. An overview of preparation methods and properties of mesoporous silicon carbide materials via nanocasting of SBA-15 silica.
Preparation method T [oC] Sg[m2g-1] dm [nm] C
[wt.%]
Mesoporous SiC(disordered)
850 410-830 2-10 26-35
High surface area SiC
(disordered)
Autogenic pressure reaction
1000 636 2-4 30
OrderedMesoporous SiC
Polycarbosilane (PCS)melt infiltration
1300 640-800 3 35
T = synthesis temperature; Sg = specific surface area; dm = mesopore diameter; C = carbon content (30wt% is theoretical value for the stoichiometric SiC)
68

Results and Discussion
Chemical vapor infiltration from dimethyldichlorosilane (DMS) resulted in disordered
silicon carbide materials with high specific surface area (410-580 m2g-1), high mesopore volume
(up to 0.96 cm3g-1), but a broad pore size distribution (Chapter 0). Such materials were prepared
at relatively low temperature (850 oC) from simple silane precursor, with a good control of the
chemical composition (C content) by changing the deposition parameters (Ar/H2 ratio).
Autogenic pressure reaction of tetramethylsilane (TMS) in a stainless steel autoclave at
1000 oC allowed to prepare SiC with also high surface area (636 m2g-1), high chemical purity
(carbon content close to theoretical value) and disordered pore system (Chapter 0).
An inverse replica of SBA-15 was obtained in the case of the polycarbosilane derived
materials (Chapter 4.1.2). This was confirmed by low angle X-ray diffraction, nitrogen
physisorption (narrow pore size distribution with maximum pore diameter of 3 nm ) and
transmission electron microscopy. Thus specific surface areas for ordered mesoporous silicon
carbide were highest reported until now in literature (640-800 m2g-1), but on the other hand,
some free carbon impurities were also detected.
Moreover, the thermal stability of silicon carbide materials was significantly better than
that of the silica template (SBA-15), but not as good as that of the ordered mesoporous carbon
CMK-1.
In the next paragraph (4.2) it is shown how ordered mesoporous silica can be used for
preparation of highly dispersed metal particles. In contrast to nanocasting principle presented
here, the aim was not to fill the pores completely but to develop a simple in-situ procedure for the
preparation of highly dispersed metal (Pt, Pd, V) species.
69

Results and Discussion
4.2 Incorporation of Metal and Metal Oxide Particles into MCM-41 and SBA-15 via
Efficient In-situ Procedure
In this chapter, a new approach to prepare in one step well dispersed platinum
nanoparticles predominately inside the pores of MCM-41 is presented. A solution of a
platinum precursor in a hydrophobic, non-polar solvent (Pt(acac)2 in toluene) was used and
injected inside the hydrophobic core of the surfactant micelles used as a template for the
MCM-41 structure, before addition of the silica source [Scheme 6 – step 1].
Scheme 6. Schematic illustration of the in-situ Pt/MCM-41 preparation.
Since both Pt(acac)2 and toluene did not mix with water, they were dissolved in the
inner hydrophobic core of the micelles, which resulted in a high degree of incorporation. Thus,
80-100 % of the precursor was incorporated in the final material. In the as synthesized
Pt/surfactant/MCM-41 composite material, surfactant removal was catalytically enhanced due
to the presence of platinum resulting in a lower calcination temperature needed as compared to
pure MCM-41.[182, 183] Catalytic template removal was also observed by Montes et al.[184] who
added platinum to the as synthesized MCM-41 material before calcination. The method
presented here is widely applicable to other metal or metal oxide containing silica systems such
as Pd/MCM-41, V2O5/MCM-41 and Pt-SBA-15, using the same procedure and
acetylacetonates as precursors. Especially palladium-loaded MCM-41 was found to be a good
hydrogenation catalyst in the cinnamic acid hydrogenation, but also vanadium containing silica
was a promising catalyst in a number of reactions.[185-187]
70

Results and Discussion
4.2.1 In-situ Pt-incorporation into MCM-41 Materials
In a typical synthesis procedure, a solution of CTABr (surfactant) in H2O and NH3 was
used. Subsequently, appropriate amounts of Pt(II)acetylacetonate in toluene [Table 9] were
added [Scheme 6 – step 1]. After adding TEOS [Scheme 6 – step 2] the solid was isolated by
filtration, washed with water and calcined at 450 oC [Scheme 6 – step 3]. The choice of
Pt(acac)2 as a precursor (acac=acetylacetonate) and toluene as swelling agent was not arbitrary.
Due to the lack of solubility in water, Pt(acac)2 preferentially dissolved in the toluene phase.
Toluene could dissolve reasonably high amounts of this Pt precursor (up to 3.2 wt% at 70 oC)
and also did not mix with water. In this approach (depending on the loading and precursor
concentration) 80 to 100 % of the platinum was incorporated into MCM-41 [Table 9], avoiding
losses of this expensive metal during the synthesis.
Table 10.Synthesis conditions and characterization of platinum containing MCM-41 materials.
Sample code Amount of Pt
solution addeda) [mL]
Theroretical/measured Pt
loading [wt%]
Pt Yielde)
[%]
Surface area
[m2g-1]
M-0 MCM-41 - - 1189 M-1 0.4 wt% Pt 0.4b) 0.39/0.39 100 1190 M-2 1 wt% Pt 1c) 0.99/0.79 80 1126 M-3 1 wt% Pt 2d) 0.99/0.86 87 1098 M-4 2 wt% Pt 2c) 1.97/1.69 86 1073
a) Per 1.2 g of CTABr and 5 g TEOS used b) 2.4 wt% Pt(acac)2 in toluene solution c) 3.2 wt% Pt(acac)2 in toluene solution d) 1.6 wt% Pt(acac)2 in toluene solution e) Pt yield determined using ICP-OES
For highly saturated solutions of the precursor, a lower platinum incorporation was
observed (Table 9, M-2 and M-4), while for more diluted solution of Pt(acac)2 (M-3) and lower
loading (M-1) almost all platinum was incorporated. This could be due to the presence of
ethanol in the solution after addition of TEOS. Ethanol increased the solubility of Pt(acac)2
outside the micelles and therefore caused leaching of the metal complex. The volume of the
Pt(acac)2/toluene solution, that was solubilized by CTABr micelles was limited. Higher
loadings (2 wt% - M-4 sample) also caused a decrease in pore ordering. This was clearly
visible in low angle X-ray diffractograms [Figure 42a]. For sample M-4 with 2 wt% Pt, only
one broad (100) peak could be observed and the (110) and (200) reflections disappeared.
However, in the case of 1 wt% loading of platinum (M1) no loss of the ordering was observed
as compared to pure MCM-41 and three reflections of the hexagonal structure were discerned.
Increasing the Pt/toluene loading also caused a significant increase of the (100) lattice spacing
as expected for the addition of swelling agents.[28]
71

Results and Discussion
1 2 3 4 5 6
Inte
nsit
y (a
rbitr
ary
unit
s)
2θ/o 2θ/o
Inte
nsit
y (a
rbitr
ary
unit
s)
30 40 50 60 70 80
Pt(111) Pt
(200) Pt(220)
(100)
(110) (200)
(100)
M-0
M-1
M-2
M-4
1 2 3 4 5 6 30 8070605040
M-0
M-1
M-2
M-4
(a) (b)
1 2 3 4 5 6
Inte
nsit
y (a
rbitr
ary
unit
s)
2θ/o 2θ/o
Inte
nsit
y (a
rbitr
ary
unit
s)
30 40 50 60 70 80
Pt(111) Pt
(200) Pt(220)
(100)
(110) (200)
(100)
M-0
M-1
M-2
M-4
1 2 3 4 5 6 30 8070605040
M-0
M-1
M-2
M-4
1 2 3 4 5 6
Inte
nsit
y (a
rbitr
ary
unit
s)
2θ/o 2θ/o
Inte
nsit
y (a
rbitr
ary
unit
s)
30 40 50 60 70 80
Pt(111) Pt
(200) Pt(220)
(100)
(110) (200)
(100)
M-0
M-1
M-2
M-4
1 2 3 4 5 6 30 8070605040
M-0
M-1
M-2
M-4
(a) (b)
Figure 42. (a) Low and (b) high angle XRD of Pt/MCM-41 samples. M-0 is a pure MCM-41, while M-1, M-2 and M-4 are Pt/MCM-41 materials with different metal loading [Table 9]. The presence of nanocrystalline Pt was detected for M-4 and M-2.
TEM micrographs further confirmed this conclusion. Comparing Figure 43a and Figure
44a, ordering of the pores in sample M-2 was significantly better than that of M-4. The
micrographs also showed the incorporated Pt nanoparticles (dark spots) inside the channels of
MCM-41 and no large particles were found outside. The average particle size was estimated to
be 3.0 nm in the case of M-2 [Figure 43b] and 4.2 nm in the case of M-4 [Figure 44b]. These
values were in good agreement with the measured pore diameter of the silica matrix calculated
from nitrogen physisorption isotherms measured at 77 K (3.3 nm pore diameter for 1 wt% Pt
sample (M2) and 3.7 nm pore diameter for 2 wt% Pt sample (M4) – BJH desorption) [Figure
45]. No significant decrease in the surface area as compared to standard MCM-41 (1190 m2g-1)
was observed in all Pt/MCM-41 samples. For the sample with the highest 2 wt% Pt loading, a
surface area of 1073 m2g-1 was measured.
72

Results and Discussion
Figure 43. (a) Overview transmission electron micrograph of sample M-2 with 1 wt% Pt/MCM-41. Platinum particles (dark) are statistically embedded within bent silica pore walls (periodicity ~ 3.9 nm).(b)High resolution TEM micrographs of M-2 displaying single platinum nanoparticle with (111) lattice fringes corresponding to about 2.24 Å. (c) Magnified image of a single nanoparticle integrated in the nanoporous host.
Figure 44. (a) Defocused overview TEM image of sample M-4 with 2 wt% Pt/MCM-41 and a periodicity of about 4.4 nm. (b) In-focus overview TEM image of sample M-4 with 2 wt% Pt/MCM-41. Under in-focus conditions only platinum nanoparticles are visible. High-resolution TEM micrograph and fast Fourier transform (FFT) of M-4 displaying a single Pt-nanoparticle with (111) and (200) lattice fringes corresponding to about 2.27 Å and 1.92 Å.
73

Results and Discussion
0
200
400
600
800
1000
1200
1400
1600
0 0,2 0,4 0,6 0,8 10
0,1
0,2
0,3
0,4
0,5
0,6
0,7
20 40 600.2 0.4 0.6 0.8
(a) (b)
M-0
M-2
M-4
M-0
M-2
M-4
Relative pressure P/Po Pore diameter (Å)
Nitr
ogen
vol
ume
adso
rbed
[cm
3 g-1
]
0.2
0.4
0.5
0.6
0.7
0.1
0.3
Por
evo
lum
e[c
m3 g
-1Å-1
]0
200
400
600
800
1000
1200
1400
1600
0 0,2 0,4 0,6 0,8 10
0,1
0,2
0,3
0,4
0,5
0,6
0,7
20 40 600.2 0.4 0.6 0.8
(a) (b)
M-0
M-2
M-4
M-0
M-2
M-4
Relative pressure P/Po Pore diameter (Å)
Nitr
ogen
vol
ume
adso
rbed
[cm
3 g-1
]
0.2
0.4
0.5
0.6
0.7
0.1
0.3
Por
evo
lum
e[c
m3 g
-1Å-1
]
Figure 45. (a) Nitrogen physisorption isotherms of pure MCM-41 (M-0) and Pt/MCM-41 samples (M-2 and M-4) measured at 77K (with 200 cm3g-1 offset). (b) BJH pore size distribution calculated from the desorption branch of the nitrogen physisorption isotherms (with 0.25 cm3g-1Å-1 offset)
Wide angle X-ray diffractograms showed the presence of cubic metallic platinum in
samples with high Pt loading [Figure 42b]. Reduction to Pt0 was also confirmed in the XPS
spectra (Pt4f7/2: 70.5 eV) [Figure 46].[188]
Figure 46. XPS spectra of the M-2 sample (1wt% Pt/MCM-41). The position of Pt 4f7/2 peak at 70.5 eV suggests complete Pt reduction to Pto
74
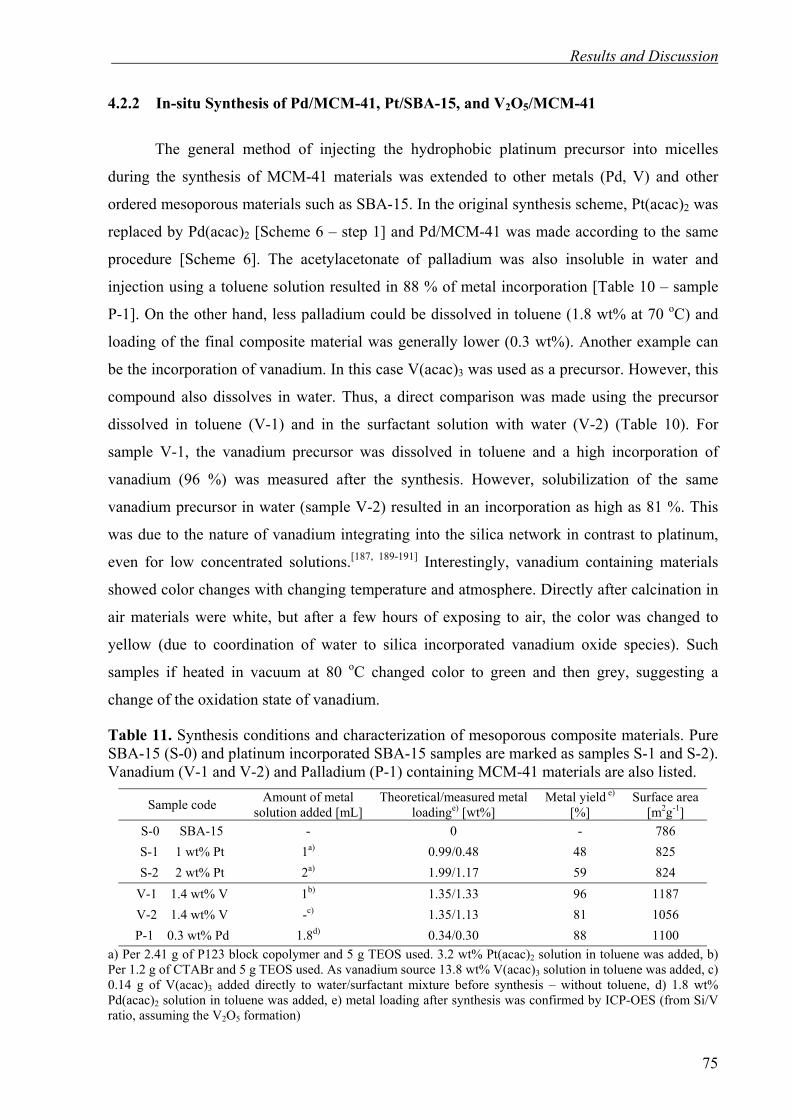
Results and Discussion
4.2.2 In-situ Synthesis of Pd/MCM-41, Pt/SBA-15, and V2O5/MCM-41
The general method of injecting the hydrophobic platinum precursor into micelles
during the synthesis of MCM-41 materials was extended to other metals (Pd, V) and other
ordered mesoporous materials such as SBA-15. In the original synthesis scheme, Pt(acac)2 was
replaced by Pd(acac)2 [Scheme 6 – step 1] and Pd/MCM-41 was made according to the same
procedure [Scheme 6]. The acetylacetonate of palladium was also insoluble in water and
injection using a toluene solution resulted in 88 % of metal incorporation [Table 10 – sample
P-1]. On the other hand, less palladium could be dissolved in toluene (1.8 wt% at 70 oC) and
loading of the final composite material was generally lower (0.3 wt%). Another example can
be the incorporation of vanadium. In this case V(acac)3 was used as a precursor. However, this
compound also dissolves in water. Thus, a direct comparison was made using the precursor
dissolved in toluene (V-1) and in the surfactant solution with water (V-2) (Table 10). For
sample V-1, the vanadium precursor was dissolved in toluene and a high incorporation of
vanadium (96 %) was measured after the synthesis. However, solubilization of the same
vanadium precursor in water (sample V-2) resulted in an incorporation as high as 81 %. This
was due to the nature of vanadium integrating into the silica network in contrast to platinum,
even for low concentrated solutions.[187, 189-191] Interestingly, vanadium containing materials
showed color changes with changing temperature and atmosphere. Directly after calcination in
air materials were white, but after a few hours of exposing to air, the color was changed to
yellow (due to coordination of water to silica incorporated vanadium oxide species). Such
samples if heated in vacuum at 80 oC changed color to green and then grey, suggesting a
change of the oxidation state of vanadium.
Table 11. Synthesis conditions and characterization of mesoporous composite materials. Pure SBA-15 (S-0) and platinum incorporated SBA-15 samples are marked as samples S-1 and S-2). Vanadium (V-1 and V-2) and Palladium (P-1) containing MCM-41 materials are also listed.
Sample code Amount of metal solution added [mL]
Theoretical/measured metal loadinge) [wt%]
Metal yield e)
[%] Surface area
[m2g-1] S-0 SBA-15 - 0 - 786 S-1 1 wt% Pt 1a) 0.99/0.48 48 825 S-2 2 wt% Pt 2a) 1.99/1.17 59 824
V-1 1.4 wt% V 1b) 1.35/1.33 96 1187 V-2 1.4 wt% V -c) 1.35/1.13 81 1056 P-1 0.3 wt% Pd 1.8d) 0.34/0.30 88 1100
a) Per 2.41 g of P123 block copolymer and 5 g TEOS used. 3.2 wt% Pt(acac)2 solution in toluene was added, b) Per 1.2 g of CTABr and 5 g TEOS used. As vanadium source 13.8 wt% V(acac)3 solution in toluene was added, c) 0.14 g of V(acac)3 added directly to water/surfactant mixture before synthesis – without toluene, d) 1.8 wt% Pd(acac)2 solution in toluene was added, e) metal loading after synthesis was confirmed by ICP-OES (from Si/V ratio, assuming the V2O5 formation)
75

Results and Discussion
In wide angle X-ray diffraction patterns no crystalline particles of vanadium oxide were
detected, confirming a high dispersion of vanadium oxide on silica support.
Incorporation of platinum into the pores of SBA-15 was less successful. Addition of
platinum caused severe decrease of pore ordering as compared to the toluene-free system, and
only one reflection at low angle could be observed in X-ray diffractograms. Even for S-1 with
only 1 ml of platinum/toluene solution added, the (110) and (200) reflections of the hexagonal
structure were not observed. However, the position of the (100) peak was shifted to lower 2θ
values, if the precursor solution was added. The specific surface area (S-2: 824 m2g-1, S-1: 825
m2g-1) was comparable to that of pure SBA-15 (S-0: 786 m2g-1). The lower incorporation
could be attributed to the extended time needed for the synthesis of SBA-15 (28 h), as
compared to the synthesis of platinum containing MCM-41 (1 h). The long time required for
SBA-15 synthesis allowed the Pt(acac)2 precursor to diffuse from toluene to ethanol/water
mixture resulting from tetraethylorthosilicate hydrolysis. A platinum incorporation of 48 % for
sample S-1 and 59 % for S-2 was achieved. However, the surface areas of these materials were
high [Table 10] and comparable to those of pure SBA-15. Nitrogen adsorption isotherms
[Figure 47] of platinum containing samples, show hysteresis loops much broader than in the
case of Pt-free SBA-15 (S-0). This may be caused by pore blocking by Pt particles or by
structural changes (due to the presence of swelling agent) in the SBA-15, leading to the
formation of a bottle-neck-like pore geometry.
0
0,05
0,1
0,15
0,2
0,25
20 120 220 320 4200
200
400
600
800
1000
1200
1400
1600
0 0,2 0,4 0,6 0,8 10.2 0.4 0.6 0.8
(a) (b)
S-0
S-1
S-2
S-0
S-1
Relative pressure P/Po Pore diameter (Å)
Nitr
ogen
vol
ume
adso
rbed
[cm
3 g-1
]
Pore
volu
me
[cm
3 g-1
Å-1]
0.05
0.10
0.15
0.20
0.25
S-2
0
0,05
0,1
0,15
0,2
0,25
20 120 220 320 4200
200
400
600
800
1000
1200
1400
1600
0 0,2 0,4 0,6 0,8 10.2 0.4 0.6 0.8
(a) (b)
S-0
S-1
S-2
S-0
S-1
Relative pressure P/Po Pore diameter (Å)
Nitr
ogen
vol
ume
adso
rbed
[cm
3 g-1
]
Pore
volu
me
[cm
3 g-1
Å-1]
0.05
0.10
0.15
0.20
0.25
S-2
Figure 47. (a) Nitrogen physisorption isotherms of the pure SBA-15 and Pt/SBA-15 samples with different metal loadings (S-1, S-2), measured at 77K (with 200 cm3g-1 offset), (b) BJH pore size distribution calculated from the adsorption branch of the isotherm (with 0.1 cm3g-1Å-1 offset)
76

Results and Discussion
4.2.3 Pt-catalyzed Template Removal
For a Pt-free MCM-41 material, the surfactant was typically removed by calcination at
a temperature of 540 oC[1, 167] [Scheme 6 – step 3]. There are other known template removal
procedures[192] such as solvent extraction,[193, 194] or ozone treatment,[195] but often complete
removal was not achieved. The calcination behavior critically depends on parameters such as
the surfactant chain length, the type of oxide phase and the atmosphere.[182, 196] According to
TG/MS and DSC measurements in air, three steps are distinguished.[182, 183] In the first
decomposition step, at temperatures between 150 and 250 oC, Hofmann degradation of the
template into trimethyl amine and hexadecane occurs. In the range of 250 and 300 oC
exothermic cracking of the long chain hydrocarbons takes place followed by oxidation at
temperatures exceeding 320 oC. Typically, the template removal is complete at 550 oC.
Comparing the calcination process for M-0 and M-4 [Figure 48A and Figure 48B], the removal
of the template in the platinum-containing sample started at the same temperature as for the
platinum-free material, but complete removal was achieved at significantly lower temperatures
(400 oC) as compared to M-0 (550 oC).
Figure 48. TG (A) and DTG (B) calcination curves of pure MCM-41 (M-0, black) and 2 wt% platinum containing MCM-41 (M-4, grey) in air (heating rate of 3 oCmin-1).
77

Results and Discussion
Species evolving during heat treatment were also released at different temperatures.
Fragments resulting from cracking of the large chain hydrocarbons were released up to 350 oC[182] (C3H6: m/z=42, C4H7: m/z=55). This was also observed in the case of the M-0 sample
[Figure 49]. One or two broad overlapping peaks are present on m/z=42 and 55 in between 150
and 290 oC and one centered at 320 oC. This was observed for all cracking products in the case
of all surfactant hydrocarbon chain lengths.[182] However, in the case of platinum-containing
material (M-4) only one peak in between 150 and 260 oC was present [Figure 49 m/z=55, 42].
At 270 oC large amounts of CO2 (m/z=44) were detected as compared to M-0, suggesting that
the cracking products were immediately oxidized by the integrated platinum-catalyst to form
CO2, or direct oxidation of long chain alkanes took place. Also H2O formation increased at this
temperature. The TG/MS experiments show that platinum, located inside the pores, acts as an
oxidation catalyst. The lower calcination temperatures feasible due to the presence of the Pt-
particles could provide a new way for the manufacture of mesoporous transition metal oxides
that often tend to collapse at higher temperatures due to crystallization processes or low
melting temperatures. The method could also improve the preparation of mesoporous silica
films due to the decrease of stress and strain in between the substrate and porous silica layer
developing in the calcination process. However, in the case of silica, low calcination
temperatures may result in lower densification of silica and subsequently lower hydrothermal
stability.
Figure 49. Combustion products detected by mass spectrometry during the TG measurements in air as a function of temperature. Black lines correspond to the M-0 (pure MCM-41) and grey curves to the M-4 (with 2 wt% Pt) sample. Numbers indicate the m/z ratio of species evolved and the corresponding product.
78
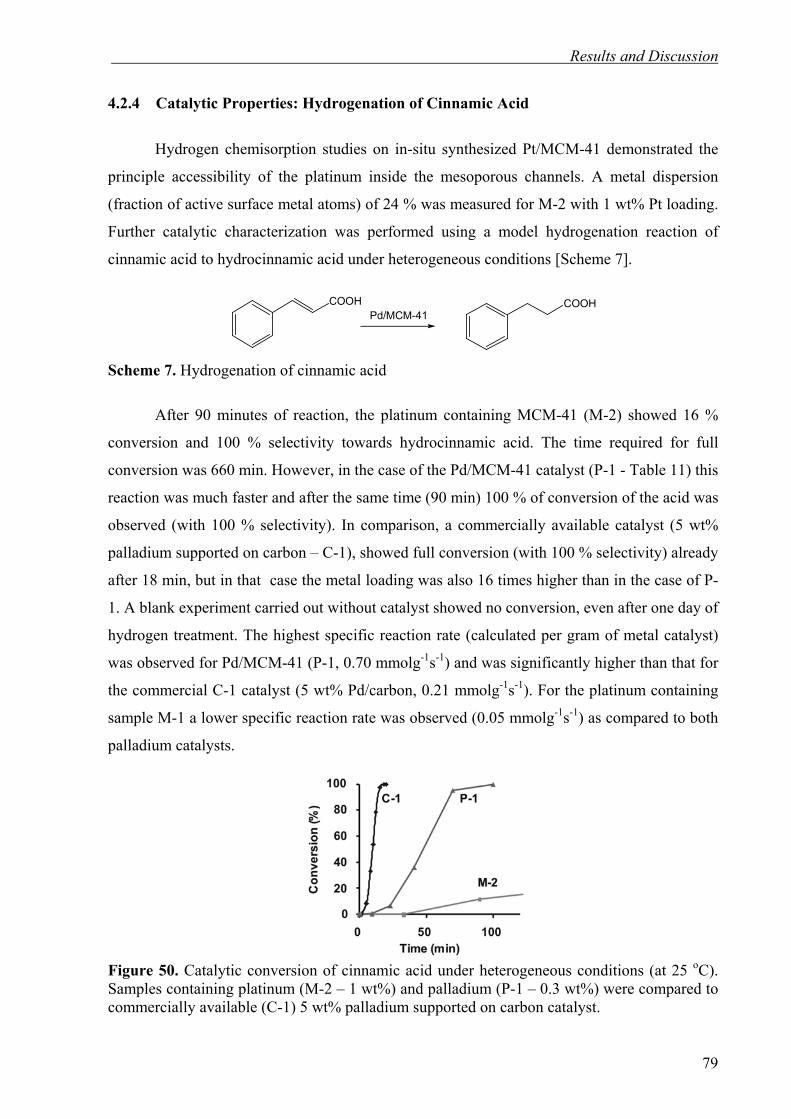
Results and Discussion
4.2.4 Catalytic Properties: Hydrogenation of Cinnamic Acid
Hydrogen chemisorption studies on in-situ synthesized Pt/MCM-41 demonstrated the
principle accessibility of the platinum inside the mesoporous channels. A metal dispersion
(fraction of active surface metal atoms) of 24 % was measured for M-2 with 1 wt% Pt loading.
Further catalytic characterization was performed using a model hydrogenation reaction of
cinnamic acid to hydrocinnamic acid under heterogeneous conditions [Scheme 7].
COOH COOH
Pd/MCM-41
Scheme 7. Hydrogenation of cinnamic acid
After 90 minutes of reaction, the platinum containing MCM-41 (M-2) showed 16 %
conversion and 100 % selectivity towards hydrocinnamic acid. The time required for full
conversion was 660 min. However, in the case of the Pd/MCM-41 catalyst (P-1 - Table 11) this
reaction was much faster and after the same time (90 min) 100 % of conversion of the acid was
observed (with 100 % selectivity). In comparison, a commercially available catalyst (5 wt%
palladium supported on carbon – C-1), showed full conversion (with 100 % selectivity) already
after 18 min, but in that case the metal loading was also 16 times higher than in the case of P-
1. A blank experiment carried out without catalyst showed no conversion, even after one day of
hydrogen treatment. The highest specific reaction rate (calculated per gram of metal catalyst)
was observed for Pd/MCM-41 (P-1, 0.70 mmolg-1s-1) and was significantly higher than that for
the commercial C-1 catalyst (5 wt% Pd/carbon, 0.21 mmolg-1s-1). For the platinum containing
sample M-1 a lower specific reaction rate was observed (0.05 mmolg-1s-1) as compared to both
palladium catalysts.
Figure 50. Catalytic conversion of cinnamic acid under heterogeneous conditions (at 25 oC). Samples containing platinum (M-2 – 1 wt%) and palladium (P-1 – 0.3 wt%) were compared to commercially available (C-1) 5 wt% palladium supported on carbon catalyst.
79

Results and Discussion
4.2.5 Conclusions
Summarizing, a new one-step, in-situ preparation procedure for platinum-containing
MCM-41 was developed. The highly porous material shows well dispersed platinum metal
predominately confined inside the pores of the mesoporous silica. Particles outside the pore
system were not detected using transmission electron microscopy. The confined Pt particles
catalyze the removal of surfactant from the MCM-41 and allow calcination at lower
temperatures. The in situ method presented can be widely applied for the incorporation of other
metals or oxides (such as Pd or V2O5) into MCM-41 and large pore silica such as SBA-15. A
high catalytic activity was observed for Pd/MCM-41 catalyst in the hydrogenation of cinnamic
acid under heterogeneous conditions. Moreover, this method can be easily applied for other
metal/mesoporous oxide systems since no interaction between metal oxide and platinum
precursor exists during the synthesis.
In the next chapter it will be shown that in-situ prepared V2O5/MCM-41 materials are
suitable substrates for the preparation of highly dispersed VN/MCM-41 catalysts via nitridation
in ammonia flow. Compared to supported nitrides prepared from V2O5/MCM-41 materials, via
the ex-situ procedure they show similar high catalytic activity in propane dehydrogenation,
despite significantly lower vanadium content.
80
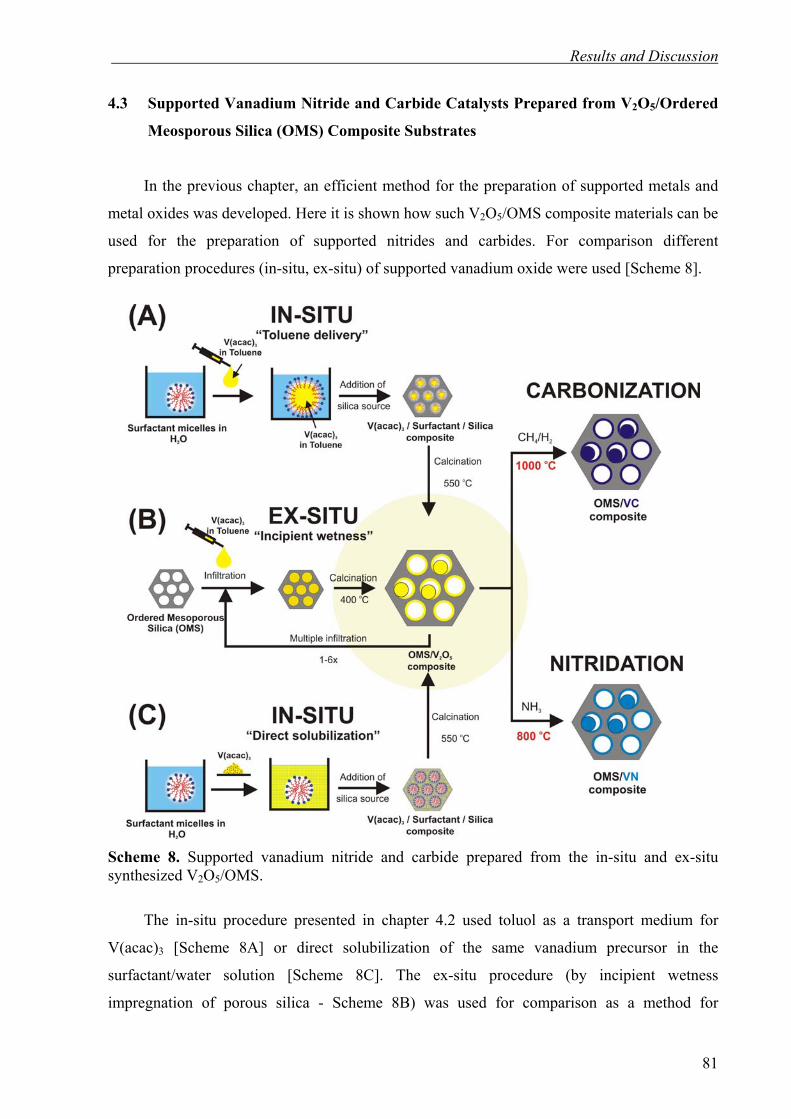
Results and Discussion
4.3 Supported Vanadium Nitride and Carbide Catalysts Prepared from V2O5/Ordered
Meosporous Silica (OMS) Composite Substrates
In the previous chapter, an efficient method for the preparation of supported metals and
metal oxides was developed. Here it is shown how such V2O5/OMS composite materials can be
used for the preparation of supported nitrides and carbides. For comparison different
preparation procedures (in-situ, ex-situ) of supported vanadium oxide were used [Scheme 8].
Scheme 8. Supported vanadium nitride and carbide prepared from the in-situ and ex-situ synthesized V2O5/OMS.
The in-situ procedure presented in chapter 4.2 used toluol as a transport medium for
V(acac)3 [Scheme 8A] or direct solubilization of the same vanadium precursor in the
surfactant/water solution [Scheme 8C]. The ex-situ procedure (by incipient wetness
impregnation of porous silica - Scheme 8B) was used for comparison as a method for
81

Results and Discussion
preparation of materials with high vanadium oxide content. Moreover, the ex-situ procedure
was also tested for the preparation of vanadium nitride and carbide supported on large pore
silica SBA-15 and activated carbon NORIT-A. After synthesis and characterization, some of
the materials were tested as catalysts for non-oxidative propane dehydrogenation.
82

Results and Discussion
4.3.1 VN/MCM-41 via Nitridation of In-situ Prepared V2O5/MCM-41 Composites
In-situ preparation and characterization of V2O5/MCM-41
In-situ prepared V2O5/MCM-41 composites were used as substrates for the preparation
of supported VN/MCM-41. Two different procedures to incorporate the vanadia species into
the mesoporous silica matrix during synthesis and two different amounts of V2O5 precursor
(V(acac)3) were used [Table 11]. In the first one, toluene was employed as an efficient delivery
agent for the vanadia precursor during synthesis (samples IVN-1 and IVN-3)[Scheme 8A]
while in the second one the vanadia precursor was dissolved directly in the surfactant/water
solution before synthesis of ordered mesoporous silica (samples IVN-2 and IVN-4)[Scheme
8C]. One additional sample was prepared combining both procedures in order to maximize the
vanadium loading in the composite materials (IVN-5). The toluene assisted delivery method
was more efficient and vanadium yields were higher by 15 (for IVN-1) and 20% (for IVN-3) as
compared to the samples prepared via direct solubilization of the same amount of precursor in
water/surfactant solution (IVN-2 and IVN-4 respectivly) [Table 11]. Material prepared via the
combined procedure (toluene delivery + solubilization in water) showed also a high yield of
vanadium incorporation (89%) and the highest vanadium content (4.95 wt.%) among the in-
situ prepared V2O5/MCM-41 materials.
Table 12. Preparation of VN/MCM-41 materials from in-situ synthesized V2O5/MCM-41 substrates
Sample code
Vsolutiona)
[ml] mmetal
b)
[g]
Theoretical/measured vanadium contentc)
[wt.%]
Vanadium yield [%]
Sgoxide
[m2g-1] Sg
nitride
[m2g-1]
N content after
nitridation [wt.%]
IMCM-41 - - - - 1075 1062 3.2* IVN-1 1 - 1.35/1.33 96 1097 750 n.a.d)
IVN-2 - 0.14 1.35/1.13 81 1056 644 n.a.d)
IVN-3 2 - 2.78/2.52 91 1226 964 0.9** IVN-4 - 0.28 2.78/1.98 71 1292 810 3.6* IVN-5 2 0.28 5.56/4.95 89 1057 664 1.4**
a) Volume of 13.8 wt% V(acac)3 in toluene (1ml solution contains 0.14g V(acac)3) added during the synthesis, b) mass of the V(acac)3 precursor added during the synthesis c) vanadium content measured via ICP-OES and calculated from the V/Si ratio, assuming the V2O5 formation on SiO2, d) data not available * measured via hot gas extraction method 1-2 weeks after synthesis (stored in air atmosphere) ** measured via hot gas extraction method 50-55 weeks after synthesis (stored in air atmosphere) The specific surface areas for the oxide materials were in the range of 1056-1292 m2g-1.
Surprisingly, materials with an average vanadium content (IVN-3 and IVN-4) had a higher
specific surface area (1226 and 1292 m2g-1) than the vanadium-free MCM-41 materials [Table
83
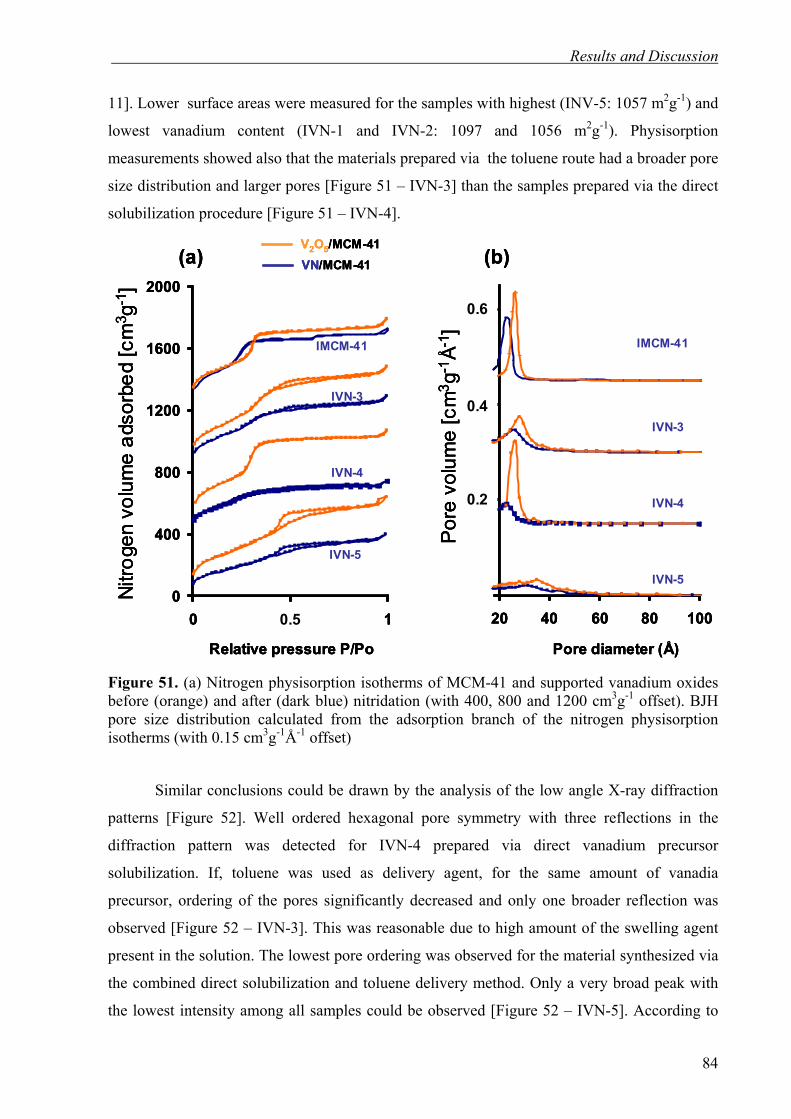
Results and Discussion
11]. Lower surface areas were measured for the samples with highest (INV-5: 1057 m2g-1) and
lowest vanadium content (IVN-1 and IVN-2: 1097 and 1056 m2g-1). Physisorption
measurements showed also that the materials prepared via the toluene route had a broader pore
size distribution and larger pores [Figure 51 – IVN-3] than the samples prepared via the direct
solubilization procedure [Figure 51 – IVN-4].
0
400
800
1200
1600
2000
0 0,5 1
Relative pressure P/Po
Nitro
gen
volu
me
adso
rbed
[cm
3 g-1
]
0.5
(a)V2O5/MCM-41VN/MCM-41
IMCM-41
IVN-3
IVN-4
IVN-5
20 40 60 80 100
Pore diameter (Å)
0.6
0.4
0.2
Por
evo
lum
e[c
m3 g
-1Å-1
]
(b)
IMCM-41
IVN-3
IVN-4
IVN-50
400
800
1200
1600
2000
0 0,5 1
Relative pressure P/Po
Nitro
gen
volu
me
adso
rbed
[cm
3 g-1
]
0.5
(a)V2O5/MCM-41VN/MCM-41
IMCM-41
IVN-3
IVN-4
IVN-5
0
400
800
1200
1600
2000
0 0,5 1
Relative pressure P/Po
Nitro
gen
volu
me
adso
rbed
[cm
3 g-1
]
0.5
(a)V2O5/MCM-41VN/MCM-41
IMCM-41
IVN-3
IVN-4
IVN-5
20 40 60 80 100
Pore diameter (Å)
0.6
0.4
0.2
Por
evo
lum
e[c
m3 g
-1Å-1
]
(b)
IMCM-41
IVN-3
IVN-4
IVN-5
20 40 60 80 100
Pore diameter (Å)
0.6
0.4
0.2
Por
evo
lum
e[c
m3 g
-1Å-1
]
(b)
IMCM-41
IVN-3
IVN-4
IVN-5
Figure 51. (a) Nitrogen physisorption isotherms of MCM-41 and supported vanadium oxides before (orange) and after (dark blue) nitridation (with 400, 800 and 1200 cm3g-1 offset). BJH pore size distribution calculated from the adsorption branch of the nitrogen physisorption isotherms (with 0.15 cm3g-1Å-1 offset)
Similar conclusions could be drawn by the analysis of the low angle X-ray diffraction
patterns [Figure 52]. Well ordered hexagonal pore symmetry with three reflections in the
diffraction pattern was detected for IVN-4 prepared via direct vanadium precursor
solubilization. If, toluene was used as delivery agent, for the same amount of vanadia
precursor, ordering of the pores significantly decreased and only one broader reflection was
observed [Figure 52 – IVN-3]. This was reasonable due to high amount of the swelling agent
present in the solution. The lowest pore ordering was observed for the material synthesized via
the combined direct solubilization and toluene delivery method. Only a very broad peak with
the lowest intensity among all samples could be observed [Figure 52 – IVN-5]. According to
84

Results and Discussion
the high angle X-ray diffraction measurements, all V2O5/MCM-41 composites were amorphous
and no reflection of any crystalline phase was detected, suggesting uniform incorporation of
V2O5 inside the MCM-41 pores.
1 3 5
Inte
nsity
(arb
itrar
y un
its)
2θ/o
V2O5/MCM-41VN/MCM-41
IMCM-41
IVN-3
IVN-4
IVN-5
(100)
(200)(220)
1 3 5
Inte
nsity
(arb
itrar
y un
its)
2θ/o
V2O5/MCM-41VN/MCM-41
IMCM-41
IVN-3
IVN-4
IVN-5
(100)
(200)(220)
Figure 52. Low angle X-ray diffraction patterns of pure MCM-41 and V2O5/MCM-41 composites before (orange) and after (blue) nitridation.
Nitridation of in-situ synthesized V2O5/MCM-41 for the preparation of VN/MCM-41 materials As prepared V2O5/MCM-41 composites were subjected to nitridation in ammonia flow
at 800oC. After cooling down to room temperature the materials were passivated in O2/N2 gas
mixture (1%O2) in order to prevent rapid oxidation in contact with air. For comparison, also
vanadium-free MCM-41 was nitrided in the same conditions. An elemental analysis of sample
IVN-4 made shortly after nitridation, showed a nitrogen content of 3.6 wt.%, while for
nitridation of pure silica (IMCM-41) a lower amount of nitrogen was detected (3.2 wt.%)
[Table 11]. This was in good agreement with the results of Asefa et al. who studied
ammonolysis of MCM-41 and periodic mesoporous organosilica in similar conditions.[197] For
two other samples, the elemental analysis was performed after one year storage in air
atmosphere, showing significantly lower nitrogen content due to oxidation and hydrolysis (0.9
wt.% N for IVN-3 and 1.4 wt.% N for IVN-5). However, the basic relation between the
85

Results and Discussion
vanadium loading and nitrogen content was similar (the sample with higher vanadium loading
– IVN-5, had also a higher nitrogen content). The oxidized samples changed also color from
the initial black-gray to almost white after one year showing that the oxidation state of metal or
its coordination chemistry was changed.
According to nitrogen physisorption measurements [Figure 51a] in high temperature
specific surface areas of all vanadium containing materials decreased due to nitridation by 15
to 39 % [Table 11]. Materials prepared via toluene delivery retained relatively high surface
areas as compared to V2O5/MCM-41 oxide precursors (reduction by 15 and 31 % of the
original surface area for IVN-3 and IVN-1 respectively), while samples prepared via direct
solubilization were prone to more severe sintering (reduction by 38 and 39 % of the original
surface area for respectiviely IVN-4 and IVN-2). A similar decrease of surface area was
observed for IVN-5 with the highest vanadium loading (reduction of supported oxide surface
area by 37 %) For the nitridation of vanadium-free MCM-41, the specific surface area did not
change significantly (decreased by 1%).
According to the BJH calculations [Figure 51b], during the nitridation process, the pore
diameter decreased in the case of all samples to lower values. For pure MCM-41, the diameter
changed from 2.6 to 2.3 nm. In the case of vanadium containing materials, the degree of pore
shrinkage was dependent on the preparation method and vanadium content. For materials with
low vanadium content, the shrinkage of the pore diameter by 10 and 11 % for IVN-1 and IVN-
2 was observed, while for materials with high vanadium content shrinkage of 6 and 14% for
IVN-3 and IVN-4 was measured. Materials prepared by direct solubilization method showed a
higher degree of shrinkage, especially for high vanadium content (IVN-4), than the ones
prepared via toluene delivery (IVN-3).
This could be an effect of different nature of vanadium incorporation. For vanadium
directly dissolved in the water/surfactant mixture (IVN-2 and 4), one can expect that vanadium
was uniformly incorporated in the bulk silica pore walls of MCM-41 materials. In the case of
toluene delivery, one could expect that metal species were incorporated iniside the pores after
the calcination of surfactant and were distributed as particles or as the pore wall coating
(therefore not incorporating uniformly in the bulk pore wall). The presence of vanadium in the
pore walls could significantly lower the thermal stability of mesoporous material and
destabilize it under reducing conditions. Therefore, materials prepared via toluene delivery
route showed a lower degree of sintering (loss of surface area and decrease of the pore
diameter) during the nitridation process.
86

Results and Discussion
These conclusions were confirmed by low angle X-ray diffraction patterns where
ordering of the IVN-4 sample prepared via direct solubilization was significantly reduced due
to nitridation process [Figure 52]. The nitrided sample showed a reduced structural ordering
and shrinkage as compared to IVN-3 [Figure 52]. The material prepared via combined
procedures showed only extremely broad reflections before and after nitridation. In the high
angle area of X-ray diffraction patterns no reflections were observed, excluding the formation
of large VN particles outside the pore system.
87
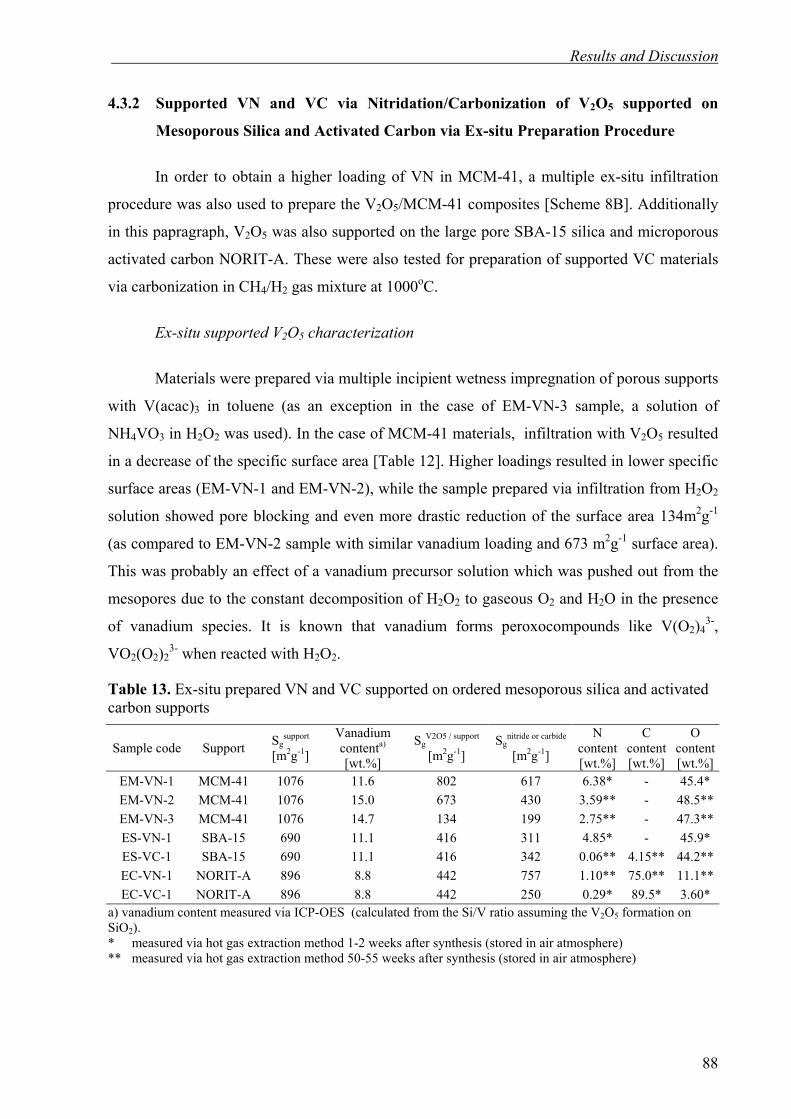
Results and Discussion
4.3.2 Supported VN and VC via Nitridation/Carbonization of V2O5 supported on
Mesoporous Silica and Activated Carbon via Ex-situ Preparation Procedure
In order to obtain a higher loading of VN in MCM-41, a multiple ex-situ infiltration
procedure was also used to prepare the V2O5/MCM-41 composites [Scheme 8B]. Additionally
in this papragraph, V2O5 was also supported on the large pore SBA-15 silica and microporous
activated carbon NORIT-A. These were also tested for preparation of supported VC materials
via carbonization in CH4/H2 gas mixture at 1000oC.
Ex-situ supported V2O5 characterization
Materials were prepared via multiple incipient wetness impregnation of porous supports
with V(acac)3 in toluene (as an exception in the case of EM-VN-3 sample, a solution of
NH4VO3 in H2O2 was used). In the case of MCM-41 materials, infiltration with V2O5 resulted
in a decrease of the specific surface area [Table 12]. Higher loadings resulted in lower specific
surface areas (EM-VN-1 and EM-VN-2), while the sample prepared via infiltration from H2O2
solution showed pore blocking and even more drastic reduction of the surface area 134m2g-1
(as compared to EM-VN-2 sample with similar vanadium loading and 673 m2g-1 surface area).
This was probably an effect of a vanadium precursor solution which was pushed out from the
mesopores due to the constant decomposition of H2O2 to gaseous O2 and H2O in the presence
of vanadium species. It is known that vanadium forms peroxocompounds like V(O2)43-,
VO2(O2)23- when reacted with H2O2.
Table 13. Ex-situ prepared VN and VC supported on ordered mesoporous silica and activated carbon supports
Sample code Support Sgsupport
[m2g-1]
Vanadium contenta) [wt.%]
SgV2O5 / support
[m2g-1] Sg
nitride or carbide
[m2g-1]
N content [wt.%]
C content [wt.%]
O content [wt.%]
EM-VN-1 MCM-41 1076 11.6 802 617 6.38* - 45.4* EM-VN-2 MCM-41 1076 15.0 673 430 3.59** - 48.5**EM-VN-3 MCM-41 1076 14.7 134 199 2.75** - 47.3**ES-VN-1 SBA-15 690 11.1 416 311 4.85* - 45.9* ES-VC-1 SBA-15 690 11.1 416 342 0.06** 4.15** 44.2**EC-VN-1 NORIT-A 896 8.8 442 757 1.10** 75.0** 11.1**EC-VC-1 NORIT-A 896 8.8 442 250 0.29* 89.5* 3.60*
a) vanadium content measured via ICP-OES (calculated from the Si/V ratio assuming the V2O5 formation on SiO2). * measured via hot gas extraction method 1-2 weeks after synthesis (stored in air atmosphere) ** measured via hot gas extraction method 50-55 weeks after synthesis (stored in air atmosphere)
88
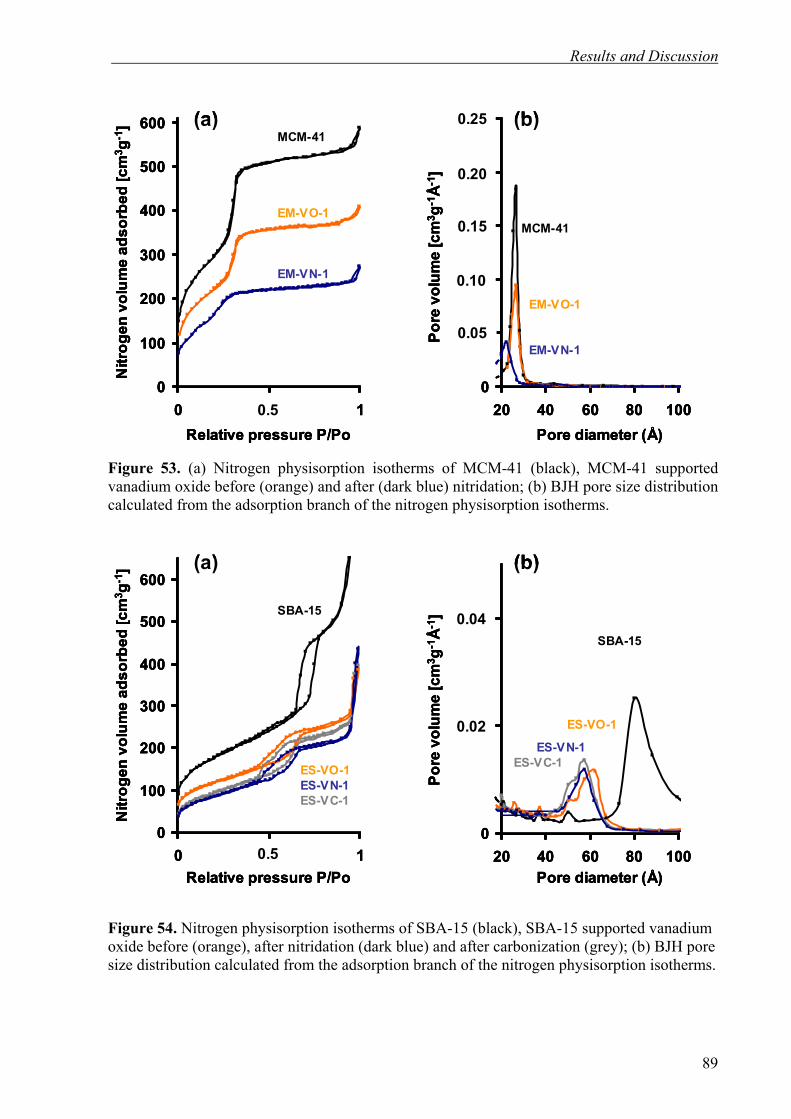
Results and Discussion
0
100
200
300
400
500
600
0 0,5 10.5
Nitr
ogen
vol
ume
adso
rbed
[cm
3 g-1
]
Relative pressure P/Po
MCM-41
EM-VO-1
EM-VN-1
(a)
0
0,05
0,1
0,15
0,2
0,25
20 40 60 80 100
0.20
0.15
Pore
vol
ume
[cm
3 g-1
Å-1]
Pore diameter (Å)
MCM-41
EM-VO-1
EM-VN-1
(b)
0.05
0.10
0.25
0
100
200
300
400
500
600
0 0,5 10.5
Nitr
ogen
vol
ume
adso
rbed
[cm
3 g-1
]
Relative pressure P/Po
MCM-41
EM-VO-1
EM-VN-1
(a)
0
100
200
300
400
500
600
0 0,5 10.5
Nitr
ogen
vol
ume
adso
rbed
[cm
3 g-1
]
Relative pressure P/Po
MCM-41
EM-VO-1
EM-VN-1
(a)
0
0,05
0,1
0,15
0,2
0,25
20 40 60 80 100
0.20
0.15
Pore
vol
ume
[cm
3 g-1
Å-1]
Pore diameter (Å)
MCM-41
EM-VO-1
EM-VN-1
(b)
0.05
0.10
0.25
0
0,05
0,1
0,15
0,2
0,25
20 40 60 80 100
0.20
0.15
Pore
vol
ume
[cm
3 g-1
Å-1]
Pore diameter (Å)
MCM-41
EM-VO-1
EM-VN-1
(b)
0.05
0.10
0.25
Figure 53. (a) Nitrogen physisorption isotherms of MCM-41 (black), MCM-41 supported vanadium oxide before (orange) and after (dark blue) nitridation; (b) BJH pore size distribution calculated from the adsorption branch of the nitrogen physisorption isotherms.
0
100
200
300
400
500
600
0 0,5 10.5
Nitr
ogen
vol
ume
adso
rbed
[cm
3 g-1
]
Relative pressure P/Po
SBA-15
ES-VN-1
(a)
ES-VO-1
ES-VC-1
0
0,02
0,04
20 40 60 80 100
0.04
Pore
vol
ume
[cm
3 g-1
Å-1]
Pore diameter (Å)
ES-VC-1
SBA-15
(b)
ES-VO-1
ES-VN-10.02
0
100
200
300
400
500
600
0 0,5 10.5
Nitr
ogen
vol
ume
adso
rbed
[cm
3 g-1
]
Relative pressure P/Po
SBA-15
ES-VN-1
(a)
ES-VO-1
ES-VC-1
0
100
200
300
400
500
600
0 0,5 10.5
Nitr
ogen
vol
ume
adso
rbed
[cm
3 g-1
]
Relative pressure P/Po
SBA-15
ES-VN-1
(a)
ES-VO-1
ES-VC-1
0
0,02
0,04
20 40 60 80 100
0.04
Pore
vol
ume
[cm
3 g-1
Å-1]
Pore diameter (Å)
ES-VC-1
SBA-15
(b)
ES-VO-1
ES-VN-10.02
0
0,02
0,04
20 40 60 80 100
0.04
Pore
vol
ume
[cm
3 g-1
Å-1]
Pore diameter (Å)
ES-VC-1
SBA-15
(b)
ES-VO-1
ES-VN-10.02
Figure 54. Nitrogen physisorption isotherms of SBA-15 (black), SBA-15 supported vanadium oxide before (orange), after nitridation (dark blue) and after carbonization (grey); (b) BJH pore size distribution calculated from the adsorption branch of the nitrogen physisorption isotherms.
89
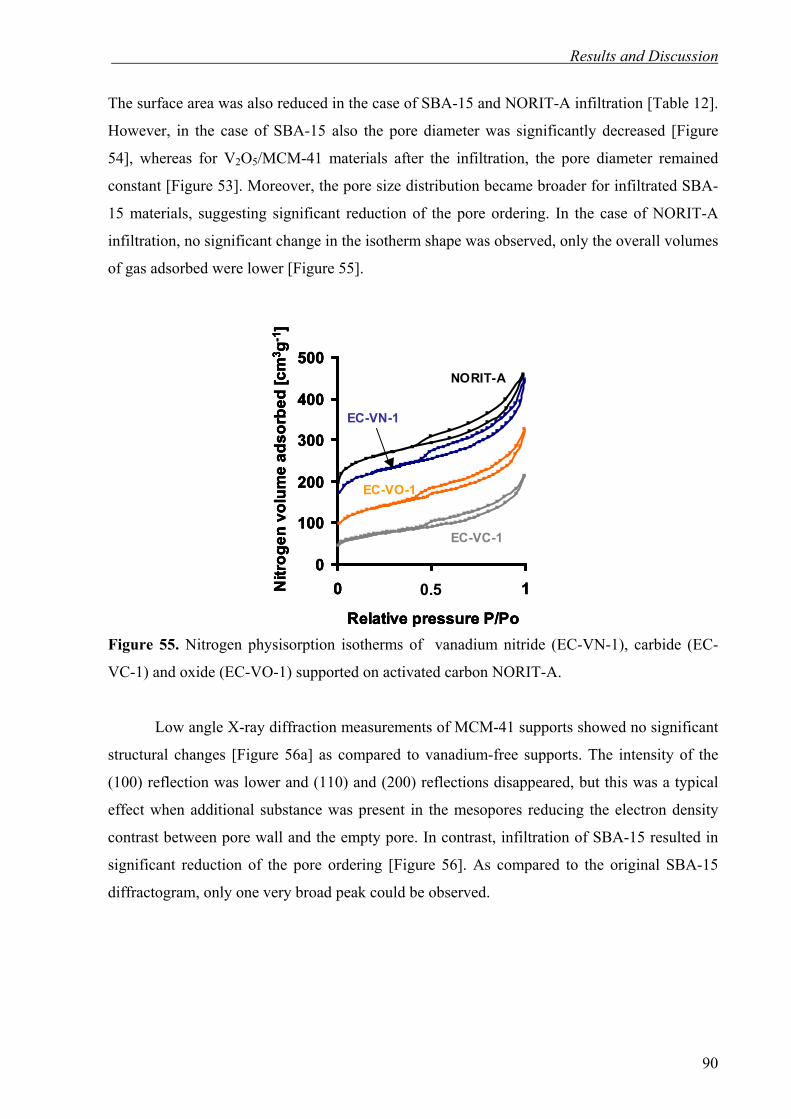
Results and Discussion
The surface area was also reduced in the case of SBA-15 and NORIT-A infiltration [Table 12].
However, in the case of SBA-15 also the pore diameter was significantly decreased [Figure
54], whereas for V2O5/MCM-41 materials after the infiltration, the pore diameter remained
constant [Figure 53]. Moreover, the pore size distribution became broader for infiltrated SBA-
15 materials, suggesting significant reduction of the pore ordering. In the case of NORIT-A
infiltration, no significant change in the isotherm shape was observed, only the overall volumes
of gas adsorbed were lower [Figure 55].
0
100
200
300
400
500
0 0,5Nitr
ogen
vol
ume
adso
rbed
[cm
3 g-1
]
Relative pressure P/Po
10.5
NORIT-A
EC-VC-1
EC-VO-1
EC-VN-1
0
100
200
300
400
500
0 0,5Nitr
ogen
vol
ume
adso
rbed
[cm
3 g-1
]
Relative pressure P/Po
10.50
100
200
300
400
500
0 0,5Nitr
ogen
vol
ume
adso
rbed
[cm
3 g-1
]
Relative pressure P/Po
10.5
NORIT-A
EC-VC-1
EC-VO-1
EC-VN-1
Figure 55. Nitrogen physisorption isotherms of vanadium nitride (EC-VN-1), carbide (EC-
VC-1) and oxide (EC-VO-1) supported on activated carbon NORIT-A.
Low angle X-ray diffraction measurements of MCM-41 supports showed no significant
structural changes [Figure 56a] as compared to vanadium-free supports. The intensity of the
(100) reflection was lower and (110) and (200) reflections disappeared, but this was a typical
effect when additional substance was present in the mesopores reducing the electron density
contrast between pore wall and the empty pore. In contrast, infiltration of SBA-15 resulted in
significant reduction of the pore ordering [Figure 56]. As compared to the original SBA-15
diffractogram, only one very broad peak could be observed.
90

Results and Discussion
0,7 1,7 2,71.7 2.70.7
Inte
nsity
(arb
itrar
y un
its)
O/2θ
SBA-15
ES-VN-1
ES-VC-1
ES-VO-1SBA-15/V2O5
SBA-15/VN
SBA-15/VC
(b)
1,7 2,7 3,7 4,72.71.7 3.7 3.7
Inte
nsity
(arb
itrar
y un
its)
O/2θ
MCM-41
EM-VN-1
MCM-41/V2O5
MCM-41/VN
EM-VO-1
(a)(100)
(110) (200)
(100)
(110) (200)
0,7 1,7 2,71.7 2.70.7
Inte
nsity
(arb
itrar
y un
its)
O/2θ
SBA-15
ES-VN-1
ES-VC-1
ES-VO-1SBA-15/V2O5
SBA-15/VN
SBA-15/VC
(b)
0,7 1,7 2,71.7 2.70.7
Inte
nsity
(arb
itrar
y un
its)
O/2θ
SBA-15
ES-VN-1
ES-VC-1
ES-VO-1SBA-15/V2O5
SBA-15/VN
SBA-15/VC
(b)
0,7 1,7 2,71.7 2.70.7
Inte
nsity
(arb
itrar
y un
its)
O/2θ
SBA-15
ES-VN-1
ES-VC-1
ES-VO-1SBA-15/V2O5
SBA-15/VN
SBA-15/VC
(b)
1,7 2,7 3,7 4,72.71.7 3.7 3.7
Inte
nsity
(arb
itrar
y un
its)
O/2θ
MCM-41
EM-VN-1
MCM-41/V2O5
MCM-41/VN
EM-VO-1
(a)(100)
(110) (200)
(100)
(110) (200)
Figure 56. Low angle X-ray diffraction patterns of ordered mesoporous silica (black),V2O5/OMS composites (orange), V2O5/OMS composites after nitridation (blue) or V2O5/OMS composites after carbonization (grey); (a) composites prepared using MCM-41 and (b) SBA-15 silica.
Nitridation of ex-situ supported V2O5 materials
In the case of ex-situ prepared materials with high loading, the general trend of
decreasing surface area upon nitridation was observed not for all of the samples (in contrast to
the in-situ supported MCM-41 materials). The EM-VN-1, EM-VN-2 and ES-VN-1 samples
reduced their surface area by 23, 36 and 25 % respectively [Table 12, Figure 53, Figure 54].
However, for the EM-VN-3 and EC-VN-1 samples the specific surface area increased
significantly by 48 and 71 % [Figure 55, Table 13]. In the first case (EM-VN-3), where MCM-
41 silica was used as a support, blocking of pores from the outside was suspected (large
reduction of surface area after V2O5 infiltration). Upon nitridation, larger oxide particles
blocking the pores were transformed into smaller vanadium nitride and more of the pore
volume became accessible (higher surface area).
For vanadium nitride supported on activated carbon (EC-VN-1) the increase of surface
area as compared to oxide was even larger (from 442 to 757 m2g-1) [Figure 55, Table 13]. To
some degree, such effect could have been also assigned to vanadium oxide blocking the pores
91
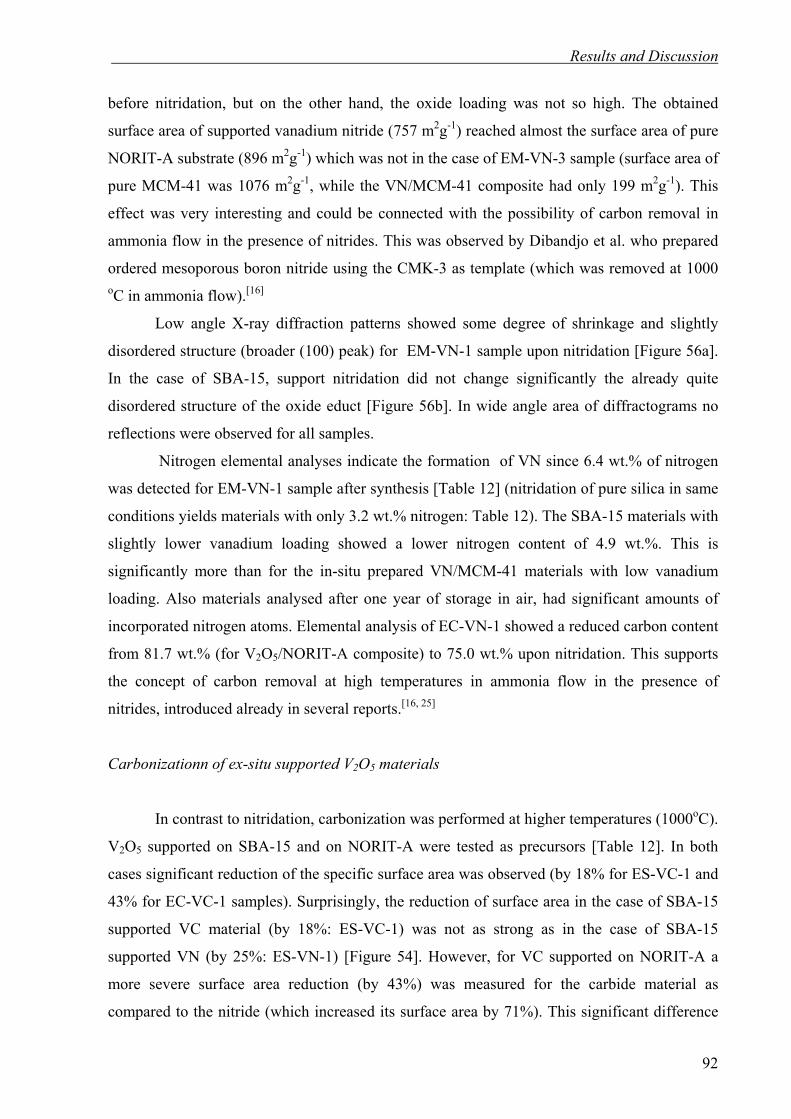
Results and Discussion
before nitridation, but on the other hand, the oxide loading was not so high. The obtained
surface area of supported vanadium nitride (757 m2g-1) reached almost the surface area of pure
NORIT-A substrate (896 m2g-1) which was not in the case of EM-VN-3 sample (surface area of
pure MCM-41 was 1076 m2g-1, while the VN/MCM-41 composite had only 199 m2g-1). This
effect was very interesting and could be connected with the possibility of carbon removal in
ammonia flow in the presence of nitrides. This was observed by Dibandjo et al. who prepared
ordered mesoporous boron nitride using the CMK-3 as template (which was removed at 1000 oC in ammonia flow).[16]
Low angle X-ray diffraction patterns showed some degree of shrinkage and slightly
disordered structure (broader (100) peak) for EM-VN-1 sample upon nitridation [Figure 56a].
In the case of SBA-15, support nitridation did not change significantly the already quite
disordered structure of the oxide educt [Figure 56b]. In wide angle area of diffractograms no
reflections were observed for all samples.
Nitrogen elemental analyses indicate the formation of VN since 6.4 wt.% of nitrogen
was detected for EM-VN-1 sample after synthesis [Table 12] (nitridation of pure silica in same
conditions yields materials with only 3.2 wt.% nitrogen: Table 12). The SBA-15 materials with
slightly lower vanadium loading showed a lower nitrogen content of 4.9 wt.%. This is
significantly more than for the in-situ prepared VN/MCM-41 materials with low vanadium
loading. Also materials analysed after one year of storage in air, had significant amounts of
incorporated nitrogen atoms. Elemental analysis of EC-VN-1 showed a reduced carbon content
from 81.7 wt.% (for V2O5/NORIT-A composite) to 75.0 wt.% upon nitridation. This supports
the concept of carbon removal at high temperatures in ammonia flow in the presence of
nitrides, introduced already in several reports.[16, 25]
Carbonizationn of ex-situ supported V2O5 materials
In contrast to nitridation, carbonization was performed at higher temperatures (1000oC).
V2O5 supported on SBA-15 and on NORIT-A were tested as precursors [Table 12]. In both
cases significant reduction of the specific surface area was observed (by 18% for ES-VC-1 and
43% for EC-VC-1 samples). Surprisingly, the reduction of surface area in the case of SBA-15
supported VC material (by 18%: ES-VC-1) was not as strong as in the case of SBA-15
supported VN (by 25%: ES-VN-1) [Figure 54]. However, for VC supported on NORIT-A a
more severe surface area reduction (by 43%) was measured for the carbide material as
compared to the nitride (which increased its surface area by 71%). This significant difference
92

Results and Discussion
could further confirm the hypothesis of the ammonia-carbon interactions during nitridation of
V2O5 supported on NORIT-A.
The low angle diffraction patterns recorded for the SBA-15 supported materials showed
that no significant structural changes took place in this already quite disordered material
[Figure 56]. The wide angle measurements also did not confirm presence of any crystalline
phase in all carbide samples.
Elemental analysis performed for the ES-VC-1 sample revealed a carbon content of
4.15 wt.% indicating VC formation. Carbonization of pure SBA-15 under similar conditions
resulted in material with only 0.09 wt.% of carbon. Due to carbonization of the V2O5/NORIT-
A material, carbon content increased from 81.7 (for V2O5/NORIT-A composite) to 89.5 wt%
(for EC-VC-1).
93
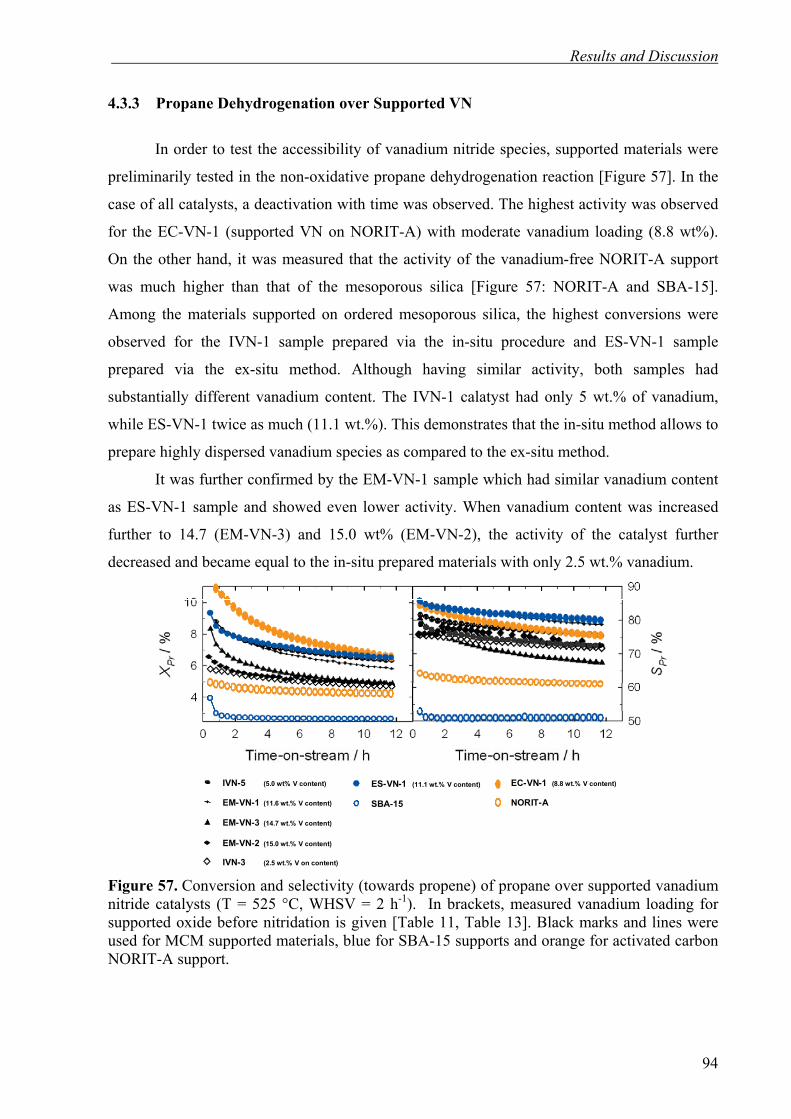
Results and Discussion
4.3.3 Propane Dehydrogenation over Supported VN
In order to test the accessibility of vanadium nitride species, supported materials were
preliminarily tested in the non-oxidative propane dehydrogenation reaction [Figure 57]. In the
case of all catalysts, a deactivation with time was observed. The highest activity was observed
for the EC-VN-1 (supported VN on NORIT-A) with moderate vanadium loading (8.8 wt%).
On the other hand, it was measured that the activity of the vanadium-free NORIT-A support
was much higher than that of the mesoporous silica [Figure 57: NORIT-A and SBA-15].
Among the materials supported on ordered mesoporous silica, the highest conversions were
observed for the IVN-1 sample prepared via the in-situ procedure and ES-VN-1 sample
prepared via the ex-situ method. Although having similar activity, both samples had
substantially different vanadium content. The IVN-1 calatyst had only 5 wt.% of vanadium,
while ES-VN-1 twice as much (11.1 wt.%). This demonstrates that the in-situ method allows to
prepare highly dispersed vanadium species as compared to the ex-situ method.
It was further confirmed by the EM-VN-1 sample which had similar vanadium content
as ES-VN-1 sample and showed even lower activity. When vanadium content was increased
further to 14.7 (EM-VN-3) and 15.0 wt% (EM-VN-2), the activity of the catalyst further
decreased and became equal to the in-situ prepared materials with only 2.5 wt.% vanadium.
IVN-5 (5.0 wt% V content)
IVN-3 (2.5 wt.% V on content)
EM-VN-3 (14.7 wt.% V content)
EM-VN-2 (15.0 wt.% V content)
EM-VN-1 (11.6 wt.% V content)
ES-VN-1 (11.1 wt.% V content)
SBA-15
EC-VN-1 (8.8 wt.% V content)
NORIT-A
IVN-5 (5.0 wt% V content)
IVN-3 (2.5 wt.% V on content)
EM-VN-3 (14.7 wt.% V content)
EM-VN-2 (15.0 wt.% V content)
EM-VN-1 (11.6 wt.% V content)
ES-VN-1 (11.1 wt.% V content)
SBA-15
EC-VN-1 (8.8 wt.% V content)
NORIT-A
Figure 57. Conversion and selectivity (towards propene) of propane over supported vanadium nitride catalysts (T = 525 °C, WHSV = 2 h-1). In brackets, measured vanadium loading for supported oxide before nitridation is given [Table 11, Table 13]. Black marks and lines were used for MCM supported materials, blue for SBA-15 supports and orange for activated carbon NORIT-A support.
94
Results and Discussion
4.3.4 Conclusions
In this paragraph it was shown how the in-situ vanadium incorporation method was
used to prepare highly dispersed vanadium nitride and carbide species inside the mesoporous
silica materials. Significant structural differences were observed for materials prepared via
“direct solubilization” and “toluene delivery” routes. The first one resulted in vanadium
incorporation in the bulk pore wall, while in the second, probably pore wall coating and
particles were obtained, which had a significant influence on the nitridation process.
Incorporation of vanadium species directly into the pore wall via direct solubilization of
vanadium precursor resulted in well ordered oxide materials, although the material was more
sensitive to the ammonolysis process as compared to pure MCM-41 and material prepared via
toluene delivery method. In turn, the ex-situ method allowed to prepare materials with higher
vanadium loadings and on different supports (like activated carbons). The catalytic activity of
the ex-situ prepared materials was similar to that of in-situ prepared materials, although the
latter ones had significantly lower vanadium content. On the other hand, if the vanadium
content was increased to around 15 wt.% for ex-situ materials, catalytic activity decreased.
The next chapter (Chapter 4.4) will present an alternative method to prepare bulk VN
(support-free) nanocrystalline vanadium nitride material with high surface areas and high
catalytic activity in propane dehydrogenation.
95
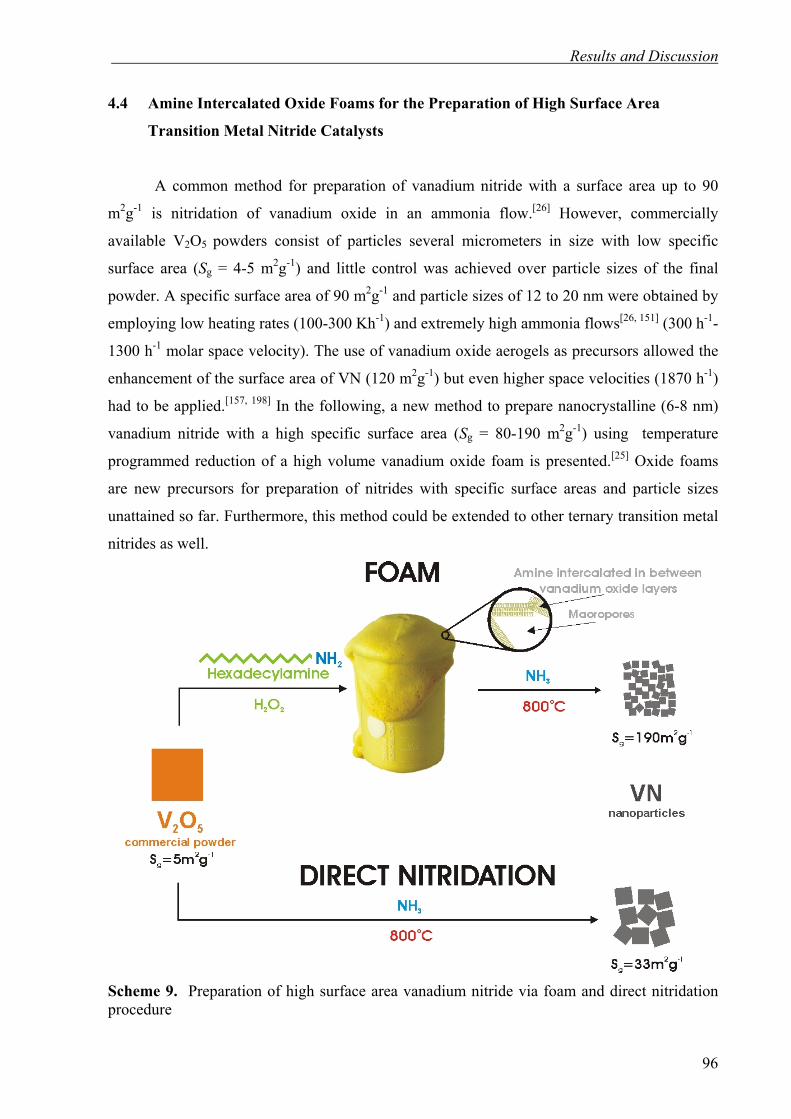
Results and Discussion
4.4 Amine Intercalated Oxide Foams for the Preparation of High Surface Area
Transition Metal Nitride Catalysts
A common method for preparation of vanadium nitride with a surface area up to 90
m2g-1 is nitridation of vanadium oxide in an ammonia flow.[26] However, commercially
available V2O5 powders consist of particles several micrometers in size with low specific
surface area (Sg = 4-5 m2g-1) and little control was achieved over particle sizes of the final
powder. A specific surface area of 90 m2g-1 and particle sizes of 12 to 20 nm were obtained by
employing low heating rates (100-300 Kh-1) and extremely high ammonia flows[26, 151] (300 h-1-
1300 h-1 molar space velocity). The use of vanadium oxide aerogels as precursors allowed the
enhancement of the surface area of VN (120 m2g-1) but even higher space velocities (1870 h-1)
had to be applied.[157, 198] In the following, a new method to prepare nanocrystalline (6-8 nm)
vanadium nitride with a high specific surface area (Sg = 80-190 m2g-1) using temperature
programmed reduction of a high volume vanadium oxide foam is presented.[25] Oxide foams
are new precursors for preparation of nitrides with specific surface areas and particle sizes
unattained so far. Furthermore, this method could be extended to other ternary transition metal
nitrides as well.
Scheme 9. Preparation of high surface area vanadium nitride via foam and direct nitridation procedure
96

Results and Discussion
Foam-derived high surface area vanadium nitrides were tested in the non-oxidative
dehydrogenation of propane. They show a considerably higher activity as compared to
vanadium nitride synthesized directly from V2O5. Conversion of n-butane on vanadium nitrides
and carbides as well as conversion of propane over supported molybdenum carbide have been
reported previously.[151, 199] The catalytic potential of transition metal nitrides for non-oxidative
dehydrogenation of propane is still largely unexplored.
4.4.1 High Surface Area Vanadium Nitride
Recently, a novel method for generation of oxide foams was developed by Livage.[200,
201] This method produced a macroporous solid, a composite of V2O5 and hexadecylamine with
the latter intercalated in between the oxide layers. The foaming process allowed the preparation
of a high-volume precursor (1 g of V2O5 produced up to 2.5 L of foam). In the following, it is
shown how this V2O5 foam is transformed in a reaction with ammonia into nano-crystalline
vanadium nitride. Not only is the macroporosity of the foam beneficial, but also amine
separating oxide layers in the composite and thus sintering or aggregation of particles during
nitridation process is avoided.
The space velocity of ammonia used in nitridation of the foam strongly affected the
amine removal. Low space velocities (33 h-1) favored the formation of pyrolitic carbon. Three
foam-derived vanadium nitride samples [Table 13] were prepared using different loadings of
foam in the reactor (1.5g, 2.5g and 7.5 g), while the ammonia flow was kept constant. For
comparison, one vanadium nitride sample (VN-S) was prepared via direct nitridation of a
commercially available V2O5 (Sg = 5 m2g-1).
Table 14. Preparation conditions and properties of VN materials (VN-1, VN-2, VN-3 prepared from V2O5 foam using different ammonia space velocities, VN-S prepared from V2O5 powder).
Sample code
Ammonia Space velocity a)
h-1
Specific Surface area
m2 g-1
Average crystallite size b)
nm
Nitrogen contentc)
wt.-%
Carbon contentd)
wt.-%
VN-1 168 80 8.1 17.8 2.8 VN-2 101 146 7.2 11.5 10.2 VN-3 33 190 6.3 9.4 17.3 VN-S 118 33 23.0 16.8 -
a) mol(NH3)/mol(V2O5), b) Average crystallite diameter estimated from XRD using the Scherrer equation.[202] c) Measured by hot gas extraction d) measured by combustion method
97

Results and Discussion
A high space velocity of ammonia (for sample VN-1: 168 h-1) allowed almost complete
removal of amine and only 2.8 wt.-% of carbon was observed as an impurity. Decreasing the
space velocity to 101 and 33 h-1 (VN-2 and VN-3) caused an increase of the carbon content to
10.2 and 17.3 wt.-%, respectively. The increasing surface area (from 80 to 190 m2g-1) with
increasing carbon content (from 2.8 to 17.3 wt.-%) suggested a significant contribution of
pyrolytic carbon to the specific surface area [Table 13]. The smallest (6.3 nm in diameter)
vanadium nitride crystallites were detected in the sample with the highest carbon content (VN-
3) [Table 13, Figure 58], while for the samples with lower carbon residue (2.8 wt.-% and 10.2
wt.-%), the crystallite diameter was estimated to be slightly larger (7.2 nm and 8.1 nm
respectively). The measured surface area of the VN-2 sample (146m2g-1) corresponded well to
the one calculated from the crystallite size (138 m2g-1, ρ=6.04 gcm-3 [144]). For VN-1 the
surface area estimated from the crystallite size was higher (123 m2g-1) as compared to the value
measured by nitrogen physisorption (80 m2g-1) indicating agglomeration. For VN-3 the
measured surface area (190 m2g-1) exceeded the estimated value (158 m2g-1) indicating
contributions from carbon residues formed during pyrolysis. Thus, the role of amine was to
prevent nitride particles from sintering and agglomerating. This mechanism was effective
during the early stages of V2O5 reduction, since V2O5 due to its low melting point (690 oC) is
very susceptible to densification. All of the foam-derived samples had substantially higher
surface areas and consisted of much smaller (6 to 8 nm in diameter) particles compared to the
sample synthesized via direct nitridation of V2O5 powder (VN-S, 23 nm), although the
synthesis conditions were similar.
Figure 58. X-ray diffraction patterns of vanadium nitride-based samples derived from foam (VN-1, VN-3) and via the standard procedure (VN-S)
98

Results and Discussion
Nitrogen analyses showed a variation of the nitrogen content with the reaction
conditions [Table 13]. The calculated value for pure VN1.0 is 21.4 wt.-%. Since our samples
contain significant amounts of residual carbon (2.8 to 17.3 wt.-%), the relative nitrogen content
is lower (17.8 to 9.4 wt.-%). Additionally, nitrides tend to form oxidic passivation layers,
which should also be taken into account. Although this effect was minimized by passivation
with oxygen (1vol.-% O2 in N2),[26] due to the very small crystallite size (6-8 nm) and large
specific surface area (80-190 m2g-1), a layer of oxide could have significantly contributed to the
overall composition. For VN-3, the oxides VO2 (29 %) and V2O5 (31%) were clearly identified
in V2p3/2 X-ray photoelectron spectra [Figure 59],[203] whereas the VN signal (40 %) was
observed at 513.6 eV.[204] For VN-1, the nitrogen content was close to the theoretical value
(17.8 wt.-%). This sample had both the lowest carbon content (2.8 wt.-%) and the largest
particles (8.3 nm). The other VN-2 and VN-3 samples had a lower nitrogen content (11.5 and
9.4 wt.-%), since the amount of residual carbon was higher (10.2 and 17.3 wt.-%), and the
particle size was smaller (7.2 and 6.1 nm) enhancing the amount of surface oxide.
Figure 59. (A) C1s XPS spectra of VN-3 after passivation with 1% oxygen/nitrogen mixture (B) V 2p3/2 spectra of the same VN-3 sample
A more in-depth analysis of the X-ray diffraction patterns [Figure 58] indicates that in
the case of VN-S, the lattice parameter was smaller (4.113 Å) than in the case of foam-derived
samples (4.125 Å for VN-3 and 4.134 Å for VN-1). In pure nitride, the lattice parameter was
4.138 Å,[144] and a slight decrease to 4.125 and 4.13 Å indicated substitution of oxygen into
the lattice. This was consistent with the elemental analyses of VN-1, with a slightly lower
nitrogen content than expected (17.8 wt.-% instead of 21.4 wt.-%). In the case of finely
dispersed vanadium oxide foam, nitridation proceeded faster as compared to pure V2O5
powder, but in the nitride oxygen was not only present in a surface oxide layer, but also
substituted in the bulk material. Substitution of nitrogen by carbon in foam-derived VN was
99

Results and Discussion
not observed. For carbon-substituted materials an increased lattice parameter is expected
(a(VC0.88) = 4.164 Å, a(VC0.96) = 4.182 Å).[26, 144] The absence of V-C bonds was further
confirmed by XPS showing no signals at 282.4 eV in the C1s spectra.[205] According to XPS
studies, carbon was present as elemental carbon (75% C-C among carbon species for VN-3)
but signals at 287.5 and 286.0 eV indicated the presence of C-N bonds.[206]
Kapoor and Oyama[26] used V2O5 as a precursor with a specific surface area of 19 m2g-1
and extremely high space velocities of ammonia (1300 h-1). The vanadium nitride received had
a particle size of 14 nm and a surface area of 90 m2g-1, while in the method reported here,
space velocities were considerably lower (168 h-1 for the sample VN-1 and 33 h-1 for the
sample VN-3). Thus, the foam route yields materials with small particle sizes (6-8nm) that can
be produced from low surface area substrates (Sg < 5 m2g-1), using orders of magnitude
ammonia flows (33 to 168 h-1) than reported in the literature.[26, 151, 157]
A transmission electron micrograph of VN-1 [Figure 60] showed powders composed of
agglomerates of crystalline particles, with sizes in between 5 and 10nm.
Figure 60. Transmission electron micrographs of VN-1
4.4.2 Propane Dehydrogenation over High Surface Area Vanadium Nitride Catalysts
Vanadium nitride materials prepared from vanadium oxide foams were tested in the
non-oxidative dehydrogenation of propane [Figure 61]. Compared to the sample synthesized
via direct nitridation of dense V2O5 powder, the foam-derived catalysts showed considerably
enhanced activity. The propane conversion increased with the specific surface area of the
materials. All catalyst samples were prone to a rapid deactivation during the first 2hours of
experiments. However, after 2hour time-on-stream, the gravimetric reaction rate over the
100

Results and Discussion
sample with the highest specific surface area (VN-3, 76 µmol g-1 s-1) was 2.5 times higher than
that observed on the sample with the lowest specific surface area (VN-S, 31 µmol g-1 s-1).
Figure 61. Conversion and selectivity (towards propene) of propane over vanadium nitride catalysts (T = 525 °C, WHSV = 2 h-1).
The higher gravimetric reaction rates over the foam-derived samples were mainly due
to a higher rate of propene formation over these catalysts. The relative increase of propene
yield passing from the catalyst with Sg = 33 m2g-1 to that with 190 m2g-1 was 3.3 %, whereas
the combined yields of methane, ethane and ethene increased by 0.5 % only. The latter
products resulted from propane cracking and hydrogenolysis as side reactions of propane
dehydrogenation. As a consequence of higher dehydrogenation rate, selectivity of high surface
area nitrides for propene was higher than that of the conventionally prepared sample VN-S (>
70 % for VN-2 and VN-3 vs. < 55 % for VN-S compared after the initial deactivation period of
2h time-on-stream). The areal rate was similar over VN-1, VN-2 and VN-3 (0.54 µmol m-2 s-1),
but lower than that observed over VN-S (1.08 µmol m-2 s-1). This indicated that, with respect to
VN-S, the foam-derived samples exhibited a lower density of active sites or sites with a lower
activity. These sites could have been more selective for the dehydrogenation of propane.
Moreover, although the areal rate for the foam-derived samples with different specific surface
areas was similar, the propene selectivities were slightly different. This indicated the presence
of different types of active sites on the catalyst surface. This may be related to a change of the
surface composition with increasing specific surface area or to a different local coordination of
active sites on the surface of smaller and larger crystallites (e.g., defect positions), respectively.
However, the nature of these sites is still unknown. A possible role of the higher residual
carbon content in the materials with higher specific surface area could also not be excluded. In
conclusion, although the results depicted in Figure 61 showed that higher conversions were
achieved on materials with larger specific surface areas, the different selectivities observed
101

Results and Discussion
over VN-1, VN-2 and VN-3 implied that the surface properties and, thus, the active sites might
have been affected as well. Similar effects of the specific surface area on the areal rate were
also observed by Y. Zhang et al.[207] during the hydrogenation of cyclohexene over Mo2N
catalysts. These authors correlated the higher specific activities of the samples with lower
specific surface areas with a higher ratio of (111)- relative to (200)-crystal planes as
determined from the corresponding intensities of XRD reflections.
For a comparison, propane conversion over the foam-derived vanadium nitride with the
highest specific surface area (VN-3) was also carried out under the conditions applied by
Solymosi et al. in an investigation of a Mo2C catalyst supported on Cab-O-Sil (high surface
area silica).[199] Also, the Mo2C catalyst was reported to deactivate within the first 2 h of the
experiment. The catalytic activity of both VN-3 and the supported Mo2C was in a similar
range. Upon closer analysis of the propane conversion, the vanadium nitride catalyst was less
active than the Mo2C supported on Cab-O-Sil in the initial stage of the experiment (initial areal
rate: 0.27 vs. 0.47 µmol m-2 s-1 as calculated based on the specific surface area of the Cab-O-Sil
support ). However, after 3h time-on-stream, the areal rate was equal on both catalysts (0.22
µmol m-2 s-1) and after 12h time-on-stream slightly higher over VN-3 than over the supported
Mo2C catalyst (0.21 µmol m-2 s-1 vs. 0.15 µmol m-2 s-1 ). Moreover, the selectivity for propane
dehydrogenation was significantly higher (SPr > 63%) over the vanadium nitride catalyst
throughout the whole catalytic experiment. This was due to a higher activity of the Mo2C
catalyst for propane cracking and aromatization which was particularly pronounced at the early
stages of the catalytic conversion (SPr < 49%, SMethane+Ethane+Ethene > 36%, YAromatics > 15%,
YMethane+Ethane > 30% in the first 2h time-on-stream).
At similar experimental conditions, the initial reaction rate observed over the most
active vanadium nitride catalyst (VN-3) was lower than that observed over a silica supported
Pt-Sn-catalyst (gravimetric rate: 150 vs. 450 µmol g-1 s-1, areal rate 0.8 vs. 1.03 µmol m-2 s-1 as
calculated based on the specific surface area of the silica support). Nevertheless, the foam-
derived VN catalysts reported here appeared to be more efficient catalysts than all the
transition metal nitrides and carbides for the non-oxidative dehydrogenation of propane
reported up to now in the literature. Although the reasons for the rapid deactivation of these
catalysts are still unknown, the higher activity obtained through the new foam-derived
materials showed that there is still significant room for improvement of their stability and
conversion levels. As these materials are less costly than noble metals, they might offer an
interesting alternative as catalysts in the non-oxidative dehydrogenation of lower alkanes.
102
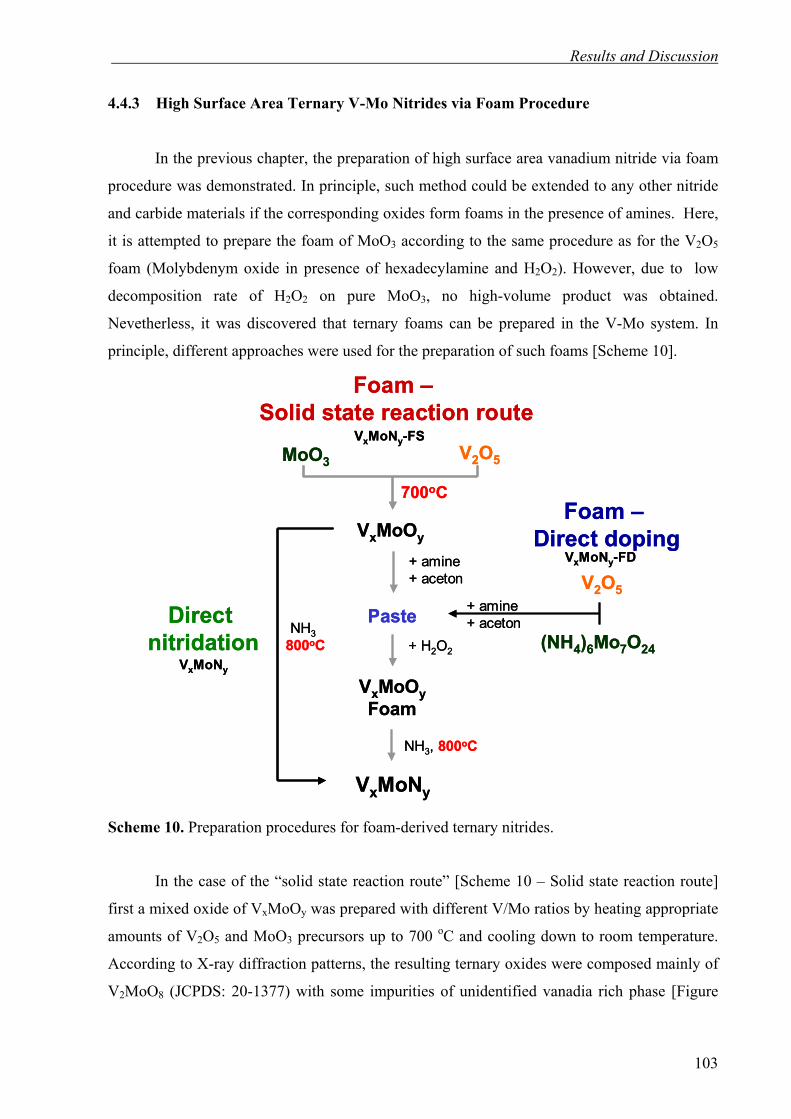
Results and Discussion
4.4.3 High Surface Area Ternary V-Mo Nitrides via Foam Procedure
In the previous chapter, the preparation of high surface area vanadium nitride via foam
procedure was demonstrated. In principle, such method could be extended to any other nitride
and carbide materials if the corresponding oxides form foams in the presence of amines. Here,
it is attempted to prepare the foam of MoO3 according to the same procedure as for the V2O5
foam (Molybdenym oxide in presence of hexadecylamine and H2O2). However, due to low
decomposition rate of H2O2 on pure MoO3, no high-volume product was obtained.
Nevetherless, it was discovered that ternary foams can be prepared in the V-Mo system. In
principle, different approaches were used for the preparation of such foams [Scheme 10].
Foam –Solid state reaction route
Foam –Direct doping
(NH4)6Mo7O24
V2O5+ amine+ aceton
VxMoOy
MoO3 V2O5
700oC
VxMoOyFoam
+ amine+ aceton
Paste+ H2O2
NH3, 800oC
VxMoNy
VxMoNy-FS
VxMoNy-FD
Direct nitridation
VxMoNy
NH3800oC
Foam –Solid state reaction route
V2O5MoO3
700oCFoam –
Direct doping
(NH4)6Mo7O24
V2O5+ amine+ aceton
VxMoOy
VxMoOyFoam
+ amine+ aceton
Paste+ H2O2
NH3, 800oC
VxMoNy
VxMoNy-FS
VxMoNy-FD
Direct nitridation
VxMoNy
NH3800oC
Scheme 10. Preparation procedures for foam-derived ternary nitrides.
In the case of the “solid state reaction route” [Scheme 10 – Solid state reaction route]
first a mixed oxide of VxMoOy was prepared with different V/Mo ratios by heating appropriate
amounts of V2O5 and MoO3 precursors up to 700 oC and cooling down to room temperature.
According to X-ray diffraction patterns, the resulting ternary oxides were composed mainly of
V2MoO8 (JCPDS: 20-1377) with some impurities of unidentified vanadia rich phase [Figure
103

Results and Discussion
62]. The relative amount of the unknown phase was increasing with the increasing vanadium
content. Although the unkown reflections were not clearly identified in the crystallographic
database, the phase diagram of the V2O5-MoO3 system suggested that beside V2MoO8, Mo
doped V2O5 phase ((V1-yMoy)2O5) should be present in the vanadium rich samples.[208]
10 30 50 70 90
V4MoOy
V2MoOy
V1MoOy
V2O5
Inte
nsity
(arb
itrar
y un
its)
O/2θ
*
** **
**
* *** *
*
** **
**
* *** *
*
*
+
+
+
+
*
* V2MoO8
unknown+
**
*+*
**
+
+
10 30 50 70 90
V4MoOy
V2MoOy
V1MoOy
V2O5
Inte
nsity
(arb
itrar
y un
its)
O/2θ
*
** **
**
* *** *
*
** **
**
* *** *
*
*
+
+
+
+
*
* V2MoO8
unknown+
**
*+*
**
+
+
Figure 62. X-ray diffractograms of selected ternary VxMoOy materials and V2O5 precursor.
After synthesis of the ternary oxides, the resulting product was mixed with amine and
acetone to form a paste. The prepared paste was then treated with H2O2 to start the foaming
process. The as prepared foam was left for drying and placed in the reactor in ammonia flow at
800 oC for nitridation. The samples prepared via this procedure are marked as VxMoNy-FS. A
“direct doping” [Scheme 10 – direct doping] procedure was also employed to prepare foam
derived ternary nitrides. In the latter, instead of ternary oxides, a mixture of V2O5 and a
molybdenum precursor dissolving in H2O2 was used (ammonium heptamolybdate tetrahydrate:
104

Results and Discussion
(NH4)6Mo7•4H2O). High surface area ternary V-Mo-N nitrides were also proposed by Oyama
as interesting materials as heterogeneous catalysts due to their high surface reactivity.
The preparation of V-Mo foams was successful for materials with V/Mo ratio higher
than one. If lower amounts of vanadium were used, the foaming process was slow and the
foam tended to collapse before reaching high volumes. Preparation of foams via the “solid state
reaction route” resulted in more homogeneous and higher-volume materials, as compared to
the foams prepared via “direct doping”. Also the nitridation experiments of such foams
indicated that in the case of foam precursors prepared via the “solid state reaction route” the
received nitride materials had higher surface areas than those prepared from directly doped
foams. In the case of V4MoNy-FS sample, a surface area of 198 m2g-1 was measured, while for
the same composition prepared via the direct doping procedure, a lower surface area of 151
m2g-1 was observed (V2MoNy-FD) [Table 14]. The same trend was observed for materials with
lower V/Mo ratio. For example, V2MoNy-FS prepared via solid state reaction foam route had a
surface area of 83 m2g-1, while for the sample prepared via direct doping of the foam, only 37
m2g-1 was measured (V2MoNy-FD) [Table 14]. Therefore, other foam-derived samples with
different stoichiometry were prepared only via the “solid state reaction route”.
Table 15. Surface areas and preparation procedures of foam-derived ternary nitrides compared to materials prepared by direct nitridation
Material Foam preparation Surface areab)
(VxMoNy-FS VxMoNy-FD)
Surface area: non-foamed materialc)
(VxMoNy)
Crystallite sized)
(VxMoNy-FS VxMoNy-FD)
Crystallite size: non-foamed
materiale)
(VxMoNy) VN - 190 33 6.1 23.0 V4MoNy SSRRa) (FS) 198 55 6.3 16.3 V3MoNy SSRRa) (FS) 127 66 6.8 14.7 V2MoNy SSRRa) (FS) 83 90 8.0 13.3 V1MoNy SSRRa) (FS) 45 100 10.2 5.6 Mo2N - - 120 - 6 V4MoNy Direct doping (FD) 151 55 6.9 16.3 V2MoNy Direct doping (FD) 37 90 9.1 13.3 a) SSRR – solid state reaction route of foam preparation, b) BET specific surface area of samples prepared from foams [Scheme 10 – foam – direct doping, solid state reaction route] c) BET specific surface area of samples prepared via direct ternary oxide nitridation procedure [Scheme 10 – direct nitridation] d) Calculated according to the Scherrer equation e) Calculated according to the Scherrer equation for samples prepared via direct alloy nitridation procedure
In order to investigate if the presence of amine and foam formation had a crucial
influence on the preparation of the high surface area material, additional samples were
prepared via direct nitridation of non-foamed ternary oxides [Scheme 7 – Direct nitridation].
105

Results and Discussion
The surface area of pure VN and Mo2N prepared via direct nitridation of ternary oxides is also
given for comparison [Table 14]. The highest surface areas were observed for foam derived
materials with high vanadium content (VN: 190m2g-1 and V4MoNy-FS: 198m2g-1). If the
amount of molybdenum was increased, the specific surface area decreased down to 45m2g-1 for
the sample with the lowest vanadium content (V1MoNy-FS). The inverse relation was observed
for the materials prepared via direct nitridation procedure [Scheme 10 – Direct nitridation]. In
it, the surface area was increasing from the 33m2g-1 (pure VN sample) to 100m2g-1, measured
for V1MoNy-FS sample with low vanadium content. The graphical form of specific surface
area values with changing stoichiometry and preparation procedure is presented in Figure 63.
0
50
100
150
200
0 0,2 0,4 0,6 0,8 1
200
150
100
50
0
VN
V4MoNy
V3MoNy
V2MoNyV1MoNy
Mo2N
Foam derived materials
Direct nitridation
Spe
cific
sur
face
are
a (m
2 g-1
)
200 40 60 80
V4MoNy-FS
V3MoNy-FS
V2MoNy-FS
V1MoNy-FS
Composition (Mo at. %)
1000
50
100
150
200
0 0,2 0,4 0,6 0,8 1
200
150
100
50
0
VN
V4MoNy
V3MoNy
V2MoNyV1MoNy
Mo2N
Foam derived materials
Direct nitridation
Spe
cific
sur
face
are
a (m
2 g-1
)
200 40 60 80
V4MoNy-FS
V3MoNy-FS
V2MoNy-FS
V1MoNy-FS
Composition (Mo at. %)
0
50
100
150
200
0 0,2 0,4 0,6 0,8 1
200
150
100
50
0
VN
V4MoNy
V3MoNy
V2MoNyV1MoNy
Mo2N
Foam derived materials
Direct nitridation
Spe
cific
sur
face
are
a (m
2 g-1
)
200 40 60 80
V4MoNy-FS
V3MoNy-FS
V2MoNy-FS
V1MoNy-FS
Composition (Mo at. %)
100
Figure 63. Specific surface areas of ternary and binary nitrides prepared via direct nitridation
(blue line) and nitridation of foam derived via solid state reaction route (grey line)
Both γ-Mo2N and VN crystallize in the face centered cubic unit cell (fcc) with different
unit cell size. In the case of γ-Mo2N the lattice constant is 4.126 Å while for the VN it is 4.138
Å. Ternary V-Mo nitrides were reported by Oyama to have the same fcc unit cell symmetry.
The V atoms are substituted by Mo in the VN crystal and Mo atoms by V in γ-Mo2N so that
VN-Mo2N solid solutions are formed. The X-ray diffraction patterns confirmed the face
centered cubic structure of ternary nitrides with peaks located in between the corresponding
peaks of γ-Mo2N and VN [Figure 64].
106
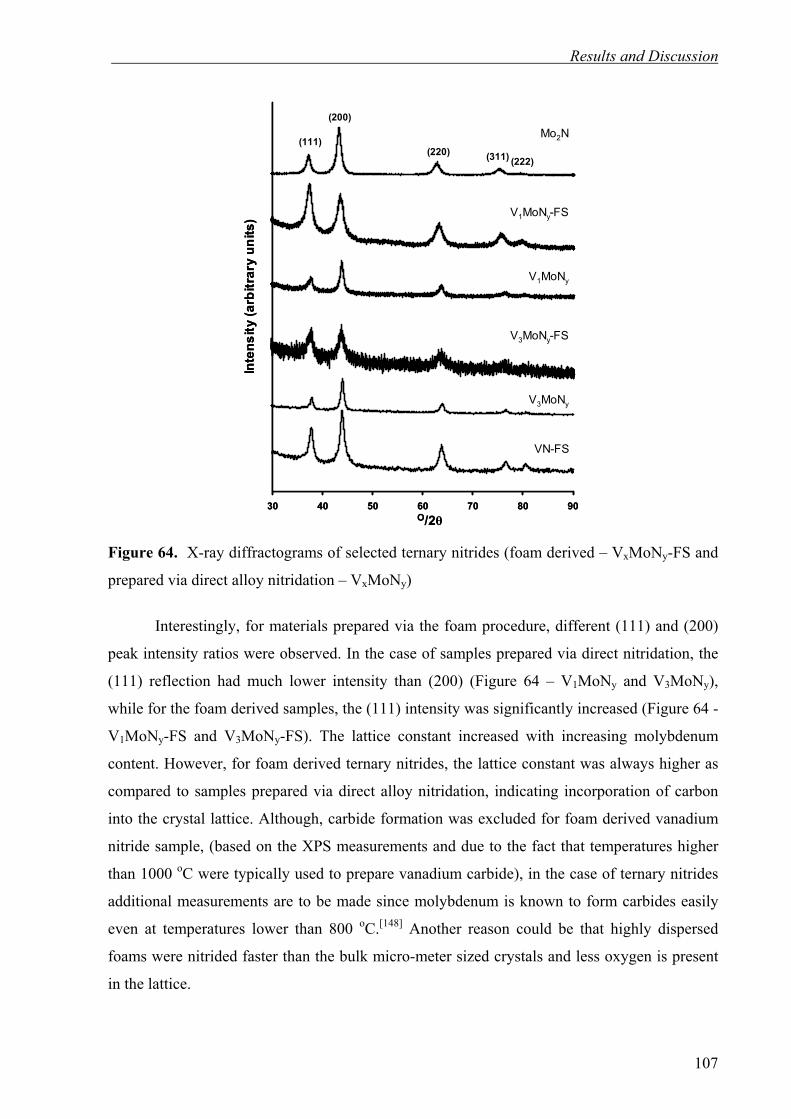
Results and Discussion
30 40 50 60 70 80 90
(111)
(200)
(220) (311) (222)
VN-FS
V3MoNy-FS
V3MoNy
V1MoNy-FS
V1MoNy
Mo2N
Inte
nsity
(arb
itrar
y un
its)
O/2θ30 40 50 60 70 80 90
(111)
(200)
(220) (311) (222)
VN-FS
V3MoNy-FS
V3MoNy
V1MoNy-FS
V1MoNy
Mo2N
Inte
nsity
(arb
itrar
y un
its)
O/2θ Figure 64. X-ray diffractograms of selected ternary nitrides (foam derived – VxMoNy-FS and
prepared via direct alloy nitridation – VxMoNy)
Interestingly, for materials prepared via the foam procedure, different (111) and (200)
peak intensity ratios were observed. In the case of samples prepared via direct nitridation, the
(111) reflection had much lower intensity than (200) (Figure 64 – V1MoNy and V3MoNy),
while for the foam derived samples, the (111) intensity was significantly increased (Figure 64 -
V1MoNy-FS and V3MoNy-FS). The lattice constant increased with increasing molybdenum
content. However, for foam derived ternary nitrides, the lattice constant was always higher as
compared to samples prepared via direct alloy nitridation, indicating incorporation of carbon
into the crystal lattice. Although, carbide formation was excluded for foam derived vanadium
nitride sample, (based on the XPS measurements and due to the fact that temperatures higher
than 1000 oC were typically used to prepare vanadium carbide), in the case of ternary nitrides
additional measurements are to be made since molybdenum is known to form carbides easily
even at temperatures lower than 800 oC.[148] Another reason could be that highly dispersed
foams were nitrided faster than the bulk micro-meter sized crystals and less oxygen is present
in the lattice.
107

Results and Discussion
4,1
4,12
4,14
4,16
4,18
4,2
0 0,2 0,4 0,6 0,8 1
4.20
4.18
4.16
4.14
4.12
4.100 20 40 60 80 100
Composition (Mo at. %)
Latti
ce c
onst
ant (
Å)
Mo 2
N
V 1M
oNy-F
S
V 2MoN
y-F
S
V 3MoN
y-F
S
V 4MoN
y-F
S
VN-F
SVN
V 4MoN
yV 3M
oNy
V 2MoN
y
V 1MoN
y
Nitridation of foam prepared by solid state reaction route
Direct alloy nitridation
Figure 65. Lattice constants of ternary nitrides as a function of chemical composition.
The VMoxNy materials prepared from foams and via the direct nitridation were also
preliminary tested in the propane dehydrogenation reaction. However, they had lower
conversions and selectivities than the high surface area VN with 190m2g-1 prepared from foam.
Although the V2O5 foam synthesis procedure could not be directly applied for the preparation
of MoO3 foams (at least without major modification), the intercalation of amine into the
molybdic acid was recently reported.[209] Also preparation of TiO2 foam in presence of amine is
described with the similar procedure to the V2O5 foam preparation. Such foams can be
interesting for the preparation of other nitride nanomaterials.[210]
108

Results and Discussion
4.4.4 Conclusions
In summary, a novel method for preparation of vanadium nitride and doped vanadium
nitride nanoparticles (6-8 and 6-10 nm) was presented. A pre-structured foam precursor
containing highly dispersed, amine intercalated V2O5 was used as a precursor. The residual
carbon content and particle size was controlled by changing the space velocity of ammonia.
The foam route should be in principle applicable to many other systems such as carbides and
oxides, not only of vanadium but also of other transition metals. Preliminary experiments
showed that also high surface area ternary nitrides could be prepared via this method. In
comparison to vanadium nitride obtained through the conventional V2O5 nitridation route,
these high surface area materials exhibited a significantly improved catalytic activity in the
non-oxidative dehydrogenation of propane. In contrast to supported vanadium nitrides,
(Chapter 4.3) preparation of foam nitrides was simpler and the materials obtained were
crystalline according to X-ray diffraction patterns. Due to their mechanical and tribological
properties the bulk not supported nanocrystalline nitrides may be an interesting material for
nanocomposites with increased hardness or plasticity.
109

Summary
5 Summary
In the present work new methods were developed for preparation of novel nanosized
and nanostructured ceramic materials [Scheme 11].
Ordered mesoporous silica SBA-15 was found to be useful as a hard template for the
nanocasting of silicon carbide and allowed the preparation of high temperature stable
mesoporous silicon carbide ceramics [Scheme 11 – NANOCASTING]. Chemical vapor
infiltration of SBA-15 with dimethyldichlorosilane at elevated temperatures yields SiC/SBA-
15 nanocomposites. The subsequent HF treatment of those composites resulted in silica
removal and preparation of mesoporous silicon carbide with surface areas between 410 and
830 m2g-1 and high mesopore volume (up to 0.9 cm3g-1). The pore size (between 3 and 7nm in
diameter) and surface area of mesoporous silicon carbide were controlled by adjusting the
infiltration conditions (time, atmosphere). The mesoporous silicon carbide prepared via this
method showed high structural thermal stability at 1300 oC, exceeding that of the SBA-15
template. However, the ordering on the mesoscopic scale was low.
Scheme 11. Preparation of new high surface area nanostructured ceramics
Nevertheless, highly ordered mesoporous silicon carbide materials were obtained via
polymer melt infiltration in SBA-15. The low molecular weight polycarbosilane used as a
110

Summary
preceramic precursor was converted at 1300 oC to silicon carbide inside the SBA-15, and after
subsequent silica removal by HF, a highly ordered mesoporous material was
obtained. Ordered mesoporous silicon carbide prepared by the methods reported here, may be
an interesting material as a support due to its high temperature stability, chemical inertness,
high thermal conductivity and semiconductor properties.
In contrast to the nanocasting approach, based on the complete pore filling, also a new
in-situ procedure for the preparation of finely dispersed metal and metal oxide particles inside
ordered mesoporous silica was developed [Scheme 11 – IN-SITU and
INFILTRATION/INCORPORATION]. A swelling agent (toluene) was used to deliver a
hydrophobic platinum precursor into the surfactant micelles before addition of silica source.
Such an in-situ method resulted in very high platinum incorporation (80-100%), not achieved
for any other in-situ preparation procedures. Additionally, the presence of platinum allowed to
decrease the template removal temperatures. Moreover, the method was also extended to other
metal or metal oxide/ordered mesoporous silica systems. This may be especially interesting for
the preparation of ordered mesoporous materials with low melting points, where typically the
structure collapses during the high temperature calcinations process.
The in-situ synthesized V2O5/MCM-41 materials were used to prepare VN/MCM-41
composites via nitridation in ammonia at 800oC [Scheme 11 – OMS / VN nanocomposite].
This method allowed to prepare highly dispersed, X-ray amorphous vanadium nitride species,
with high activity in the propane dehydrogenation. Compared to nitridation of supported
vanadium oxide prepared via the ex-situ procedure, in-situ synthesized materials showed
similar catalytic activity, in spite of having significantly lower vanadium loading.
As an alternative for the preparation of supported nitride materials, a novel preparation
procedure of bulk not supported nanocrystalline vanadium nitride with high surface area was
presented. Instead of pure oxide powder (which was typically used in the preparation of high
surface area vanadium nitride catalysts), a macroporous amine intercalated V2O5 was used as
the starting material [Scheme 11 – FOAMING]. The obtained nitride consisted of small
crystallites and had a surface area up to 198 m2g-1. Moreover, this foam-derived VN showed
significantly improved activity as a catalyst in propane dehydrogenation. This novel
preparation method could also be extended to other systems such as ternary VMoxNy nitrides.
111
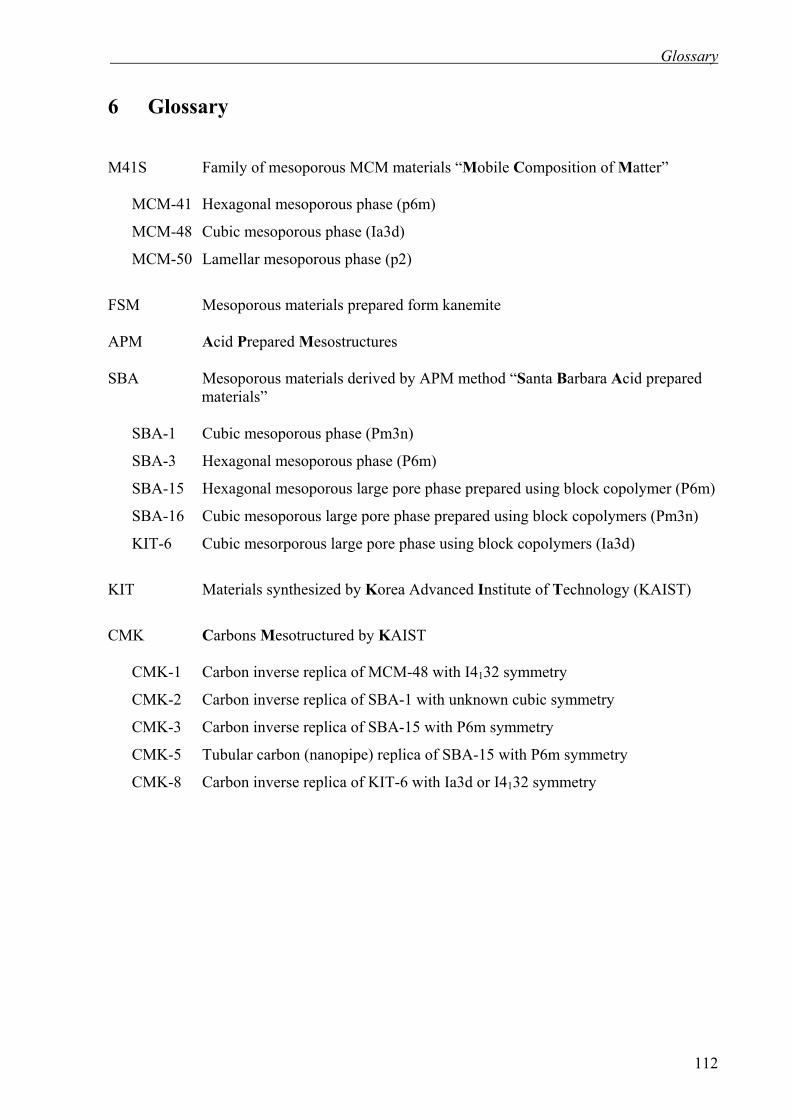
Glossary
6 Glossary
M41S Family of mesoporous MCM materials “Mobile Composition of Matter”
MCM-41 Hexagonal mesoporous phase (p6m)
MCM-48 Cubic mesoporous phase (Ia3d)
MCM-50 Lamellar mesoporous phase (p2)
FSM Mesoporous materials prepared form kanemite APM Acid Prepared Mesostructures SBA Mesoporous materials derived by APM method “Santa Barbara Acid prepared
materials” SBA-1 Cubic mesoporous phase (Pm3n)
SBA-3 Hexagonal mesoporous phase (P6m)
SBA-15 Hexagonal mesoporous large pore phase prepared using block copolymer (P6m)
SBA-16 Cubic mesoporous large pore phase prepared using block copolymers (Pm3n)
KIT-6 Cubic mesorporous large pore phase using block copolymers (Ia3d)
KIT Materials synthesized by Korea Advanced Institute of Technology (KAIST)
CMK Carbons Mesotructured by KAIST CMK-1 Carbon inverse replica of MCM-48 with I4132 symmetry
CMK-2 Carbon inverse replica of SBA-1 with unknown cubic symmetry
CMK-3 Carbon inverse replica of SBA-15 with P6m symmetry
CMK-5 Tubular carbon (nanopipe) replica of SBA-15 with P6m symmetry
CMK-8 Carbon inverse replica of KIT-6 with Ia3d or I4132 symmetry
112

References
7 References
[1] C. T. Kresge, M. E. Leonowicz, W. J. Roth, J. C. Vartuli, J. S. Beck, Nature 1992, 359,
710-712.
[2] J. S. Beck, J. C. Vartuli, W. J. Roth, M. E. Leonowicz, C. T. Kresge, K. D. Schmitt, C. T.
W. Chu, D. H. Olson, E. W. Sheppard, S. B. McCullen, J. B. Higgins, J. L. Schlenker, J. Am.
Chem. Soc. 1992, 114, 10834-10843.
[3] A. Taguchi, F. Schüth, Microporous Mesoporous Mater. 2005, 77, 1-45.
[4] Y. J. Ying, C. P. Mehnert, M. S. Wong, Angew. Chem. Int. Ed. 1999, 38, 56-77.
[5] U. Ciesla, F. Schüth, Microporous Mesoporous Mater. 1999, 27, 131-149.
[6] A. Vinu, V. Murugesan, O. Tangermann, M. Hartmann, Chem. Mater. 2004, 16, 3056-
3065.
[7] D. Y. Zhao, J. L. Feng, Q. S. Huo, N. Melosh, G. H. Fredrickson, B. F. Chmelka, G. D.
Stucky, Science 1998, 279, 548-552.
[8] D. Y. Zhao, Q. S. Huo, J. L. Feng, B. F. Chmelka, G. D. Stucky, J. Am. Chem. Soc. 1998,
120, 6024-6036.
[9] F. Schüth, Chem. Mater. 2001, 13, 3184-3195.
[10] A. Sayari, P. Liu, Microporous Mater. 1997, 12, 149-177.
[11] R. Ryoo, S. H. Joo, S. Jun, J. Phys. Chem. B 1999, 103, 7743-7746.
[12] S. Jun, S. H. Joo, R. Ryoo, M. Kruk, M. Jaroniec, Z. Liu, T. Ohsuna, O. Terasaki, J. Am.
Chem. Soc. 2000, 122, 10712-10713.
[13] R. Ryoo, S. H. Joo, M. Kruk, M. Jaroniec, Adv. Mater. 2001, 13, 677-681.
[14] A. H. Lu, W. Schmidt, A. Taguchi, B. Spliethoff, B. Tesche, F. Schüth, Angew. Chem.
Int. Ed. 2002, 41, 3489-3492.
[15] J. Roggenbuck, M. Tiemann, J. Am. Chem. Soc. 2005, 127, 1096-1097.
[16] P. Dibandjo, L. Bois, F. Chassagneux, D. Cornu, J. M. Letoffe, B. Toury, F. Babonneau,
P. Miele, Adv. Mater. 2005, 17, 571-574.
[17] K. A. Schwetz in Handbook of Ceramic Hard Materials, Vol. 1 (Ed: R. Riedel) Wiley-
VCH, Weinheim 2000, 683-740.
[18] M. J. Ledoux, C. Pham-Huu, Cattech 2001, 5, 226-246.
[19] M. Sternitzke, J. European Ceram. Soc. 1997, 17, 1061-1082.
[20] P. Krawiec, C. Weidenthaler, S. Kaskel, Chem. Mater. 2004, 16, 2869-2880.
[21] P. Krawiec, S. Kaskel, J.Solid State Chem. 2006, 179, 2281-2289.
113
References
[22] P. Krawiec, D. Geiger, S. Kaskel, Chem.Commun. 2006, 23, 2469-2470.
[23] R. B. Levy, M. Boudart, Science 1973, 181, 547-549.
[24] S. T. Oyama in The Chemistry of Transition Metal Carbides and Nitrides, (Ed: S. T.
Oyama) Blackie Academic & Professional, London 1996,
[25] P. Krawiec, P. L. De Cola, R. Gläser, J. Weitkamp, C. Weidenthaler, S. Kaskel,
Adv.Mater. 2006, 18, 505-508.
[26] R. Kapoor, S. T. Oyama, J. Solid State Chem. 1992, 99, 303-312.
[27] P. Krawiec, E. Kockrick, G. Auffermann, P. Simon, S. Kaskel, Chem.Mater. 2006, 18,
2663-2669.
[28] A. Lind, J. Andersson, S. Karlsson, P. Agren, P. Bussian, H. Amenitsch, M. Linden,
Langmuir 2002, 18, 1380-1385.
[29] K. S. W. Sing, D. H. Everett, R. A. W. Haul, L. Moscou, R. A. Pierotti, J. Rouquerol, T.
Siemieniewska, Pure Appl. Chem. 1985, 57, 603-619.
[30] J. Weitkamp, Solid State Ion. 2000, 131, 175-188.
[31] Y. Ma, W. Tong, H. Zhou, S. L. Suib, Microporous Mesoporous Mater. 2000, 37, 243-
252.
[32] O. M. Yaghi, M. O'Keeffe, N. W. Ockwig, H. K. Chae, M. Eddaoudi, J. Kim, Nature
2003, 423, 705-714.
[33] S. Kitagawa, R. Kitaura, S. Noro, Angew. Chem. Int. Ed. 2004, 43, 2334-2375.
[34] J. L. C. Rowsell, O. M. Yaghi, Microporous Mesoporous Mater. 2004, 73, 3-14.
[35] S. Kaskel in Handbook of Porous Solids, (Ed: Schüth F., Sing K. S. W. and W. J) Wiley
VCH, Weinheim 2002, 1190-1249.
[36] E. Auer, A. Freund, J. Pietsch, T. Tacke, Appl. Catal. A-Gen. 1998, 173, 259-271.
[37] G. Chaplais, K. Schlichte, O. Stark, R. A. Fischer, S. Kaskel, Chem. Commun. 2003,
730-731.
[38] V. C. Menon, S. Komarneni, J. Porous Mater. 1998, 5, 43-58.
[39] J. L. C. Rowsell, A. R. Millward, K. S. Park, O. M. Yaghi, J. Am. Chem. Soc. 2004, 126,
5666-5667.
[40] A. C. Dillon, M. J. Heben, Appl. Phys. A-Mater. Sci. Process. 2001, 72, 133-142.
[41] P. Krawiec, M. Kramer, M. Sabo, R. Künschke, H. Fröde, S. Kaskel, Adv.Eng.Mater
2006, 8, 293-296.
[42] Z. Y. Yuan, B. L. Su, J. Mater. Chem. 2006, 16, 663-677.
[43] S. Polarz, B. Smarsly, J. Nanosci. Nanotechnol. 2002, 2, 581-612.
[44] C. M. Soukoulis, Nanotechnology 2002, 13, 420-423.
114

References
[45] J. M. Thomas, W. J. Thomas, Principles and Practice of Heterogeneous Catalysis,
VCH, Weinheim, 2005.
[46] A. Firouzi, D. Kumar, L. M. Bull, T. Besier, P. Sieger, Q. Huo, S. A. Walker, J. A.
Zasadzinski, C. Glinka, J. Nicol, D. Margolese, G. D. Stucky, B. F. Chmelka, Science 1995,
267, 1138-1143.
[47] Q. S. Huo, D. I. Margolese, G. D. Stucky, Chem. Mater. 1996, 8, 1147-1160.
[48] Q. S. Huo, R. Leon, P. M. Petroff, G. D. Stucky, Science 1995, 268, 1324-1327.
[49] J. M. Kim, S. K. Kim, R. Ryoo, Chem. Commun. 1998, 259-260.
[50] A. Corma, Chem. Rev. 1997, 97, 2373-2419.
[51] S. Gontier, A. Tuel Stud. Surf. Sci. Catal. 1995, 97, 157-164.
[52] S. Che, Z. Liu, T. Ohsuna, K. Sakamoto, O. Terasaki, T. Tatsumi, Nature 2004, 429,
281-284.
[53] F. P. Matthae, D. Genske, C. Minchev, H. Lechert Stud. Surf. Sci. Catal. 1998, 117, 223-
230.
[54] J. C. Vartuli, K. D. Schmitt, C. T. Kresge, W. J. Roth, M. E. Leonowicz, S. B. McCullen,
S. D. Hellring, J. S. Beck, J. L. Schlenker, D. H. Olson, E. W. Sheppard, Chem. Mater. 1994,
6, 2317-2326.
[55] Q. S. Huo, D. I. Margolese, U. Ciesla, D. G. Demuth, P. Y. Feng, T. E. Gier, P. Sieger,
A. Firouzi, B. F. Chmelka, F. Schüth, G. D. Stucky, Chem. Mater. 1994, 6, 1176-1191.
[56] F. Kleitz, S. H. Choi, R. Ryoo, Chem. Commun. 2003, 2136-2137.
[57] A. Galarneau, N. Cambon, F. Di Renzo, R. Ryoo, M. Choi, F. Fajula, New J. Chem.
2003, 27, 73-79.
[58] C. Booth, D. Attwood, Macromol. Rapid Commun. 2000, 21, 501-527.
[59] J. N. Israelachvili, H. Wennerstrom, J. Phys. Chem. 1992, 96, 520-531.
[60] G. Wanka, H. Hoffmann, W. Ulbricht, Macromolecules 1994, 27, 4145-4159.
[61] D. M. Antonelli, J. Y. Ying, Angew. Chem. Int. Ed. 1995, 34, 2014-2017.
[62] U. Ciesla, S. Schacht, G. D. Stucky, K. K. Unger, F. Schüth, Angew. Chem. Int. Ed.
1996, 35, 541-543.
[63] Q. S. Huo, D. I. Margolese, U. Ciesla, P. Y. Feng, T. E. Gier, P. Sieger, R. Leon, P. M.
Petroff, F. Schüth, G. D. Stucky, Nature 1994, 368, 317-321.
[64] P. Liu, I. L. Moudrakovski, J. Liu, A. Sayari, Chem. Mater. 1997, 9, 2513-2520.
[65] P. D. Yang, D. Y. Zhao, D. I. Margolese, B. F. Chmelka, G. D. Stucky, Nature 1998,
396, 152-155.
115
References
[66] P. V. Braun, P. Osenar, V. Tohver, S. B. Kennedy, S. I. Stupp, J. Am. Chem. Soc. 1999,
121, 7302-7309.
[67] V. Tohver, P. V. Braun, M. U. Pralle, S. I. Stupp, Chem. Mater. 1997, 9, 1495-1498.
[68] P. Osenar, P. V. Braun, S. I. Stupp, Adv. Mater. 1996, 8, 1022-1025.
[69] D. Farrusseng, K. Schlichte, B. Spliethoff, A. Wingen, S. Kaskel, J. S. Bradley, F.
Schüth, Angew. Chem. Int. Ed. 2001, 40, 4204-4207.
[70] S. Kaskel, D. Farrusseng, K. Schlichte, Chem. Commun. 2000, 2481-2482.
[71] S. Kaskel, K. Schlichte, B. Zibrowius, Phys. Chem. Chem. Phys. 2002, 4, 1675-1681.
[72] G. S. Attard, C. G. Goltner, J. M. Corker, S. Henke, R. H. Templer, Angew. Chem.Int.
Ed. 1997, 36, 1315-1317.
[73] W. P. Guo, X. S. Zhao Stud. Surf. Sci. Catal. 2005, 156, 551-556.
[74] T. W. Kim, F. Kleitz, B. Paul, R. Ryoo, J. Am. Chem. Soc. 2005, 127, 7601-7610.
[75] S. H. Joo, S. J. Choi, I. Oh, J. Kwak, Z. Liu, O. Terasaki, R. Ryoo, Nature 2001, 412,
169-172.
[76] M. Kruk, M. Jaroniec, T. W. Kim, R. Ryoo, Chem. Mater. 2003, 15, 2815-2823.
[77] A. H. Lu, W. C. Li, W. Schmidt, W. Kiefer, F. Schüth, Carbon 2004, 42, 2939-2948.
[78] M. Kang, S. H. Yi, H. I. Lee, J. E. Yie, J. M. Kim, Chem. Commun. 2002, 1944-1945.
[79] N. S. Yao, C. Pinckney, S. Y. Lim, C. Pak, G. L. Haller, Microporous Mesoporous
Mater. 2001, 44, 377-384.
[80] A. Jentys, W. Schiesser, H. Vinek, Catal. Today 2000, 59, 313-321.
[81] U. Junges, W. Jacobs, I. Voigtmartin, B. Krutzsch, F. Schüth, J. Chem. Soc., Chem.
Commun. 1995, 2283-2284.
[82] C. Yang, U. Wüstefeld, M. Kalwei, F. Schüth Stud. Surf. Sci. Catal. 2004, 154, 2574-
2580.
[83] C. M. Yang, H. S. Sheu, K. J. Chao, Adv. Funct. Mater. 2002, 12, 143-148.
[84] C. M. Yang, P. H. Liu, Y. F. Ho, C. Y. Chiu, K. J. Chao, Chem. Mater. 2003, 15, 275-
280.
[85] H. Araki, A. Fukuoka, Y. Sakamoto, S. Inagaki, N. Sugimoto, Y. Fukushima, M.
Ichikawa, J. Mol. Catal. A-Chem. 2003, 199, 95-102.
[86] R. M. Rioux, H. Song, J. D. Hoefelmeyer, P. Yang, G. A. Somorjai, J. Phys. Chem. B
2005, 109, 2192-2202.
[87] M. A. Aramendia, V. Borau, C. Jimenez, J. M. Marinas, F. J. Romero, Chem. Commun.
1999, 873-874.
[88] M. Chatterjee, T. Iwasaki, Y. Onodera, T. Nagase, Catal. Lett. 1999, 61, 199-202.
116
References
[89] J. Zhu, Z. Konya, V. F. Puntes, I. Kiricsi, C. X. Miao, J. W. Ager, A. P. Alivisatos, G. A.
Somorjai, Langmuir 2003, 19, 4396-4401.
[90] K. J. Lin, L. J. Chen, M. R. Prasad, C. Y. Cheng, Adv. Mater. 2004, 16, 1845-1848.
[91] Z. Konya, V. F. Puntes, I. Kiricsi, J. Zhu, P. Alivisatos, G. A. Somorjai, Catal. Lett.
2002, 81, 137-140.
[92] T. Yamada, H. S. Zhou, D. Hiroishi, M. Tomita, Y. Ueno, K. Asai, I. Honma, Adv.
Mater. 2003, 15, 511-513.
[93] C. M. Yang, M. Kalwei, F. Schüth, K. J. Chao, Appl. Catal. A-Gen. 2003, 254, 289-296.
[94] U. Junges, F. Schüth, G. Schmid, Y. Uchida, R. Schlogl, Phys. Chem. Chem. Phys. 1997,
101, 1631-1634.
[95] A. Y. Khodakov, A. Griboval-Constant, R. Bechara, V. L. Zholobenko, J. Catal. 2002,
206, 230-241.
[96] J. Panpranot, J. G. Goodwin, A. Sayari, Catal. Today 2002, 77, 269-284.
[97] J. Panpranot, J. G. Goodwin, A. Sayari, J. Catal. 2002, 211, 530-539.
[98] J. Panpranot, J. G. Goodwin, A. Sayari, J. Catal. 2003, 213, 78-85.
[99] A. Lewandowska, S. Monteverdi, M. Bettahar, M. Ziolek, J. Mol. Catal. A-Chem. 2002,
188, 85-95.
[100] V. R. Choudhary, S. K. Jana, B. P. Kiran, J. Catal. 2000, 192, 257-261.
[101] V. R. Choudhary, S. K. Jana, J. Mol. Catal. A-Chem. 2002, 180, 267-276.
[102] J. M. Clacens, Y. Pouilloux, J. Barrault, Appl. Catal. A-Gen. 2002, 227, 181-190.
[103] A. Maldotti, A. Molinari, G. Varani, M. Lenarda, L. Storaro, F. Bigi, R. Maggi, A.
Mazzacani, G. Sartori, J. Catal. 2002, 209, 210-216.
[104] T. Ookoshi, M. Onaka, Chem. Commun. 1998, 2399-2400.
[105] F. Schüth, A. Wingen, J. Sauer, Microporous Mesoporous Mater. 2001, 44, 465-476.
[106] L. Zhang, G. C. Papaefthymiou, J. Y. Ying, J. Phys. Chem. B 2001, 105, 7414-7423.
[107] E. R. Rivera-Munos, D. Lardizabal, G. Alonso, A. Aguilar, M. H. Siadati, R. R.
Chianelli, Catal. Lett. 2003, 85, 147-151.
[108] L. Vradman, M. V. Landau, M. Herskowitz, V. Ezersky, M. Talianker, S. Nikitenko, Y.
Koltypin, A. Gedanken, J. Catal. 2003, 213, 163-175.
[109] H. Koch, W. Reschetilowski, Microporous Mesoporous Mater. 1998, 25, 127-129.
[110] A. Auroux, Top. Catal. 2002, 19, 205-213.
[111] A. Corma, M. S. Grande, V. GonzalezAlfaro, A. V. Orchilles, J. Catal. 1996, 159, 375-
382.
[112] J. P. G. Pater, P. A. Jacobs, J. A. Martens, J. Catal. 1999, 184, 262-267.
117

References
[113] X. X. Yan, C. Z. Yu, X. F. Zhou, J. W. Tang, D. Y. Zhao, Angew. Chem. Int. Ed. 2004,
43, 5980-5984.
[114] X. X. Yan, H. X. Deng, X. H. Huang, G. Q. Lu, S. Z. Qiao, D. Y. Zhao, C. Z. Yu, J.
Non-Cryst. Solids 2005, 351, 3209-3217.
[115] X. X. Yan, X. H. Huang, C. Z. Yu, H. X. Deng, Y. Wang, Z. D. Zhang, S. Z. Qiaoc, G.
Q. Lu, D. Y. Zhao, Biomaterials 2006, 27, 3396-3403.
[116] Q. H. Shi, J. F. Wang, J. P. Zhang, J. Fan, G. D. Stucky, Adv. Mater. 2006, 18, 1038-
1042.
[117] F. Hoffmann, M. Cornelius, J. Morell, M. Fröba, Angew. Chem. Int. Ed. 2006, 45,
3216-3251.
[118] T. Asefa, M. J. MacLachan, N. Coombs, G. A. Ozin, Nature 1999, 402, 867-871.
[119] S. Inagaki, S. Guan, T. Ohsuna, O. Terasaki, Nature 2002, 416, 304-307.
[120] D. J. Macquarrie, D. B. Jackson, Chem. Commun. 1997, 1781-1782.
[121] Y. Q. Wang, C. M. Yang, B. Zibrowius, B. Spliethoff, M. Linden, F. Schüth, Chem.
Mater. 2003, 15, 5029-5035.
[122] Y. Q. Wang, B. Zibrowius, C. M. Yang, B. Spliethoff, F. Schuth, Chem. Commun.
2004, 46-47.
[123] M. Raczka, G. Gorny, L. Stobierski, K. Rozniatowski, Mater. Charact. 2001, 46, 245-
249.
[124] L. Stobierski, A. Gubernat, Ceram. Int. 2003, 29, 287-292.
[125] I. A. Ibrahim, F. A. Mohamed, E. J. Lavernia, J. Mater. Sci. 1991, 26, 1137-1156.
[126] T. P. D. Rajan, R. M. Pillai, B. C. Pai, J. Mater. Sci. 1998, 33, 3491-3503.
[127] M. Mitomo, Y. W. Kim, H. Hirotsuru, J. Mater. Res. 1996, 11, 1601-1604.
[128] R. Moene, M. Makkee, J. A. Moulijn, Appl. Catal. A 1998, 167, 321-330.
[129] M. J. Ledoux, S. Hantzer, C. P. Huu, J. Guille, M. P. Desaneaux, J. Catal. 1988, 114,
176-185.
[130] C. Phamhuu, P. Delgallo, E. Peschiera, M. J. Ledoux, Appl. Catal. A 1995, 132, 77-96.
[131] M. B. Kizling, P. Stenius, S. Andersson, A. Frestad, Appl. Catal. B-Env. 1992, 1, 149-
168.
[132] M. A. Vannice, Y. L. Chao, R. M. Friedman, Appl. Catal. 1986, 20, 91-107.
[133] P. H. Cuong, S. Marin, M. J. Ledoux, M. Weibel, G. Ehret, M. Benaissa, E. Peschiera,
J. Guille, Appl. Catal. B-Env. 1994, 4, 45-63.
[134] G. Q. Jin, X. Y. Guo, Microporous Mesoporous Mater. 2003, 60, 207-212.
[135] J. Parmentier, J. Patarin, J. Dentzer, C. Vix-Guterl, Ceram. Int. 2002, 28, 1-7.
118

References
[136] Z. C. Liu, W. H. Shen, W. B. Bu, H. R. Chen, Z. L. Hua, L. X. Zhang, L. Li, J. L. Shi,
S. H. Tan, Microporous Mesoporous Mater. 2005, 82, 137-145.
[137] A. H. Lu, W. Schmidt, W. Kiefer, F. Schüth, J. Mater. Sci. 2005, 40, 5091-5093.
[138] V. G. Pol, S. V. Pol, A. Gedanken, Chem. Mater. 2005, 17, 1797-1802.
[139] C. L. Bowes, A. Malek, G. A. Ozin, Chem. Vapor Depos. 1996, 2, 97-103.
[140] E. Chomski, O. Dag, A. Kuperman, N. Coombs, G. A. Ozin, Chem. Vapor Depos.
1996, 2, 8-13.
[141] O. Dag, G. A. Ozin, H. Yang, C. Reber, G. Bussiere, Adv. Mater. 1999, 11, 474-480.
[142] I. Golecki, Mater. Sci. Eng. R-Rep. 1997, 20, 37-124.
[143] Y. F. Shi, Y. Meng, D. H. Chen, S. J. Cheng, P. Chen, T. F. Yang, Y. Wan, D. Y. Zhao,
Adv. Funct. Mater. 2006, 16, 561-567.
[144] W. Lengauer in Handbook of Ceramic Hard Materials, Vol. 1 (Ed: R. Riedel) Wiley-
VCH, Weinheim 2000, Ch. 7.
[145] W. S. Williams, JOM 1997, 49, 38-42.
[146] R. Sanjines, P. Hones, F. Levy, Thin Solid Films 1998, 332, 225-229.
[147] S. T. Oyama, Catal. Today 1992, 15, 179-200.
[148] S. Z. Li, J. S. Lee, T. Hyeon, K. S. Suslick, Appl. Catal. A: Gen. 1999, 184, 1-9.
[149] E. Furimsky, Appl. Catal. A:Gen. 2003, 240, 1-28.
[150] M. Nagai, T. Suda, K. Oshikawa, N. Hirano, S. Omi, Catal. Today 1999, 50, 29-37.
[151] H. Kwon, S. Choi, L. T. Thompson, J. Catal. 1999, 184, 236-246.
[152] S. Kaskel, K. Schlichte, G. Chaplais, M. Khanna, J. Mater. Chem. 2003, 13, 1496-1499.
[153] J. R. Groza, Nanostruct. Mater. 1999, 12, 987-992.
[154] J. R. Groza, Int. J. Powder Metall. 1999, 35, 59-66.
[155] J. A. J. Rodrigues, G. M. Cruz, G. Bugli, M. Boudart, G. DjegaMariadassou, Catal.
Lett. 1997, 45, 1-3.
[156] R. Kapoor, S. T. Oyama, J. Solid State Chem. 1995, 120, 320-326.
[157] S. T. Oyama, R. Kapoor, H. T. Oyama, D. J. Hofmann, E. Matijevic, J. Mater. Res.
1993, 8, 1450-1454.
[158] L. Volpe, S. T. Oyama, M. Boudart, Stud. Surf. Sci. Catal. 1983, 16, 147-158.
[159] M. Nagai, R. Nakauchi, Silic. Ind. 2004, 69, 61-67.
[160] C. Shi, A. M. Zhu, X. F. Yang, C. T. Au, Appl. Catal. A-Gen. 2005, 293, 83-90.
[161] F. Rouquerol, J. Rouquerol, K. Sing, Adsorption by Powders & Porous Solids,
Academic Press, San Diego, 1998.
[162] E. P. Barrett, L. G. Joyner, P. P. Halenda, J. Am. Chem. Soc. 1951, 73, 373-380.
119
References
[163] I. Langmuir, J.Am.Chem.Soc 1918, 40, 1361.
[164] S. Brunauer, P. Emmett, E. Teller, J.Am.Chem.Soc 1938, 60, 309.
[165] J. H. Deboer, B. G. Linsen, Vanderpl.T, Zonderva.Gj, J. Catal. 1965, 4, 649-&.
[166] M. Choi, W. Heo, F. Kleitz, R. Ryoo, Chem. Commun. 2003, 1340.
[167] M. Grün, I. Lauer, K. K. Unger, Adv. Mater. 1997, 9, 254.
[168] M. Grün, K. K. Unger, A. Matsumoto, K. Tsutsumi, Microporous Mesoporous Mater.
1999, 27, 207-216.
[169] P. Krawiec, Master Thesis 2002, Max-Planck Institute in Mülheim an Der Ruhr,
Germany.
[170] J. R. Guth, W. T. Petuskey, J. Phys. Chem. 1987, 91, 5361-5364.
[171] G. Roewer, U. Herzog, K. Trommer, E. Müller, S. Frühauf, Struct. Bond. 2002, 101,
60-127.
[172] H. M. Williams, E. A. Dawson, P. A. Barnes, B. Rand, R. M. D. Brydson, A. R.
Brough, J. Mater. Chem. 2002, 12, 3754-3760.
[173] V. Belot, R. J. P. Corriu, D. Leclercq, P. H. Mutin, A. Vioux, J. Non-Cryst. Solids
1992, 144, 287-297.
[174] Y. ElKortobi, J. B. E. delaCaillerie, A. P. Legrand, X. Armand, N. Herlin, M.
Cauchetier, Chem. Mater. 1997, 9, 632-639.
[175] T. Merlemejean, E. Abdelmounim, P. Quintard, J. Mol. Struct. 1995, 349, 105-108.
[176] K. Cassiers, T. Linssen, M. Mathieu, M. Benjelloun, K. Schrijnemakers, P. Van Der
Voort, P. Cool, E. F. Vansant, Chem. Mater. 2002, 14, 2317-2324.
[177] M. Kruk, M. Jaroniec, R. Ryoo, S. H. Joo, J. Phys. Chem. B 2000, 104, 7960-7968.
[178] C. Raynaud, J. Non-Cryst. Solids 2001, 280, 1-31.
[179] H. F. Yang, Y. Yan, Y. Liu, F. Q. Zhang, R. Y. Zhang, Y. Meng, M. Li, S. H. Xie, B.
Tu, D. Y. Zhao, J. Phys. Chem. B 2004, 108, 17320.
[180] L. A. Solovyov, T. W. Kim, F. Kleitz, O. Terasaki, R. Ryoo, Chem. Mater. 2004, 16,
2274.
[181] S. N. Che, K. Lund, T. Tatsumi, S. Iijima, S. H. Joo, R. Ryoo, O. Terasaki, Angew.
Chem.Int. Ed. 2003, 42, 2182.
[182] F. Kleitz, W. Schmidt, F. Schüth, Microporous Mesoporous Mater. 2003, 65, 1-29.
[183] M. T. J. Keene, R. D. M. Gougeon, R. Denoyel, R. K. Harris, J. Rouquerol, P. L.
Llewellyn, J. Mater. Chem. 1999, 9, 2843-2850.
[184] A. Montes, E. Cosenza, G. Giannetto, E. Urquieta, R. A. de Melo, N. S. Gnep, M.
Guisnet, Stud. Surf. Sci. Catal. 1998, 117, 237.
120

References
[185] V. Fornes, C. Lopez, H. H. Lopez, A. Martinez, Appl. Catal. A: Gen. 2003, 249, 345-
354.
[186] S. Shylesh, A. P. Singh, J. Catal. 2004, 228, 333-346.
[187] J. George, S. Shylesh, A. P. Singh, Appl. Catal. A: Gen. 2005, 290, 148-158.
[188] L. Abis, D. B. Dell' Amico, C. Busetto, F. Calderazzo, R. Caminiti, C. Ciofi, F.
Garbassi, G. Masciarelli, J. Mater. Chem. 1998, 8, 751-759.
[189] K. M. Reddy, I. Moudrakovski, A. Sayari, J. Chem. Soc.,Chem. Commun. 1994, 1059-
1060.
[190] J. S. Reddy, P. Liu, A. Sayari, Appl. Catal. A: Gen. 1996, 148, 7-21.
[191] K. J. Chao, C. N. Wu, H. Chang, L. J. Lee, S. F. Hu, J. Phys. Chem. B 1997, 101, 6341-
6349.
[192] J. Patarin, Angew. Chem. Int. Ed. 2004, 43, 3878-3880.
[193] Z. Huang, L. Huang, S. C. Shen, C. C. Poh, K. Hidajat, S. Kawi, S. C. Ng, Microporous
Mesoporous Mater. 2005, 80, 157-163.
[194] W. A. Gornes, L. A. M. Cardoso, A. R. E. Gonzaga, L. G. Aguiar, H. M. C. Andrade,
Mater. Chem. Phys. 2005, 93, 133-137.
[195] A. N. Parikh, A. Navrotsky, Q. H. Li, C. K. Yee, M. L. Amweg, A. Corma,
Microporous Mesoporous Mater. 2004, 76, 17-22.
[196] F. Kleitz, W. Schmidt, F. Schüth, Microporous Mesoporous Mater. 2001, 44, 95-109.
[197] T. Asefa, M. Kruk, N. Coombs, H. Grondey, M. J. MacLachlan, M. Jaroniec, G. A.
Ozin, J. Am. Chem. Soc. 2003, 125, 11662-11673.
[198] O. Merdrignac-Conanec, K. El Badraoui, P. L'Haridon, J. Solid State Chem. 2005, 178,
218-223.
[199] F. Solymosi, R. Nemeth, L. Ovari, L. Egri, J. Catal. 2000, 195, 316-325.
[200] G. T. Chandrappa, N. Steunou, J. Livage, Nature 2002, 416, 702.
[201] B. Alonso, J. Livage, J. Solid State Chem. 1999, 148, 16-19.
[202] STOE Size/Strain analysis software with implemented Scherrer equation (WinXPOW)
v.1.06 1999
[203] J. Mendialdua, R. Casanova, Y. Barbaux, J. Electron Spectrosc. Relat. Phenom. 1995,
71, 249-261.
[204] P. S. Herle, M. S. Hegde, N. Y. Vasathacharya, S. Philip, J. Solid State Chem. 1997,
134, 120-127.
[205] J. G. Choi, Appl. Surf. Sci. 1999, 148, 64-72.
[206] W. T. Xu, T. Fujimoto, B. Q. Li, I. Kojima, Appl. Surf. Sci. 2001, 175, 456-461.
121

References
[207] Y. J. Zhang, Q. Xin, I. Rodriguez-Ramos, A. Guerrero-Ruiz, Appl. Catal. A:Gen. 1999,
180, 237-245.
[208] A. H. Adams, F. Haass, T. Buhrmester, J. Kunert, J. Ott, H. Vogel, H. Fuess, J. Mol.
Catal. A-Chem. 2004, 216, 67-74.
[209] M. I. Shukoor, H. A. Therese, L. Gorgishvili, G. Glasser, U. Kolb, W. Tremel, Chem.
Mater. 2006, 18, 2144-2151.
[210] I. M. Arabatzis, P. Falaras, Nano Lett. 2003, 3, 249-251.
122

Publications:
1. Krawiec P., Weidenthaler C. Kaskel S. “SiC/MCM-48 and SiC/SBA-15 nanocomposites” Chemistry of Materials 2004, 16, 2869-2880 DOI: 10.1021/cm034737+
2. Krawiec P., DeCola P.L. Glaser R., Weitkamp J., Weidenthaler C., Kaskel S. “Oxide foams for the synthesis of high surface area vanadium nitride catalysts” Advanced Materials 2006, 18, 505-509 DOI: 10.1002/adma.200500278
3. Krawiec P., Kramer M., Sabo M., Kunschke R., Fröde H., Kaskel S. „Improved hydrogen storage in the metal-organic framework Cu3(BTC)2” Advanced Engineering Materials 2006, 8, 293-296 DOI: 10.1002/adem.200500223
4. Krawiec P., Kockrick E., Simon P, Auffermann G. Kaskel S.
„Platinum-catalyzed template removal for the in-situ preparation of MCM-41 supported catalysts”
Chemistry of Materials 2006, 18, 2663-2669 DOI: 10.1021/cm052830n
5. Krawiec P., Geiger D, Kaskel S. „Ordered mesoporous silicon carbide (OM-SiC) via polymer precursor nanocasting” Chemical Communications 2006, 23, 2469-2470
DOI: 10.1039/b603284b 6. Krawiec P., Kaskel S. „Thermal stability of high surface area silicon carbide materials” Journal of Solid State Chemistry 2006, 179, 2281-2289 DOI:10.1016/j.jssc.2006.02.034
123
Conference contributions:
2004.03 - oral 16th German zeolite conference, Dresden, Germany “High surface area SiC via infiltration of ordered mesoporous silica”
2005.03 - poster 17th German zeolite conference, Giessen, Germany “Oxide foams for the preparation of high surface area vanadium
nitride”
2005.09 - oral + poster Workshop on advanced materials (WAM III), Stellenbosch, South Africa “Oxide foams for the preparation of high surface area vanadium nitride catalysts”
2005.05 - oral Mitteldeutsches Anorganisches Nachwuchs Symposium MANS III, Leipzig, Germany
„Efficient one step synthesis of Pt/MCM-41 materials“
2006.03 - poster 18th Zeolite conference, Hannover, Germany „Platinum-catalysed template removal for the in-situ synthesis of MCM-41 supported catalysts“
2006.03 - poster XXXVIII Polish catalysis conference Kraków, Poland “Preparation of highly ordered mesoporous silicon carbide materials – a new high temperature stable catalyst support”
2006.06 - oral Solid state chemistry seminar, Hirschegg, Germany “High surface area nanostructured ceramics for catalytic applications”
2006.09 - oral European Materials Research Society (E-MRS) meeting, Warsaw,
Poland “Highly ordered mesoporous silicon carbide materials – a new high temperature stable catalyst support”
124
CURRICULUM VITAE
Personal Details:
Name: Piotr Krawiec Date of Birth: 18th May 1978 Nationality: Polish Address in Poland: 22-400 Zamość ul.Wiejska 10 Address in Germany: 01219 Dresden Kreischaer str.12 Telephone: +48602680776 E-mail: [email protected] Family status: Single
Languages:
English fluent German medium Russian basic Polish native language
University Education:
1997 - 2002 University of Mining and Metallurgy in Cracow (AGH) : Poland – Faculty of Materials Science and Ceramics with a specialisation of Materials Science (graduated 2002 with the excellent degree of 6 – M.Sc.Eng.)
2000 University of Ghent : Belgium – Department of Electronics and Information Systems (one semester on Socrates scholarship)
2001 - 2002 University of Applied Sciences Münster : Germany – Master of Science studies in Chemical Engineering Faculty (graduated 2002 with honours - final note Excellent 1.0 – M.Sc.)
M.Sc. / PhD work carried at:
M.Sc. (2002) Max-Planck-Institut für Kohlenforschung in Mülheim an der Ruhr : Germany – “Synthesis and Infiltration of Mesoporous Silica Materials with Silicon Carbide”
PhD (2003 – 2006) Max-Planck-Institut für Kohlenforschung in Mülheim an der
Ruhr : Germany (01.2003-04.2004) “Nanostructured Porous High Surface Area Ceramics for Catalytic Applications”
Technical University of Dresden : Germany (05.2004-07.2006) – after moving with the whole group to Dresden, continuation of the PhD work and assistant in the courses of the inorganic chemistry
125

Practical training / internship:
2000 University of Bristol : U.K. – Department of Physics (two months working in polymer physics group - using the maximum entropy method to interpret Small Angle X-Ray Diffraction Images of Polyethylene and Polyurethane)
2001 Colorobbia S.A. : Spain – two months of training in the field of production, creation and development of frits, glazes, pigments and other raw materials for ceramic industry.
Teaching experience (at TU-Dresden):
2004 Inorganic Chemistry Laboratory and Seminars for 1st semester students
2004-2006 Advanced Inorganic Chemistry Laboratory for 6th semester
students (Porous Materials Synthesis and Characterization)
2005-2006 Advanced Inorganic Chemistry Laboratory for 8th semester students (Porous Materials Synthesis and Characterization)
Awards and Scholarships: 1998 - 2001 Rector’s Award (AGH): each year for the best students on the
year in the materials science and ceramics faculty (adequately 7th, 2nd, 2nd, and 1st)
1998 - 2002 University Scholarship (AGH): each year for good results
during studies 2000 Staszic Bronze Award (AGH): for outstanding student of AGH
university 2003 FH-Münster Award: for the best master thesis in the chemical
engineering faculty in 2002 2002 - 2004 Max Planck Fellowship: financial support for the PhD studies
in MPI für Kohlenforschung
126
Versicherung
Hiermit versichere ich, dass ich die vorliegende Arbeit ohne unzulässige Hilfe Dritter und ohne
Benutzung anderer als der angegebenen Hilfsmittel angefertigt habe; die aus fremden Quellen
direkt oder indirekt übernommenen Gedanken sind als solche kenntlich gemacht. Die Arbeit
wurde bisher weder im Inland noch im Ausland in gleicher oder ähnlicher Form einer anderen
Prüfungsbehörde vorgelegt.
Erklärung
Die vorliegende Arbeit wurde am Max-Planck Institut für Kohlenforschung in Mülheim an der
Ruhr und am Institut für Anorganische Chemie der Technischen Universität Dresden unter
wissenschaftlichen Betreung von Herrn Prof. Dr. Stefan Kaskel im Zeitraum von Dezember
2002 bis Mai 2006 angefertigt.
Es haben keine früheren erfolglosen Promotionsverfahren stattgefunden.
Hiermit erkenne ich die Promotionsordnung der Fakultät Mathematik und Naturwissenschaften
der Technischen Universität Dresden vom 17. April 2003 an.
Dresden, den 1.08.2006 Piotr Krawiec
127


![Synthesis of CuO nanoparticles for catalytic … 35 06.pdfProcessing and Applicationof Ceramics 11 [1] (2017)39–44 DOI: 10.2298/PAC1701039Y Synthesis of CuO nanoparticles for catalytic](https://static.fdocuments.in/doc/165x107/5e94d01ffcf72854d647ed4f/synthesis-of-cuo-nanoparticles-for-catalytic-35-06pdf-processing-and-applicationof.jpg)