Nanostructure Development and Foam Processing in Polymer ...
44
6 Nanostructure Development and Foam Processing in Polymer/Layered Silicate Nanocomposites M. Okamoto CONTENTS 6.1 Introduction .................................................................................... 176 6.2 Nanostructure Development ...................................................... 177 6.2.1 Melt Intercalation ................................................................. 177 6.2.2 Interlayer Structure of OMLFs and Intercalation .......... 177 6.2.2.1 Nanofillers .............................................................. 177 6.2.2.2 Molecular Dimensions and Interlayer Structure ............................................... 178 6.2.2.3 Correlation of Intercalant Structure and Interlayer Opening ........................................ 182 6.2.2.4 Nanocomposite Structure ..................................... 183 6.3 Flow-Induced Structure Development ...................................... 188 6.3.1 Elongational Flow and Strain-Induced Hardening ....... 188 6.4 Foam Processing ........................................................................... 190 6.4.1 Foam Processing of PP-Based Nanocomposites ............ 190 6.4.2 In-Situ Observation of Foaming ....................................... 196 6.4.3 PLA-Based Nanocomposite Foaming ............................. 200 6.4.4 Foaming Temperature Dependence of Cellular Structure ............................................................... 201 6.4.5 CO 2 Pressure Dependence ................................................ 204 6.4.6 TEM Observation ............................................................... 208 6.4.7 Polycarbonate (PC)-Based Nanocomposite Foams ........ 209 61259_C006.indd 175 61259_C006.indd 175 7/28/2008 11:30:51 AM 7/28/2008 11:30:51 AM
Transcript of Nanostructure Development and Foam Processing in Polymer ...
6Nanostructure Development and Foam Processing in Polymer/Layered Silicate Nanocomposites
M. Okamoto
CONTENTS
6.1 Introduction .................................................................................... 1766.2 Nanostructure Development ...................................................... 177
6.2.1 Melt Intercalation ................................................................. 1776.2.2 Interlayer Structure of OMLFs and Intercalation .......... 177
6.2.2.1 Nanofi llers .............................................................. 1776.2.2.2 Molecular Dimensions and
Interlayer Structure ............................................... 1786.2.2.3 Correlation of Intercalant Structure
and Interlayer Opening ........................................ 1826.2.2.4 Nanocomposite Structure ..................................... 183
6.3 Flow-Induced Structure Development ...................................... 1886.3.1 Elongational Flow and Strain-Induced Hardening ....... 188
6.4 Foam Processing ........................................................................... 1906.4.1 Foam Processing of PP-Based Nanocomposites ............ 1906.4.2 In-Situ Observation of Foaming ....................................... 1966.4.3 PLA-Based Nanocomposite Foaming ............................. 2006.4.4 Foaming Temperature Dependence of
Cellular Structure ............................................................... 2016.4.5 CO2 Pressure Dependence ................................................ 2046.4.6 TEM Observation ............................................................... 2086.4.7 Polycarbonate (PC)-Based Nanocomposite Foams ........ 209
61259_C006.indd 17561259_C006.indd 175 7/28/2008 11:30:51 AM7/28/2008 11:30:51 AM

6.4.8 Mechanical Properties of Nanocomposite Foams ............ 2116.4.9 Porous Ceramic Materials Via Nanocomposite ................ 214
6.5 Conclusions and Future Prospects .............................................. 215References ................................................................................................ 216
6.1 Introduction
A decade of research has shown that nanostructured materials have the potential to signifi cantly impact growth at every level of the world econ-omy in the twenty-fi rst century. This new class of materials is now being introduced in structural applications including gas barrier fi lms, fl ame retardant products, and other load-bearing applications.
Of particular interest are recently developed nanocomposites consisting of a polymer and layered silicate, which often exhibit remarkably improved properties1 when compared with polymer or conventional composites (both micro- and macro-composites). In polymer/layered silicate nano-composites, a nylon 6/layered silicate hybrid2 reported by Toyota Central Research & Development Co. Inc. (TCRD) was successfully prepared by in-situ polymerization of ε-caprolactam in a dispersion of montomorril-lonite (MMT). The silicate can be dispersed in liquid monomer or a solution of monomer. It has also been possible to melt-mix polymers with layered silicates, avoiding the use of organic solvents. This method permits the use of conventional processing techniques such as injection molding and extrusion. The extensive literature on nanocomposite research are covered in recent reviews.1,3,4
Continued progress in nanoscale controlling, as well as an improved understanding of the physico-chemical phenomena at the nanometer scale, have contributed to the rapid development of novel nanocomposites. This chapter presents current research on polymer/layered silicate nano-composites (PLSNCs) with the primary focus on nanostructure development and foam processing operations.
Development of nanocomposite foams is one of the latest evolutionary technologies of the polymeric foam following a pioneering effort by Okamoto and his colleagues.5,6 They prepared polypropylene (PP)/layered silicate, poly(l-lactide) (PLA)/layered silicate and polycarbonate (PC)/lay-ered silicate nanocomposites foams in a batch process using supercritical CO2 as a physical foaming agent.6–8
To innovate on the material properties of nanocomposite foams, one needs to pin down the morphological correlation between the dispersed silicate particles with nanometer dimensions in the bulk and the formed closed-cellular structure after foaming. This chapter is devoted to the study of evaluation of the performance potential of PLSNCs in foam application.
176 Polymeric Foams
61259_C006.indd 17661259_C006.indd 176 7/28/2008 11:30:51 AM7/28/2008 11:30:51 AM

6.2 Nanostructure Development
6.2.1 Melt Intercalation
Since the possibility of direct melt intercalation was fi rst demonstrated,9 melt intercalation has become a preparation of the intercalated polymer/layered silicate nanocomposites (PLSNCs). This process involves annealing, stati-cally or under shear, a mixture of the polymer and organically modifi ed layered fi llers (OMLFs) above the softening point of the polymer. During annealing, the polymer chains diffuse from the bulk polymer melt into the nanogalleries between the layered fi llers.
In order to understand the thermodynamic issue associated with the nanocomposite formation, Vaia et al. have applied a mean-fi eld statistical lattice model and found conclusions based on the mean fi eld theory agreed with the experimental results.10,11 The entropy loss associated with con-fi nement of a polymer melt is not prohibited to nanocomposite formation because an entropy gain associated with the layer separation balances the entropy loss of polymer intercalation, resulting in a net entropy change near to zero. Thus, from the theoretical model, the outcome of nanocom-posite formation via polymer melt intercalation depends on energetic factors, which may be determined from the surface energies of the poly-mer and OMLF.
Nevertheless, we have often faced the problem where the nanocompos-ite shows fi ne and homogeneous distribution of the nanoparticles in the polymer matrix (e.g. poly(l-lactide)) without a clear peak shift of the mean interlayer spacing of the (001) plane, as revealed by wide-angle X-ray dif-fraction (WAXD) analysis.12 Furthermore we sometimes encounter a decrease in interlayer spacing compared with that of pristine OMLF, despite very fi ne dispersion of the silicate particles. For this reason, infor-mation on the structure of the surfactant (intercalant)–polymer interface is necessary to understand the intercalation kinetics that can predict fi nal nanocomposite morphology and overall material properties.
6.2.2 Interlayer Structure of OMLFs and Intercalation
6.2.2.1 Nanofi llers
In characterizing layered silicate, including layered titanate (HTO), the surface charge density is particularly important because it determines the interlayer structure of intercalants as well as cation exchange capacity (CEC). Lagaly proposed a method consisting of total elemental analysis and the dimension of the unit cell:13
surface charge: e� ____
nm2 �
� __
ab (6.1)
Nanostructure Development and Foam Processing 177
61259_C006.indd 17761259_C006.indd 177 7/28/2008 11:30:51 AM7/28/2008 11:30:51 AM

where � is the layer charge (1.07 for HTO, 0.66 for synthetic fl uorine hectrite (syn-FH), and 0.33 for montmorillonite (MMT); a and b are cell parameters of HTO (a � 3.782 Å, b � 2.978 Å),14 syn-FH (a � 5.24 Å, b � 9.08 Å),15 and MMT (a � 5.18 Å, b � 9.00 Å)).16 For syn-FH, however, about 30% of the interlayer Na� ions are not replaced quantitatively by intercalants due to the non-activity for ion-exchange reactions.15 For HTO, only 27% of interlayer H� (H3O
�) is active for ion-exchange reactions.12 The remaining part is the non-active site in the HTO. Thus the incomplete replacement of the interlayer ions is ascribed to the intrinsic chemical reactivity. The characteristic parameters of three nanofi llers are summa-rized in Table 6.1.16 HTO has a high surface charge density of 1.26 e�/nm2 compared with those of syn-FH (0.971 e�/nm2) and MMT (0.780 e�/nm2). From these results, we can estimate the average distance between exchange sites, which is calculated to be 0.888 nm for HTO, 1.014 nm for syn-FH, and 1.188 nm for MMT. This estimation assumes that the cations are evenly distributed in a cubic array over the silicate surface and that half of the cations are located on one side of the platelet and the other half reside on the other side.
6.2.2.2 Molecular Dimensions and Interlayer Structure
The calculated models of the intercalant structures are presented in Figure 6.1. For octadecylammonium (C18H3N
�), obtained molecular length, thickness, and width are 2.466 nm, 0.301 nm, and 0.301 nm, respectively. Since the length of all alkyl units are more than 2 nm, these spacings (distance between exchange sites) of 0.888–1.188 nm do not allow parallel
TABLE 6.1
Characteristic Parameters of Nanofi llers
Parameters HTO syn-FH MMT
Chemical formula H1.07Ti1.73O3.95·0.5H2O Na0.66Mg2.6Si4O10(F)2 Na0.33(Al1.67Mg0.33)
Si4O10(OH)2
Particle size (nm) ~100–200 ~100–200 ~100–200
BET area (m2/g) ~2400 ~800 ~700
CECa (meq/100 g) ~200 (660) ~120 (170) ~90(90)
e� (charge/nm2) 1.26 0.971 0.708
Density (g/cm3) 2.40 2.50 2.50
Refractive index
(n20D)
2.3 1.55 1.55
pH 4–6 9–11 7.5–10
a Methylene blue adsorption method. The values in the parenthesis are calculated from
chemical formula of nanofi llers.
Source: From Yoshida, O. and Okamoto, M. Macromolecular Rapid Communications 27 (2006):
751. © 2006 Wiley-VCH. With permission.
Q12
Q13
Q14
178 Polymeric Foams
61259_C006.indd 17861259_C006.indd 178 7/28/2008 11:30:52 AM7/28/2008 11:30:52 AM

Intercalant C18H3N+ C18(CH3)3N+ 2C18(CH3)2N+ qC14(OH)
Length /nm 2.466 2.601 4.766 2.090
Thickness /nm 0.301 0.372 0.434 0.374
Width /nm 0.301 0.372 0.318 0.881
(a) Octadecyl ammonium [C18H3N+]
(b) Octadecyl trimethyl ammonium [C18(CH3)3N+]
(c) Dioctadecyl dimethyl ammonium [2C18(CH3)2N+]
(d) N-(coco alkyl)-N,N-[bis(2-hydroxyethyl)]-N-methyl ammonium [qC14(OH)]
FIGURE 6.1 Molecular dimensions of intercalans: (a) octadecylammonium (C18H3N�); (b)
octadecyltrimethylammonium (C18(CH3)3N�); (c) dioctadecyldimethylammonium (2C18(CH3)2
N�); and (d) N-(cocoalkyl)-N,N-[bis(2-hydroxyethyl)]-N-methyl ammonium cations (qC14(OH)).
(From: Yoshida, O. and Okamoto, M. Macromolecular Rapid Communications 27 (2006): 751.
© 2006 Wiley-VCH.)
layer arrangement like fl at-lying chains13 in each gallery space of the nano-fi llers. All of the intercalants are oriented with some inclination to the host layer in the interlayer space to form an interdigitated layer. This is suggested by the paraffi n-type layer structure proposed by Lagaly, espe-cially in the case of highly surface-charged clay minerals.13
Q7
Nanostructure Development and Foam Processing 179
61259_C006.indd 17961259_C006.indd 179 7/28/2008 11:30:52 AM7/28/2008 11:30:52 AM

Wide-angle X-ray diffraction (WAXD) patterns for three OMLF pow-ders are presented in Figure 6.2. The mean interlayer spacing of the (001) plane (d(001)) for the HTO intercalated with qC14(OH) (HTO-qC14(OH)) obtained by WAXD measurements is 2.264 nm (diffraction angle, 2Q � 3.90°). The appearances of small peaks observed at 2Q � 7.78°, 11.78° and 15.74° confi rmed that these refl ections were due to (002) up to (004) plane of HTO-qC14(OH). HTO-qC14(OH) showed a surprisingly well-ordered suprastructure, as demonstrated by WAXD with diffraction maxima up to the fourth order, due to the high surface charge density of the HTO layers. On the other hand, syn-FH and MMT, which have low surface charge density compared with that of HTO, show a less-ordered interlayer structure; that is, the coherent order of the silicate layers is much lower in each syn-FH and MMT intercalated with surfactants.
0
2000
4000
6000
8000
0
2000
4000
6000
00 5 10 15 20
2000
4000
6000
2Theta/degrees
Inte
nsity
/a.u
.
d = 2.264 nm
(001)
d = 1.135 nm
mm m
d = 0.751 nmd = 0.563 nm
d = 2.063 nm
(001)
d = 1.027 nm
(002)
d = 1.855 nm
(001)
HTO-qC14(OH)
syn-FHqC14(OH)
MMT-qC14(OH)
d = 0.930 nm
(002)
FIGURE 6.2 WAXD patterns of HTO, syn-FH, and MMT intercalated with qC14(OH)+.
(From: Yoshida, O. and Okamoto, M. Macromolecular Rapid Communications 27 (2006): 751.
© 2006 Wiley-VCH.) Q8,Q9
180 Polymeric Foams
61259_C006.indd 18061259_C006.indd 180 7/28/2008 11:30:52 AM7/28/2008 11:30:52 AM

From WAXD results, we can discuss the interlayer opening that is esti-mated after subtraction of the layer thickness value of 0.374 nm for HTO,14 0.98 nm for syn-FH15 and 0.96 nm for MMT.13 This is an important point for the following discussion of the interlayer structure. The illustration of a model of interlayer structure of the qC14(OH) in the gallery space of the HTO is shown in Figure 6.3. For nanofi llers with high surface charge density, the intercalants can adopt a confi guration with orientation where the alkyl chains are tilted under the effect of van der Waals forces, which decreases the chain–chain distance. For this reason, the angle α should be directly related to the packing density of the alkyl chains. The value of α decreases until close contact between the chains is attained, giving an increase in the degree of the crystallinity of the intercalants in the nano-galleries. To estimate the tilt angle α, we combined the molecular dimen-sion, interlayer spacing, and loading amount of intercalant in the layers, which was calculated from thermogravimetry analysis (TGA). The char-acteristic parameters are summarized in Tables 6.2 and 6.3. Note that HTO exhibits a large layer opening accompanied with large values of α and endothermic heat fl ow (�H) owing to the melting of the intercalants in the galleries when compared with those of syn-FH and MMT. This indicates that HTO leads to a highly interdigitated layer structure and the interlayer
0.888 nm
(0.794 nm2/charge)
Ti-O
Ti-O
1.889 nm
HTO-qC14(OH)
CH3N+
OH
CH3N+
OH
CH3 N+
HO
CH3 N+
HOα
FIGURE 6.3 Illustration of a model of interlayer structure of intercalant N-(cocoalkyl)-
N,N-[bis(2-hydroxyethyl)]-N-methyl ammonium cation (qC14(OH)) in gallery space of layer
titanate (HTO). The average distance between exchange sites is 0.888 nm, calculated by sur-
face charge density of 1.26 e�/nm2. For qC14(OH), obtained molecular length, thickness and
width are 2.09 nm, 0.881 nm, and 0.374 nm, respectively (see Figure 6.1). The tilt angle � of
the intercalants can be estimated by the combination of the interlayer spacing, molecular
dimensions, and loading amount of intercalants when the alkyl chains adopt an all-trans
conformation. (From: Yoshida, O. and Okamoto, M. Macromolecular Rapid Communications
27 (2006): 751. © 2006 Wiley-VCH.) Q10
Nanostructure Development and Foam Processing 181
61259_C006.indd 18161259_C006.indd 181 7/28/2008 11:30:52 AM7/28/2008 11:30:52 AM

opening becomes more uniform compared with MMT and syn-FH (possessing lower surface charge density).
From this fact, we can observe well-defi ned diffraction peaks up to the (004) plane (see Figure 6.2). The entropic contribution of the intercalants, which leads to the entropy gain associated with the layer expansion after intercalation of the polymer chains, may not be signifi cant because of the interdigitated layer structure.
6.2.2.3 Correlation of Intercalant Structure and Interlayer Opening
For the interdigitated layer structure in MMT, alkyl chain length (i.e. C18H37, CH3 and (CH2)2OH in the amine structure) changes the interlayer opening. That is, when we compare different intercalants having the same long alkyl chain (i.e. C18H3N
� and C18(CH3)3N�)), three methyl (CH3) sub-
stituents instead of hydrogen (H) disturb the contact with silicate surfaces. The value of α decreases until close contact between the ammonium cations
TABLE 6.2
Comparison of Characteristic Parameters Between HTO, syn-FH, and MMT Prepared with qC14(OH)
HTO-qC14(OH) syn-FH-qC14(OH) MMT-qC14(OH)
Layer opening (nm) 1.889 1.083 0.895
Tilt angle � (°) 64.4 31.1 25.3
Organic content (wt%) 39.6 30.4 32.5
Tma (°C) 108.3 111.3 97.7
�Ha (J/g) 214.5 141.2 138.6
a The melting and heat fl ow of qC14(OH)�Cl� are 35.8°C and 69.8 J/g, respectively.
Source: From Yoshida, O. and Okamoto, M. Macromolecular Rapid Communications 27 (2006):
751. © 2006 Wiley-VCH. With permission.
TABLE 6.3
Comparison of Characteristic Parameters MMT-Based OMLF Prepared with C18H3N�, C18(CH3)3N�, and 2C18(CH3)2N�
C18H3N� C18(CH3)3N
� 2C18(CH3)2N�
Layer opening (nm) 1.350 1.011 1.540
Tilt angle � (°) 33.2 22.9 40.1
Organic content (wt%) 35.5 29.5 39.8
Tma (°C) 69.9 69.5 44.0
�Ha (J/g) 177.7 189.6 129.7
a The melting and heat fl ow of C18H3N�, C18(CH3)3N
�, and 2C18(CH3)2N� are 83.8°C and
95.6 J/g; 103.5°C and 161.2 J/g; and 37.0°C and 54.6 J/g, respectively.
Source: From Yoshida, O. and Okamoto, M. Macromolecular Rapid Communications 27 (2006):
751. © 2006 Wiley-VCH. With permission.
182 Polymeric Foams
61259_C006.indd 18261259_C006.indd 182 7/28/2008 11:30:52 AM7/28/2008 11:30:52 AM

and silicate surfaces is attained, giving a decrease in the interlayer open-ing (� d(001)) (see Table 6.3 and Figure 6.2).
In cases where the intercalant has two long alkyl chains (i.e. 2C18(CH3)2N�),
the packing density of the alkyl chains is reduced and sterically limited in the nanogalleries. Consequently, MMT-2C18(CH3)2N
� exhibits large inter-layer opening accompanied by low crystallinity of the intercalant (�H ~ 130 J/g) compared with MMT-C18H3N
� and MMT-C18(CH3)3N�. Accordingly,
we observe a disordered diffraction peak of (001) plane of MMT-2C18(CH3)2N
� in the WAXD analysis (see fi gure 1 in Reference 17). We have to pay attention to the molecular size of the substituents instead of H attached to the nitrogen for the better understanding of the interdigitated layer structure and direct polymer melt intercalation. This feature has been observed in the results of OMLFs intercalated with various intercal-ants (such as octadecyl di-methylbenzylammonium, n-hexadecyl tri-n-butyl phosphonium, n-hexadecyl tri-phenyl phosphonium cations).18
6.2.2.4 Nanocomposite Structure
Figure 6.4 shows the results of TEM bright fi eld images of PLA-based nanocomposites, in which dark entities are the cross-section of interca-lated MMT layers. The organically modifi ed MMT content in all nano-composites was 4 weight-percentage. From the TEM images, it becomes clear that there are some intercalated and stacked silicate layers in the nanocomposites. Yoshida et al. estimated the form factors obtained from TEM images; that is, average value of the particle length (L), of the dis-persed particles, and the correlation length (�) between them.19 From the WAXD patterns, the crystallite size (D) of intercalated stacked silicate layers of each nanocomposite was calculated using the Scherrer equation. The calculated value of D (�thickness of the dispersed particles) and other parameters for each nanocomposite are presented in Table 6.4.
For PLA/MMT-C18(CH3)3N�, L and D are in the range 200 ± 25 nm and
10.7 nm. On the other hand, PLA/MMT-C18H3N� exhibits a large value of
L (450 ± 200 nm) with a large level of stacking of the silicate layers (D~ 21 nm). The � value of the PLA/MMT-C18(CH3)3N
� (80 ± 20 nm) is lower than the value of PLA/MMT-C18H3N
� (260 ± 140 nm), suggesting that the interca-lated layers are more homogeneously and fi nely dispersed in the case of PLA/MMT-C18(CH3)3N
�. The number of the stacked individual silicate layers (�D/d(001) � 1) is 5 for PLA/MMT-C18(CH3)3N
� and � value of this nanocomposite is one order of magnitude lower compared with those of PLA/MMT-C18H3N
� and PLA/MMT-2C18(CH3)2N�, suggesting that inter-
calated silicate layers are more homogeneously and fi nely dispersed.Although the (initial) interlayer opening of MMT-C18(CH3)3N
� at 1.011 nm is smaller than MMT-C18H3N
� at 1.350 nm and MMT-2C18(CH3)2N� at
1.540 nm, the intercalation of the PLA in these different OMLFs gives almost the same basal spacing after preparation of the nanocomposites. Note that the existence of a sharp Bragg peak in PLA-based nanocomposites
Nanostructure Development and Foam Processing 183
61259_C006.indd 18361259_C006.indd 183 7/28/2008 11:30:52 AM7/28/2008 11:30:52 AM

500 nm
500 nm
(a)
(b)
(c)
300 nm
FIGURE 6.4 Bright fi led TEM images of PLA-based nanocomposites prepared with:
(a) MMT-C18H3N+; (b) MMT-C18(CH3)3N
+; and (c) MMT-2C18(CH3)2N+. The dark entities are
the cross-section and/or face of intercalated-and-stacked silicate layers and the bright areas
are the matrix. (From: Yoshida, O. and Okamoto, M. Macromolecular Rapid Communications
27 (2006): 751. © 2006 Wiley-VCH.) Q11
184 Polymeric Foams
61259_C006.indd 18461259_C006.indd 184 7/28/2008 11:30:53 AM7/28/2008 11:30:53 AM

after melt extrusion clearly indicates that the dispersed silicate layers still retain an ordered structure after melt extrusion.
In Table 6.4 they summarized the layer expansion after preparation (�� opening) of three nanocomposites, or after subtraction of the initial layer opening. For the same MMT with different intercalants (e.g. comparison between MMT-C18(CH3)3N
� and MMT-2C18(CH3)2N�), the layer expansion
of the former (0.879 nm) exhibits a large value compared with that of the latter (0.45 nm) in PLA-based nanocomposites. In other words, the smaller interlayer opening caused by the confi guration with a small tilt angle (� � 22.9° for C18(CH3)3N
�) promotes a large amount of intercalation of the polymer chains. Accordingly, PLA/MMT-C18(CH3)3N
� exhibits fi ner dis-persion of the nanofi llers compared with PLA/MMT-2C18(CH3)2N
� and PLA/MMT-C18H3N
� as discussed previously (see Figure 6.4).A more interesting feature is the absolute value of � opening. According
to the molecular modeling, the width and thickness of the PLA are 0.76 nm and 0.58 nm (see Figure 6.5). This may suggest that the polymer chains could not penetrate into galleries in the case of MMT-2C18(CH3)2N
� when we compare the apparent interlayer expansion (�� opening).
Now it is necessary to understand the meaning of the interlayer expan-sion in the intercalated nanocomposites. As discussed previously, we have to take the interdigitated layer structure into consideration. This structure may suggest that a different orientation angle could be adopted when the polymer chains penetrate into the galleries, giving a decrease in basal spacing after intercalation. At the same time, this structure apparently provides a balance between the polymer penetration and different orien-tation angle of the intercalants; that is, we have to pay attention to the polymer chain intercalation into the galleries from the result of the change of the basal spacing as revealed by WAXD. Presumably the penetration of the polymer chain is prevented or reduced by the steric limitation of the
TABLE 6.4
Form Factors of Three Nanocomposites Obtained from WAXD and TEM Observations
Nano-composites
PLA/MMT-
C18H3N�
PLA/MMT-
C18(CH3)3N�
PLA/MMT-
2C18(CH3)2N�
d001 (nm) 3.03 2.85 2.95
� opening (nm) 0.72 0.879 0.45
Final layer opening (nm) 2.07 1.89 1.99
D (nm) 20.9 10.73 14.71
(D/d001) � 1 7.9 4.8 6.0
L (nm) 450 ± 200 200 ± 25 655 ± 121
� (nm) 260 ± 140 80 ± 20 300 ± 52
Source: From Yoshida, O. and Okamoto, M. Macromolecular Rapid Communications 27 (2006):
751. © 2006 Wiley-VCH. With permission.
Nanostructure Development and Foam Processing 185
61259_C006.indd 18561259_C006.indd 185 7/28/2008 11:30:53 AM7/28/2008 11:30:53 AM

confi guration with a large value of � (e.g. � � 40.1° for MMT-2C18(CH3)2N�).
Accordingly, we sometimes observe small interlayer expansion and encounter a decrease in the interlayer spacing after melt intercalation. As seen in Table 6.4, the initial interlayer opening depends on the interlayer expansion (�� opening) after melt intercalation. The smaller initial open-ing leads to the larger interlayer expansion, and gives almost same fi nal interlayer opening. This feature has been observed in the results of other nanocomposites prepared by different OMLFs intercalated with different surfactants.20 From this result, the entropic contribution of the intercal-ants, which leads to the entropy gain associated with layer expansion after intercalation of the small molecules and/or polymer chains, may not be signifi cant owing to the interdigitated layer structure. Presumably the penetration takes place by pressure drop within the nanogalleries, nano-capillary action, generated by the two platelets.
As reported in the literature,18 the pressure drop (�p) in the nanogalleries, which makes the polymer penetration more diffi cult, should be discussed. The estimated pressure difference (~24 MPa) is much larger than the shear stress (~0.1 MPa) during melt compounding.18 This suggests that shear stress has little effect on the delamination (exfoliation) of the layer. This reasoning is consistent with the intercalated structure reported by so many nanocomposite researchers, who can prepare only intercalated (not exfoli-ated) nanocomposites via the simple melt extrusion technique.1 A novel compounding process is currently in progress. Solid-state shear processing may be an innovative technique to delaminate the layered fi llers.21
Compared to OMLFs, the nanocomposite structure is diffi cult to model using atomic scale molecular dynamics (MD) because the intercalated polymer chain conformation is complex and is rarely in an equilibrium state. However, Pricl et al.22 explored and characterized the atomic scale
3.3763.933
Thickness 0.338 nm
PLA-oligomer
Width 0.393 nm
MD program(MM2 in Quantum CAChe)
FIGURE 6.5 Molecular dimensions of PLA-backbone using the molecular dynamics program
(MM2 in Quantum CAChe) in consideration of van der Waals radii into consideration. Optimi-
zation of structure is based on minimization of the total energy of the molecular system.
186 Polymeric Foams
61259_C006.indd 18661259_C006.indd 186 7/28/2008 11:30:53 AM7/28/2008 11:30:53 AM

structure to predict binding energies and basal spacing of PLSNCs based on polypropylene (PP) and maleated (MA) PP (PP-MA), MMT, and differ-ent alkylammonium ions as intercalants (see Figure 6.6). From a global interpretation of all of these MD simulation results, they concluded that intercalants with a smaller volume are more effective for clay modifi ca-tion as they improve the thermodynamics of the system by increasing the binding energy. On the other hand, intercalants with longer tails are more effective for intercalation and exfoliation processes, as they lead to higher
FIGURE 6.6 Three-component model used for basal spacing simulations, consisting of
two layers of MMT with K� cations (stick model), four molecules of trimethylammonium
cation (a) or dimethylstearylammonium cation (b) (stick and ball model), and one molecule
of maleated PP (PP-MA) (ball model). (From Totha, R., Coslanicha, A., Ferronea, M. et al. Polymer 45 (2004): 8075. © 2006 Elsevier Science.)
Nanostructure Development and Foam Processing 187
61259_C006.indd 18761259_C006.indd 187 7/28/2008 11:30:53 AM7/28/2008 11:30:53 AM

basal spacing. Additional information is necessary to predict a more rea-sonable nanostructure of PLSNCs. Some literature related to the confi ned polymer chains within the silicate galleries by using coarse-grained MD simulation has been published.23–26
6.3 Flow-Induced Structure Development
Rheological behavior, especially elongational and shear fl ow behavior in the molten state of PLSNCs, has not been well studied, although such knowledge should be indispensable in relation to their performance in processing operations. One objective of this chapter is to focus on a profound understanding of PLSNCs for their innovations in practical material production. For this purpose, it is indispensable to illuminate the nanostructure as well as rheological properties of PLSNCs to assess appropriate processing conditions for designing and controlling their hierarchical nanostructure, which must be closely related to their material performance.
6.3.1 Elongational Flow and Strain-Induced Hardening
Okamoto et al.27 fi rst conducted an elongation test of PP-based nanocom-posites (PPCN4) under molten state at constant Hencky strain rate, e.0 using an elongation fl ow opto-rheometry, and attempted to control the alignment of the dispersed MMT layers with nanometer dimensions of intercalated PPCNs under uniaxial elongational fl ow.
Figure 6.7 shows double logarithmic plots of transient elongational vis-cosity �E (�
.0;t) against time t observed for a nylon 6/OMLS system (N6CN3.7:
MMT � 3.7 weight-percentage) and PPCN4 (MMT � 4 weight-percentage) with different Hencky strain rates, �
.0, ranging from 0.001 s�1 to 1.0 s�1.
The solid curve represents time development of three-fold shear viscosity, 3�0 (�
.;t), at 225°C with a constant shear rate �
. � 0.001 s�1. In �E (�
.0;t) at
any �.0, N6CN3.7 melt shows a weak tendency of strain-induced hardening
compared with that of PPCN4 melt. A strong behavior of strain-induced hardening for PPCN4 melt was originated from the perpendicular align-ment of the silicate layers to the stretching direction as reported by Okamoto et al.28
From TEM observation,29 the N6CN3.7 forms a fi ne dispersion of the sil-icate layers of about 100 nm in Lclay, 3 nm thickness in dclay and clay of about 20–30 nm between them. The clay value is one order of magnitude lower than the value of Lclay, suggesting the formation of a spatially linked-like structure of the dispersed clay particles in the nylon 6 matrix. For N6CN3.7 melt, the silicate layers are densely dispersed into the matrix and hence
188 Polymeric Foams
61259_C006.indd 18861259_C006.indd 188 7/28/2008 11:30:54 AM7/28/2008 11:30:54 AM

diffi cult to align under elongational fl ow. Under fl ow fi elds, the silicate layers might translationally move, but not rotationally in such a way that the loss energy becomes minimum. This tendency was also observed in PPCN7.5 melt having higher content of MMT (�7.5 weight-percentage).30
One can observe two features for the shear viscosity curve. First, the extended Trouton rule, 3�0(�
.;t) � �E(�
.0;t), does not hold for both N6CN3.7
and PPCN4 melts, as opposed to the melt of ordinary homo-polymers. The latter, �E(�
.0;t), is more than 10 times larger than the former, 30(�
.;t).
Second, again unlike ordinary polymer melts, 3�0(�.;t) of N6CN3.7 melt
increases continuously with t, never showing a tendency of reaching a steady state within the time span (600 s or longer) examined here. This time-depen-dent thickening behavior may be called anti-thixotropy or rheopexy. Under slow shear fl ow (�
.� 0.001 s�1), 3�0(�
.;t) of N6CN3.7 exhibits a much stronger
rheopexy behavior with almost two orders of magnitude higher than that
108
106
104
102
100
η/P
a.s
106
104
102
100
10–1 100 101
Time/s
102 103
N6CN3.7
225°C
PPCN4
150°C
ε0 / s–1∗
1.00.50.1
3*η0
0.050.030.010.0050.001
(cone-plate; 0.001s–1
)(a)
(b)
FIGURE 6.7 Time variation of elongational viscosity �E(�.0;t) for: (a) N6CN3.7 melt at 225°C;
and (b) PPCN4 at 150°C. The solid line shows three times the shear viscosity, 3�E(�.;t), taken
at a low shear rate �.
� 0.001 s�1 on a cone-plate rheometer. (From Okamoto, M. “Polymer/
Layered Silicate Nanocomposites.” Rapra Review Report No. 163, Rapra Technology Ltd,
London, 2003. 166 pp. © 2003 Rapra Technology Ltd.)
Nanostructure Development and Foam Processing 189
61259_C006.indd 18961259_C006.indd 189 7/28/2008 11:30:54 AM7/28/2008 11:30:54 AM

of PPCN4. This refl ects a fact that the shear-induced structural change involved a process with an extremely long relaxation time as well as for other PLSNCs having rheopexy behavior,31 especially under the weak shear fi eld.
In uniaxial elongational fl ow (converging low) for a PPCN4, the forma-tion of a ‘house-of-cards’ structure is found by TEM analysis.27 The per-pendicular (but not parallel) alignment of disk-like MMT clay particles with large anisotropy toward the fl ow direction might sound unlikely but this could be the case, especially under an elongational fl ow fi eld in which the extentional fl ow rate is the square of the converging fl ow rate along the thickness direction, if the assumption of affi ne deformation without volume change is valid. Obviously under such conditions, the energy dis-sipation rate due to viscous resistance between the disk surface and the matrix polymer is minimal when the disks are aligned perpendicular to the fl ow direction.
Some 20 years ago, van Olphen32 pointed out that the electrostatic attrac-tion between the layers of natural clay in aqueous suspension arises from higher polar forces in the medium. The intriguing features such as yield stress thixotropy and/or rheopexy exhibited in aqueous suspensions of natural clay minerals may be taken as a reference to the present PLSNCs.
6.4 Foam Processing
Flow-induced internal structural change occurs in both shear and elonga-tional fl ow, but differs in each case, as noted from the above results on �E(�
.0;t) and 3�0(�
.;t) (see Figure 6.7). Thus, with the rheological features of
the PLSNCs and the characteristics of each processing operation, tactics should be selected accordingly for a particular nanocomposite for the enhancement of its mechanical properties.
For example, the strong strain-induced hardening in �E(�.0;t) is requisite
for withstanding the stretching force during the processing, while the rheopexy in 3�0(�
.;t) suggests that for such PLSNC a promising technology
is the processing in confi ned space (such as injection molding) where shear force is crucial.
6.4.1 Foam Processing of PP-Based Nanocomposites
PPCNs have already been shown to exhibit a tendency toward strong strain-induced hardening. On the basis of this result, the fi rst successful nano-composite foam, processed by using supercritical (sc)-CO2 as a physical foaming agent, appeared through a pioneering effort by Okamoto et al.5,6 A small amount of nanofi llers in the polymer matrix serve as nucleation
190 Polymeric Foams
61259_C006.indd 19061259_C006.indd 190 7/28/2008 11:30:55 AM7/28/2008 11:30:55 AM

sites to facilitate the bubble nucleation during foaming. Novel nanocom-posite foams based on the combination of new nanofi llers and sc-CO2 led to a new class of materials. The process consists of four stages: (1) satura-tion of CO2 in the sample at desired temperature; (2) cell nucleation when the release of CO2 pressure started (supersaturated CO2); (3) cell growth to an equilibrium size during the release of CO2; and (4) stabilization of cell via cooling of the foamed sample. The autoclave setup used in their study is shown in Figure 6.8. Figure 6.9 represents the scanning electron micros-copy (SEM) images of PP-MA and various PPCNs foams conducted at vari-ous temperatures under a pressure of 10 MPa. From the SEM images it can be clearly observed that, apart from PPCN4 (MMT � 4 weight-percentage) and PPCN7.5 foams prepared at 130.6°C, all exhibit neatly closed-cell structures with cells having 12- or 14-hedron shapes. The formed cells show their faces mostly in pentagons or hexagons, which express the most energetically stable state of polygon cells. They also calculated the distri-bution function of cell sizes from SEM images as shown in Figure 6.10. From the distribution curve it is clearly seen that PPCN7.5 exhibited a bimodal distribution of cell size, whereas the other samples neatly follow a Gaussian distribution. Another interesting observation from Figure 6.10 is the width of the distribution peaks—the polydispersity of the cell size became narrower with the addition of clay into the matrix (PPCN2 and
Autoclave
Bandheater
CO2 gas cylinderCooling water jacket
Sample
Pressure gauge
FIGURE 6.8 Schematic representation of autoclave set-up. (From Nam, P. H., Okamoto, M.,
Maiti, P., et al. Polymer Engineering Science 42 (2002): 1907. © 2002 Society of Plastic Engineers.
With permission.)
Nanostructure Development and Foam Processing 191
61259_C006.indd 19161259_C006.indd 191 7/28/2008 11:30:55 AM7/28/2008 11:30:55 AM

PPCN4). This behavior may be due to the heterogenous clay sites possibly acting for cell nucleation and their uniform dispersion in the matrix, which, if present, leads to the high homogeneity in cell size. On the other hand, the cell size of prepared foam gradually decreases with increasing clay content in the PPCNs. This behavior is due the intrinsically high vis-cosity of the materials with increasing clay loading, which were subjected to foam processing. In contrast, the cell density of the foams behaved in the opposite way. The characteristic parameters of pre- and post-formed samples are listed in Table 6.5. The function for determining cell density (Nc) in cells/cm3 is defi ned in the following equation:6
4
3
3[1 ( / )]10
4 d
f pcN
r rp
-=
(6.2)
On the other hand, the mean cell wall thickness (�) in �m was estimated by the following equation:6
d � d(1/ √ _________
1 - (rf/rp) - 1) (6.3)
Figure 6.11 shows the TEM images on the structure of the mono-cell wall (a) and the junction of three cell walls (b) for PPCN4 foamed at 134.7°C. In Figure 6.11a, the dispersed clay particles in the cell wall align along
7.5
Clay content (wt %)
4
2
0
Temperature (oC) 130.6°C 134.7°C 139.2°C 143.4°C
200 μm
FIGURE 6.9 SEM images for PP-MA and various PPCNs foamed at different temperature.
(From Nam, P. H., Okamoto, M., Maiti, P., et al. Polymer Engineering Science 42 (2002): 1907.
© 2002 Society of Plastic Engineers. With permission.)
192 Polymeric Foams
61259_C006.indd 19261259_C006.indd 192 7/28/2008 11:30:55 AM7/28/2008 11:30:55 AM

PP-MA
Cell size/μm
40
30
20
10
0
18
12
6
0
12
8
4
0
12
8
4
00 20 40 60 80 100 120 140 160 180 200
Fra
ctio
n / %
PPCN7.5134.7°C
PPCN4134.7°C
PPCN2134.7°C
PPCN2134.7°C
134.7°C
FIGURE 6.10 Typical example for cell size distribution of foamed PP-MA and PPCNs in
experiment at 134.7°C. Average values of d in �m and variances 2d in �m2 in the Gaussian
fi t through the data are: 122.1 and 12.1 for PP-MA foam; 95.1 and 9.8 for PPCN2 foam; and
64.4 and 3.1 for PPCN4 foam. (From Nam, P. H., Okamoto, M., Maiti, P., et al. Polymer Engineering Science 42 (2002): 1907. © 2002 Society of Plastic Engineers. With permission.)
the interface between the solid and gas phase. In other words, the clay particles arrange along the boundary of cells. The orientation angle of the dispersed clay particles (versus cell boundary), calculated statistically from TEM photographs, is about 5 ± 3.6°, indicating that plane orientation of the dispersed clay particles to the cell boundary occurred. In a previous paper for PPCN4 melt,27 the perpendicular alignment of the clay particles to stretching or elongating direction was shown, which was the main rea-son for causing the strain-induced hardening in the uniaxial elongational viscosity.
In this foam processing, apparently, a similar structure is formed, prob-ably by a different mechanism. Due to the biaxial fl ow of material during foam process, the clay particles probably either turned their face (marked
Nanostructure Development and Foam Processing 193
61259_C006.indd 19361259_C006.indd 193 7/28/2008 11:30:56 AM7/28/2008 11:30:56 AM

with the arrows (A) in Figure 6.11a or fi xed face orientation (marked with the arrows (B) in Figure 6.11a) and aligned along the fl ow direction of materials; that is, along the cell boundary. The interesting point here is that such aligning behavior of the clay particles may help cells to with-stand the stretching force from breaking the thin cell wall; in other words, to improve the strength of foam in mechanical properties. The clay parti-cles seem to act as a secondary cloth layer to protect the cells from being destroyed by external forces. How do such unique alignments represent an improvement in mechanical properties?
The compression modulus K� of the foams are shown in Table 6.6. The K� of the PPCN foams appears higher than that of PP-MA foam even though they have the same �f. level. This may create the improvement of mechani-cal properties for polymeric foams through polymeric nanocomposites.
TABLE 6.5
Characteristic Parameters of Pre- and Post-Foamed PP and Various PPCNs
Sample
Tf
(°C)�
(g.mL�1)
d
(�m)
Nc (Cells.
mL�1.107)�
(mm)
PP-MA 0.854
PP-MA foam 130.6 0.219 74.4 1.8 11.88
PP-MA foam 134.7 0.114 122.1 0.48 9.07
PP-MA foam 139.2 0.058 155.3 0.25 5.56
PP-MA foam 143.4 0.058 137.3 0.35 6.46
PPCN2 0.881
PPCN2 foam 130.6 0.213 72.5 1.99 10.76
PPCN2 foam 134.7 0.113 95.1 1.01 6.76
PPCN2 foam 139.2 0.058 133.3 0.39 4.62
PPCN2 foam 143.4 0.113 150.3 0.26 10.68
PPCN4 0.900
PPCN4 foam 130.6 0.423
PPCN4 foam 134.7 0.196 64.4 2.92 8.41
PPCN4 foam 139.2 0.193 93.4 0.96 11.98
PPCN4 foam 143.4 0.341 56.1 3.52 15.08
PPCN7.5 0.921
PPCN7.5 foam 130.6 0.473
PPCN7.5 foam 134.7 0.190 35.1 18.35 4.30
PPCN7.5 foam 139.2 0.131 33.9 22.00 2.70
PPCN7.5 foam 143.4 0.266 27.5 34.2 5.11
Source: From Nam, P. H., Okamoto, M., Maiti, P., et al. Polymer Engineering Science 42 (2002):
1907. © 2002 Society of Plastic Engineers. With permission.
194 Polymeric Foams
61259_C006.indd 19461259_C006.indd 194 7/28/2008 11:30:56 AM7/28/2008 11:30:56 AM

In Figure 6.11b, besides the alignment of clay particles, we can observe a random dispersion of clay in the central area of the junction (marked with the arrow in Figure 6.11b). Such behavior of clay particles presumably refl ects the effect of stagnation fl ow region of material under the growth of three contacting cells.
Figure 6.12 shows the stress–strain curves and the strain recovery behav-ior of the PP-based nanocomposite (PPCN) foams28 in the compression mode at a constant strain rate of 5% min�1. The nanocomposite foams exhibit high modulus compared to neat PP-g-MA foam. The residual strain is 17%
(a)
(A)
(B)
(b)
Cell boundary
Cell boundary 500 nm200 nm
FIGURE 6.11 TEM micrographs for PPCN4 foamed at 134.7 °C: (a) mono-cell wall and
(b) junction of three contacting cells. (From Okamoto, M., Nam, P. H., Maiti, M., et al. Nano Letters 1 (2001): 503. © 2001 American Chemical Society. With permission.)
TABLE 6.6
Morphological parameters and compression modulus of PP and PPCN foams
Foam
Samples�f
(g.cm�3)
d
(�m)NC � 10�6
(Cell.cm�3)
�
(�m)
K�*
(MPa)
PP-MA 0.06 155.3 2.49 5.6 0.44
PPCN2 0.06 133.0 3.94 4.6 1.72
PPCN4 0.12 93.4 9.64 11.9 1.95
PPCN7.5 0.13 33.9 220 2.7 2.80
* At 25°C.
Source: From Okamoto, M., Nam, P. H., Maiti, M., et al. Nano Letters 1 (2001): 503. © 2001
American Chemical Society. With permission.
Nanostructure Development and Foam Processing 195
61259_C006.indd 19561259_C006.indd 195 7/28/2008 11:30:56 AM7/28/2008 11:30:56 AM

for PPCN2 (MMT � 2 weight-percentage) as well as neat PP foam, provid-ing the excellent strain recovery and the energy dissipation mechanism, probably with the ‘house-of-cards’ structure formation in the cell wall, which enhances the mechanical properties of the nanocomposites like a spruce wood which is close to right-handed helix (see Figure 6.13).33
6.4.2 In-Situ Observation of Foaming
To understand the complex mechanism of physical foaming, Taki et al. studied the dynamic behavior of bubble nucleation and growth in the batch foaming of PP-based nanocomposites.34 Employing image-processing techniques, the bubble nucleation and growth rate for different nano-composites are analyzed from the series micrographs. Together with the solubility and diffusivity of CO2 into the PP matrix, the mechanism of nanocomposite foaming is investigated.
Figure 6.14 shows a schematic diagram of the visual observation appa-ratus for batch physical foaming. It consists of a high-pressure cell, a gas supply line and a pump with a gas cylinder. The high-pressure cell is made of stainless steel and has two sapphire windows on the walls. The C-shape stainless steel is used for a spacer. A signal processing board (DITECT, Japan; HAS-PCI) is installed so as to record a series of micro-graphs onto an online computer.
Figure 6.15 shows the series of micrographs of PP-MA (upper) and PPCN7.5 (lower) foaming at 150°C under a pressure of 13 MPa. The
1.0
0.8
0.6
0.4Str
ess/
MP
a
0.2
0
0 10 20
Strain/%
30 40
Compression set (%)
PP-MA 18PPCN2 17PPCN4 29PPCN7.5 41
50
FIGURE 6.12 Stress–strain curves and strain recovery behavior of the PP-based nano-
composites (PPCNs). (From Okamoto, M. “Polymer/Layered Silicate Nanocomposites.”
Rapra Review Report No. 163, Rapra Technology Ltd, London, 2003. 166 pp. © 2003 Rapra
Technology Ltd.)
196 Polymeric Foams
61259_C006.indd 19661259_C006.indd 196 7/28/2008 11:30:57 AM7/28/2008 11:30:57 AM

Z-HelixCellulose
fibrils
μ
42 μm
FIGURE 6.13 X-Ray microdiffraction experiment with a 2-μm-thick section of spruce
wood embedded in resin. Note the asymmetry of the patterns in the enlargement (far left)
which can be used to determine the local orientation of cellulose fi brils in the cell wall
(arrows). The arrows are plotted in the right image with the convention that they represent
the projection of a vector parallel to the fi brils onto the plane of the cross-section. The pic-
ture clearly shows that all cells are right-handed helices. (From Fratzl, P. Current Opinion in Colloid Interface Science 8 (2003): 32. © 2003 Elsevier Science.)
CO2 cylinder
Chiller
Pump
Pressuresensor
Temperaturecontroller
high-speed digital camera
Cartridgeheater
Back light
Sapphirewindows
Buffer cylinder
Needle valve
Computer
Valve1
Valve 2 Needle valve
Microscope with
Needle valve
FIGURE 6.14 A schematic diagram of the visual observation apparatus for batch physical
foaming. (From Taki, K., Yanagimoto, T., Funami, E., Okamoto, M., and Ohshima, M.
Polymer Engineering Science 44 (2004): 1004. © 2004 Society of Plastic Engineers.)
Nanostructure Development and Foam Processing 197
61259_C006.indd 19761259_C006.indd 197 7/28/2008 11:30:57 AM7/28/2008 11:30:57 AM

dynamic behavior of bubble nucleation and growth in the very early stages of foaming can be seen in Figure 6.16. The bubble nucleation rate and the fi nal density of bubbles were highest at PPCN7.5 foaming. Although a distinct difference in bubble nucleation rate as well as in the fi nal bubble density could not be observed between PPCN2 and PPMA foaming, the nucleation rate and the fi nal bubble density increased as the weight fraction of clay increased. Furthermore, the induction time became shorter as the clay content increased.
The bubble growth rate is quantifi ed by measuring temporal change in cross-sectional area of each bubble. Figure 6.17 shows the representative growth rate of the bubbles born at the designated time in PP-MA and nano-composite foaming. Since the change in cross-sectional area of bubbles can be approximated by a linear function of time as mentioned above, the bub-ble growth observed by micrographs is a mass transfer-controlled process. Therefore, it can be said that the clay content changes the mass transfer rate of CO2 from the matrix polymer to the bubbles. The clay particles decrease the diffusivity of CO2 while keeping the solubility of CO2 in the matrix polymer the same. Owing to the clay-induced diffusivity depression, the
PPCN7.5 (PP+clay7.5%)
0 s 1 s 2 s
0 s 1 s 2 s
PPMA (PP+clay0%)
1.2
mm
1.6 mm1.
2 m
m
1.6 mm
FIGURE 6.15 Series of micrographs of foaming: PP-MA (upper), PPCN7.5 (lower). The
black dots are bubbles and white part is the polymer matrix. The color of the bubbles in the
micrograph appear black because the bubbles refl ect the light entering from the opposite-
side window of the high-pressure cell. (From Taki, K., Yanagimoto, T., Funami, E., Okamoto, M.,
and Ohshima, M. Polymer Engineering Science 44 (2004): 1004. © 2004 Society of Plastic
Engineers.)
198 Polymeric Foams
61259_C006.indd 19861259_C006.indd 198 7/28/2008 11:30:58 AM7/28/2008 11:30:58 AM

0
2.5 3.0 3.5 4.0 4.5 5.0 5.5 6.0
200
400
600
800
1000
1200N
umbe
r de
nsity
of n
ucle
ated
bub
ble
(1/m
m3 )
Time elapsed after the pressure release starts (s)
PPMA PPCN2 PPCN4 PPCN7.5
FIGURE 6.16 Time variation in number density of nucleated bubble of PP-MA and nano-
composite foaming. (From Taki, K., Yanagimoto, T., Funami, E., Okamoto, M., and Ohshima,
M. Polymer Engineering Science 44 (2004): 1004. © 2004 Society of Plastic Engineers.)
Rep
rese
ntat
ive
aver
age
grow
th r
ate
(μm
2 /s)
2.5 3.0 3.5 4.0 4.5 5.0 5.5
Time elapsed after the pressure release starts (s)
0
2000
4000
6000
8000
10000
12000
PPMA
PPCN2
PPCN4
PPCN7.5
FIGURE 6.17 Representative average growth rates for PP-MA and nanocomposite foam-
ing. (From Taki, K., Yanagimoto, T., Funami, E., Okamoto, M., and Ohshima, M. Polymer Engineering Science 44 (2004): 1004. © 2004 Society of Plastic Engineers.)
Nanostructure Development and Foam Processing 199
61259_C006.indd 19961259_C006.indd 199 7/28/2008 11:30:58 AM7/28/2008 11:30:58 AM

increase in clay content depresses the mass transfer of CO2 from the matrix polymer to the bubbles. As a result, the bubble growth rate is decreased.
6.4.3 PLA-Based Nanocomposite Foaming
Figure 6.18 shows the typical results of SEM images of the fracture surfaces of the PLA/MMT-ODA and neat PLA without clay foamed at a tempera-ture range of 100–140°C under the different isobaric saturation conditions (14, 21, and 28 MPa).35 All foams exhibit the neat closed-cell structure. We noted here that homogeneous cells were formed in the case of nanocompos-ite foams, while neat PLA foams show rather non-uniform cell structure having large cell size. The nanocomposite foams show smaller cell size (d) and larger cell density (Nc) compared with neat PLA foam, suggesting that the dispersed silicate particles act as nucleating sites for cell formation.5
For both foam systems, the calculated distribution function of cell size from SEM images are presented in Figure 6.19. The nanocomposite foams nicely obeyed the Gaussian distribution. In the case of PLA/ODA foamed at 150°C under high pressure of 24 MPa, we can see that the width of the distribution peaks, which indicates the dispersity for cell size, became narrow accompanied by fi ner dispersion of silicate particles.
Obviously, with decreasing saturation pressure condition (~140°C and 14 MPa), both foams exhibit large cell size due to the low supply of CO2
x7,500
x1,000
2 μm
20 μm
PC
O2/M
Pa
Tf/°C
120100 140140
14
21
28
PLA/MMT-ODA PLA
FIGURE 6.18 Typical results of SEM images of the fracture surfaces of PLA/MMT-ODA
and neat PLA foamed at temperature range of 100–140°C under different isobaric satura-
tion condition (14, 21, and 28 MPa). (Source: Reprinted from Ema, Y., Ikeya, M., and Okamoto,
M. Polymer 47 (2006): 5350. © 2006, Elsevier Science.)
200 Polymeric Foams
61259_C006.indd 20061259_C006.indd 200 7/28/2008 11:30:58 AM7/28/2008 11:30:58 AM

molecules, which can subsequently form a small population of cell nuclei upon depressurization. The incorporation of nanoclay (OMLS) induces heterogeneous nucleation because of a lower activation energy barrier compared with homogeneous nucleation.36 However, the competi-tion between homogeneous and heterogeneous nucleation is no longer discernible.
6.4.4 Foaming Temperature Dependence of Cellular Structure
The dependence of the foam density (�f) at the Tf under different CO2 pres-sures are shown in Figure 6.20. Throughout the whole CO2 pressure range, the mass density of PLA/MMT-ODA foams remains at a constant value at low foaming temperature (Tf) range and abruptly decreases beyond a cer-tain Tf, and then attains a minimum constant value up to 150°C again. From the above results, it can be said that such behavior of mass density is due to the competition between cell nucleation and cell growth. At the low Tf range (~110°C), in which a large supply of CO2 molecules are pro-vided, the cell nucleation is dominant, while at the high Tf, (~140°C), cell growth and the coalescence of cells are prominent due to low viscosity of the systems compared with the low Tf range (~110°C). This behavior clearly appears in the plots of the cell size (�2d), the cell density (Nc), and the mean cell wall thickness (�) versus Tf under various pressure conditions, respectively. As seen in Figure 6.21, with increasing Tf all nanocomposite foams show an increasing tendency of 2d and/or �
. and attain a maximum.
00 10 20 30 40 50 60 70 80 90 100
10
20
30
40
50
PLAPLA/MMT-ODA
Fra
ctio
n / %
Cell size/μm
FIGURE 6.19 Typical example for cell size distribution of foamed PLA/MMT-ODA and
neat PLA in experiments at 150°C under 24 MPa. Average values d in �m and variances 2d
in �m2 in the Gaussian fi t through the data are 24.2 and 19.1 for PLA/MMT-ODA foam, and
58.3 and 171.0 for PLA foam. (Source: Reprinted from Ema, Y., Ikeya, M., and Okamoto,
M. Polymer 47 (2006): 5350. © 2006, Elsevier Science.)
Nanostructure Development and Foam Processing 201
61259_C006.indd 20161259_C006.indd 201 7/28/2008 11:30:58 AM7/28/2008 11:30:58 AM

On the other hand, the temperature dependence of Nc shows opposite behavior compared with the tendency of 2d due to cell growth and coales-cence. Both 2d and Nc affect the mass density of the foams.
Using Tg depressions (corresponding to �Tg), reconstructed plots of �f versus Tf � �Tg were drawn from the data of Figure 6.20. The results are shown in Figure 6.22. All of the data, including neat PLA and PLA/MMT-SBE, neatly conform to a reduced curve with �f ~1.0 ± 0.1 g/cm3 at Tf � �Tg � 140 ± 4°C (nanocellular region), whereas �f values approach around 0.3 ± 0.15 g/cm3 as reduced temperature (Tf � �Tg) increased well above 150°C (microcellular region). The critical temperature is thus 140 ± 4°C, above which cell growth prevails. Below the critical tempera-ture, cell nucleation dominates and cell growth is suppressed due to the high modulus and viscosity as revealed by the temperature dependence of stage, G�(�), and loss, G��(�), moduli (G� � 162 MPa and viscosity com-ponent G��/� � 2 MPa s at 140°C). Figure 6.23 shows temperature-reduced plots of 2d, Nc and � versus Tf � �Tg. All data nicely conform to a reduced curve such as in Figure 6.22. Interestingly, when both Tg and Tm depressions were used37 to conduct superposition, it was recognized that the reduced curve is neatly constructed but there is no signifi cant difference in compari-son with the case of Tf � �Tg. This indicates that Tg depression is important in optimizing foam processing conditions but Tm depression may be not a signifi cant factor for processing because the Tf range is still below Tm after CO2 saturation.
In Figure 6.24, the relationship between 2d and Nc, and � and 2d in this study are shown. The relationship neatly obeys Equations 6.2 and 6.3 but
0.2
0.4
0.6
0.8
1
1.2
90 100 110 120 130 140 150 160
142118242830
Tf / °C
PCO2 / MPa
ρ f /
g·cm
–3
FIGURE 6.20 Foaming temperature dependence of mass density for PLA/MMT-ODA
foamed under different CO2 pressure conditions. (From Ema, Y., Ikeya, M., and Okamoto,
M. Polymer 47 (2006): 5350. © 2006, Elsevier Science.)
Q1
202 Polymeric Foams
61259_C006.indd 20261259_C006.indd 202 7/28/2008 11:30:59 AM7/28/2008 11:30:59 AM

the deviation occurs beyond the value of Nc ~ 1012 cell/cm�3 for panel (a) and below 2d ~ 1 �m for panel (b). The downward and upward deviations indicate that the heterogeneous cell distribution mechanism due to the rigid crystalline phases in the PLA matrix is caused by a high degree of crys-tallinity (~49 weight-percentage) under the low foaming temperature range (~100°C). As seen in Figure 6.25, the PLACN foams exhibit a heteroge-neous cell distribution. The PLA foam reduces the value of Nc accompanied by a large value of �
. compared with that of PLACN foams. In the case of
PLACN foams, the controlled structure of the PLACN foams is from microcellular (2d � 30 �m and Nc � 3.0 × 10⁷ cells/cm3) to nanocellular (2d � 200 nm and Nc � 2.0 × 10¹³ cells/cm3).
141821242830
PCO2 / MPa
FIGURE 6.21 Foaming temperature dependence of: (a) cell size; (b) cell density; and (c)
mean cell wall thickness under different CO2 pressure conditions. (From Ema, Y., Ikeya, M.,
and Okamoto, M. Polymer 47 (2006): 5350. © 2006, Elsevier Science.)
Nanostructure Development and Foam Processing 203
61259_C006.indd 20361259_C006.indd 203 7/28/2008 11:30:59 AM7/28/2008 11:30:59 AM

6.4.5 CO2 Pressure Dependence
At high pressure, both homogeneous and heterogeneous nucleation mechanisms may appear to be of comparable signifi cance. All systems demonstrate that Nc increases systematically with increasing CO2 pressure in the low Tf region (~100–120°C). For PLA/MMT-ODA foams, the system suggests that the heterogeneous nucleation is favored in high-pressure conditions. The cell nucleation in the heterogeneous nucleation system such as PLA/MMT-ODA foams took place in the boundary between the matrix and the dispersed nanoclay particles. Accordingly, the cell size decreased without individual cell coalescence for PLA/MMT-ODA and neat PLA systems, as seen in Figure 6.25. To clearly investigate whether the addition of internal surfaces of the dispersed nanoclay may hinder CO2 diffusion by creating a more tortuous diffusive pathway,19 character-ization of the interfacial tension between bubble and matrix was conducted using the modifi ed classical nucleation theory.36
According to the theory proposed by Suh and Colton, the rate of nucle-ation of cells per unit volume (N
.) can be written as
2
3
2
16 ( )~ exp
3( )CO B
SN Cf
P k Tpg qÈ ˘-
Í ˙DÍ ˙Î ˚
�
(6.4)
0
0.2
0.4
0.6
0.8
1
1.2
120 130 140 150 160 170
PLAPLA/MMT-ODAPLA/MMT-SBE
r f /
g·cm
–3
Tf + ΔT / °C
FIGURE 6.22 Plot of mass density for PLA/MMT-ODA, PLA/MMT-SBE and neat PLA
versus reduced foaming temperature (Tf � �Tg). The critical temperature (140 ± 4°C) is
shaded. (From Ema, Y., Ikeya, M., and Okamoto, M. Polymer 47 (2006): 5350. © 2006, Elsevier
Science.)
204 Polymeric Foams
61259_C006.indd 20461259_C006.indd 204 7/28/2008 11:30:59 AM7/28/2008 11:30:59 AM

where C is the concentration of CO2 and/or the concentration of heteroge-neous nucleation sites, f is the collision frequency of CO2, � is the inter-facial tension between bubble and matrix, S(�) is the energy reduction factor for the heterogeneous nucleation (i.e. PLA/MMT-ODA), �PCO2
is the magnitude of the pressure quench during depressurization, kB is the Boltzmann constant, and T is absolute temperature.
The theoretical cell density is given by
0
t
theorN Ndt= Ú � (6.5)
PLAPLA/MMT-ODAPLA/MMT-SBE
FIGURE 6.23 Temperature-reduced plots of: (a) 2d; (b) Nc; and (c) � versus Tf � �Tg for
PLA/MMT-ODA, PLA/MMT-SBE and neat PLA. (From Ema, Y., Ikeya, M., and Okamoto,
M. Polymer 47 (2006): 5350. © 2006, Elsevier Science.)
Nanostructure Development and Foam Processing 205
61259_C006.indd 20561259_C006.indd 205 7/28/2008 11:30:59 AM7/28/2008 11:30:59 AM

where t is the foaming time that takes approximately 3 s. Assuming no effect of the coalescence of cell on the value of Nc, we estimate the interfa-cial tension of the systems calculated using Equations 6.4 and 6.5; that is, the slope of the plots (Nc, versus 1/�PCO2). The characteristic parameters of two systems are shown in Table 6.7. The interfacial tension of PLA/MMT-ODA and neat PLA are 6.65 mJ/m2 and 7.43 mJ/m2 at 110°C, respectively. These estimated �
. values are in good agreement with that of the other
poly(methyl methacrylate) (PMMA)-CO2 system (~10 mJ/m2).38 The PLA/MMT-ODA system has a low value compared to that of neat PLA. This trend refl ects the relative importance of heterogeneous nucleation, which
103(a)
102
101
100
2d/m
m
10–1
10–2
102(b)
101
100
d/mm
10–1
10–2
104 106 108 1010
Nc/cm–31012
PLA
PLA/MMT-ODA
PLA/MMT-SBE
PLA
PLA/MMT-ODA
–1/3
1
PLA/MMT-SBE
1014
10–2 10–1 100 101
2d /mm102 103
FIGURE 6.24 Relationship between: (a) cell size versus cell density; and (b) cell wall thick-
ness versus cell size for all foams. (From Ema, Y., Ikeya, M., and Okamoto, M. Polymer
47 (2006): 5350. © 2006, Elsevier Science.)
206 Polymeric Foams
61259_C006.indd 20661259_C006.indd 206 7/28/2008 11:30:59 AM7/28/2008 11:30:59 AM

FIGURE 6.25 SEM images of the fracture surfaces of: (a) neat PLA; (b) PLA/MMT-ODA;
and (c) PLA/MMT-SBE foamed at 100°C under 28 MPa. (From Ema, Y., Ikeya, M., and
Okamoto, M. Polymer 47 (2006): 5350. © 2006, Elsevier Science.)
Nanostructure Development and Foam Processing 207
61259_C006.indd 20761259_C006.indd 207 7/28/2008 11:30:59 AM7/28/2008 11:30:59 AM

dominates over the homogeneous one in the event that the amount of CO2 available for bubble nucleation is limited because of a lower activation energy barrier, as mentioned previously. That is, in the heterogeneous nucleation (PLA/MMT-ODA), we have to take the reduction of the critical energy into consideration because of the inclusion of nucleants, which is a function of the PLA-gas-nanoclay contact angle (�) and the relative curvature (W) of the nucleant surface to the critical radius of the nucleated phase.39 In the case of W � 10, the energy reduction factor S(�) can be expressed:
S(�) � (1/4) (2 � cos �)(1 � cos �)2 (6.6)
In the case of homogeneous nucleation S(�) is unity (� � 180°). The obtained values of the contact angle are 107.3° at 110°C and 85.3° at 120°C. The estimated reduction factor (S(�) � 0.4–0.7) was not so small when we com-pared with the other nanofi llers (e.g. carbon nanofi bers, S(�) � 0.006).40 However, experimentally, nanoclay particles lead to an increase in Nc.
For PLA/MMT-SBE foams prepared under condition with low Tf (~100–110°C) and high pressure (~28 MPa), the nanocomposite foams exhibit no signifi cant difference in Nc compared with PLA/MMT-ODA foams. This reasoning is consistent with the large value of W in both systems.
6.4.6 TEM Observation
To confi rm the heterogeneous nucleation and the nanocellular features of foam processing, Okamoto et al. conducted TEM observation of the cell wall in the PLA/MMT-ODA foam.
Figure 6.26 shows a TEM micrograph for the structure of the cell wall foamed at 100°C under 28 MPa. Interestingly, the grown cells having a diameter of ~200 nm are localized along the dispersed nanoclay particles in the cell wall. In other words, the dispersed nanoclay particles act as nucle-ating sites for cell formation and the cell growth occurs on the surfaces of the clays; that is, the cellular structure has an oval-faced morphology
TABLE 6.7
Characteristic Interfacial Parameters of Two Systems
Tf (°C) �S()1/3 (mJ/m2) S() (°)
PLA/CO2 110 7.43
PLA/MMT-ODA/CO2 6.65 0.717 107.3
PLA/CO2 120 7.08
PLA/MMT-ODA/CO2 5.38 0.439 85.3
Source: From Ema, Y., Ikeya, M., and Okamoto, M. Polymer 47 (2006): 5350. © 2006 Elsevier
Science.
208 Polymeric Foams
61259_C006.indd 20861259_C006.indd 208 7/28/2008 11:30:59 AM7/28/2008 11:30:59 AM

rather than spherical cellular structures for high Tf conditions (~140°C). In Figure 6.26, in addition to the nanocellular structure formation, we can observe a lammellar pattern beside the nanoclay particles. This behavior appears to arise from the formation of the �-phase of the PLA crystal in the presence of nanoclay particles.41 This is a unique observation of the epitaxial crystallization of PLA grown up from clay surfaces due to the nucleation effect of the dispersed nanoclays.
6.4.7 Polycarbonate (PC)-Based Nanocomposite Foams
Figure 6.27 shows the typical results of SEM images of the fracture sur-faces of the PC/SMA blend (matrix) and PC-based nanocomposites foamed at 140°C under different isobaric saturation condition (10, 18, and 24 MPa).42 PC/SMA foams exhibit polygon closed-cell structures having pentagonal and hexagonal faces, which express the most energetically stable state of polygon cells. Obviously, under low saturation CO2 pressure (~10 MPa),
FIGURE 6.26 TEM micrograph for the structure of PLA/MMT-ODA cell wall foamed at
100°C under 28 MPa. (From Ema, Y., Ikeya, M., and Okamoto, M. Polymer 47 (2006): 5350.
© 2006, Elsevier Science.)
Nanostructure Development and Foam Processing 209
61259_C006.indd 20961259_C006.indd 209 7/28/2008 11:31:00 AM7/28/2008 11:31:00 AM

both PC/SMA/MAE1 and PC/SMA/MAE2.5 foams exhibit larger cell size compared with PC/SMA, indicating that dispersed clay particles hin-der CO2 diffusion by creating a maze or a more tortuous path.8 However, high CO2 pressure (~24 MPa) provides a large supply of CO2 molecules, which can subsequently form a large population of cell nuclei upon depressurization. The incorporation of nanoclay hinders CO2 diffusion and simultaneously induces heterogeneous nucleation because of a lower activation energy barrier compared with homogeneous nucleation.
In Figure 6.28, the relationship between d and Nc, and � and d are plot-ted. Equations 6.2 and 6.3 lead to these relations but some deviation occurs in each system. For example, PC/SMA/MAE2.5 (syn-FH-C18TM) (MMT � 1 weight-percentage) exhibits a smaller value of Nc under the same d value when compared with PC/SMA and PC/SMA/MAE1. For the relationship between � and Nc, PC/SMA/MAE2.5 (MMT � 2.5 weight-percentage) shows a large value of � compared with PC/SMA/MAE1. These deviations indicate that the heterogeneous cell distribution mechanism due to the rigid matrix phases in PC/SMA is caused by high MAE loading (MMT � 2.5–5.0 weight-percentage) as seen in Figure 6.28. As well as PLA-based nanocomposite foams, in Table 6.8, the interfacial tension and energy reduction factor of systems are summarized.42
The interfacial tension of PC/SMA/MAE1 (including energy reduction factor S(�)) and PC/SMA (S(�) � 1) are 9.7 mJ/m2 and 10.9 mJ/m2 at 14 MPa, respectively. These estimated values of � are of the same order of magnitude compared with the PLA system (5–7 mJ/m2). The interfacial tension slightly decreases with an increase in clay content under the same
FIGURE 6.27 Typical SEM images of the fracture surfaces of the PC/SMA blend (matrix)
and PC-based nanocomposites foamed at 140°C under different isobaric condition (10, 18
and 24 MPa). (From Ito, Y., Yamashita, M., Okamoto, M. Macromolecular Materials Engineering
291 (2006): 773. © 2006 Wiley-VCH.)
210 Polymeric Foams
61259_C006.indd 21061259_C006.indd 210 7/28/2008 11:31:00 AM7/28/2008 11:31:00 AM

CO2 pressure conditions, indicating heterogeneous cell nucleation occurs easily with increasing clay content. The estimated reduction factor (S(�) � 0.3–0.8) is the same order compared with the foaming of PLA-based nanocomposites.35 The TEM micrograph of the structure of the cell wall foamed at 160°C is shown in Figure 6.29. The grown cells are local-ized along the dispersed nanoclay particles in the cell wall.
6.4.8 Mechanical Properties of Nanocomposite Foams
Figure 6.30 shows the relationship of relative modulus (Kf/Kp) against rela-tive density (�f/�p) of neat PLA and nanocomposite foams, taken in the parallel (a) and perpendicular (b) directions to the fl ow, respectively.
1000(a)
100
10
d/m
m
1
0.1
1000(b)
100
10
1
d/mm
1
0.1
105 107
–1/3
109 1011
Nc/cells.cm–31013 1015
0.1 1 10 100d /mm
1000
PC/SMAPC/SMA/MAE1PC/SMA/MAE2.5PC/SMA/MAE5
PC/SMAPC/SMA/MAE1PC/SMA/MAE2.5PC/SMA/MAE5
FIGURE 6.28 (a) Cell size versus cell density; and (b) cell wall thickness versus cell size for
PC/SMA and PC based nanocomposite foams. (From Ito, Y., Yamashita, M., Okamoto, M.
Macromolecular Materials Engineering 291 (2006): 773. © 2006 Wiley-VCH.)
Nanostructure Development and Foam Processing 211
61259_C006.indd 21161259_C006.indd 211 7/28/2008 11:31:00 AM7/28/2008 11:31:00 AM

FIGURE 6.29 TEM micrograph of the structure of the cell wall foamed at 160°C. (From
Ito, Y., Yamashita, M., and Okamoto, M. Macromolecular Materials Engineering 291 (2006): 773.
© 2006 Wiley-VCH.)
TABLE 6.8
Interfacial Tension [�S(�)1/3] Including Energy Reduction Factor [S(�)] of Systems
Systems � S()1/3 (mJ/m2) S()
PC/SMA-CO2 10.7 1.0
PC/SMA/MAE1-CO2 PCO2 � 10 MPa 8.6 0.53
PC/SMA/MAE2.5-CO2 8.0 0.42
PC/SMA-CO2 10.9 1.0
PC/SMA/MAE1-CO2 PCO2 � 14 MPa 9.7 0.72
PC/SMA/MAE2.5-CO2 9.9 0.77
PC/SMA-CO2 13.6 1.0
PC/SMA/MAE1-CO2 PCO2 � 18 MPa 10.2 0.42
PC/SMA/MAE2.5-CO2 9.2 0.30
PC/SMA-CO2 11.3 1.0
PC/SMA/MAE1-CO2 PCO2 � 22 MPa 12.4 —
PC/SMA/MAE2.5-CO2 8.0 0.36
Source: From Ito, Y., Yamashita, M., Okamoto, M. Macromolecular Materials Engineering
291 (2006): 773. © 2006 Wiley-VCH.
212 Polymeric Foams
61259_C006.indd 21261259_C006.indd 212 7/28/2008 11:31:00 AM7/28/2008 11:31:00 AM
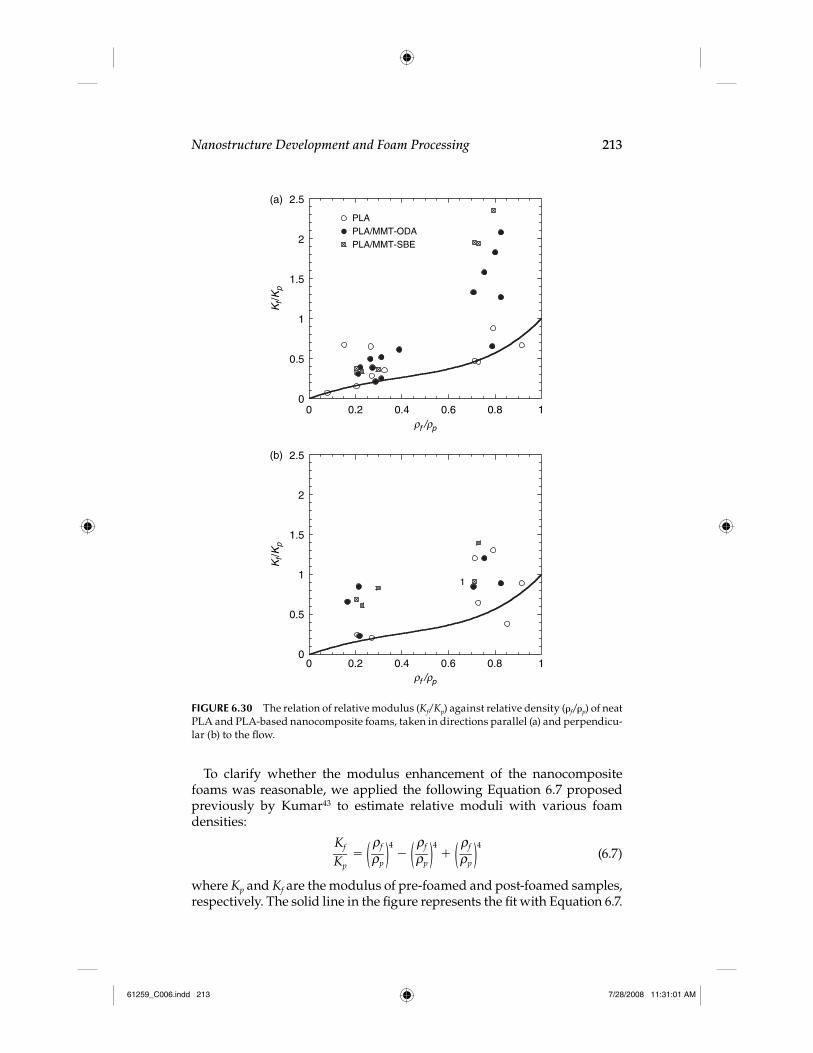
To clarify whether the modulus enhancement of the nanocomposite foams was reasonable, we applied the following Equation 6.7 proposed previously by Kumar43 to estimate relative moduli with various foam densities:
Kf
___ Kp � (
rf __ rp )
4
� ( rf
__ rp )
4
� ( rf
__ rp )
4 (6.7)
where Kp and Kf are the modulus of pre-foamed and post-foamed samples, respectively. The solid line in the fi gure represents the fi t with Equation 6.7.
2.5(a)
2
1.5
1
Kf/K
p
0.5
0
2.5(b)
2
1.5
1
Kf/K
p
0.5
0
0 0.2 0.4 0.6 0.8
PLAPLA/MMT-ODAPLA/MMT-SBE
1
1
0 0.2 0.4 0.6rf /rp
rf /rp
0.8 1
FIGURE 6.30 The relation of relative modulus (Kf/Kp) against relative density (�f/�p) of neat
PLA and PLA-based nanocomposite foams, taken in directions parallel (a) and perpendicu-
lar (b) to the fl ow.
Nanostructure Development and Foam Processing 213
61259_C006.indd 21361259_C006.indd 213 7/28/2008 11:31:01 AM7/28/2008 11:31:01 AM

The neat PLA foams do not show any difference between the two moduli (a) and (b). On the other hand, for PLACN foams, the relative moduli exhibit a large value compared with the theoretical one. The dispersed clay particles in the cell wall align along the thickness direction of the sample. In other word, the clay particles arrange owing to the biaxial fl ow of material during foaming. The clay particles seem to act as a secondary cloth layer to protect the cells from being destroyed by external forces. In the directions perpendicular to the fl ow, the relative modulus of PLA/MMT-ODA and PLA/MMT-SBE foams appear higher than the predicted value even at the same relative mass density in the range 0.7–0.85 (see Figure 6.30a). This upward deviation suggests that the small cell size with large cell density enhances the material property as predicted by Weaire.44 This may create the improvement of mechanical properties for polymeric foams through polymeric nanocomposites. More detailed surveys on various types of nanocomposite foaming can be also be found in the literatures.45–48
6.4.9 Porous Ceramic Materials Via Nanocomposite
A new route for the preparation of porous ceramic material from ther-mosetting epoxy/clay nanocomposite was fi rst demonstrated by Brown et al.49 This route offers attractive potential for diversifi cation and appli-cation of the PLFNCs. Okamoto and coworkers have reported the results on the novel porous ceramic material via burning of the PLA/MMT sys-tem (PLACN).50 The PLACN contained 3.0 weight-percentage inorganic clay. The SEM image of the fracture surface of porous ceramic material prepared from simple burning of the PLACN in a furnace of up to 950°C is shown in Figure 6.31. After complete burning, as seen in the fi gure, the PLACN becomes a white mass with a porous structure. The bright lines in the SEM image correspond to the edge of the stacked silicate layers. In the porous ceramic material, the silicate layers form a house-of-cards structure, which consist of the large plates having a length of ~1000 nm and thickness of ~30–60 nm. This implies that the further stacked plate-let structure is formed during burning. The material exhibits the open-cell type structure having a 100–1000 nm diameter void, a BET surface area of 31 m2 g�1 and a low density of porous material of 0.187 g ml�1 esti-mated by the buoyancy method. The BET surface area value of MMT (780 m2/g) and that of the porous ceramic material (31 m2/g), suggests about 25 MMT plates stacked together. When MMT is heated above 700°C (but below 960°C) all OH groups are fi rst eliminated from the structure and thus MMT is decomposed into that of a non-hydrated aluminosilicate. This transformation radically disturbs the crystalline network of the MMT, and the resulting diffraction pattern is indeed often typical of an amorphous (or non-crystalline) phase. The estimated rough value of the compression modulus (K) is of the order of ~1.2 MPa, which is fi ve orders of magnitude lower than the bulk modulus of MMT
214 Polymeric Foams
61259_C006.indd 21461259_C006.indd 214 7/28/2008 11:31:01 AM7/28/2008 11:31:01 AM

(~102 GPa).28 In the stress–strain curve, the linear deformation behavior is nicely described in the early stage of the deformation; that is, the deformation of the material closely resembles that of ordinary polymeric foams.51 This open-cell type porous ceramic material consisting of the house-of-cards structure is expected to provide strain recovery and an excellent energy dissipation mechanism after unloading in the elastic region up to 8% strain, probably each plate bend like leaf spring. This porous ceramic material is a new material possessing elastic feature and is very lightweight. This new route for the preparation of porous ceramic material via burning of nanocomposites can be expected to pave the way for a much broader range of applications of the PLSNCs. This porous ceramic material provides an excellent insulator fl ame retardant property for PLFNCs.28 The fl ame behavior must be derived from the morphological control of the shielding properties of the graphitic/clay created during polymer ablation.
6.5 Conclusions and Future Prospects
Development of nanocomposite foams is one of the latest evolutionary technologies of polymeric foams. The nanocomposite foams offer attrac-tive potential for diversifi cation and application of conventional polymeric
FIGURE 6.31 SEM image of porous ceramic material after coated with platinum layer
(~10 nm thickness). (From Cao, X., Lee, L. J., Widya, T., and Macosko, C. Polymer 46 (2005): 775.
© 2002 American Chemical Society.)
Q2
Nanostructure Development and Foam Processing 215
61259_C006.indd 21561259_C006.indd 215 7/28/2008 11:31:01 AM7/28/2008 11:31:01 AM

materials. Some of them are already commercially available and applied in industrial products through Unitika Ltd., Japan, and open a new dimen-sion for plastics and composite foams. The major impact will be at least a decade away.
References
1. Sinha Ray, S. and Okamoto, M. Progress in Polymer Science 28 (2003): 1539. 2. Usuki, A., Kojima, Y., Okada, A., Fukushima, Y., Kurauchi, T., and Kamigaito,
O. Journal of Material Research 8 (1993): 1174. 3. Gao, F. Materials Today 7 (2004): 50. 4. Usuki, A., Hasegawa, N., and Kato, M. Advances in Polymer Science 179 (2005):
135. 5. Okamoto, M., Nam, P. H., Maiti, M., et al. Nano Letters 1 (2001): 503. 6. Nam, P. H., Okamoto, M., Maiti, P., et al. Polymer Engineering Science 42 (2002):
1907. 7. Fujimoto, Y., Sinha Ray, S., Okamoto, M., Ogami, A., and Ueda, K.
Macromolecular Rapid Communications 24 (2003): 457. 8. Mitsunaga, M., Ito, Y., Sinha Ray, S., Okamoto, M., and Hironaka, K.
Macromolecular Materials Engineering 288 (2003): 543. 9. Vaia, R. A., Ishii, H, and Giannelis, E. P. Chemistry of Materials 5 (1993): 1694. 10. Vaia, R. A., Giannelis, E. P. Macromolecules 30 (1997): 7990. 11. Vaia, R. A., Giannelis, E. P. Macromolecules 30 (1997): 8000. 12. Hiroi, R., Sinha Ray, S., Okamoto, M., Shiroi, T. Macromolecular Rapid
Communications 25 (2004): 1359. 13. Lagaly, G. Clay Minerals 16 (1970): 1. 14. Nakano, S., Sasaki, T., Takemura, K., Watanabe, M. Chemistry of Materials
10 (1998) 2044–2046. 15. Tateyama, H., Nishimura, S., Tsunematsu, K., Jinnai, K., Adachi, Y., and
Kimura, M. Clay Minerals 40 (1992): 180–185. 16. Yoshida, O. and Okamoto, M. Macromolecular Rapid Communications 27
(2006): 751. 17. Sinha Ray, S., Yamada, K., Okamoto, M. and Ueda, K. Journal of Nanoscience
and Nanotechnology 3 (2003): 503–510. 18. Yoshida, O. and Okamoto, M. Journal of Polymer Engineering (in press). 19. Sinha Ray, S., Yamada, K., Okamoto, M., Ogami, A., and Ueda, K. Chemistry
of Materials 15 (2003): 1456–1465. 20. Saito, T., Okamoto, M., Hiroi, R., Yamamoto, M., and Shiroi, T. Macromolecular
Materials Engineering 291 (2006): 1367. 21. Saito T., Okamoto M., Hiroi R., Yamamoto M., and Shiroi T., Macromolecular
Rapid Communications 27 (2006): 1472. 22. Totha, R., Coslanicha, A., Ferronea, M. et al. Polymer 45 (2004): 8075. 23. Sinsawat, A., Anderson, K. L., Vaia, R. A., and Farmer, B. L. Journal of Polymer
Science Part B: Polymer Physics 41 (2003): 3272.
Q3
Q4
216 Polymeric Foams
61259_C006.indd 21661259_C006.indd 216 7/28/2008 11:31:01 AM7/28/2008 11:31:01 AM

24. Kuppa, V., Menakanit, S., Krishnamoorti, R., and Manias, E. J. Journal of Polymer Science Part B: Polymer Physics 41 (2003): 3285.
25. Zeng, Q. H., Yu, A. B., Lu, G. Q., and Standish, R. K. Chemistry of Materials 15 (2003): 4732.
26. Sheng, N., Boyce, M. C., Parks, D. M., Rutledge, G. C., Abes, J. I., and Cohen, R. E. Polymer 45 (2004): 487.
27. Okamoto, M., Nam, P. H., Maiti, P., Kotaka, T., Hasegawa, N., and Usuki, A. Nano Letters 1 (2001) 295.
28. Okamoto, M. “Polymer/Layered Silicate Nanocomposites.” Rapra Review Report No. 163, Rapra Technology Ltd, London, 2003. 166 pp.
29. Maiti, P. and Okamoto, M. Macromolecular Materials Engineering 288 (2003): 440. 30. Nam, P. H. MSc thesis, Toyota Technological Institute, 2001. 31. Sinha Ray, S., Okamoto, K., and Okamoto, M. Macromolecules 36 (2003):
2355. 32. van Olphen, H. An Introduction to Clay Colloid Chemistry. Wiley, New York,
1977. 33. Fratzl, P. Current Opinion in Colloid Interface Science 8 (2003): 32. 34. Taki, K., Yanagimoto, T., Funami, E., Okamoto, M., and Ohshima, M. Polymer
Engineering Science 44 (2004): 1004. 35. Ema, Y., Ikeya, M., and Okamoto, M. Polymer 47 (2006): 5350. 36. Colton, J. S. and Suh, N. P. Polymer Engineering Science 27 (1987): 485. 37. Takada, M. Crystallization Control and Foam Processing of Semi-crystalline
Polymers via Supercritical CO2. PhD thesis, Kyoto University, 2004. 38. Goel, S. K. and Beckman, E. J. Polymer Engineering Science 34 (1994): 1137. 39. Fletcher, N. H. Journal of Chemical Physics 29 (1958): 572. 40. Shen, J., Zeng, C., and Lee, L. J. Polymer 46 (2005): 5218. 41. Nam, J. Y., Sinha, S. R., and Okamoto, M. Macromolecules 36 (2003): 7126. 42. Ito, Y., Yamashita, M., and Okamoto, M. Macromolecular Materials Engineering
291 (2006): 773. 43. Kumar, V. and Weller, J. E. ANTEC 1401 (1991). 44. Weaire, D. and Fu, T. L. Journal of Rheology 32 (1988): 271. 45. Lee, L. J., Zeng, C., Cao, X., Han, X., Shen, J., and Xu, G. Composites Science
and Technology 65 (2005): 2344. 46. Cao, X., Lee, L. J., Widya, T., and Macosko, C. Polymer 46 (2005): 775. 47. Chandra, A., Gong, S., Turng, L. S., Gramann, P., and Cordes, H. Polymer
Engineering Science 45 (2005): 52. 48. Strauss, W., D’Souza, N. A. Journal of Cellular Plastics 40 (2004): 229. 49. Brown, J. M., Curliss, D. B., and Vaia, R. A. Proceedings of the Polymer Materials
Science Engineering Spring Meeting, San Francisco, 2000, p. 278. 50. Sinha Ray, S., Okamoto, K., Yamada, K., and Okamoto, M. Nano Letters
2 (2002): 423. 51. Gibson, L. J. and Ashby, M. F. (eds) Cellular Solids. Pergamon Press,
New York, 1988, p. 8.
Q5
Q6
Nanostructure Development and Foam Processing 217
61259_C006.indd 21761259_C006.indd 217 7/28/2008 11:31:01 AM7/28/2008 11:31:01 AM

61259_C006.indd 21861259_C006.indd 218 7/28/2008 11:31:01 AM7/28/2008 11:31:01 AM