![Fluorescence Nanoscopy TIRF 4-pi STED STORM/PALMbi177/private/L13_handout.pdf · Microsoft PowerPoint - L13_0227_STED_STORM.ppt [Compatibility Mode] Author: dani Created Date: 2/29/2012](https://static.fdocuments.in/doc/165x107/5f75fde950d7c62043404f31/fluorescence-nanoscopy-tirf-4-pi-sted-storm-bi177privatel13handoutpdf-microsoft.jpg)
Nanoscopy with Focused Light - Kapitza Insitute for ...glazkov/students/Nobel-hell-lecture.pdf ·...
29
159 Nanoscopy with Focused Light Nobel Lecture, December 8, 2014 by Stefan W. Hell Max Planck Institute for Biophysical Chemistry, Department of NanoBiophotonics, Am Fassberg 11, 37077 Göttingen, Germany & German Cancer Research Center (DKFZ), Optical Nanoscopy Division, Im Neuenheimer Feld 280, 69120 Heidelberg, Germany. W e are all familiar with the sayings “a picture is worth a thousand words” and “seeing is believing.” Not only do they apply to our daily lives, but certainly also to the natural sciences. erefore, it is probably not by chance that the historical beginning of modern natural sciences very much coincides with the invention of light microscopy. With the light microscope, mankind was able to see for the first time that every living being consists of cells as basic units of structure and function; bacteria were discovered with the light microscope, and also mitochondria as examples of subcellular organelles. However, we learned in high school that the resolution of a light micro- scope is limited to about half the wavelength of the light in use [1–4], which typically amounts to about 200–350 nanometres (Fig. 1). If we want to see de- tails of smaller things, such as viruses, we have to resort to electron microscopy. Electron microscopy has achieved a much higher spatial resolution—ten-fold, hundred-fold or even thousand-fold higher; in fact, down to the size of a single molecule. erefore the question comes up: Why do we bother with the light mi- croscope and its spatial resolution, now that we have the electron microscope? e answer to this question is given in Fig. 2, where I’ve conducted a small “experiment.” I counted the numbers of papers published in this issue of Nature Medicine where a light microscope was used, and where an electron microscope was used. e clear winner was light microscopy, which has remained the most popular microscopy technique in the life sciences. is is for two strong reasons.
Transcript of Nanoscopy with Focused Light - Kapitza Insitute for ...glazkov/students/Nobel-hell-lecture.pdf ·...

159
Nanoscopy with Focused LightNobel Lecture, December 8, 2014
by Stefan W. HellMax Planck Institute for Biophysical Chemistry, Department of NanoBiophotonics, Am Fassberg 11, 37077 Göttingen, Germany & German Cancer Research Center (DKFZ), Optical Nanoscopy Division, Im Neuenheimer Feld 280, 69120 Heidelberg, Germany.
W e are all familiar with the sayings “a picture is worth a thousand words” and “seeing is believing.” Not only do they apply to our daily lives, but
certainly also to the natural sciences. Therefore, it is probably not by chance that the historical beginning of modern natural sciences very much coincides with the invention of light microscopy. With the light microscope, mankind was able to see for the first time that every living being consists of cells as basic units of structure and function; bacteria were discovered with the light microscope, and also mitochondria as examples of subcellular organelles.
However, we learned in high school that the resolution of a light micro-scope is limited to about half the wavelength of the light in use [1–4], which typically amounts to about 200–350 nanometres (Fig. 1). If we want to see de-tails of smaller things, such as viruses, we have to resort to electron microscopy. Electron microscopy has achieved a much higher spatial resolution—ten-fold, hundred-fold or even thousand-fold higher; in fact, down to the size of a single molecule. Therefore the question comes up: Why do we bother with the light mi-croscope and its spatial resolution, now that we have the electron microscope?
The answer to this question is given in Fig. 2, where I’ve conducted a small “experiment.” I counted the numbers of papers published in this issue of Nature Medicine where a light microscope was used, and where an electron microscope was used. The clear winner was light microscopy, which has remained the most popular microscopy technique in the life sciences. This is for two strong reasons.

160 The Nobel Prizes
The first reason is that light microscopy is the only way in which we can look inside a living cell, or even living tissues, in three dimensions; it is minimally invasive. But, there is another reason. When we look into a cell, we are usually interested in a certain species of proteins or other biomolecules, and we have to make this species distinct from the rest—we have to “highlight” those proteins [5]. This is because, to light or to electrons, all the proteins look the same.
In light microscopy this “highlighting” is readily feasible by attaching a fluo-rescent molecule to the biomolecule of interest [6]. Importantly, a fluorescent molecule (Fig. 2, [7]) has, among others, two fundamental states: a ground state and an excited fluorescent state with higher energy. If we shine light of a suitable wavelength on it, for example green light, it can absorb a green photon so that the molecule is raised from its ground state to the excited state. Right afterwards the atoms of the molecule wiggle a bit—that is why the molecules have vibra-tional sub-states—but within a few nanoseconds, the molecule relaxes back to the ground state by emitting a fluorescence photon.
Because some of the energy of the absorbed (green) photon is lost in the wiggling of the atoms, the fluorescence photon is red-shifted in wavelength, shown as orange in Fig. 2. This is actually very convenient, because we can now
FIGURE 1. Length scales and spatial resolution limits of visual inspection (human eye), light (optical) microscopy and electron microscopy. Far-field optical nanoscopy extends the resolution much beyond Abbe’s limit of half the wavelength of light used (~200 nanometres).

Nanoscopy with Focused Light 161
easily separate the fluorescence from the excitation light, the light with which the cell is illuminated. This shift in wavelength makes fluorescence microscopy extremely sensitive. In fact, it can be so sensitive that one can detect a single molecule, as has been discovered through the works of my co-laureate W. E. Moerner [8], of Michel Orrit [9] and their co-workers.
However, if a second molecule, a third molecule, a fourth molecule, a fifth molecule and so on are positioned closer together than about 200–350 nano-metres, we cannot tell them apart, because they appear in the microscope as a single blur. Therefore, it is important to keep in mind that resolution is about telling features apart; it is about distinguishing them. Resolution must not be confused with sensitivity of detection, because it is about seeing different fea-tures as separate entities.
Now it is easy to appreciate that a lot of information is lost if we look into a cell with a fluorescence microscope: anything that is below the scale of 200 nanometres appears blurred. Consequently, if one manages to come up with a focusing (far-field) fluorescence microscope which has a much higher spatial resolution, this would have a tremendous impact in the life sciences and beyond.
In a first step, we have to understand why the resolution of a conventional light-focusing microscope is limited. In simple terms it can be explained as
FIGURE 2. Light microscopy remains the most popular microscopy method in the life sciences, due to a number of distinct advantages such as live-cell imaging and biomo-lecular specificity. The latter is provided by labelling the biomolecules of interest with fluorescent markers, allowing their species-specific detection in the microscope.

162 The Nobel Prizes
follows. The most important element of a light microscope is the objective lens (Fig. 3). The role of this objective lens is simply to concentrate the light in space, to focus the light down to a point. However, because light propagates as a wave, it is not possible for the lens to concentrate the light in a single point. Rather the light will be diffracted, “smeared out” in the focal region, forming a spot of light which is—at minimum—about 200 nanometres wide and about 500 nanome-tres along the optical axis [10]. This has a major consequence: if several features fall within this region, they will all be flooded with this light at the same time and hence produce signals simultaneously. In the case of fluorescence micros-copy, this is the excitation light. As we try to detect the fluorescence signal with a lens and relay it onto a detector, the signals produced by the molecules within this >200-nanometre spot will be confused. This is because at the detector, each molecule will also produce a spot of focused (fluorescence) light and the spots from these simultaneously illuminated molecules will overlap (Fig. 3). No de-tector will be able to tell the signal from these molecules apart, no matter if it is the eye, a photo-multiplier or even a pixelated camera.
The person who fully appreciated that diffraction poses a serious limit on resolution was Ernst Abbe (Fig. 4), who lived at the end of the 19th century and
FIGURE 3. Focusing of light by the microscope (objective) lens cannot occur more tightly than Abbe’s limit. As a result, all molecules within this diffraction-limited region are il-luminated together, emit virtually together, and cannot be told apart.
Nanoscopy with Focused Light 163
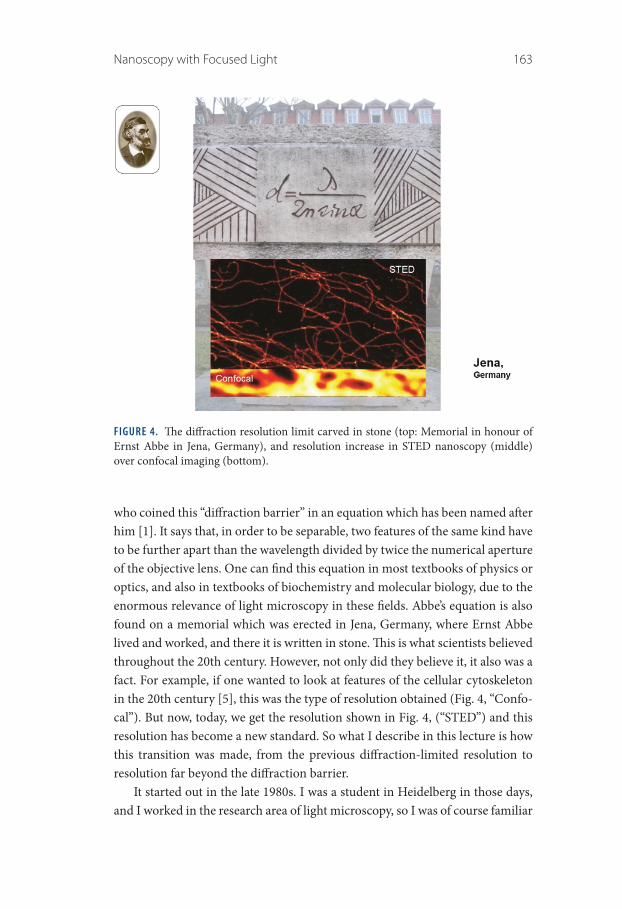
who coined this “diffraction barrier” in an equation which has been named after him [1]. It says that, in order to be separable, two features of the same kind have to be further apart than the wavelength divided by twice the numerical aperture of the objective lens. One can find this equation in most textbooks of physics or optics, and also in textbooks of biochemistry and molecular biology, due to the enormous relevance of light microscopy in these fields. Abbe’s equation is also found on a memorial which was erected in Jena, Germany, where Ernst Abbe lived and worked, and there it is written in stone. This is what scientists believed throughout the 20th century. However, not only did they believe it, it also was a fact. For example, if one wanted to look at features of the cellular cytoskeleton in the 20th century [5], this was the type of resolution obtained (Fig. 4, “Confo-cal”). But now, today, we get the resolution shown in Fig. 4, (“STED”) and this resolution has become a new standard. So what I describe in this lecture is how this transition was made, from the previous diffraction-limited resolution to resolution far beyond the diffraction barrier.
It started out in the late 1980s. I was a student in Heidelberg in those days, and I worked in the research area of light microscopy, so I was of course familiar
FIGURE 4. The diffraction resolution limit carved in stone (top: Memorial in honour of Ernst Abbe in Jena, Germany), and resolution increase in STED nanoscopy (middle) over confocal imaging (bottom).

164 The Nobel Prizes
with Abbe’s equation. I began wondering: This equation was coined in 1873, and yet it is now 1990. So much new physics emerged during the 20th century and so many new phenomena were discovered—as a matter of fact, I had to learn so much for my examinations! There should be phenomena—at least one—that could be utilised to overcome the diffraction barrier in a light microscope oper-ating with propagating beams of light and regular lenses. Well, I understood that it won’t work just by changing the way the light is propagating, the way the light is focused. [Actually I had looked into that; it led me to the invention of the 4Pi microscope [11, 12], which improved the axial resolution, but did not overcome Abbe’s barrier.] I was convinced that a potential solution must have something to do with the major discoveries of the 20th century: quantum mechanics, mol-ecules, molecular states and so on.
Therefore, I started to check my textbooks again in order to find something that could be used to overcome the diffraction barrier in a light-focusing mi-croscope. One day I put my ideas about solving the problem down in writing (Fig. 5). In simple terms, the idea was to check out the spectroscopic proper-ties of fluorophores, their state transitions, and so on, specifically to solve the resolution problem. Until then, they had been used only for fluorescence signal
FIGURE 5. Realisation in the early 1990s that the key to surpassing the diffraction resolu-tion limit lies in fluorophore properties (quote from a manuscript submitted in 1993, top). The photograph (bottom) shows page 20 of the book The Quantum Theory of Light by Rodney Loudon (Oxford Science Publications), where I found a reminder of the phe-nomenon of stimulated emission, which I of course knew about from my physics studies, on Saturday morning, November 6, 1993. My copy of the book is now on display at the Nobel Museum, Stockholm.

Nanoscopy with Focused Light 165
generation or to measure pH or Calcium concentration, etc. But maybe there was a property that could be used for the purpose of making Abbe’s barrier obsolete. Alternatively, there could be a quantum-optical effect whose potential has not been realised, simply because nobody thought about overcoming the diffraction barrier [13].
With these ideas in mind, one day when I was not very far from here in Åbo/Turku, just across the Gulf of Bothnia, on a Saturday morning, I browsed a textbook on quantum optics [14] and stumbled across the page shown in Fig. 5. It dealt with stimulated emission. All of a sudden I was electrified. Why?
To reiterate, the problem is that the lens focuses the light in space, but not more tightly than 200 nanometres. All the features within the 200-nanometre region are simultaneously flooded with excitation light. This cannot be changed, at least not when using conventional optical lenses. But perhaps we can change the fact that all the features, which are flooded with (excitation) light are, in the end, capable of sending light (back) to the detector. If we manage to keep some of the molecules dark—to be precise, in a state in which they are not able to send light to the detector—we will see only the molecules that can, i.e. those in the bright state. Hence, by registering bright-state molecules as opposed to dark-state molecules, we can tell molecules apart. So the idea was to keep a fraction of the molecules residing in the same diffraction area in a dark state, for the period of time in which the molecules residing in this area are detected. In any case, keep in mind: the state (transition) is the key to making features distinct. And resolution is about discerning features.
For this reason, the question comes up: are there dark states in a fluorescent molecule? The answer has actually been given in the energy diagram shown in Fig. 2, reiterated in Fig. 6b. The ground state of the fluorophore is a dark state! For the molecule to emit fluorescence, the molecule has to be in its excited state. So the excited state is the bright state, but the ground state is, of course, a dark state.
What is now the role of stimulated emission? Actually, the answer is as sim-ple as profound: it makes dark molecules, that is, molecules that are not seen by the detector! This was the reason why I was so excited. I had found a way to make normal fluorophores not fluoresce, just normal fluorophores that were commonly used in fluorescence microscopy. And now you can easily envisage how the microscope works: stimulated emission depletion—or: STED—mi-croscopy [15–23]. Fig. 7a sketches the lens, the critical component of a far-field optical microscope, as well as a sample and a detector. We use a beam of light for exciting molecules from the ground state to the excited state, to make them bright (‘ON’), i.e. get them to the excited state. Inevitably, the excitation light

166 The Nobel Prizes
FIGURE 6. Switching molecules within the diffraction-limited region “off ” enables the separate detection of neighbouring molecules residing within the same diffraction re-gion. (a) In fluorescence microscopy operating with conventional lenses (e.g. confocal microscopy), all molecules within the region covered by the main diffraction maximum of the excitation light are flooded with excitation light simultaneously and emit fluores-cence together. This is because they are simultaneously allowed to assume the fluorescent (signalling) state. (b) Keeping most molecules—except the one(s) one aims to register—in a dark state solves the problem. The dark state is a state from which no signal is pro-duced at the detector. Such a transition to the dark “off ” state is most simply realised by inducing stimulated emission, which instantaneously forces molecules to their dark (“off ”) ground state.

Nanoscopy with Focused Light 167
will be diffracted and one obtains a spot of light of at least 200 nanometres. Sig-nal which is produced therein, from all the molecules, will be able to end up at the detector. But now, we use a second beam of light which induces stimulated emission, and thus makes dark-state molecules. The idea is to instantly “push” the molecules that were excited back down to the ground state so that the mol-ecule is not capable of emitting light, because it has assumed the dark ground state (‘OFF’).
The physical condition for achieving this is that the wavelength of the stimu-lating beam is longer (Fig. 7c). The photons of the stimulating beam have a lower energy, so as not to excite molecules but to stimulate the molecules going from the excited state back down to the ground state. There is another condition, however: we have to ensure that there is indeed a red photon at the molecule which pushes the molecule down. I am saying this because most photons pass by the molecules, as there is a finite interaction probability of the photon with
FIGURE 7. STED microscopy. (a) Setup schematic. (b) Region where the molecule can occupy the “on” state (green) and where it has to occupy the “off ” state (red). (c) Mo-lecular transitions. (d) For intensities of the STED light (red) equalling or in excess of the threshold intensity Is, molecules are effectively switched “off.” This is because the STED light will always provide a photon that will stimulate the molecule to instantly assume the ground state, even in the presence of excitation light (green). Thus, the presence of STED light with intensity greater than Is switches the ability of the molecules to fluoresce off.

168 The Nobel Prizes
a molecule, i.e. a finite cross-section of interaction. But if one applies stimulat-ing light at an intensity above a certain threshold, one can be sure that there is at least one photon which “kicks” the molecule down to the ground state, thus making it instantly assume the dark state.
Fig. 7d shows the probability of the molecule assuming the bright state, the S1, in the presence of the STED beam transferring the molecule to the dark ground state. Beyond a certain threshold intensity, Is, the molecule is clearly turned “off.” One can apply basically any intensity of green light. Yet, the mol-ecule will not be able to occupy the bright state and thus not signal. Now the approach is clear: we simply modify this red beam to have a ring shape in the focal plane [19, 24], such that it does not carry any intensity at the centre. Thus, we can turn off the fluorescence ability of the molecules everywhere but at the centre. The ring or “doughnut” becomes weaker and weaker towards the centre, where it is ideally of zero intensity. There, at the centre, we will not be able to turn the molecules off, because there is no STED light, or it is much too weak.
Now let’s have a look at the sample (Fig. 7b) and let us assume that we want to see just the fibre in the middle. Therefore, we have to turn off the fibre to its left and the one to its right. What do we do? We cannot make the ring smaller, as it is also limited by diffraction. Abbe would say: “Making narrower rings of light is not possible due to diffraction.” But we do not have to do that. Rather, we simply have to “shut off ” the molecules of the fibres that we do not want to see, that is, we make their molecules dwell in a dark state, until we have recorded the signal from that area. Obviously, the key lies in the preparation of the states. So what do we do? We make the beam strong enough so that the molecules even very close to the centre of the ring are turned “off ” because they are effectively confined to the ground state all the time. This is because, even close to the centre of the ring, the intensity is beyond the threshold Is in absolute terms.
Now we succeed in separation: only in the position of the doughnut centre are the molecules allowed to emit, and we can therefore separate this signal from the signal of the neighbouring fibres. And now we can acquire images with sub-diffraction resolution: we can move the beams across the specimen and separate each fibre from the other, because their molecules are forced to emit at differ-ent points in time. We play an “on/off game.” Within the much wider excitation region, only a subset of molecules that are at the centre of the doughnut ring are allowed to emit at any given point in time. All the others around them are effectively kept in the dark ground state. Whenever one makes a check which state they are in, one will nearly always find those molecules in the ground state.
This concept turned out to work very well [17, 19, 23, 25]. Fig. 8a contains a standard, high-end confocal recording of something which one cannot make

Nanoscopy with Focused Light 169
out what it is. Fig. 8b shows the same region imaged using STED microscopy. The resolution is increased by about an order of magnitude (in the red channel), and one can clearly discern what is actually being imaged here: nuclear pore complexes. As a result of the high resolution, you can see that this nuclear pore complex features eight molecular subunits. The eight-fold symmetry comes out very clearly [25]. There is almost no comparison with the standard confocal recording.
Needless to say, if afforded this increase in spatial resolution, one obtains new information. In other words, new insights are gained with this microscope. I briefly describe research done in collaboration with virologists interested in human immunodeficiency virus (HIV). Generally, viruses are about 30 to 150 nanometre in diameter [5]. So, if one wants to image them with a light micro-scope . . . there is no chance this will succeed—one will not see any details of protein distributions on the virus particles. A diffraction-limited fluorescence microscope would yield just a 250–350 nanometre sized fluorescence blur. The
FIGURE 8. Nuclear pore complex architecture in an intact cell nucleus imaged by (a) con-focal microscopy (diffraction-limited), and (b) STED nanoscopy.

170 The Nobel Prizes
human immunodeficiency virus (HIV) is about 140 nm in size. The scientists collaborating with us were interested in finding out how a protein called Env is distributed on the HIV particle [26], Fig. 9. In the normal recording, nothing specific is seen. In contrast, the high-resolution STED recording revealed that the protein Env forms patterns on the HIV particles. What has actually been found out in this study is that the mature HIV particles—those which are ready to infect the next cell—have the Env concentrated basically in a single place on the virus. It seems to be a requirement for HIV to be very effective. This is an example how new mechanistic insight was gained as a result of subdiffraction-resolution imaging.
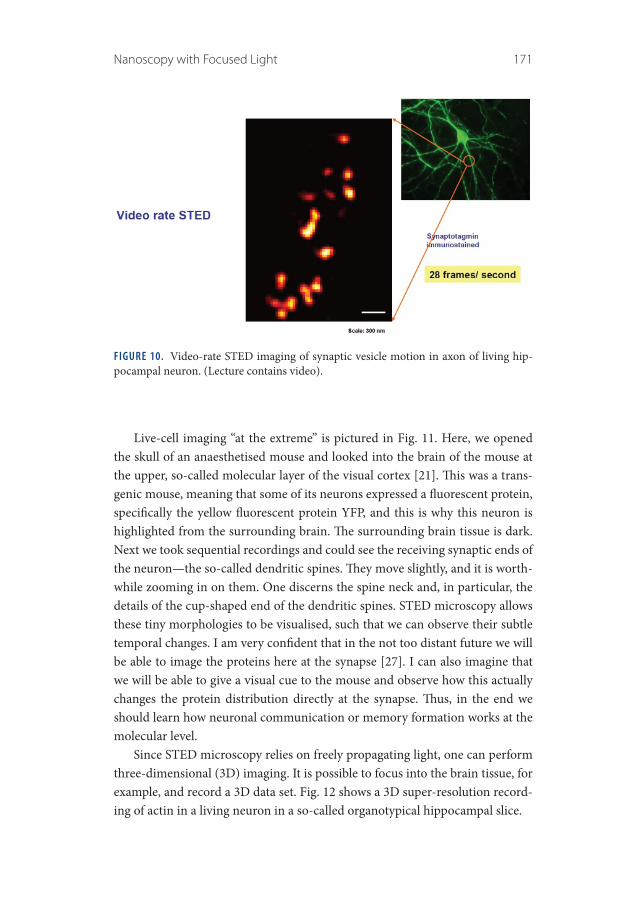
Of course, one strength of light microscopy is that we can image living cells. Figure 10, shows a video-rate recording with STED microscopy. These are synaptic vesicles in the axon of a living neuron [20]. One can directly see how they move about and we can study their dynamics and their fate over time. It is clearly important to be able to image living cells.
FIGURE 9. STED nanoscopy of the HIV Envelope protein Env on single virions. Confocal microscopy is not able to reveal the nanoscale spatial distribution of the Env proteins; the images of the Env proteins on the virus particles look like 250–350 nm sized blurred spots (orange, left column). STED microscopy reveals that the Env proteins form spatial patterns (centre column, orange), with mature particles having their Env strongly con-centrated in space (panel in top row of centre column, orange).
Nanoscopy with Focused Light 171
Live-cell imaging “at the extreme” is pictured in Fig. 11. Here, we opened the skull of an anaesthetised mouse and looked into the brain of the mouse at the upper, so-called molecular layer of the visual cortex [21]. This was a trans-genic mouse, meaning that some of its neurons expressed a fluorescent protein, specifically the yellow fluorescent protein YFP, and this is why this neuron is highlighted from the surrounding brain. The surrounding brain tissue is dark. Next we took sequential recordings and could see the receiving synaptic ends of the neuron—the so-called dendritic spines. They move slightly, and it is worth-while zooming in on them. One discerns the spine neck and, in particular, the details of the cup-shaped end of the dendritic spines. STED microscopy allows these tiny morphologies to be visualised, such that we can observe their subtle temporal changes. I am very confident that in the not too distant future we will be able to image the proteins here at the synapse [27]. I can also imagine that we will be able to give a visual cue to the mouse and observe how this actually changes the protein distribution directly at the synapse. Thus, in the end we should learn how neuronal communication or memory formation works at the molecular level.
Since STED microscopy relies on freely propagating light, one can perform three-dimensional (3D) imaging. It is possible to focus into the brain tissue, for example, and record a 3D data set. Fig. 12 shows a 3D super-resolution record-ing of actin in a living neuron in a so-called organotypical hippocampal slice.
FIGURE 10. Video-rate STED imaging of synaptic vesicle motion in axon of living hip-pocampal neuron. (Lecture contains video).

172 The Nobel Prizes
FIGURE 11. STED nanoscopy in living mouse brain.
FIGURE 12. Rendition of three-dimensional STED nanoscopy data showing the dendritic actin from a neuron of a living organotypical hippocampal brain slice (mouse).
Coming back again to the basics, to the spatial resolution, some of you will ask: What is the resolution we can get? What is the limit? Indeed, is there a new limit? So let us get back to the principle. The “name of the game” is that we turn off molecules everywhere but at the intensity minimum, at the central zero, of the STED beam [28–31]. If we can make the region in which the molecules are

Nanoscopy with Focused Light 173
still allowed to emit smaller, the resolution is improved; that is clear. The extent (or diameter) of the region in which the molecules are still “on” now determines the spatial resolution. Clearly, it cannot be described by Abbe’s equation any more. In fact, this diameter must depend on the intensity I which is found at the doughnut crest (Fig. 13b,d) and on the threshold intensity Is, which is a charac-teristic of the photon-molecule interaction. The larger their ratio becomes, the smaller d will become. It is now easy to appreciate that this ratio must be found in the denominator, if we describe the resolution with a new equation which is now obviously required [23, 28, 29]. In fact, d scales inversely with the square root of I/Is. So the larger I/Is, the smaller is d. As a result, d tends to 0 for larger and larger values of I/Is (Fig. 13b,d).
In the situation depicted in Fig. 13b, we cannot separate two of the close-by molecules because both are allowed to emit at the same time. But let us make the beam a bit stronger, so that only one molecule “fits in” the region in which the molecules are allowed to be “on.” Now the resolution limit is apparent: it is the size of a molecule, because a molecule is the smallest entity one can separate.
FIGURE 13. Resolution scaling in the STED/RESOLFT concepts: an extension of Abbe’s equation. The resolution scales inversely with the square-root of the ratio between the maximum intensity at the doughnut crest and the fluorophore-characteristic threshold intensity Is.

174 The Nobel Prizes
This is not surprising! After all, we separate features by preparing their mol-ecules in two different states, and so it must be the molecule which is the limit of spatial resolution. When two molecules come very close together, we can sepa-rate them because at the time one of them is emitting, the other one is “off ” and vice versa [28, 30–32].
It is worth noting that if all the “off ” or dark molecules are entirely dark, de-tecting a single photon from a molecule is absolutely enough to know that there is a molecule present (at the minimum of the STED beam). The position of that molecule is entirely determined by the presence of the STED beam photons. These photons determine exactly where the molecule is “ON” and where it is “OFF” (dark). The detected fluorescence photons only indicate the presence of a molecule, or many of them [30–32].
Does one typically obtain molecular spatial resolution, and what about in a cell? For STED microscopy right now, the standard of resolution is between 20 and 40 nanometres depending on the fluorophore, and depending on the fluo-rophore’s chemical environment [25]. But this is something which is progress-ing; it is under continuous development. With fluorophores which have close-to-ideal properties and can be turned “on” and “off ” as many times as desired, we can do much better, of course.
In fact, there are such fluorophores—not organic ones, inorganic ones—which meet this requirement already. These are so-called charged nitrogen va-cancies in diamonds (Fig. 14), fluorescent defects in diamond crystals which can be turned on and off an almost unlimited number of times [33]. Imaging these, we managed to squeeze down the region of emission to 2.4 nanometres [34]. It is worth keeping in mind that the wavelength responsible for this result is 775 nanometres. So the region of emission is smaller than one per cent, a very small fraction of the wavelength.
This may look like a proof-of-principle experiment, and to some extent it is. But it is not just that, there is another reason why to perform these experiments [33, 35, 36]. The so-called charged nitrogen vacancies are currently regarded as attractive candidates for quantum computation: as qubits operating at room temperature [37, 38]. They possess a spin state with a very long coherence time even at room temperature, which can be prepared and read out optically. Being less than a nanometre in size, they can sense magnetic fields at the nanoscale [39, 40]. We inherently have nanosensors in here, and STED is perhaps the best way of reading out the state and the magnetic fields at the nanoscale. In the end, this could make STED an interesting candidate perhaps for reading out qubits in a quantum computer, or who knows . . . Development goes on!

Nanoscopy with Focused Light 175
Returning to the fundamentals, I emphasised that the name of the game is “on/off,” or keeping a fraction of the molecules dark for separation [30–32]. This is how we separate molecules, with a bright state and a dark state. Once it is clear that this is a general principle it is obvious that stimulated emission is not the only way by which we can play this “on/off game.” There must also be other “on” and “off ” states in a dye which one can use to the same effect [22, 28–30]. With this in mind, I browsed other textbooks and found that there are triplet states, long-lived dark states and, of course, in chemistry textbooks, one will find that there is photoinduced cis-trans isomerisation (Fig. 15). One might ask why use these special transitions that, unlike stimulated emission, are not found in abso-lutely any fluorophore, as special fluorophores are needed for this? After all, the transitions used in STED are truly basic: optical excitation and de-excitation. And the two states between which these transitions are induced are the most basic states imaginable, namely the ground and the first excited state.
FIGURE 14. Quasi-ideal fluorophores, in particular virtually unlimited repetitions of the resolution-enabling on-off state transitions, provide the present resolution records in far-field optical imaging using STED, in the single-digit nanometre regime. Color centres (charged nitrogen vacancy centres) in diamonds hold great potential for various other applications, notably in magnetic sensing and quantum information, which may be com-bined with diffraction-unlimited lens-based (far-field) optical readout.

176 The Nobel Prizes
Indeed, it turns out that there is a strong reason for looking into other types of states and state transitions. Consider the state lifetimes (Fig. 15). For the basic STED transition, the lifetime of the state, the excited state, is nanoseconds (Fig. 15a). For metastable dark states used in methods termed ground state depletion (GSD) microscopy [41–43] (Fig. 15b) the lifetime of the state is microseconds, and for isomerisation it is on the order of milliseconds (Fig. 15c). Why are these major increases in the utilised state lifetime relevant?
Well, just remember that we separate adjacent features by transferring their fluorescent molecules into two different states. But if the state—one of the states—disappears after a nanosecond, then the difference in states created dis-appears after a nanosecond. Consequently, one has to hurry up putting in the photons, creating this difference in states, as well as reading it out, before it dis-appears. But if one has more time—microseconds, milliseconds—one can turn molecules off, read the remaining ones out, turn on, turn off . . . ; they stay there, because their states are long-lived. One does not have to hurry up putting in the
FIGURE 15. States and state transitions utilised in (a) STED, (b) GSD and (c) RESOLFT nanoscopy. (d) The modified expression for the resolution describes the spatial region, in which molecules can still reside in the “on” state. (e) The intensity Is for guaranteeing the transition is inversely related to the state lifetime. The longer the lifetime of the involved states, the fewer photons per second are needed to establish the on-off state difference which is required to separate features residing within the diffraction barrier.

Nanoscopy with Focused Light 177
light, and this makes this “separation by states” operational at much lower light levels [28, 41].
To be more formal, the aforementioned intensity threshold Is scales in-versely with the lifetime of the states involved (Fig. 15e): the longer the lifetime, the smaller is the Is, and the diffraction barrier can be broken using this type of transition at much lower light levels. Is goes down from megawatts (STED), kilowatts (GSD) down to watts per square centimetre for millisecond switching times—a six orders of magnitude range [28]. This makes transitions between long-lived states very interesting, of course. Here in the equation (Fig. 15d), Is goes down and with that of course also I goes down because one does not need as many photons per second in order to achieve the same resolution d.
The cis-trans isomerisation is particularly interesting because it is found in switchable fluorescent proteins. We looked into this very early on starting from 2003, to check whether we can use it for a STED-like recording. Eventu-ally, I called it RESOLFT, for “Reversible Saturable/Switchable Optically Linear
FIGURE 16. Parallelisation of the STED/RESOLFT concept holds the key to faster imag-ing. The diffraction problem has to be addressed only for molecules residing within a diffraction-limited region. Thus, many intensity minima (‘doughnuts’) are produced, at mutual distances greater than the diffraction limit, for highly efficient scanning of large sample areas. The use of highly parallelised schemes is greatly facilitated by harnessing transitions between long-lived molecular on-off states, such as cis/trans.

178 The Nobel Prizes
(Fluorescence) Transitions” [28, 44–46], simply because I could not have called it STED anymore. There is no stimulated emission in there, which is why I had to give it a different name. The strength is not only that one can obtain high resolution at low light levels. Notably, one can use inexpensive lasers, continu-ous wave (CW) lasers, and/or spread out the light over a large field of view, because one does not need such intense light to switch the molecules. In this way, one can parallelise the recordings, meaning that one can make an array of many holes (intensity minima, zeros) at the same time and read out a large field of view quickly (Fig. 16). It does not matter that one has many of these intensity minima at the same time. As long as they are each further apart than Abbe’s diffraction barrier, they can be read out simultaneously by projecting the signal generated in this array of minima onto a camera. Only a few scanning steps in one direction and in the orthogonal direction, and a super-resolution image of a large field of view is taken. In Fig. 17 [47], a living cell was recorded within two seconds with more than 100,000 “doughnuts,” so to speak, in parallel.
Notwithstanding the somewhat different optical arrangement, the key is the molecular transition. Selecting the right molecular transition determines the parameters of imaging. The imaging performance, including the resolution and
FIGURE 17. Massively parallelised RESOLFT nanoscopy. Here, an array of ~114 000 in-tensity minima (zeros) was used to image a living cell in two seconds.

Nanoscopy with Focused Light 179
the contrast level, as well as other factors, is actually determined by the molecu-lar transition chosen [32].
Putting up the next question, what does it take to achieve the best resolu-tion? Now let us assume one had asked this question in the 20th century. What would have been the answer? Well, the answer was unquestionably: good lenses [10]. Sure, good lenses. Why? Because the separation of neighbouring features was performed by the focusing of light. And then, of course, one needs good lenses to produce the sharpest focal spot of light at the sample here, there, and everywhere, and/or the sharpest focal spot of light anywhere at the detector. However, once one cannot produce an even smaller focal spot of light, this strat-egy has come to an end (Fig. 18, top). Therefore, if one has several features fall-ing within a diffraction-limited spot of light, one simply cannot do any better. Resolution is definitely limited by diffraction if one separates features by the fo-cusing of light—no way to tell features, the molecules, apart, because everything overlaps on the detector (Fig. 18, top). So what was the solution to this problem?
Do not separate just by focusing. Separate by molecular states, in the easi-est case by “on/off ” states [28–31]. If separating by molecular states, one can indeed distinguish the features, one can tell the molecules apart even though they reside within the region dictated by diffraction. We can tell, for instance, one molecule apart from its neighbours and discern it (Fig. 18, bottom). For this purpose, we have our choice of states that I have introduced already (Fig. 15) which we can use to distinguish features within the diffraction region.
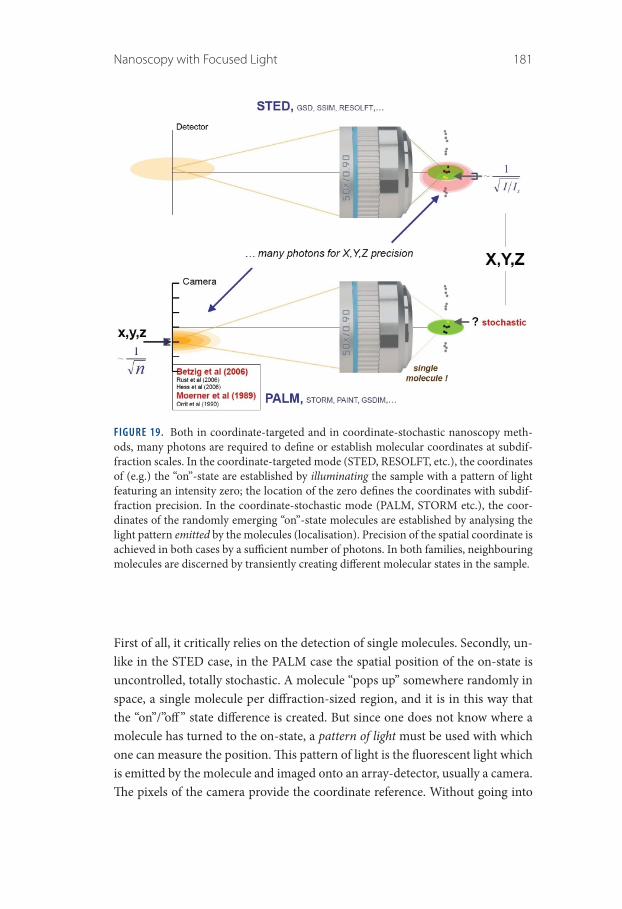
In the methods I have described, STED, RESOLFT and so on, the position of the state—where the molecule is “on,” where the molecule is “off ”—is deter-mined by a pattern of light featuring one or more intensity zeros, for example a doughnut. This light pattern clearly determines where the molecule has to be “on” and where it has to be “off.” The coordinates X, Y, Z are tightly controlled by the incident pattern of light and the position(s) of its zero(s). Moving the pat-tern to the next position X, Y, Z—one knows the position of the occurrence of the “on” and “off ” states already. One does not necessarily require many detected photons from the “on” state molecules, because the detected photons are merely indicators of the presence of a feature. The occurrence of the state and its loca-tion is fully determined by the incident light pattern.
Now the question comes up: How does this compare with the seminal inven-tion first reported by Eric Betzig [48], based on the discovery of W. E. Moerner [8, 49], that you can detect single molecules? In the PALM (“Photo-Activated Localization Microscopy”) [48] concept (also called STORM or FPALM [50, 51]), there are two fundamental differences to STED-like approaches (Fig. 19).

180 The Nobel Prizes
FIGURE 18. Paradigm shift in the use of the physical phenomenon by which features are discerned in a far-field fluorescence microscope: From focusing of light to using a mo-lecular state transition, such as a transition between an “on” and an “off ” state.
Nanoscopy with Focused Light 181
First of all, it critically relies on the detection of single molecules. Secondly, un-like in the STED case, in the PALM case the spatial position of the on-state is uncontrolled, totally stochastic. A molecule “pops up” somewhere randomly in space, a single molecule per diffraction-sized region, and it is in this way that the “on”/”off ” state difference is created. But since one does not know where a molecule has turned to the on-state, a pattern of light must be used with which one can measure the position. This pattern of light is the fluorescent light which is emitted by the molecule and imaged onto an array-detector, usually a camera. The pixels of the camera provide the coordinate reference. Without going into
FIGURE 19. Both in coordinate-targeted and in coordinate-stochastic nanoscopy meth-ods, many photons are required to define or establish molecular coordinates at subdif-fraction scales. In the coordinate-targeted mode (STED, RESOLFT, etc.), the coordinates of (e.g.) the “on”-state are established by illuminating the sample with a pattern of light featuring an intensity zero; the location of the zero defines the coordinates with subdif-fraction precision. In the coordinate-stochastic mode (PALM, STORM etc.), the coor-dinates of the randomly emerging “on”-state molecules are established by analysing the light pattern emitted by the molecules (localisation). Precision of the spatial coordinate is achieved in both cases by a sufficient number of photons. In both families, neighbouring molecules are discerned by transiently creating different molecular states in the sample.

182 The Nobel Prizes
the details, this pattern of emitted fluorescence light allows one to determine the molecule’s position with a centroid calculation.
An interesting insight here is that one needs a bright pattern of emitted light to find out the position of emission just as one needs a bright pattern of inci-dent light in STED/RESOLFT to determine the position of emission. Not sur-prisingly, one always needs bright patterns of light when it comes to positions, because if one has just a single photon, this goes astray. The photon can go any-where within the realm of diffraction, there is no way to control where it goes within the diffraction zone. In other words, when dealing with positions, one needs many photons by definition, because this is inherent to diffraction. Many photons are required for defining positions of “on”- and “off ”-state molecules in STED/RESOLFT microscopy, just as many photons are required to find out the position of “on”-state molecules in the stochastic method PALM.
However, in both cases the separation of features is, of course, done by an “on/off ” transition [28–31]. This is how we make features distinct, how we tell them apart. As a matter of fact, all the super-resolution methods which are in place right now and useful, achieve separation by transiently placing the mol-ecules in two different states for the time period in which the molecules residing in the same diffraction zone are detected. “Fluorescent” and “non-fluorescent” is the easiest pair of states to play with, and so this is what has worked out so far.
One can take the point of view that in the 20th century it was the lenses which were decisive. And the lens makers were the “kings.” One had to go to them and ask them for the best lenses to get the best resolution. But how is it today? No, it is not the lens makers. This resolution game is not about lenses anymore. It is about molecular states, and molecular states are of course about molecules. The molecules determine now how well we can image; they deter-mine the spatial resolution. And that is not optical technology—that is chem-istry (Fig. 20). One might say that it is now the chemists who can take the best images. In a way this was initially a physics problem—the diffraction barrier certainly was, no doubt about it—which has now evolved into a chemistry topic.
This Nobel Prize was awarded for super-resolution fluorescence imaging. The enabling element being a transition between two states, the two states need not be fluorescence “on”/”off ”: they could also be a pair of states “A” and “B” (Fig. 21), like “absorption/non-absorption,” “scattering/non-scattering,” “spin up/spin down,” “bound”/“unbound” (as in the method called PAINT [52]), etc. Perhaps one can also imagine a super-resolution absorption microscope or a su-per-resolution scattering microscope, if one identifies the right states. The story continues, and I am expecting more of it to come. It has just begun!

Nanoscopy with Focused Light 183
FIGURE 20. From lenses to molecular switches. Whereas in the 20th century, the focusing quality of the lenses was decisive for gaining very high spatial resolution, now it is the molecules and their state transitions which become central to achieving the best resolu-tion. Optimising molecules towards providing robust and repeatedly executable (on/off) state transitions is primarily a chemistry problem.
FIGURE 21. The limiting role of diffraction is overcome by utilising at least two molecular states to separate features residing closer than the diffraction barrier. While fluorescent molecules have been the first type of molecules which have provided such states, other molecules and states are conceivable that are not necessarily of the fluorescent type. This is why one could imagine breaking the diffraction barrier also in a non-fluorescence far-field optical microscope, provided suitable states and state transitions are identified.

184 The Nobel Prizes
Looking at Abbe’s equation (Fig. 4), it was written in stone for so many years, but it cannot explain the fact that we now have a much higher spatial resolution. Fortunately, we can adapt Abbe’s equation very easily. We simply add the square root factor, and now the good news is: the resolution goes down to the size of a molecule (Fig. 15d). We can achieve image resolution at the molecular scale.
ACKNOWLEDGEMENTS
I am grateful to Steffen J. Sahl for editing the initial version of the transcribed original lecture, as well as to Mark Bates for further improvements. Last but not least, I would like to mention that I could not have told you about this develop-ment without the help of many very talented students and postdocs who have contributed to it. I thank them from the bottom of my heart for their contribu-tions. I would like to add that many of them are still continuing in this field because it is very, very exciting.
REFERENCES
1. Abbe, E., “Beiträge zur Theorie des Mikroskops und der mikroskopischen Wahrnehmung.” Archiv für Mikroskopische Anatomie, 1873. 9, 413–468.
2. Verdet, E., Leçons d’ optique physique. Vol. 1. 1869, Paris: Victor Masson et fils.3. Lord Rayleigh, “On the Theory of Optical Images, with Special Reference to the
Microscope.” Philosophical Magazine, 1896. 5(42), 167–195.4. von Helmholtz, H., “Die theoretische Grenze für die Leistungsfähigkeit der
Mikroskope.” Annalen der Physik und Chemie (Jubelband, J. C. Poggendorff gewid-met), 1874, 557–584.
5. Alberts, B., et al., Molecular Biology of the Cell. 4 ed. 2002, New York: Garland Science.
6. Giepmans, B.N.G., et al., “The Fluorescent Toolbox for Assessing Protein Location and Function.” Science, 2006. 312(5771), 217–224.
7. Lakowicz, J.R., Principles of fluorescence spectroscopy. 2006, New York, N.Y.: Springer.8. Moerner, W.E. and L. Kador, “Optical-detection and spectroscopy of single mol-
ecules in a solid.” Physical Review Letters, 1989. 62(21), 2535–2538.9. Orrit, M. and J. Bernard, “Single pentacene molecules detected by fluorescence exci-
tation in a p-terphenyl crystal.” Physical Review Letters, 1990. 65, 2716–2719.10. Born, M. and E. Wolf, Principles of Optics. 7th ed. 2002, Cambridge, New York,
Melbourne, Madrid, Cape Town: Cambridge University Press.11. Hell, S. and E.H.K. Stelzer, “Properties of a 4pi confocal fluorescence microscope.”
Optical Society of America. Journal A: Optics, Image Science, and Vision, 1992. 9, 2159–2166.

Nanoscopy with Focused Light 185
12. Hell, S.W., M. Schrader, and H.T.M. Van der Voort, “Far-field fluorescence micros-copy with three-dimensional resolution in the 100-nm range.” Journal of Microscopy, 1997. 187(1), 1–7.
13. Hell, S.W., “Improvement of lateral resolution in far-field light microscopy using two-photon excitation with offset beams.” Optics Communications, 1994. 106, 19–24.
14. Loudon, R., The Quantum Theory of Light. 1983, Oxford: Oxford University Press.15. Hell, S.W. and J. Wichmann, “Breaking the diffraction resolution limit by stimu-
lated-emission—stimulated-emission-depletion fluorescence microscopy.” Optics Letters, 1994. 19(11), 780–782.
16. Klar, T.A. and S.W. Hell, “Subdiffraction resolution in far-field fluorescence micros-copy.” Optics Letters, 1999. 24(14), 954–956.
17. Klar, T.A., et al., “Fluorescence microscopy with diffraction resolution barrier broken by stimulated emission.” Proceedings of the National Academy of Sciences of the United States of America, 2000. 97, 8206–8210.
18. Donnert, G., et al., “Macromolecular-scale resolution in biological fluorescence microscopy.” Proceedings of the National Academy of Sciences of the United States of America, 2006. 103(31), 11440–11445.
19. Willig, K.I., et al., “STED microscopy reveals that synaptotagmin remains clustered after synaptic vesicle exocytosis.” Nature, 2006. 440(7086), 935–939.
20. Westphal, V., et al., “Video-Rate Far-Field Optical Nanoscopy Dissects Synaptic Vesicle Movement.” Science, 2008. 320(5873), 246–249.
21. Berning, S., et al., “Nanoscopy in a living mouse brain.” Science, 2012. 335(6068), 551.
22. Dyba, M. and S.W. Hell, “Focal spots of size lambda/23 open up far-field flores-cence microscopy at 33 nm axial resolution.” Physical Review Letters, 2002. 88(16), 163901.
23. Westphal, V. and S.W. Hell, “Nanoscale Resolution in the Focal Plane of an Optical Microscope.” Physical Review Letters, 2005. 94, 143903.
24. Keller, J., A. Schoenle, and S.W. Hell, “Efficient fluorescence inhibition patterns for RESOLFT microscopy.” Optics Express, 2007. 15(6), 3361–3371.
25. Göttfert, F., et al., “Coaligned Dual-Channel STED Nanoscopy and Molecular Diffusion Analysis at 20 nm Resolution.” Biophysical Journal, 2013. 105(1), L01–L03.
26. Chojnacki, J., et al., “Maturation-dependent HIV-1 surface protein redistribution revealed by fluorescence nanoscopy.” Science, 2012. 338(6106), 524–528.
27. Willig, K.I., et al., “Nanoscopy of Filamentous Actin in Cortical Dendrites of a Living Mouse.” Biophysical Journal, 2014. 106(1), L01–L03.
28. Hell, S.W., “Toward fluorescence nanoscopy.” Nature Biotechnology, 2003. 21(11), 1347–1355.
29. Hell, S.W., “Strategy for far-field optical imaging and writing without diffraction limit.” Physics Letters. Section A: General, Atomic and Solid State Physics, 2004. 326(1–2), 140–145.
30. Hell, S.W., “Far-Field Optical Nanoscopy.” Science, 2007. 316(5828), 1153–1158.31. Hell, S.W., “Microscopy and its focal switch.” Nature Methods, 2009. 6(1), 24–32.

186 The Nobel Prizes
32. Hell, S.W., “Far-Field Optical Nanoscopy,” in Single Molecule Spectroscopy in Chemistry, Physics and Biology, A. Gräslund, Rigler, R., Widengren, J., eds. 2009, Springer: Berlin, 365–398.
33. Rittweger, E., et al., “STED microscopy reveals crystal colour centres with nanomet-ric resolution.” Nature Photonics, 2009. 3, 144–147.
34. Wildanger, D., et al., “Solid Immersion Facilitates Fluorescence Microscopy with Nanometer Resolution and Sub-Angström Emitter Localization.” Advanced Materials, 2012. 24(44), 309–313.
35. Rittweger, E., D. Wildanger, and S.W. Hell, “Far-field fluorescence nanoscopy of diamond color centers by ground state depletion.” Europhysics Letters, 2009. 86, 14001.
36. Han, K.Y., et al., “Three-Dimensional Stimulated Emission Depletion Microscopy of Nitrogen-Vacancy Centers in Diamond Using Continuous-Wave Light.” Nano Letters, 2009. 9(9), 3323–3329.
37. Wrachtrup, J., “Defect center room-temperature quantum processors.” Proceedings of the National Academy of Sciences of the United States of America, 2010. 107(21), 9479–9480.
38. Wrachtrup, J. and F. Jelezko, “Processing quantum information in diamond.” Journal of Physics: Condensed Matter, 2006. 18(21), S807–S824.
39. Maze, J.R., et al., “Nanoscale magnetic sensing with an individual electronic spin in diamond.” Nature, 2008. 455, 644–647.
40. Wildanger, D., J.R. Maze, and S.W. Hell, “Diffraction unlimited all-optical recording of electron spin resonances.” Physical Review Letters, 2011. 107(1), 017601.
41. Hell, S.W. and M. Kroug, “Ground-state depletion fluorescence microscopy, a con-cept for breaking the diffraction resolution limit.” Applied Physics B: Lasers and Optics, 1995. 60, 495–497.
42. Bretschneider, S., C. Eggeling, and S.W. Hell, “Breaking the Diffraction Barrier in Fluorescence Microscopy by Optical Shelving.” Physical Review Letters, 2007. 98(21), 218103.
43. Fölling, J., et al., “Fluorescence nanoscopy by ground-state depletion and single-molecule return.” Nature Methods, 2008. 5, 943–945.
44. Hofmann, M., et al., “Breaking the diffraction barrier in fluorescence microscopy at low light intensities by using reversibly photoswitchable proteins.” Proceedings of the National Academy of Sciences of the United States of America, 2005. 102(49), 17565–17569.
45. Grotjohann, T., et al., “Diffraction-unlimited all-optical imaging and writing with a photochromic GFP.” Nature, 2011. 478(7368), 204–208.
46. Hell, S.W., M. Dyba, and S. Jakobs, “Concepts for nanoscale resolution in fluores-cence microscopy.” Current Opinion in Neurobiology, 2004. 14(5), 599–609.
47. Chmyrov, A., et al., “Nanoscopy with more than 100,000 ‘doughnuts’.” Nature Methods, 2013. 10(8), 737–740.
48. Betzig, E., et al., “Imaging Intracellular Fluorescent Proteins at Nanometer Resolution.” Science, 2006. 313(5793), 1642–1645.
49. Dickson, R.M., et al., “On/off blinking and switching behaviour of single molecules of green fluorescent protein.” Nature, 1997. 388(6640), 355–358.

Nanoscopy with Focused Light 187
50. Rust, M.J., M. Bates, and X.W. Zhuang, “Sub-diffraction-limit imaging by stochastic optical reconstruction microscopy (STORM).” Nature Methods, 2006. 3, 793–795.
51. Hess, S.T., T.P.K. Girirajan, and M.D. Mason, “Ultra-High Resolution Imaging by Fluorescence Photoactivation Localization Microscopy.” Biophysical Journal, 2006. 91(11), 4258–4272.
52. Sharonov, A. and R.M. Hochstrasser, “Wide-field subdiffraction imaging by accu-mulated binding of diffusing probes.” Proceedings of the National Academy of Sciences of the United States of America, 2006, 103 (50), 18911–18916.
Portrait photo of Stefan W. Hell by photographer Alexander Mahmoud.


![Surface plasmon-enhanced nanoscopy of intracellular … · 2019. 9. 4. · [1–3]. Conventional fluorescence microscopy has also been combined with prior information on molecular](https://static.fdocuments.in/doc/165x107/5fcad6152859e536e226f4af/surface-plasmon-enhanced-nanoscopy-of-intracellular-2019-9-4-1a3-conventional.jpg)