
Nanoparticle-Based Bioanalysis · 1 Nanoparticle-Based Bioanalysis A Major Qualifying Project...
55
1 Nanoparticle-Based Bioanalysis A Major Qualifying Project Report Submitted to the Faculty of the WORCESTER POLYTECHNIC INSTITUTE In partial fulfillment of the requirements for a Bachelor of Science Degree in the fields of Chemical Engineering and Chemistry By: __________________________ John Austin Date: March 11, 2010 Approvals: ___________________________________________ Assistant Professor H. Susan Zhou, Advisor of Record
Transcript of Nanoparticle-Based Bioanalysis · 1 Nanoparticle-Based Bioanalysis A Major Qualifying Project...
1
Nanoparticle-Based
Bioanalysis
A Major Qualifying Project Report
Submitted to the Faculty of the
WORCESTER POLYTECHNIC INSTITUTE
In partial fulfillment of the requirements
for a Bachelor of Science Degree
in the fields of Chemical Engineering and Chemistry
By:
__________________________
John Austin
Date: March 11, 2010
Approvals:
___________________________________________
Assistant Professor H. Susan Zhou, Advisor of Record

2
Acknowledgements The completion of this project is in a large part due to the assistance of those working in Professor
Zhou’s laboratory. Foremost, I must thank Professor Zhou, whose knowledge, patience, and respect for
her students has made her an excellent advisor. Without her continued guidance over the past two
years, this project would have not succeeded. Next, I must thank Professor Yu, who, in his time advising
this project, provided excellent advice concerning the creation of iron oxide nanoparticles. Additionally,
I must recognize Dr. Jainlong Wang for his continued mentorship in the laboratory. Whenever I have
had difficulties with my work, Dr. Wang has graciously made time to both assist and advise me. Next, I
would like to thank Ahsan Munir, who helped to guide me in the initial stages of my work. Lastly, I
would like to thank Dr. Jaingdong Deng of Harvard University for his assistance capturing TEM images of
the iron oxide nanoparticles I fabricated.

3
Abstract An investigation into the effect of using aptamer-modified iron oxide nanoparticles to increase the
minimum detection limit of human Immunoglobulin E (hIgE) was conducted using electrical impedance
spectroscopy (EIS). Three distinct chemical configurations were tested to evaluate accurately their
effectiveness. In particular, reproducibility and ease of amplification were chosen as the most important
criteria. Impedance data was fit to equivalent circuit models before evaluation.
The first sensor evaluated consisted of an antibody modified gold electrode that specifically bound to its
target molecule (hIgE). Iron oxide nanoparticles modified by sensing aptamers were used to increase
the impedance signal generated by the hIgE. In the presence of an electrolyte, an increase in electrical
impedance was detected with each subsequent modification. Although this sensor did create a sizeable
amplification of the hIgE signal upon addition of iron oxide nanoparticles, reproducible results were
difficult to obtain, due to the ease with which antibodies denature.
The second configuration was similar to the first; however, a gold electrode modified with aptamers
replaced the antibody modified gold electrode. This sensor proved to be as effective as the first.
Moreover, due to the stability of aptamers, it did not suffer issues of reproducibility.
The third configuration tested was identical to the second; however, it differed in that the impedance
measurements were recorded in the absence of an electrolyte, creating a capacitance only electrical
biosensor. This setup allowed the data to be evaluated using a simple RC equivalent-circuit model.
Results obtained through this method were easily reproducible; however, though the addition of hIgE
was observable from the impedance data, the addition of magnetic nanoparticles only slightly amplified
the signal.
While all three configurations were shown to be viable impedance biosensors, the second configuration,
utilizing only aptamers as targeting elements in the presence of an electrolyte, proved to be the most
effective in terms of generating reproducible, large impedance changes in the presence of its target
molecule.

4
Table of Contents Acknowledgements ....................................................................................................................................... 2
Abstract ......................................................................................................................................................... 3
Table of Figures ............................................................................................................................................. 7
Introduction .................................................................................................................................................. 8
Background ................................................................................................................................................... 8
Immunoglobulin E ..................................................................................................................................... 8
What is Immunoglobulin E? .................................................................................................................. 8
IgE's Role in Allergic Reactions .............................................................................................................. 9
Defense against Helminthic Parasites ................................................................................................... 9
IgE in Modern Societies ......................................................................................................................... 9
Immune Response to Protozoan Parasites ........................................................................................... 9
Human IgE Deficiency ........................................................................................................................... 9
Importance of Detecting Concentrations of IgE ................................................................................. 10
Aptamer .................................................................................................................................................. 10
What is an Aptamer? .......................................................................................................................... 10
Creation of Aptamers: The SELEX Procedure ...................................................................................... 10
Aptamer Biosensors ............................................................................................................................ 11
An Aptamer Alternative: Antibodies ................................................................................................... 11
Benefits of Using Aptamers ................................................................................................................ 12
Current Detection Methods Using Aptamer Biosensors ......................................................................... 12
Optical Fluorescence Detection Using Aptamers ............................................................................... 12
Surface Plasmon Resonance (SPR) ...................................................................................................... 15
Quantum Dot (QD) Sensors ................................................................................................................ 17
Acoustic Sensors ................................................................................................................................. 18
Electrochemical Redox Aptamer Biosensors ...................................................................................... 19
Microcantilever Sensor Array ............................................................................................................. 24
Enzyme-Linked Oligonucleotide Assay (ELONA) ................................................................................. 24
Aptamer-Linked Immobilized Sorbent Assay (ALISA) ......................................................................... 25
Electrical Impedance Spectroscopy ......................................................................................................... 26
What is Electrical Impedance Spectroscopy? ..................................................................................... 26
Bode Plot ............................................................................................................................................. 26

5
Nyquist Plot ......................................................................................................................................... 27
Equivalent Circuits .............................................................................................................................. 28
Capacitance Detection ........................................................................................................................ 30
Basic Aptamer-Protein Detection Scheme .......................................................................................... 31
Cyclic Voltammetery ............................................................................................................................... 31
What is Cyclic Voltammetery? ............................................................................................................ 31
The Experimental Importance of Cyclic Voltammetery ...................................................................... 31
Methodology ............................................................................................................................................... 31
Nanoparticle Synthesis ............................................................................................................................ 31
Synthesis of Mono-disperse (10 nm) Fe3O4 Nanoparticles ................................................................. 31
Purification of Fe3O4 Nanoparticles after Synthesis............................................................................ 32
Preparation of Fe3O4 TEM Samples ..................................................................................................... 32
Preparation of Aptamer Modified Magnetic Iron-Oxide Nanoparticles ............................................. 32
Electrochemical Detection (Antibody Method) ....................................................................................... 33
Probe Preparation ............................................................................................................................... 33
Surface Modification ........................................................................................................................... 34
IgE Immobilization............................................................................................................................... 35
Signal Modification with Aptamer Modified Nanoparticles ............................................................... 35
Electrochemical Detection (Aptamer-Only Method) ............................................................................... 35
Surface Modification ........................................................................................................................... 35
Use of β-Mercaptoethanol to Block Unreacted Binding Sites on Electrode Surface .......................... 36
Electrochemical Detection (Capacitance Test) ........................................................................................ 36
Electrical Impedance Spectroscopy Test ................................................................................................. 37
Preparation of Device and Solution for Testing .................................................................................. 37
Necessary Precautions when Conducting EIS Experiments ................................................................ 38
Results & Discussion ................................................................................................................................... 38
Equivalent Circuit Model ......................................................................................................................... 38
Randles Circuit .................................................................................................................................... 39
RC Circuit ............................................................................................................................................. 40
Analysis of Results ................................................................................................................................... 40
Randles Circuit – Aptamer Studies ...................................................................................................... 40
Randles Circuit – Aptamer-Antibody Studies ...................................................................................... 42

6
RC Circuit ............................................................................................................................................. 44
Influence of Surface Roughness .............................................................................................................. 49
Conclusions ................................................................................................................................................. 50
References .................................................................................................................................................. 51

7
Table of Figures FIGURE 1. DIAGRAM OF SELEX PROCEDURE (MOK ET AL.) ....................................................................................................... 11
FIGURE 2. CONFORMATIONAL CHANGE OF IGE UPON BINDING (KATILIUS ET AL.) .......................................................................... 13
FIGURE 3. CHANGE IN CONFORMATION OF AN APTAMER BEACON UPON BINDING TO ITS TARGET MOLECULE (MOK ET AL.) ................. 14
FIGURE 4. CHANGE INDUCED IN A STRUCTURE-SWITCHING APTAMER UPON BINDING TO ITS TARGET MOLECULE (MOK ET AL.) ............. 14
FIGURE 5. EXAMPLE OF SIGNALING BY A FLUOROGENIC REACTION (MOT ET AL.) .......................................................................... 15
FIGURE 6. SCHEMATIC OF COLORIMETRIC SENSOR FOR ADENOSINE (LIU ET AL.) ........................................................................... 16
FIGURE 7. SCHEMATIC OF QUANTUM DOT SENSOR UTILIZING FLUORESANCE RESONANCE ENERGY TRANSFER QUENCHING (MOK ET AL.)
............................................................................................................................................................................ 17
FIGURE 8. SCHEMATIC OF QUANTUM DOT SENSOR UTILIZING CHARGE TRANSFER QUENCHING (MOK ET AL.) .................................... 18
FIGURE 9. SCHEMATIC OF GENERAL DESIGN OF ACOUSTIC APTAMER BIOSENSOR (MOK ET AL.) ....................................................... 19
FIGURE 10. SIGNAL-ON BINDING MECHANISM OF COCAINE REDOX SENSOR (BAKER ET AL.) ........................................................... 20
FIGURE 11. SIGNAL-OFF BINDING MECHANISM OF THROMBIN REDOX SENSOR (XIAO ET AL.) ......................................................... 21
FIGURE 12. STRAND DISPLACEMENT BINDING MECHANISM OF THROMBIN REDOX SENSOR (XIAO ET AL.) ......................................... 22
FIGURE 13. STRAND RELEASE SIGNAL-ON BINDING MECHANISM OF REDOX SENSOR (YOSHIZUMI ET AL.) ......................................... 23
FIGURE 14. STRAND RELEASE SIGNAL-OFF BINDING MECHANISM OF REDOX SENSOR (LU ET AL.) .................................................... 23
FIGURE 15. MECHANISM OF MICROCANTILEVER DETECTION USING APTAMERS (MOK ET AL.) ........................................................ 24
FIGURE 16. ELONA BIOASSAY (MOK ET AL.) ......................................................................................................................... 25
FIGURE 17. EXAMPLE OF A BODE PLOT (AKBARINEZHAD ET AL.) ................................................................................................ 27
FIGURE 18. EXAMPLE OF NYQUIST PLOT WITH IMPEDANCE VECTOR (GAMRY INSTRUMENTS) .......................................................... 28
FIGURE 19. COMPARISON OF THE EFFECTS OF A CAPACITOR AND AN INDUCTOR (PHILIPPSON, JEFFREY) ............................................ 29
FIGURE 20. CIRCUIT ELEMENTS IN SERIES (GAMRY INSTRUMENTS) ............................................................................................ 29
FIGURE 21. CIRCUIT ELEMENTS IN PARALLEL (GAMRY INSTRUMENTS) ........................................................................................ 30
FIGURE 22. CYCLIC VOLTAMMETERY CURVE OF BARE GOLD IN SULFURIC ACID ............................................................................. 34
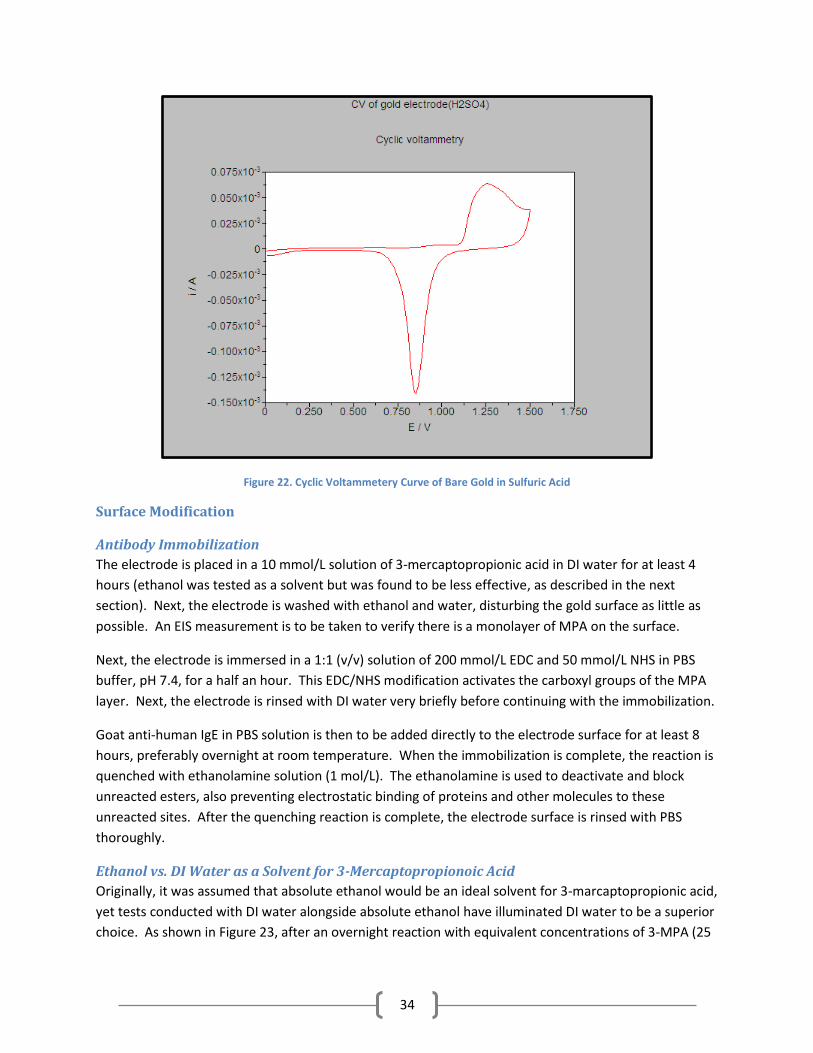
FIGURE 23. ETHANOL VS. DI WATER AS A SOLVENT FOR 3-MERCAPTOPRPIONOIC ACID ................................................................. 35
FIGURE 24. BRINKMANN POTENTIOSTAT ............................................................................................................................... 37
FIGURE 25. RANDLES CIRCUIT DIAGRAM (KATZ ET AL.) ............................................................................................................ 39
FIGURE 26. RC CIRCUIT DIAGRAM (KATZ ET AL.) .................................................................................................................... 40
FIGURE 27. RANDLES CIRCUIT (APTAMER) RESULTS ................................................................................................................ 41
FIGURE 28. IMPEDANCE RESPONSE TO ARA H 1 PROBE (SUNI ET AL.) ......................................................................................... 42
FIGURE 29. RANDLES CIRCUIT (APTAMER-ANTIBODY) RESULTS ................................................................................................. 43
FIGURE 30. IMPEDANCE INCREASE WITH TIME ....................................................................................................................... 44
FIGURE 31. IMPEDANCE INCREASE WITH TIME (2) .................................................................................................................. 45
FIGURE 32. RC CIRCUIT RESULTS ......................................................................................................................................... 46
FIGURE 33. AFM TOPOGRAPHY OF ELECTRODE MODIFIED WITH APTAMERS (XU ET AL.) ............................................................... 47
FIGURE 34. AFM TOPOGRAPY OF ELECTRODE MODIFIED WITH HIGE (XU ET AL.) ......................................................................... 47
FIGURE 35. RC CIRCUIT RESULTS 2 ...................................................................................................................................... 48
FIGURE 36. RC CIRCUIT RESULTS 3 ...................................................................................................................................... 49

8
Introduction Genetic mutations and abnormalities can cause significant defects and diseases. Diagnosis and
detection of these mutations can lead to awareness and possible earlier treatment of a potential
problem for a patient. Additionally, in laboratory experiments it is at times necessary to know the
current concentration of a species in solution. Thus, there is a need for efficient biosensors for both
diagnosis and detection. Electrical impedance biosensors have been developed that can effectively
detect the presence of target biomolecules; as research into electrical impedance biosensors progresses,
it has become of increasing interest to improve both the minimum detection limit and the reliability of
these sensors.
In this paper, three distinct aptamer based biosensors, utilizing an iron oxide nanoparticle sandwich
method for amplification, are to be evaluated. In theory, due to their relatively large size, iron oxide
nanoparticles should greatly increase the electrical impedance signal of the target molecules, allowing
for more reproducible, larger impedance signals.
First, an antibody-aptamer complex will be evaluated, as it is most similar to the bulk of current
impedance biosensors. This sensor is composed of a gold electrode, modified with a sensing antibody
(anti-hIgE) that, when in the presence of its target antigen (human IgE), binds. Additionally, as with all
sensor configurations presented in this paper, iron oxide nanoparticles (10 nm) modified with aptamers,
are used to amplify the impedance generated from the addition of the hIgE. Impedance measurements
will be conducted in the presence of the electrolyte potassium ferricyanide.
The second sensor to be evaluated in this paper differs from the first sensor only in that the antibodies
are replaced by aptamers. This will be done to evaluate the effectiveness of aptamers as targeting
elements in impedance biosensors.
Lastly, the second biosensor configuration will be tested in the absence of an electrolyte to create a
capacitance only detection scheme. This will be done to evaluate the effectiveness of utilizing iron oxide
nanoparticles as amplification elements in capacitance biosensors. Capacitance only biosensors have
received some attention due to the detrimental impedance drift generated by high concentrations of
electrolytes in typical impedance biosensors.
Background
Immunoglobulin E
What is Immunoglobulin E?
Immunoglobulin E, often referred to as IgE, is a class of antibodies found exclusively in mammals.
Teruka and Kimishige Ishizaka discovered it in 1966.1 IgE is most notable for its important role in allergic
reactions; additionally, IgE may be linked to immune protection from parasitic worms as well as a
warning to the body's immune system of cancer.
1 (Ishizaka, Ishizaka, & Hornbrook, 1966)

9
IgE's Role in Allergic Reactions
The first time an individual encounters an allergen, such as pollen, the pollen will react with a B cell to
produce specific IgE antibodies. These IgE antibodies then bind to mast cells. From then on, whenever
the IgE antibodies on the mast cell encounter their corresponding pollen, the resulting binding produces
a change in the mast cell. This change releases histamine, cytokines, and other chemical mediators that
induce allergy symptoms in the individual.
Defense against Helminthic Parasites
IgE may have evolved in mammals as a defense against helminthic parasites. The body's immune
response to helminthic parasites, worms, is similar to the body's response to allergens. In the initial
stage of the immune response, IgE antibodies bind to the surface of the parasite. The eosinophil FcR
receptor on a mast cell binds to the Fc receptor on IgE, causing the mast cell to release eosinophil. The
eosinophil then degranulates to the parasite, damaging, destroying, or dislodging the parasite.2
IgE in Modern Societies
In modern societies where medical science and disease prevention have evolved to the point where gut-
parasite infections are no longer common enough to pose a threat, IgE seems to do more harm than
good. When sanitation needs where hardly being met at the turn of the twentieth century, reports of
chronic allergies were rare. Yet, in modernized societies, individuals suffering from allergies are much
more common. Today, as many as 20% of adults have allergies while 40% of children are afflicted with
minor allergies (Winter et al.). Winter et al. hypothesizes that better sanitation methods have left the
immune system unoccupied, leaving the immune system to attack benign allergens.
Immune Response to Protozoan Parasites
Protozoa are single-celled eukaryotes; some can infect the body, causing disease and illness. There is
some evidence that IgE aids in the body's immune response to protozoa; this was shown in a study of
Plasmodium falciparum infections conducted in endemic areas of Gabon and India.3 Upon infection,
total IgE levels elevated, yet this increase did not differ between patients with severe infections and
those presenting mild symptoms. However, the study showed that increased levels of P. falciparum
specific IgE in individuals correlated with both milder symptoms and an apparent resistance to the
infection.
Human IgE Deficiency
Because IgE levels are normally very low, .05 % of IgG concentration in the blood, it is hard to determine
what a deficiency of IgE should be specified at; however, Winter et al. defines IgE deficiency to be levels
less than 2 U/mL in children and less than 4 U/mL in adults (Winter et al.). IgE deficiency has been linked
to severe combined immunodeficiency, hyper-IgE syndrome, ataxia telangiectasia, X-linked recessive
Bruton agammaglobulinemia, common variable immunodeficiency, transient hypogammaglobulinemia
of infancy, and isolated IgE deficiency (Winter et al.).
2 (Winter, Hardt, & Fuhrman, 2000)
3 (Duarte, et al., 2007)

10
Importance of Detecting Concentrations of IgE
It is important to be able to detect IgE concentrations in experiments as well as in individuals suffering
from Job's syndrome or atopy; these individuals may have up to ten times the normal concentration of
IgE in their blood. People who suffer from atopy exhibit hypersensitive allergic reactions on parts of
their body that have not been exposed to an allergen. Examples of atopy include asthma, eczema,
allergic rhinitis, etc...
Treatments for these atopic symptoms currently utilize anti-histamines and other such chemicals that
target the symptoms of allergies; however, it may be possible to develop a treatment that inhibits the
binding of IgE and receptor. This treatment could effectively stop allergy attacks before they started.
However, research towards this treatment does require an effective biosensor to detect concentrations
of active IgE in solutions.
Aptamer
What is an Aptamer?
Aptamers are artificially synthesized nucleic acids, either DNA or RNA. Aptamers are made to bind
selectively to specific substrates, which can range from low weight inorganic and organic molecules to
proteins. The affinity aptamers exhibit for their specific substrates is very strong and is comparable to
that of antibodies to antigens.4 For example, anti-theophyllin RNA aptamer exhibits a 10,000-fold
discrimination against caffeine,5 which differs from caffeine only by a methyl group. The unusually
strong selectivity of aptamers arises from their ability to fold upon binding to their corresponding
substrate, either to envelop it or integrate into it.6
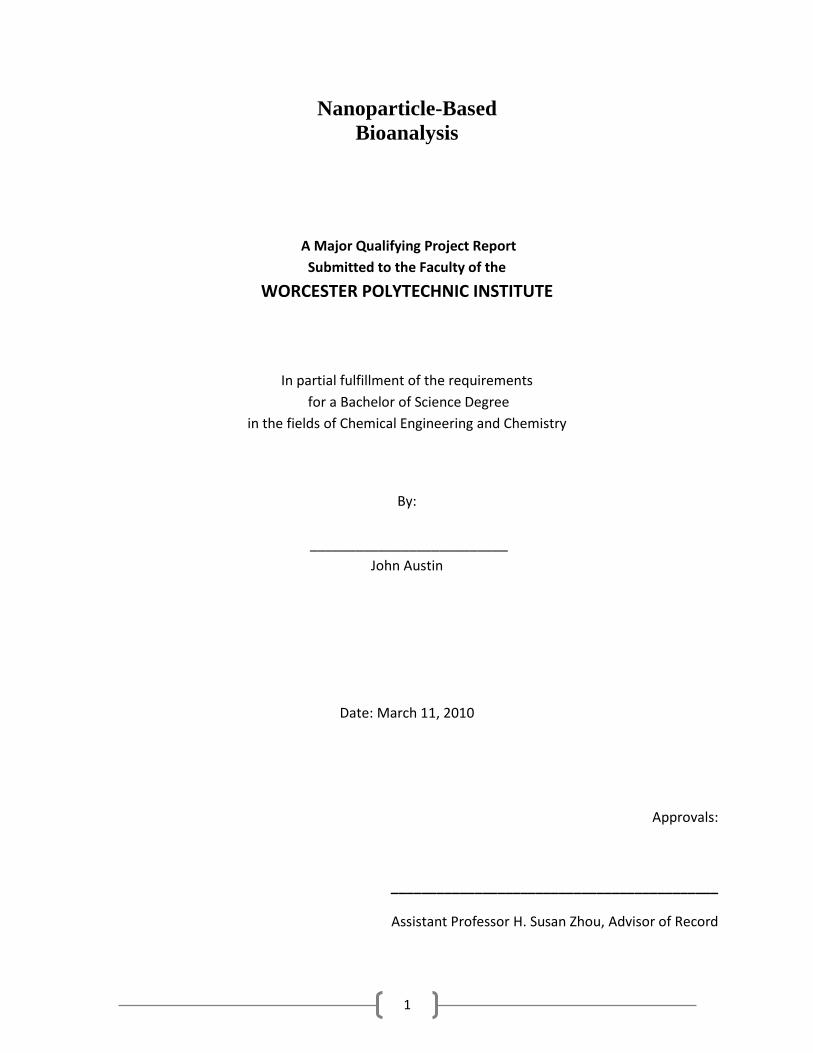
Creation of Aptamers: The SELEX Procedure
The systematic evolution of ligands by exponential enrichment, often referred to as the SELEX
procedure, is a novel tool for the generation of aptamers. The process begins by adding a solution
containing a random assortment of oligonucleotides to a separation matrix. The solution is then washed
away, leaving only the nucleic acids that show affinity for the substrate behind. These nucleic acids are
then replicated many times through polymerase chain reaction (PCR) amplification. This new solution,
containing those nucleic acids that have shown an affinity for the substrate, is once again exposed to a
separation matrix. This cycle is repeated several times. Each time the library of nucleic acids narrows as
only those with the highest affinity to bind to the substrate remain. After approximately 8-15
purification cycles and PCR amplifications, the resulting solution yields the desired aptamers (Zayats et
al.). A diagram of the SELEX procedure can be seen in Figure 1.
4 (Zayats & Willner, 2007)
5 (Jenison, Gill, Pardi, & Polisky, 1994)
6 (Song, Wang, Li, Zhao, & Fan, 2008)
11
Figure 1. Diagram of SELEX Procedure (Mok et al.)
Aptamer Biosensors
Aptamers have shown great promise and value in the field of biosensing due to their strongly selective
binding. The shape an aptamer adopts when it binds to its substrate is well defined and reproducible,
yet when aptamers selectively bind to their substrates, they undergo a conformational change, limiting,
changing, and adding redox available sites. This change can be detected using electrochemical
spectroscopy (i.e. cyclic voltammetery or electrical impedance spectroscopy).
An Aptamer Alternative: Antibodies
Antibodies have been shown to be good selective alternatives to aptamers. Immunolabeled
nanoparticles have been shown to bind selectively to antigens on a cells surface. In particular, this was
done with 60 nm gold nanoparticles coated with anti-EGFR antibodies. In vitro the gold nanoparticles
successfully bound selectively to their corresponding EGFR antigens on the surfaces of tumor cells. This
was done in an attempt to create a new tumor cell detection method.7
However, antibodies have their limitations. Primarily, antibodies cannot be so easily manufactured as
aptamers. Antibodies must be collected from live specimens while aptamers can be synthesized
artificially with high reproducibility and chemical stability.8 Additionally, antibodies can only be
7 (Crow, Grant, Provenzale, & Wax, 2009)
8 (Song, Wang, Li, Zhao, & Fan, 2008)

12
harvested that specifically bind to known un-mutated antigens while aptamers can be made that can
detect for specific types of mutations.
Benefits of Using Aptamers
Artificially Selective Binding
Owing to their artificial creation, aptamers can be created to bind to specific, desired sites on a target
molecule. This control is lost when using antibodies, as this decision is controlled by the immune system
of the organism the antibody was harvested from.9 Thus, reproducible results are not always
guaranteed.
Stability
Due to their simple makeup of small sequences of stable nucleic acids, artificially created aptamers are
significantly more stable than their protein counterparts are. This stability lends itself to increased shelf
life, resistance to temperature changes that would normally denature proteins, and some tolerance for
non-physiological conditions. Additionally, aptamers can be forced to resume their original
conformations after use and are thus somewhat reusable (Mok et al.). This can be done by immersing
bound aptamers in a highly ionic solution, such as 1.0 M HCL, as reported by Radi et al.10
Viability for In Vivo Studies and Applications
Unlike antibodies, which can cause an immune response when used in vivo, aptamers do not signal an
immune reaction (Mok et al.). In vivo, aptamers are rapidly cleaved by nucleases into smaller pieces;
however, through modification of the aptamer’s terminal group with either 2’-amino, 2’-fluoro, or 2’-O-
alky groups, the aptamers can be made resistant to nuclease degradation.11 This is particularly
important both for future applications of aptamers based pharmaceuticals as well as in vivo detection
methods.
Relatively Simple Structure
Because aptamers are composed of a small number of nucleotides in an easily discernable sequence, the
effect of side reactions as well as undesirable main reaction pathways can be minimized. This is
especially important when it is necessary to modify specific sites of a biosensing molecule.
Current Detection Methods Using Aptamer Biosensors
Optical Fluorescence Detection Using Aptamers
Fluorescence imaging is not a new concept, nor is it in the field of biosensing; however, it remains a
potent tool for the detection of biomolecules. There are several different types of fluorescent-aptamer
sensors available. Below, a few of these designs are briefly summarized. Further information can be
found in a review by Mok et al. It should be noted that any modifications to aptamers with fluorophores
must be done in a way that minimizes any effect on the aptamer’s structure. If the modifications alter
the aptamer’s conformation, steps must be taken to reform the binding site’s conformation.
9 (Mok & Li, 2008)
10 (Radi, Sanchez, Baldrich, & O'Sullivan, 2005)
11 (Pieken, Olsen, Aurup, Benseler, & Eckstein, 1991)
13
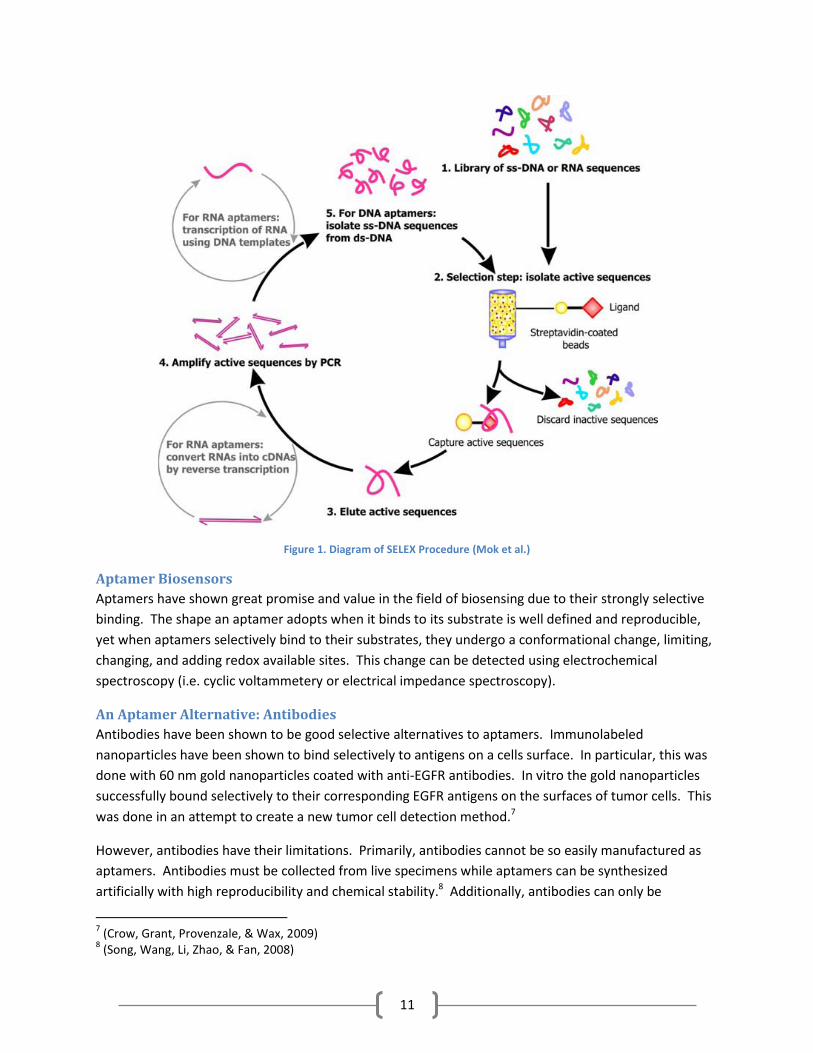
Single Fluorophore
With this method, a fluorescent molecule is chemically bound to the aptamer. It is important to
understand the reaction mechanism as it is necessary to bind the fluorophore at a site that will undergo
a significant structural/conformational change upon binding to the target molecule. As concluded by
Katilius et al., IgE aptamers should be modified in the loop region because they undergo a
conformational change from a loop-hairpin structure to a structure with two loops (or vice versa), 12 as
seen in Figure 2.
Figure 2. Conformational Change of IgE upon Binding (Katilius et al.)
A change in fluorescence intensity is used to detect binding. As found by Katilius et al., modification of
IgE aptamer by 2-aminopurine resulted in a 5.6-fold increase in fluorescence intensity upon binding to
IgE as compared to unbound IgE (Katilius et al.). Though this method is relatively simple to reproduce, it
involves modification of the aptamer at its binding site, reducing the aptamers binding affinity and
specificity. As reported by Katilius et al., addition of 2-aminopurine resulted in an increase in the
aptamer’s apparent Kd value from 10 nM to 46 +/- 6 nM. Though this interference is not inhibitory, it
illuminates a problem with fluorescence detection that is not present in EIS detection, where the
aptamer’s binding site remains unmodified.
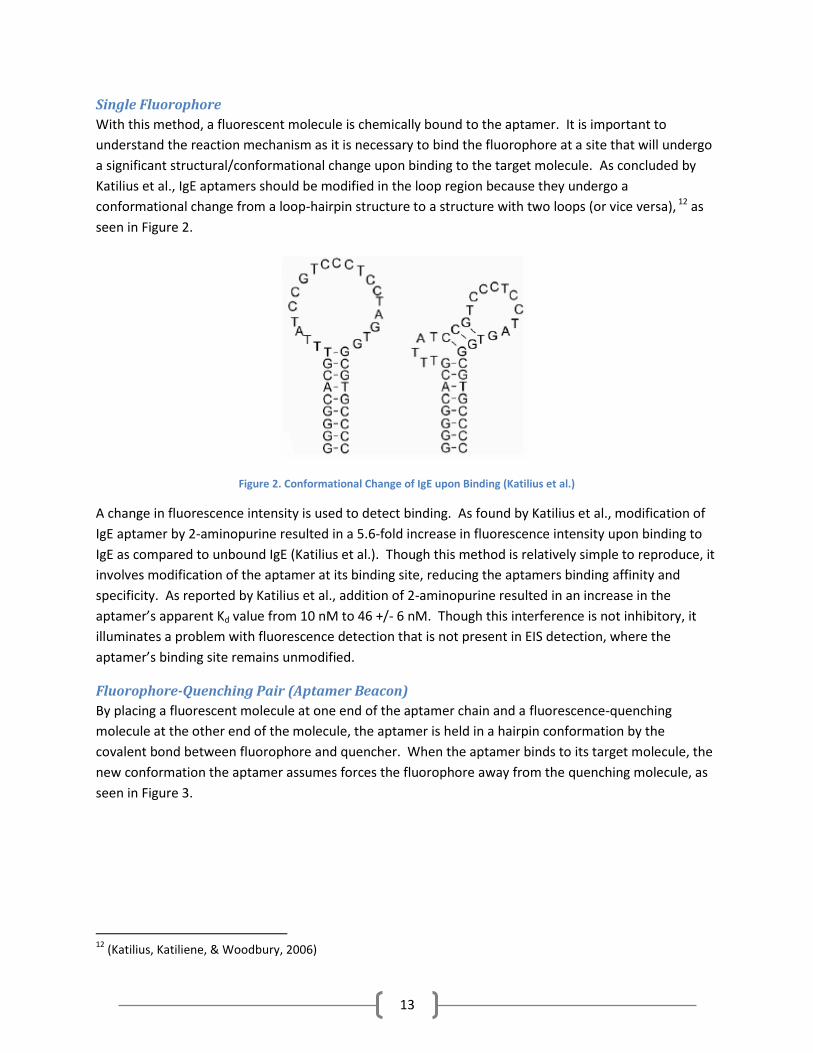
Fluorophore-Quenching Pair (Aptamer Beacon)
By placing a fluorescent molecule at one end of the aptamer chain and a fluorescence-quenching
molecule at the other end of the molecule, the aptamer is held in a hairpin conformation by the
covalent bond between fluorophore and quencher. When the aptamer binds to its target molecule, the
new conformation the aptamer assumes forces the fluorophore away from the quenching molecule, as
seen in Figure 3.
12
(Katilius, Katiliene, & Woodbury, 2006)
14
Figure 3. Change in Conformation of an Aptamer Beacon upon Binding to its Target Molecule (Mok et al.)
Binding can be inferred by an increase in fluorescence intensity. In an experiment conducted by Fang
et al. using the β chain of platelet-derived growth factor (PDGF-β) and its corresponding engineered
aptamer beacon, a minimum detection limit of 110 pM was found after only 20 seconds after
administration of PDGF-β.13 One particular advantage of this method over other fluorescence detection
methods is the elimination of potentially false signals resulting from DNA degradation. This problem is
especially important when conducting studies with biological specimens containing nucleases. Fang et
al., successfully detected different isoforms of PDGF-β in a human breast carcinoma cell line, HTB-26
(Fang et al.).
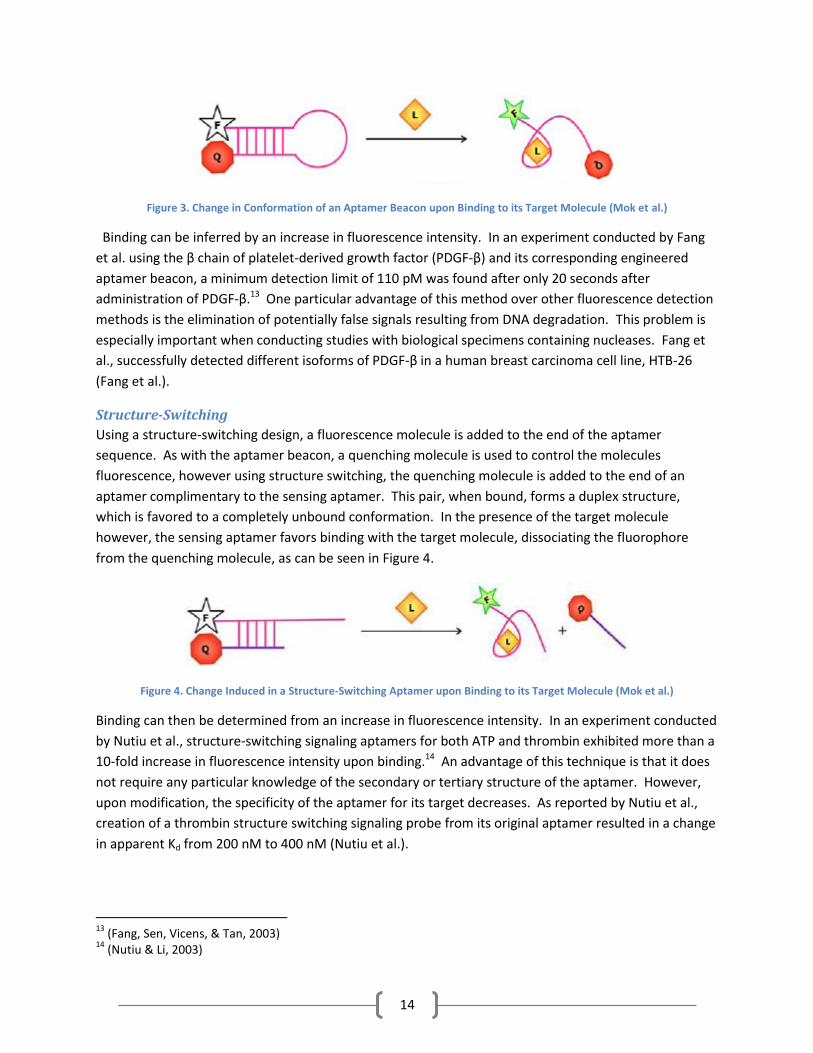
Structure-Switching
Using a structure-switching design, a fluorescence molecule is added to the end of the aptamer
sequence. As with the aptamer beacon, a quenching molecule is used to control the molecules
fluorescence, however using structure switching, the quenching molecule is added to the end of an
aptamer complimentary to the sensing aptamer. This pair, when bound, forms a duplex structure,
which is favored to a completely unbound conformation. In the presence of the target molecule
however, the sensing aptamer favors binding with the target molecule, dissociating the fluorophore
from the quenching molecule, as can be seen in Figure 4.
Figure 4. Change Induced in a Structure-Switching Aptamer upon Binding to its Target Molecule (Mok et al.)
Binding can then be determined from an increase in fluorescence intensity. In an experiment conducted
by Nutiu et al., structure-switching signaling aptamers for both ATP and thrombin exhibited more than a
10-fold increase in fluorescence intensity upon binding.14 An advantage of this technique is that it does
not require any particular knowledge of the secondary or tertiary structure of the aptamer. However,
upon modification, the specificity of the aptamer for its target decreases. As reported by Nutiu et al.,
creation of a thrombin structure switching signaling probe from its original aptamer resulted in a change
in apparent Kd from 200 nM to 400 nM (Nutiu et al.).
13
(Fang, Sen, Vicens, & Tan, 2003) 14
(Nutiu & Li, 2003)
15
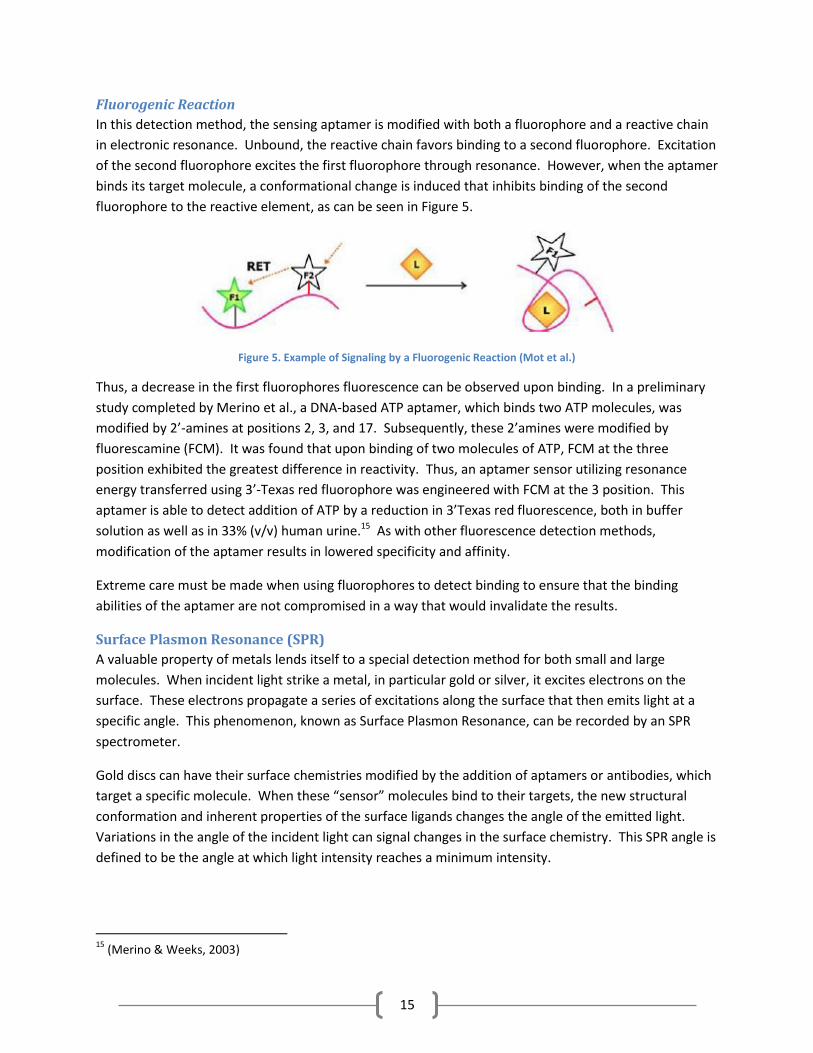
Fluorogenic Reaction
In this detection method, the sensing aptamer is modified with both a fluorophore and a reactive chain
in electronic resonance. Unbound, the reactive chain favors binding to a second fluorophore. Excitation
of the second fluorophore excites the first fluorophore through resonance. However, when the aptamer
binds its target molecule, a conformational change is induced that inhibits binding of the second
fluorophore to the reactive element, as can be seen in Figure 5.
Figure 5. Example of Signaling by a Fluorogenic Reaction (Mot et al.)
Thus, a decrease in the first fluorophores fluorescence can be observed upon binding. In a preliminary
study completed by Merino et al., a DNA-based ATP aptamer, which binds two ATP molecules, was
modified by 2’-amines at positions 2, 3, and 17. Subsequently, these 2’amines were modified by
fluorescamine (FCM). It was found that upon binding of two molecules of ATP, FCM at the three
position exhibited the greatest difference in reactivity. Thus, an aptamer sensor utilizing resonance
energy transferred using 3’-Texas red fluorophore was engineered with FCM at the 3 position. This
aptamer is able to detect addition of ATP by a reduction in 3’Texas red fluorescence, both in buffer
solution as well as in 33% (v/v) human urine.15 As with other fluorescence detection methods,
modification of the aptamer results in lowered specificity and affinity.
Extreme care must be made when using fluorophores to detect binding to ensure that the binding
abilities of the aptamer are not compromised in a way that would invalidate the results.
Surface Plasmon Resonance (SPR)
A valuable property of metals lends itself to a special detection method for both small and large
molecules. When incident light strike a metal, in particular gold or silver, it excites electrons on the
surface. These electrons propagate a series of excitations along the surface that then emits light at a
specific angle. This phenomenon, known as Surface Plasmon Resonance, can be recorded by an SPR
spectrometer.
Gold discs can have their surface chemistries modified by the addition of aptamers or antibodies, which
target a specific molecule. When these “sensor” molecules bind to their targets, the new structural
conformation and inherent properties of the surface ligands changes the angle of the emitted light.
Variations in the angle of the incident light can signal changes in the surface chemistry. This SPR angle is
defined to be the angle at which light intensity reaches a minimum intensity.
15
(Merino & Weeks, 2003)
16
In a study completed by Wang et al. that utilized an aptamer-IgE-aptamer-Au NP sandwich method,
detection of human IgE was amplified to 1 ng/ml.16 This study utilized the intrinsic property of gold
nanoparticles to enhance the sensitivity of SPR detection through an electronic coupling interaction
between the localized surface Plasmon of the nanoparticles and the surface Plasmon wave of the gold
film.17
Observable Changes in SPR of Gold Nanoparticles
Since the Middle Ages, artists and scientists have been utilizing the ability of solutions of gold
nanoparticles to change color from red to violet as the solution changed from a colloidal dispersion state
to an a state of aggregation. This is a result of a change in the surface Plasmon resonance of the gold
nanoparticles18 that arises from their distance dependent optical properties.
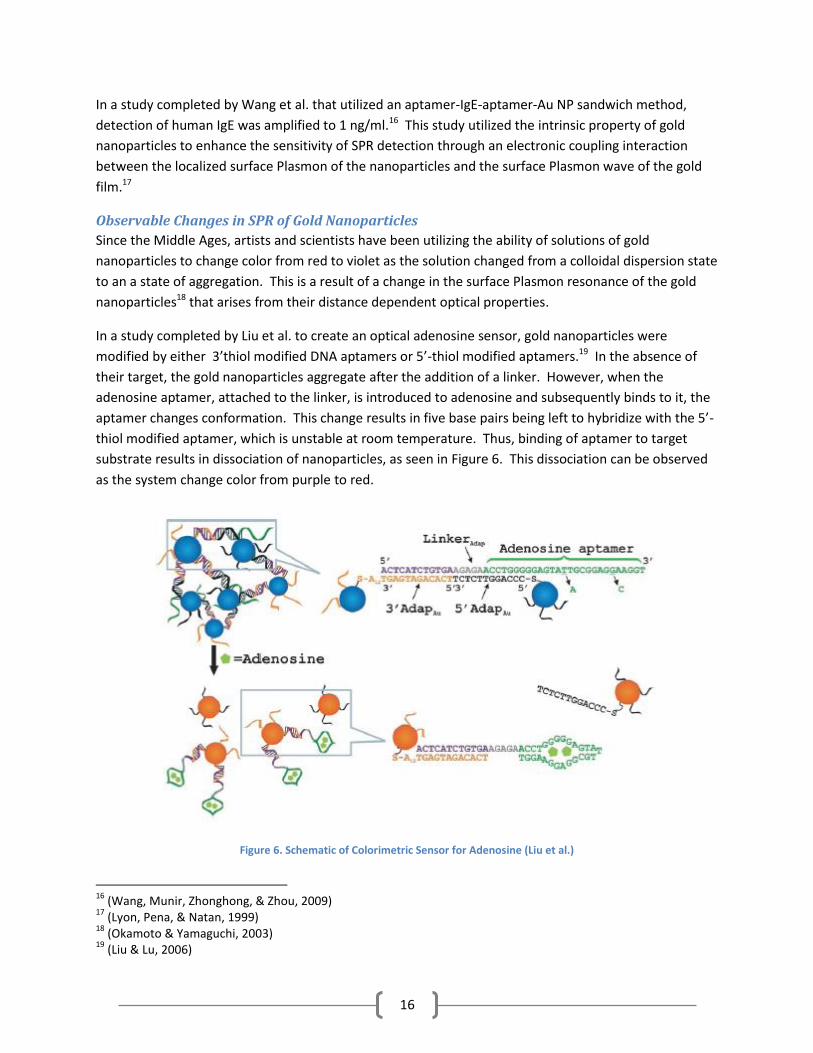
In a study completed by Liu et al. to create an optical adenosine sensor, gold nanoparticles were
modified by either 3’thiol modified DNA aptamers or 5’-thiol modified aptamers.19 In the absence of
their target, the gold nanoparticles aggregate after the addition of a linker. However, when the
adenosine aptamer, attached to the linker, is introduced to adenosine and subsequently binds to it, the
aptamer changes conformation. This change results in five base pairs being left to hybridize with the 5’-
thiol modified aptamer, which is unstable at room temperature. Thus, binding of aptamer to target
substrate results in dissociation of nanoparticles, as seen in Figure 6. This dissociation can be observed
as the system change color from purple to red.
Figure 6. Schematic of Colorimetric Sensor for Adenosine (Liu et al.)
16
(Wang, Munir, Zhonghong, & Zhou, 2009) 17
(Lyon, Pena, & Natan, 1999) 18
(Okamoto & Yamaguchi, 2003) 19
(Liu & Lu, 2006)
17
Observable aptamer-based colorimetric biosensors present some advantages over traditional laboratory
detection methods. Most importantly, these sensors can produce a color change within seconds at
room temperature to signal the presence of their target substrates.20 Additionally, the sensors can be
used without the necessity for large and expensive laboratory equipment in a variety of roles, such as in
the detection of illicit substances by law enforcement. However, these sensors lack the ability to detect
precise concentrations of their substrates, and thus, they have limited practical use in laboratory
settings.
Quantum Dot (QD) Sensors
Properties of Quantum Dots
Quantum dots are nanocrystals usually composed of elements from either the II and VI groups or the III
and V groups. These quantum dots have very small radii that give them unique electrical and optical
properties. Because of their size, quantum dots exhibit electron confinement.21 This results in a narrow
characteristic emission spectrum. By fine-tuning the size of the quantum dot, these electrical and
optical properties can be manipulated. Quantum dots are a valuable alternative to fluorophores as they
show resistance to photobleaching.
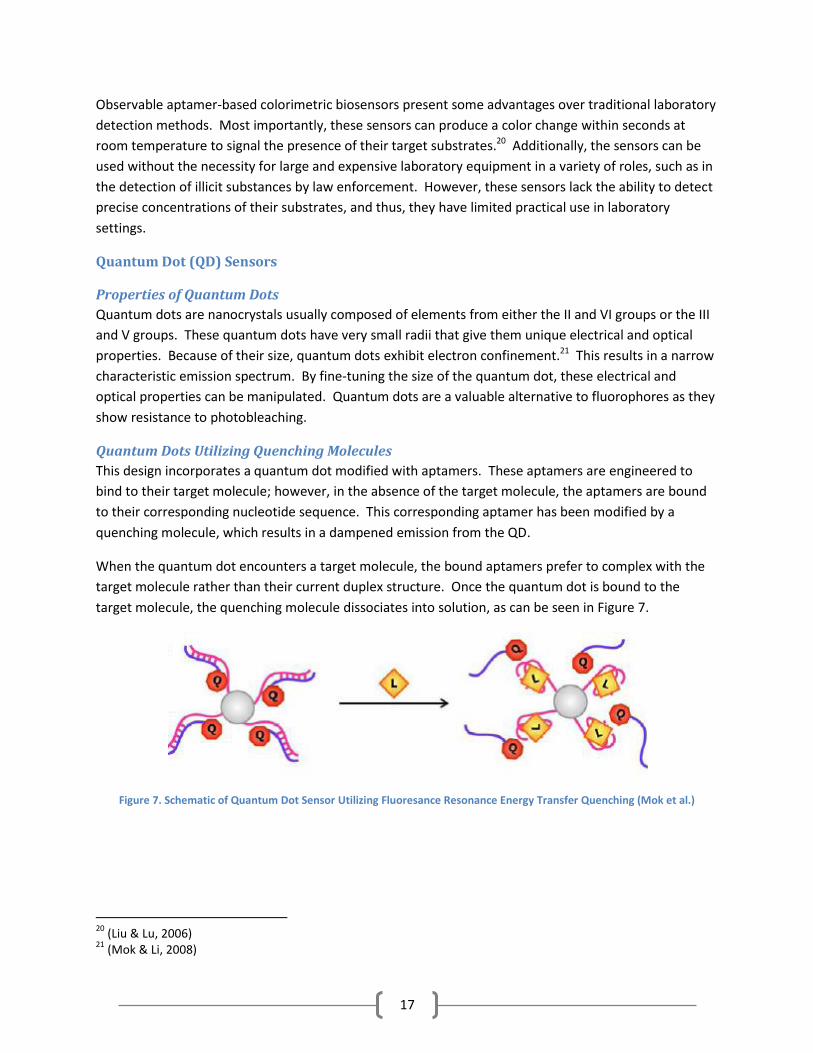
Quantum Dots Utilizing Quenching Molecules
This design incorporates a quantum dot modified with aptamers. These aptamers are engineered to
bind to their target molecule; however, in the absence of the target molecule, the aptamers are bound
to their corresponding nucleotide sequence. This corresponding aptamer has been modified by a
quenching molecule, which results in a dampened emission from the QD.
When the quantum dot encounters a target molecule, the bound aptamers prefer to complex with the
target molecule rather than their current duplex structure. Once the quantum dot is bound to the
target molecule, the quenching molecule dissociates into solution, as can be seen in Figure 7.
Figure 7. Schematic of Quantum Dot Sensor Utilizing Fluoresance Resonance Energy Transfer Quenching (Mok et al.)
20
(Liu & Lu, 2006) 21
(Mok & Li, 2008)
18
An increase in photoemissions from quantum dots signals binding. In an experiment conducted by Levy
et al. using fluorescent quantum dots as signaling agents, a 19-fold increase in fluorescence was
detected upon addition of the target substrate, thrombin.22
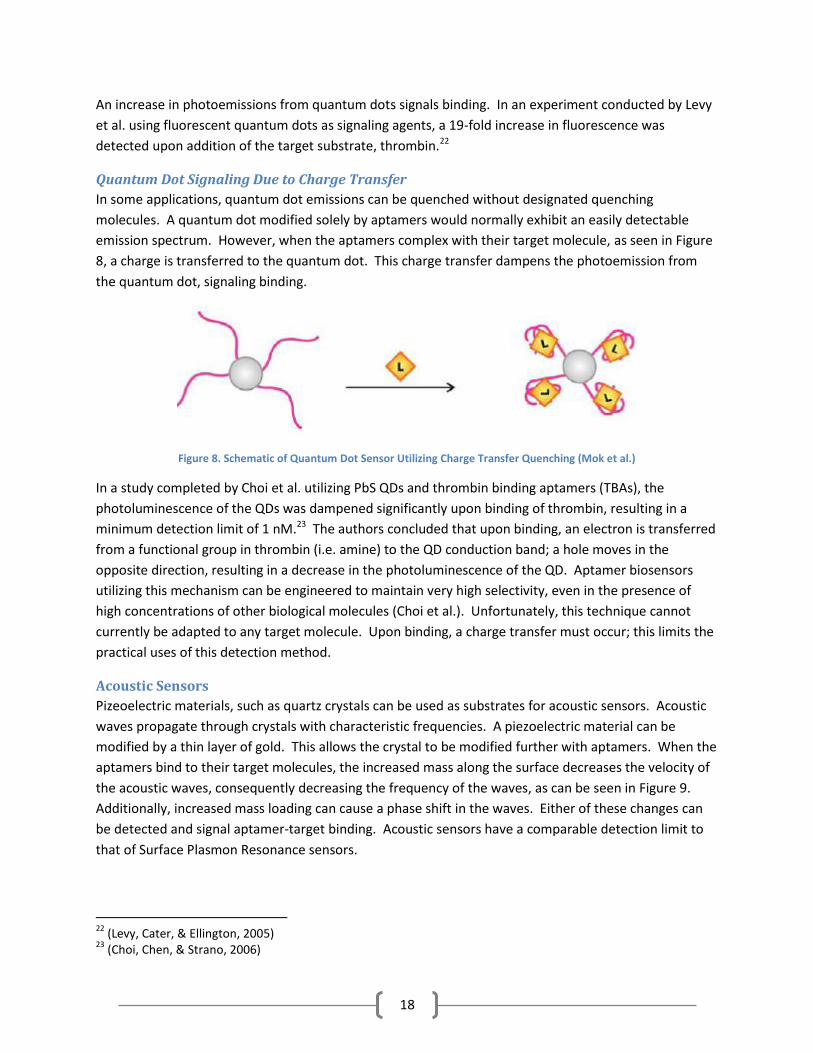
Quantum Dot Signaling Due to Charge Transfer
In some applications, quantum dot emissions can be quenched without designated quenching
molecules. A quantum dot modified solely by aptamers would normally exhibit an easily detectable
emission spectrum. However, when the aptamers complex with their target molecule, as seen in Figure
8, a charge is transferred to the quantum dot. This charge transfer dampens the photoemission from
the quantum dot, signaling binding.
Figure 8. Schematic of Quantum Dot Sensor Utilizing Charge Transfer Quenching (Mok et al.)
In a study completed by Choi et al. utilizing PbS QDs and thrombin binding aptamers (TBAs), the
photoluminescence of the QDs was dampened significantly upon binding of thrombin, resulting in a
minimum detection limit of 1 nM.23 The authors concluded that upon binding, an electron is transferred
from a functional group in thrombin (i.e. amine) to the QD conduction band; a hole moves in the
opposite direction, resulting in a decrease in the photoluminescence of the QD. Aptamer biosensors
utilizing this mechanism can be engineered to maintain very high selectivity, even in the presence of
high concentrations of other biological molecules (Choi et al.). Unfortunately, this technique cannot
currently be adapted to any target molecule. Upon binding, a charge transfer must occur; this limits the
practical uses of this detection method.
Acoustic Sensors
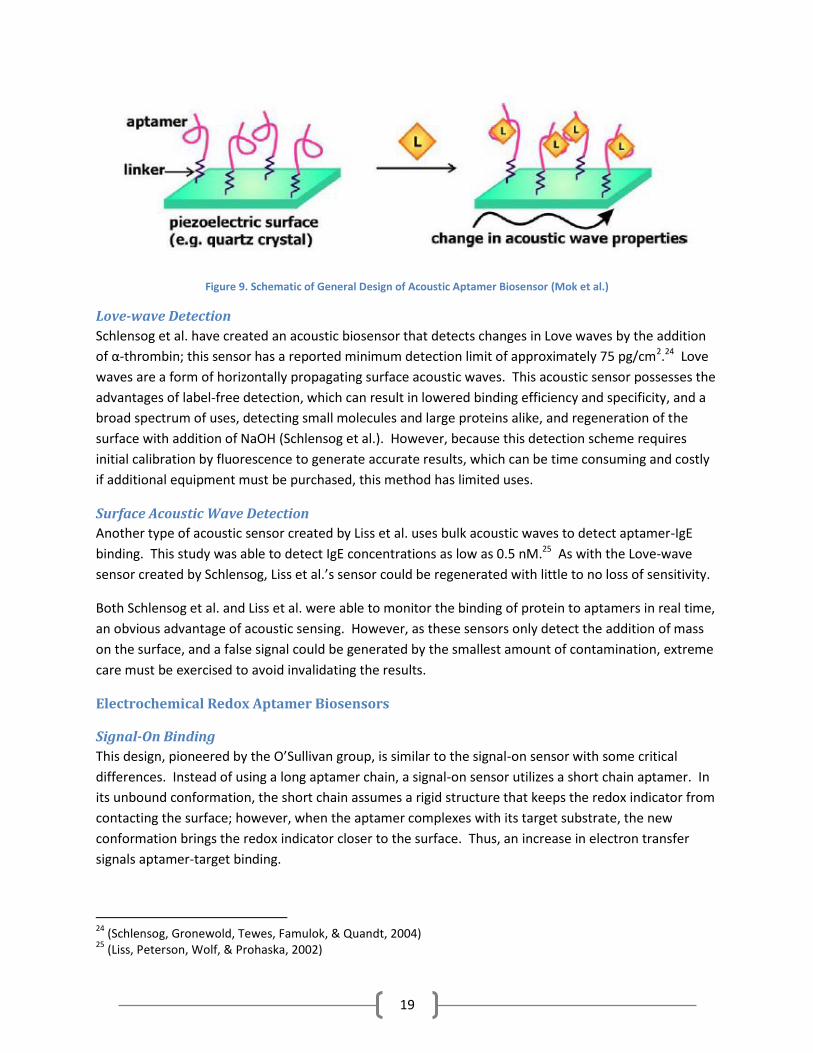
Pizeoelectric materials, such as quartz crystals can be used as substrates for acoustic sensors. Acoustic
waves propagate through crystals with characteristic frequencies. A piezoelectric material can be
modified by a thin layer of gold. This allows the crystal to be modified further with aptamers. When the
aptamers bind to their target molecules, the increased mass along the surface decreases the velocity of
the acoustic waves, consequently decreasing the frequency of the waves, as can be seen in Figure 9.
Additionally, increased mass loading can cause a phase shift in the waves. Either of these changes can
be detected and signal aptamer-target binding. Acoustic sensors have a comparable detection limit to
that of Surface Plasmon Resonance sensors.
22
(Levy, Cater, & Ellington, 2005) 23
(Choi, Chen, & Strano, 2006)
19
Figure 9. Schematic of General Design of Acoustic Aptamer Biosensor (Mok et al.)
Love-wave Detection
Schlensog et al. have created an acoustic biosensor that detects changes in Love waves by the addition
of α-thrombin; this sensor has a reported minimum detection limit of approximately 75 pg/cm2.24 Love
waves are a form of horizontally propagating surface acoustic waves. This acoustic sensor possesses the
advantages of label-free detection, which can result in lowered binding efficiency and specificity, and a
broad spectrum of uses, detecting small molecules and large proteins alike, and regeneration of the
surface with addition of NaOH (Schlensog et al.). However, because this detection scheme requires
initial calibration by fluorescence to generate accurate results, which can be time consuming and costly
if additional equipment must be purchased, this method has limited uses.
Surface Acoustic Wave Detection
Another type of acoustic sensor created by Liss et al. uses bulk acoustic waves to detect aptamer-IgE
binding. This study was able to detect IgE concentrations as low as 0.5 nM.25 As with the Love-wave
sensor created by Schlensog, Liss et al.’s sensor could be regenerated with little to no loss of sensitivity.
Both Schlensog et al. and Liss et al. were able to monitor the binding of protein to aptamers in real time,
an obvious advantage of acoustic sensing. However, as these sensors only detect the addition of mass
on the surface, and a false signal could be generated by the smallest amount of contamination, extreme
care must be exercised to avoid invalidating the results.
Electrochemical Redox Aptamer Biosensors
Signal-On Binding
This design, pioneered by the O’Sullivan group, is similar to the signal-on sensor with some critical
differences. Instead of using a long aptamer chain, a signal-on sensor utilizes a short chain aptamer. In
its unbound conformation, the short chain assumes a rigid structure that keeps the redox indicator from
contacting the surface; however, when the aptamer complexes with its target substrate, the new
conformation brings the redox indicator closer to the surface. Thus, an increase in electron transfer
signals aptamer-target binding.
24
(Schlensog, Gronewold, Tewes, Famulok, & Quandt, 2004) 25
(Liss, Peterson, Wolf, & Prohaska, 2002)
20
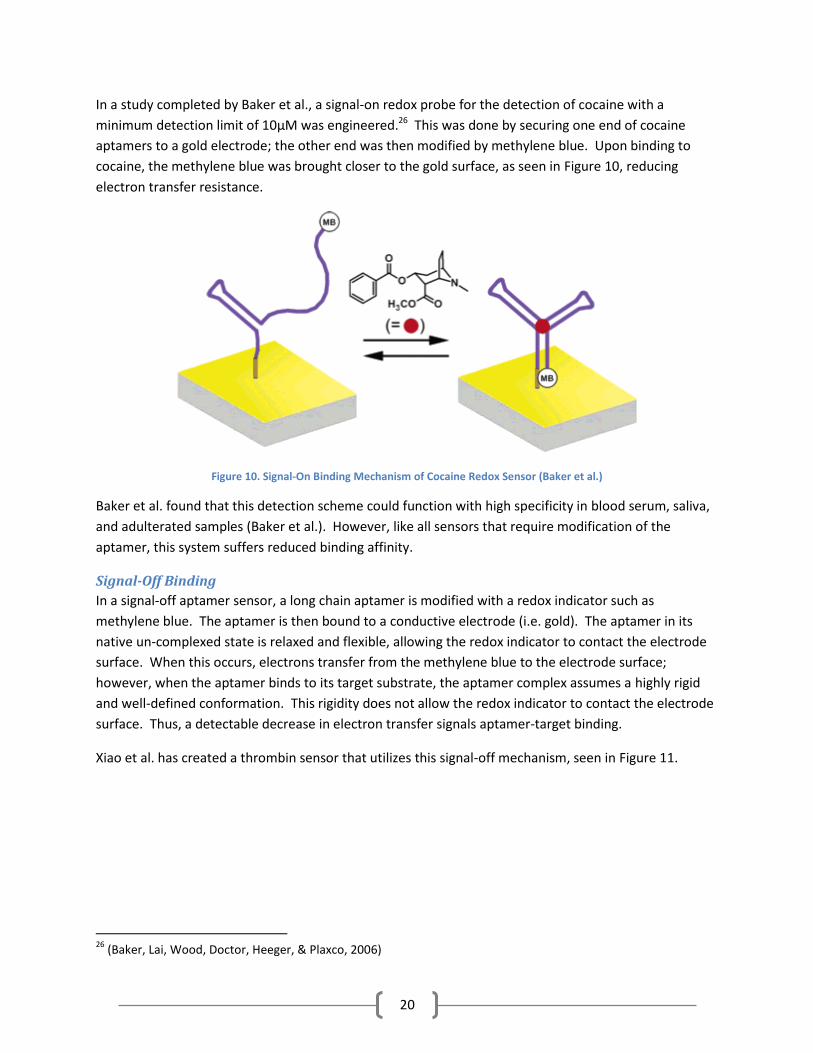
In a study completed by Baker et al., a signal-on redox probe for the detection of cocaine with a
minimum detection limit of 10μM was engineered.26 This was done by securing one end of cocaine
aptamers to a gold electrode; the other end was then modified by methylene blue. Upon binding to
cocaine, the methylene blue was brought closer to the gold surface, as seen in Figure 10, reducing
electron transfer resistance.
Figure 10. Signal-On Binding Mechanism of Cocaine Redox Sensor (Baker et al.)
Baker et al. found that this detection scheme could function with high specificity in blood serum, saliva,
and adulterated samples (Baker et al.). However, like all sensors that require modification of the
aptamer, this system suffers reduced binding affinity.
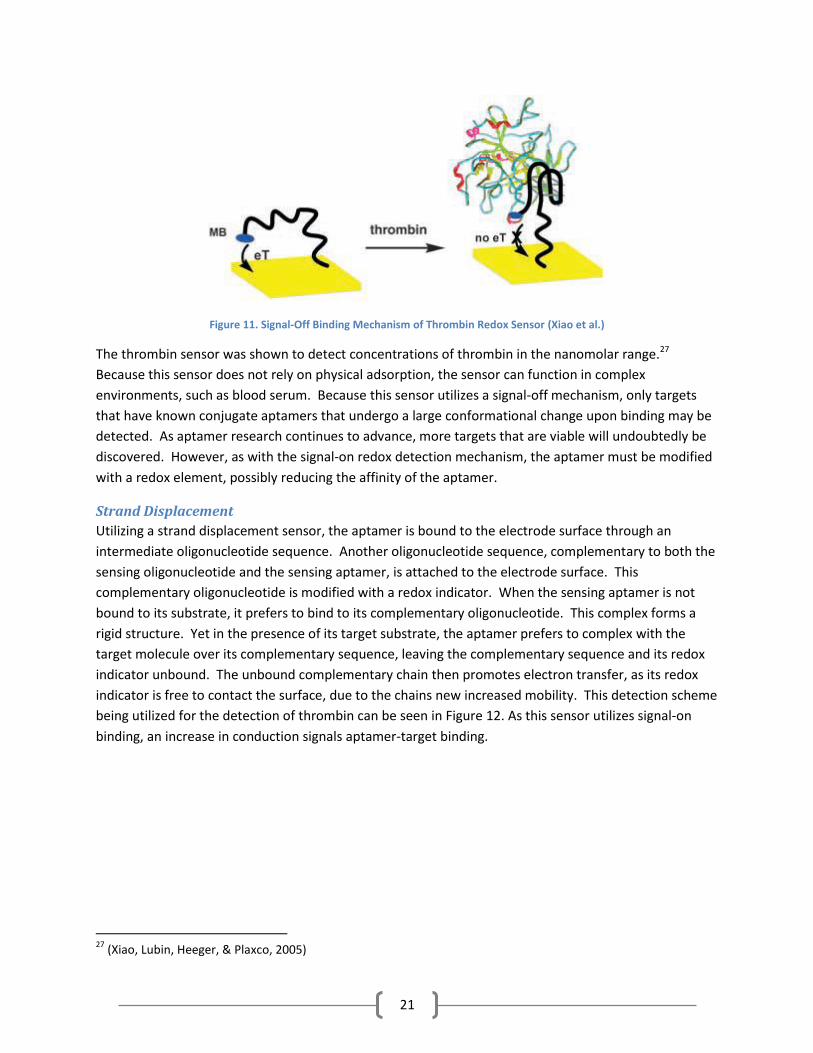
Signal-Off Binding
In a signal-off aptamer sensor, a long chain aptamer is modified with a redox indicator such as
methylene blue. The aptamer is then bound to a conductive electrode (i.e. gold). The aptamer in its
native un-complexed state is relaxed and flexible, allowing the redox indicator to contact the electrode
surface. When this occurs, electrons transfer from the methylene blue to the electrode surface;
however, when the aptamer binds to its target substrate, the aptamer complex assumes a highly rigid
and well-defined conformation. This rigidity does not allow the redox indicator to contact the electrode
surface. Thus, a detectable decrease in electron transfer signals aptamer-target binding.
Xiao et al. has created a thrombin sensor that utilizes this signal-off mechanism, seen in Figure 11.
26
(Baker, Lai, Wood, Doctor, Heeger, & Plaxco, 2006)
21
Figure 11. Signal-Off Binding Mechanism of Thrombin Redox Sensor (Xiao et al.)
The thrombin sensor was shown to detect concentrations of thrombin in the nanomolar range.27
Because this sensor does not rely on physical adsorption, the sensor can function in complex
environments, such as blood serum. Because this sensor utilizes a signal-off mechanism, only targets
that have known conjugate aptamers that undergo a large conformational change upon binding may be
detected. As aptamer research continues to advance, more targets that are viable will undoubtedly be
discovered. However, as with the signal-on redox detection mechanism, the aptamer must be modified
with a redox element, possibly reducing the affinity of the aptamer.
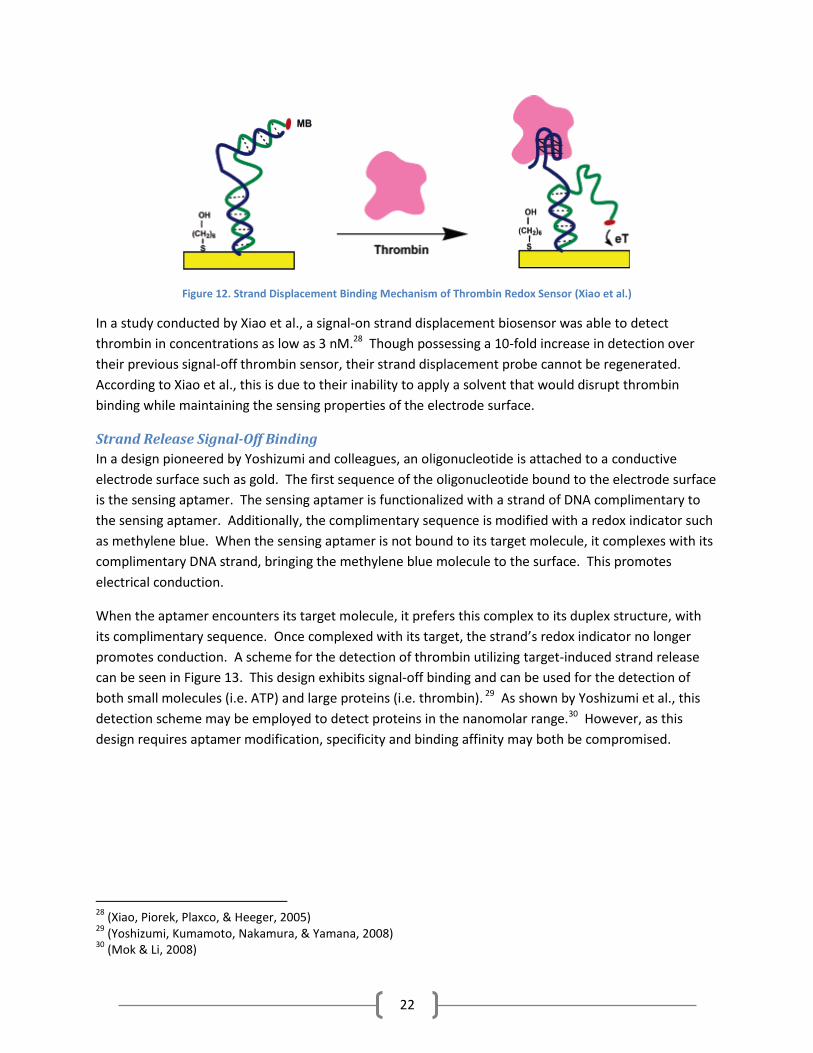
Strand Displacement
Utilizing a strand displacement sensor, the aptamer is bound to the electrode surface through an
intermediate oligonucleotide sequence. Another oligonucleotide sequence, complementary to both the
sensing oligonucleotide and the sensing aptamer, is attached to the electrode surface. This
complementary oligonucleotide is modified with a redox indicator. When the sensing aptamer is not
bound to its substrate, it prefers to bind to its complementary oligonucleotide. This complex forms a
rigid structure. Yet in the presence of its target substrate, the aptamer prefers to complex with the
target molecule over its complementary sequence, leaving the complementary sequence and its redox
indicator unbound. The unbound complementary chain then promotes electron transfer, as its redox
indicator is free to contact the surface, due to the chains new increased mobility. This detection scheme
being utilized for the detection of thrombin can be seen in Figure 12. As this sensor utilizes signal-on
binding, an increase in conduction signals aptamer-target binding.
27
(Xiao, Lubin, Heeger, & Plaxco, 2005)
22
Figure 12. Strand Displacement Binding Mechanism of Thrombin Redox Sensor (Xiao et al.)
In a study conducted by Xiao et al., a signal-on strand displacement biosensor was able to detect
thrombin in concentrations as low as 3 nM.28 Though possessing a 10-fold increase in detection over
their previous signal-off thrombin sensor, their strand displacement probe cannot be regenerated.
According to Xiao et al., this is due to their inability to apply a solvent that would disrupt thrombin
binding while maintaining the sensing properties of the electrode surface.
Strand Release Signal-Off Binding
In a design pioneered by Yoshizumi and colleagues, an oligonucleotide is attached to a conductive
electrode surface such as gold. The first sequence of the oligonucleotide bound to the electrode surface
is the sensing aptamer. The sensing aptamer is functionalized with a strand of DNA complimentary to
the sensing aptamer. Additionally, the complimentary sequence is modified with a redox indicator such
as methylene blue. When the sensing aptamer is not bound to its target molecule, it complexes with its
complimentary DNA strand, bringing the methylene blue molecule to the surface. This promotes
electrical conduction.
When the aptamer encounters its target molecule, it prefers this complex to its duplex structure, with
its complimentary sequence. Once complexed with its target, the strand’s redox indicator no longer
promotes conduction. A scheme for the detection of thrombin utilizing target-induced strand release
can be seen in Figure 13. This design exhibits signal-off binding and can be used for the detection of
both small molecules (i.e. ATP) and large proteins (i.e. thrombin). 29 As shown by Yoshizumi et al., this
detection scheme may be employed to detect proteins in the nanomolar range.30 However, as this
design requires aptamer modification, specificity and binding affinity may both be compromised.
28
(Xiao, Piorek, Plaxco, & Heeger, 2005) 29
(Yoshizumi, Kumamoto, Nakamura, & Yamana, 2008) 30
(Mok & Li, 2008)
23
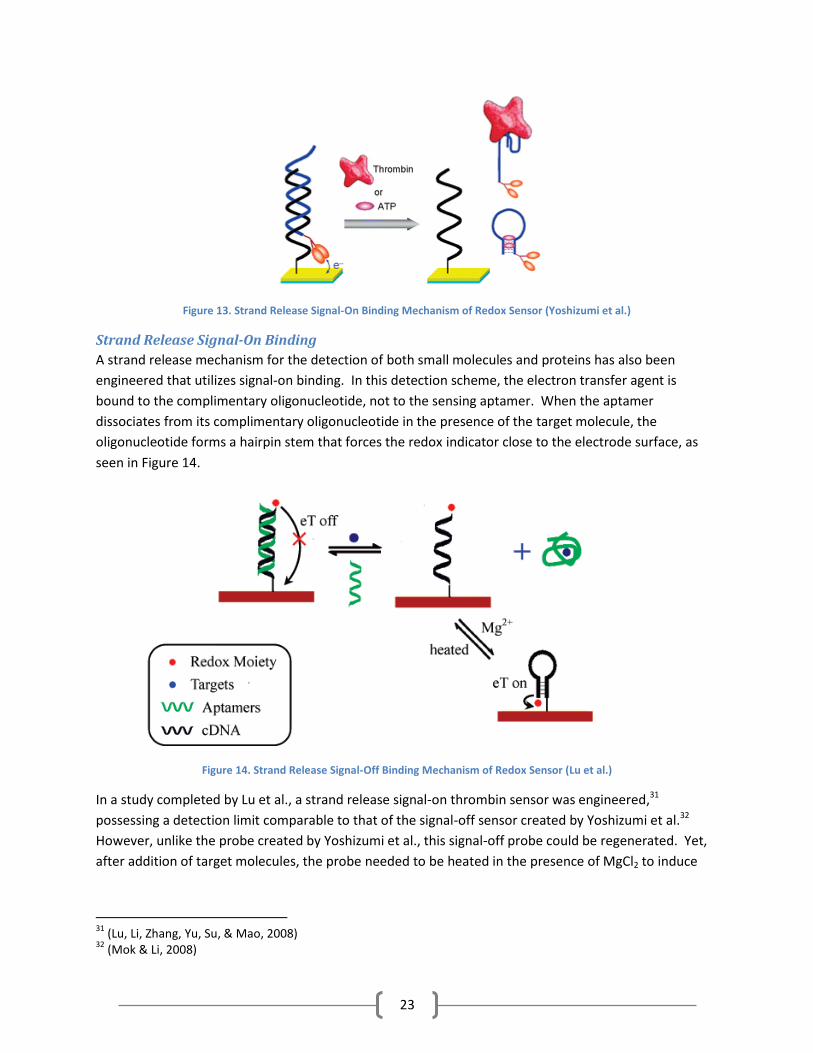
Figure 13. Strand Release Signal-On Binding Mechanism of Redox Sensor (Yoshizumi et al.)
Strand Release Signal-On Binding
A strand release mechanism for the detection of both small molecules and proteins has also been
engineered that utilizes signal-on binding. In this detection scheme, the electron transfer agent is
bound to the complimentary oligonucleotide, not to the sensing aptamer. When the aptamer
dissociates from its complimentary oligonucleotide in the presence of the target molecule, the
oligonucleotide forms a hairpin stem that forces the redox indicator close to the electrode surface, as
seen in Figure 14.
Figure 14. Strand Release Signal-Off Binding Mechanism of Redox Sensor (Lu et al.)
In a study completed by Lu et al., a strand release signal-on thrombin sensor was engineered,31
possessing a detection limit comparable to that of the signal-off sensor created by Yoshizumi et al.32
However, unlike the probe created by Yoshizumi et al., this signal-off probe could be regenerated. Yet,
after addition of target molecules, the probe needed to be heated in the presence of MgCl2 to induce
31
(Lu, Li, Zhang, Yu, Su, & Mao, 2008) 32
(Mok & Li, 2008)
24
hairpin stem formation of the oligonucleotide labeled with the ferrocene redox indicator.33 Though the
design presented by Lu et al. can be regenerated, the steps necessary to induce hairpin stem formation
limit its uses.
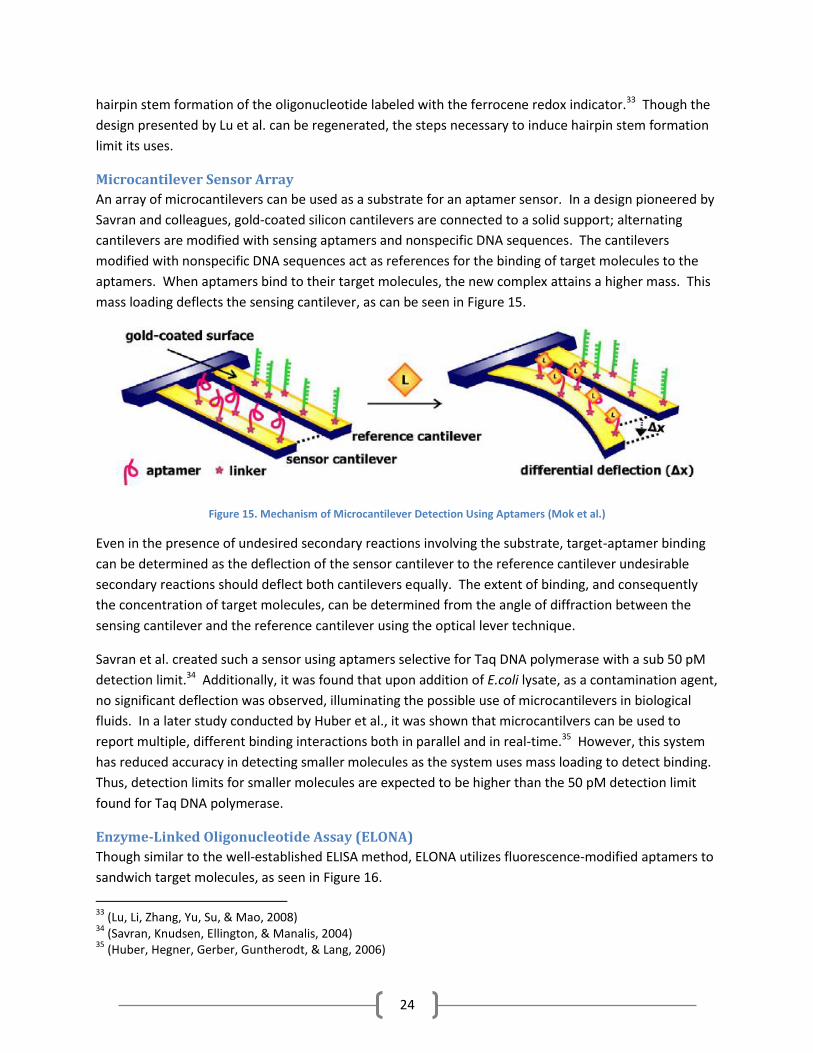
Microcantilever Sensor Array
An array of microcantilevers can be used as a substrate for an aptamer sensor. In a design pioneered by
Savran and colleagues, gold-coated silicon cantilevers are connected to a solid support; alternating
cantilevers are modified with sensing aptamers and nonspecific DNA sequences. The cantilevers
modified with nonspecific DNA sequences act as references for the binding of target molecules to the
aptamers. When aptamers bind to their target molecules, the new complex attains a higher mass. This
mass loading deflects the sensing cantilever, as can be seen in Figure 15.
Figure 15. Mechanism of Microcantilever Detection Using Aptamers (Mok et al.)
Even in the presence of undesired secondary reactions involving the substrate, target-aptamer binding
can be determined as the deflection of the sensor cantilever to the reference cantilever undesirable
secondary reactions should deflect both cantilevers equally. The extent of binding, and consequently
the concentration of target molecules, can be determined from the angle of diffraction between the
sensing cantilever and the reference cantilever using the optical lever technique.
Savran et al. created such a sensor using aptamers selective for Taq DNA polymerase with a sub 50 pM
detection limit.34 Additionally, it was found that upon addition of E.coli lysate, as a contamination agent,
no significant deflection was observed, illuminating the possible use of microcantilevers in biological
fluids. In a later study conducted by Huber et al., it was shown that microcantilvers can be used to
report multiple, different binding interactions both in parallel and in real-time.35 However, this system
has reduced accuracy in detecting smaller molecules as the system uses mass loading to detect binding.
Thus, detection limits for smaller molecules are expected to be higher than the 50 pM detection limit
found for Taq DNA polymerase.
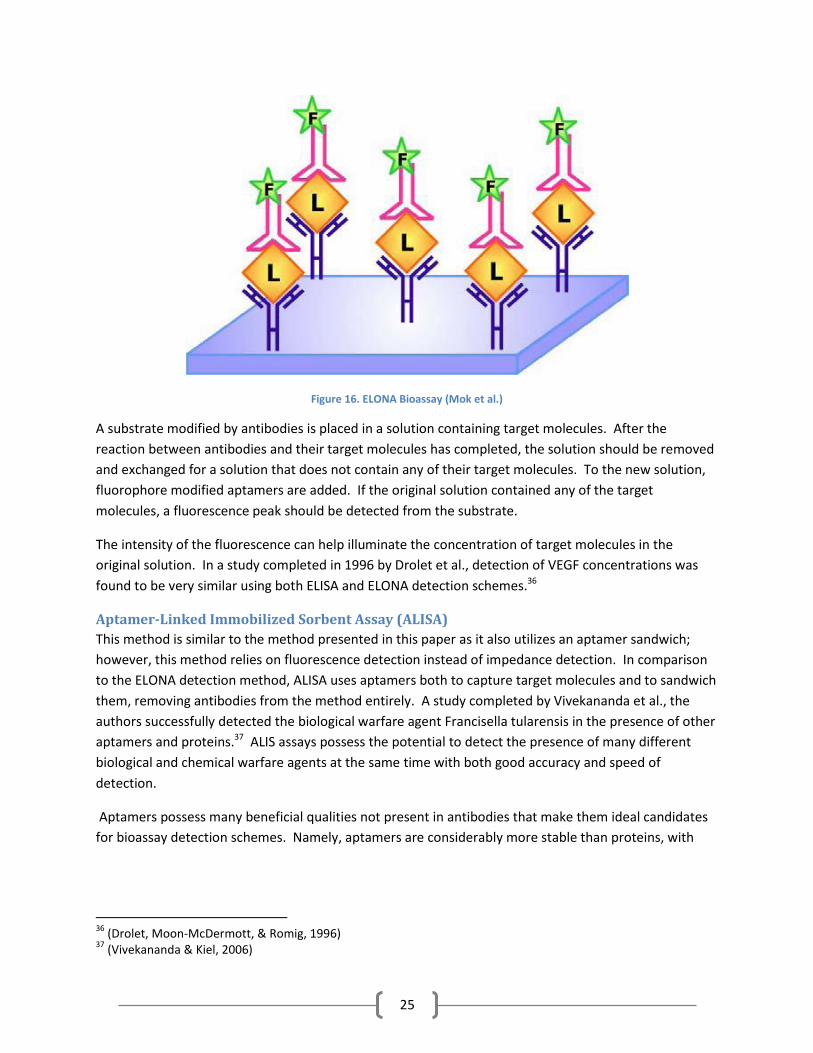
Enzyme-Linked Oligonucleotide Assay (ELONA)
Though similar to the well-established ELISA method, ELONA utilizes fluorescence-modified aptamers to
sandwich target molecules, as seen in Figure 16.
33
(Lu, Li, Zhang, Yu, Su, & Mao, 2008) 34
(Savran, Knudsen, Ellington, & Manalis, 2004) 35
(Huber, Hegner, Gerber, Guntherodt, & Lang, 2006)
25
Figure 16. ELONA Bioassay (Mok et al.)
A substrate modified by antibodies is placed in a solution containing target molecules. After the
reaction between antibodies and their target molecules has completed, the solution should be removed
and exchanged for a solution that does not contain any of their target molecules. To the new solution,
fluorophore modified aptamers are added. If the original solution contained any of the target
molecules, a fluorescence peak should be detected from the substrate.
The intensity of the fluorescence can help illuminate the concentration of target molecules in the
original solution. In a study completed in 1996 by Drolet et al., detection of VEGF concentrations was
found to be very similar using both ELISA and ELONA detection schemes.36
Aptamer-Linked Immobilized Sorbent Assay (ALISA)
This method is similar to the method presented in this paper as it also utilizes an aptamer sandwich;
however, this method relies on fluorescence detection instead of impedance detection. In comparison
to the ELONA detection method, ALISA uses aptamers both to capture target molecules and to sandwich
them, removing antibodies from the method entirely. A study completed by Vivekananda et al., the
authors successfully detected the biological warfare agent Francisella tularensis in the presence of other
aptamers and proteins.37 ALIS assays possess the potential to detect the presence of many different
biological and chemical warfare agents at the same time with both good accuracy and speed of
detection.
Aptamers possess many beneficial qualities not present in antibodies that make them ideal candidates
for bioassay detection schemes. Namely, aptamers are considerably more stable than proteins, with
36
(Drolet, Moon-McDermott, & Romig, 1996) 37
(Vivekananda & Kiel, 2006)

26
both a longer shelf life and the ability to be easily synthesized and modified. Additionally, aptamers are
10 times smaller than antibodies.38
However, unlike impedance detection schemes, both ELONA and ALISA detection schemes require
modification of aptamers with fluorescent molecules, possibly reducing the specificity of the modified
aptamer for its target.
Electrical Impedance Spectroscopy
What is Electrical Impedance Spectroscopy?
Electrical impedance is a measure of opposition to electrical current. It is necessary to use impedance
and not resistance when describing AC circuits as impedance is described in terms of both conventional
resistance and phase shift. Impedance, characterized as the ratio of voltage to current at a particular
frequency (ω), has the same unit as resistance, the Ohm, but it is usually expressed as a complex
number.
If two conductive electrodes are placed in an electrolytic solution, current will easily flow from the
anode, through the solution, and into the cathode with minimal resistance. In the case of AC current,
there will be minimal impedance. If an organic layer were to be added to one of the electrodes, the flow
of electrons would be hampered, resulting in a larger impedance. Additionally, if more non-conducting
elements were to be added to the electrode surface, the system’s impedance would increase. Electrical
impedance spectroscopy utilizes this phenomenon. An anode, often gold39 (though can be other
materials such as glassy carbon), 40 is added, along with a cathode and reference electrode to an
electrolytic solution; a potentiostat is then used to measure the electrical impedance of the system.
This base measurement is used to determine the impedance of the electrolyte. After subsequent
additions of non-conducting molecules to the surface of the anode, increases in impedance are
measured by a potentiostat.
This technique can be used to detect binding of high affinity molecules, such as antibodies and
aptamers, for the target molecules, as well as conformational changes of the bound molecules, as the
thickness of the boundary layer affects impedance. A particular advantage of this type of detection is
that it does not require labeling of the targeting molecule; binding affinity is therefore preserved.
Electrical impedance is often analyzed using either Bode or Nyquist plots.
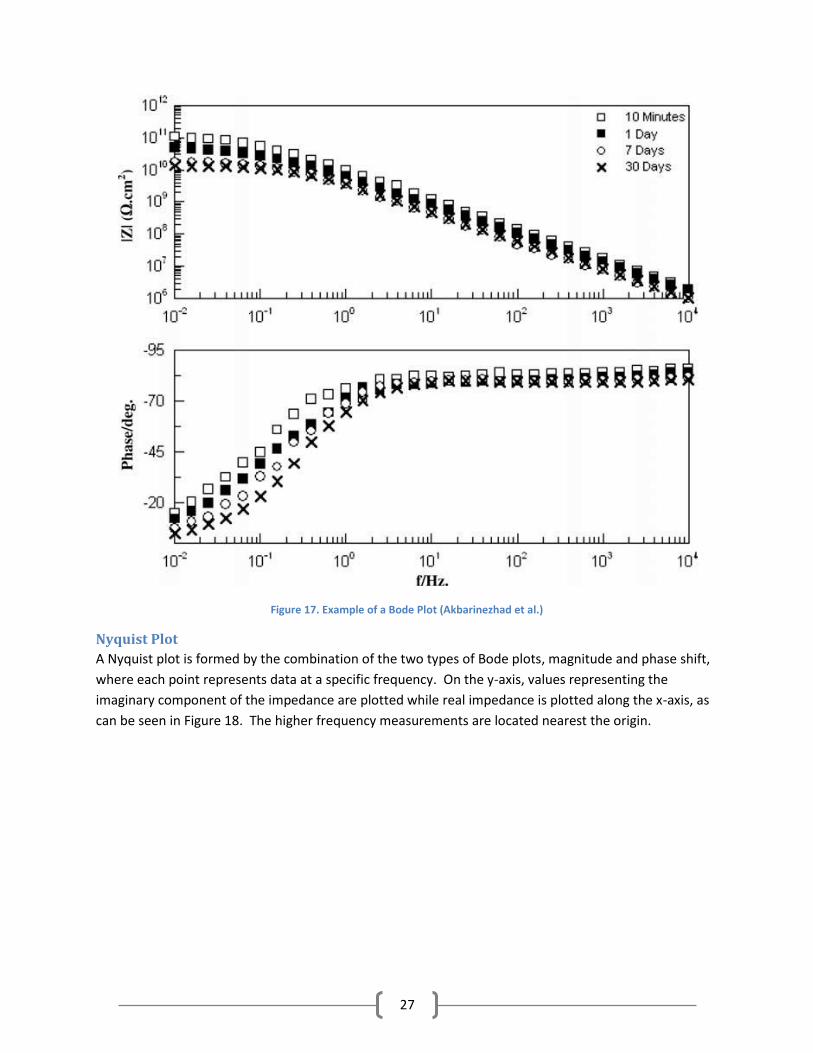
Bode Plot
Bode plots are analyzed to determine the system’s frequency response. Bode plots consist of two
graphs, sometimes superimposed. One graph is a plot of the magnitude of the impedance, or gain, as a
function of frequency. The other graph shows the phase shift of the current as a function of frequency.
An example of a Bode plot split into its two component graphs is shown in Figure 17.
38
(Mok & Li, 2008) 39
(Xu D. , Xu, Yu, Liu, He, & Ma, 2005) 40
(Lee, Hwang, Kwak, Park, Lee, & Lee, 2008)
27
Figure 17. Example of a Bode Plot (Akbarinezhad et al.)
Nyquist Plot
A Nyquist plot is formed by the combination of the two types of Bode plots, magnitude and phase shift,
where each point represents data at a specific frequency. On the y-axis, values representing the
imaginary component of the impedance are plotted while real impedance is plotted along the x-axis, as
can be seen in Figure 18. The higher frequency measurements are located nearest the origin.
28
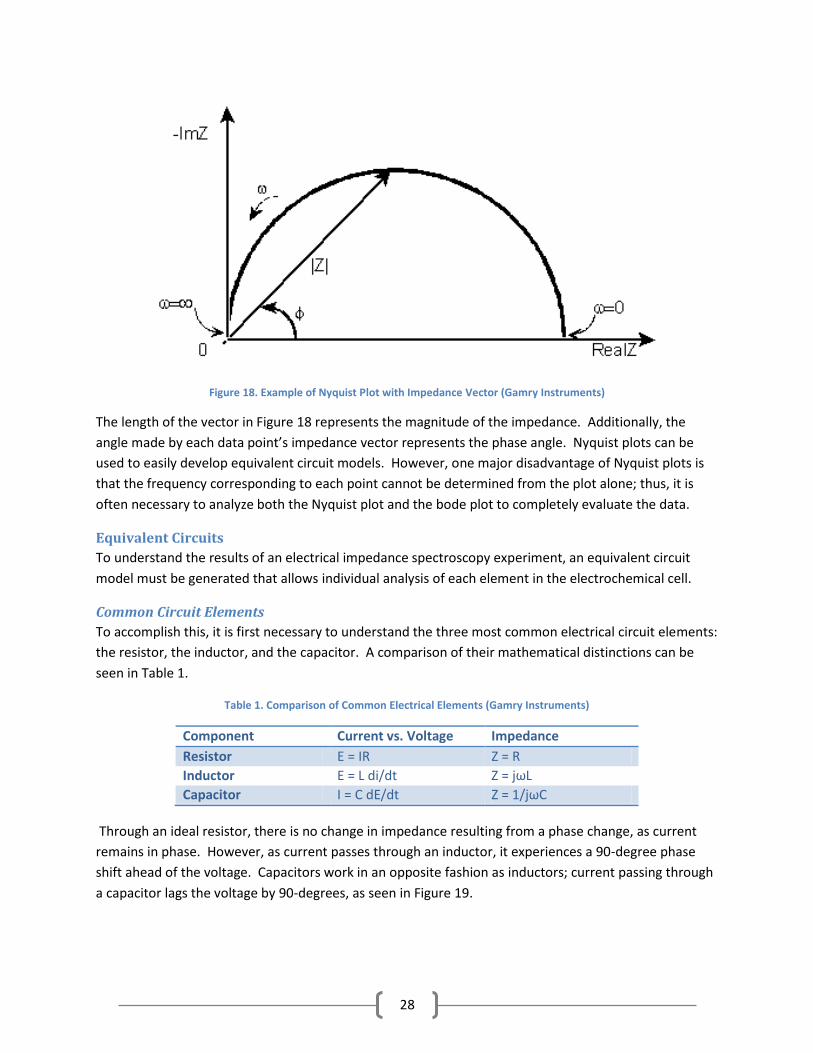
Figure 18. Example of Nyquist Plot with Impedance Vector (Gamry Instruments)
The length of the vector in Figure 18 represents the magnitude of the impedance. Additionally, the
angle made by each data point’s impedance vector represents the phase angle. Nyquist plots can be
used to easily develop equivalent circuit models. However, one major disadvantage of Nyquist plots is
that the frequency corresponding to each point cannot be determined from the plot alone; thus, it is
often necessary to analyze both the Nyquist plot and the bode plot to completely evaluate the data.
Equivalent Circuits
To understand the results of an electrical impedance spectroscopy experiment, an equivalent circuit
model must be generated that allows individual analysis of each element in the electrochemical cell.
Common Circuit Elements
To accomplish this, it is first necessary to understand the three most common electrical circuit elements:
the resistor, the inductor, and the capacitor. A comparison of their mathematical distinctions can be
seen in Table 1.
Table 1. Comparison of Common Electrical Elements (Gamry Instruments)
Component Current vs. Voltage Impedance
Resistor E = IR Z = R
Inductor E = L di/dt Z = jωL
Capacitor I = C dE/dt Z = 1/jωC
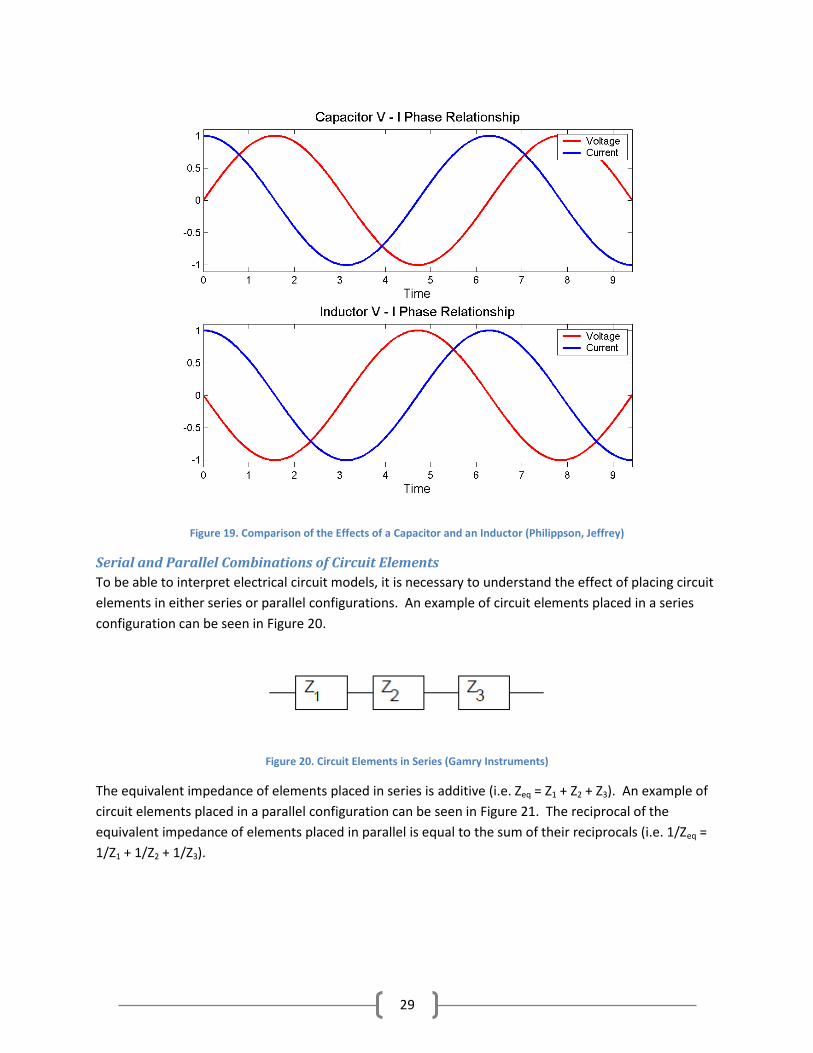
Through an ideal resistor, there is no change in impedance resulting from a phase change, as current
remains in phase. However, as current passes through an inductor, it experiences a 90-degree phase
shift ahead of the voltage. Capacitors work in an opposite fashion as inductors; current passing through
a capacitor lags the voltage by 90-degrees, as seen in Figure 19.
29
Figure 19. Comparison of the Effects of a Capacitor and an Inductor (Philippson, Jeffrey)
Serial and Parallel Combinations of Circuit Elements
To be able to interpret electrical circuit models, it is necessary to understand the effect of placing circuit
elements in either series or parallel configurations. An example of circuit elements placed in a series
configuration can be seen in Figure 20.
Figure 20. Circuit Elements in Series (Gamry Instruments)
The equivalent impedance of elements placed in series is additive (i.e. Zeq = Z1 + Z2 + Z3). An example of
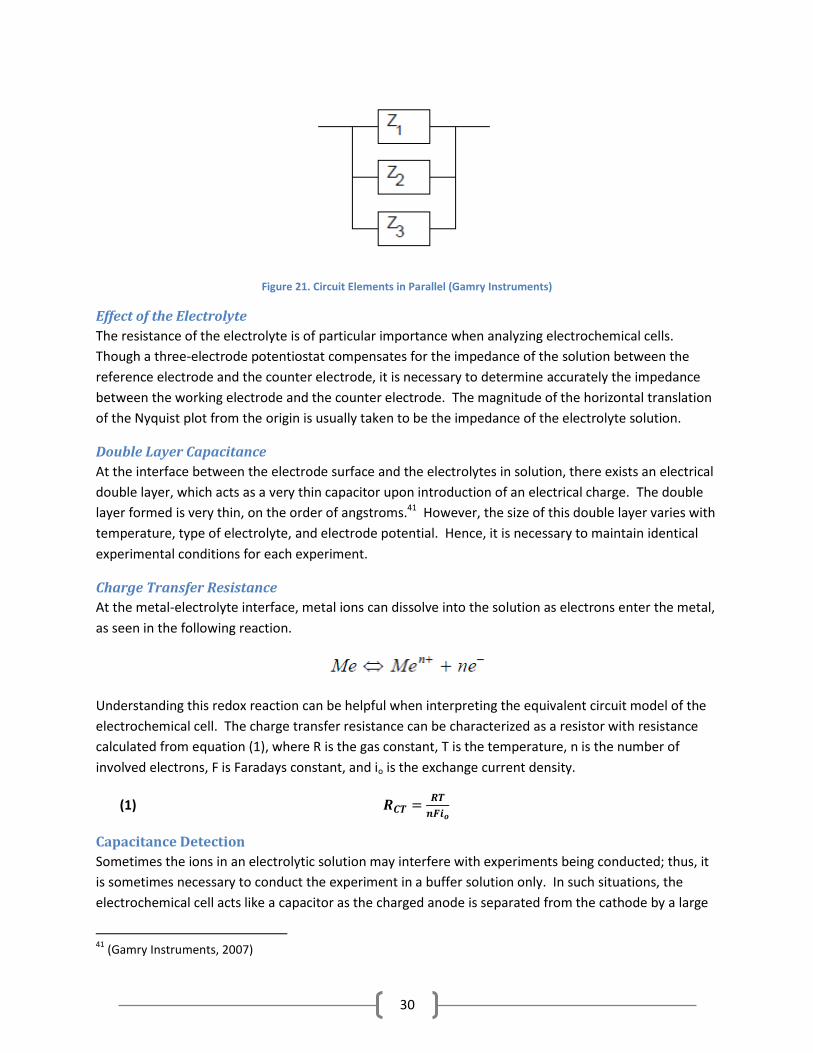
circuit elements placed in a parallel configuration can be seen in Figure 21. The reciprocal of the
equivalent impedance of elements placed in parallel is equal to the sum of their reciprocals (i.e. 1/Zeq =
1/Z1 + 1/Z2 + 1/Z3).
30
Figure 21. Circuit Elements in Parallel (Gamry Instruments)
Effect of the Electrolyte
The resistance of the electrolyte is of particular importance when analyzing electrochemical cells.
Though a three-electrode potentiostat compensates for the impedance of the solution between the
reference electrode and the counter electrode, it is necessary to determine accurately the impedance
between the working electrode and the counter electrode. The magnitude of the horizontal translation
of the Nyquist plot from the origin is usually taken to be the impedance of the electrolyte solution.
Double Layer Capacitance
At the interface between the electrode surface and the electrolytes in solution, there exists an electrical
double layer, which acts as a very thin capacitor upon introduction of an electrical charge. The double
layer formed is very thin, on the order of angstroms.41 However, the size of this double layer varies with
temperature, type of electrolyte, and electrode potential. Hence, it is necessary to maintain identical
experimental conditions for each experiment.
Charge Transfer Resistance
At the metal-electrolyte interface, metal ions can dissolve into the solution as electrons enter the metal,
as seen in the following reaction.
Understanding this redox reaction can be helpful when interpreting the equivalent circuit model of the
electrochemical cell. The charge transfer resistance can be characterized as a resistor with resistance
calculated from equation (1), where R is the gas constant, T is the temperature, n is the number of
involved electrons, F is Faradays constant, and io is the exchange current density.
(1) 𝑹𝑪𝑻 =𝑹𝑻
𝒏𝑭𝒊𝒐
Capacitance Detection
Sometimes the ions in an electrolytic solution may interfere with experiments being conducted; thus, it
is sometimes necessary to conduct the experiment in a buffer solution only. In such situations, the
electrochemical cell acts like a capacitor as the charged anode is separated from the cathode by a large
41
(Gamry Instruments, 2007)
31
insulator. An electrochemical cell without an electrolytic solution to transfer the charge to the cathode
is nearly solely dependent upon the imaginary component of the impedance.
Basic Aptamer-Protein Detection Scheme
Using this method, a gold electrode surface is modified with DNA aptamers that target a specific
molecule. This molecule, in low concentrations, is added directly to the electrode surface and allowed
to react with the surface-bound aptamers. The subsequent binding changes the resistance of the layer
on the surface of the gold electrode. This change is measured by electrical impedance spectroscopy. In
a study conducted by Xu et al,42 an approximate detection limit of 0.1 nM human IgE was obtained
without the use of amplifying modifications. Had this study, completed in 2005, utilized modifications
such as the nanoparticle sandwich design presented in the current paper, the detection limit would
most likely have been decreased further into the low femto-molar range.
Cyclic Voltammetery
What is Cyclic Voltammetery?
Cyclic voltammetery (CV) is an electrochemical detection method. Cyclic voltammetery curves are
generated by a potentiostat in a three-electrode configuration (reference electrode, working electrode,
and counter electrode). These electrodes are immersed in an electrolyte solution (i.e. potassium
ferrocyanide). During a CV scan, the working electrode generates a voltage difference, which is
increased linearly with respect to time, until a certain potential. Once the maximum potential has been
reached, the electrical potential is inverted.
The Experimental Importance of Cyclic Voltammetery
As the potentiostat progresses through the voltage range, the current measured will pass through a
maxima and minima. Each representing either the analyte’s oxidation or reduction peak. These peaks
are specific to their analyates and can be used to verify the identity of the substrate.
Methodology
Nanoparticle Synthesis
Synthesis of Mono-disperse (10 nm) Fe3O4 Nanoparticles
In a fume hood, 1 mmol of FeO(OH) must be ground in a mortar and pestle to increase the surface area
of the reactant. The FeO(OH) is then combined with 4 mmol of Oleic Acid (OA) and 5g 1-octadecene
(ODE) in a 25 mL round bottom flask. The reaction vessel is connected to a condenser and sealed to the
atmosphere. The condenser is then evacuated to remove any water vapor and then flushed with
nitrogen. A slow, yet steady, flow of nitrogen is left to flow through the system. The reaction is then
heated to 320 degrees Celsius and held at that temperature by a temperature controller. From the time
heating commences, the reaction runs for 30 minutes. During the reaction, the mixture changes color
42
(Xu D. , Xu, Yu, Liu, He, & Ma, 2005)
32
from brown to clear black. After the reaction has completed, the solution is allowed to cool to room
temperature.
Purification of Fe3O4 Nanoparticles after Synthesis
The iron oxide solution is poured into six separate centrifuge tubes. The solution in each tube should
not be more than 1/10th the total volume of the tube. Into each vial, a large quantity of toluene is
added, raising the level in the tube to about ¾ full. Subsequently, a small volume of acetone is added
while leaving room to cap the tube. Next, all six tubes are centrifuge at 4000 RPMs for 10 minutes. The
centrifuged product is decanted and the purification process repeated. The precipitate is allowed to dry
in a fume hood.
Preparation of Fe3O4 TEM Samples
Four-hundred mesh copper TEM slides are placed onto a clean surface. One drop of the purified
solution, dissolved in toluene, is added to the slide. The slide is allowed to dry and another drop added
before testing.
Preparation of Aptamer Modified Magnetic Iron-Oxide Nanoparticles
Transferof Iron Oxide Nanoparticles into the Aqueous Phase
To prepare aptamer modified magnetic iron oxide nanoparticles, it is first necessary to transfer the
magnetic nanoparticles from the organic phase into the aqueous phase. This can be done by a method
pioneered by Yu et al.43 Briefly, monodispersed Fe3O4 nanoparticles solvated in toluene is added to the
amphiphilic polymer (Poly(maleic anhydride-alt-1-octadecene) - mPEG-NH2) at a molar ratio of 1:10
Fe3O4:PMAO-PEG. The solution is left to stir overnight. The next day, PBS buffer (10 mM and pH 8.0) is
added at a volume ration of at least 1:1 to the toluene solution. The toluene is removed by rotary
evaporation at 35 °C. The resulting solution is a clear black solution of iron oxide nanoparticles
dispersed in PBS. The transfer process is 100% efficient; no residue is observed.
Attach Aptamers onto Nanoparticle Surface
Once the transfer process is complete, it is necessary to attach aptamers to the nanoparticles. This can
be done by modifying the carboxylic acid groups that now surround the nanoparticles. It is first
necessary to dilute the aqueous nanoparticle solution. To a solution of deionized water (4.75 mL), 0.25
mL of iron oxide nanoparticles are added. This results in a 1/10th dilution of particles. 1 mg of EDC and
0.5 mg of NHS are then added to the solution to modify the carboxylic acids for addition of aptamers.
A large selection of EDC/NHS concentrations were tested. This ratio of EDC to NHS was the most
effective found that did not aggregate the nanoparticles out of solution. Aggregation is an issue that
needs to be monitored. When the EDC/NHS reacts with a carboxylic acid group, it forms a C-O-
acylisourea group, which is unstable. Thus, once the EDC/NHS solution is prepared, it must be used
immediately. This reaction must be left under constant stirring for one hour.
After that time, 50 ul 18.5 uM NH2-modified IgE aptamer is added to this solution and let to react for at
least two hours (overnight is recommended) under stirring. Then, ethanolamine is added to quench the
43
(Yu, Change, Sayes, Drezek, & Colvin, 2006)

33
reaction in an amount that will result in a concentration of 1 M. This quenching reaction occurs for one
hour.
Purification of Aptamer Modified Nanoparticles
Once the nanoparticles have been modified, it is then necessary to purify them. The solution should be
purified at 14,500 x g twice for at least 40 minutes (or until the solution becomes clear). The liquid
should be decanted after each separation before being re-dispersed in PBS solution. Once the solution
has been purified, it is to be stored at 4 °C until use.
Electrochemical Detection (Antibody Method)
Probe Preparation
Polishing
A small amount of α-Al2O3 (1.0 and 0.3 μm) is placed onto a polishing pad and hydrated with de-ionized
water. The probe is polished in a figure-eight motion, so as to clean the surface of the probe evenly, for
at least 4 hours. This only needs to be done the first time the probe is used. After the initial polishing,
less time is needed between trials (approximately thirty minutes per probe).
Cleaning
The probe is placed into a 50 mL beaker for cleaning. To the beaker, 30 mL of DI water is added before
being placed in a sonicator for no less than 10 minutes. Once the sonication is complete, the probe is
rinsed with DI water. Next, the probe is immersed in a beaker filled with ethanol and again sonicated
for 10 minutes. When the sonication is complete, the probe is air dried with nitrogen.
Sulfuric Acid Cleaning
0.1 M H2SO4 in H2O is placed into a small beaker. Subsequently, the three probes (reference, counter,
and working) are placed into the solution. Next, all three probes are connected to a 3-electrode
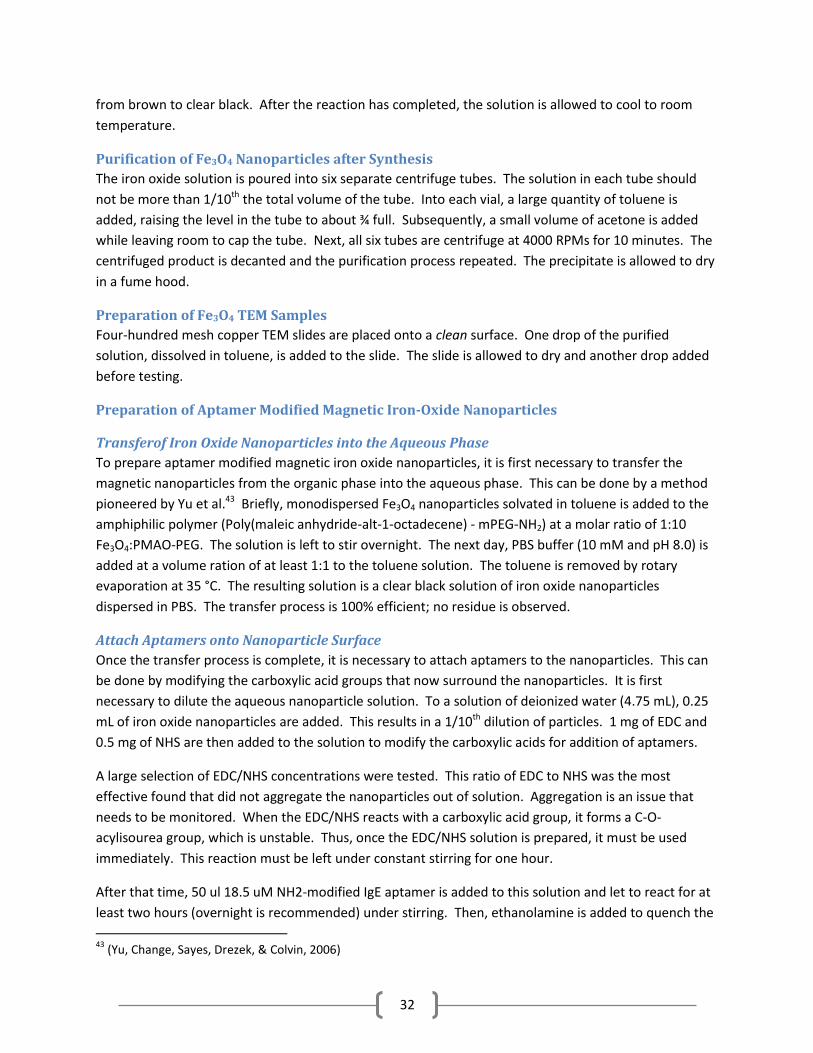
potentiostat. Next, a cyclic voltammetery curve is then generated by scanning twenty times in the range
between -0.2 and 1.55 Volts at intervals of 0.5 s-1. This completes the cleaning of the gold electrode.
Before continuing, it is necessary to verify the CV curve matches known CV curves for gold before
continuing (An example of CV curve of a gold electrode in sulfuric acid is shown in Figure 22. If the
curves do not match, it will be necessary to re-polish the electrode.
34
Figure 22. Cyclic Voltammetery Curve of Bare Gold in Sulfuric Acid
Surface Modification
Antibody Immobilization
The electrode is placed in a 10 mmol/L solution of 3-mercaptopropionic acid in DI water for at least 4
hours (ethanol was tested as a solvent but was found to be less effective, as described in the next
section). Next, the electrode is washed with ethanol and water, disturbing the gold surface as little as
possible. An EIS measurement is to be taken to verify there is a monolayer of MPA on the surface.
Next, the electrode is immersed in a 1:1 (v/v) solution of 200 mmol/L EDC and 50 mmol/L NHS in PBS
buffer, pH 7.4, for a half an hour. This EDC/NHS modification activates the carboxyl groups of the MPA
layer. Next, the electrode is rinsed with DI water very briefly before continuing with the immobilization.
Goat anti-human IgE in PBS solution is then to be added directly to the electrode surface for at least 8
hours, preferably overnight at room temperature. When the immobilization is complete, the reaction is
quenched with ethanolamine solution (1 mol/L). The ethanolamine is used to deactivate and block
unreacted esters, also preventing electrostatic binding of proteins and other molecules to these
unreacted sites. After the quenching reaction is complete, the electrode surface is rinsed with PBS
thoroughly.
Ethanol vs. DI Water as a Solvent for 3-Mercaptopropionoic Acid
Originally, it was assumed that absolute ethanol would be an ideal solvent for 3-marcaptopropionic acid,
yet tests conducted with DI water alongside absolute ethanol have illuminated DI water to be a superior
choice. As shown in Figure 23, after an overnight reaction with equivalent concentrations of 3-MPA (25
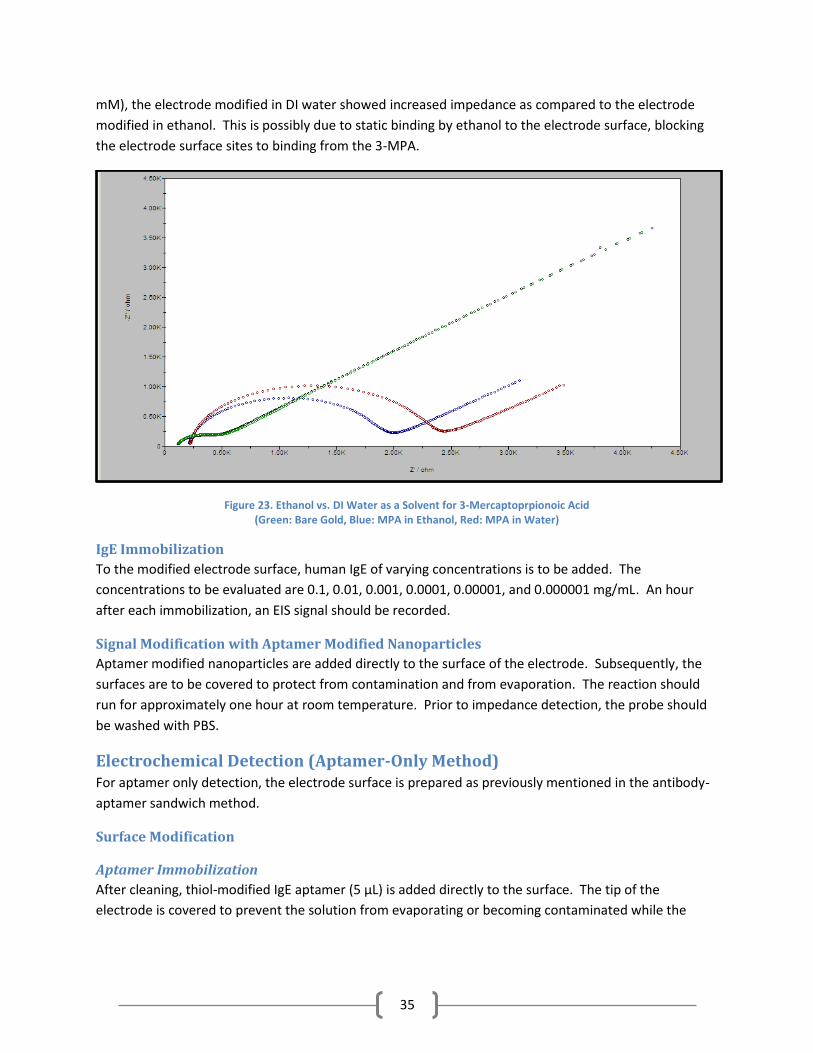
35
mM), the electrode modified in DI water showed increased impedance as compared to the electrode
modified in ethanol. This is possibly due to static binding by ethanol to the electrode surface, blocking
the electrode surface sites to binding from the 3-MPA.
Figure 23. Ethanol vs. DI Water as a Solvent for 3-Mercaptoprpionoic Acid (Green: Bare Gold, Blue: MPA in Ethanol, Red: MPA in Water)
IgE Immobilization
To the modified electrode surface, human IgE of varying concentrations is to be added. The
concentrations to be evaluated are 0.1, 0.01, 0.001, 0.0001, 0.00001, and 0.000001 mg/mL. An hour
after each immobilization, an EIS signal should be recorded.
Signal Modification with Aptamer Modified Nanoparticles
Aptamer modified nanoparticles are added directly to the surface of the electrode. Subsequently, the
surfaces are to be covered to protect from contamination and from evaporation. The reaction should
run for approximately one hour at room temperature. Prior to impedance detection, the probe should
be washed with PBS.
Electrochemical Detection (Aptamer-Only Method) For aptamer only detection, the electrode surface is prepared as previously mentioned in the antibody-
aptamer sandwich method.
Surface Modification
Aptamer Immobilization
After cleaning, thiol-modified IgE aptamer (5 μL) is added directly to the surface. The tip of the
electrode is covered to prevent the solution from evaporating or becoming contaminated while the
36
reaction occurs overnight at room temperature. After the reaction is complete, the electrode is to be
washed with DI water and PBS buffer before continuing.
Use of β-Mercaptoethanol to Block Unreacted Binding Sites on Electrode Surface
As reported by K. Min et al.,44 and Radi et al.,45 after aptamer immobilization, it is necessary to block
unreacted binding sites on the surface of the gold electrode with β-mercaptoethanol. β-
mercaptoethanol forms a sulfur bond with the surface of the gold electrode, blocking binding sites to
physical and electrostatic absorption of the aptamer to the surface.
If the surface of the electrode is not blocked by the addition of β-mercaptoethanol, the many amines
present in the hIgE aptamer will absorb onto the electrode by forming weak, covalent bonds to the gold
surface46. With the addition of β-mercaptoethanol, the thiol group of the β-mercaptoethanol supplants
the weakly bound amines present in hIgE. Thus, the aptamers are left tethered to the gold surface
primarily through their thiol-modified tail; additionally, aptamers weakly absorbed onto the gold surface
only through amine bonds are displaced.
Without the addition of β-mercaptoethanol, reproducible, viable results cannot be obtained.
Antibody Immobilization
With a micropipette, 5 μL of IgE (at varying concentrations) is added to the electrode surface. This
immobilization reaction should be carried out under refrigeration to help minimize the risk of the
protein denaturing. The reaction occurs overnight. After the reaction has run its course, the electrode
tip is to be washed with 0.01 M PBS buffer prior to EIS testing.
Magnetic Nanoparticle Immobilization
Aptamer modified magnetic nanoparticles are added directly to the surface of the electrode.
Subsequently, the surface is to be covered to protect from contamination and from evaporation. The
reaction should run for approximately one hour at room temperature; the probe should be washed with
PBS prior to impedance detection.
Electrochemical Detection (Capacitance Test) To avoid potential problems with using an electrolytic solution, EIS experiments may be conducted in
only PBS buffer. When the electrolyte is replaced by PBS buffer, the electrochemical cell becomes a
capacitor, with a charge build-up on the working electrode due to the high resistance of the solution.
These experiments are conducted as in the above section, but the potassium ferricyanide solution is
replaced with PBS.
44
(Min, Cho, Han, Shim, Ku, & Ban, 2008) 45
(Radi, Sanchez, Baldrich, & O'Sullivan, 2005) 46
(Leff, Brandt, & Heath, 1996)
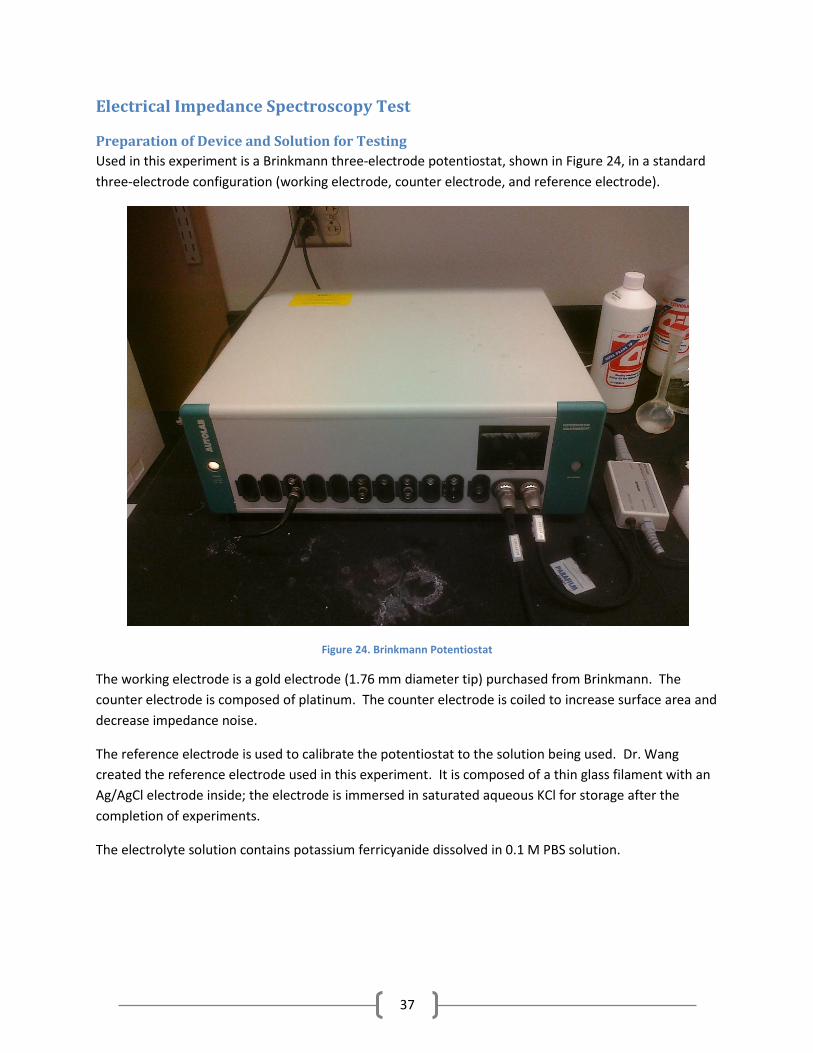
37
Electrical Impedance Spectroscopy Test
Preparation of Device and Solution for Testing
Used in this experiment is a Brinkmann three-electrode potentiostat, shown in Figure 24, in a standard
three-electrode configuration (working electrode, counter electrode, and reference electrode).
Figure 24. Brinkmann Potentiostat
The working electrode is a gold electrode (1.76 mm diameter tip) purchased from Brinkmann. The
counter electrode is composed of platinum. The counter electrode is coiled to increase surface area and
decrease impedance noise.
The reference electrode is used to calibrate the potentiostat to the solution being used. Dr. Wang
created the reference electrode used in this experiment. It is composed of a thin glass filament with an
Ag/AgCl electrode inside; the electrode is immersed in saturated aqueous KCl for storage after the
completion of experiments.
The electrolyte solution contains potassium ferricyanide dissolved in 0.1 M PBS solution.

38
Necessary Precautions when Conducting EIS Experiments
Loose Wires
When conducting EIS experiments, the many wire-wire connection points must be securely connected.
Before each EIS test is conducted, it is necessary to inspect each of these joints to make sure they are
secure. A loose connection will give invalid, irreproducible results.
Loose Wire Connections to the Electrodes
Much more common are loose or poor connections from the wires to one or more of the electrodes.
This is due to the size incompatibility of the wire connectors and the probe connections. If possible, it is
recommended to obtain non-standard alligator-clips to ensure good electrical conduction and
reproducible results. Signs of a poor wire-electrode connection can be seen clearly after the first several
points of the EIS curve have been plotted. Initially, the points should form a nearly straight line. If
points seem to be randomly placed, it is necessary to stop the test and reconnect the electrodes to the
wires.
Using Cyclic Voltammetery to Test the Validity of EIS Results
The validity of the connections may be tested with a preliminary CV test, as these curves have been well
documented for gold electrodes and the change due to further layering the tip of the working electrode
can easily be extrapolated. However, caution must be taken when conducting CV tests as bad
connections can cause too much current to pass through the electrode, corroding the electrode tip.
Thoroughly Wash Electrode Surfaces
The working electrode surface must be thoroughly rinsed before each EIS curve is produced. Some of
the species in solution during a reaction phase may only physically absorb onto the surface and not be
chemically bound (i.e. static binding). Failure to do this can result in an impedance curve larger than
expected that can harm the validity of subsequent tests. However, care must also be made not to wash
the probe too vigorously, which could dislodge desired, chemically bound species from the electrode
surface. It is recommended that the electrode surface be washed in an appropriate solvent (i.e. PBS,
tris-buffer, or DI water) with three to five 1 mL aliquots. Careful attention must be made not to wash
the working electrode surface directly.
The counter electrode and reference electrode should only be washed once before each battery of tests
is completed. They should be rinsed with copious amounts of DI water to ensure they are free from
contamination.
Results & Discussion
Equivalent Circuit Model To accurately model the effects of adding additional layers to the electrode surface, the electrochemical
data is fit to an equivalent electrical circuit model. Different equivalent circuit models must represent
different configurations of electrode modifications and electrolyte solutions. In this study, both the
Randles circuit and a simple RC circuit will be used.
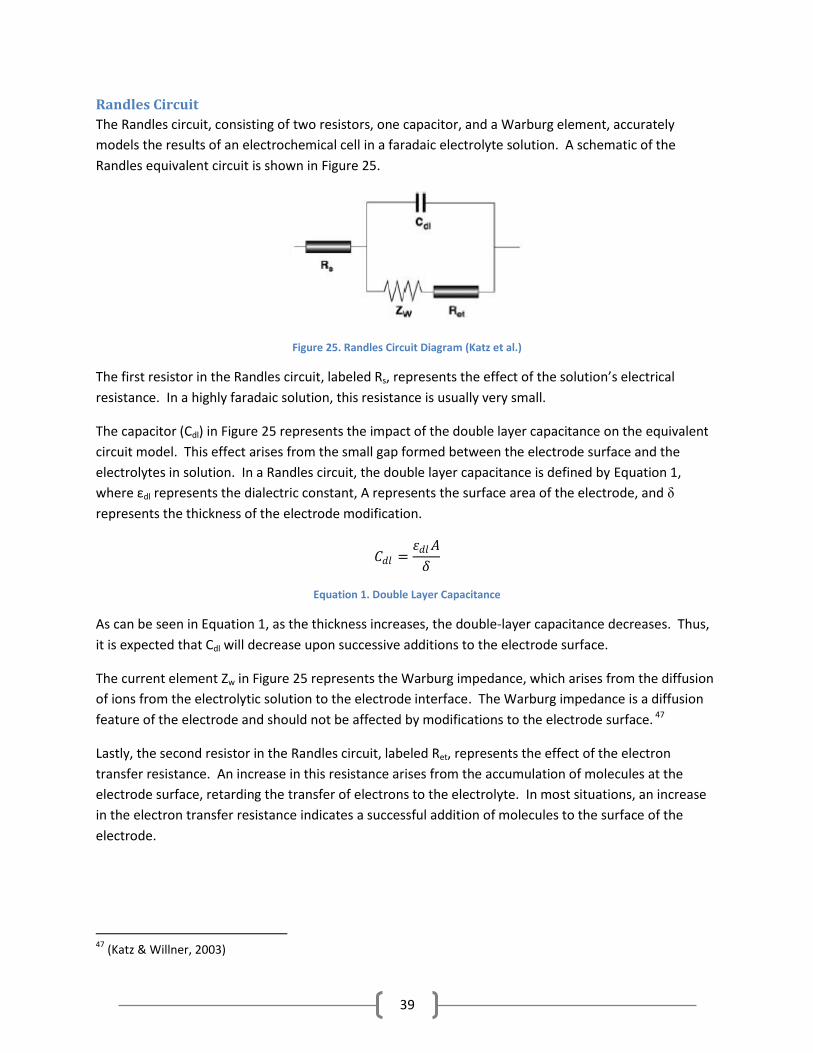
39
Randles Circuit
The Randles circuit, consisting of two resistors, one capacitor, and a Warburg element, accurately
models the results of an electrochemical cell in a faradaic electrolyte solution. A schematic of the
Randles equivalent circuit is shown in Figure 25.
Figure 25. Randles Circuit Diagram (Katz et al.)
The first resistor in the Randles circuit, labeled Rs, represents the effect of the solution’s electrical
resistance. In a highly faradaic solution, this resistance is usually very small.
The capacitor (Cdl) in Figure 25 represents the impact of the double layer capacitance on the equivalent
circuit model. This effect arises from the small gap formed between the electrode surface and the
electrolytes in solution. In a Randles circuit, the double layer capacitance is defined by Equation 1,
where εdl represents the dialectric constant, A represents the surface area of the electrode, and δ
represents the thickness of the electrode modification.
𝐶𝑑𝑙 =휀𝑑𝑙𝐴
𝛿
Equation 1. Double Layer Capacitance
As can be seen in Equation 1, as the thickness increases, the double-layer capacitance decreases. Thus,
it is expected that Cdl will decrease upon successive additions to the electrode surface.
The current element Zw in Figure 25 represents the Warburg impedance, which arises from the diffusion
of ions from the electrolytic solution to the electrode interface. The Warburg impedance is a diffusion
feature of the electrode and should not be affected by modifications to the electrode surface. 47
Lastly, the second resistor in the Randles circuit, labeled Ret, represents the effect of the electron
transfer resistance. An increase in this resistance arises from the accumulation of molecules at the
electrode surface, retarding the transfer of electrons to the electrolyte. In most situations, an increase
in the electron transfer resistance indicates a successful addition of molecules to the surface of the
electrode.
47
(Katz & Willner, 2003)

40
RC Circuit
An RC circuit is a much simpler equivalent circuit model than the Randles circuit and is commonly used
to analyze electrical biosensors when the solution used contains no electrolytes. A diagram of a simple
RC circuit suitable for these situations can be seen in Figure 26.
Figure 26. RC Circuit Diagram (Katz et al.)
As with the Randles circuit, the components Rs and Cdl represent the solution’s resistance and the
double-layer capacitance, respectively. The double-layer capacitance can be determined from
experimental data through Equation 2, where Zim represents the imaginary part of the impedance and ω
represents the frequency of the measurement.
𝑍𝑖𝑚 =1
𝜔𝐶𝑑𝑙
Equation 2. Double Layer Capacitance in the Absence of an Electrolyte
Because the solution contains no electrolytes, there are no terms included to describe the diffusion of
either ions or electrons (Zw or Ret). In the absence of an electrolyte, binding can only be determined by a
decrease in the value of the double-layer capacitance. The solutions resistance should remain
unchanged.
Analysis of Results
Randles Circuit – Aptamer Studies
After completing the included methodology in the presence of an electrolyte, the data shown in Figure
27 was fit to the Randles equivalent circuit using the equivalent circuit-fitting program in AutoLab. The
tabulated results can be seen in Table 2.
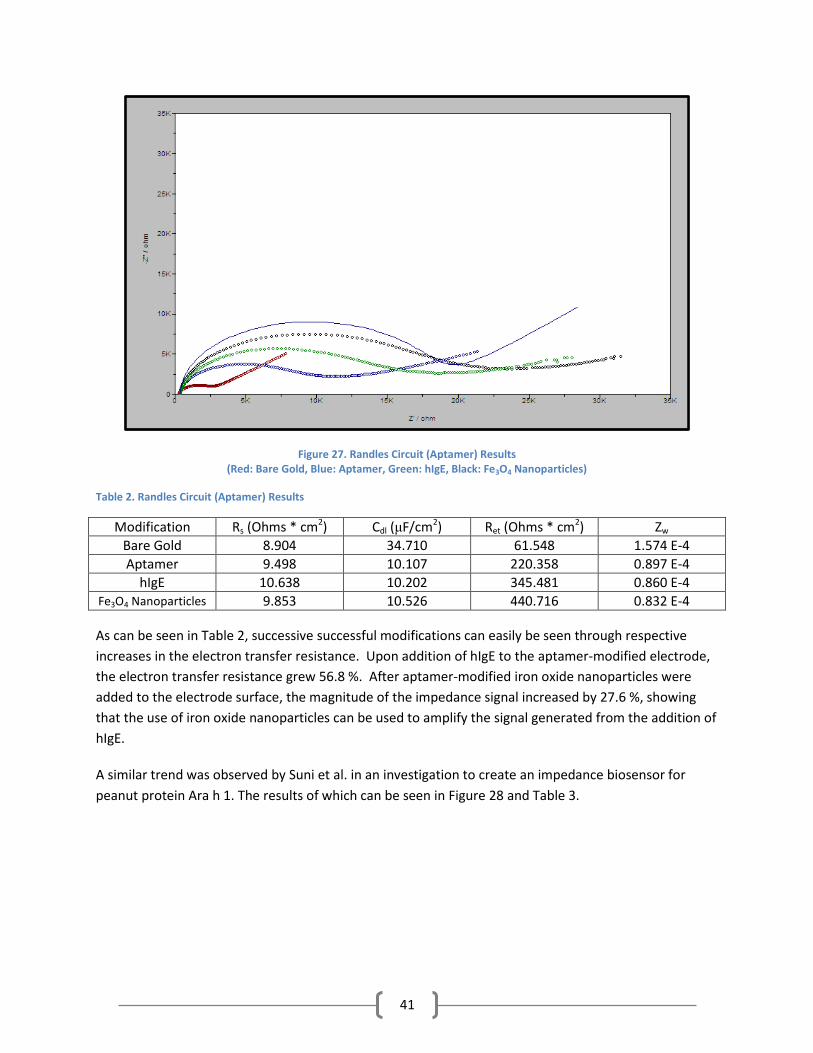
41
Figure 27. Randles Circuit (Aptamer) Results (Red: Bare Gold, Blue: Aptamer, Green: hIgE, Black: Fe3O4 Nanoparticles)
Table 2. Randles Circuit (Aptamer) Results
Modification Rs (Ohms * cm2) Cdl (μF/cm2) Ret (Ohms * cm2) Zw
Bare Gold 8.904 34.710 61.548 1.574 E-4
Aptamer 9.498 10.107 220.358 0.897 E-4
hIgE 10.638 10.202 345.481 0.860 E-4 Fe3O4 Nanoparticles 9.853 10.526 440.716 0.832 E-4
As can be seen in Table 2, successive successful modifications can easily be seen through respective
increases in the electron transfer resistance. Upon addition of hIgE to the aptamer-modified electrode,
the electron transfer resistance grew 56.8 %. After aptamer-modified iron oxide nanoparticles were
added to the electrode surface, the magnitude of the impedance signal increased by 27.6 %, showing
that the use of iron oxide nanoparticles can be used to amplify the signal generated from the addition of
hIgE.
A similar trend was observed by Suni et al. in an investigation to create an impedance biosensor for
peanut protein Ara h 1. The results of which can be seen in Figure 28 and Table 3.
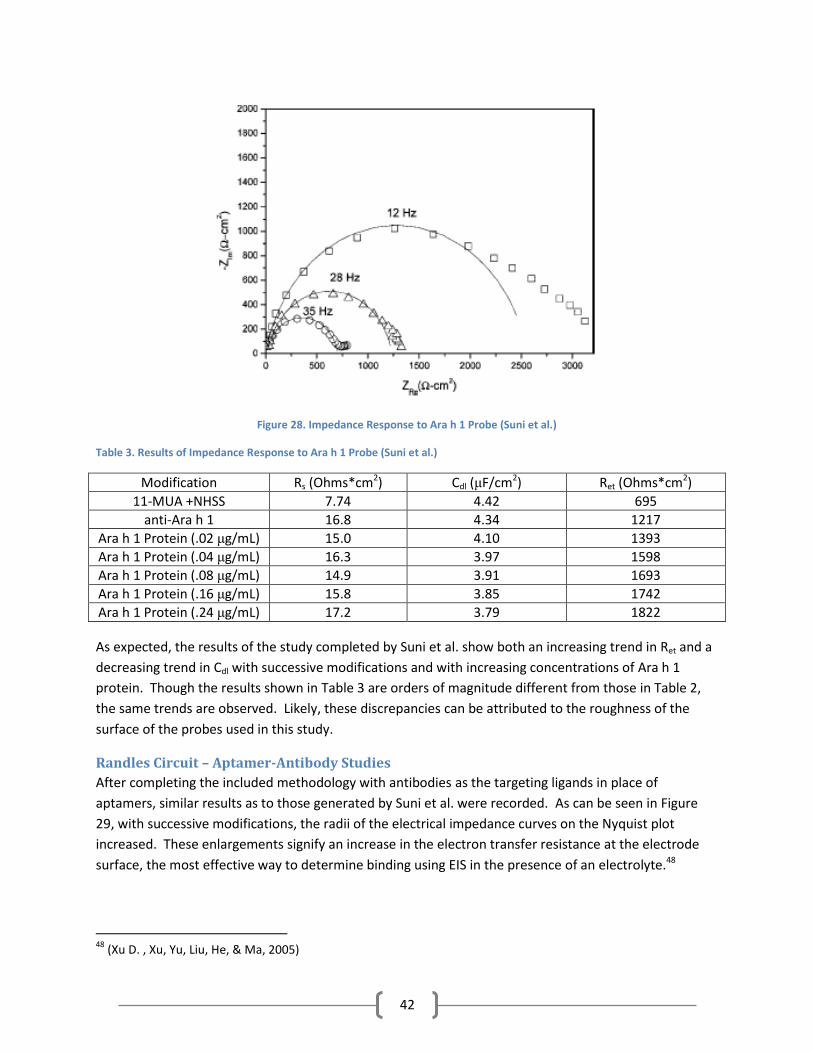
42
Figure 28. Impedance Response to Ara h 1 Probe (Suni et al.)
Table 3. Results of Impedance Response to Ara h 1 Probe (Suni et al.)
Modification Rs (Ohms*cm2) Cdl (μF/cm2) Ret (Ohms*cm2)
11-MUA +NHSS 7.74 4.42 695
anti-Ara h 1 16.8 4.34 1217
Ara h 1 Protein (.02 μg/mL) 15.0 4.10 1393
Ara h 1 Protein (.04 μg/mL) 16.3 3.97 1598
Ara h 1 Protein (.08 μg/mL) 14.9 3.91 1693
Ara h 1 Protein (.16 μg/mL) 15.8 3.85 1742
Ara h 1 Protein (.24 μg/mL) 17.2 3.79 1822
As expected, the results of the study completed by Suni et al. show both an increasing trend in Ret and a
decreasing trend in Cdl with successive modifications and with increasing concentrations of Ara h 1
protein. Though the results shown in Table 3 are orders of magnitude different from those in Table 2,
the same trends are observed. Likely, these discrepancies can be attributed to the roughness of the
surface of the probes used in this study.
Randles Circuit – Aptamer-Antibody Studies
After completing the included methodology with antibodies as the targeting ligands in place of
aptamers, similar results as to those generated by Suni et al. were recorded. As can be seen in Figure
29, with successive modifications, the radii of the electrical impedance curves on the Nyquist plot
increased. These enlargements signify an increase in the electron transfer resistance at the electrode
surface, the most effective way to determine binding using EIS in the presence of an electrolyte.48
48
(Xu D. , Xu, Yu, Liu, He, & Ma, 2005)

43
Furthermore, as can be seen in Figure 29 and in Table 4, there is a large relative increase in the electron
transfer resistance upon binding of the magnetic nanoparticles to the surface (24.2 % increase) as
compared to the increase resulting from the addition of hIgE (6.8 % increase). This large relative
increase demonstrates that Fe3O4 nanoparticles labeled with aptamers can be used to amplify a weak
binding signal resulting from antibody-antigen interactions.
Figure 29. Randles Circuit (Aptamer-Antibody) Results (Cyan: Bare Gold, Green: MPA, Blue: Anti-hIgE, Red: hIgE, Black: Fe3O4 Nanoparticles)
Additionally, as can be seen from Figure 29, the model generated by the equivalent circuit very closely
fits the experimental data, signifying that the Randles circuit model is the proper equivalent circuit
model. Table 4. Randles Circuit (Aptamer-Antibody) Results
Modification Rs (Ohms * cm2) Cdl (μF/cm2) Ret (Ohms * cm2) Zw
Bare Gold 3.107 42.502 6.238 1.71 E-4
MPA 2.968 27.663 60.505 2.01 E-4
Anti-hIgE 3.148 25.854 79.068 2.30 E-4
hIgE 3.036 27.005 84.420 2.30 E-4 Fe3O4 Nanoparticles 2.703 28.444 104.856 2.49 E-4
As is apparent from Table 4, the value of the Warburg impedance, Zw, remains relatively constant
throughout the experiment, as expected. The Warburg impedance represents the diffusion of ions from
the electrolyte to the electrode surface. It is a bulk property of the fluid and should remain unchanged
as the electrode surface is modified.
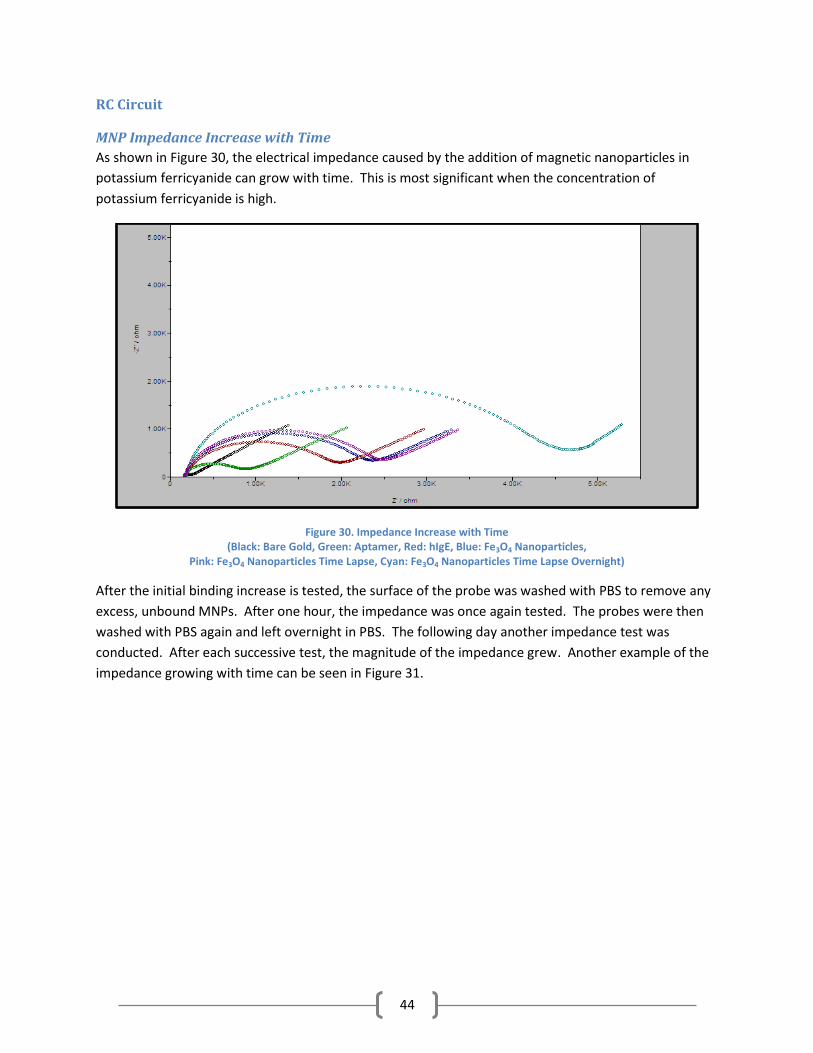
44
RC Circuit
MNP Impedance Increase with Time
As shown in Figure 30, the electrical impedance caused by the addition of magnetic nanoparticles in
potassium ferricyanide can grow with time. This is most significant when the concentration of
potassium ferricyanide is high.
Figure 30. Impedance Increase with Time (Black: Bare Gold, Green: Aptamer, Red: hIgE, Blue: Fe3O4 Nanoparticles,
Pink: Fe3O4 Nanoparticles Time Lapse, Cyan: Fe3O4 Nanoparticles Time Lapse Overnight)
After the initial binding increase is tested, the surface of the probe was washed with PBS to remove any
excess, unbound MNPs. After one hour, the impedance was once again tested. The probes were then
washed with PBS again and left overnight in PBS. The following day another impedance test was
conducted. After each successive test, the magnitude of the impedance grew. Another example of the
impedance growing with time can be seen in Figure 31.

45
Figure 31. Impedance Increase with Time (2) (Black: Bare Gold, Aptamer: Cyan, Green: hIgE, Red: Fe3O4 Nanoparticles,
Pink: Fe3O4 Nanoparticles Time Lapse, Blue: Fe3O4 Nanoparticles Time Lapse 2)
Both tests have shown an increase in impedance with time. This is most likely due either to detrimental
effects arising from the repeated reduction and oxidation of K3Fe(CN)6/K4Fe(CN)649 or to the further
binding of aptamers on the MNPs to unbound IgE molecules.
49
(Huang, Bell, & Suni, 2008)
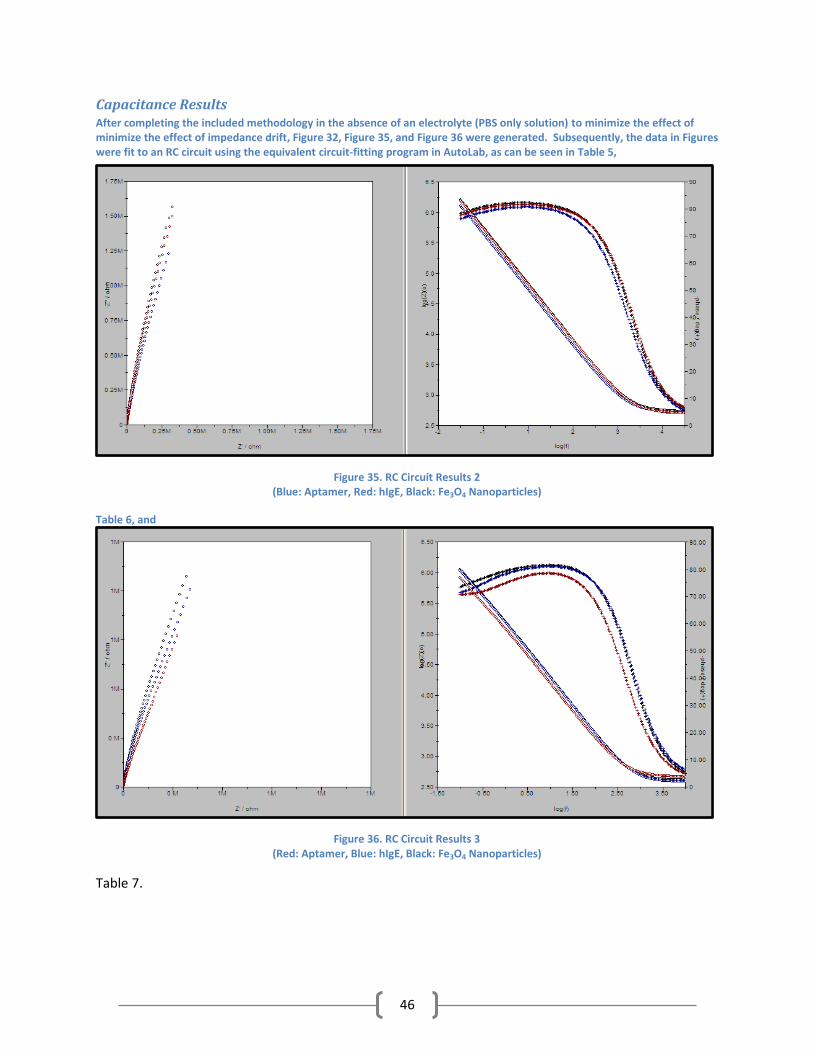
46
Capacitance Results After completing the included methodology in the absence of an electrolyte (PBS only solution) to minimize the effect of minimize the effect of impedance drift, Figure 32, Figure 35, and Figure 36 were generated. Subsequently, the data in Figures were fit to an RC circuit using the equivalent circuit-fitting program in AutoLab, as can be seen in Table 5,
Figure 35. RC Circuit Results 2 (Blue: Aptamer, Red: hIgE, Black: Fe3O4 Nanoparticles)
Table 6, and
Figure 36. RC Circuit Results 3 (Red: Aptamer, Blue: hIgE, Black: Fe3O4 Nanoparticles)
Table 7.
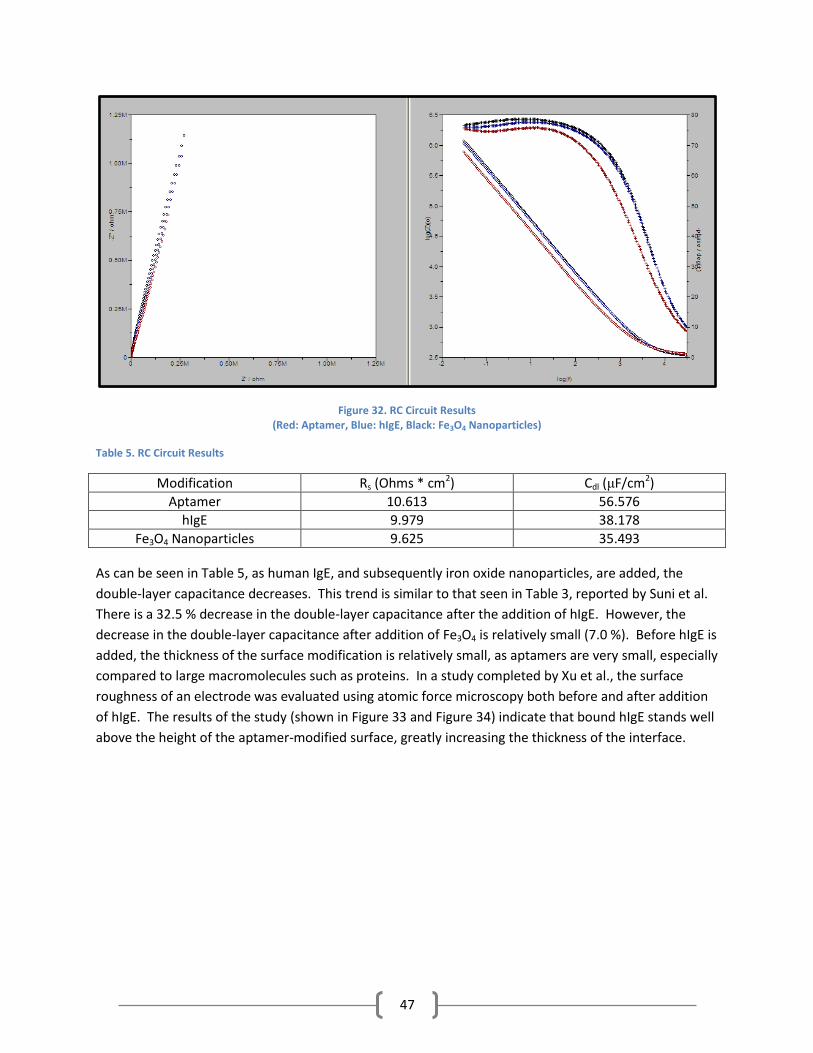
47
Figure 32. RC Circuit Results (Red: Aptamer, Blue: hIgE, Black: Fe3O4 Nanoparticles)
Table 5. RC Circuit Results
Modification Rs (Ohms * cm2) Cdl (μF/cm2)
Aptamer 10.613 56.576
hIgE 9.979 38.178
Fe3O4 Nanoparticles 9.625 35.493
As can be seen in Table 5, as human IgE, and subsequently iron oxide nanoparticles, are added, the
double-layer capacitance decreases. This trend is similar to that seen in Table 3, reported by Suni et al.
There is a 32.5 % decrease in the double-layer capacitance after the addition of hIgE. However, the
decrease in the double-layer capacitance after addition of Fe3O4 is relatively small (7.0 %). Before hIgE is
added, the thickness of the surface modification is relatively small, as aptamers are very small, especially
compared to large macromolecules such as proteins. In a study completed by Xu et al., the surface
roughness of an electrode was evaluated using atomic force microscopy both before and after addition
of hIgE. The results of the study (shown in Figure 33 and Figure 34) indicate that bound hIgE stands well
above the height of the aptamer-modified surface, greatly increasing the thickness of the interface.
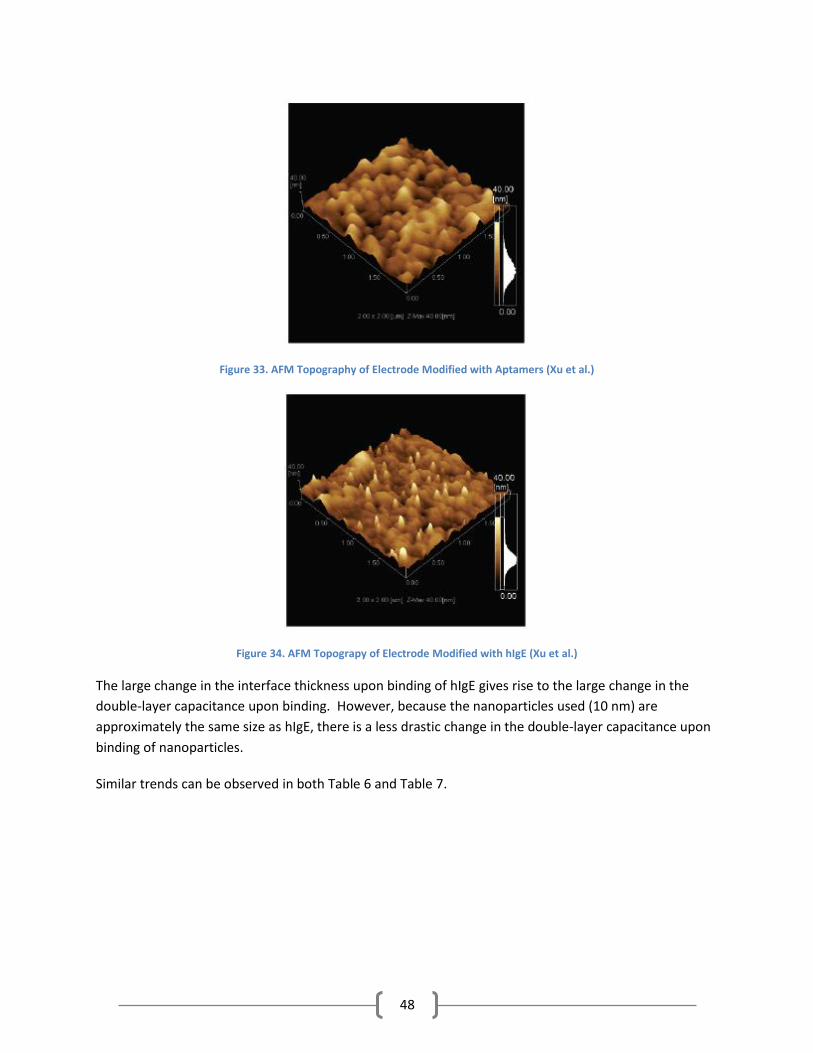
48
Figure 33. AFM Topography of Electrode Modified with Aptamers (Xu et al.)
Figure 34. AFM Topograpy of Electrode Modified with hIgE (Xu et al.)
The large change in the interface thickness upon binding of hIgE gives rise to the large change in the
double-layer capacitance upon binding. However, because the nanoparticles used (10 nm) are
approximately the same size as hIgE, there is a less drastic change in the double-layer capacitance upon
binding of nanoparticles.
Similar trends can be observed in both Table 6 and Table 7.
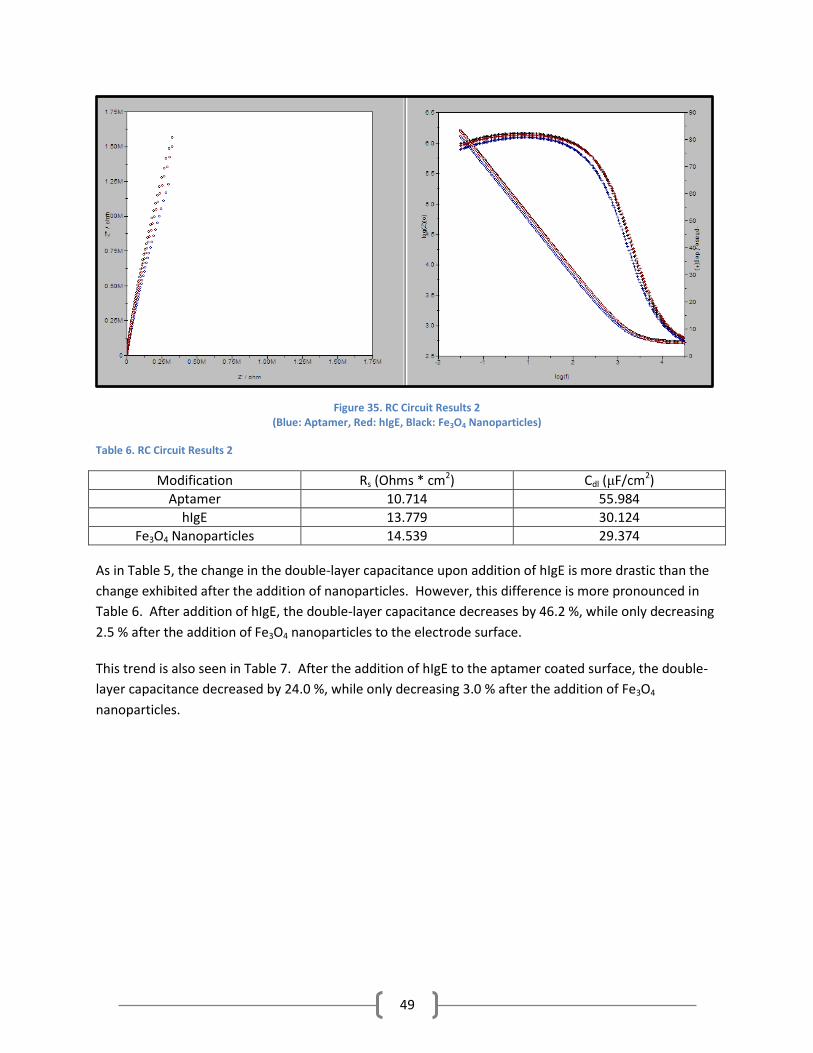
49
Figure 35. RC Circuit Results 2 (Blue: Aptamer, Red: hIgE, Black: Fe3O4 Nanoparticles)
Table 6. RC Circuit Results 2
Modification Rs (Ohms * cm2) Cdl (μF/cm2)
Aptamer 10.714 55.984
hIgE 13.779 30.124
Fe3O4 Nanoparticles 14.539 29.374
As in Table 5, the change in the double-layer capacitance upon addition of hIgE is more drastic than the
change exhibited after the addition of nanoparticles. However, this difference is more pronounced in
Table 6. After addition of hIgE, the double-layer capacitance decreases by 46.2 %, while only decreasing
2.5 % after the addition of Fe3O4 nanoparticles to the electrode surface.
This trend is also seen in Table 7. After the addition of hIgE to the aptamer coated surface, the double-
layer capacitance decreased by 24.0 %, while only decreasing 3.0 % after the addition of Fe3O4
nanoparticles.
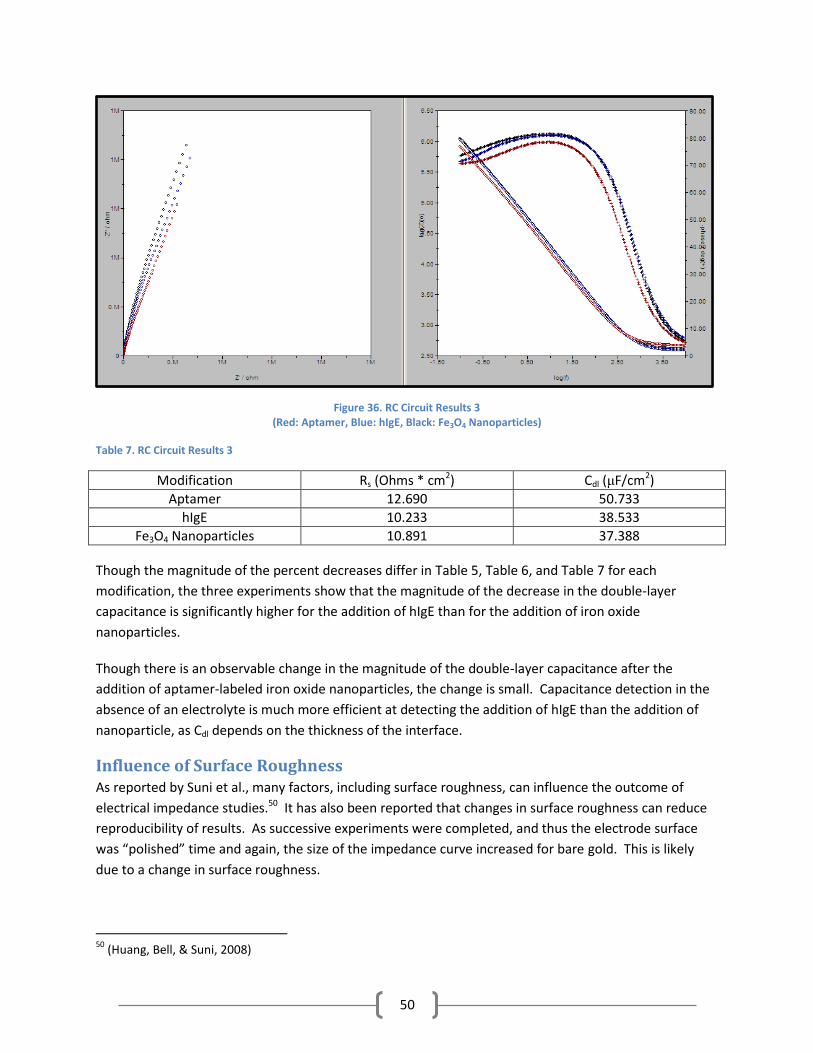
50
Figure 36. RC Circuit Results 3 (Red: Aptamer, Blue: hIgE, Black: Fe3O4 Nanoparticles)
Table 7. RC Circuit Results 3
Modification Rs (Ohms * cm2) Cdl (μF/cm2)
Aptamer 12.690 50.733
hIgE 10.233 38.533
Fe3O4 Nanoparticles 10.891 37.388
Though the magnitude of the percent decreases differ in Table 5, Table 6, and Table 7 for each
modification, the three experiments show that the magnitude of the decrease in the double-layer
capacitance is significantly higher for the addition of hIgE than for the addition of iron oxide
nanoparticles.
Though there is an observable change in the magnitude of the double-layer capacitance after the
addition of aptamer-labeled iron oxide nanoparticles, the change is small. Capacitance detection in the
absence of an electrolyte is much more efficient at detecting the addition of hIgE than the addition of
nanoparticle, as Cdl depends on the thickness of the interface.
Influence of Surface Roughness As reported by Suni et al., many factors, including surface roughness, can influence the outcome of
electrical impedance studies.50 It has also been reported that changes in surface roughness can reduce
reproducibility of results. As successive experiments were completed, and thus the electrode surface
was “polished” time and again, the size of the impedance curve increased for bare gold. This is likely
due to a change in surface roughness.
50
(Huang, Bell, & Suni, 2008)

51
Conclusions In this paper, three electrochemical biosensors were evaluated. The first method utilized both
antibodies and aptamer-modified iron oxide nanoparticles to detect the presence of hIgE. This method,
while able to amplify effectively the signal generated by the addition of hIgE, was unfortunately plagued
with problems of reproducibility. Conversely, the RC detection scheme, which was able to generate
reproducible results, was hampered by an inability to amplify effectively the signal generated by the
addition of hIgE. Fortunately, the aptamer only biosensor (in the presence of an electrolyte) possessed
both excellent reproducibility and ease of detection, making it the most desirable of the three schemes.

52
References Akbarinezhad, E., Bahremandi, M., Faridi, H. R., & Rezaei, F. (2009). Another approach for ranking and
evaluating organic paint coatings via electrochemical impedance spectroscopy. Corrosion Science , 51
(2), 356-363.
Baker, B. R., Lai, R. Y., Wood, M. S., Doctor, E. H., Heeger, A. J., & Plaxco, K. W. (2006). An electronic,
aptamer-based small-molecule sensor for the rapid, label-free detection of cocaine in adulterated
samples and biological fluids. Journal of the American Chemical Society , 128 (10), 3138-3139.
Choi, J. H., Chen, K. H., & Strano, M. S. (2006). Aptamer-capped nanocrystal quantum dots: A new
method for label-free protein detection. Journal of the American Chemical Society , 128 (49), 15584-
15585.
Crow, M. J., Grant, G., Provenzale, J. M., & Wax, A. (2009, April). Molecular Imaging and Quantitative
Measurement of Epidermal Growth Factor Receptor Expression in Love Cancer Cells Using
Immunolabeled Gold Nanoparticles. Nuclear Medicine and Molecular Imaging , 1021-1028.
Drolet, D. W., Moon-McDermott, L., & Romig, T. S. (1996). An enzyme-linked oligonucleotide assay.
Nature Biotechnology , 14 (8), 1021-1025.
Duarte, J., Deshpande, P., Guiyedi, V., Mecheri, S., Fesel, C., Cazenave, P.-A., et al. (2007). Total and
functional parasite specific IgE responses in Plasmodium falciparum-nfected patients exhibiting different
clinical status. Malaria Journal , 6 (1).
Fang, X., Sen, A., Vicens, M., & Tan, W. (2003). Synthetic DNA Aptamers to Detect Protein Molecular
Variants in a High-Throughput Fluorescence Quenching Assay. ChemBioChem , 4 (9), 829-834.
Gamry Instruments. (2007). Basics of Electrochemical Impedance Spectroscopy, 5. Retrieved Novemer
2009, from http://www.gamry.com/App_Notes/EIS_Primer/EIS_Primer_2007.pdf
Huang, Y., Bell, M. C., & Suni, I. I. (2008). Impedance biosensor for peanut protein Ara h 1. Analytical
Chemistry , 80 (23), 9157-9161.
Huber, F., Hegner, M., Gerber, C., Guntherodt, H.-J., & Lang, H. P. (2006). Label free analysis of
transcription factors using microcantilever arrays. Biosensors and Bioelectronics , 21 (8), 1599-1605.
Ishizaka, K., Ishizaka, T., & Hornbrook, M. (1966). Physico-chemical properties of human reaginic
antibody. IV. Presence of a unique immunoglobulin as a carrier of reaginic activity. Journal of
Immunology , 97 (1), 75-85.
Jenison, R., Gill, S., Pardi, A., & Polisky, B. (1994). High-Resolution Molecular Discrimination by RNA.
Science , 263 (5152), 1425-1429.
Katilius, E., Katiliene, Z., & Woodbury, N. W. (2006). Signaling aptamers created using fluorescent
nucleotide analogues. Analytical Chemistry , 78 (18), 6484-6489.

53
Katz, E., & Willner, I. (2003). Probing biomolecular interactions at conductive and semiconductive
surfaces by impedance spectroscopy: Routes to impedimetric immunosensors, DNA-sensors, and
enzyme biosensors. Electroanalysis , 15 (11), 913-947.
Lee, J. A., Hwang, S., Kwak, J., Park, S. I., Lee, S. S., & Lee, K.-C. (2008). An electrochemical impedance
biosensor with aptamer-modified pyrolyzed carbon electrode for label-free protein detection. Sensors
and Actuators B , 129, 372-379.
Leff, D. V., Brandt, L., & Heath, J. R. (1996). Synthesis and Characterization of Hydrophobic, Organically-
Soluble Gold Nanocrystals Functionalized with Primary Amines. Langmuir , 12, 4723-4730.
Levy, M., Cater, S. F., & Ellington, A. D. (2005). Quantum-Dot Aptamer Beacons for the Detection of
Proteins. ChemBioChem , 6 (12), 2163-2166.
Li, B., Wang, Y., Wei, H., & Dong, S. (2008). Amplified electrochemical aptasensor taking AuNPs based
sandwich sensing platform as a model. Biosensors and Bioelectronics , 965-970.
Liss, M., Peterson, B., Wolf, H., & Prohaska, E. (2002). An aptamer-based quartz crystal protein
biosensor. Analytical Chemistry , 74 (17), 4488-4495.
Liu, J., & Lu, Y. (2006). Fast colorimetric sensing of adenosine and cocaine based on a general sensor
design involving aptamers and nanoparticles. Angewante Chemie-International Edition , 45 (1), 90-94.
Lu, Y., Li, X., Zhang, L., Yu, P., Su, L., & Mao, L. (2008). Aptamer-based electrochemical sensors with
aptamer-complementary DNA oligonucleotides as probe. Analytical Chemistry , 80 (6), 1883-1890.
Lyon, L., Pena, D., & Natan, M. (1999). Surface plasmon resonance of Au colloid-modified Au films:
Particle size dependence. Journal of Physical Chemistry , 103 (28), 5826-5831.
Merino, E. J., & Weeks, K. M. (2003). Fluorogenic Resolution of Ligand Binding by a Nucleic Acid
Aptamer. Journal of the American Chemical Society , 125 (41), 12370-12371.
Min, K., Cho, M., Han, S.-Y., Shim, Y.-B., Ku, J., & Ban, C. (2008). A simple and direct electrochemical
detecion of interferon-gamma using its RNA and DNA aptamers. Biosensors and Bioelectronics , 23,
1819-1824.
Mok, W., & Li, Y. (2008). Recent Progress in Nucleic Acid Aptamer Based Biosensors and Bioassays.
Sensors , 7050-7084.
Nutiu, R., & Li, Y. (2003). Structure-switching Signaling Aptamers. Journal of the American Chemical
Society , 125 (16), 4771-4778.
Okamoto, T., & Yamaguchi, I. (2003). Optical absorption study of the surface plasmon resonance in gold
nanoparticles immobilized onto a gold substrate by self-assembly technique. Journal of Physical
Chemistry B , 107 (38), 10321-10324.

54
Philippson, J. (2007, April 1). Illustration of the voltage-current phase relationships for a capacitor and an
inductor. Retrieved November 2009, from Wikipedia: http://en.wikipedia.org/wiki/File:VI_phase.png
Pieken, W., Olsen, D., Aurup, H., Benseler, F., & Eckstein, F. (1991). Kinetic Characterization of
Ribonuclease-Resistant 2'-Modified Hammerhead Ribozymes. Science , 253 (5017), 314-317.
Radi, A.-E., Sanchez, J. L., Baldrich, E., & O'Sullivan, C. K. (2005). Reagentless, Reusable, Ultrasensitive
Electrochemical Molecular Beacon Aptasensor. JACS .
Savran, C. A., Knudsen, S. M., Ellington, A. D., & Manalis, S. R. (2004). Micromechanical detection of
proteins using aptamer-based receptor molecules. Analytical Chemistry , 76 (11), 3194-3198.
Schlensog, M. D., Gronewold, M. A., Tewes, M., Famulok, M., & Quandt, E. (2004). A Love-wave
biosensor using nucleic acids as ligands. Sensors and Actuators B-Chemical , 101 (3), 308-315.
Song, S., Wang, L., Li, J., Zhao, J., & Fan, C. (2008). Aptamer-Based Biosensors. Trends in Analytical
Chemistry , 27 (2), 108-117.
Vivekananda, J., & Kiel, J. L. (2006). Anti-Francisella tularensis DNA aptamers detect tularemia antigen
from different subspecies by aptamer-linked immobilized sorbent assay. Laboratory Investigation , 86
(6), 610-618.
Wang, J., Munir, A., Zhonghong, L., & Zhou, S. H. (2009). Aptamer-Au NPs conjugates-enhanced SPR
sensing for the ultrasensitive sandwich immunoassay. Biosensors and Bioelectronics , 25 (1), 124-129.
Winter, W. E., Hardt, N. S., & Fuhrman, S. (2000). Immunoglobulin E. Archives of Pathology and
Laboratory Medicine , 123 (9), 1382-1385.
Xiao, Y., Lubin, A. A., Heeger, A. J., & Plaxco, K. W. (2005). Label-free electronic detection of thrombin in
blood serum by using an aptamer-based sensor. Angewandte Chemie-International Edition , 44 (34),
5456-5459.
Xiao, Y., Piorek, B. D., Plaxco, K. W., & Heeger, A. J. (2005). A reagentless signal-on architecture for
electronic, aptamer-based sensors via target-induced strand displacement. Journal of the American
Chemical Society , 127 (51), 17990-17991.
Xu, D., Xu, D., Yu, X., Liu, Z., He, W., & Ma, Z. (2005). Label-free electrochemical detection for aptamer-
based array electrodes. Analytical Chemistry , 77 (16), 5107-5113.
Yoshizumi, J., Kumamoto, S., Nakamura, M., & Yamana, K. (2008). Target-induced strand release (TISR)
from aptamer-DNA duplex: A general strategy for electronic detection of biomolecules randing from a
small molecule to a large protein. Analyst , 133 (3), 323-325.
Yu, W. W., Change, E., Sayes, C. M., Drezek, R., & Colvin, V. L. (2006). Aqueous dispersion of
monodisperse magnetic iron oxide nanocrystals through phase transfer. Nanotechnology , 17 (17), 4483-
4487.

55
Zayats, M., & Willner, I. (2007). Electronic Aptamer-Based Sensors. Agnew. Chem. Int. Ed. , 6408-6418.