Nanomaterial Drug Products: Current Experience and...
22
PQRI Workshop on Nanotechnology Nanomaterial Drug Products: Current Experience and Management of Potential Risks January 14-15, 2014 USP Meeting Center 1:40 pm Analytical Considerations for the Characterization of Nanomaterial Drug Products Christie Sayes, Ph.D. RTI International [email protected]
Transcript of Nanomaterial Drug Products: Current Experience and...

PQRI Workshop on Nanotechnology
Nanomaterial Drug Products: Current Experience and Management of Potential Risks
January 14-15, 2014 USP Meeting Center
1:40 pm
Analytical Considerations for the Characterization of Nanomaterial Drug Products
Christie Sayes, Ph.D.
RTI International

Simplified Process Flow for Nanomaterial Drug Products R&D
2
Synthesis & Formulation
Physical & Chemical
Characterization
Safety & Efficacy
Evaluation
© Christie M. Sayes 2013

Detailed Process Flow
3
Chemical Synthesis
Dose-Response Size range and distribution
Amount (weight or number
per unit volume)
Impurities
Structure (organic,
polymeric)
In vitro Sciences
In vivo Sciences
Knockdown, transgenic
Surface characteristics
Synthesis & Formulation
Physical & Chemical
Characterization
Safety & Efficacy
Evaluation
Time Course
Pre-clinical, clinical
Epidemiology
Physicochemical
Properties
Liquid v. Aerosol Phase
Emulsification
Stability and Expiration
Dating
Formulations
Dose Metrics
Morphology (crystalline)
© Christie M. Sayes 2013

Synthesis Approaches
1 mm 0.1 nm 1 µm
4
Chemical methods: •Organic synthesis •Chemical reduction •Aerosol seeded-growth
Bottom-up strategy
Silver salt
NP
NP
NP
NP
Top-down strategy
Physical methods: •Photolithography •Laser-beam processing •Mechanical techniques
© Christie M. Sayes 2013
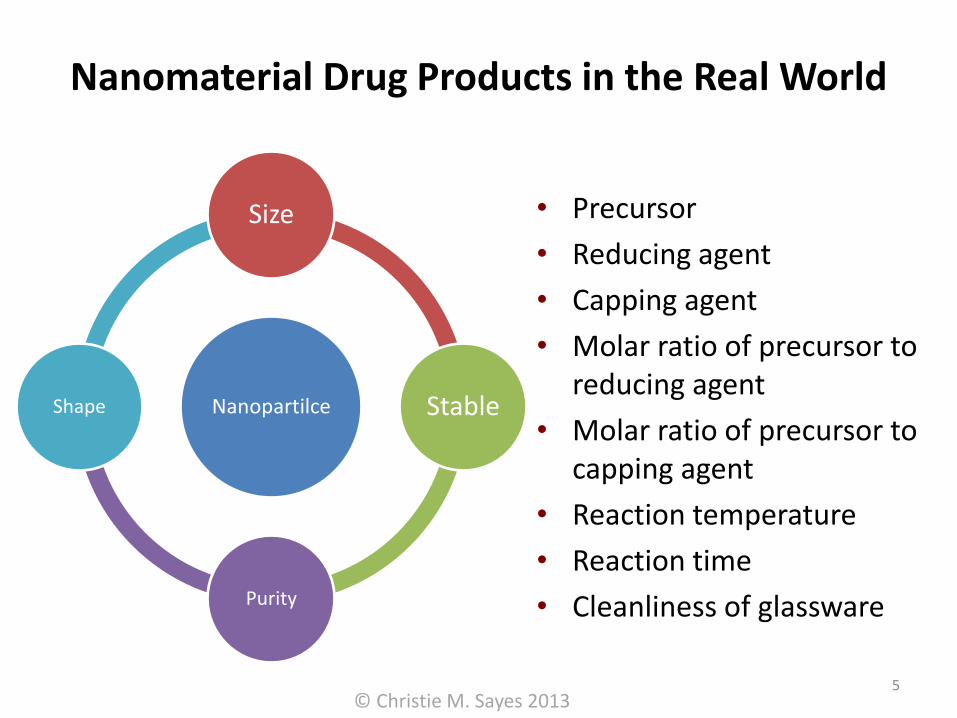
Nanomaterial Drug Products in the Real World
• Precursor
• Reducing agent
• Capping agent
• Molar ratio of precursor to reducing agent
• Molar ratio of precursor to capping agent
• Reaction temperature
• Reaction time
• Cleanliness of glassware
Nanopartilce
Size
Stable
Purity
Shape
5 © Christie M. Sayes 2013

6
Chemical Properties on the Nanometer Size Scale Lipid/Protein
Oxidation
H2O2
OH·
Fe2+
Fenton Reaction
Protein Adhesion
Inorganic Molecule Adhesion
O2
O2.-
Spontaneous ROS
Generation
e-
O2
O2.-
Photo-oxidation
TiO2 e-
UV
CeIV CeIII
Redox Cycling
e-
Dissolution and Release of Ions
Cd2+
Fe2+ Ag+
Zn2+ Al+
© Christie M. Sayes 2013

7
Physical Properties on the Nanometer Size Scale
Chemical Composition
Atomic Emission Spectroscopy (AES)
Energy Dispersive X-ray Spectroscopy
(EDS)
Surface
Specific Surface Area
Zeta potential as a measure of surface
charge
Reactivity via chemical reaction
Water solubility
Iso-Electric Point (IEP)
Size and Shape
Diffraction Patterns
Nanoparticle Tracking Analysis
Electron Microscopy (EM)
Dynamic Light Scattering (DLS)
© Christie M. Sayes 2013

Dynamic Light Scattering as a measure of aggregation
8
individual particles
particle agglomeration
200 600 1000 1400 Size (nm)
• Dynamic light scattering is also
known as photon correlation
spectroscopy or quasi-elastic light
scattering
• The detector measured fluctuations
in the scattered laser light
• These fluctuations are due to
Brownian motion
• Typical spectra of nanoparticle
suspensions in aqueous solution
© Christie M. Sayes 2013

Electron Microscopy as a measure of particle size
9
As with any other microscopy method, electron micrographs are a two dimensional representation of a three dimensional object
Size of the Analysis Region
Size regime
Type of analyses
Instrument
> 100 µm to 0.1 mm
bulk analysis
> 100 nm to 0.1 µm
SEM “micro analysis”
X-ray emission spectrometry (XES) Electron backscatter patterns (EBSP) Auger electron spectrometry (AES) X-ray photoelectron spectrometry (XPS)
< 100 nm to 0.1 µm
TEM “nano analysis”
X-ray emission spectrometry (XES) Transmission electron diffraction (SAD, CBED) Electron energy loss spectrometry (EELS) Atom probe
INFORMATION OBTAINED: • Size • Morphology • Aggregation • Elemental composition
microscopy.tamu.edu © Christie M. Sayes 2013

Nanoparticle Tracking Analysis as a measure of aggregation
• Nanoparticle Tracking Analysis (NTA) visualizes nanoparticles in liquid suspension
• “Tracks” individual particles and gives information about size distribution
• Used in applications such as drug R&D, protein aggregation, and nanoparticle characterization
Microscope
Particles in liquid
Laser
Glass
Metal surface
Scattered particles
© Christie M. Sayes 2013

Diffraction Patterns as a measure of crystallinity
11
An electron diffraction pattern and
transmission electron micrograph of
crystalline C60 aggregates (ranging 20 to 200
nm in diameter)
30 40 50 60 70 80 2
q
An X-ray diffraction pattern of crystalline zinc
oxide nanoparticles (~30 nm in diameter)
• Diffraction patterns for nanocrystalline materials
• There are 2 common methods to acquire a diffraction pattern: • Electron diffraction (shown to the left
above) • X-ray diffraction (shown to the left below)
• Diffraction from a 3D periodic structure in a
crystal is called Bragg diffraction
• Bragg diffraction may be carried out using either light of very short wavelength like X-rays or matter waves like electrons
© Christie M. Sayes 2013

Specific Surface Area as a measure of porosity and area
12
• Specific Surface Area (SSA) is performed on a dry powder
• Most common method is the BET method (S. Brunauer, P. H. Emmett and E. Teller, J. Am. Chem. Soc., 1938, 60, 309.)
• BET theory aims to explain the physical adsorption of gas molecules on a solid surface and serves as the basis for an important analysis technique for the measurement of the specific surface area of a material
0 5 10 15 20 0
400
800
1200
1600
Surf
ace
Are
a (m
2/g
)
Radius (nm)
Particle surface area and diameter is an inverse squared relationship
© Christie M. Sayes 2013

Zeta Potential as a measure of charge
Zeta potential is the boundary of the
diffuse layer of ions within which the
particle acts as a single entity
13
NP + +
+ + + + + + + +
+ + + + + +
+ + + +
+
-
+
-
+
+
+
+
Electric Double
Layer
Slipping
Plane
Stern Layer
Zeta Potential
Surface
Charge
Distance from Nanoparticle Center
Surface < Stern Potential < Zeta Potential
What properties influence this measurement? • Surface functionalization
• Surfactant Ions
• pH of suspension medium
• Ionic strength of suspension medium
Zeta Potential Stability Interpretation for Biomedical Research
From 0 to ± 5 mV Rapid agglomeration Increased bioaccumulation Decreased efficacy
From 10 to ± 30 mV
Relatively unstable
From 30 to ± 40 mV
Moderately stable Greater biodistribution Heightened bioactivity
More than ± 40 mV
Good to excellent stability
NP
+
+ +
+ +
+ +
+ -
© Christie M. Sayes 2013

Redox Capacity as a measure of reactivity
14
NP
organic matter
e-
NP NP
+ +
+
+ +
+
+
+
- -
-
-
“Smart” Nanoparticles • Most chemical reactions involving nanoparticles
occur on the surface of the particle
• Stimuli responsive materials can be manipulated to enable reversible change in their physicochemical characteristics in response to changes in their environmental surroundings
• These “smart” stimuli responsive materials are sensitive to pH, temperature, signaling molecules, enzymes or drugs, and/or reactive species
• Redox chemistry on the nanoparticle surface is the most common chemical reaction
enzyme or other targeting moieties
pH
temperature
signaling molecules
reactive species
mutifunctional
nanoparticle
© Christie M. Sayes 2013

Water Solubility as a measure of fate and transformation
15
Nanoparticles are either hydrophobic (lipophilic)
or hydrophilic (lipophobic)
NP
nanoparticle core
micelle
PEGylation
changing pH + +
+
+ + +
+ +
+
altered surface charge
C60(OH)24
suspended in
water
C60
suspended in
toluene
OHOH
OH
OH
HO
HO
OH
OHHO
HO
HO
OH
OHHO
OHOH
C60 C60(OH)24
5000 mg/L in toluene 0.5 mg/L in toluene
10-8 mg/L in water 100,000 mg/L in water
© Christie M. Sayes 2013

Atomic Emission Spectroscopy as a measure of composition
16
Primarily used for metal-based nanoparticles, such as:
•Colloids
•Oxides
•Bimetallic semiconductors
It is one of the few quantitative methods in particle
physicochemical characterization.
Most common atomization method is inductively
coupled plasma (ICP)
AES can gives information on:
•Total ion concentration
•Impurities
•REDOX state
•Presence of nanoparticle inside of a cell
Advantages of the technique
Determination of 68 metals
Ability to make ppb determinations on major components of a sample
Precision of measurements by flame are better
Analysis is subject to little interference
Most interference that occurs have been well studied and documented
Sample preparation is simple (often involving only dissolution in an acid)
Instrument easy to tune and operate
excitation
source
excited
atoms
selector
detector
© Christie M. Sayes 2013

UV-Visible-IR Spectroscopy as a measure of functionality
17
Peaks Description After incorporated
on nanoparticle
922 cm-1 Asymmetric wagging vibrations of the
terminal dihalovinlyl group Shifts to 911 cm-1
884 cm-1 Deformation vibrations of the
cyclopropane rings Shifts to 843 cm-1
1072 cm-1 (C=O)-O- stretching Shifts to 1077 cm-1
1250 cm-1 aryl-O stretch, out-of-phase C-O-C
stretching and ring vibrations
1607 cm-1 1401 cm-
1
Asymmetry flex vibration of C=O and symmetry flex vibration of C=O
Shifts to 1583 cm-1 and 1393 cm-1
Wedge 1 Wedge 2
Sooresh et al. ACS Journal of Applied Mat & Interfaces. 2011. 3: 3779-3789
INSTRUMENTATION: • Monochromator-based • High Energy Xenon Flash • Infrared spectrometer • Tuned “windows” to avoid
interferences
INFORMATION: • Surface plasmon properties which
can be interpreted as changes to particle’s surface (i.e. functionalization)
• Shift in bands will indicate interaction with other molecules in its vicinity
© Christie M. Sayes 2013

0
50
100
150
200
0 2500 5000 7500 10000
Energy eV
Energy Dispersive X-ray Spectroscopy as a measure of composition
18
• Energy dispersive spectroscopy as a micro-analytical tool can yield both quantitative and qualitative results
• These results are typically a spectra with signature peaks identifying atomic species preset in the sample
Fe
Fe
Cu
Cu
Si
Os P
Fe
Fe Cu
Cu
Os
Fe2O3
nanoparticles in a membrane
bound vesicle
A549 epithelial cell
incident X-ray
ejected electron detector
shells
or orbitals
spectra
© Christie M. Sayes 2013

pH and Iso-Electric Point as a measures of fate and transformation
19
- - - -
- - -
- - - - -
+ + + +
-
+ +
+ +
+
+ +
-
-
particle
double layer
zeta potential
influences
cellular viability
- - - -
- - -
- - - - -
+ + + +
-
+ +
+ +
+
+ +
-
- -
-
-
- -
+ - +
- +
- +
-
- + - +
+ -
+
- +
+
- -
-
+
- +
+ + + +
+
+ + +
- - - -
+
- -
- -
-
- -
+
+ +
+
+
+ +
pH=IEP
small agglomerate
small agglomerate
large agglomerate
• The model below is a schematic diagram of the effects of pH on a nanoparticle
• Surface charge is altered when the pH is
increased or decreased
0
500
1000
1500
2000
2500
-80
-60
-40
-20
0
20
40
60
80
1 3 5 7 9 11 13
Siz
e (n
m)
Zeta
po
ten
tia
l (m
V)
pH
• Titration of nanoparticles in ultrapure water (18.2 mΩ)
• In a model nanoparticle system,
the largest aggregate size would be observed at its isoelectric point (zeta potential=0 mV)
© Christie M. Sayes 2013

Identification of Risk Triggers
20
Goal: Develop methods
for the purpose of building a risk
management methodology for
nanomaterial drug products
Adapted from Tsuji J S et al.
Toxicol. Sci. 2006;89:42-50 © Christie M. Sayes 2013

A Life Cycle Approach
Pristine nanoparticles
Nano-enabled Products
Product
End-of-life
Well-characterized and understood
engineered nanomaterials
Wear & tear; Use vs. misuse
Pharmaceuticals Devices
Toxicity Assessment
Pristine
Pristine
End-of-life
End-of-life
Characterization
21
Packaging
© Christie M. Sayes 2013

200 nm
TiO2
Sooresh et al. Environmental Science & Technology, 2013, submitted.
22
Polymer + TiO2
500 nm
5 µm
A Life Cycle Approach
Other changes
• ROS generation decreases
• Signature peaks become less intense (XRD, EDS)
• FTIR bands shift
© Christie M. Sayes 2013