Nanoflow Liquid Chromatography Coupled with Middle … · Nanoflow Liquid Chromatography Coupled...
1
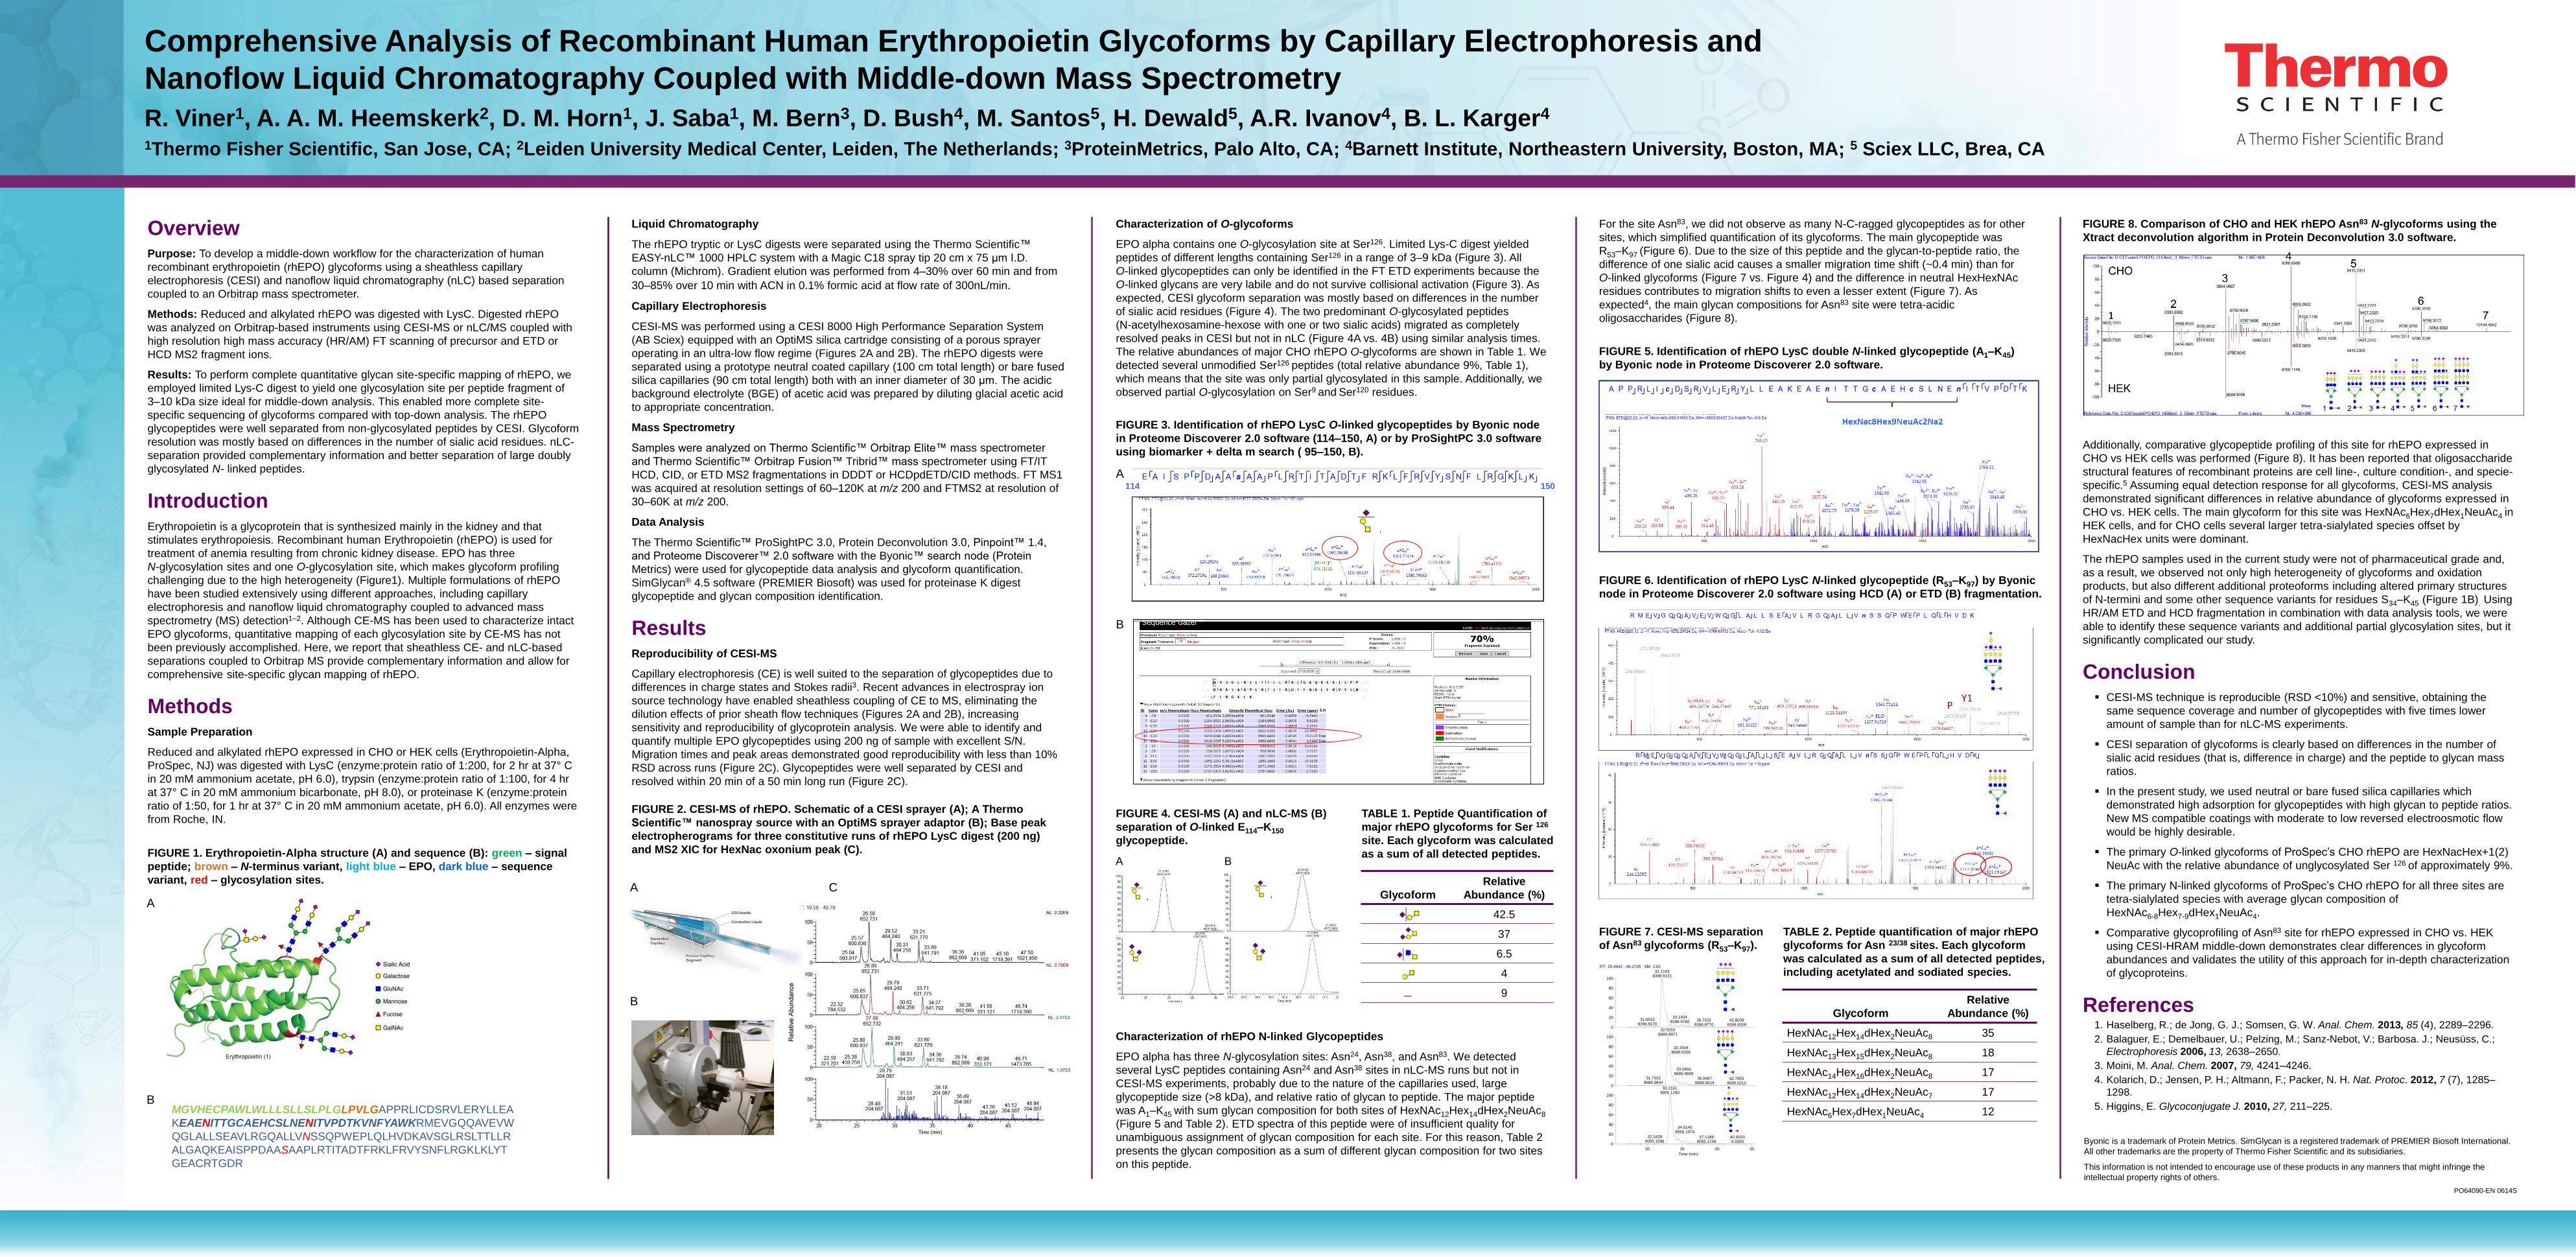
Comprehensive Analysis of Recombinant Human Erythropoietin Glycoforms by Capillary Electrophoresis and Nanoflow Liquid Chromatography Coupled with Middle-down Mass Spectrometry R. Viner 1 , A. A. M. Heemskerk 2 , D. M. Horn 1 , J. Saba 1 , M. Bern 3 , D. Bush 4 , M. Santos 5 , H. Dewald 5 , A.R. Ivanov 4 , B. L. Karger 4 1 Thermo Fisher Scientific, San Jose, CA; 2 Leiden University Medical Center, Leiden, The Netherlands; 3 ProteinMetrics, Palo Alto, CA; 4 Barnett Institute, Northeastern University, Boston, MA; 5 Sciex LLC, Brea, CA Additionally, comparative glycopeptide profiling of this site for rhEPO expressed in CHO vs HEK cells was performed (Figure 8). It has been reported that oligosaccharide structural features of recombinant proteins are cell line-, culture condition-, and specie- specific. 5 Assuming equal detection response for all glycoforms, CESI-MS analysis demonstrated significant differences in relative abundance of glycoforms expressed in CHO vs. HEK cells. The main glycoform for this site was HexNAc 6 Hex 7 dHex 1 NeuAc 4 in HEK cells, and for CHO cells several larger tetra-sialylated species offset by HexNacHex units were dominant. The rhEPO samples used in the current study were not of pharmaceutical grade and, as a result, we observed not only high heterogeneity of glycoforms and oxidation products, but also different additional proteoforms including altered primary structures of N-termini and some other sequence variants for residues S 34 –K 45 (Figure 1B) . Using HR/AM ETD and HCD fragmentation in combination with data analysis tools, we were able to identify these sequence variants and additional partial glycosylation sites, but it significantly complicated our study. Conclusion CESI-MS technique is reproducible (RSD <10%) and sensitive, obtaining the same sequence coverage and number of glycopeptides with five times lower amount of sample than for nLC-MS experiments. CESI separation of glycoforms is clearly based on differences in the number of sialic acid residues (that is, difference in charge) and the peptide to glycan mass ratios. In the present study, we used neutral or bare fused silica capillaries which demonstrated high adsorption for glycopeptides with high glycan to peptide ratios. New MS compatible coatings with moderate to low reversed electroosmotic flow would be highly desirable. The primary O-linked glycoforms of ProSpec’s CHO rhEPO are HexNacHex+1(2) NeuAc with the relative abundance of unglycosylated Ser 126 of approximately 9%. The primary N-linked glycoforms of ProSpec’s CHO rhEPO for all three sites are tetra-sialylated species with average glycan composition of HexNAc 6-8 Hex 7-9 dHex 1 NeuAc 4 . Comparative glycoprofiling of Asn 83 site for rhEPO expressed in CHO vs. HEK using CESI-HRAM middle-down demonstrates clear differences in glycoform abundances and validates the utility of this approach for in-depth characterization of glycoproteins. References 1. Haselberg, R.; de Jong, G. J.; Somsen, G. W. Anal. Chem. 2013, 85 (4), 2289–2296. 2. Balaguer, E.; Demelbauer, U.; Pelzing, M.; Sanz-Nebot, V.; Barbosa. J.; Neusüss, C.; Electrophoresis 2006, 13, 2638–2650. 3. Moini, M. Anal. Chem. 2007, 79, 4241–4246. 4. Kolarich, D.; Jensen, P. H.; Altmann, F.; Packer, N. H. Nat. Protoc. 2012, 7 (7), 1285– 1298. 5. Higgins, E. Glycoconjugate J. 2010, 27, 211–225. Overview Purpose: To develop a middle-down workflow for the characterization of human recombinant erythropoietin (rhEPO) glycoforms using a sheathless capillary electrophoresis (CESI) and nanoflow liquid chromatography (nLC) based separation coupled to an Orbitrap mass spectrometer. Methods: Reduced and alkylated rhEPO was digested with LysC. Digested rhEPO was analyzed on Orbitrap-based instruments using CESI-MS or nLC/MS coupled with high resolution high mass accuracy (HR/AM) FT scanning of precursor and ETD or HCD MS2 fragment ions. Results: To perform complete quantitative glycan site-specific mapping of rhEPO, we employed limited Lys-C digest to yield one glycosylation site per peptide fragment of 3–10 kDa size ideal for middle-down analysis. This enabled more complete site- specific sequencing of glycoforms compared with top-down analysis. The rhEPO glycopeptides were well separated from non-glycosylated peptides by CESI. Glycoform resolution was mostly based on differences in the number of sialic acid residues. nLC- separation provided complementary information and better separation of large doubly glycosylated N- linked peptides. Introduction Erythropoietin is a glycoprotein that is synthesized mainly in the kidney and that stimulates erythropoiesis. Recombinant human Erythropoietin (rhEPO) is used for treatment of anemia resulting from chronic kidney disease. EPO has three N-glycosylation sites and one O-glycosylation site, which makes glycoform profiling challenging due to the high heterogeneity (Figure1). Multiple formulations of rhEPO have been studied extensively using different approaches, including capillary electrophoresis and nanoflow liquid chromatography coupled to advanced mass spectrometry (MS) detection 1–2 . Although CE-MS has been used to characterize intact EPO glycoforms, quantitative mapping of each glycosylation site by CE-MS has not been previously accomplished. Here, we report that sheathless CE- and nLC-based separations coupled to Orbitrap MS provide complementary information and allow for comprehensive site-specific glycan mapping of rhEPO. Methods Sample Preparation Reduced and alkylated rhEPO expressed in CHO or HEK cells (Erythropoietin-Alpha, ProSpec, NJ) was digested with LysC (enzyme:protein ratio of 1:200, for 2 hr at 37° C in 20 mM ammonium acetate, pH 6.0), trypsin (enzyme:protein ratio of 1:100, for 4 hr at 37° C in 20 mM ammonium bicarbonate, pH 8.0), or proteinase K (enzyme:protein ratio of 1:50, for 1 hr at 37° C in 20 mM ammonium acetate, pH 6.0). All enzymes were from Roche, IN. FIGURE 2. CESI-MS of rhEPO. Schematic of a CESI sprayer (A); A Thermo Scientific™ nanospray source with an OptiMS sprayer adaptor (B); Base peak electropherograms for three constitutive runs of rhEPO LysC digest (200 ng) and MS2 XIC for HexNac oxonium peak (C). TABLE 1. Peptide Quantification of major rhEPO glycoforms for Ser 126 site. Each glycoform was calculated as a sum of all detected peptides. FIGURE 4. CESI-MS (A) and nLC-MS (B) separation of O-linked E 114 –K 150 glycopeptide. Liquid Chromatography The rhEPO tryptic or LysC digests were separated using the Thermo Scientific™ EASY-nLC™ 1000 HPLC system with a Magic C18 spray tip 20 cm x 75 μm I.D. column (Michrom). Gradient elution was performed from 4–30% over 60 min and from 30–85% over 10 min with ACN in 0.1% formic acid at flow rate of 300nL/min. Capillary Electrophoresis CESI-MS was performed using a CESI 8000 High Performance Separation System (AB Sciex) equipped with an OptiMS silica cartridge consisting of a porous sprayer operating in an ultra-low flow regime (Figures 2A and 2B). The rhEPO digests were separated using a prototype neutral coated capillary (100 cm total length) or bare fused silica capillaries (90 cm total length) both with an inner diameter of 30 μm. The acidic background electrolyte (BGE) of acetic acid was prepared by diluting glacial acetic acid to appropriate concentration. Mass Spectrometry Samples were analyzed on Thermo Scientific™ Orbitrap Elite™ mass spectrometer and Thermo Scientific™ Orbitrap Fusion™ Tribrid™ mass spectrometer using FT/IT HCD, CID, or ETD MS2 fragmentations in DDDT or HCDpdETD/CID methods. FT MS1 was acquired at resolution settings of 60–120K at m/z 200 and FTMS2 at resolution of 30–60K at m/z 200. Data Analysis The Thermo Scientific™ ProSightPC 3.0, Protein Deconvolution 3.0, Pinpoint™ 1.4, and Proteome Discoverer™ 2.0 software with the Byonic™ search node (Protein Metrics) were used for glycopeptide data analysis and glycoform quantification. SimGlycan ® 4.5 software (PREMIER Biosoft) was used for proteinase K digest glycopeptide and glycan composition identification. Results Reproducibility of CESI-MS Capillary electrophoresis (CE) is well suited to the separation of glycopeptides due to differences in charge states and Stokes radii 3 . Recent advances in electrospray ion source technology have enabled sheathless coupling of CE to MS, eliminating the dilution effects of prior sheath flow techniques (Figures 2A and 2B), increasing sensitivity and reproducibility of glycoprotein analysis. We were able to identify and quantify multiple EPO glycopeptides using 200 ng of sample with excellent S/N. Migration times and peak areas demonstrated good reproducibility with less than 10% RSD across runs (Figure 2C). Glycopeptides were well separated by CESI and resolved within 20 min of a 50 min long run (Figure 2C). For the site Asn 83 , we did not observe as many N-C-ragged glycopeptides as for other sites, which simplified quantification of its glycoforms. The main glycopeptide was R 53 –K 97 (Figure 6). Due to the size of this peptide and the glycan-to-peptide ratio, the difference of one sialic acid causes a smaller migration time shift (~0.4 min) than for O-linked glycoforms (Figure 7 vs. Figure 4) and the difference in neutral HexHexNAc residues contributes to migration shifts to even a lesser extent (Figure 7). As expected 4 , the main glycan compositions for Asn 83 site were tetra-acidic oligosaccharides (Figure 8). Byonic is a trademark of Protein Metrics. SimGlycan is a registered trademark of PREMIER Biosoft International. All other trademarks are the property of Thermo Fisher Scientific and its subsidiaries. This information is not intended to encourage use of these products in any manners that might infringe the intellectual property rights of others. PO64090-EN 0614S FIGURE 1. Erythropoietin-Alpha structure (A) and sequence (B): green – signal peptide; brown – N-terminus variant, light blue – EPO, dark blue – sequence variant, red – glycosylation sites. FIGURE 3. Identification of rhEPO LysC O-linked glycopeptides by Byonic node in Proteome Discoverer 2.0 software (114–150, A) or by ProSightPC 3.0 software using biomarker + delta m search ( 95–150, B). Characterization of rhEPO N-linked Glycopeptides EPO alpha has three N-glycosylation sites: Asn 24 , Asn 38 , and Asn 83 . We detected several LysC peptides containing Asn 24 and Asn 38 sites in nLC-MS runs but not in CESI-MS experiments, probably due to the nature of the capillaries used, large glycopeptide size (>8 kDa), and relative ratio of glycan to peptide. The major peptide was A 1 –K 45 with sum glycan composition for both sites of HexNAc 12 Hex 14 dHex 2 NeuAc 8 (Figure 5 and Table 2). ETD spectra of this peptide were of insufficient quality for unambiguous assignment of glycan composition for each site. For this reason, Table 2 presents the glycan composition as a sum of different glycan composition for two sites on this peptide. Characterization of O-glycoforms EPO alpha contains one O-glycosylation site at Ser 126 . Limited Lys-C digest yielded peptides of different lengths containing Ser 126 in a range of 3–9 kDa (Figure 3). All O-linked glycopeptides can only be identified in the FT ETD experiments because the O-linked glycans are very labile and do not survive collisional activation (Figure 3). As expected, CESI glycoform separation was mostly based on differences in the number of sialic acid residues (Figure 4). The two predominant O-glycosylated peptides (N-acetylhexosamine-hexose with one or two sialic acids) migrated as completely resolved peaks in CESI but not in nLC (Figure 4A vs. 4B) using similar analysis times. The relative abundances of major CHO rhEPO O-glycoforms are shown in Table 1. We detected several unmodified Ser 126 peptides (total relative abundance 9%, Table 1), which means that the site was only partial glycosylated in this sample. Additionally, we observed partial O-glycosylation on Ser 9 and Ser 120 residues. FIGURE 6. Identification of rhEPO LysC N-linked glycopeptide (R 53 –K 97 ) by Byonic node in Proteome Discoverer 2.0 software using HCD (A) or ETD (B) fragmentation. MGVHECPAWLWLLLSLLSLPLGLPVLGAPPRLICDSRVLERYLLEA KEAENITTGCAEHCSLNENITVPDTKVNFYAWKRMEVGQQAVEVW QGLALLSEAVLRGQALLVNSSQPWEPLQLHVDKAVSGLRSLTTLLR ALGAQKEAISPPDAASAAPLRTITADTFRKLFRVYSNFLRGKLKLYT GEACRTGDR A B 114 150 FIGURE 5. Identification of rhEPO LysC double N-linked glycopeptide (A 1 –K 45 ) by Byonic node in Proteome Discoverer 2.0 software. A B A B FIGURE 8. Comparison of CHO and HEK rhEPO Asn 83 N-glycoforms using the Xtract deconvolution algorithm in Protein Deconvolution 3.0 software. RT: 25.4842 - 46.2705 SM: 13G 30 35 40 45 Time (min) 0 20 40 60 80 100 0 20 40 60 80 100 0 20 40 60 80 100 32.1103 8398.9131 33.1504 8398.8760 31.6515 8398.9170 36.7532 8398.8770 42.8039 8398.9209 32.9253 8689.9971 33.1504 8690.0156 33.5604 8689.9668 31.7532 8689.9844 36.8467 8689.9619 42.7953 8690.0215 33.2161 9055.1260 34.0145 9055.1074 32.5428 9055.1006 37.1188 9055.1748 42.9203 0.0000 FIGURE 7. CESI-MS separation of Asn 83 glycoforms (R 53 –K 97 ). TABLE 2. Peptide quantification of major rhEPO glycoforms for Asn 23/38 sites. Each glycoform was calculated as a sum of all detected peptides, including acetylated and sodiated species. A B C Glycoform Relative Abundance (%) HexNAc 12 Hex 14 dHex 2 NeuAc 8 35 HexNAc 13 Hex 15 dHex 2 NeuAc 8 18 HexNAc 14 Hex 16 dHex 2 NeuAc 8 17 HexNAc 12 Hex 14 dHex 2 NeuAc 7 17 HexNAc 6 Hex 7 dHex 1 NeuAc 4 12 Glycoform Relative Abundance (%) 42.5 37 6.5 4 — 9
Transcript of Nanoflow Liquid Chromatography Coupled with Middle … · Nanoflow Liquid Chromatography Coupled...
Comprehensive Analysis of Recombinant Human Erythropoietin Glycoforms by Capillary Electrophoresis and
Nanoflow Liquid Chromatography Coupled with Middle-down Mass Spectrometry
R. Viner1, A. A. M. Heemskerk2, D. M. Horn1, J. Saba1, M. Bern3, D. Bush4, M. Santos5, H. Dewald5, A.R. Ivanov4, B. L. Karger4 1Thermo Fisher Scientific, San Jose, CA; 2Leiden University Medical Center, Leiden, The Netherlands; 3ProteinMetrics, Palo Alto, CA; 4Barnett Institute, Northeastern University, Boston, MA; 5 Sciex LLC, Brea, CA
Additionally, comparative glycopeptide profiling of this site for rhEPO expressed in
CHO vs HEK cells was performed (Figure 8). It has been reported that oligosaccharide
structural features of recombinant proteins are cell line-, culture condition-, and specie-
specific.5 Assuming equal detection response for all glycoforms, CESI-MS analysis
demonstrated significant differences in relative abundance of glycoforms expressed in
CHO vs. HEK cells. The main glycoform for this site was HexNAc6Hex7dHex1NeuAc4 in
HEK cells, and for CHO cells several larger tetra-sialylated species offset by
HexNacHex units were dominant.
The rhEPO samples used in the current study were not of pharmaceutical grade and,
as a result, we observed not only high heterogeneity of glycoforms and oxidation
products, but also different additional proteoforms including altered primary structures
of N-termini and some other sequence variants for residues S34–K45 (Figure 1B). Using
HR/AM ETD and HCD fragmentation in combination with data analysis tools, we were
able to identify these sequence variants and additional partial glycosylation sites, but it
significantly complicated our study.
Conclusion CESI-MS technique is reproducible (RSD <10%) and sensitive, obtaining the
same sequence coverage and number of glycopeptides with five times lower
amount of sample than for nLC-MS experiments.
CESI separation of glycoforms is clearly based on differences in the number of
sialic acid residues (that is, difference in charge) and the peptide to glycan mass
ratios.
In the present study, we used neutral or bare fused silica capillaries which
demonstrated high adsorption for glycopeptides with high glycan to peptide ratios.
New MS compatible coatings with moderate to low reversed electroosmotic flow
would be highly desirable.
The primary O-linked glycoforms of ProSpec’s CHO rhEPO are HexNacHex+1(2)
NeuAc with the relative abundance of unglycosylated Ser 126 of approximately 9%.
The primary N-linked glycoforms of ProSpec’s CHO rhEPO for all three sites are
tetra-sialylated species with average glycan composition of
HexNAc6-8Hex7-9dHex1NeuAc4.
Comparative glycoprofiling of Asn83 site for rhEPO expressed in CHO vs. HEK
using CESI-HRAM middle-down demonstrates clear differences in glycoform
abundances and validates the utility of this approach for in-depth characterization
of glycoproteins.
References 1. Haselberg, R.; de Jong, G. J.; Somsen, G. W. Anal. Chem. 2013, 85 (4), 2289–2296.
2. Balaguer, E.; Demelbauer, U.; Pelzing, M.; Sanz-Nebot, V.; Barbosa. J.; Neusüss, C.;
Electrophoresis 2006, 13, 2638–2650.
3. Moini, M. Anal. Chem. 2007, 79, 4241–4246.
4. Kolarich, D.; Jensen, P. H.; Altmann, F.; Packer, N. H. Nat. Protoc. 2012, 7 (7), 1285–
1298.
5. Higgins, E. Glycoconjugate J. 2010, 27, 211–225.
Overview Purpose: To develop a middle-down workflow for the characterization of human
recombinant erythropoietin (rhEPO) glycoforms using a sheathless capillary
electrophoresis (CESI) and nanoflow liquid chromatography (nLC) based separation
coupled to an Orbitrap mass spectrometer.
Methods: Reduced and alkylated rhEPO was digested with LysC. Digested rhEPO
was analyzed on Orbitrap-based instruments using CESI-MS or nLC/MS coupled with
high resolution high mass accuracy (HR/AM) FT scanning of precursor and ETD or
HCD MS2 fragment ions.
Results: To perform complete quantitative glycan site-specific mapping of rhEPO, we
employed limited Lys-C digest to yield one glycosylation site per peptide fragment of
3–10 kDa size ideal for middle-down analysis. This enabled more complete site-
specific sequencing of glycoforms compared with top-down analysis. The rhEPO
glycopeptides were well separated from non-glycosylated peptides by CESI. Glycoform
resolution was mostly based on differences in the number of sialic acid residues. nLC-
separation provided complementary information and better separation of large doubly
glycosylated N- linked peptides.
Introduction Erythropoietin is a glycoprotein that is synthesized mainly in the kidney and that
stimulates erythropoiesis. Recombinant human Erythropoietin (rhEPO) is used for
treatment of anemia resulting from chronic kidney disease. EPO has three
N-glycosylation sites and one O-glycosylation site, which makes glycoform profiling
challenging due to the high heterogeneity (Figure1). Multiple formulations of rhEPO
have been studied extensively using different approaches, including capillary
electrophoresis and nanoflow liquid chromatography coupled to advanced mass
spectrometry (MS) detection1–2. Although CE-MS has been used to characterize intact
EPO glycoforms, quantitative mapping of each glycosylation site by CE-MS has not
been previously accomplished. Here, we report that sheathless CE- and nLC-based
separations coupled to Orbitrap MS provide complementary information and allow for
comprehensive site-specific glycan mapping of rhEPO.
Methods Sample Preparation
Reduced and alkylated rhEPO expressed in CHO or HEK cells (Erythropoietin-Alpha,
ProSpec, NJ) was digested with LysC (enzyme:protein ratio of 1:200, for 2 hr at 37° C
in 20 mM ammonium acetate, pH 6.0), trypsin (enzyme:protein ratio of 1:100, for 4 hr
at 37° C in 20 mM ammonium bicarbonate, pH 8.0), or proteinase K (enzyme:protein
ratio of 1:50, for 1 hr at 37° C in 20 mM ammonium acetate, pH 6.0). All enzymes were
from Roche, IN. FIGURE 2. CESI-MS of rhEPO. Schematic of a CESI sprayer (A); A Thermo
Scientific™ nanospray source with an OptiMS sprayer adaptor (B); Base peak
electropherograms for three constitutive runs of rhEPO LysC digest (200 ng)
and MS2 XIC for HexNac oxonium peak (C).
TABLE 1. Peptide Quantification of
major rhEPO glycoforms for Ser 126
site. Each glycoform was calculated
as a sum of all detected peptides.
FIGURE 4. CESI-MS (A) and nLC-MS (B)
separation of O-linked E114–K150
glycopeptide.
Liquid Chromatography
The rhEPO tryptic or LysC digests were separated using the Thermo Scientific™
EASY-nLC™ 1000 HPLC system with a Magic C18 spray tip 20 cm x 75 μm I.D.
column (Michrom). Gradient elution was performed from 4–30% over 60 min and from
30–85% over 10 min with ACN in 0.1% formic acid at flow rate of 300nL/min.
Capillary Electrophoresis
CESI-MS was performed using a CESI 8000 High Performance Separation System
(AB Sciex) equipped with an OptiMS silica cartridge consisting of a porous sprayer
operating in an ultra-low flow regime (Figures 2A and 2B). The rhEPO digests were
separated using a prototype neutral coated capillary (100 cm total length) or bare fused
silica capillaries (90 cm total length) both with an inner diameter of 30 μm. The acidic
background electrolyte (BGE) of acetic acid was prepared by diluting glacial acetic acid
to appropriate concentration.
Mass Spectrometry
Samples were analyzed on Thermo Scientific™ Orbitrap Elite™ mass spectrometer
and Thermo Scientific™ Orbitrap Fusion™ Tribrid™ mass spectrometer using FT/IT
HCD, CID, or ETD MS2 fragmentations in DDDT or HCDpdETD/CID methods. FT MS1
was acquired at resolution settings of 60–120K at m/z 200 and FTMS2 at resolution of
30–60K at m/z 200.
Data Analysis
The Thermo Scientific™ ProSightPC 3.0, Protein Deconvolution 3.0, Pinpoint™ 1.4,
and Proteome Discoverer™ 2.0 software with the Byonic™ search node (Protein
Metrics) were used for glycopeptide data analysis and glycoform quantification.
SimGlycan® 4.5 software (PREMIER Biosoft) was used for proteinase K digest
glycopeptide and glycan composition identification.
Results Reproducibility of CESI-MS
Capillary electrophoresis (CE) is well suited to the separation of glycopeptides due to
differences in charge states and Stokes radii3. Recent advances in electrospray ion
source technology have enabled sheathless coupling of CE to MS, eliminating the
dilution effects of prior sheath flow techniques (Figures 2A and 2B), increasing
sensitivity and reproducibility of glycoprotein analysis. We were able to identify and
quantify multiple EPO glycopeptides using 200 ng of sample with excellent S/N.
Migration times and peak areas demonstrated good reproducibility with less than 10%
RSD across runs (Figure 2C). Glycopeptides were well separated by CESI and
resolved within 20 min of a 50 min long run (Figure 2C).
For the site Asn83, we did not observe as many N-C-ragged glycopeptides as for other
sites, which simplified quantification of its glycoforms. The main glycopeptide was
R53–K97 (Figure 6). Due to the size of this peptide and the glycan-to-peptide ratio, the
difference of one sialic acid causes a smaller migration time shift (~0.4 min) than for
O-linked glycoforms (Figure 7 vs. Figure 4) and the difference in neutral HexHexNAc
residues contributes to migration shifts to even a lesser extent (Figure 7). As
expected4, the main glycan compositions for Asn83 site were tetra-acidic
oligosaccharides (Figure 8).
Byonic is a trademark of Protein Metrics. SimGlycan is a registered trademark of PREMIER Biosoft International.
All other trademarks are the property of Thermo Fisher Scientific and its subsidiaries.
This information is not intended to encourage use of these products in any manners that might infringe the
intellectual property rights of others.
PO64090-EN 0614S
FIGURE 1. Erythropoietin-Alpha structure (A) and sequence (B): green – signal
peptide; brown – N-terminus variant, light blue – EPO, dark blue – sequence
variant, red – glycosylation sites.
FIGURE 3. Identification of rhEPO LysC O-linked glycopeptides by Byonic node
in Proteome Discoverer 2.0 software (114–150, A) or by ProSightPC 3.0 software
using biomarker + delta m search ( 95–150, B).
Characterization of rhEPO N-linked Glycopeptides
EPO alpha has three N-glycosylation sites: Asn24, Asn38, and Asn83. We detected
several LysC peptides containing Asn24 and Asn38 sites in nLC-MS runs but not in
CESI-MS experiments, probably due to the nature of the capillaries used, large
glycopeptide size (>8 kDa), and relative ratio of glycan to peptide. The major peptide
was A1–K45 with sum glycan composition for both sites of HexNAc12Hex14dHex2NeuAc8
(Figure 5 and Table 2). ETD spectra of this peptide were of insufficient quality for
unambiguous assignment of glycan composition for each site. For this reason, Table 2
presents the glycan composition as a sum of different glycan composition for two sites
on this peptide.
Characterization of O-glycoforms
EPO alpha contains one O-glycosylation site at Ser126. Limited Lys-C digest yielded
peptides of different lengths containing Ser126 in a range of 3–9 kDa (Figure 3). All
O-linked glycopeptides can only be identified in the FT ETD experiments because the
O-linked glycans are very labile and do not survive collisional activation (Figure 3). As
expected, CESI glycoform separation was mostly based on differences in the number
of sialic acid residues (Figure 4). The two predominant O-glycosylated peptides
(N-acetylhexosamine-hexose with one or two sialic acids) migrated as completely
resolved peaks in CESI but not in nLC (Figure 4A vs. 4B) using similar analysis times.
The relative abundances of major CHO rhEPO O-glycoforms are shown in Table 1. We
detected several unmodified Ser126 peptides (total relative abundance 9%, Table 1),
which means that the site was only partial glycosylated in this sample. Additionally, we
observed partial O-glycosylation on Ser9 and Ser120 residues.
FIGURE 6. Identification of rhEPO LysC N-linked glycopeptide (R53–K97) by Byonic
node in Proteome Discoverer 2.0 software using HCD (A) or ETD (B) fragmentation.
MGVHECPAWLWLLLSLLSLPLGLPVLGAPPRLICDSRVLERYLLEA
KEAENITTGCAEHCSLNENITVPDTKVNFYAWKRMEVGQQAVEVW
QGLALLSEAVLRGQALLVNSSQPWEPLQLHVDKAVSGLRSLTTLLR
ALGAQKEAISPPDAASAAPLRTITADTFRKLFRVYSNFLRGKLKLYT
GEACRTGDR
A
B
114 150
FIGURE 5. Identification of rhEPO LysC double N-linked glycopeptide (A1–K45)
by Byonic node in Proteome Discoverer 2.0 software.
A
B
A B
FIGURE 8. Comparison of CHO and HEK rhEPO Asn83 N-glycoforms using the
Xtract deconvolution algorithm in Protein Deconvolution 3.0 software.
RT: 25.4842 - 46.2705 SM: 13G
30 35 40 45
Time (min)
0
20
40
60
80
100
0
20
40
60
80
100
Rela
tive A
bundance
0
20
40
60
80
100
32.11038398.9131
33.15048398.8760
31.65158398.9170
36.75328398.8770
42.80398398.9209
32.92538689.9971
33.15048690.0156
33.56048689.9668
31.75328689.9844
36.84678689.9619
42.79538690.0215
33.21619055.1260
34.01459055.1074
32.54289055.1006
37.11889055.1748
42.92030.0000
NL:3.76E6
m/z= 8398.8200-8398.9900 F: ms MS EPO_HEKlysC_3_50min_FTETD_xtract
NL:1.40E7
m/z= 8689.8820-8690.0373 F: ms MS EPO_HEKlysC_3_50min_FTETD_xtract
NL:6.24E6
m/z= 9055.0741-9055.1889 F: ms MS EPO_HEKlysC_3_50min_FTETD_xtract
FIGURE 7. CESI-MS separation
of Asn83 glycoforms (R53–K97).
TABLE 2. Peptide quantification of major rhEPO
glycoforms for Asn 23/38 sites. Each glycoform
was calculated as a sum of all detected peptides,
including acetylated and sodiated species.
A
B
C
Glycoform
Relative
Abundance (%)
HexNAc12Hex14dHex2NeuAc8 35
HexNAc13Hex15dHex2NeuAc8 18
HexNAc14Hex16dHex2NeuAc8 17
HexNAc12Hex14dHex2NeuAc7 17
HexNAc6Hex7dHex1NeuAc4 12
Glycoform
Relative
Abundance (%)
42.5
37
6.5
4
— 9