Nanofiber fabrication in a temperature and humidity controlled
14
Nanofiber fabrication in a temperature and humidity controlled environment for improved fibre consistency Oliver Hardick a,b , Bob Stevens a , Daniel G. Bracewell b a Micro and Nanotechnology Centre, Science and Technology Facilities Council, Rutherford Appleton Laboratory, Didcot, OX11 0QX, United Kingdom b The Advanced Centre for Biochemical Engineering, Department of Biochemical Engineering, University College London, Torrington Place, London, WC1E 7JE, United Kingdom Corresponding author at: Micro and Nanotechnology Centre, Science and Technology Facilities Council, Rutherford Appleton Laboratory, Didcot, OX11 0QX, United Kingdom Tel.: +44 1235 445446 E-mail address: [email protected] (O. Hardick). ABSTRACT To fabricate nanofibers with reproducible characteristics, an important demand for many applications, the effect of controlled atmospheric conditions on resulting electrospun cellulose acetate (CA) nanofibers was evaluated for temperature ranging 17.5 - 35°C and relative humidity ranging 20% - 70%. With the potential application of nanofibers in many industries, especially membrane and filter fabrication, their reproducible production must be established to ensure commercially viability. Cellulose acetate (CA) solution (0.2 g/ml) in a solvent mixture of acetone/DMF/ethanol (2:2:1) was electrospun into nonwoven fibre mesh with the fibre diameter ranging from 150nm to 1μm. The resulting nanofibers were observed and analyzed by scanning electron microscopy (SEM), showing a correlation of reducing average fibre diameter with increasing atmospheric temperature. A less pronounced correlation was seen with changes in relative humidity regarding fibre diameter, though it was shown that increased humidity reduced the effect of fibre beading yielding a more consistent, and therefore better quality of fibre fabrication. Differential scanning calorimetry (DSC) studies observed lower melt enthalpies for finer CA nanofibers in the first heating cycle confirming the results gained from SEM analysis. From the conditions that were explored in this study the temperature and humidity that gave the most suitable fibre mats for a membrane purpose were 25.0°C and 50%RH due to the highest level of fibre diameter uniformity, the lowest level of beading while maintaining a low fibre diameter for increased surface area and increased pore size homogeneity. This study has highlighted the requirement to control the atmospheric conditions during the electrospinning process in order to fabricate reproducible fibre mats. Keywords Electrospinning, Cellulose Acetate, Humidity, Controlled Environment, Consistency Abbreviations DMF - Dimethylformamide CA - Cellulose Acetate SEM - Scanning electron microscopy DSC - Differential scanning calorimetry RH - Relative Humidity Nature Precedings : hdl:10101/npre.2010.4524.1 : Posted 9 Jun 2010
Transcript of Nanofiber fabrication in a temperature and humidity controlled

Nanofiber fabrication in a temperature and humidity controlled environment for improved fibre consistency Oliver Hardicka,b, Bob Stevensa, Daniel G. Bracewellb a Micro and Nanotechnology Centre, Science and Technology Facilities Council, Rutherford Appleton Laboratory, Didcot, OX11 0QX, United Kingdom b The Advanced Centre for Biochemical Engineering, Department of Biochemical Engineering, University College London, Torrington Place, London, WC1E 7JE, United Kingdom Corresponding author at: Micro and Nanotechnology Centre, Science and Technology Facilities Council, Rutherford Appleton Laboratory, Didcot, OX11 0QX, United Kingdom Tel.: +44 1235 445446 E-mail address: [email protected] (O. Hardick). ABSTRACT To fabricate nanofibers with reproducible characteristics, an important demand for many applications, the effect of controlled atmospheric conditions on resulting electrospun cellulose acetate (CA) nanofibers was evaluated for temperature ranging 17.5 - 35°C and relative humidity ranging 20% - 70%. With the potential application of nanofibers in many industries, especially membrane and filter fabrication, their reproducible production must be established to ensure commercially viability. Cellulose acetate (CA) solution (0.2 g/ml) in a solvent mixture of acetone/DMF/ethanol (2:2:1) was electrospun into nonwoven fibre mesh with the fibre diameter ranging from 150nm to 1µm. The resulting nanofibers were observed and analyzed by scanning electron microscopy (SEM), showing a correlation of reducing average fibre diameter with increasing atmospheric temperature. A less pronounced correlation was seen with changes in relative humidity regarding fibre diameter, though it was shown that increased humidity reduced the effect of fibre beading yielding a more consistent, and therefore better quality of fibre fabrication. Differential scanning calorimetry (DSC) studies observed lower melt enthalpies for finer CA nanofibers in the first heating cycle confirming the results gained from SEM analysis. From the conditions that were explored in this study the temperature and humidity that gave the most suitable fibre mats for a membrane purpose were 25.0°C and 50%RH due to the highest level of fibre diameter uniformity, the lowest level of beading while maintaining a low fibre diameter for increased surface area and increased pore size homogeneity. This study has highlighted the requirement to control the atmospheric conditions during the electrospinning process in order to fabricate reproducible fibre mats. Keywords Electrospinning, Cellulose Acetate, Humidity, Controlled Environment, Consistency Abbreviations DMF - Dimethylformamide CA - Cellulose Acetate SEM - Scanning electron microscopy DSC - Differential scanning calorimetry RH - Relative Humidity
Nat
ure
Pre
cedi
ngs
: hdl
:101
01/n
pre.
2010
.452
4.1
: Pos
ted
9 Ju
n 20
10

1. INTRODUCTION The first significant report of electrospinning to produce polymer fibres came in 1934 when a patent by A. Formhals was issued which described electrospinning as a process for forming textile fibres [1]. To date applications of nanofibers have included textiles, medical materials, filtration devices, bioengineering materials, and even energy cells [2-5]. In the medical sector nanofibers have been used to produce artificial organ components, implant material, tissue replacement and wound dressing [6-8]. The electrospinning process is a technique based on the use of an electrical charge to draw fibres from a polymer-solvent solution. The basic laboratory setup consists of a spinneret (micro needle) connected to a high-voltage (5-30Kv) power supply, a syringe pump, and a grounded collector plate. The polymer solution is extruded from the needle tip at a constant rate by the syringe pump, forming a droplet. The voltage applied causes the droplet to stretch into a Taylor cone. If the molecular cohesion of the material is sufficiently high, stream breakup does not occur (if it does, droplets are electrosprayed) and a charged liquid jet is formed. The jet is then elongated by a whipping process caused by electrostatic repulsion initiated at small bends in the fibre stretching it to nanometer-scale before being deposited on the grounded collector. The solvent must evaporate for the polymer to solidify forming a fibre [9-11].
Fig 1. Illustration of nanofiber formation by electrospinning. When a sufficient electrical charge is applied the body of the polymer-solvent solution becomes charged. As the electrostatic forces overcome the surface tension a Taylor cone is formed. A thin cylindrical jet emanates from the droplet surface extending towards the direction of the electric field. Elongation along this axis continues until electrical bending instability occurs. Here the mode of current flow changes from ohmic to convective as the charge migrates to the surface of the fibre. This causes the jet to quickly bend through 90° leading into a series of loops under rapid acceleration. This ‘whipping’ process is responsible for nanometer scale reduction in fibre diameter.
As the application of nanofibers grows through a multitude of industries where reproducibility of product is either expected or required by validation (the exercise of proving with documented evidence any claims regarding the performance of a device, unit operation or product) and regulation [12-16]. Indeed all products should be sold with relevant documentation stating the product specification. This requires rigorous quality assurance testing of which reproducibility will be a key part. Therefore in order to assure nanofiber use is accessible and applicable for many markets the ability to control the production must be established. This work is particularly relevant to membrane operations which are
Nat
ure
Pre
cedi
ngs
: hdl
:101
01/n
pre.
2010
.452
4.1
: Pos
ted
9 Ju
n 20
10

commonly limited by poor membrane pore size uniformity and axial & radial diffusion which results in poor system dispersion yielding low utilisation of membrane capacity [17,18]. Previous studies have highlight the importance of designing a membrane with regards to the proposed system and operating conditions, optimizing the membrane pore size by balancing mass transfer against and fouling issues [19-21]. Numerous parameters act on the electrospinning process which affects the resulting nanofiber characteristics. Due to the difficulty of precisely controlling the large number parameters the reproducible production of nanofibers becomes problematical which is an issue for the use and development of nanofibers in industries such as biotechnology & health care. These parameters can be split up into three subcategories: Polymer solution parameters involving rheological and chemical properties of solutions. Processing conditions which include applied voltage, flowrate, spinneret & collector properties. Ambient parameters where atmospheric conditions interact with the system to affect fibre morphology. Varying any of these parameters even by small amounts can have a large effect on the structure of fibres produced; this enables the formation of fibres with defined features such as fibre diameter, flat ribbon or cylindrical fibres, level of fibre surface porosity and bead formation. Depending on the intended application these properties have the potential to be selected and specifically expressed. For example thinner fibres may be preferred due to the larger surface area that they convey but with small diameter comes an inherent reduction in fibre strength. Aligned and random fibre mats can be formed by changing the collector plate and by manipulating the external electric field. Collecting on a non flat or porous surface can be beneficial as it allows for faster drying of the deposited fibres reducing the moulding together effect which can deteriorate fibre properties. This is particularly applicable for aqueous polymer solutions due to the lower volatility in comparison to other solvents commonly associated with electrospinning. However it was noted that collection on a smooth surface may result in a more densely packed fibre structure due to the wicking and diffusion of the residual solvent molecules allowing the fibres to be pulled together while conducting away residual charges [22]. Moving collectors are often used for the fabrication of aligned fibres but can also be useful for use with a system where the solvent has a high boiling point as this increases the rate of evaporation [23]. Ribbon or flattened fibres can be formed by a mechanism relating to the solvent evaporation rate during the electrospinning. Should the polymer-solvent system be at such a state where a thin polymer skin forms on the liquid jet surface as a result of hyper solvent volatility the liquid core can succumb to the atmospheric pressure allowing the fibres to collapse in on themselves at the same time as complete solvent evaporation resulting in flattened fibre formation [24]. Koski et al, (2004) observed that higher molecular weight polymer-solvent systems of poly(vinyl alcohol) in water produced ribbon like fibres [25]. In the current literature which covers nanofiber production it has typically been the polymer solution parameters and processing conditions which have been investigated. However in order to control the process further, thereby improving the reproducibility of the resulting fibre morphology, this report investigates the effect of the electrospinning environment by controlling air temperature and humidity. The system chosen here is the electrospinning of reproducible cellulose acetate nonwoven nanofiber mats using three different temperatures and relative humidities in a controlled environment cabinet to evaluate the effect on the resulting average nanofiber diameter by SEM and the corresponding thermal properties of the nanofibers by DSC. The polymer solution parameters and processing conditions remain fixed for the entire investigation.
Nat
ure
Pre
cedi
ngs
: hdl
:101
01/n
pre.
2010
.452
4.1
: Pos
ted
9 Ju
n 20
10

2. EXPERIMENTAL 2.1. Materials Cellulose acetate (CA, Mr = 29,000, 40% acetyl groups) solution (0.20 g/ml) in acetone/dimethylformamide/ethanol (2:2:1) was electrospun to obtain CA nanofiber nonwoven membranes. All materials were bought from Sigma-Aldrich (Sigma-Aldrich Company Ltd. Dorset, UK) and used without further purification. 2.2. Electrospinning process The process was carried out in a ClimateZone climate control cabinet (a1-safetech Luton, UK) which allows the process to be performed under controlled atmospheric conditions. The temperature and relative humidity (RH) were selected and kept constant throughout each electrospinning event from a temperature range: 17°C to 35°C (resolution of 0.1°C), and a humidity range: 20%RH to 80%RH (resolution of 1%RH). 5mL polymer solution loaded into a sterile syringe and attach to a Harvard PHD 4400 syringe pump (Harvard Apparatus Ltd. Kent, UK), with a programmable flow rate range from 0.0001 µL/h up to 13.25 L/h, to deliver the polymer solution to a 0.5mm ID stainless steel micro needle. The pump is set at a flowrate of 800µL/h. The tip of the needle was placed 30 cm above the grounded collector plate. The collector plate used was a rectangular (20 x 26 cm) aluminium foil covered earth steel plate. The process was run for 1 hour. These conditions were selected based on preliminary experiments and are known to yield solid dry nanofibers with diameters from 0.1µm - 1µm. Samples for the defined parameters were electrospun on 3 different days allowing for the comparison of fibre consistency. 2.3. Scanning electron microscopy (SEM) Complete drying of the fibres was allowed before characterising using scanning electron microscopy. Non-woven fibre mats were analyzed with 20 individual measurements of nanofiber diameters taken from 3 SEM images. This was repeated for 3 different cuttings from a single electrospun fibre mat fabricated under a single set of constant conditions to calculate the average nanofiber diameter and standard deviation. The total number of samples imaged by the SEM was 81 (27 samples with 3 cuttings each) which generated a data total of 1620 fibre diameter measurments. The SEM used was a Hitachi TM-1000 Tabletop microscope (Hitachi High-Technologies Europe Gmbh). 2.4. Differential scanning calorimetry (DSC) Thermal properties of the fibres were evaluated by a Netzsch DSC 200 F3 Maia (NETZSCH-Gerätebau GmbH, Selb, Germany) at a rate of 10°C/min heating 25°C to 260°C in a nitrogen atmosphere. 10 Samples of nanofibers were measured consisting of 1 sample from each of the 9 possible combinations of temperature and humidity conditions and one sample of cellulose acetate powder. The melt enthalpy values were calculated by taking the integral of the melt temperature curve using the DSC software.
Nat
ure
Pre
cedi
ngs
: hdl
:101
01/n
pre.
2010
.452
4.1
: Pos
ted
9 Ju
n 20
10
3. RESULTS AND DISCUSSION The results are taken from the electrospun nanofibers that were fabricated under the specified parameter conditions. As shown by the matrix below there was an array of 9 combinations of controlled parameters in total with the use of 3 controlled temperatures (17.5°C, 25.0°C, 32.5°C) and 3 controlled humidities (20%RH, 50%RH, 70%RH). This was chosen to provide data across the capabilities of the equipment allowing for the optimal analysis with the fewest number of experiments. 3.1. Fibre diameter and surface characteristics
Fig 2. SEM images for nanofiber produced under different controlled environment conditions.
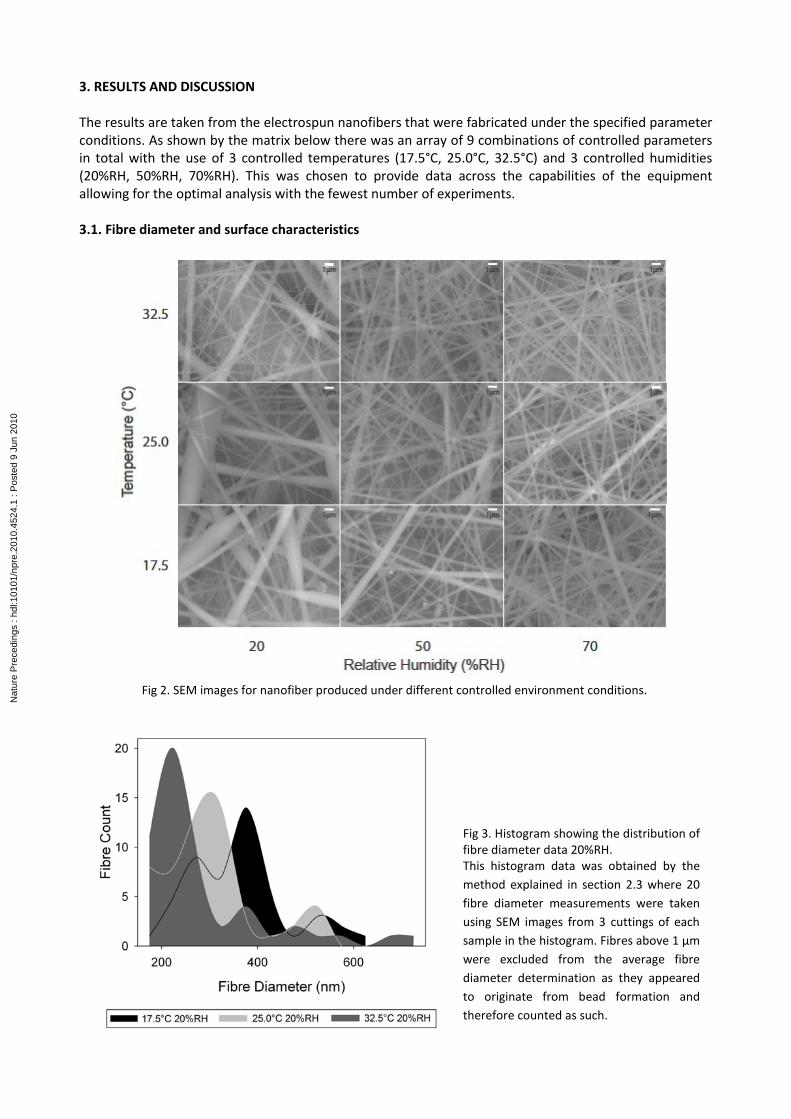
Fig 3. Histogram showing the distribution of fibre diameter data 20%RH. This histogram data was obtained by the
method explained in section 2.3 where 20
fibre diameter measurements were taken
using SEM images from 3 cuttings of each
sample in the histogram. Fibres above 1 µm
were excluded from the average fibre
diameter determination as they appeared
to originate from bead formation and
therefore counted as such.
Nat
ure
Pre
cedi
ngs
: hdl
:101
01/n
pre.
2010
.452
4.1
: Pos
ted
9 Ju
n 20
10

The distribution of the data is displayed in the histogram above and is typical throughout. The data does not fit a Gaussian function however normal means have been calculated to determine average fibre diameters which could then be plotted. It is also worth noting that the standard deviation error calculated is based on a normal distribution and is used is subsequent graph analyses. The change in average fibre diameter for the variable ranges was larger than the values reported by Mit-Uppatham et al, (2004) but this is unsurprising since a different polymer solvent system was employed here [26]. The results showed that the fibre diameter decreases with increasing temperature. Using the 20%RH as a constant variable the fibre diameter decreased from 360nm to 284nm for process temperatures 17.5°C and 32.5°C respectively. The rate of change in fibre diameter caused by temperature change was not independent of humidity as shown by the percentage increase in fibre diameter of 31.2% & 11.0% for humidity conditions 20%RH and 70%RH respectively. The average of the entire data showed an increase in fibre diameter of 1.29% per 1°C.
Fig 4. Graph showing average fibre diameter vs. process temperature for 20%RH, Δ 50%RH and 70%RH Error bars are +/- 1 standard deviation of the sample population. The average fibre diameter for each sample was determined by taking the average of 60 measurements from 9 SEM images for each of the 9 controlled conditions on 3 separate days.
This effect is due to the fact that at increased temperature the viscosity of the polymer-solvent solution is reduced. The lower viscosity allows the columbic forces to increase stretching giving finer fibres. Mit-Uppatham et al, (2004) demonstrated that an increase in temperature caused the decrease of solution viscosity, surface tension & conductivity, and resulting polyamide-6 fibre diameter [26]. Increasing temperature also increases evaporation rate, this in conjunction with greater solubility allows for more even stretching and the deposition of more uniform fibre. This was observed by Demir et al, (2002) in their study of parameters affecting the electrospinning of polyurethane fibres [27]. The results showed that the fibre diameter increases with increasing humidity. Using the 25°C samples as a constant variable the average fibre diameter increased from 300nm to 352nm for process humidity 20% RH and 70% RH respectively. Here the average change in fibre diameter was 0.30% per 1%RH.
Nat
ure
Pre
cedi
ngs
: hdl
:101
01/n
pre.
2010
.452
4.1
: Pos
ted
9 Ju
n 20
10

Fig 5. Graph showing average fibre diameter vs. process humidity for 17.5°C, 25.0°C and 32.5°C. Error bars are +/- 1 standard deviation of the sample population.
These observed effects are most likely due to the increased rate of evaporation at low humidity levels. This can lead to the formation of finer fibres but if this effect is too great then needle clogging can occur. Conversely if the relative humidity is too high the deposition of wet fibres can occur causing them to fuse together before drying. These occurrences explained by Baumgarten, (1971) affect the fibre diameter but perhaps the more interesting effect from the humidity is that to the fibre surface roughness or porosity [28]. The correlation observed could also be due to a less dense fibre being formed at a higher humidity. If the extent of charge repulsion during the whipping stage of electrospinning is constant for different humidities and fibre density varies, due to fibre surface porosity, then this would correspond to a change in fibre diameter. At sufficient atmospheric humidity water condenses on the surface of the fibre during electrospinning. If a volatile solvent is being used, pores form when both the water and solvent evaporate. With increasing humidity, pore size increases until they coalesce to form large non-uniform pores. Casper et al, (2004) showed that electrospinning polystyrene at a relative humidity of 31-38% was enough to see the formation of fibre surface pores. They also showed that surface pores of size increased with %RH, seeing an average pore size of 85nm at 31-38% and 135nm at 66-72%RH [29]. Bognitzki et al, (2001) reported that using a solvent with a lower vapour pressure reduced the formation of pores on PLLA porous nanofibers [30]. Megelski et al, (2002) observed the same effect of reduced pore formation with decreasing vapour pressure using the example of polystyrene and varying ratio THF/DMF solvent mixtures [31]. As the ratio of the less volatile DMF increases, therefore reducing the vapour pressure, surface roughness or microtexture decreased until 100% DMF where smooth fibres are formed. Many of the lower relative humidity samples contained a beaded fibre system which often meant having to exclude fibres measured over 1µm from the data represented. It also yielded a large error due to some partially formed beads represented as thicker sections of fibre.
Nat
ure
Pre
cedi
ngs
: hdl
:101
01/n
pre.
2010
.452
4.1
: Pos
ted
9 Ju
n 20
10

3.2. Consistency and reproducibility One of the main focus points of this work was to establish the reproducible fabrication of nanofibers using a controlled environment. Even taking into account the bead formation issues that occur with electrospinning cellulose acetate the consistency of average fibre diameter from samples electrospun on different days can be seen throughout the sample range.
The greatest difference in average fibre diameter between samples was 27.3nm which corresponded to 7.5% difference. The average difference however was 4.3% which is perfectly respectable considering the variety of fibre characteristics produced in this polymer-solvent system. The distribution of data over the three separate days was consistent and therefore this was deemed sufficient to prove the reproducibility within a margin of average difference in fibre diameter.
Fig 6. Graphs from 3 days showing average fibre diameter for particular controlled environment conditions. This data corresponds to the ranges set earlier: temperature 17.5, 25.0, 35°C & relative humidity 20%, 50%, 70%.
Nat
ure
Pre
cedi
ngs
: hdl
:101
01/n
pre.
2010
.452
4.1
: Pos
ted
9 Ju
n 20
10

3.3. Beading The extent of beading was determined by analysis of 27 SEM images from the 9 sample array of controlled conditions. The average amount of beading across the samples for the 3 different days was calculated and used. The SEM image matrix below shows that the polymer-solvent system in this case was in a state near to or actually producing a beaded fibre structure. The most uniform fibres, and the ones with the least amount of beading where those that were electrospun at high humidity and high temperature. High relative humidity appeared to be the dominant process variable in the goal for homogeneity as the images below suggest.
Fig 8. Graph observing the consistency in average amount of beading using a controlled environment. Fibre diameters above 1 µm were counted as a single bead. Bead counts were done using 2500x SEM images with the averages from each day plotted. Beading is expressed in percentage terms: number of beaded fibres vs. total number of fibres in the SEM image.
Nat
ure
Pre
cedi
ngs
: hdl
:101
01/n
pre.
2010
.452
4.1
: Pos
ted
9 Ju
n 20
10

It was interesting to note the effects of the increased humidity, and to a lesser extent temperature, with relation to the formation of beads. This could have been due to the reduced rate in evaporation caused by the more humid atmosphere which allows for greater stability of the chain entanglements due to increased flight time. The reduced beading effect allowed for an improvement in homogeneity of fibres produced which can be seen as an advantage in the effort of fabricating reproducible fibres. The reduced beading effect with increase in temperature was less pronounced but none-the-less was observed and could have been caused by the reduced viscosity of the polymer solution allowing for a more even stretching due to the more dominant effects of the columbic forces [32]. This effect is not as noticeable due to the converse effect of the increased surface tension at increased temperatures. Surface tension can be a common cause of bead formation in electrospinning. Where there is a high concentration of free solvent molecules there is a tendency for them to congregate adopting a spherical shape giving rise to the bead formation. The use of low surface tension solvents such as ethanol encourages smooth fibres formation as does adding surfactants to the solution to reduce surface tension [33]. The increased beading effect displayed with decreasing humidity could also be due to the polymer-solvent solution droplet drying at the tip of the micro-needle. With reduced humidity the evaporation of the volatile solvent mixture occurs at such a rate that the polymer begins to dry before it is broken up into fibre jets. This causes pulses of fibre jets leading to the formation of polymer beads along the fibres formed. Zong et al, (2002) noted a similar effect due to the use of a polymer solution too high in concentration [34]. 3.4. Thermal properties To confirm the findings from fibre diameter studies DSC was used to explore the thermal properties of nanofibers fabricated under different atmospheric conditions. DSC was used to measure the energy required (mW/mg) to heat each nanofiber sample over a temperature range from 25°C to 260°C for 9 samples corresponding to each of the controlled parameter conditions. Melt enthalpy values were determined by taking the integral of the melting temperature curve from the thermograms. As the fibre diameter decreased so did the melt enthalpy which was expressed by a broad low endothermic peak. The atmospheric conditions that yielded the largest fibres (17.5°C, 70%RH: 385nm) yielded the largest melt enthalpy of 12.07J/g, this is in comparison to the 4.47J/g yielded by the finest fibres (32.5°C, 20%RH: 276nm). These observations suggest decreased crystallinity and a less ordered molecular structure with decreasing fibre diameter. Lee et al, (2004) demonstrated a similar effect by using DSC to show higher molecular weight PVA shifted the Tm from 224.7°C to 232.7°C due to the effectively increased crystalline structure [35].
Fig 9. Graph comparing the average fibre diameter (filled symbols) and melt enthalpy (open symbols) vs. process temperature of fibres fabricated under different controlled conditions: 20%RH, Δ 50%RH and 70%RH.
Nat
ure
Pre
cedi
ngs
: hdl
:101
01/n
pre.
2010
.452
4.1
: Pos
ted
9 Ju
n 20
10

There was also some indication that finer fibres had a higher melting temperature (Tm) though this was not observed in every case. Tm ranged from 227.6°C to 229.4°C for fibres produced under atmospheric conditions (17.5°C, 50%RH) & (25.0°C, 20%RH) respectively. The glass transition temperature (Tg) was not obvious but the thermograms showed a small feature before the main melting peak at around 194°C which is likely to correspond to the bond breaking and irreversible plastic deformation occurrences at this point. The powder form of cellulose acetate was also investigated using DSC and yielded to smaller peaks at 230°C and 242°C. The melt enthalpy was not measurable here suggesting that the nanofiber structures confer a higher degree of order than the powder form. Zong et al, 2002 used DSC to show that PLLA polymer had a crystallinity degree of 36% where as PLLA nanofibers exhibited a much lower value. XRD results supported that although the polymer chains were non-crystalline in nanofiber form, they are highly orientated. This suggests that nanofibers do confer a high degree of order of polymer chains though their crystallinity is not high [36]. 4. CONCLUSIONS Cellulose acetate nanofibers were electrospun under a controlled atmospheric environment to establish the impact upon the reproducibility of fabrication. The effects of process temperature and process humidity on the resulting fibre morphology were investigated. The results obtained from SEM indicated the expected correlation of decreasing average fibre diameter with increasing process temperature. For this polymer-solvent system the average fibre diameter decreased from 360nm to 284nm for process temperatures 17.5°C and 32.5°C respectively. A correlation was also observed whereby the fibre diameter increased with increasing humidity. The fibre diameter increased from 300nm to 352nm for process humidity 20% RH and 70% RH respectively. In addition, the relative humidity levels during the electrospinning process appeared to be the dominant factor in determining the level of bead formation. This is most likely due to the effective rate of evaporation which determines the stability of the chain entanglements due to flight time. This unexpected but notable observation has given new possibility for the controlling of beading nanofiber systems and has highlighted the importance of controlling atmospheric conditions during the electrospinning process. This is particularly relevant to the membrane industry where beading would result in a poor quality of membrane structure. The atmospheric conditions for nanofiber production in this study which yield the most suitable fibre mats for a membrane purpose are 25.0°C and 50%RH due to the highest level of fibre diameter uniformity, the lowest level of beading while maintaining a low fibre diameter for increased surface area and increased pore size homogeneity. The DSC results support the fibre diameter studies done here and in conjunction provide strong evidence to the claims made in this study, most important of which is the need to control all parameters involved in the electrospinning process. Acknowledgements Support for O.H. as part of the IMRC for Bioprocessing in The Advanced Centre for Biochemical Engineering by the Engineering and Physical Sciences Research Council (EPSRC) under the Innovative Manufacturing Research initiative is gratefully acknowledged. Support from Rob McKean at the Micro and Nanotechnology Centre, Science and Technology Facilities Council was greatly appreciated.
Nat
ure
Pre
cedi
ngs
: hdl
:101
01/n
pre.
2010
.452
4.1
: Pos
ted
9 Ju
n 20
10

REFERENCES [1] A. Formhals, US Patent No. 1 975 504, 1934. [2] C.P. Barnes, S.A. Sell, E.D. Boland, D.G. Simpson, G.L. Bowlin, Nanofiber technology: Designing the next generation of tissue engineering scaffolds. Adv. Drug Delivery Reviews 59 (2007) 1413-1433. [3] S.G. Kumbar, S.P. Nukavarapu, R. James, L.S. Nair, C.T. Laurencin, Electrospun poly(lactic acid-co-glycolic acid) scaffolds for skin tissue engineering Biomaterials, 29 (2008) 4100-4107. [4] T.H. Grafe, K.M. Graham, K. M. Nanofiber Webs from Electrospinning (2003), Donaldson Company Inc. Minneapolis, MN, USA. Available at: http://www.donaldson.com/en/filtermedia/support/datalibrary/003321.pdf [Accessed 01 December 2009] [5] J.R. Kim, S.W. Choi, S.M. Jo, W.S. Lee, B.C. Kim, Electrospun PVdF-based fibrous polymer electrolytes for lithium ion polymer batteries, Electrochimica Acta, 50 (2004) 69-75. [6] J. Zeng, X. Xu, X. Chen, Q. Liang, X. Bian, L. Yang, X. Jing, Biodegradable electrospun fibers for drug delivery, Journal of Controlled Release, 92 (2003) 227-231. [7] G. Verreck, I. Chun, J. Rosenblatt, J. Peeters, A. Van Dijck, J. Mensch, M. Noppe, M.E. Brewster, Incorporation of drugs in an amorphous state into electrospun nanofibers composed of a water-insoluble, nonbiodegradable polymer, Journal of Controlled Release, 92 (2003) 349-360. [8] K. Kim, Y.K. Luu, C. Chang, D. Fang, B.S. Hsiao, B. Chu, M. Hadjiargyrou, Incorporation and controlled release of a hydrophilic antibiotic using poly(lactide-co-glycolide)-based electrospun nanofibrous scaffolds, Journal of Controlled Release, 98 (2004) 47-56. [9] D. Li, X. Xia, Electrospinning of Nanofibers: Reinventing the Wheel?. Advanced Materials. 16 (2004) 1151-1170. [10] D.H. Reneker, H. Fong, (Eds.), Polymeric Nanofibers, American Chemical Society, Washington, DC, 2006. [11] S. Ramakrishna, K. Fujihara, W-E. Teo, T-C. Lim, Z. Ma, An Introduction to Electrospinning and Nanofibers, World Scientific Publishing Co. Pte. Ltd., Singapore, 2005. [12] T.H. Grafe, K.M. Graham, K. M. Nanofiber Webs from Electrospinning (2003), Donaldson Company Inc. Minneapolis, MN, USA. Available at: http://www.donaldson.com/en/filtermedia/support/datalibrary/003321.pdf [Accessed 01 December 2009] [13] J.J. Garcia, R.E. Gresh, M.B. Gareis, R.A. Haney, Effectiveness of Cabs for Dust and Silica Control on Mobile Mining Equipment, Proceedings of the 8th US Mine Ventilation Symposium, University of Missouri at Rolla, June 1999. [14] S. Ramakrishna, K. Fujihara, W. Teo, T. Yong, Z. Ma, R. Ramaseshan, Electrospun nanofibers: solving global issues, materialstoday, March 2006, Volume 9, Number 3, Elsevier, Oxford. [15] T. Webster, M.C. Waid, J.L. McKenzie, R.L. Price, J.U. Ejiofor, Nano-biotechnology: carbon nanofibers as improved neural and orthopaedic implants, Nanotechnology, 15 (2004) 48-54.
Nat
ure
Pre
cedi
ngs
: hdl
:101
01/n
pre.
2010
.452
4.1
: Pos
ted
9 Ju
n 20
10

[16] A.S. Rathore, G. Sofer, “Process validation in Manufacturing of Biopharmaceuticals”, Taylor & Francis Group, 2005. [17] X. Zeng, E. Ruckestein, Ind. Eng. Chem. Res. 35 (1996) m 4169. [18] A. Tejeda, J. Ortega, I. Magana and R. Guzman, Optimal design of affinity membrane chromatographic columns, J. Chromatogr. A 830 (1999), p. 293. [19] M. Weissenborn, B. Hutter, M. Singh, T.C. Beeskow, F.B. Anspach, Biotechnol. Appl. Biochem. 25 (1997), 159. [20]M.B. Tennikov, N.V. Gazdina, T.B. Tennikova and F. Svec, Effect of porous structure of macroporous polymer supports on resolution in high-performance membrane chromatography of proteins, J. Chromatogr. A 798 (1998), p. 55. [21] F.T. Sarfert and M.R. Etzel, Mass transfer limitations in protein separations using ion-exchange membranes, J. Chromatogr. A 764 (1997), p. 3. [22] H. Liu & Y. Hsieh, Ultrafine Fibrous Cellulose Membranes from Electrospinning of Cellulose Acetate. Journal of Polymer Science Part B: Polymer Physics, 40 (2002) 2119-2129. [23] L. Wannatong, A. Sirivat, P. Supaphol, Effects of solvents on electrospun polymeric fibers: preliminary study on polystyrene, Polymer International, 53 (2004) 1851-1859. [24] S. Koombhongse, W. Liu, D.H. Reneker, Flat polymer ribbons and other shapes by electrospinning. Journal of Polymer Science Part B: Polymer Physics, 39 (2001) 2598-2606. [25] A. Koski, K. Yim, S. Shivkumar, Effect of molecular weight on fibrous PVA produced by electrospinning, Materials Letters, 58 (2004) 493-497. [26] C. Mit-Uppatham, M. Nithitanakul, P. Supaphol, Ultrafine electrospun polyamide-6 fibers: Effect of solution conditions on morphology and average fiber diameter, Macromolecular Chemistry and Physics, 205 (2004) 2327-2338. [27] M.M Demir, I. Yilgor, E. Yilgor, B. Erman, Electrospinning of polyurethane fibers, Polymer, 43 (2002) 3303-3309. [28] P. Baumgarten, Electrostatic spinning of acrylic microfibers, Journal of Colloid and Interface Science, 36 (1971) 71-79. [29] C.L. Casper, J.S. Stephens, N.G. Tassi, D.B. Chase, J.F. Rabolt, Controlling surface morphology of electrospun polystyrene fibers: Effect of humidity and molecular weight in the electrospinning process, Macromolecules, 37 (2004) 573-578. [30] M. Bognitzki, W. Czado, T. Frese, A. Schaper, M. Hellwig, M. Steinhart, A. Greiner, J.H. Wendorff, Nanostructured Fibers via Electrospinning, Advanced Materials, 13 (2001) 70-72. [31] S. Megelski, J.S. Stephens, D.B. Chase, F.J. Rabolt, Micro- and Nanostructured Surface Morphology on Electrospun Polymer Fibers, Macromolecules, 35 (2002) 8456-8466. [32] M.M Demir, I. Yilgor, E. Yilgor, B. Erman, Electrospinning of polyurethane fibers, Polymer, 43 (2002) 3303-3309.
Nat
ure
Pre
cedi
ngs
: hdl
:101
01/n
pre.
2010
.452
4.1
: Pos
ted
9 Ju
n 20
10

[33] H. Fong, I. Chun, D.H. Reneker, Beaded Nanofibers formed during electrospinning, Polymer, 40 (1999) 4585-4592. [34] X. Zong, K. Kim, D. Fang, S. Ran, B.S. Hsiao, B. Chu, Structure and process relationship of electrospun bioabsorbable nanofiber membranes, Polymer, 43 (2002) 4403-4412. [35] J.S. Lee, K.H. Choi, H.D. Ghim, S.S. Kim, D.H. Chun, H.Y. Kim, W.S. Lyoo, Role of molecular weight of atactic poly(vinyl alcohol) (PVA) in the structure and properties of PVA nanofabric prepared by electrospinning, Journal of Applied Polymer Science, 93 (2004) 1638-1646. [36] X. Zong, K. Kim, D. Fang, S. Ran, B.S. Hsiao, B. Chu, Structure and process relationship of electrospun bioabsorbable nanofiber membranes, Polymer, 43 (2002) 4403-4412.
Nat
ure
Pre
cedi
ngs
: hdl
:101
01/n
pre.
2010
.452
4.1
: Pos
ted
9 Ju
n 20
10