Nanodomain shock wave in near-field laser–material...
5
Physics Letters A 369 (2007) 323–327 www.elsevier.com/locate/pla Nanodomain shock wave in near-field laser–material interaction Xuhui Feng, Xinwei Wang ∗ Department of Mechanical Engineering, N104 Walter Scott Engineering Center, The University of Nebraska-Lincoln, Lincoln, NE 68588-0656, USA Received 8 March 2007; received in revised form 25 April 2007; accepted 30 April 2007 Available online 6 May 2007 Communicated by R. Wu Abstract In this work, molecular dynamics simulation is conducted to explore the shock wave phenomena in a nanodomain in near-field laser–material interaction. A large system consisting of over 800,000 atoms is studied. The work focuses on the kinetic and physical properties of the disturbed gas compression driven by the high speed movement of the molten particulates ejected from the solid target in a nanodomain. The quick interaction between solid and gas atoms compresses the gas and forms a steep shock wave front, which moves at a supersonic speed. The fast compression of gas also induces a steep interface of density, temperature and pressure distribution, which is viewed as typical characteristics of nanoscale shock waves. Evolutions of shock wave front position, velocity and Mach number are also explored and show quick decay during wave propagation. © 2007 Elsevier B.V. All rights reserved. PACS: 61.46.-w; 79.20.Ds; 52.65.Yy; 52.35.Tc Keywords: Shock wave; Nanodomain; Near-field laser–material interaction; Molecular dynamics 1. Introduction In the past decade, different near-field techniques, such as near-field scanning optical microscopy (NSOM) [1], superlens [2], nanoscale aperture [3,4], and scanning probe microscope (SPM) [5], have been developed to overcome the diffraction limit in laser-assisted manufacturing and material processing. In these near-field techniques, the laser beam can be focused to a small spot of tens of nanometers. Taking the laser-assisted STM as an example, the optical field can be enhanced by two orders of magnitude and focused to an extremely localized do- main [6]. This enhanced optical field reaches the surface of the sample and causes chemical and physical changes of the ma- terial [7–16]. In laser-assisted nanomanufacturing, as a direct consequence of heating, the nanodomain of the sample under manufacturing experiences intense phase change, stress devel- opment and propagation. Because of the strong laser heating, the atoms right in the irradiated region will gain extraordinarily * Corresponding author. Tel.: +1 (402) 472 3089; fax: +1 (402) 472 1465. E-mail address: [email protected] (X. Wang). high kinetic energy and move out of the surface. This high- speed movement could compress ambient gas atoms in quite a short time, leading to a strong shock wave. The formation of the shock wave in the nanoscale domain could significantly affect the laser–material interacting zone and the nanostruc- turing process. In the past, very little research has been done to study laser-induced shock waves in nanoscale gas domains during near-field nanostructuring. According to work by Luo et al. [17], the interaction of laser irradiation with matter can induce inertially confined high-pressure plasma and vapor. In work by Kohen and Martens [18], a pump laser pulse excites impurity molecules embedded in a solid host to a repulsive elec- tronic state, and then the resulting photofragments collide with neighboring host atoms and create a localized nanoscale shock wave through the lattice. Villagrán-Muniz et al. [19] have mon- itored the evolution of shock wave and thermal expansion of the hot air in the core of decaying plasma by using the probe beam deflection method. Jeong et al. [20] also used the probe beam deflection technique to measure the propagation of a shock wave and material vapor plume generated during excimer laser ablation of aluminum. Most of these works focused on the shock wave that happened in systems of one single medium, or 0375-9601/$ – see front matter © 2007 Elsevier B.V. All rights reserved. doi:10.1016/j.physleta.2007.04.106
Transcript of Nanodomain shock wave in near-field laser–material...

Physics Letters A 369 (2007) 323–327
www.elsevier.com/locate/pla
Nanodomain shock wave in near-field laser–material interaction
Xuhui Feng, Xinwei Wang ∗
Department of Mechanical Engineering, N104 Walter Scott Engineering Center, The University of Nebraska-Lincoln, Lincoln, NE 68588-0656, USA
Received 8 March 2007; received in revised form 25 April 2007; accepted 30 April 2007
Available online 6 May 2007
Communicated by R. Wu
Abstract
In this work, molecular dynamics simulation is conducted to explore the shock wave phenomena in a nanodomain in near-field laser–materialinteraction. A large system consisting of over 800,000 atoms is studied. The work focuses on the kinetic and physical properties of the disturbedgas compression driven by the high speed movement of the molten particulates ejected from the solid target in a nanodomain. The quick interactionbetween solid and gas atoms compresses the gas and forms a steep shock wave front, which moves at a supersonic speed. The fast compression ofgas also induces a steep interface of density, temperature and pressure distribution, which is viewed as typical characteristics of nanoscale shockwaves. Evolutions of shock wave front position, velocity and Mach number are also explored and show quick decay during wave propagation.© 2007 Elsevier B.V. All rights reserved.
PACS: 61.46.-w; 79.20.Ds; 52.65.Yy; 52.35.Tc
Keywords: Shock wave; Nanodomain; Near-field laser–material interaction; Molecular dynamics
1. Introduction
In the past decade, different near-field techniques, such asnear-field scanning optical microscopy (NSOM) [1], superlens[2], nanoscale aperture [3,4], and scanning probe microscope(SPM) [5], have been developed to overcome the diffractionlimit in laser-assisted manufacturing and material processing.In these near-field techniques, the laser beam can be focusedto a small spot of tens of nanometers. Taking the laser-assistedSTM as an example, the optical field can be enhanced by twoorders of magnitude and focused to an extremely localized do-main [6]. This enhanced optical field reaches the surface of thesample and causes chemical and physical changes of the ma-terial [7–16]. In laser-assisted nanomanufacturing, as a directconsequence of heating, the nanodomain of the sample undermanufacturing experiences intense phase change, stress devel-opment and propagation. Because of the strong laser heating,the atoms right in the irradiated region will gain extraordinarily
* Corresponding author. Tel.: +1 (402) 472 3089; fax: +1 (402) 472 1465.E-mail address: [email protected] (X. Wang).
0375-9601/$ – see front matter © 2007 Elsevier B.V. All rights reserved.doi:10.1016/j.physleta.2007.04.106
high kinetic energy and move out of the surface. This high-speed movement could compress ambient gas atoms in quitea short time, leading to a strong shock wave. The formationof the shock wave in the nanoscale domain could significantlyaffect the laser–material interacting zone and the nanostruc-turing process. In the past, very little research has been doneto study laser-induced shock waves in nanoscale gas domainsduring near-field nanostructuring. According to work by Luoet al. [17], the interaction of laser irradiation with matter caninduce inertially confined high-pressure plasma and vapor. Inwork by Kohen and Martens [18], a pump laser pulse excitesimpurity molecules embedded in a solid host to a repulsive elec-tronic state, and then the resulting photofragments collide withneighboring host atoms and create a localized nanoscale shockwave through the lattice. Villagrán-Muniz et al. [19] have mon-itored the evolution of shock wave and thermal expansion ofthe hot air in the core of decaying plasma by using the probebeam deflection method. Jeong et al. [20] also used the probebeam deflection technique to measure the propagation of ashock wave and material vapor plume generated during excimerlaser ablation of aluminum. Most of these works focused on theshock wave that happened in systems of one single medium, or

324 X. Feng, X. Wang / Physics Letters A 369 (2007) 323–327
of large scale. Wang’s previous work [21] has simulated laser-assisted nanomanufacturing, but no concern has been given tothe environment in the event that it is not a vacuum. If the sur-rounding is filled with a gas, the nanoscale laser heating wouldproduce a very high pressure, which then consequently inducesa nanoscale shock wave in the ambient gas.
2. Methodologies for domain design and simulation
In order to fill the above knowledge gap, a modified systemdifferent from the models in our previous work is established tostudy nanoscale shock waves in near-field laser-assisted inter-action. In this work, the simulated system includes two sub-domains. The first sub-domain is an argon thin film (target)positioned in the gas environment, and the lattice constant a foreach face-centered-cubic (fcc) cell is 5.414 Å. This part is com-prised of 5 fcc units (2.707 nm) in the x direction, 648 fcc units(350.83 nm) in the y direction and 60 fcc units (32.48 nm) inthe z direction. For the gas domain, when referring to one gasunit for initial construction, the lattice constant is enlarged to4 times argon lattice constant. In the z direction, the gas do-main has 20 fcc units (43.31 nm) below the film and 100 fccunits (216.6 nm) above the film. Periodical boundary conditionsare applied along the x, y, and z directions. A total of 855,360atoms are simulated in this case.
The film material takes argon since its physical and chemi-cal properties have been thoroughly studied. The gas materialtakes the same molecular mass as argon, but with a modifiedinteratomic potential for the convenience of computation. Forthe model gas, only the repulsive force is considered betweenatoms. Except this, the model gas shares same parameters asthe argon for MD simulation. In MD simulation for argon, theLJ well depth parameter ε and equilibrium separation σ take1.653 × 10−21 J and 3.406 Å, respectively. The half-step leap-frog scheme is used [22] in this work with a time step of 25 fs.The interaction between atoms is neglected at a cutoff distanceof 2.5σ . The enhanced near-field laser beam comes from the−z direction and is assumed to have a distribution of
(1)I = I0 · exp(−(�r − �r0)
2/r2g
) · exp(−(t − t0)
2/t2g
),
where I0 is a laser beam intensity constant, �r0 is the center ofthe sample surface, rg = 5 nm, t0 = 10 ps, and tg = 3 ps. Anartificial absorption depth (τ ) of 10 nm is employed in the sim-ulation. When the laser beam goes through every cell along thez direction, the atoms in each cell absorb part of the energywith considering the exponential absorption of the laser beamin the incident direction. The absorption of laser in the sampleis achieved by exciting the kinetic energy of atoms while keep-ing their momentum conserved. Details of the computationalprinciples and laser energy absorption are described in our pre-vious work [21,23]. The laser pulse has an energy of 0.75 fJ(1 fJ = 1 × 10⁻¹⁵ J), which is corresponding to a maximal en-ergy density level of 180 MW/cm2.
Before applying laser heating, an equilibrium simulation isperformed for 4000 steps (100 ps) to make the system achievean expected temperature of 50 K. The equilibrium simulationis performed for the gas and solid (target) separately and si-
multaneously. After the equilibrium process, another 4000 stepssimulation is performed to eliminate the disturbance introducedby the equilibrium procedure and to keep the system in minimalenergy state. After these processes, the initial temperature of thewhole region maintains at 50 K. In our simulation, because thedistance between gas atoms is far beyond the interaction range(cutoff distance), this gas can be treated as ideal gas. Accord-ing to the ideal gas law, the initial gas pressure is estimated tobe 0.27 MPa. Our MD result shows that the initial gas pressureis 0.23 MPa, very close to this ideal gas estimation, confirmingthe ideal gas assumption. Under this condition, the sound speedis calculated to be 132 m/s.
3. Results and discussion
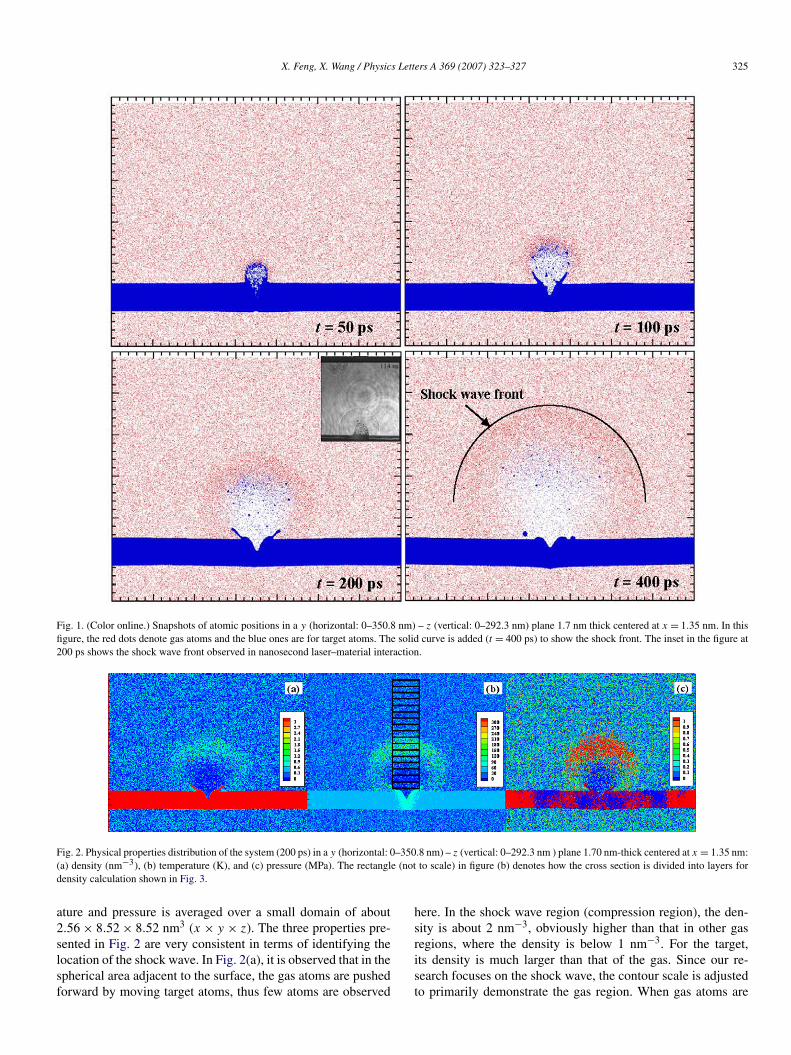
Fig. 1 presents the snapshots of atomic positions in the simu-lated domain at different times. In work by Porneala and Willis[24] for nanosecond laser ablation of aluminum, phase explo-sion and shock wave generation and propagation were observeddirectly. Although the simulation in this work differs from theirsin time and scales, we find that the shock wave generation andpropagation shares the similar trend. The inset in Fig. 1 (200 ps)is from the work by Porneala and Willis [24] for comparisonpurpose. It can be clearly observed that at 50 ps, the explosionof the sample is very intense, and the solid atoms are movingout with a high speed. This sudden change rapidly compressesthe adjacent gas region, causing a spherical interface made ofcompressed gas atoms. This means at the moment of 50 ps, ashock wave already forms. At 100 ps, the explosion has fin-ished for a while, and the fast moving target atoms still keeppropagating and compressing the ambient gas region. There-fore the spherical interface becomes much more evident. Thisshock wave moves very fast. In a period of 50 picoseconds, itmoves about 25 nm, corresponding to an average velocity ofabout 500 m/s, much higher than the sound speed (132 m/s)in the ambient gas. In addition, according to the different col-ors shown in Fig. 1, the target atoms mix very little with thegas. When time reaches 200 ps, the thickness of the gas in theshock wave becomes larger. Due to the increase of the shockwave thickness and the slowdown of target atoms, the mixingof the two kinds of atoms is still weak. From the density dis-tribution of the interface and mixed region, it can be concludedthat the movements of target and gas atoms are primarily in thedirection perpendicular to the sample surface. At 400 ps, thepropagation of the shock wave still goes on, and its thicknessgets even larger. Because of the decrease of shock wave veloc-ity and temperature during propagation, the shock wave front isnot so distinct as before. Appreciable mixing of gas and targetatoms is observed. The speed of the shock wave front is still ashigh as 300 m/s.
For the shock wave, the physical properties (density, temper-ature, pressure, velocity) of the medium in it generally changesharply and significantly from the compressed region to the nor-mal ambient gas. To confirm this feature of the shock wave ina nanodomain, Fig. 2 shows the distribution of density, temper-ature and pressure of the system in a y–z plane at 200 ps. Inorder to eliminate the statistical uncertainty, the local temper-
X. Feng, X. Wang / Physics Letters A 369 (2007) 323–327 325
Fig. 1. (Color online.) Snapshots of atomic positions in a y (horizontal: 0–350.8 nm) – z (vertical: 0–292.3 nm) plane 1.7 nm thick centered at x = 1.35 nm. In thisfigure, the red dots denote gas atoms and the blue ones are for target atoms. The solid curve is added (t = 400 ps) to show the shock front. The inset in the figure at200 ps shows the shock wave front observed in nanosecond laser–material interaction.
Fig. 2. Physical properties distribution of the system (200 ps) in a y (horizontal: 0–350.8 nm) – z (vertical: 0–292.3 nm ) plane 1.70 nm-thick centered at x = 1.35 nm:(a) density (nm−3), (b) temperature (K), and (c) pressure (MPa). The rectangle (not to scale) in figure (b) denotes how the cross section is divided into layers fordensity calculation shown in Fig. 3.
ature and pressure is averaged over a small domain of about2.56 × 8.52 × 8.52 nm3 (x × y × z). The three properties pre-sented in Fig. 2 are very consistent in terms of identifying thelocation of the shock wave. In Fig. 2(a), it is observed that in thespherical area adjacent to the surface, the gas atoms are pushedforward by moving target atoms, thus few atoms are observed
here. In the shock wave region (compression region), the den-sity is about 2 nm−3, obviously higher than that in other gasregions, where the density is below 1 nm−3. For the target,its density is much larger than that of the gas. Since our re-search focuses on the shock wave, the contour scale is adjustedto primarily demonstrate the gas region. When gas atoms are

326 X. Feng, X. Wang / Physics Letters A 369 (2007) 323–327
Fig. 3. Evolution of target and gas density distribution along the z direction.
driven by the increasing repulsive force from the exploded tar-get atoms, they derive high velocities that consequently lead tohigher local temperatures. This is clearly observed in Fig. 2(b).In the shock wave region, the temperature of the gas is muchhigher due to fast compression, which is about 120 K, while theambient temperature is only 50 K. In addition, the temperatureof the top shock wave front is evidently higher than that at bothsides, indicating that the shock wave is much stronger in the re-gion directly above the laser–material interacting zone. In thecompressed gas domain (shock wave) shown in Fig. 2(c), thepressure is in the order of 0.8 MPa. The highest pressure can bemore than 1 MPa. This value is much larger than the pressureof the ambient gas (0.23 MPa). This sharp pressure drop fromthe compressed region to the ambient gas clearly demonstratesthe existence of the shock wave.
In addition to the typical properties of shock waves dis-cussed above, the evolution of gas and target/plume densitiesin the shock wave is also studied. This information directlyreflects how the ablation plume and compressed gas pene-trates into each other inside the shock wave. As shown inFig. 2(b), a small section of several layers, the size of whichis 2.56 × 8.52 × 0.852 nm3 (x × y × z), is chosen to calculatethe average density for both the gas and target atoms. Fig. 3presents the evolution of this separate layer-by-layer speciesdensity distribution at different moments. At 50 ps, the gasdensity is very uniform except a small peak around 100 nm.For the target part, in the range from 50 to 100 nm, its den-sity decreases from a high level to around 0 without an evidentpeak in the ambient domain. At 100 ps, both the target and gas
Fig. 4. Evolution of the shock wave front temperature, position and Mach num-ber.
has formed an evident density peak at different locations. Forthe gas, the position of its peak density is about 130 nm, andstill keeps propagating forward. For the target material, a clearpeak forms at about 120 nm, a little behind the density peakof the background gas. Through the comparison of these twoplots, it is learned that the gas atoms are pushed forward by thefast-moving target atoms. At 200 ps, both peaks keep movingforward. Because of the energy dissipation, their values becomesmaller in comparison with previous peaks. In the plot at 400 ps,only one evident peak (for the gas) is observed. For the targetmaterial, when the velocities of atoms are dissipated by nearbygas atoms, their movements slow down and the density is muchsmaller. But for the gas, a density peak still exists and keepsmoving, which means the energy obtained from target atomsstill pushes the gas atoms to move. With analysis of these fourplots, it can be seen there is always an overlap between the twodensity distributions. This overlapping region is getting largerwith the propagation of the shock wave. Its thickness changesfrom around 10 nm (at 50 ps) to more than 50 nm (at 400 ps).The mass penetration speed is estimated to be about 100 m/s.
As observed in Fig. 1, along with its propagation, the shockwave experiences a fast decay in its temperature, pressure, andvelocity. This decay is calculated in great detail and shown inFig. 4. The decay shown in Fig. 4 is for the shock wave prop-agating in the direction normal to the target surface. It is seenthat at the beginning, the surface is under a continuous heat-ing process, and the neighboring gas temperature is as high as230 K. Then the shock wave propagates in the gas domain,the movement of atoms transfers energy to atoms adjacent tothe shock wave. This procedure makes the shock wave tem-perature decrease rapidly. The more intense the movement is,the more energy is transferred. Therefore, at the beginning, theshock wave front experiences faster temperature decay thanthe later stage. With further propagation of the shock wave,its temperature decreases to close to 50 K, which is the ini-tial gas temperature. From the position of the shock wave front,information can be extracted about the velocity of the shockwave. The nonlinear feature of the z–t curve indicates that theshock wave velocity decreases along the propagation. When theshock wave is referred to, one important parameter deserving

X. Feng, X. Wang / Physics Letters A 369 (2007) 323–327 327
significant attention is the Mach number, which is the ratio ofpropagation speed to the local sound speed. During the simu-lation, the Mach number is always higher than 1, meaning thispropagation is indeed a real shock wave. Within the first 50picoseconds, the shock wave travels about 25 nm and its ve-locity is about 500 m/s. The corresponding Mach number isabout 3. During the second 50 picoseconds period, the propa-gating distance is around 20 nm and the velocity is calculated tobe 400 m/s, still making the Mach number 1.7. When the prop-agation continues to 500 ps, the velocity is evaluated to be about250 m/s, still higher than local sound speed at 70 K, which is160 m/s, and the Mach number is 1.6. From the curve, it isconclusive that the Mach number is higher than 1 all the time,meaning a nanoscale shock wave does form and propagate inlaser-assisted nanomanufacturing.
4. Conclusion
In summary, MD simulation was conducted to explore theshock wave phenomena in a nanodomain during near-fieldlaser–material interaction. The distinct generation and propa-gation of the shock wave was observed. During the collision oftarget atoms with the background gas, the strong repulsive forcefrom the ablation plume compressed the gas atoms and formedan obvious shock wave front. The physical properties, such asdensity, temperature, and pressure had a very sharp change atthe shock wave front. Because of energy dissipation, the tem-perature, pressure, and speed of the shock wave experienced afast decay, but the Mach number always remained higher than 1,meaning the shock wave always persisted in our simulation.
Acknowledgements
Support for this work from NSF (CMS: 0457471), NebraskaResearch Initiative, Air Force Office for Scientific Research andMURI from ONR is gratefully acknowledged. X. Wang also
thanks the very helpful discussion with Dr. Zhaoyan Zhang atUNL.
References
[1] S. Toshiharu, N. Yoshihito, JSAP Int. 5 (2002) 22.[2] N. Fang, H. Lee, C. Sun, X. Zhang, Science 308 (2005) 534.[3] E.X. Jin, X.F. Xu, J. Quant. Spectrosc. Radiat. Transfer 93 (2005) 163.[4] L. Wang, E.X. Jin, S.M. Uppuluri, X.F. Xu, Opt. Express 14 (2006) 9902.[5] Y.F. Lu, B. Hu, Z.H. Mai, W.J. Wang, W.K. Chim, T.C. Chong, Jpn. J.
Appl. Phys. 40 (2001) 4395.[6] Y.F. Lu, Z.H. Mai, W.K. Chim, Jpn. J. Appl. Phys. 38 (1999) 5910.[7] J. Jersch, F. Demming, K. Dickmann, Appl. Phys. A 64 (1997) 29.[8] Y.F. Lu, Z.H. Mai, Y.W. Zheng, W.D. Song, Appl. Phys. Lett. 76 (2000)
1200.[9] J. Jersch, K. Dickmann, Appl. Phys. Lett. 68 (1996) 868.
[10] J. Jersch, F. Demming, L.J. Hildenhagen, K. Dickmann, Appl. Phys. A 66(1998) 29.
[11] Y.F. Lu, Z.H. Mai, G. Qiu, W.K. Chim, Appl. Phys. Lett. 75 (1999) 2359.[12] B. Hu, Y.F. Lu, Z.H. Mai, W.D. Song, W.K. Chim, in: First International
Symposium on Laser Precision Microfabrication, Omiya, Saitama, Japan,2000, pp. 232.
[13] Z.H. Mai, Y.F. Lu, S.M. Huang, W.K. Chim, J.S. Pan, J. Vac. Sci. Tech-nol. B 18 (2000) 1853.
[14] Z.H. Mai, Y.F. Lu, W.D. Song, W.K. Chim, Appl. Surface Sci. 154–155(2000) 360.
[15] A. Chimmalgi, T. Choi, C.P. Grigoropoulos, in: ASME International Me-chanical Engineering Congress and Exposition, New Orleans, LA, 2002,pp. 291–295.
[16] S.M. Huang, M.H. Hong, Y.F. Lu, B.S. Lukyanchuk, W.D. Song, T.C.Chong, J. Appl. Phys. 91 (2002) 3268.
[17] S.N. Luo, D.C. Swift, T.E. Tierney IV, D.L. Paisley, G.A. Kyrala, R.P.Johnson, A.A. Hauer, O. Tschauner, P.D. Asimow, High Pressure Res. 24(2004) 409.
[18] D. Kohen, C.C. Martens, J. Chem. Phys. 111 (1999) 4343.[19] M. Villagrán-Muniz, H. Sobral, R. Navarro-González, Meas. Sci. Tech-
nol. 14 (2003) 614.[20] S.H. Jeong, R. Greif, R.E. Russo, J. Phys. D: Appl. Phys. 32 (1999) 2578.[21] X. Wang, J. Phys. D: Appl. Phys. 38 (2005) 1805.[22] M.P. Allen, D.J. Tildesley, Computer Simulation of Liquids, Clarendon
Press, Oxford, 1987.[23] X. Wang, Y. Lu, J. Appl. Phys. 98 (2005) 114304.[24] C. Porneala, D.A. Willis, Appl. Phys. Lett. 89 (2006) 211121.