NANOCOMPOSITES BASED ON BLENDS OF POLYETHYLENEetd.lib.metu.edu.tr/upload/3/12606338/index.pdf ·...
194
NANOCOMPOSITES BASED ON BLENDS OF POLYETHYLENE A THESIS SUBMITTED TO THE GRADUATE SCHOOL OF NATURAL AND APPLIED SCIENCES OF MIDDLE EAST TECHNICAL UNIVERSITY BY FATMA IŞIK IN PARTIAL FULFILLMENT OF THE REQUIREMENTS FOR THE DEGREE OF MASTER OF SCIENCE IN CHEMICAL ENGINEERING JULY 2005
Transcript of NANOCOMPOSITES BASED ON BLENDS OF POLYETHYLENEetd.lib.metu.edu.tr/upload/3/12606338/index.pdf ·...

NANOCOMPOSITES BASED ON BLENDS OF POLYETHYLENE
A THESIS SUBMITTED TO THE GRADUATE SCHOOL OF NATURAL AND APPLIED SCIENCES
OF MIDDLE EAST TECHNICAL UNIVERSITY
BY
FATMA IŞIK
IN PARTIAL FULFILLMENT OF THE REQUIREMENTS FOR
THE DEGREE OF MASTER OF SCIENCE IN
CHEMICAL ENGINEERING
JULY 2005

ii
Approval of Graduate School of Natural and Applied Sciences
Prof. Dr. Canan Özgen Director I certify that this thesis satisfies all the requirements as a thesis for degree of Master of Science.
Prof. Dr. Nurcan Baç Head of the Department This is to certify that we have read this thesis and that in our opinion it is fully adequate, in scope and quality, as a thesis for the degree of Master of Science.
Prof. Dr. Ülkü Yılmazer
Supervisor Examining Committee Members
Prof. Dr. Nurcan Baç (CHE)
Prof. Dr. Ülkü Yılmazer (CHE)
Prof. Dr. Leyla Aras (CHEM)
Assoc. Prof. Dr. Göknur Bayram (CHE)
Assoc. Prof. Dr. Cevdet Kaynak (METE)

iii
I hereby declare that all information in this document has been obtained and presented in accordance with academic rules and ethical conduct. I also declare that, as required by these rules and conduct, I have fully cited and referenced all material and results that are not original to this work. Name, Last name : Fatma Işık
Signature

iv
ABSTRACT
NANOCOMPOSITES BASED ON BLENDS OF POLYETHYLENE
Işık, Fatma
M.S., Department of Chemical Engineering
Supervisor: Prof. Dr. Ülkü YILMAZER
July 2005, 164 pages
In this study the effects of compatibilizer type, organoclay type, and the addition order
of components on the morphological, thermal, mechanical and flow properties of
ternary nanocomposites based on low density polyethylene, LDPE were investigated.
As compatibilizer, ethylene/methyl acrylate/glycidyl methacrylate, ethylene/glycidyl
methacrylate, and ethylene/butyl acrylate/maleic anhydride; as organoclay Cloisite®
15A, Cloisite® 25A and Cloisite® 30B were used. All samples were prepared by a co-
rotating twin screw extruder, followed by injection molding.
Before producing the ternary nanocomposites, in order to determine the optimum
amount of the organoclay and compatibilizer, binary mixtures of LDPE/organoclay and
LDPE/compatibilizer blends with different compositions were prepared. Based on the
results of the mechanical tests, compatibilizer and organoclay contents were
determined as 5 wt. % and 2 wt % respectively. After that, ternary nanocomposites
were prepared with each compatibilizer/organoclay system and characterization of
these nanocomposites was performed.

v
Among the investigated addition orders, mechanical test results showed that the best
sequence of component addition was (PCoC), in which LDPE, compatibilizer and
organoclay were simultaneously compounded in the first run of the extrusion.
Considering the ternary nanocomposites, compositions of LDPE/E-MA-GMA/15A,
LDPE/E-GMA/15A and LDPE/E-nBA-MAH/30B showed the highest improvement in
mechanical properties.
According to the DSC analysis, addition of organoclay and compatibilizer does not
influence the melting behavior of the compositions and both compatibilizers and
organoclay types have no nucleation activity in LDPE.
In the X-Ray analysis, the highest increase of the basal spacing for ternary
nanocomposites obtained for LDPE/E-nBA-MAH/organoclay nanocomposites. This
increase was 83 %, 198 %, and 206 % for samples containing 15A, 25A and 30B
respectively.
Keywords: low density polyethylene, compatibilizer, organoclay, nanocomposites,
extrusion

vi
ÖZ
POLİETİLEN ALAŞIMLARI BAZLI NANOKOMPOZİTLER
Işık, Fatma
Yüksek Lisans, Kimya Mühendisliği
Tez Yöneticisi: Prof. Dr. Ülkü Yılmazer
Temmuz 2005, 164 sayfa
Bu çalışmada, uyum sağlayıcı çeşidi, organik kil çeşidi ve bileşenlerin ekleme sırasının
alçak yoğunluklu polietilen bazlı nanokompozit sistemlerinin morfolojik, ısıl, mekanik ve
akış özellikleri üzerindeki etkileri incelenmiştir. Uyum sağlayıcı olarak, etilen/metil
akrilat/glisidil metakrilat (E-MA-GMA), etilen/glisidil metakrilat (E-GMA), ve etilen/bütil
akrilat/maleik anhidrit (E-nBA-MAH) terpolimerleri; organik kil olarak Cloisite® 15A,
Cloisite® 25A ve Cloisite® 30B kullanılmıştır. Tüm numuneler aynı yönde dönen çift
vidalı ekstrüder ve bunu takiben enjeksiyonlu kalıplama yöntemi kullanılarak
hazırlanmıştır.
Üçlü nanokompozit sistemleri hazırlanmadan önce, en uygun uyum sağlayıcı ve
organik kil miktarını belirlemek için, değişik kompozisyonlarda ikili AYPE/organik kil
nanokompozitleri ve AYPE/uyum sağlayıcı alaşımları hazırlanmıştır. Mekanik test
sonuçlarına göre uyum sağlayıcı ve organik kil konsantrasyonları sırası ile ağırlıkça %
5 ve % 2 olarak belirlenmiştir. Bundan sonra, herbir uyum sağlayıcı/organik kil sistemi

vii
ile üçlü nanokompozitler hazırlanmış ve bunu takiben bu nanokompozitlerin
karakterizasyonu yapılmıştır.
Mekanik test sonuçları incelenen bileşen ekleme sıraları arasında AYPE, uyum
sağlayıcı ve organik kilin ilk ekstrüzyon sırasında hep beraber karıştırıldığı (PCoC)
yönteminin, en iyi ekleme sırası olduğunu göstermiştir. Üçlü nanokompozit sistemleri
dikkate alındığında, AYPE/E-MA-GMA/15A, AYPE/E-GMA/15A ve AYPE/E-nBA-
MAH/30B sistemleri mekanik özelliklerde en yüksek gelişmeyi göstermiştir.
DSC analizine göre, alçak yoğunluklu polietilene organik kil ve uyum sağlayıcı
eklenmesi, bileşiklerin erime özelliklerini etkilememiştir ve uyum sağlayıcı ve organik
kil çeşitleri, AYPE içinde kristallenmeyi başlatıcı özelliğe sahip değildirler.
X-ışını kırınımı analizinde, üçlü nanokompozit sistemleri arasında tabaka aralığındaki
en fazla artış, AYPE/E-nBA-MAH/organik kil nanokompozitlerinde elde edilmiştir. Bu
artış 15A, 25A ve 30B içeren numunelerde sırasıyla % 83, % 198, ve % 206‘ dır.
Anahtar Kelimeler: Alçak yoğunluklu polietilen, uyum sağlayıcı, organik kil,
nanokompozitler, ekstrüzyon

viii
To my family & My little nephew, M.Efe Işık
ix
ACKNOWLEDGEMENTS
I would like to express my deepest gratitude to my thesis supervisor Prof. Dr. Ülkü
Yılmazer for his guidance, understanding, kind support, encouraging advices, criticism,
and valuable discussions throughout my thesis.
I am greatly indebted to Assoc. Prof. Dr. Göknur Bayram from Department of Chemical
Engineering for providing me every opportunity to use the instruments in her
laboratory, Prof. Dr. Erdal Bayramlı from Department of Chemistry for his permission
to use the injection molding machine in his laboratory, and Prof. Dr. Teoman Tinçer
from Department of Chemistry for letting me use the mechanical testing instrument in
his laboratory.
Special thanks go to Mihrican Açıkgöz from Chemical Engineering Department for
DSC analysis, Cengiz Tan from Metallurgical and Materials Engineering Department
for SEM analysis, İnciser Girgin and Bilgin Çiftçi from General Directorate of Mineral
Research and Exploration for X-ray diffraction analysis.
I would sincerely thank to İlknur Çakar and Sertan Yeşil for their endless friendship,
support, help in all parts of my life, making my stay in METU happy and memorable
and being always right beside me. My deepest gratitude also goes to F. Nihan Çayan
and her family who was a second family to me in Ankara.
I express my special thanks to Güralp Özkoç for sparing his time and his all help
during my experiments. I would also like to thank to my friends Işıl Işık, Aslı Tolga,
Benek Abat, Mert Kılınç, Elif Alyamaç, Özcan Köysüren, Pelin Toprak, and Gülsüm
Özden, for cooperation and friendship, and helping me in all the possible ways.

x
It is with immense pleasure that I dedicate this dissertation to each and every member
of my family who always offered their advice, love, care and support. My family’s
absolute unquestionable belief in me, have been a constant source of encouragement
and have helped me achieve my goals. I also express my sincerest love and thanks to
Fatih Coşkunses for his love, patience, support and understanding and
encouragement in every step of this study. It would not have been possible without
their love and support to complete this study.
This study was supported by BAP-2005-07-02-00-66.

xi
TABLE OF CONTENTS
PLAGIARISM ………………………. ...................................................................... iii
ABSTRACT………………………. .......................................................................... iv
ÖZ………………………………………………………………………………............. vi
DEDICATION ......................................................................................................... viii
ACKNOWLEDGEMENTS .................................................................................... ix
TABLE OF CONTENTS ....................................................................................... xi
LIST OF TABLES .................................................................................................. xv
LIST OF FIGURES ................................................................................................ xvii
NOMENCLATURE………………………………………………………………………………………………..xxix CHAPTER
1. INTRODUCTION ................................................................................... ........ 1
2. BACKGROUND.... .................................................................................. ........ 4
2.1 Composites ................................................................................... ........ 4
2.1.1 Matrix Phase ........................................................................... ........ 5
2.1.2 Reinforcement Phase .............................................................. ........ 5
2.1.3 Types of Composites ............................................................... ........ 6
2.2 Polymer-Matrix Composites ............................................................ ........ 6
2.3 Nanocomposites .............................................................................. ........ 7
2.3.1 Polymer-Layered Silicate Nanocomposites............................. ........ 8
2.3.2 Layered Silicates...................................................................... ........ 9
2.3.2.1 Montmorillonite (Smectite clay) ................................. ........ 10
2.3.3 Organically Modified Layered Silicates.................................... ........ 11
xii
2.3.4 Types of Polymer Layered Silicate Nanocomposite Structures........ 12
2.3.5 Synthesis of Polymer Layered Silicate Nanocomposites........ ........ 14
2.3.5.1 In-Situ Intercalative Polymerization Method ............. ........ 14
2.3.5.2 Solution Intercalation Method ................................... ........ 15
2.3.5.3 Melt Intercalation Method.......................................... ........ 15
2.4 Polyethylene ................................................................................... ........ 18
2.4.1 Low Density Polyethylene........................................................ ........ 19
2.4.2 Polymerization of LDPE........................................................... ........ 20
2.4.3 Properties of LDPE .................................................................. ........ 21
2.4.4 Polyethylene – Organoclay Interaction.................................... ........ 22
2.4.4.1 Glycidyl Methacrylate (GMA) Functionality............... ........ 24
2.4.4.2 Maleic Anhydride (MAH) Functionality...................... ........ 25
2.5 Polymer Processing......................................................................... ........ 26
2.5.1 Extrusion .................................................................................. ........ 26
2.5.2 Twin Screw Extrusion .............................................................. ........ 28
2.5.3 Injection Molding ...................................................................... ........ 30
2.6 Characterization of Nanocomposites .............................................. ........ 31
2.6.1 Morphological Analysis ............................................................ ........ 31
2.6.1.1 X-Ray Diffraction (XRD ............................................. ........ 32
2.6.1.2 Scanning Electron Microscopy (SEM) ...................... ........ 33
2.6.2 Mechanical Tests ..................................................................... ........ 33
2.6.2.1 Tensile Test............................................................... ........ 34
2.6.2.2 Flexural Test.............................................................. ........ 37
2.6.3 Thermal Analysis...................................................................... ........ 38
2.6.3.1 Differential Scanning Calorimetry Analysis (DSC..... ........ 39
2.6.4 Flow Characteristics................................................................. ........ 41
2.6.4.1 Melt Flow Index (MFI) Test ....................................... ........ 41
2.7 Previous Studies .............................................................................. ........ 41

xiii
3. EXPERIMENTAL ........................................................................................... 45
3.1 Materials………………………………………………………………………. 45
3.1.1 Polymer Matrix………………………………………………………….. 45
3.1.2 Organoclays……………………………………………………………...45
3.1.2.1 Cloisite® 15A……………………………………………….... 46
3.1.2.2 Cloisite® 25A………………………………………………… 47
3.1.2.3 Cloisite® 30B………………………………………………… 48
3.1.3 Compatibilizers…………………………………………………………. 49
3.2 Experimental Set-Up and Procedure…………………………………………… 53
3.2.1 Melt Blending…………………………………………………………… 53
3.2.2 Injection Molding………………………………………………………. 54
3.2.3 Experimental Procedure………………………………………………. 55
3.2.4 Extrusion Process……………………………………………………… 58
3.2.4.1 Addition Order of Raw Materials…………………………... 58
3.2.5 Specimen Preparation…………………………………………………. 62
3.3 Characterization of Specimens………………………………………………….. 63
3.3.1 Morphological Analysis………………………………………………… 63
3.3.1.1 X-Ray Diffraction (XRD) Analysis………………………….. 63
3.3.1.2 Scanning Electron Microscopy (SEM) Analysis………….. 64
3.3.2 Thermal Analysis……………………………………………………….. 64
3.3.2.1 Differential Scanning Calorimetry (DSC) Analysis……….. 64
3.3.3 Mechanical Tests……………………………………………………….. 64
3.3.3.1 Tensile Tests…………………………………………………. 65
3.3.3.2 Flexural Tests………………………………………………… 66
3.3.4 Flow Characteristics……………………………………………………. 66
3.3.4.1 Melt Flow Index (MFI) Test…………………………………. 66
4. RESULTS AND DISCUSSION………………………………………………….. 67

xiv
4.1 Morphological Analysis……………………………………………………… 67
4.1.1 X-Ray Diffraction (XRD)………………………………………………. 67
4.1.1.1 Effect of Compatibilizer..................................................... 70
4.1.1.2 Effect of Addition Order…………………………………….. 72
4.1.2 Scanning Electron Microscopy (SEM) Analysis…………………….. 73
4.2 Thermal Characterization……………………………………………………. 91
4.2.1 Differential Scanning Calorimetry (DSC) Analysis………………….. 91
4.3 Mechanical Analysis…………………………………………………………. 92
4.3.1 Tensile Properties……………………………………………………… 92
4.3.2 Flexural Properties……………………………………………………... 115
4.4 Flow Characteristics ………………………………………………………….124
5. CONCLUSIONS………………………………………………………………..…. 128
REFERENCES..................................................................................................... 131
APPENDICES............................................................................................... ........ 138
A. X-Ray Analysis.................................................................................................138
B. DSC Analysis............................................................................................ ......... 149
C. Mechanical Test Results.................................................................................. 155

xv
LIST OF TABLES
TABLE
2.1 Commercial classification of Polyethylenes ..........................................…….18
2.2 Properties of LDPE .................................................................................…….21
3.1 Properties of polymer matrix, LDPE…….……. ......................................…….45
3.2 Physical properties of Cloisite® 15A…...................................................…….46
3.3 Physical properties of Cloisite® 25A…...................................................…….48
3.4 Physical properties of Cloisite® 30B…...................................................…….49
3.5 Specifications of Lotader® AX8900 and Lotader® AX8840 ..................…….51
3.6 Specifications of Lotader® 2210.............................................................…….52
3.7 Drying conditions ....................................................................................…….56
3.8 Addition order procedures ......................................................................…….60
3.9 Compositions of all samples ...................................................................…….61
3.10 Compositions of all samples (Cont’d)...................................................…….62
3.11 Molding parameters for injection molding.............................................…….63
3.12 Dimensions of tensile test specimen ....................................................…….65
4.1 X-ray diffraction results of samples ........................................................…….68
4.2 X-ray diffraction results of nanocomposites produced with different
addition order sequences .....................................................................…….72
4.3 DSC analysis results of samples ...........................................................…….92
4.4 MFI values of pure materials ..................................................................…….124
4.5 MFI values of LDPE/organoclay nanocomposites .................................…….125
xvi
4.6 MFI values of LDPE/compatibilizer blends............................................. ........125
4.7 MFI values of ternary LDPE/compatibilizer/organoclay nanocomposites
produced with AO4 sequence ...............................................................…….126
4.8 MFI values of ternary LDPE/compatibilizer/organoclay nanocomposites
produced with different addition order .................................................. ........127
C.1 Tensile strength data for all samples .....................................................…….155
C.2 Tensile strength data for all samples (Cont’d) .......................................…….156
C.3 Tensile modulus data for all samples ....................................................…….157
C.4 Tensile modulus data for all samples (Cont’d) ......................................…….168
C.5 Tensile strain at break data for all samples ...........................................…….159
C.6 Tensile strain at break data for all samples (Cont’d) .............................…….160
C.7 Flexural strength data for all samples …………….................................…….161
C.8 Flexural strength data for all samples (Cont’d)......................................…….162
C.9 Flexural modulus data for all samples ……………................................…….163
C.10 Flexural modulus data for all samples (Cont’d) ...................................…….164

xvii
LIST OF FIGURES
FIGURE
2.1 Structure of 2:1 layered phyllosilicates...................................................…….10
2.2 The cation-exchange process between alkylammonium ions and cations
initially intercalated between the clay layers .....................................…….12
2.3 Scheme of different types of composites arising from the interaction of
Layered silicates and polymers … ....................................................…….13
2.4 Melt Intercalation Method …...................................................................…….16
2.5 The stepwise mechanism of clay platelets dispersion during melt blending..17
2.6 Schematic of polymerization of ethylene................................................…….19
2.7 Schematic picture of the action of compatibilizer for an exfoliation of
clay layers within a polymer matrix ...................................................…….23
2.8 Chemical structure of GMA.....................................................................…….24
2.9 Reaction of Maleic Anhydride with Hydroxyl group of clay ....................…….25
2.10 The extruder, used to obtain nanocomposites, in this study................…….27
2.11 Types of twin screw extruders according to screw design...................…….29
2.12 Co-rotating twin screw extruder and its zones .....................................…….30
2.13 Principal of X-ray diffraction..................................................................…….32
2.14 Tensile specimen and tensile test procedure.......................................…….35
2.15 Stress –strain curves of several polymeric materials...........................…….36
2.16 Flexural test procedure .........................................................................…….37

xviii
2.17 A representative drawing of a) DSC, b) output of analysis ..................…….40
3.1 Chemical structure of organic modifier (2M2HT*) and anion (Cl-) of
Cloisite® 15A ...................................................................................…….46
3.2 Chemical structure of organic modifier (2MHTL8 *) and anion
(methyl sulfate) of Cloisite® 25A .....................................................…….47
3.3 Chemical structure of organic modifier (MT2EtOH*) and anion
(Cl-) of Cloisite® 30B .......................................................................…….48
3.4 Chemical structure of Lotader® AX8900 (E-MA-GMA)……….. ............…….50
3.5 Chemical structure of Lotader® AX8840 (E-GMA)……….. ...................…….50
3.6 Chemical structure of Lotader® 2210 (E-nBA-MAH)……….. ................…….52
3.7-a Thermo Prism TSE 16 TC twin screw extruder...................................…….53
3.7-b Screw Configuration of Thermo Prism TSE 16 TC twin screw extruder…..54
3.8 Injection Molding Machine ......................................................................…….55
3.9 Flowchart of experimental procedure and characterization ...................…….57
3.10 ASTM Tensile test specimen................................................................…….65
3.11 Omega Melt Flow Indexer.....................................................................…….66
4.1 SEM micrographs of pure Low Density Polyethylene (LDPE)
(a) x250 (b) x3000.............................................................................…….74
4.2 SEM micrographs of nanocomposites containing Cloisite® 15A (a) 2 wt. %
250 , (b) 2 wt. % x3000; (c) 4 wt. % x250, (d) 4 wt. % x3000; (e) 6 wt. %
x250, (f) 6 wt. % x3000 .....................................................................…….75
4.3 SEM micrographs of nanocomposites containing Cloisite® 25A,
(a) 2 wt. % x250, (b) 2 wt. % x3000.................................................…….76
4.4 SEM micrographs of nanocomposites containing Cloisite® 30B,

xix
(a) 2 wt. % x250, (b) 2 wt. % x3000..................................................…….76
4.5 SEM micrographs of LDPE/ compatibilizer blends containing Lotader® AX
8900 (E-MA-GMA) (a) 5 wt. % x250, (b) 5 wt. % x3000; (c) 10 wt. %
x250, (d) 10 wt. % x3000; (e) 15 wt. % x250, (f) 15 wt. % x3000 ....…….77
4.6 SEM micrographs of LDPE/compatibilizer blends containing Lotader® AX
8840 (E-GMA) (a) 5 wt. % x250, (b) 5 wt. % x3000; (c) 10 wt. %
x250, (d) 10 wt. % x3000; (e) 15 wt. % x250, (f) 15 wt. % x3000 ....…….78
4.7 SEM micrographs of LDPE/compatibilizer blends containing Lotader® 2210
(E-BA-MAH) (a) 5 wt. % x250, (b) 5 wt. % x3000; (c) 10 wt. %
x250, (d) 10 wt. % x3000; (e) 15 wt. % x250, (f) 15 wt. % x3000 ....…….79
4.8 SEM micrographs of nanocomposites produced with AO4 sequence,
containing 2 wt. % Cloisite® 15A and 5 wt. % compatibilizer,
(a) Lotader® AX 8900 x250,(b) Lotader® AX8900 x3500;
(c) Lotader® AX8840 x250, (d) Lotader® AX 8840 x3000;
(e) Lotader® 2210 x250, (f) Lotader®2210 x3000 ......................... .......81
4.9 SEM micrographs of nanocomposites produced with AO4 sequence,
containing 2 wt. % Cloisite� 25A and 5 wt. % compatibilizer,
(a) Lotader® AX 8900 x250, (b) Lotader® AX8900 x3000;
(c) Lotader® AX8840 x250, (d) Lotader® AX 8840 x3000;
(e) Lotader® 2210 x250, (f) Lotader® 2210 x3000 ...................... .......82
4.10 SEM micrographs of nanocomposites produced with AO4 sequence,
containing 2 wt. % Cloisite�30B and 5 wt. % compatibilizer,
(a) Lotader® AX 8900 x250, (b) Lotader® AX8900 x3000;

xx
(c) Lotader® AX8840 x250, (d) Lotader® AX 8840 x3000;
(e) Lotader® 2210 x250, (f) Lotader® 2210 x3000 ........................ .......83
4.11 SEM micrographs of nanocomposites produced with different addition
order sequences, containing 2 wt. % Cloisite® 15A and 5 wt. %
Lotader® AX8900; (a) AO1 x250, (b) AO1 x3000 ; (c) AO2 x250,
(d) AO2 x3000 ...................................................................................……85
4.12 SEM micrographs of nanocomposites produced with different addition
order sequences, containing 2 wt. % Cloisite® 15A and 5 wt. %
Lotader® AX8900; (a) AO3 x250, (b) AO3 x3000 ; (c) AO4 x250,
(d) AO4 x3500 ...................................................................................……86
4.13 SEM micrographs of nanocomposites produced with different addition
order sequences, containing 2 wt. % Cloisite® 15A and 10 wt. %
Lotader® AX8900; (a) AO1 x250, (b) AO1 x3000 ; (c) AO2 x250,
(d) AO2 x3000 ...................................................................................……87
4.14 SEM micrographs of nanocomposites produced with different addition
order sequences, containing 2 wt. % Cloisite® 15A and 10 wt. %
Lotader® AX8900; (a) AO3 x250, (b) AO3 x3000 ; (c) AO4 x250,
(d) AO4 x3000 ...................................................................................……88

xxi
4.15 SEM micrographs of nanocomposites produced with different addition
order sequences, containing 2 wt. % Cloisite® 30B and 5 wt. %
Lotader® 2210 ; (a) AO1 x250, (b) AO1 x3000 ; (c) AO2 x250,
(d) AO2 x3000 ...................................................................................……89
4.16 SEM micrographs of nanocomposites produced with different addition
order sequences, containing 2 wt. % Cloisite® 30B and 5 wt. %
Lotader® 2210 ; (a) AO3 x250, (b) AO3 x3000 ; (c) AO4 x250,
(d) AO4 x3000 ...................................................................................……90
4.17 The stress-strain curves of LDPE/organoclay nanocomposites with
different Cloisite® 15A content .........................................................……94
4.18 The stress-strain curves of LDPE/organoclay nanocomposites containing
2 wt % of different organoclay types.................................................……94
4.19 The stress-strain curves of LDPE/compatibilizer blends containing
different amounts of E-MA-GMA.......................................................……95
4.20 The stress-strain curves of LDPE/compatibilizer blends containing
different amounts of E-GMA .............................................................……95
4.21 The stress-strain curves of LDPE/compatibilizer blends containing ...
different amounts of E-nBA-MAH .....................................................……96
4.22 The stress-strain curves of LDPE/E-MA-GMA/organoclay nanocomposites
containing 5 wt % of E-MA-GMA and 2 wt % of organoclay ...........……96
4.23 The stress-strain curves of LDPE/E- GMA/organoclay nanocomposites
containing 5 wt % of E-GMA and 2 wt % of organoclay...................……97
4.24 The stress-strain curves of LDPE/E-nBA-MAH/organoclay nanocomposites
containing 5 wt % of E-nBA-MAH and 2 wt % of organoclay...........……97
xxii
4.25 The stress-strain curves of LDPE/E-MA-GMA/15A nanocomposites
produced with different addition order sequence, and containing
5 wt % E-MA-GMA, 2 wt % 15A ...................................................... .......98
4.26 Effect of organoclay content on tensile strength of LDPE/15A
nanocomposites ................................................................................……100
4.26 Effect of organoclay content on tensile modulus of LDPE/15A
nanocomposites ................................................................................……100
4.28 Effect of organoclay content on tensile strain at break values of LDPE/15A
nanocomposites ................................................................................……101
4.29 Tensile strength of LDPE/organoclay nanocomposites, containing 2 wt %
organoclay….. ...................................................................................……101
4.30 Tensile modulus of LDPE/organoclay nanocomposites, containing 2 wt %
organoclay….. ...................................................................................……102
4.31 Tensile strain at break values of LDPE/organoclay nanocomposites,
containing 2 wt % organoclay ...........................................................……102
4.32 Effect of compatibilizer content on tensile strength of LDPE/compatibilizer
blends ………. ...................................................................................……103
4.33 Effect of compatibilizer content on tensile modulus of LDPE/compatibilizer
blends ………. ...................................................................................……104
4.34 Effect of compatibilizer content on tensile strain at break values of
LDPE/compatibilizer blends ..............................................................……104
4.35 Tensile strength values of ternary LDPE/compatibilizer/organoclay
nanocomposites ................................................................................……107
xxiii
4.36 Tensile modulus values of ternary LDPE/compatibilizer/organoclay
nanocomposites ...............................................................................……108
4.37 Tensile strain at break values of ternary LDPE/compatibilizer/organoclay
nanocomposites ................................................................................……108
4.38 Effect of addition order on tensile strength of LDPE/ E-MA-GMA /15A
nanocomposites containing 5 wt % compatibilizer and 2 wt %
organoclay…. ...................................................................................……110
4.39 Effect of addition order on tensile modulus of LDPE/ E-MA-GMA /15A
nanocomposites containing 5 wt % compatibilizer and 2 wt %
organoclay….. ...................................................................................……110
4.40 Effect of addition order on tensile strain at break value of
LDPE/E-MA-GMA /15A nanocomposites containing 5 wt %
compatibilizer and 2 wt % organoclay ..............................................……111
4.41 Effect of addition order on tensile strength of LDPE/ E-MA-GMA /15A
nanocomposites containing 10 wt % compatibilizer and
2 wt % organoclay.............................................................................……111
4.42 Effect of addition order on tensile modulus of LDPE/ E-MA-GMA /15A
nanocomposites containing 10 wt % compatibilizer and
2 wt % organoclay.............................................................................……112
4.43 Effect of addition order on tensile strain at break value of
LDPE/E-MA-GMA /15A nanocomposites containing 10 wt %
compatibilizer and 2 wt % organoclay …..........................................……112
4.44 Effect of addition order on tensile strength of LDPE/ E-nBA-MAH/30B
nanocomposites containing 5 wt % compatibilizer and 2 wt %

xxiv
organoclay….. ...................................................................................……113
4.45 Effect of addition order on tensile modulus of LDPE/ E-nBA-MAH/30B
nanocomposites containing 5 wt % compatibilizer and 2 wt %
organoclay ...................................................................................……113
4.46 Effect of addition order on tensile strain at break value of
LDPE/ E-nBA-MAH/30B nanocomposites containing 5 wt %
compatibilizer and 2 wt % organoclay ..............................................……114
4.47 Effect of organoclay content on flexural strength of LDPE/15A
nanocomposites ................................................................................……117
4.48 Effect of organoclay content on flexural modulus of LDPE/15A
nanocomposites ................................................................................……117
4.49 Flexural strength of LDPE/organoclay nanocomposites containing
2 wt % organoclay.............................................................................……118
4.50 Flexural modulus of LDPE/organoclay nanocomposites containing
2 wt % organoclay.............................................................................……118
4.51 Effect of compatibilizer content on flexural strength of LDPE/compatibilizer
blends…………………………. ..........................................................……119
4.52 Effect of compatibilizer content on flexural modulus of LDPE/compatibilizer
blends…………………………. ..........................................................……119
4.53 Flexural strength values of ternary LDPE / compatibilizer / organoclay
nanocomposites …………………………. .........................................……120
4.54 Flexural modulus values of ternary LDPE / compatibilizer / organoclay
nanocomposites ................................................................................……120
xxv
4.55 Effect of addition order on flexural strength of LDPE/E-MA-GMA /15A
nanocomposites containing 5 wt % compatibilizer and
2 wt % organoclay.............................................................................……121
4.56 Effect of addition order on flexural modulus of LDPE/E-MA-GMA /15A
nanocomposites containing 5 wt % compatibilizer and
2 wt % organoclay.............................................................................……121
4.57 Effect of addition order on flexural strength of LDPE/ E-MA-GMA /15A
nanocomposites containing 10 wt % compatibilizer and
2 wt % organoclay.............................................................................……122
4.58 Effect of addition order on flexural modulus of LDPE/ E-MA-GMA /15A
nanocomposites containing 10 wt % compatibilizer and
2 wt % organoclay.............................................................................……122
4.59 Effect of addition order on flexural strength of LDPE/ E-nBA-MAH/30B
nanocomposites containing 5 wt % compatibilizer and
2 wt % organoclay.............................................................................……123
4.60 Effect of addition order on flexural modulus of LDPE/ E-nBA-MAH/30B
nanocomposites containing 5 wt % compatibilizer and
2 wt % organoclay.............................................................................……123
A.1 X-Ray diffraction pattern of pure low density polyethylene (LDPE) ...... ...... 138
A.2 X-Ray diffraction pattern of nanocomposite containing 2 wt. %
Cloisite® 15A ................................................................................... ......139
A.3 X-Ray diffraction pattern of nanocomposite containing 4 wt. %
Cloisite® 15A ................................................................................... ......139
xxvi
A.4 X-Ray diffraction pattern of nanocomposite containing 6 wt. %
Cloisite® 15A ................................................................................... ......140
A.5 X-Ray diffraction pattern of nanocomposite containing 2 wt. %
Cloisite® 25A ................................................................................... ......140
A.6 X-Ray diffraction pattern of nanocomposite containing 2 wt. %
Cloisite® 30B ................................................................................... ......141
A.7 X-Ray diffraction pattern of nanocomposites produced with AO4 sequence,
containing 2 wt. % Cloisite® 15A and 5 wt. % Lotader® AX 8900........141
A.8 X-Ray diffraction pattern of nanocomposites containing 2 wt. %
Cloisite® 15Aand 5 wt. % Lotader® AX 8840 .......................................142
A.9 X-Ray diffraction pattern of nanocomposites containing 2 wt. %
Cloisite® 15A and 5 wt. % Lotader® 2210............................................142
A.10 X-Ray diffraction pattern of nanocomposites containing 2 wt. %
Cloisite® 25A and 5 wt. % Lotader® AX 8900……………………………143
A.11 X-Ray diffraction pattern of nanocomposite produced with AO4 sequence,
containing 2 wt. % Cloisite® 25A and 5 wt. % Lotader® AX8840..........143
A.12 X-Ray diffraction pattern of nanocomposite produced with AO4 sequence,
containing 2 wt. % Cloisite® 25A and 5 wt. % Lotader® 2210 ..............144
A.13 X-Ray diffraction pattern of nanocomposite produced with AO4 sequence,
containing 2 wt. % Cloisite® 30B and 5 wt. % Lotader® AX 8900 ........144
A.14 X-Ray diffraction pattern of nanocomposite produced with AO4 sequence,
containing 2 wt. % Cloisite® 30B and 5 wt. % Lotader® AX 8840.........145

xxvii
A.15 X-Ray diffraction pattern of nanocomposite produced with AO4 sequence,
containing 2 wt. % Cloisite® 30B and 5 wt. % Lotader® 2210...............145
A.16 X-Ray diffraction pattern of nanocomposite produced with AO1 sequence,
containing 2 wt. % Cloisite® 15A and 5 wt. % Lotader® AX 8900.........146
A.17 X-Ray diffraction pattern of nanocomposite produced with AO2 sequence,
containing 2 wt. % Cloisite® 15A and 5 wt. % Lotader® AX 8900..........146
A.18 X-Ray diffraction pattern of nanocomposite produced with AO3 sequence,
containing 2 wt. % Cloisite® 15A and 5 wt. % Lotader® AX 8900..........147
A.19 X-Ray diffraction pattern of nanocomposite produced with AO1 sequence,
containing 2 wt. % Cloisite® 30B and 5 wt. % Lotader® AX 8900..........147
A.20 X-Ray diffraction pattern of nanocomposite produced with AO2 sequence,
containing 2 wt. % Cloisite® 30B and 5 wt. % Lotader® 2210................148
A.21 X-Ray diffraction pattern of nanocomposite produced with AO3 sequence,
containing 2 wt. % Cloisite® 30B and 5 wt. % Lotader® 2210.................148
B.1 DSC thermogram of pure low density polyethylene (LDPE)..........................149
B.2 DSC thermogram of nanocomposite containing 2 wt. % Cloisite® 15A...... 150
B.3 DSC thermogram of nanocomposite containing 2 wt. % Cloisite® 25A.......150
B.4 DSC thermogram of nanocomposite containing 2 wt. % Cloisite® 30B.......151
B.5 DSC thermogram of composite containing 5 wt. % Lotader® AX 8900........151
B.6 DSC thermogram of composite containing 5 wt. % Lotader® AX 8840........152
B.7 DSC thermogram of composite containing 5 wt. % Lotader® 2210..............152
B.8 DSC thermogram of nanocomposite produced with AO4 sequence,
containing 2 wt. % Cloisite® 15A, and 5 wt. % Lotader® AX 8900.........153

xxviii
B.9 DSC thermogram of nanocomposite produced with AO4 sequence,
containing 2 wt. % Cloisite® 15A, and 5 wt. % Lotader® AX 8840.........153
B.10 DSC thermogram of nanocomposite produced with AO4 sequence,
containing 2 wt. % Cloisite® 30B, and 5 wt. % Lotader® 2210...............154

xxix
NOMENCLATURE
A0 Original, undeformed cross-sectional area, mm2
b Width of beam tested, mm
d Depth of beam tested, mm
d Plane spacing, Å
E Modulus of Elasticity, MPa
F Tensile Load, N
L Support span, mm
L0 Initial gauge length, mm
∆L Change in sample length, mm
m Slope of the tangent to the initial straight-line portion of the load deflection
curve, N/mm
n Order of diffraction
P Load at a given point on the load-deflection curve, N
R Maximum strain in the outer fibers, mm/mm
S Stress in the outer fibers at midspan, MPa
T Thickness, mm
Tc Crystallization temperature, °C
Tg Glass transition temperature, °C
Tm Melting temperature, °C
Greek Letters
Є Tensile strain, mm/mm
λ Wavelength, nm
σ Tensile stress(nominal), MPa
σm Tensile strength, MPa
θ Scattering angle, °

xxx
Abbreviations
ASTM American Society for Testing and Materials
CEC Cation Exchange Capacity
DSC Differential Scanning Calorimetry
E-GMA Ethylene-Glycidyl Methacrylate
E-MA-GMA Ethylene-Methyl Acrylate-Glycidyl Methacrylate
E-nBA-MAH Ethylene-Butyl Acrylate-Maleic Anhydride
GMA Glycidyl Methacrylate
HDPE High Density Polyethylene
HT Hydrogenated Tallow
LDPE Low Density Polyethylene
MFI Melt Flow Index
MMT Montmorillonite
PE Polyethylene
PLS Polymer Layered Silicate
SEM Scanning Electron Microscopy
T Tallow
TEM Transmission Electron Microscopy
XRD X-Ray Diffraction
1
CHAPTER 1
INTRODUCTION
Composites usually consist of proper volume fractions of high strength, high stiffness
reinforcing materials embedded in a lower modulus matrix [1]. Properties of the
constituents, their relative amounts, and the geometry of the dispersed phase
determine the unique properties of the new materials. Composites are used in variety
of applications in industry due to the improved material properties such as strength,
stiffness or toughness, and low processing cost.
The most common matrix materials used for composites are polymers, which are
lightweight materials with high strength and modulus values. One reason for their
growing use is that their processing is relatively simple and does not require very high
temperatures and pressures. Moreover, problems associated with the degradation of
the reinforcement material during manufacture are less significant for polymer matrix
composites -PMC’s- than for composites with other matrices, such as ceramic and
metal. Design flexibility, variety of processing techniques for producing PMC parts, are
also advantages of these materials.
Nanocomposites are a special class of polymer matrix composites, containing fillers, at
least one dimension of which is in the nanometer (10-9) range [2]. Due to the structural
properties gained by well dispersion of the nanosized fillers, nanocomposites posses
highly improved mechanical, thermal, physical, and barrier properties when compared
to pristine polymer and conventional composites [3].
Among the inorganic fillers, layered silicates are widely used in nanocomposites owing
to the high aspect ratio. In the case of well dispersion of the silicate layers throughout

2
the polymer matrix, interaction of the filler and polymer increases significantly and
improves material properties.
Montmorillonite which belongs to the general family of 2:1 layered silicates is the most
commonly used smectite clay in nanocomposites. The structure of montmorillonite
consists of an octahedral alumina sheet between two tetrahedral silica sheets. The
layer thickness of the crystal structure is around 1 nm, and the lateral dimensions of
these layers may be in the range of 30 nm to several microns or larger [4]. Natural
montmorillonite is quite hydrophilic material, thus incompatible with many hydrophobic
engineering polymers. So the layered silicates are not easily dispersed in most
polymers. In order to overcome this problem, a simple cation exchange process is
applied to montmorillonite to make the clay organophilic.
LDPE is one of the major class of the polyethylenes. Its unique properties such as
toughness, high impact strength, low brittleness temperature, flexibility, processability,
chemical resistance to polar compounds, low permeability to water, and outstanding
electrical properties make it in request in industry [5].
Incompatibility of organoclay and polyethylene which is non-polar, brings out the
necessity of using a third material in nanocomposites, called compatibilizer. There are
several studies in the literature that emphasize the effect of the compatibilizer on
dispersion of organoclay in the matrix [6-16].
Mainly, there are three methods of synthesizing nanocomposites: In-situ intercalative
polymerization method, solution intercalation method and melt intercalation method.
Melt intercalation method is relatively easier than the other methods due to the
absence of organic solvents and compatible with various industrial processes such as
extrusion and injection. Thus it is the mostly used method for commercial applications
[17]. In this study nanocomposites were produced by means of a co-rotating twin
screw extruder with a two step mixing procedure.
The objective of this study is to investigate the effects of compatibilizer type,
organoclay type, addition order of the components on the final properties of ternary

3
nanocomposites containing low density polyethylene, compatibilizer, and organically
modified clay. Three types of compatibilizers, terpolymer of ethylene – methyl acrylate
– glycidyl methacrylate (E-MA-GMA), copolymer of ethylene – glycidyl methacrylate
(E-GMA), and terpolymer of ethylene – n-butyl acrylate – maleic anhydride (E- nBA-
MAH), and organoclays, Cloisite® 15A, Cloisite® 25A and Cloisite® 30B were used
during the experiments.
First, the concentrations of the compatibilizer and organoclay in nanocomposites were
determined by melt compounding of binary LDPE/compatibilizer blends and
LDPE/organoclay nanocomposites. After determining the optimal compatibilizer and
clay content, ternary nanocomposites were produced by means of a co-rotating twin
screw extruder with a two step mixing procedure. Finally, in order to characterize the
nanocomposites, all standard test specimens were prepared by injection molding.
X-Ray Diffraction (XRD) and Scanning Electron Microscopy (SEM) analyses were
performed in order to investigate the extent of dispersion of the organoclay in the
matrix. Thermal characterization of the nanocomposites was performed by Differential
Scanning Calorimetry (DSC), and flow properties were determined with Melt Flow
Index measurements. Mechanical characterization of the nanocomposites included the
investigation of tensile strength, tensile modulus, tensile strain at break, flexural
strength and flexural modulus of the all samples.
4
CHAPTER 2
BACKGROUND
2.1 Composites A composite is defined as a combination of two or more components differing in form
or composition on a macroscale, with two or more distinct phases having recognisable
interfaces between them [1]. The constituents of composites retain their identities
which mean that, they do not dissolve or merge completely into one another although
they act together and also the components can be physically identified [18].
The first composite materials may have been bricks fashioned by the ancient
Egyptians from mud and straw [19]. Reinforced concrete which was invented by
Romans and natural fiber reinforced clay used before the invention of iron are also the
essence of the composite materials [18]. In the early 1960’s, there has been an
increasing demand for materials that are stiffer and stronger, yet lighter, in aeronautic,
energy, civil engineering and various structural applications. Unfortunately, no
monolithic material is available to satify them. This need and demand certainly led to
the concept of combining different materials in an integral composite structure [1].
The new material obtained by mixing the proper combinations of the materials has
highly improved properties than the individual constituents of composites can attain
[1]. The concept of improved performance is broad and includes increased strength or
reinforcement of one material by the addition of another material [20]. The high
performance of the obtained composites results in the usage of these new materials

5
in a wide range of applications such as automotive, aerospace, chemical, marine,
sports, electrical and electronics, construction, etc. industries [21].
The composites are usually blends of two different phases, one of which is a resinous
binder or matrix, which surrounds and holds the reinforcing material, dispersed phase,
in place. The dispersed phase is strong and stiff relative to the continuous phase [22].
The final properties of the composites depend on not only the properties of each
phases but also the relative amounts of the constituents, the geometry of the
dispersed phase which includes the shape, particle size, orientation and dispersion of
reinforcing material as well as on the reinforcement-matrix interface [23]. Interface is
the region through which material properties such as concentration of an element,
crystal structure, elastic modulus, density, thermal expansion coefficient change from
one side to another [24]. The interface plays an important role in controlling the failure
mechanism, fracture toughness, and overall stress-strain behavior of material,
although it is small in size [25].
2.1.1 Matrix Phase
Matrix is the continuous phase of the composites and usually occupies 30% -40% of
composite structures. Some of the main functions of the matrix are that, it holds the
components together and determines the thermo-mechanical stability of the
composite, protects the reinforcements from environment, accepts the load over a
large surface area, and then transfers it to the reinforcement material, which can resist
a greater load [1].
2.1.2 Reinforcement Phase
The reinforcement material determines the strengthening mechanism of a composite.
It can be in the form of either continuous (long fibers, sheets) or discontinuous
(particles, short fibers, etc.). It is also possible to classify composites according to the
characteristics of the reinforcement. The following three categories are the commonly
used type of composites [1].

6
• Fiber Reinforced: The fiber is the primary load-bearing component.
• Dispersion Strengthened: The matrix is the major load-bearing component.
• Particle Reinforced: The load is shared by the matrix and the particles.
The choice of reinforcement for a particular engineering application depends on a
large number of parameters, including strength, stiffness, environmental stability, and
cost [20].
2.1.3 Types of Composites
Composites can be classified according to the material type of matrix phase. The
matrix can be metal, ceramic, wood, polymer, etc. The most common composites are
metal-matrix composites (MMC), ceramic-matrix composites (CMC), and polymer-
matrix composites (PMC).
2.2 Polymer Matrix Composites
Polymers are mostly organic compounds based on carbon, hydrogen, and other non
metallic elements. PMC are in general a synergistic combination of high performance
reinforcing material and matrix and moreover they are the most developed composite
materials group and they have found widespread applications [1]. The main reasons
for being most preferable composite type are the versatility of their properties, such as
light weight, easy processing, corrosion resistance and low processing cost [26].
There are two different alternatives in matrix selection, thermoplastic and thermoset,
and there are matrix choices available within the two main divisions. The basic
difference between the two is that thermoplastic materials (polyolefinics, polystyrene,
polyamides, etc.) can be repeatedly softened by heat, and thermosetting polymers
(epoxy resins, polyester, polyimides, phonolics, etc.) can not be changed after the
chemical reaction since their cure has been completed. Thermoplastics and
thermosets differ profoundly in terms of manufacturing, processing, physical and

7
mechanical properties of product, and the environmental resistance of the resultant
composite [22].
Thermoplastics polymers have linear or branched structures that soften upon heating.
The chains of the thermoplastics are tied together with secondary bonds such as Van
der Waals forces [20]. These bonds can be broken temporarily upon heating and the
polymer chains can slide past one another easily and can move to form a different
shape. When thermoplastics are cooled the weak bonds reform and the thermoplastic
material keeps its new shape.
The structure of thermoset materials similar to those of thermoplastic materials but
processing develops permanent cross-links between adjacent molecules, forming
complex networks that prevent relative movement between the chains of the
thermoset resins. This means that the thermosetting material always keeps its shape.
Heating a thermoset degrades the material so that it cannot be reprocessed
satisfactorily [27].
2.3 Nanocomposites
Nanocomposites are one of the most interesting and potentially important new areas
of polymer research. These are composites including less than 6 % inorganic
reinforcements with high aspect ratio with dimensions in the area of 1 to 100 nm [19].
Due to their nanometer size features, nanocomposites have unique properties typically
not shared by conventional composites, and therefore offer new technology and
business opportunities [3].
Improved mechanical properties, reduced gas and water permeability for barrier
applications, increased thermal stability, flame resistance, elevated heat-distortion
temperature, recyclability, and improved processability are some of the attractive
properties of nanocomposites. Moreover usage of inexpensive naturally-occurring
materials for reinforcement phase makes these materials more preferable than the
conventional composites [19].
8
Nanocomposites can be divided into three groups according to number of nano-size
dimensions of the dispersed particles. The first group is isodimensional nanoparticles
of which three dimensions are in the order of nanometers. Spherical silica
nanoparticles are one example of this group. When two dimensions of the particles are
in the nanometer scale and the third dimension is larger, the structure is elongated
structure and includes nanotubes and whiskers. The third type of nanocomposites is
called polymer-layered crystal nanocomposites correspond to the case where
reinforcements are in the shape of platelets and have only one dimension in the nano
level. In this type, the filler has a very high aspect ratio owing to a few nanometer
thickness to hundreds to thousands nanometers length. Polymer-layered crystal
nanocomposites are obtained by the insertion of the polymer inside the galleries of the
reinforcements which can be either natural or synthetic crystalline. Graphite, carbon
oxides, metal phosphates, clays and layered silicates are some examples of fillers
used in producing nanocomposites [2].
This study is based on the polymer-layered silicate nanocomposites which belong to
this third class.
2.3.1 Polymer-Layered Silicate Nanocomposites
Main reinforcement materials used in nanocomposites are clay and layered silicates
since clay materials are easily available and according to previous studies it was seen
that using these materials results in highly improved properties.
It was 1950’s that polymer layered silicate nanocomposites were first reported in the
patent literature [28]. However this type of nanocomposites became more widely
studied in academic, government and industrial laboratories after the Toyota
researchers obtained a well dispersion of nano-sized particles(clay) in the matrix
(nylon) and the obtained nanocomposites exhibited dramatically improved mechanical,
thermal, optical and physico-chemical properties compared to the pristine polymer or
conventional composites [2,28].

9
Polymer layered silicate nanocomposites usually exhibit properties superior to
conventional composites such as strength, stiffness, thermal and oxidative stability,
barrier properties with very little amount of filler content in comparison to glass- or
mineral- reinforced polymers. Moreover, these nanocomposites are lighter in weight
than the conventional composites. The fabrication techniques of polymer layered
silicate nanocomposites are much easier and cheaper than the fabrication of
conventional composites since they can attain the composite properties with low
volume fraction of reinforcement [3].
Some application areas of polymer layered silicate nanocomposites are aerospace,
automotive, electronics and biotechnology industries [29].
2.3.2 Layered Silicates Among the large number of inorganic layered materials that have the capability of
intercalation, layered silicates are one of the most typical because of the versatility of
reactions [30].
The commonly used layered silicates in preparation of polymer layered silicate
nanocomposites belong to the 2:1 layered or phyllosilicates family [31]. The crystalline
structure of phyllosilicates has one octahedral layer sandwiched between two
tetrahedral layers. In the structure of 2:1 layered family, two tetrahedrally coordinated
silicon atoms are fused to an edge-shared central octahedral sheet of either aluminum
or magnesium hydroxide. The oxygen atoms of the octahedral sheet also belong to the
tetrahedral sheets [32].
The layer thickness of the crystal structure is around 1 nm, and the lateral dimensions
of these layers may be in the range of 30 nm to several microns or larger. Stacking of
the layers leads to a regular Van der Waals gap between the layers called interlayer or
gallery. Isomorphic substitution within the layers (for example, Al+3 replaced by Mg+2 or
Fe+2) generates negative charges that are counterbalanced by alkali and alkaline earth
cations placed inside the galleries. This type of layered silicate is characterized by the
cation exchange capacity (CEC). Since this charge is not constant for each layer, an
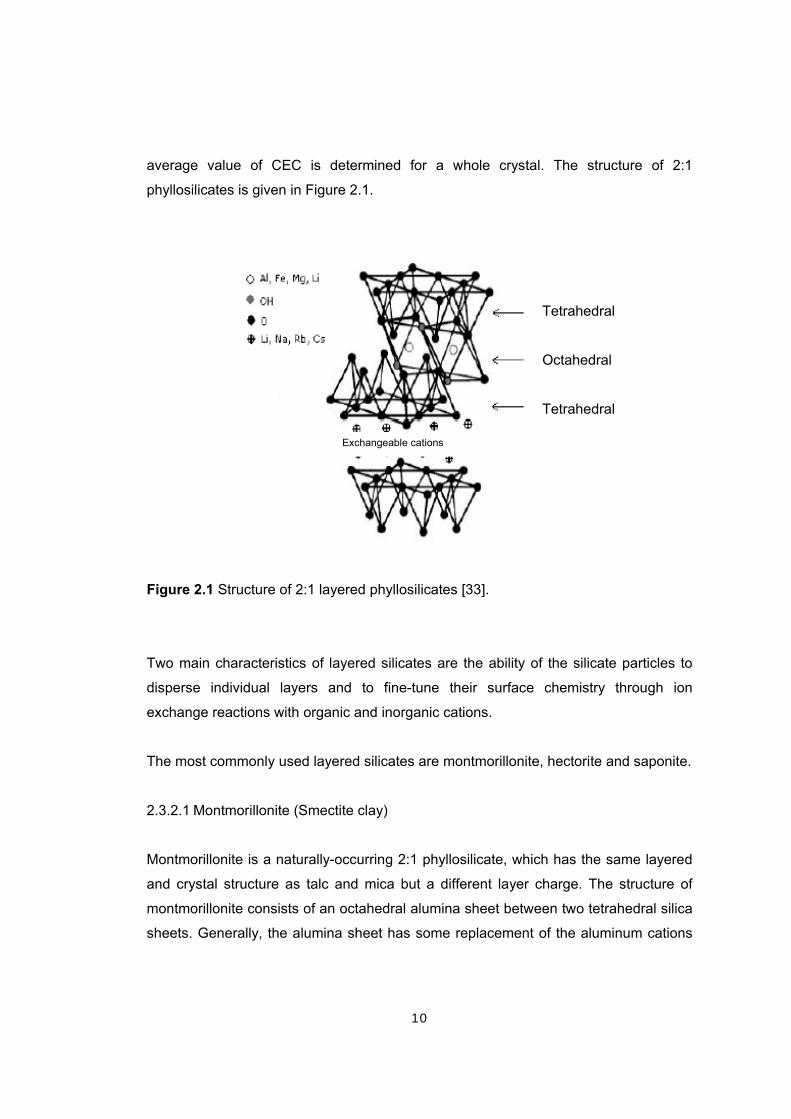
10
average value of CEC is determined for a whole crystal. The structure of 2:1
phyllosilicates is given in Figure 2.1.
Figure 2.1 Structure of 2:1 layered phyllosilicates [33].
Two main characteristics of layered silicates are the ability of the silicate particles to
disperse individual layers and to fine-tune their surface chemistry through ion
exchange reactions with organic and inorganic cations.
The most commonly used layered silicates are montmorillonite, hectorite and saponite.
2.3.2.1 Montmorillonite (Smectite clay)
Montmorillonite is a naturally-occurring 2:1 phyllosilicate, which has the same layered
and crystal structure as talc and mica but a different layer charge. The structure of
montmorillonite consists of an octahedral alumina sheet between two tetrahedral silica
sheets. Generally, the alumina sheet has some replacement of the aluminum cations
Tetrahedral Octahedral Tetrahedral
Exchangeable cations

11
by magnesium cations which results in a net negative charge to the layers. This
negative charge is balanced by having hydrated Na+, Li+, Mg+2, Ca+2, K+ cations
situated in the galleries between the aluminosilicate layers [19].
The most important aspect of the smectite group is the ability for water molecules to
be absorbed between the layered sheets, causing the volume of the minerals to
increase when they come in contact with water. Thus montmorillonite can expand by
several times its original volume when it comes in contact with water which makes it
useful for several applications.
2.3.3 Organically Modified Layered Silicates
In its pristine form the clay is present as a crystal which is made up of stack of layered
silica sheets (platelets). Silicate nanolayers are ideal for reinforcement due to the high
aspect ratios. Moreover the presence of positive ions on the surface of the silica
sheets increases the d-spacing of the clay crystal which generally varies from 1.0-1.3
nm, but it also makes the clay crystal planes hydrophilic and thus incompatible with
many hydrophobic engineering polymers [4]. So the layered silicates are not easily
dispersed in most polymers.
In order to make layered silicates miscible with polymers, naturally hydrophilic silicate
surface can be converted to organophilic surface easily by ion-exchange reactions
with cationic surfactants including primary, secondary, tertiary, and quaternary
alkylammonium cations [31]. The choice of the ammonium ion depends on its
chemical compatibility with the polymer matrix. The cation-exchange process between
the alkylammonium ions and the cations initially intercalated between the clay layers is
shown in Figure 2.2.

12
Figure 2.2 The cation-exchange process between alkylammonium ions and cations
initially intercalated between the clay layers [35].
According to charge density of the clay and the onium ion surfactant, different
arrangements of the onium ions as monolayer, lateral bilayer, pseudo-trimolecular
layer, and inclined paraffin structure, are possible [34].
The replacement of inorganic exchange cations by organic onium ions on the gallery
surfaces of smectite clays not only helps to match the polarity of the clay surface with
the polarity of the polymer, but it also increases the d-spacing of the layered silicates
[34]. Moreover the alkylammonium cations can have functional groups that can react
with the polymer matrix and improve the interface between the layered silicates and
the matrix.
2.3.4 Types of Polymer Layered Silicate Nanocomposite Structures
The structures of the polymer layered silicate nanocomposites depend on the nature of
the components used, synthesizing methods, and strength of the interfacial
interactions between the clay and the polymer, and the clay loading. There are mainly
three types of composites; phase separated composites (microcomposite),
intercalated nanocomposites, and exfoliated nanocomposites. Figure 2.3 shows the
types of nanocomposites structures.

13
Figure 2.3 Scheme of different types of composites arising from the interaction of
layered silicates and polymers: (a) phase-separated microcomposite; (b) intercalated
nanocomposite and (c) exfoliated nanocomposite [2].
If the polymer and clay are not compatible, and the clay platelets remain as large
stacks without any polymer chains entering the region between the clay platelets the
resulted structure is the phase separated microcomposite (Figure 2.3a). This type of
composites behave as conventional composites and the incomplete and non-uniform
dispersion of clay layers creates large regions of pure polymer in the nanocomposite
leading to poor properties.
In the intercalated nanocomposites, a single or sometimes several polymer chains
enter the clay gallery, but the platelets still remain as a stack and well ordered
multilayer structures (Figure 2.3b).
(a) Phase separated (microcomposite)
(b) Intercalated
(nanocomposite)
(c) Exfoliated
(nanocomposite)
Polymer Layered silicate

14
In an exfoliated nanocomposite, the individual clay layers are completely separated
throughout the polymer matrix (Figure 2.3c). This structure can be obtained if both the
polymer and the clay layers have polar groups that have favorable interaction and the
greatest property enhancement in polymer layered silicate nanocomposites systems is
obtained with the exfoliated nanocomposite structures. Usually, the clay content of an
exfoliated nanocomposite is much lower than that of an intercalated nanocomposite.
2.3.5 Synthesis of Polymer Layered Silicate Nanocomposites
Three main processes used for preparing polymer layered silicate nanocomposites
are; In-Situ Intercalative Polymerization Method, Solution Intercalation Method and Melt Intercalation Method.
2.3.5.1 In-Situ Intercalative Polymerization Method
This process involves mechanical mixing of the clay mineral with the required
monomer. The layered silicate is swollen within the liquid monomer (or a monomer
solution) and then the monomer intercalates within the interlayer and promotes
delamination. Polymerization follows, initiated by a number of ways such as heat or
radiation, the diffusion of a suitable initiator, an organic initiator or catalyst fixed
through cationic exchange inside the interlayer before the swelling step by the
monomer, to yield linear or cross linked polymer matrices. Usually the clay mineral
needs to be dispersed by a pre-swelling step of long-chain alkylammonium ion
intercalation to aid exfoliation [2].
The first US patent (#4739007) for the development of nylon-clay nanocomposites by
in-situ polymerization route was filed by Okada et.al. from Toyota Motor Company in
1988.
Nanocomposites prepared by this method have showed remarkably improved
properties but the batch size achieved by this method in a laboratory is limited due to
small sized reactors. Presence of additives in the system leads to complicated reaction
conditions making the production of these materials very complicated in the large

15
reactors used in industry. Thus bulk production of the nanocomposites by this method
is very unlikely in industry [4].
2.3.5.2 Solution Intercalation Method
In this synthesizing method, the polymer is first dissolved in a solvent and then the
modified layered silicate is added to the system. The solvent used in this method
should dissolve the polymer and also swell the layered silicates. The layered silicates
can be easily dispersed in an adequate solvent due to the weak forces that stack the
layers together. The process includes the swelling of the clay layers by the solvent and
then intercalation of the polymer chains into the expanded clay galleries and removal
of the solvent molecules out of the gallery. After the solvent is completely displaced
out of the galleries the system is heated to evaporate the solvent from the system. The
layers of the clay do not collapse back since they have been dispersed enough during
the process and at the end intercalated nanocomposites are obtained.
It is possible to synthesize nanocomposites from polymers that have little polarity with
this method but since large amounts of organic solvents are used it is not preferable
commercially because of the environmental and economical concerns.
2.3.5.3 Melt Intercalation Method
In melt intercalation method, the layered silicate is mixed with the polymer matrix in
molten state. If the layer surfaces are compatible enough with the polymer matrix, the
polymer can easily enter into the layered silicates as shown in Figure 2.4 and form
either intercalated or exfoliated nanocomposites.

16
Figure 2.4 Melt Intercalation Method [35].
Extrusion process is generally used for obtaining melt intercalated nanocomposites.
Vaia et al. first synthesized polymer-clay nanocomposites with this method by using a
twin screw extruder in 1993. The layered silicate and polymer can be simultaneously
or separately fed to the twin screw extruder [36]. The heat and the shear generated by
the screws of the extruder help to disperse the layered silicates throughout the
polymer matrix. The stepwise mechanism of clay platelets dispersion during melt
blending is shown in Figure 2.5.
organophilic clay
thermoplastic polymer Intercalation
blending +
annealing

17
Figure 2.5 The stepwise mechanism of clay platelets dispersion during melt blending:
(a) Organically modified layered silicates breakup, (b) Intercalated organically modified
layered silicate tactoids breakup, and (c) platelet exfoliation [31].
Melt intercalation method is relatively easier than the in-situ method and solution
intercalation method and environmentally benign due to the absence of organic
solvents and compatible with various industrial processes such as extrusion and
injection. So that it is the mostly used method for commercial applications. In addition
to these, melt intercalation method is quite an effective technology for the synthesis of
polyolefin-based nanocomposites [17].
In this study, nanocomposites have been synthesized by melt intercalation method by
using a twin screw extruder.
Organoclay particle (~8 μm)
Stacks of silicate
platelets or tactoids (a)
Shearing of platelet stacks leads to smaller tactoids (b)
Platelets peel apart by combined diffusion/shear process (c)
18
2.4 Polyethylene
Polyethylenes are major olefin polymers achieving significant growth each year [37].
The merits of polyethylene are its low price, good processability, excellent electrical
insulation properties, good chemical resistance, toughness, light weight, and flexibility.
On the other hand the hydrophobicity of PE prevents its usefulness considerably [38].
The classification of polyethylene is based on two parameters that could be easily
measured in 1950’s in a commercial environment with minimum instrumentation: the
resin density and its melt index [39]. According to this classification three major groups
are as follows:
• Low density polyethylene (LDPE)
• High density polyethylene (HDPE)
• Linear low density polyethylene (LLDPE).
Table 2.1 shows the classifications of PE resins with respect to density.
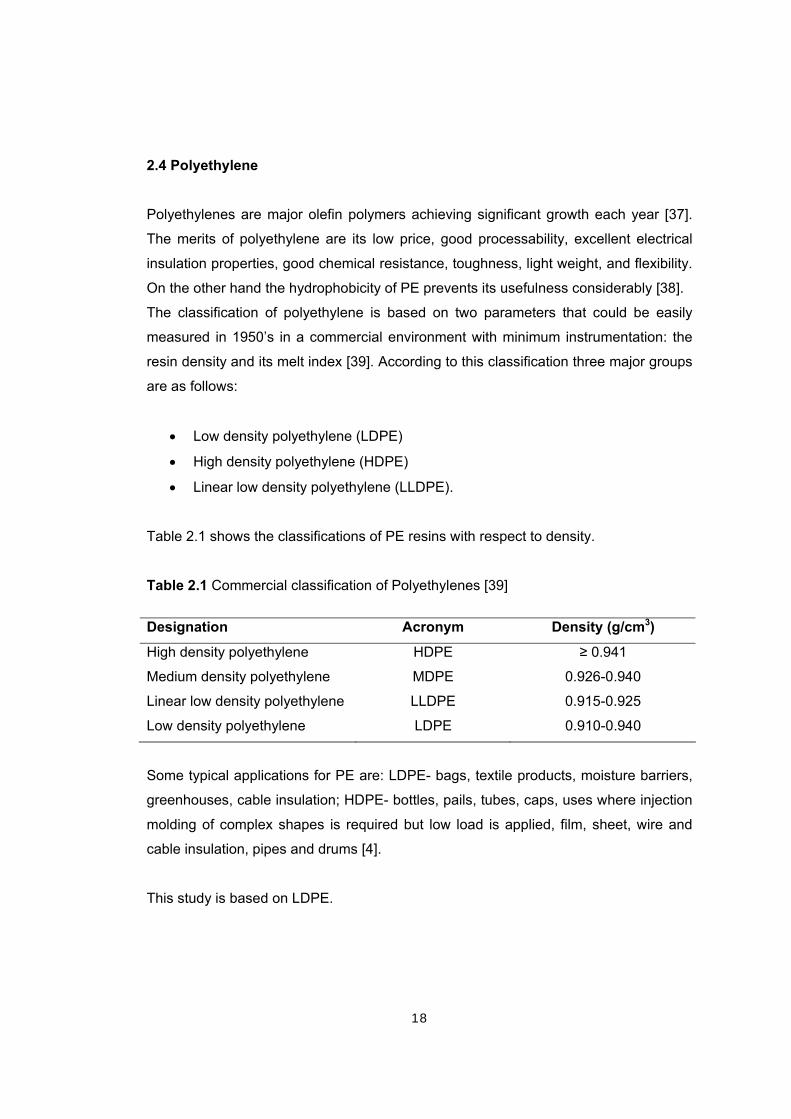
Table 2.1 Commercial classification of Polyethylenes [39]
Designation Acronym Density (g/cm3)
High density polyethylene HDPE ≥ 0.941
Medium density polyethylene MDPE 0.926-0.940
Linear low density polyethylene LLDPE 0.915-0.925
Low density polyethylene LDPE 0.910-0.940
Some typical applications for PE are: LDPE- bags, textile products, moisture barriers,
greenhouses, cable insulation; HDPE- bottles, pails, tubes, caps, uses where injection
molding of complex shapes is required but low load is applied, film, sheet, wire and
cable insulation, pipes and drums [4].
This study is based on LDPE.

19
2.4.1 Low Density Polyethylene The first high molecular weight crystalline polyolefin was produced in 1933 by Imperial
Chemical Industries, Ltd. through the high pressure process [40]. Low density
polyethylene can also be called high pressure - low density polyethylene because of
its production conditions. LDPE is produced by a free-radical catalyzed reaction using
oxygen or other free radical initiators such as organic peroxides at high temperature
and high pressure. Temperature range is 150-300°C and pressures range from 103-
345 MPa [37]. The residence time of the material is usually about 10-50 seconds [38].
The heat of ethylene polymerization is high as 105 kJ/mol, and needs to be controlled
during the process [19].
The Figure 2.6 shows simply the mechanism of polymerization of ethylene that forms
LDPE.
Figure 2.6 Schematic of polymerization of ethylene [41]
High pressure polymerization
ethylene
or simply
polyethylene

20
The resultant polymer is a highly branched long-chain thermoplastic polymer with a
density of 0.915 - 0.925 g/cm3 and molecular weight up to 4 x 10⁶.
LDPE is used in a wide range of applications: the largest segment is taken up by end
uses requiring processing into thin film. The film products include food packaging,
nonfood packaging, stretch and shrink film, carry out bags. In addition to these,
injected molded LDPE is used in making house wares, can lids, toys and pails. Other
important uses for LDPE are wire and cable jacketing, carpet backing, and foam for life
preserves or package cushioning material [40, 42].
2.4.2 Polymerization of LDPE
The polymerization process involves three basic steps: initiation, propagation, and
termination [42].
Initiation requires an initiator, usually a peroxide that thermally decomposes into free
radicals, which reacts with ethylene
Initiator (R)2 …………………………………………2 R’ (2.1)
R’ + CH2CH2 ………………………………………..RCH2CH2’ (2.2)
Propagation
RCH2CH2’ + CH2CH2 ………………………………RCH2CH2CH2CH2’ (2.3)
Termination occurs when two free radical groups combine or when a hydrogen radical
transfers from one chain to another.
RCH2CH2’+ ‘CH2CH2R …………………………….RCH2CH2CH2CH2R (2.4)
RCH2CH2’+ ‘CH2CH2R …………………………….RCH2CH3 + RCHCH2 (2.5)
21
2.4.3 Properties of LDPE
Toughness, high impact strength, low brittleness temperature, flexibility, processability,
film transparency, chemical resistance to polar compounds, low permeability to water,
and outstanding electrical properties are some unique properties of LDPE [5].
The mechanical properties of LDPE fall somewhere between rigid polymers such as
polystyrene and soft polymers such as polyvinyls. Table 2.2 summarizes the
properties of LDPE.
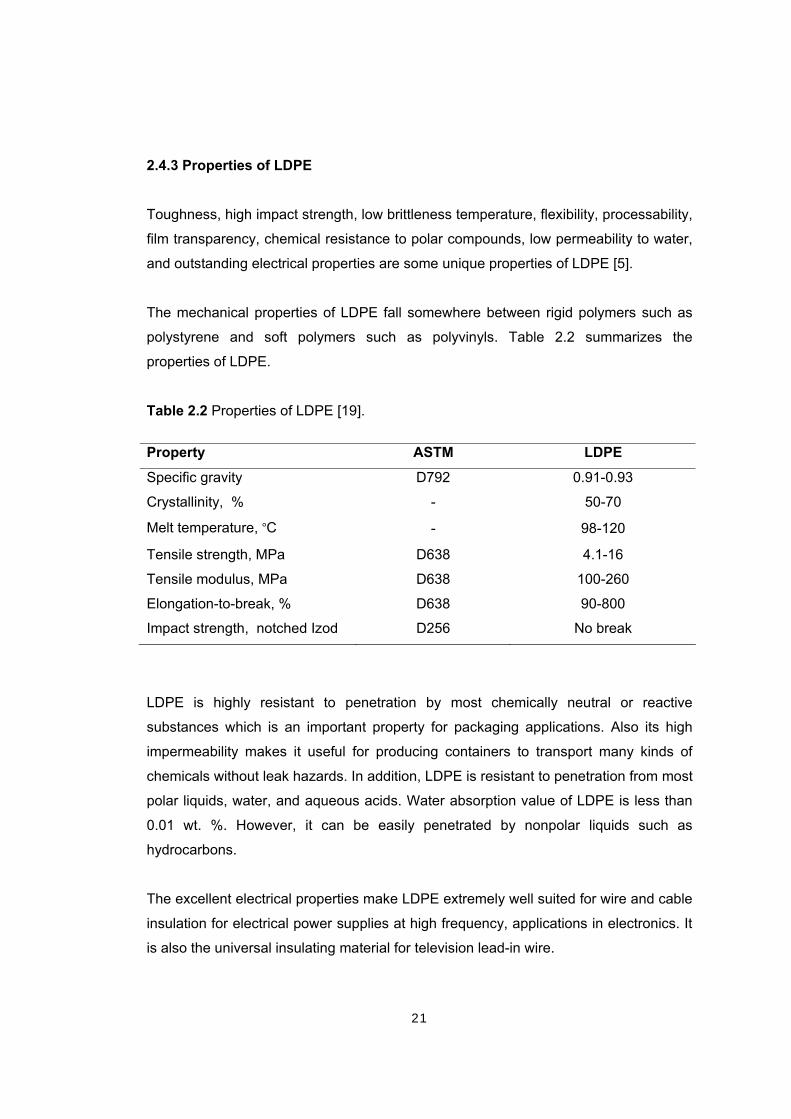
Table 2.2 Properties of LDPE [19].
Property ASTM LDPE
Specific gravity D792 0.91-0.93
Crystallinity, % - 50-70
Melt temperature, °C - 98-120
Tensile strength, MPa D638 4.1-16
Tensile modulus, MPa D638 100-260
Elongation-to-break, % D638 90-800
Impact strength, notched Izod D256 No break
LDPE is highly resistant to penetration by most chemically neutral or reactive
substances which is an important property for packaging applications. Also its high
impermeability makes it useful for producing containers to transport many kinds of
chemicals without leak hazards. In addition, LDPE is resistant to penetration from most
polar liquids, water, and aqueous acids. Water absorption value of LDPE is less than
0.01 wt. %. However, it can be easily penetrated by nonpolar liquids such as
hydrocarbons.
The excellent electrical properties make LDPE extremely well suited for wire and cable
insulation for electrical power supplies at high frequency, applications in electronics. It
is also the universal insulating material for television lead-in wire.

22
LDPE may have molecules that range in length from a few thousands carbons to a
million or more carbons. Melt viscosity is directly related to the average molecular
weight of the polymer. Increase in molecular weight results in increase in melt
viscosity, tensile strength, flexural stiffness, on the other hand it decreases the
transparency, haze and gloss [40].
The thermal properties of LDPE include a melting range 106-112 °C [41]. Its relatively
low melting point and broad melting range result in easy process applications. The
glass transition temperature of LDPE is well below the room temperature (~ -120 °C),
accounting for the polymer’s soft and flexible nature. Also, LDPE does not break when
subjected to the Izod impact test [43].
The environmental properties of LDPE are subjected to thermal and ultraviolet
degradation. However, this can be controlled with available additives and degradation
can be prevented up to several years.
2.4.4 Polyethylene – Organoclay Interaction Polyolefines (PE, PP), can not make strong interaction with polar, hydrophilic layered
silicates because of their nonpolar, hydrophobic structures during melt blending
process. This prevents the homogeneous dispersion of the silicate layers in the matrix
and thus the intercalation and exfoliation. It is known that modification of clay
increases the intercalation of polymer into the clay galleries since the modifier opens
the galleries to some extent. But this does not favor the intercalation of non-polar
polymers like polyethylene (PE) and polypropylene (PP) because the long alkyl tail
displays only a limited compatibility with the polymer chains [44]. In order to increase
the polymer clay interaction, a third component, compatibilizer is necessary to
enhance the intercalation of nonpolar polymer throughout the silicate layers [6].
Usually maleic anhydride grafted polyethylene is used as the compatibilizer to
increase the miscibility of the polyethylene and the clay. This increase, in interaction
originates from the strong hydrogen bonding between the maleic anhydride groups
and the oxygen atoms on the clay surfaces.
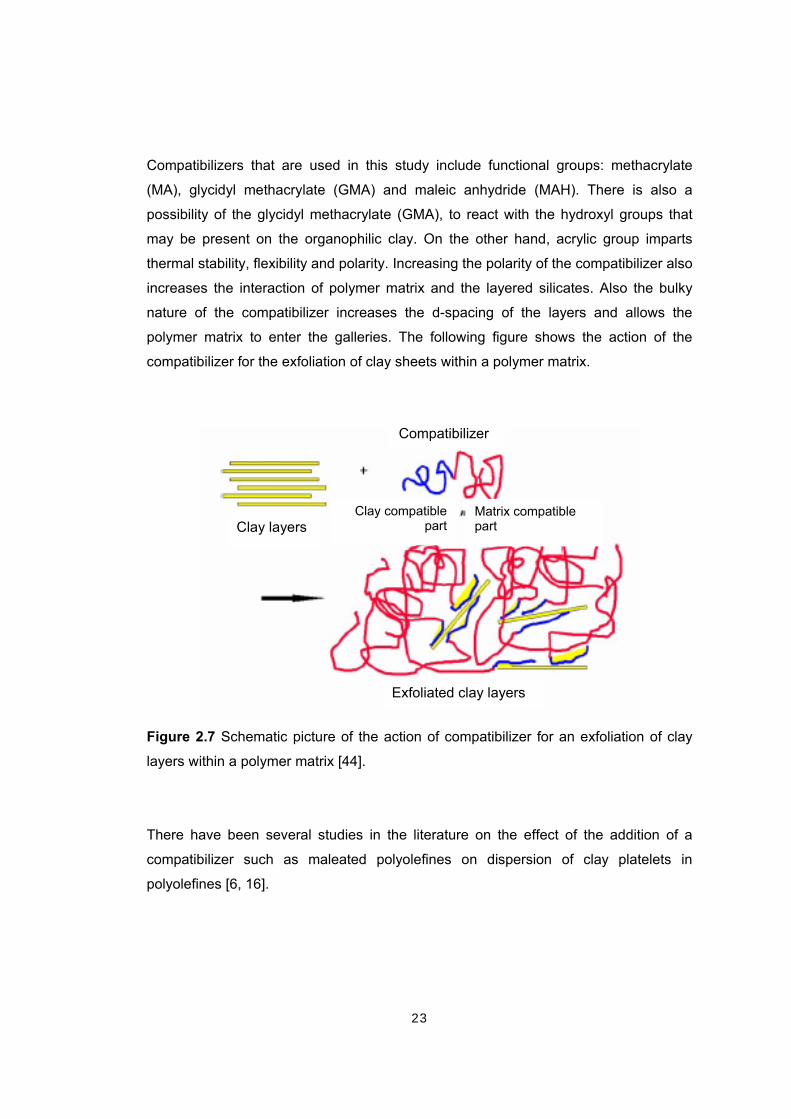
23
Compatibilizers that are used in this study include functional groups: methacrylate
(MA), glycidyl methacrylate (GMA) and maleic anhydride (MAH). There is also a
possibility of the glycidyl methacrylate (GMA), to react with the hydroxyl groups that
may be present on the organophilic clay. On the other hand, acrylic group imparts
thermal stability, flexibility and polarity. Increasing the polarity of the compatibilizer also
increases the interaction of polymer matrix and the layered silicates. Also the bulky
nature of the compatibilizer increases the d-spacing of the layers and allows the
polymer matrix to enter the galleries. The following figure shows the action of the
compatibilizer for the exfoliation of clay sheets within a polymer matrix.
Figure 2.7 Schematic picture of the action of compatibilizer for an exfoliation of clay
layers within a polymer matrix [44].
There have been several studies in the literature on the effect of the addition of a
compatibilizer such as maleated polyolefines on dispersion of clay platelets in
polyolefines [6, 16].
Compatibilizer
Exfoliated clay layers
Clay layers Clay compatible
partMatrix compatible part

24
In this study, terpolymer of Ethylene – Methyl Acrylate – Glycidyl Methacrylate (E-MA-
GMA), copolymer of Ethylene – Glycidyl Methacrylate (E-GMA), and terpolymer of
Ethylene – nButyl Acrylate – Maleic Anhydride (E- nBA-MAH) have been used as
compatibilizer in order to enhance the intercalation and exfoliation of LDPE through
the organoclay layers.
2.4.4.1 Glycidyl Methacrylate (GMA) Functionality
Glycidyl Methacrylate (GMA) monomer contains both epoxy and acrylic groups,
providing the flexible design conditions which are required for the most demanding
coating and resin applications. Figure 2.8 shows the chemical structure of GMA.
C
CH3
CH2
O O
O
p
Figure 2.8 Chemical structure of GMA
The GMA monomer can react with a variety of monomers and functionalized
molecules due to the functional groups of epoxy and acrylic. Acrylic and vinyl
functionalities provide the copolymerization with a variety of other vinyl monomers in
aqueous and non aqueous systems. The obtained polymers have a unique
combination of epoxy functionality with an acrylic backbone. Moreover, wide co-
monomer selection provides easy control of physical and chemical properties such as
glass transition temperature.
C

25
Due to the epoxy functionality, crosslinking reactions with amines, carboxylic acids,
anhydrides and hydroxyl containing polymers can be obtained. Also, the choice of
polymer accelerator / catalyst allows use of a wide range of cure temperatures. In
addition to these, this functionality allows structural modification of the polymer
backbone that can result in different properties and higher performance.
Both acrylic and epoxy functionality provides several benefits to the polymer systems
such as; improved impact resistance, improved adhesive strength, excellent acid
resistance (epoxide reactions only), improved water and heat resistance, and
improved thermoplastic polymer blend compatibility [45].
2.4.4.2 Maleic Anhydride (MAH) Functionality
Maleic anhydride increases the adhesion onto polar substrates and allows the creation
of chemical bonds. Chemical reaction occurs between the hydroxyl groups of the
organoclay and the maleic anhydride groups of maleated polyethylene. By the help of
this reaction, maleated polyethylene can move into the clay galleries and expand the
distance between the layers. Thus the maleated polyethylene serves as a useful
compatibilizer for the nanocomposite systems. Figure 2.9 shows the reaction
mechanism between the maleic anhydride and the hydroxyl group.
Figure 2.9 Reaction of Maleic Anhydride with Hydroxyl group of clay
+Maleated polyethylene
OH-

26
2.5 Polymer Processing
Processing involves the conversion of the solid polymer into a desirable size and
shape. There are number of methods to shape the polymer, including extrusion and
injection molding.
2.5.1 Extrusion Extrusion process is one of the oldest manufacturing processes. This process is used
to obtain significant quantities of plastic products, such as plastic film, sheet, and
profiles, but it is also used to produce the plastic pellets that are later used by all the
other plastics manufacturing processes [46].
In typical plastics extrusion processing, a viscous melt under pressure is forced
through a shaping die in a continuous stream. The feedstock may enter the extruder in
the molten state, but more commonly, it consists of solid particles that must be
subjected in the extruder to melting, mixing and pressurization. The solid feed may be
in the form of pellets, powder beads, flakes, or reground material. It may also be a
combination of these which may be premixed or fed separately at one or more feeders
[5].
In extrusion process, the materials are fed into the cavity between the screw and
extruder barrel and, as the screw rotates they are dragged forward, compressed, and
heated by conduction through the barrel walls and through frictional heating. During
the dragging the materials are melted, and forced under pressure through a die that
forms the molten material.
Figure 2.10 shows schematic drawing of the extruder used to obtain nanocomposites
in this study.

27
Figure 2.10 The extruder, used to obtain nanocomposites in this study.
The components of the extruder are, control panel, feeders, screw, barrel and die.
The control panel consists of different indicators to control the extrusion process. It is
possible to adjust the temperature, screw speed and feeding rate with the control
panel. Moreover, pressure of the die, temperature of the zones and torque can be
monitored.
The screw is the main part of the extruder which directly affects the performance of the
machine. It performs a number functions such as; conveying the plastic pellets,
melting the material, conveying the molten material, and mixing the plastic melt to
obtain homogeneity.
The screw is placed inside the cylinder extruder barrel. It provides the bearing surface
where shear is imparted to the plastic granules. The barrel consists of cast or
fabricated steel sections and a smooth inner liner, often made of a wear-resistant
28
material. Heating and cooling media surrounds the barrel to keep it at the desired
temperatures.
The polymer is shaped in the die zone so the die is one of the most important parts of
the extruder. The objective of an extrusion die is to distribute the polymer melt in the
flow channel in such a way that the material exits from the die with a uniform velocity.
The polymer melt is forced through the die by means of the diehead pressure. The
pressure is not determined by the extruder but by the extruder die [48].
There are tremendous die design and applications such as compounding, (coloring
and blending of melts, additives, and fillers), sheet, film, coatings, pipe, and rod [5].
Screw extruders are divided into single screw and multi screw extruders.
2.5.2 Twin Screw Extrusion Although twin-screw extruders are used less than single-screw extruders they are
widely employed for difficult compounding applications, devolatilization, chemical
reaction, and profile extrusion of thermally sensitive materials in the polymer
processing industry [5].
The complex flow patterns in twin screw extruders have several advantages, such as
good mixing, good heat transfer, large melting capacity, good devolatilization capacity,
and good control over stock temperatures [47].
Type of transport in extruder is different in single screw and twin screw extruders.
Material transport in single screw extruder is by frictional drag in solid conveying zone
and viscous drag in the melt conveying zone. On the other hand, the transport in an
intermeshing twin screw extruder is a positive displacement type of transport [47].
There is a tremendous variety of twin screw extruders, with vast differences in design,
principle of operation, and field of applications. The twin screw construction
substantially increases the number of design variables, such as direction of rotation,

29
(co-rotating, counter rotating), intermeshing, non-intermeshing, etc. [48]. Figure 2.11
shows the different screw configurations of twin screw extruders.
Figure 2.11 Types of twin screw extruders according to screw design [49].
There are two different patterns for intermeshing twin screw extruders according to the
direction of rotation of the screws: co-rotating, and counter rotating twin screw
extruders.
Co-rotating twin screw extruders in which both screw rotate in the same direction, are
typically used in applications where mixing and compounding need to be
accomplished in addition to the molding of the plastic melt. They are highly capable of
dispersing small agglomerates such as carbon black or clay [22]. The following figure
shows the co-rotating twin screw extruder and its zones.

30
Figure 2.12 Co-rotating twin screw extruder and its zones [50].
In the other intermeshing type, the screws rotate counter to each other, one rotates
clockwise and the other counterclockwise thus it is called counter rotating extruder. In
this type, material is brought to the junction of the two screws and a material bank
occurs on the top of the junction. Only a small amount of material passes between the
screws so the total shear applied to material is lower than the single screw extruders
and co-rotating twin screw extruders.
2.5.3 Injection Molding Injection molding is a widely used process to produce parts with variable dimensions.
It is a major processing technique for converting thermoplastic and thermosetting
materials into all types of products [48].
The injection molding process cycle includes melting of plastic resin, injection of melt
into the mold under high pressure, cooling of the mold, and removing the part. Cycle
time depends on the cooling time of the thermoplastic or the curing time of the
thermosetting plastic.
The injection unit may be ram fed or screw fed. The ram fed injection molding machine
uses a hydraulically operated plunger to push the material through a heated region.

31
The reciprocation single screw injection molding machine is the most common
injection unit used. In this system, the screw rotates and axially reciprocates. A
hydraulic motor produces the rotation and acts to melt, mix, and pump the polymer. In
addition to the material properties, the injection molding process itself has a large
influence on the final properties of the material, since the polymer chains undergo
orientation in the flow direction during the melt-filling phase of the injection cycle [22].
Injection molding produces parts in large volume at high production rates and the
parts need little or no finishing. The system is usually highly automated which reduces
the labor costs. Injection molding process allows the parts be molded in a combination
of plastics and fillers such as glass, and carbon. Also, parts can be molded with
metallic and nonmetallic inserts. Moreover, it is possible to produce very small parts
that are almost impossible to fabricate in quantity by other methods. On the other
hand, the plastic industry has very low profit margins. The molds, machinery and
auxiliary equipment are expensive, the initial equipment investment is high, thus in
effective molding, it is necessary to design the parts more carefully [48].
2.6 Characterization of Nanocomposites
2.6.1 Morphological Analysis X-ray diffraction (XRD) and transmission electron microscopy analyses are the mostly
used methods to investigate the dispersion of the clay particles in the polymer matrix.
In this study, only x-ray diffraction analysis has been used for this purpose.
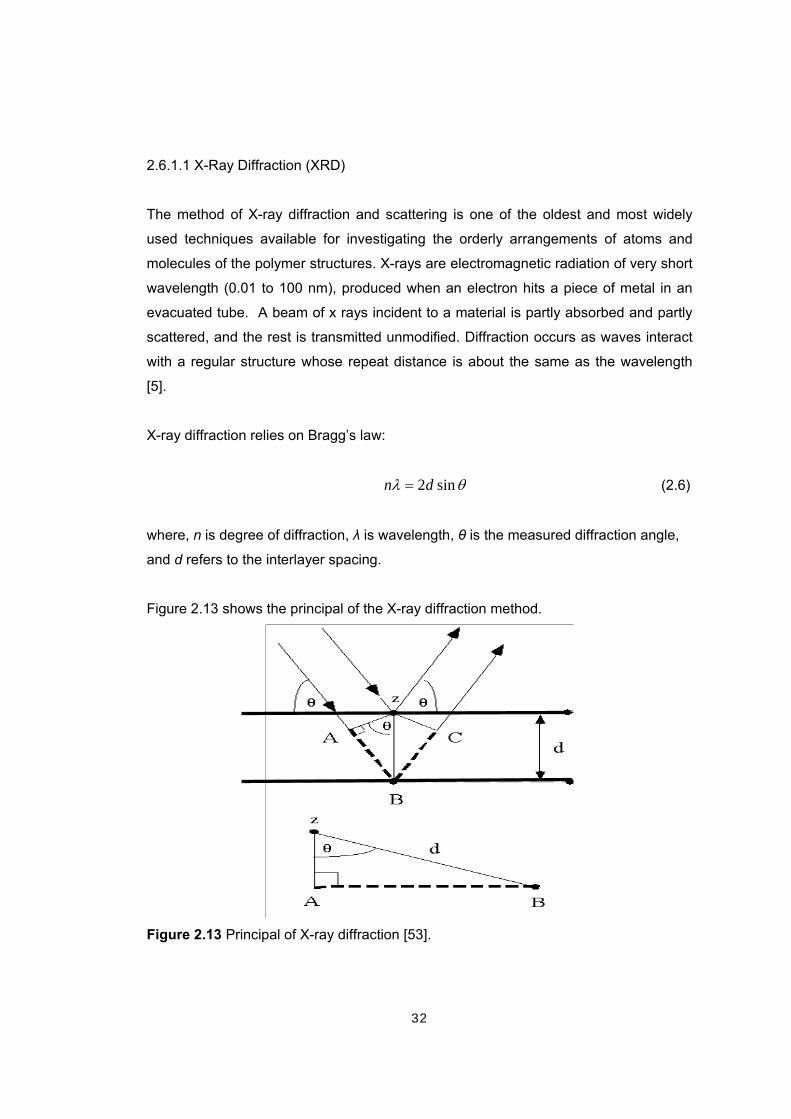
32
2.6.1.1 X-Ray Diffraction (XRD)
The method of X-ray diffraction and scattering is one of the oldest and most widely
used techniques available for investigating the orderly arrangements of atoms and
molecules of the polymer structures. X-rays are electromagnetic radiation of very short
wavelength (0.01 to 100 nm), produced when an electron hits a piece of metal in an
evacuated tube. A beam of x rays incident to a material is partly absorbed and partly
scattered, and the rest is transmitted unmodified. Diffraction occurs as waves interact
with a regular structure whose repeat distance is about the same as the wavelength
[5].
X-ray diffraction relies on Bragg’s law:
θλ sin2dn = (2.6)
where, n is degree of diffraction, λ is wavelength, θ is the measured diffraction angle,
and d refers to the interlayer spacing.
Figure 2.13 shows the principal of the X-ray diffraction method.
Figure 2.13 Principal of X-ray diffraction [53].

33
XRD gives quantitative data on the dispersion of the clay platelets. In intercalated
systems, the platelets are arranged periodically so a reflection from the clay platelets
can be observed in the XRD pattern. If more polymer chains enter the clay gallery, the
d spacing of the clay platelets increases, and the clay peak is shifted to lower angles
(2θ <2º). In addition to this, the separation of the layers also decreases the periodicity
and hence reduces the intensity of the clay peak. In exfoliated systems, the clay
platelets are randomly dispersed throughout the polymer matrix and in the X-ray
pattern no clay peak is observed. But the lack of a Bragg’s peak in the diffraction
pattern does not always mean that the clay is exfoliated. A disordered and immiscible
sample, or low concentration of the clay in the region where the x-ray beam hits a non-
uniformly dispersed sample, could fail to produce a Bragg’s reflection [4].
2.6.1.2 Scanning Electron Microscopy (SEM)
The scanning electron microscope is a microscope that uses electrons instead of light
to form an image. As in any microscope, the main objective of SEM analysis is
magnification and focus for clarity. In scanning electron microscopy, a fine beam of
electrons is scanned across the surface of an opaque specimen to which a light
conducting film (gold, platinum, silver) has been applied by high vacuum evaporation.
SEM is limited to a surface view only. It does not provide information about the interior
of the specimen. But the surface can be monitored as black and white images which
can be fitted to a x-ray instrument and elemental analysis can be made. Also, the
images can be used to make accurate conclusion about the morphology of the
polymer systems.
2.6.2 Mechanical Tests Most plastic materials are used in industry because they have the desirable
mechanical properties at an economical cost [54]. So the mechanical properties can
be considered to be the most important of all physical and chemical properties of
polymers for most applications. There are various number of mechanical tests and
testing instruments in order to investigate the properties of polymers and some of

34
these tests including tensile and flexural, have been standardized and described in the
publications of ASTM [55].
2.6.2.1 Tensile Test
Tensile tests are performed in order to measure the force required to break a
specimen and the extent to which the specimen elongates to that breaking point. The
test is applied according to standardized testing method [56]. According to this
standard, the specimens are rectangular or in the shape of dogbone, as seen in Figure
2.14.
The ends of the specimen are clamped into the jaws of the testing machine and the
jaws are separated by the application of a known force. Since the specimen is pulled
up, it elongates or breaks when the load applied is higher than the load which the
specimen can resist. The tensile test mechanism is given in Figure 2.14. Tensile test
provides a stress-strain diagram, which is used to determine the tensile modulus.
Stress-strain tests not only give the modulus and an indication of the strength of the
material but also toughness which is an indication of the energy that a material can
absorb before breaking [48].

35
Figure 2.14 Tensile specimen and tensile test procedure [57].
Tensile stress, σ is the tensile load per unit area perpendicular or normal to the applied
force ( Equation 2.7), and tensile strain, Є is the ratio of change in gage length of a
specimen in the direction of applied load stress to its original gage length (Equation
2.8).
0AF
=σ (2.7)
0LLΔ
=ε (2.8)
where, F is the measured value at the fixed end as a function of elongation (N), and A0
is the original, undeformed cross-section area of the gage region (mm2), ΔL is the
change in gage length (mm), and L0 is the original gage length of the specimen (mm).

36
The tensile strength, σm of a material is the maximum amount of tensile stress that it
can be subjected to before it breaks during a tensile test and is reported in MPa’ s. If
the maximum stress occurs at break, it is called tensile strength at break.
The ratio of the stress to strain in the proportional region of the stress-strain curve is
the measure of the stiffness and called as Young’s modulus or tensile modulus as
given in the Equation 2.9.
εσ
=E (2.9)
Tensile modulus and elongation values are determined by using the stress-strain
diagrams. Tensile modulus is the slope of the initial straight line portion of the stress-
strain diagram and may be expressed in MPa’ s [55]. Figure 2.15 represents several
polymeric materials properties according to stress-strain curves.
Figure 2.15 Stress –strain curves of several polymeric materials [58]

37
2.6.2.2 Flexural Test
The flexural test is performed according to ASTM D790M-92 test method [59]. In this
study three point loading system is applied in order to determine the flexural properties
of the specimens. Three point loading system bases on a center loading of a simply
supported beam. Due to this procedure, specimen lies on a support span and the load
is applied to the center of the specimen as shown in Figure 2.16. The support span
and the speed of loading are two parameters of flexural test and the specimen
deflection is usually measured by the crosshead position.
Figure 2.16 Flexural test procedure [51]
Flexural test results include flexural strength, flexural modulus and strain.
Maximum fiber stress developed in a specimen just before it cracks or breaks in a
flexure test is called the flexural strength It is the ability of the material to resist
bending forces applied perpendicular to its longiditual axis and can be calculated for
any point on the load-deflection curve by using Equation 2.10:
223bdPLS = (2.10)
where; S is the stress in the outer fibers at midspan and may be represented in MPa,
P is the applied load at a given point on the load-deflection curve (N), L is the length
of support span (mm), b is the width of the specimen (mm), and d is the depth of the

38
specimen (mm). For materials that do not crack in the flexure test, flexural yield
strength is reported instead of flexural strength. In this study, flexural yield strength
values have been reported.
The maximum strain in the outer fibers at midspan is calculated as follows:
2
6LDdr = (2.11)
where; r is the maximum strain, D is the maximum deflection of the center of the
beam(mm), and L is the length of the support span (mm), and d is the depth of the
specimen (mm).
Flexural modulus is used as an indication of a material’s stiffness when flexed. It is the
ratio, within the elastic limit of stress to corresponding strain and determined by
drawing a tangent line to the initial straight-line portion of the load-deflection curve and
using Equation 2.12.
3
3
4bdmLEb = (2.12)
where; Eb represents the flexural modulus (MPa), L is the support span (mm), m is the
slope of the tangent to the initial straight-line portion of the load-deflection curve
(N/mm), b is the width of beam tested (mm), and d is the depth of the beam (mm).
2.6.3 Thermal Analysis In thermal characterization, a controlled amount of heat is applied to a sample and its
effect is measured and recorded.
39
2.6.3.1 Differential Scanning Calorimetry Analysis (DSC)
Differential scanning calorimetry is the dominant technique for the thermal analysis of
polymeric materials. The working principal of a differential scanning calorimeter is
based on measurement of the difference in energy inputs into a substance and a
reference material as they are subjected to a controlled temperature range. Its
measurement process is quantitative [5].
In DSC analysis, two small metal containers, one containing polymer sample and the
other either empty or a control substance, are heated by individual electric heaters.
Both the sample and reference are maintained at the same temperature throughout
the experiment and temperature of each container is monitored by a heat sensor.
Usually the temperature of the system increases linearly as a function of time during
the experiment. When the sample suddenly absorbs heat during a transition, this
additional heat is detected by the sensor, since this sample results in a greater current
flow and change in electrical current can be monitored accurately which means
sensitive measurement can be made by DSC analysis. A recorder prints out the data
as a plot of increase in heat per increase in temperature, versus temperature.
Exothermic and endothermic processes within the sample result in a significant
deviation in the difference between the two heat flows.
The result is a peak in the DSC curve and the differential heat flow is calculated by
subtracting the sample heat flow from the reference heat flow. According to this ,
exothermic processes show up as positive peaks (above the baseline) while peaks
resulting from endothermic processes are negative (below the baseline). The area
under the resulting curve is a direct measure of heat of transition [52]. A representative
drawing of DSC and the output of analysis are seen in Figure 2.17.
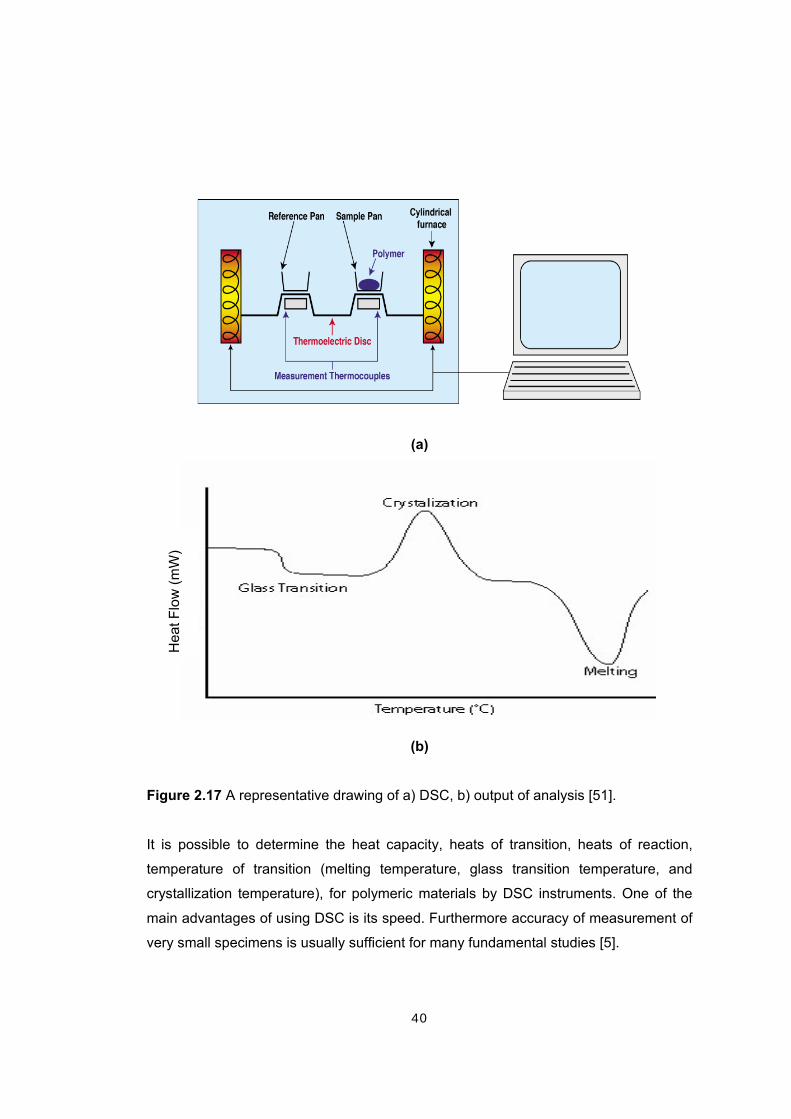
40
(a)
(b)
Figure 2.17 A representative drawing of a) DSC, b) output of analysis [51].
It is possible to determine the heat capacity, heats of transition, heats of reaction,
temperature of transition (melting temperature, glass transition temperature, and
crystallization temperature), for polymeric materials by DSC instruments. One of the
main advantages of using DSC is its speed. Furthermore accuracy of measurement of
very small specimens is usually sufficient for many fundamental studies [5].
Hea
t Flo
w (m
W)

41
2.6.4 Flow Characteristics
2.6.4.1 Melt Flow Index (MFI) Test
The melt flow index is one of the indices used to characterize the behavior of molten
plastic [38]. It is not an intrinsic property of polymers (which limits its usefulness), but is
nearly always specified when a polymer is requested due to its ability to predict
general behavior properties of the polymer. It describes the flow behavior of a polymer
at a specific temperature under specific pressure. If the melt flow index is low, then its
melt viscosity or melt flow resistance is high.
The melt index machine is a simple ram extruder. The polymer is placed in the barrel
which is heated to the appropriate temperature that is required to provide the flow of
polymer. When the polymer is molten and free of bubbles, the polymer is forced to flow
from the die by the help of the ram and a weight which is placed on the top of the ram.
After a set amount of time, usually 10 minutes, the polymer that was extruded is
weighed and the melt index is expressed as grams polymer/10 minutes.
2.7 Previous Studies
Wang et al. [7] prepared maleated polyethylene/clay nanocomposites by melt
compounding method. They investigated the effect of the maleic anhydride grafting
level and organic modifier of clay on the morphology of linear low density
polyethylene/clay nanocomposites. It was concluded that maleic anhydride grafting
level of polyethylene should be higher than 0.1 wt % and organic modifiers should
contain higher methylene groups in order to obtain better exfoliation of LLDPE/clay
nanocomposites. After this study, in 2002 Wang and co-workers studied the
morphology and physical properties of polyethylene/silicate nanocomposites prepared
by melt intercalation method.
Li et al. [8] reported the effect of blending sequence on the microstructure and
properties of ternary nanocomposites that consist of poly(butylene terephtalate),
maleic anhydride grafted polyethylene-co-vinyl acetate and organically modified
42
montmorillonite. They applied four different blending sequences in a Haake records
mixer and investigated that mixing sequence significantly influenced the microstructure
of the prepared nanocomposites, dispersion of the organoclay and thus the
mechanical properties.
Jog and co-workers in 2002 investigated the effect of the compatibilizer on the
thermal, crystallization and dynamic mechanical behavior of polypropylene / clay
nanocomposites. They used three grades of PP with different molecular weights, two
different organo-modified montmorillonites and two grades of maleic anhydride
modified PP. It was reported that the extent of intercalation or exfoliation depends on
the type of compatibilizer [6].
Gopakumar et al. [9] studied the influence of clay exfoliation on the physical properties
of montmorillonite/polyethylene composites. They prepared conventional composites
and nanocomposites of two different montmorillonite clays, high density polyethylene
and 1 wt % maleic anhydride grafted polyethylene by melt compounding method and
concluded that it is necessary to modify both the montmorillonite clay and polyethylene
in order to prepare polyethylene nanocomposites and resulting rheological,
mechanical and thermal properties of these nanocomposites depend on the structure
of the composite and clay content. In addition to this, improved rheological,
mechanical and thermal properties observed for the nanocomposites were shown to
be the evidence of the exfoliation of clay.
Kato et al. [10] prepared different compositions of nanocomposites by melt
compounding with maleic anhydride grafted polyethylene, organophilic clay and
polyethylene. In this study, silicate layers were exfoliated and dispersed which led to
superior mechanical and gas barrier properties. They obtained nanocomposites which
have 1.4 times higher tensile strength and 1.8 times higher tensile modulus than the
matrix and gas permeability of the nanocomposites was 30 % less than the
polyethylene matrix.
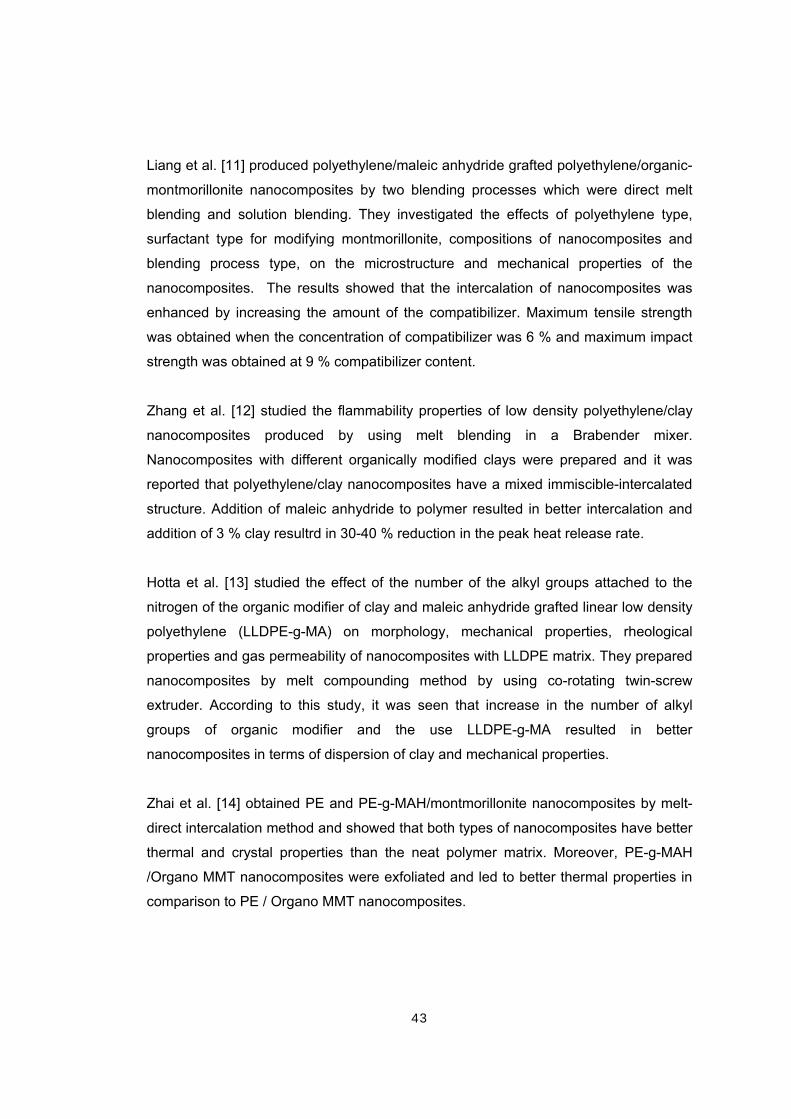
43
Liang et al. [11] produced polyethylene/maleic anhydride grafted polyethylene/organic-
montmorillonite nanocomposites by two blending processes which were direct melt
blending and solution blending. They investigated the effects of polyethylene type,
surfactant type for modifying montmorillonite, compositions of nanocomposites and
blending process type, on the microstructure and mechanical properties of the
nanocomposites. The results showed that the intercalation of nanocomposites was
enhanced by increasing the amount of the compatibilizer. Maximum tensile strength
was obtained when the concentration of compatibilizer was 6 % and maximum impact
strength was obtained at 9 % compatibilizer content.
Zhang et al. [12] studied the flammability properties of low density polyethylene/clay
nanocomposites produced by using melt blending in a Brabender mixer.
Nanocomposites with different organically modified clays were prepared and it was
reported that polyethylene/clay nanocomposites have a mixed immiscible-intercalated
structure. Addition of maleic anhydride to polymer resulted in better intercalation and
addition of 3 % clay resultrd in 30-40 % reduction in the peak heat release rate.
Hotta et al. [13] studied the effect of the number of the alkyl groups attached to the
nitrogen of the organic modifier of clay and maleic anhydride grafted linear low density
polyethylene (LLDPE-g-MA) on morphology, mechanical properties, rheological
properties and gas permeability of nanocomposites with LLDPE matrix. They prepared
nanocomposites by melt compounding method by using co-rotating twin-screw
extruder. According to this study, it was seen that increase in the number of alkyl
groups of organic modifier and the use LLDPE-g-MA resulted in better
nanocomposites in terms of dispersion of clay and mechanical properties.
Zhai et al. [14] obtained PE and PE-g-MAH/montmorillonite nanocomposites by melt-
direct intercalation method and showed that both types of nanocomposites have better
thermal and crystal properties than the neat polymer matrix. Moreover, PE-g-MAH
/Organo MMT nanocomposites were exfoliated and led to better thermal properties in
comparison to PE / Organo MMT nanocomposites.

44
Morawiec et al. [15] prepared nanocomposites based on low density polyethylene,
containing 3 or 6 wt. % of organo-modified montmorillonite clay and maleic anhydride
grafted low density polyethylene as a compatibilizer by melt blending. According to this
study, it was concluded that the mechanical performance of the system did not only
depend on the exfoliation of clay and the clay content, but it was also affected by the
presence of a significant amount of the compatibilizer. The results showed that maleic
anhydride grafted polyethylene promoted the exfoliation of the clay and its good
adhesion to LDPE and moreover it toughened the polymer matrix.
Zhong et al. [16] studied the effects of clay, polymer matrix, and compatibilizer on the
morphology, flow behavior and mechanical properties of nanocomposite blown films
prepared by melt compounding of organoclay, maleic anhydride grafted polyethylene
as compatibilizer with ethylene vinyl acetate, low density polyethylene, and high
density polyethylene respectively. As in the previous studies, it was concluded that
compatibilizer is required to obtain improved properties in nanocomposites.

45
CHAPTER 3
EXPERIMENTAL
3.1 Materials
3.1.1 Polymer Matrix Low density polyethylene was purchased from Petkim Petrokimya Holding A.Ş, İzmir,
Turkey. The trade name of the LDPE used is Petilen G03-5 and it is sold in the form of
pellets in a 25 kg white colored PE bags. Properties of LDPE obtained from the
company are given in Table 3.1.
Table 3.1 Properties of polymer matrix, LDPE
Property Unit Value
Melt Flow Rate (MFR) (2160 g, 190°C) g/10 min 0.2-0.4
Density, 23°C g/cm3 0.919-0.923
3.1.2 Organoclays Three different natural montmorillonites modified with a quaternary ammonium salt
were used in this study as filler. These organoclays, namely Cloisite® 15A, Cloisite®
25A, and Cloisite® 30B, were purchased from Southern Clay Products, Texas-U.S.A.
They are all additives for plastics to improve various plastic physical properties, such
as mechanical, thermal, and barrier properties.

46
3.1.2.1 Cloisite® 15A
The cation of Cloisite® 15A is dimethyl, dehydrogenated tallow, quaternary ammonium
and the anion is chloride. Figure 3.1 shows the chemical structure of organic modifier
of Cloisite® 15A. Physical properties obtained from manufacturer are listed in Table
3.2.
CH3 N+ HT
CH3
HT
Cl-
Figure 3.1 Chemical structure of organic modifier (2M2HT*) and anion (Cl-) of
Cloisite® 15A.
*2M : Dimethyl
HT : Hydrogenated Tallow (Alkyl chain), (~65% C18; ~30% C16; ~5% C14)
Table 3.2 Physical properties of Cloisite® 15A Properties Cloisite® 15A
Organic Modifier (1) 2M2HT
Modifier Concentration 125 meq/100g clay
% Moisture < 2%
% Weight Loss on Ignition 43%
Typical Dry Particle Sizes:
(microns, by volume)
10% less than: 2µ
50% less than: 6µ
90% less than: 13µ
Color Off white
Loose Bulk, lbs/ft3 10.79
Packed Bulk, lbs/ft3 18.64
Specific Gravity, g/cc 1.66
d- spacing (X-Ray) 31.5Å

47
3.1.2.2 Cloisite® 25A The organic modifier of Cloisite® 25A is dimethyl, hydrogenated tallow, 2-ethylhexyl
quaternary ammonium and its anion is methyl sulfate. Figure 3.2 shows the chemical
structure of the cation of Cloisite® 25. Table 3.3 summarizes the physical properties of
Cloisite® 25 .
CH3 N+ CH2
CH3
HT
CH
CH2
CH2
CH3
CH2 CH2 CH3 S
O
O O-
OH
Figure 3.2 Chemical structure of organic modifier (2MHTL8 *) and anion (methyl
sulfate) of Cloisite® 25A
* 2MHTL8: dimethyl, hydrogenated tallow, 2-ethylhexyl quaternary ammonium
HT: Hydrogenated Tallow (~65% C18; ~30% C16; ~5% C14)

48
Table 3.3 Physical properties of Cloisite® 25A
Properties Cloisite® 25A
Organic Modifier 2MHTL8
Modifier Concentration 95 meq/100g clay
% Moisture < 2%
% Weight Loss on Ignition 34%
Typical Dry Particle Sizes:
(microns, by volume)
10% less than: 2µ
50% less than: 6µ
90% less than: 13µ
Color Off white
Loose Bulk, lbs/ft3 12.08
Packed Bulk, lbs/ft3 20.48
Specific Gravity, g/cc 1.87
d- spacing (X-Ray) 18.6Å
3.1.2.3 Cloisite® 30B
Cloisite® 30B is treated with methyl, tallow, bis-2-hydroxyethyl, quaternary ammonium
by manufacturer. The anion of this clay is chloride ion. The chemical structure of
organic modifier is shown in Figure 3.3. The physical properties of Cloisite® 30B are
given in Table 3.4.
CH3 N+ T
CH2
CH2
CH2 OH
CH2 OH
Cl-
Figure 3.3 Chemical structure of organic modifier (MT2EtOH*) and anion (Cl-) of
Cloisite® 30B

49
* MT2EtOH: methyl, tallow, bis-2-hydroxyethyl, quaternary ammonium
T : tallow (~65% C18; ~30% C16; ~5% C14)
Table 3.4 Physical properties of Cloisite® 30B Properties Cloisite® 30B
Organic Modifier MT2EtOH
Modifier Concentration 90 meq/100g clay
% Moisture < 2%
% Weight Loss on Ignition 30%
Typical Dry Particle Sizes:
(microns, by volume)
10% less than: 2µ
50% less than: 6µ
90% less than: 13µ
Color Off white
Loose Bulk, lbs/ft3 14.25
Packed Bulk, lbs/ft3 22.71
Specific Gravity, g/cc 1.98
d- spacing (X-Ray) 18.5Å
3.1.3 Compatibilizers In this study Lotader® AX8900; terpolymer of Ethylene – Methyl Acrylate – Glycidyl
Methacrylate (E-MA-GMA) , Lotader® AX8840; Copolymer of Ethylene – Glycidyl
Methacrylate (E-GMA), and Lotader® 2210; terpolymer of Ethylene – nButyl Acrylate –
Maleic Anhydride (E- nBA-MAH), were chosen as compatibilizers. They were
purchased from Arkema Inc., France. The reason for choosing Lotader® resins as
compatibilizer was that, they are highly compatible with various thermoplastics
including polyethylene, owing to their reactivity, crystallinity and melt fluidity
characteristics. Moreover these resins have high thermal stability during processing.
Lotader® AX8900 and Lotader® AX8840 contains glycidyl methacrylate (GMA)
monomer as reactive group. GMA includes both acrylic and epoxy groups which

50
enables the polymer to react with substances such as hydroxyl, (OH) containing
materials, carboxylic acids (COOH), and amines. The chemical structure of Lotader®
AX8900 and Lotader® AX8840 are given in Figure 3.4 and Figure 3.5, and Table 3.5
gives the specifications of both resins.
CH2 CH2HC
C
CH2
n
OOCH3
m
C
CH3
CH2
O O
O
p
Figure 3.4 Chemical structure of Lotader® AX8900 (E-MA-GMA)
CH2 CH2
n
C
CH3
CH2
O O
O
p
Figure 3.5 Chemical structure of Lotader® AX8840 (E-GMA)
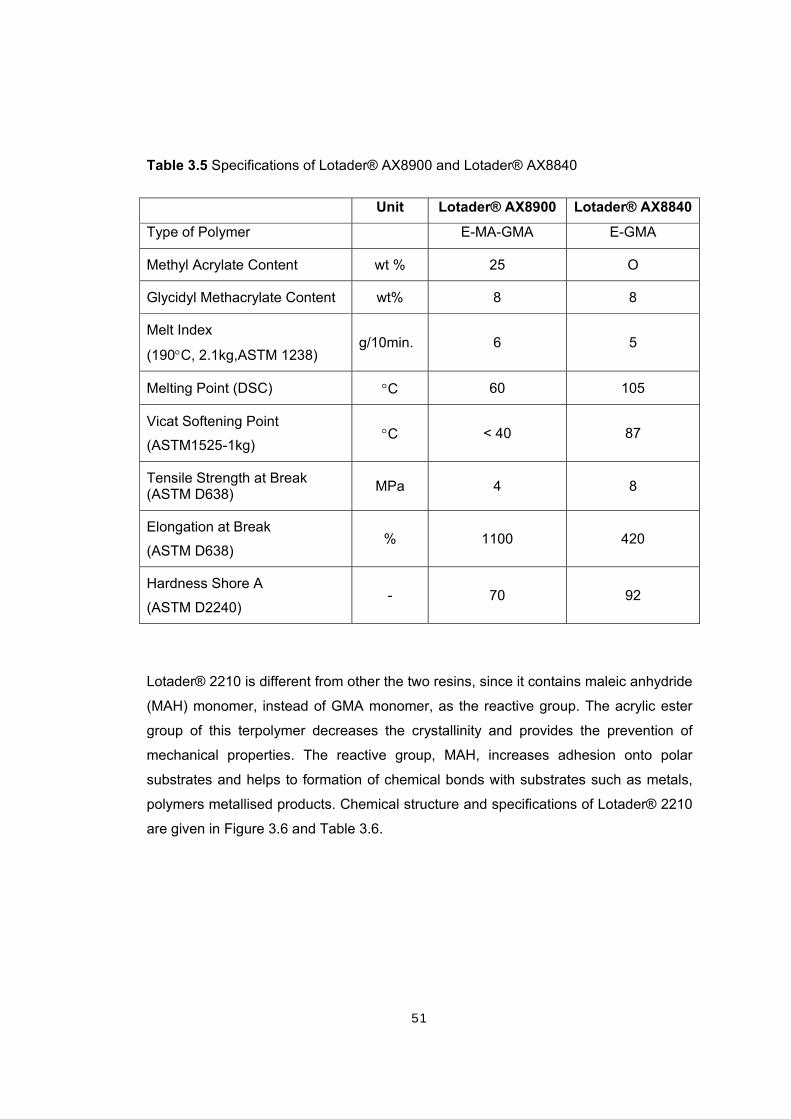
51
Table 3.5 Specifications of Lotader® AX8900 and Lotader® AX8840
Unit Lotader® AX8900 Lotader® AX8840
Type of Polymer E-MA-GMA E-GMA
Methyl Acrylate Content wt % 25 O
Glycidyl Methacrylate Content wt% 8 8
Melt Index
(190°C, 2.1kg,ASTM 1238) g/10min. 6 5
Melting Point (DSC) °C 60 105
Vicat Softening Point
(ASTM1525-1kg) °C < 40 87
Tensile Strength at Break (ASTM D638) MPa 4 8
Elongation at Break
(ASTM D638) % 1100 420
Hardness Shore A
(ASTM D2240) - 70 92
Lotader® 2210 is different from other the two resins, since it contains maleic anhydride
(MAH) monomer, instead of GMA monomer, as the reactive group. The acrylic ester
group of this terpolymer decreases the crystallinity and provides the prevention of
mechanical properties. The reactive group, MAH, increases adhesion onto polar
substrates and helps to formation of chemical bonds with substrates such as metals,
polymers metallised products. Chemical structure and specifications of Lotader® 2210
are given in Figure 3.6 and Table 3.6.
52
CH2 CH2HC
C
CH2 CH
CH
n
OOCH3CH2CH2CH2
m
O OO
m
Figure 3.6 Chemical structure of Lotader® 2210 (E-nBA-MAH)
Table 3.6 Specifications of Lotader® 2210
Unit Lotader® 2210
Type of Polymer E-nBA-MAH
Butyl Acrylate Content wt % 8
Maleic Anhydride Content wt% 2.6
Melt Index
(190°C, 2.1kg,ASTM 1238) g/10min. 3
Melting Point (DSC) °C 107
Vicat Softening Point
(ASTM1525-1kg) °C 80
Tensile Strength at Break (ASTM D638) MPa 12
Elongation at Break
(ASTM D638) % 600
Hardness Shore D
(ASTM D2240) - 46

53
3.2 Experimental Set-Up and Procedure
3.2.1 Melt Blending In this study a co-rotating twin screw extruder was used in order to obtain ternary
nanocomposites. The model of extruder is Thermoprism TSE 16 TC with L/D = 24.
The screw diameter and the twin bore diameter of the extruder are 16 mm and 15.6
mm respectively. It has a barrel length of 384 mm and die length of 16 mm. In addition
to these, maximum screw speed and maximum torque that can be achieved are 500
rpm and 12 Nm. It is possible to set barrel zones and die temperatures, screw speed
and feed flow rate of main-feeder and side-feeder by using control panel with this
extruder which allows us performing several experiments with different process
parameters. Figure 3.7 shows the extruder and its screw configuration that was used
for this study.
Figure 3.7-a Thermo Prism TSE 16 TC twin screw extruder

54
Figure 3.7-b Screw Configuration of Thermo Prism TSE 16 TC twin screw extruder
3.2.2 Injection Molding The specimens for characterization were obtained by using Microinjector which is a
laboratory scale injection molding machine (Daca Instruments). The molding
parameters that can be controlled with this injection molding machine are, nozzle
temperature, mold temperature, fill time, hold time, injection speed and injection
pressure. The schematic drawing of injection molding machine is shown in Figure 3.8.

55
Figure 3.8 Injection Molding Machine
3.2.3 Experimental Procedure Ternary nanocomposites of low density polyethylene/compatibilizer/clay were
produced in this study. Process parameters were composition of raw materials,
compatibilizer type, montmorillonite type, and addition order of materials during melt
blending process. At first nanocomposites were obtained in pelletized form by two step
extrusion process and then they were molded by injection molding in order to obtain
specimens for mechanical, thermal and morphological characterization. Pure LDPE
and binary mixtures of LDPE/Organoclay and LDPE/Compatibilizer were also
prepared with the same process conditions in order to make comparison with the
properties of nanocomposites. Before each run of extrusion process and molding, the
raw materials and samples were dried in order to get rid of the moisture. Drying
conditions were determined by considering the melting point of raw materials. Table
3.7 represents the drying conditions.

56
Table 3.7 Drying conditions
Materials Drying Temperature (°C) Drying Time (h)
Before RUN I Extrusion Process
LDPE - -
Lotader® AX8900
Lotader® AX8840
Lotader® 2210
40 12-15
Cloisite® 15A
Cloisite® 25A
Cloisite® 30B
120 12-15
Before RUN II Extrusion Process
LDPE 100 4
LDPE + Compatibilizer 100 4
LDPE + Clay 100 4
Compatibilizer + Clay 40 4
LDPE + Compatibilizer + Clay 100 4
Before Injection Molding Process
All samples 100 12-15
Flowchart of experimental procedure and characterization of nanocomposites is shown
in Figure 3.9.
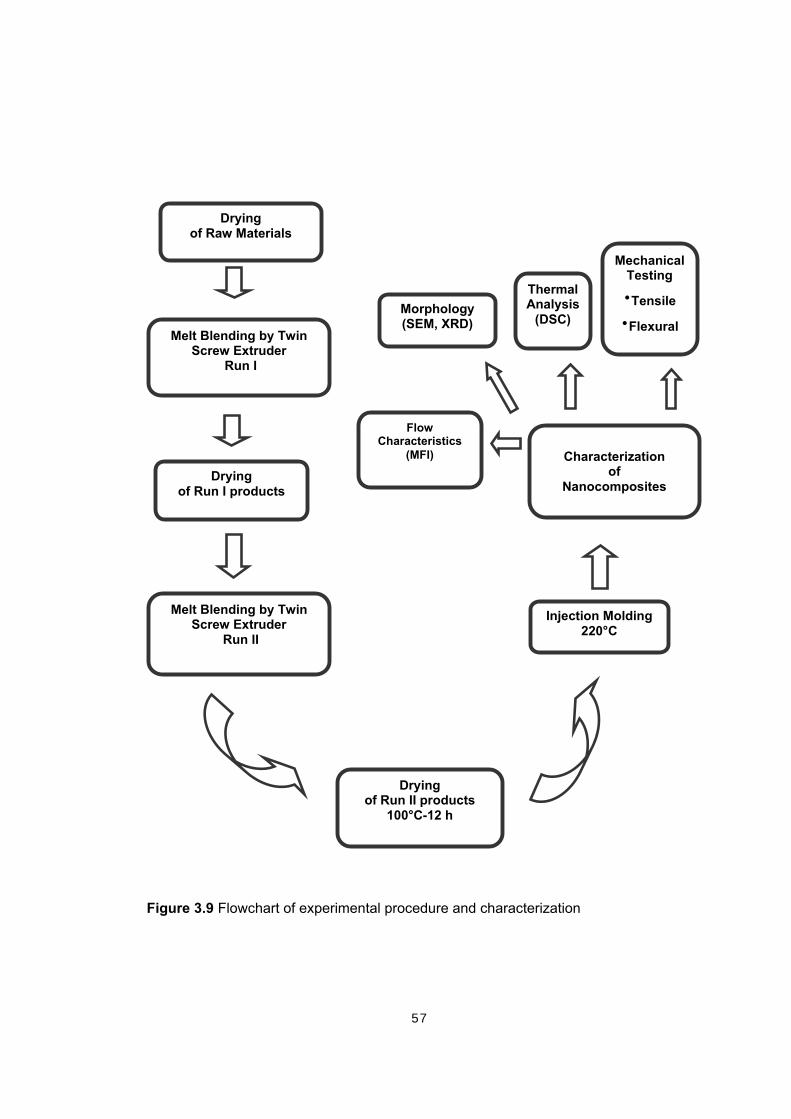
57
Figure 3.9 Flowchart of experimental procedure and characterization
Melt Blending by Twin Screw Extruder
Run I
Drying of Raw Materials
Drying of Run I products
Drying of Run II products
100°C-12 h
Injection Molding 220°C
Characterization
of Nanocomposites
Mechanical Testing
•Tensile
•Flexural
Thermal Analysis
(DSC) Morphology (SEM, XRD)
Flow Characteristics
(MFI)
Melt Blending by Twin Screw Extruder
Run II

58
3.2.4 Extrusion Process
During the extrusion process, temperature profile of the hopper, the mixing zones and
the die was the screw speed, and the total flow rate of feed to extruder barrel were
constant in all experiments. Process temperatures were 170, 210, 210, 210 ,220 °C for
the hopper, the three mixing zones and the die, respectively. The screw speed and
total flow rate of feed were kept constant at 200 rpm and 25 g/min throughout the
experiments. In order to obtain the desired compositions, inlet flow rate of the main-
feeder and the side-feeder were calibrated before each extrusion run. The molten
product obtained from the extruder barrel was cooled by passing through a water bath,
whose temperature was continuously controlled. At the end of the water bath, an air
fan was placed in order to remove the water from the product surface and finally the
product was collected in plastics bags after passing through the pelletizer.
3.2.4.1 Addition Order of Raw Materials
Addition order procedure was varied only in producing LDPE/Lotader®
AX8900/Cloisite® 15A and LDPE/Lotader® 2210/Cloisite® 30B nanocomposites. Four
different addition order procedures were applied to produce these products. The
letters P, Co, and C represent LDPE, compatibilizer, and clay respectively.
Addition Order 1 (CoC)-P
Run I: Compatibilizer pellets were fed to the extruder from the main-feeder and
organoclay was added to the system from the side-feeder. The temperature profile of
this step was determined by considering the process conditions of compatibilizer so it
was different from the other steps. Temperature profile was, 170, 190, 190, 190, 200
°C.
Run II: LDPE and product of Run I were mixed mechanically with desired compositions
and fed to the extruder from the main-feeder.

59
Addition Order 2 (PC)-Co
Run I: LDPE pellets were fed to the extruder from the main-feeder and montmorillonite
was fed from the side-feeder by adjusting the appropriate flow rates.
Run II: Compatibilizer pellets and precompounded LDPE-clay pellets were mixed and
fed to the extruder barrel from the main-feeder.
Addition Order 3 (PCo)-C
Run I: LDPE and compatibilizer pellets were mixed mechanically and fed to the
extruder barrel from the main-feeder with a flow rate of 25 g/min.
Run II: Product of Run I was fed to the system from the main-feeder and organoclay
was added from the side-feeder of extruder.
Addition Order 4 (PCoC)
Run I : LDPE and compatibilizer were mechanically mixed and fed to the extruder
barrel from the main-feeder, meanwhile the organoclay was fed from the side-feeder to
the hopper. Total flow rate of inlet streams was adjusted to 25 g/min.
Run II: Product of Run 1 were fed to the extruder from the main-feeder after dried at
determined conditions.
The reason of performing Run II, in addition order 4, was to prepare all compositions
at the same experimental conditions. Pure LDPE and binary mixtures were also
extruded twice. Table 3.8 summarizes all the addition order procedures and Table 3.9
and 3.10 shows all compositions produced in this study.

60
Table 3.8 Addition order procedures
RUN I RUN II
Addition Order
Main-Feeder Side-Feeder Main-Feeder Side-Feeder
1 (CoC)-P Compatibilizer Organoclay Run I + LDPE
{(CoC) + LDPE} -
2 (PC)-Co LDPE Organoclay
Run I + Compatibilizer
{(PC) +
Compatibilizer}
-
3 (PCo)-C LDPE CompatibilizerRun I + Clay
{(PCo) + Clay} Organoclay
4 (PCoC) LDPE
CompatibilizerClay
Run I
(PCoC) -
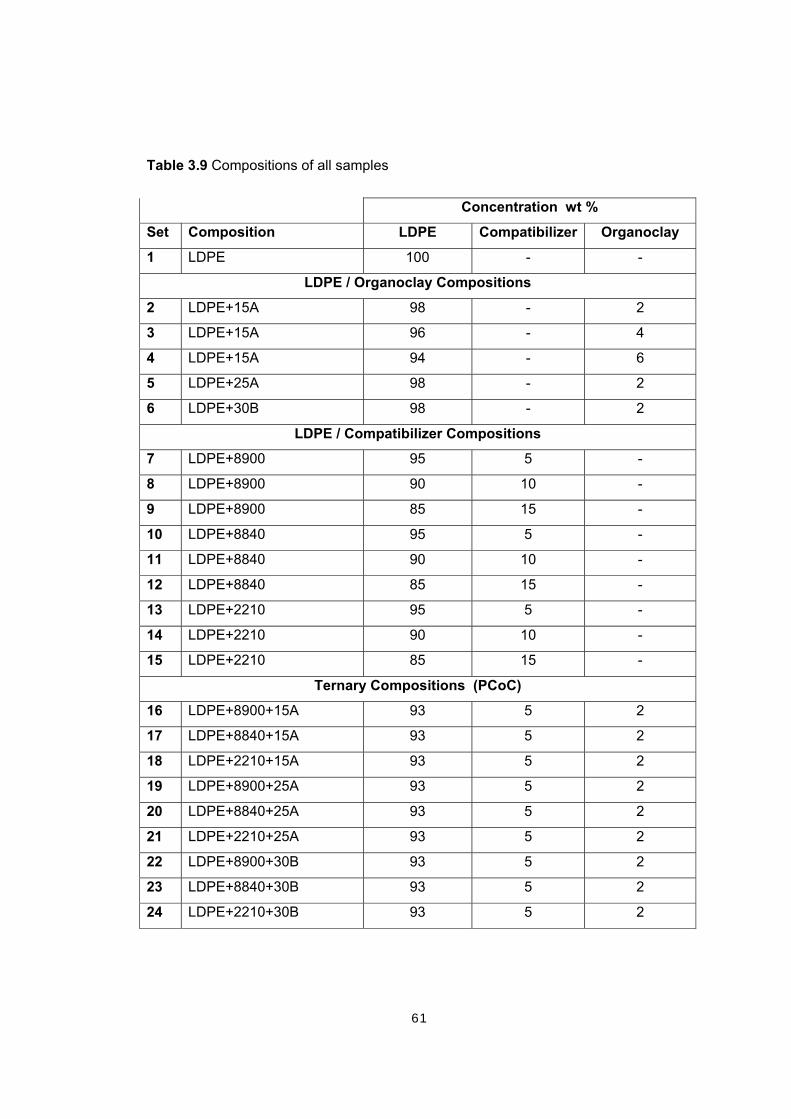
61
Table 3.9 Compositions of all samples Concentration wt %
Set Composition LDPE Compatibilizer Organoclay
1 LDPE 100 - -
LDPE / Organoclay Compositions
2 LDPE+15A 98 - 2
3 LDPE+15A 96 - 4
4 LDPE+15A 94 - 6
5 LDPE+25A 98 - 2
6 LDPE+30B 98 - 2
LDPE / Compatibilizer Compositions
7 LDPE+8900 95 5 -
8 LDPE+8900 90 10 -
9 LDPE+8900 85 15 -
10 LDPE+8840 95 5 -
11 LDPE+8840 90 10 -
12 LDPE+8840 85 15 -
13 LDPE+2210 95 5 -
14 LDPE+2210 90 10 -
15 LDPE+2210 85 15 -
Ternary Compositions (PCoC)
16 LDPE+8900+15A 93 5 2
17 LDPE+8840+15A 93 5 2
18 LDPE+2210+15A 93 5 2
19 LDPE+8900+25A 93 5 2
20 LDPE+8840+25A 93 5 2
21 LDPE+2210+25A 93 5 2
22 LDPE+8900+30B 93 5 2
23 LDPE+8840+30B 93 5 2
24 LDPE+2210+30B 93 5 2

62
Table 3.10 Compositions of all samples (Cont’d)
LDPE / Lotader® AX8900 / Cloisite® 15A
Concentration wt %
AO* LDPE Compatibilizer Organoclay
1 (8900+15A)+LDPE 93 5 2
2 (LDPE+15A)+ 8900 93 5 2
3 (LDPE+8900)+15A 93 5 2
4 LDPE+8900+15A 93 5 2
LDPE / Lotader® AX8900 / Cloisite® 15A
Concentration wt %
AO* LDPE Compatibilizer Organoclay
1 (8900+15A)+LDPE 88 10 2
2 (LDPE+15A)+ 8900 88 10 2
3 (LDPE+8900)+15A 88 10 2
4 LDPE+8900+15A 88 10 2
LDPE / Lotader® 2210 / Cloisite® 30B
Concentration wt %
AO* LDPE Compatibilizer Organoclay
1 (2210+30B)+LDPE 93 5 2
2 (LDPE+30B)+ 2210 93 5 2
3 (LDPE+2210)+30B 93 5 2
4 LDPE+2210+30B 93 5 2
* AO: Addition order
3.2.5 Specimen Preparation
The specimens for characterization were molded by injection molding process. The
molding conditions are summarized in Table 3.11.

63
Table 3.11 Molding parameters for injection molding
Parameter Unit Value
Nozzle Temperature °C 220
Mold Temperature °C 30
Fill Time sec 30
Hold Time min 1
Injection Speed - Fast
Injection Pressure bar 8
3.3 Characterization of Specimens
In order to investigate the effect of the composition of raw materials, compatibilizer
type, montmorillonite type, and addition order of materials during melt blending
process on the final properties of the nanocomposites, morphological, thermal,
mechanical analysis and flow characteristics were determined.
3.3.1 Morphological Analysis 3.3.1.1 X-Ray Diffraction (XRD) Analysis
The composites containing organoclay were analyzed by using a Philips PW3710
based X-Ray diffractometer. Cu-K anode radiation, generated at a generator tension of
40 kV and a generator current of 55 mA was used as the X-Ray source. The diffraction
patterns were collected at a diffraction angle 2θ from 1° to 10° at a scanning rate and
step size of 3°/min and 0.02°, respectively. The samples for X-Ray diffraction analysis
were obtained from molded specimens.

64
3.3.1.2 Scanning Electron Microscopy (SEM) Analysis
Scanning electron microscopy (SEM) analysis was performed by a JEOL JSM-6400
low voltage scanning electron microscope. The fractured surfaces were obtained by
using liquid nitrogen for all samples. Before SEM photographs were taken, the
fractured surfaces were coated with a thin layer of gold in order to obtain a conductive
surface. SEM photographs were taken for each specimen at x250 and x3000
magnifications. This analysis was used to investigate the effect of compatibilizer and
organoclay on the morphology of the nanocomposites.
3.3.2 Thermal Analysis
3.3.2.1 Differential Scanning Calorimetry (DSC) Analysis
Differential scanning calorimetry was performed by using a differential scanning
calorimeter General V4.1.C DuPont 2000. Measurements were carried out in the
temperature range of 30 °C to 180 °C with a heating rate of 10 °C/min under nitrogen
atmosphere. Melting points of samples and the degree of crystallinity was determined
by using the DSC curves. The heat of fusion (ΔH ) value for 100 % crystalline LDPE
was taken as 293 J/g [15].
3.3.3 Mechanical Analysis
Tensile tests and flexural tests were performed at room temperature in the laboratory.
At least six samples were used for each composition set and average values of test
results and standard deviation values were recorded. At the end of the tests, tensile
strength, tensile modulus, strain at break, flexural strength and flexural modulus of
each composition were evaluated according to ASTM standards.

65
3.3.3.1 Tensile Tests
Tensile tests were performed for each composition according to ASTM D638M-91a
(Standard Test Method for Tensile Properties of Plastics) [56], by using a Lloyd LR 30
K Universal Testing machine. The shape and dimensions of the specimens are given
in Figure 3.10 and Table 3.12 respectively.
DLo
T W
Figure 3.10 ASTM Tensile test specimen
Table 3.12 Dimensions of tensile test specimen
Symbol Specimen Dimensions (mm)
W, Width of narrow section 7.5
D, Distance between grips 80
L0,Total length of specimen 110
T, Thickness of specimen 2.1
The crosshead speed was calculated as 8 mm/min, based on the gauge length of 80
mm and strain rate of 0.1 min-1. The test was performed by pulling the specimens
from both grips until it fails. Stress versus strain diagrams were obtained from the
mechanical testing device and tensile strength, tensile modulus and elongation at
break values were determined by using these graphs.
66
3.3.3.2 Flexural Tests
Flexural tests were performed according to Test Method – I Procedure of ASTM
D790M-92 (Standard Test Methods for Flexural Properties of Unreinforced Plastics
and Electrical Insulating Materials) [59], with LR 30 K Universal Testing machine.
Molded specimens were used for flexural tests and the thickness and width of
specimens were the same as the tensile test specimens. The support span was taken
as 50 mm, strain rate was 0.1 min-1 and the rate of cross-head was calculated as
19.84 mm/min. There was no failure of flexural test specimens so the tests were
stopped when the specimens leaned against the base of the supports.
3.3.4 Flow Characteristics 3.3.4.1 Melt Flow Index (MFI) Test
Melt flow index (MFI) test was performed according to ASTM D1238-79 using an
Omega Melt Flow Indexer. The measurements were carried out at 270 °C with a load
of 2.16 kg. The weight of sample passing through the die in 10 min, defined as melt
index, was determined for all compositions. The results were recorded as grams/10
min. The melt flow index machine used in this study is shown in Figure 3.11.
Figure 3.11 Omega Melt Flow Indexer

67
CHAPTER 4
RESULTS AND DISCUSSION
4. 1 Morphological Analysis Two complementary techniques, XRD and SEM analysis, have been performed in
order to characterize the morphology of nanocomposite structures.
4.1.1 X-Ray Diffraction (XRD)Analysis
XRD analysis is a convenient method for determining the crystal structure of the
nanocomposites. Phase separated, intercalated and exfoliated structures can be
identified according to the position, shape and intensity of the basal reflections from
the silicate layers. The basal spacing (d-spacing) from XRD measurement refers to
interlayer spacing of the silicate layers and calculated at peak positions according to
Bragg’s law.
In the case of phase separated composites, the polymer matrix is unable to enter into
the clay galleries which result in no change in basal spacing. The increased basal
spacing, (d001), arises from the expansion of the interlayer space due to the entrance of
polymer matrix into the clay galleries pushing the platelets apart, as a result, the
intercalated nanocomposites can be distinguished from the difference in basal spacing
[61]. When the absence of diffraction peak is observed, that means the clay platelets
are completely delaminated and exfoliated nanocomposites are obtained. However,
the lack of a Bragg’s peak in the diffraction pattern does not necessarily mean that the
clay is exfoliated. A disordered and immiscible sample, or other factors like low
concentration of the clay in the region where the x-ray beam hits a non-uniformly
dispersed sample, could fail to produce a Bragg’s reflection [63].

68
XRD analysis was performed by setting the starting angle to 2θ = 1° in order to
determine the d-spacings greater than 45 Å. Performing the analysis, at angle (2θ),
greater than 2° will result in a false conclusion since no diffraction peak situation will
be thought as complete exfoliation of the clay layers. The d-spacing values of samples
obtained from the XRD analysis are given in Table 4.1 and the output X-ray figures are
given in Appendix A.
Table 4.1 X-ray diffraction results of samples
Composition Organoclay
wt % d- spacing (Å) 2 theta(°)
Pure Materials
LDPE - - -
Cloisite® 15A - 31.9 2.76
Cloisite® 25A - 20.1 4.39
Cloisite® 30B - 17.9 4.92
LDPE / Organoclay Compositions
LDPE+15A 2 33.3 2.65
LDPE+15A 4 30.4 2.90
LDPE+15A 6 29.9 2.95
LDPE+25A 2 28.5 3.09
LDPE+30B 2 18.80 4.70
Ternary Compositions (PCoC)*
LDPE+8900+15A 2 40.3 2.19
LDPE+8840+15A 2 34.6 2.55
LDPE+2210+15A 2 32.8 2.69
LDPE+8900+25A 2 38.3 2.31
LDPE+8840+25A 2 37.4 2.36
LDPE+2210+25A 2 53.5 1.65
LDPE+8900+30B 2 59.2 1.49
LDPE+8840+30B 2 44.1 2.10
LDPE+2210+30B 2 54.8 1.61
* Ternary nanocomposites contain 5 wt % compatibilizer.

69
The basal spacings of neat organoclays were determined as 31.9 Å at 2θ= 2.76 °, 20.1
Å at 2θ= 4.39°, and 17.9 Å at 2θ= 4.92° for Cloisite® 15A, Cloisite® 25A and Cloisite®
30B respectively and all are in accordance with the values of basal spacings reported
in the manufacturer’ s datasheet.
No increase was observed in the interlamellar distance of silicate layers of
nanocomposites containing only 15A with the compositions of 2 wt %, 4 wt %, and 6
wt % organoclay. However, the maximum intensity of the diffraction peaks increased
sharply with increase in clay content from 2 wt % to 6 wt %. The increase in intensity is
due to the high concentrations of ordered structures in the nanocomposites at high
organoclay contents. In addition to these, it was seen that the increase in organoclay
content also resulted in a slight decrease in basal spacing of the layers. It is easier to
disrupt the stacking structure of organoclay at low concentrations during the melt
blending. So the decrease in d- spacing of the layers is more likely because of the
non-uniform dispersion and agglomeration of clay particles which hinder the
penetration of polymer in to the clay galleries. It is concluded that the insertion of
LDPE was not achieved with melt blending of LDPE and organoclay 15A and the
obtained structures were not intercalated or exfoliated.
Among the LDPE and organoclay nanocomposites, the one containing 2 wt % 25A
that has the peak at 3.09° in the XRD pattern, indicating the intercalated nanostructure
of LDPE/25A nanocomposite with a maximum basal spacing of 28.5 Å. In the XRD
pattern, it is seen that there is a broader peak between the ranges of 3.1° and 5.1° with
basal spacings of 28.5 Å and 17.4 Å respectively. This shows that there are several
intercalated structures with different basal spacings, which were formed during the
insertion of the polymer throughout the clay galleries and resulted in more disordered
structures [61]. However it was not possible to obtain complete delamination of
platelets.
As in the case of LDPE/15A nanocomposites, the basal spacing of the silicate layers
of organoclay 30B was unchanged, indicating that no intercalation occurred during the
melt blending.

70
In the diffractograms of nanocomposites, secondary and tertiary peaks were also
observed at high angles, and so having d-spacing values smaller than the neat
organoclay’s basal spacing. These peaks belong to the unintercalated organoclay.
During the melt blending process, the alkyl chains of the organoclay get rearranged
and due to the breakup of the electrostatic interaction between the alkyl ammonium
and the negative charge of the silicate surface decrease in basal spacing occurs [62].
4.1.1.1 Effect of Compatibilizer
In this study all clay types were organically modified. The alkyl chains provide an
additional distance between the interlayer of the layered silicates which makes it easy
for polymer matrix to enter into the clay galleries. However, it is seen that this is not
sufficient to obtain complete dispersion and delamination of layers of organoclay
throughout the polymer matrix.
From Table 4.1, it is seen that addition of 5 wt % compatibilizer to the
LDPE/organoclay blends resulted in a shift to lower angles of the characteristic
diffraction peaks of the neat organoclay and LDPE/organoclay blends indicating a
more substantial difference in the interlayer spacing of the clay layers. The results are
compatible with the results reported in the literature about the effect of compatibilizer
on polyolefin/clay nanocomposites [6-16].
Compatibilizers used in this study are polyethylene based therefore they are miscible
with the polymer matrix of the nanocomposites and they contain functional groups of
GMA, or MAH. It is possible that there are some reactions occurring between the
functional groups of the compatibilizers and the hydroxyl groups of the montmorillonite.
Moreover this results in the intercalation of the compatibilizer into the clay galleries
and increases the possibility of the delamination of the clay structure. Also the
organoclay 30B contains hydroxyl groups in its structure which provide the reaction
possibility with functional groups of compatibilizers.
Since the compatibilizers have bulky functional groups such as GMA, and MAH this
also increases the clay spacing and decreases the interaction between the clay layers

71
and enhance the intercalation of the polymer matrix. The polar structure of
compatibilizers also increases the interaction between the organoclay and the polymer
matrix and so favor the increase in intercalation and exfoliation [4].
Considering the LDPE/compatibilizer/15A nanocomposites, the one with compatibilizer
8900 (E-MA-GMA), has the diffraction peak at angle 2.19 ° showing that the interlayer
spacing is 40.3 Å. On the other hand, XRD results of other two nanocomposites
containing compatibilizer 8840 (E-GMA), and 2210 (E-nBA-MAH) show a slight
increase in layer distance.
The effect of compatibilizer on the dispersion of silicate layers was observed in the
case of the LDPE/compatibilizer/25A nanocomposites. XRD pattern of nanocomposite
containing E-MA-GMA, showed a sharp peak at angle 2.31° and a broader one at
4.96° with the basal spacings of 38.3 Å and 17.78 Å, which indicates that the
nanocomposite have an intercalated structure, however, some of the organoclay still
kept its original stacking. XRD curve of nanocomposites containing E-GMA showed
two broaden peaks at 2.36° and 5.0° with the resultant basal spacings of 37.4 Å and
17.65 Å which are the evidences of the intercalated structures. Even better dispersion
was achieved with the nanocomposite containing E-nBA-MAH. There is a very broad
peak at the position of 1.65°, corresponding to the interlayer distance 53.5 indicating
that the organoclay has been significantly intercalated in the LDPE/2210/25A system.
Among all compositions, the best dispersion was achieved with
LDPE/compatibilizer/30B nanocomposites. The interlayer spacings were determined
as 59.2 Å, 44.1 Å, and 54.8 Å for nanocomposites containing E-MA-GMA, E-GMA,
and E-nBA-MAH, respectively. Also there were basal reflection peaks around 6°
indicating unintercalated clay layers.

72
4.1.1.2 Effect of Addition Order
X-ray diffraction analysis was performed for LDPE/8900/15A, and LDPE/2210/30B
nanocomposites obtained through different addition orders. The XRD results are given
in Table 4.2.
Table 4.2 X-ray diffraction results of nanocomposites produced with different addition
order sequences.
Composition Organoclay
wt % d- spacing (Å) 2 theta(°)
LDPE + 8900+ 15A Compositions *
AO1 (CoC)+P 2 39.6 2.23
AO2 (P+C)+Co 2 42.5 2.07
AO3 (P+Co)+C 2 40.8 2.16
AO4 (PCoC) 2 40.3 2.19
LDPE + 2210+ 30B Compositions *
AO1 (CoC)+P 2 14.7 5.98
AO2 (P+C)+Co 2 15.01 5.89
AO3 (P+Co)+C 2 15.07 5.86
AO4 (PCoC) 2 54.8 1.61
* Ternary nanocomposites contain 5 wt % compatibilizer.
Table 4.2 shows that, for LDPE/8900/15A nanocomposites, the peak of
montmorillonite apparently shifts to a small angle in all the addition order sequences.
All samples have diffraction peak around 2.15°, with corresponding basal spacing of
40.8 Å, indicating that intercalated nanocomposites were acquired. On the other hand,
there is no a similar trend for LDPE/2210/30B nanocomposites. The XRD curve of
nanocomposites obtained with AO4 sequence shows intercalated structure with a
diffraction peak at 1.61°, which leads in basal spacing of 54.8 Å. In addition to these
there is a broader peak at around 5.8° which is due to unintercalated clay layers.

73
The AO2 (PC-Co) type nanocomposite has a sharp peak at 5.89°. It can be concluded
that these nanocomposites failed to have intercalated structures. Also agglomerates of
clay particles are seen in SEM analysis in these nanocomposites. The other two
nanocomposite types have also a broader peak at angle 5.8°, indicating the
unintercalated structures.
4.1.2 Scanning Electron Microscopy (SEM) Analysis In this study, the mixtures of polymer/organoclay, polymer/compatibilizer, and
polymer/compatibilizer/organoclay have been obtained by means of twin screw
extrusion process. In order to investigate the morphological properties of these
samples, scanning electron microscopy analysis was performed to fractured surfaces
of all samples produced. SEM images of these samples are presented here with
magnifications of x250 and x3000 to provide better observation.
The SEM micrographs of ternary nanocomposites designate that compatibilizer has an
important role in dispersion of the clay throughout the polymer LDPE matrix, which
results in improved mechanical properties.
Figure 4.1 shows the fractured surfaces of twice extruded LDPE at magnifications of
x250 and x3000. It is seen that LDPE has a smooth surface and few crack propagation
lines are observed.

74
Figure 4.1 SEM micrographs of pure Low Density Polyethylene (LDPE) (a) x250
(b) x3000.
Figure 4.2 shows the fractured surfaces of nanocomposites containing 2, 4, and 6
percent of Cloisite® 15A. It is seen that addition of organoclay to neat polymer results
in the disappearance of the smooth surface. In Figure 4.2 (a) and 4.2 (b) the crack
propagation lines of 2 wt % organoclay containing nanocomposite can clearly be seen
at x250 and x3000 magnifications. These are straight propagation lines and due to this
homogeneous structure, there are no significant barriers to stop the crack propagation.
The collinear position of crack lines enhances the crack growth so it is possible to
obtain fracture with only small amounts of energy [49].
In Figure 4.2, it is observed that the crack propagation lines are approaching a shorter
and closer structure with increasing clay loading and instead of being straight lines,
they are more zigzagged and tortuous. These tortuous paths prevent the easy
propagation of the cracks. Generally, as the distance between the crack lines is
smaller the material can endure high impact stresses.
Figure 4.3 and 4.4 show the fractured surfaces of nanocomposites containing 2 weight
% of Cloisite® 25A and Cloisite® 30B respectively. The surfaces of these
nanocomposites are similar and both have tortuous crack propagation path.
(a) (b)
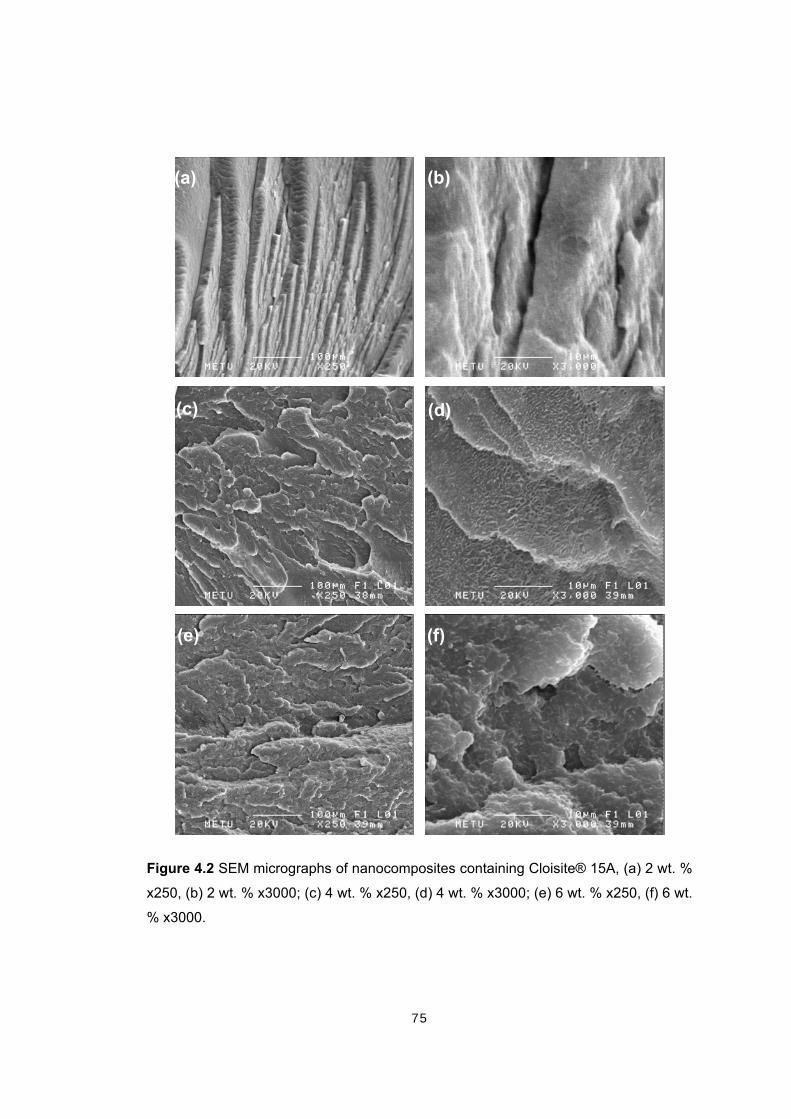
75
Figure 4.2 SEM micrographs of nanocomposites containing Cloisite® 15A, (a) 2 wt. %
x250, (b) 2 wt. % x3000; (c) 4 wt. % x250, (d) 4 wt. % x3000; (e) 6 wt. % x250, (f) 6 wt.
% x3000.
(a) (b)
(d)(c)
(e) (f)

76
Figure 4.3 SEM micrographs of nanocomposites containing Cloisite® 25A, (a) 2 wt. %
x250, (b) 2 wt. % x3000.
Figure 4.4 SEM micrographs of nanocomposites containing Cloisite® 30B, (a) 2 wt. %
x250, (b) 2 wt. % x3000.
In Figures 4.5, 4.6, and 4.7 SEM micrographs of LDPE/ E-MA-GMA, LDPE/E-GMA,
and LDPE/E-nBA-MAH blends with varying compatibilizer concentrations are shown at
magnifications of x250, and x3000 respectively. Although the compatibilizer
concentration is increased, no remarkable difference was observed in the morphology
of LDPE/compatibilizer blends. The continuous and interpenetrated phases seen in the
micrographs indicating that the compatibilizers are compatible with LDPE.
(a) (b)
(a) (b)

77
Figure 4.5 SEM micrographs of LDPE/ compatibilizer blends containing Lotader® AX
8900 (E-MA-GMA) (a) 5 wt. % x250, (b) 5 wt. % x3000; (c) 10 wt. % x250, (d) 10 wt. %
x3000; (e) 15 wt. % x250, (f) 15 wt. % x3000.
(a) (b)
(c) (d)
(e) (f)

78
Figure 4.6 SEM micrographs of LDPE/compatibilizer blends containing Lotader® AX
8840 (E-GMA) (a) 5 wt. % x250, (b) 5 wt. % x3000; (c) 10 wt. % x250, (d) 10 wt. %
x3000; (e) 15 wt. % x250, (f) 15 wt. % x3000.
(a) (b)
(d)(c)
(f)(e)

79
Figure 4.7 SEM micrographs of LDPE/compatibilizer blends containing Lotader® 2210
(E-BA-MAH) (a) 5 wt. % x250, (b) 5 wt. % x3000; (c) 10 wt. % x250, (d) 10 wt. %
x3000; (e) 15 wt. % x250, (f) 15 wt. % x3000.
(d)(c)
(e) (f)
(a) (b)

80
Figure 4.8, 4.9 and 4.10 are SEM micrographs of the fractured surfaces of ternary
LDPE/compatibilizer/organoclay nanocomposites containing 5 weight percent
compatibilizer and 2 weight percent organoclay, prepared by AO4 sequence in which
all the materials were fed to extruder simultaneously at first run. It is seen that the
crack propagation lines of nanocomposite surfaces are not straight lines and the
smooth structure of neat LDPE is not detected in these SEM micrographs. In the case
of well dispersed layered silicates, many shorter and closer, circular, nonlinear , cracks
are formed simultaneously and these nonlinear cracks tend to grow until they interfere
with each other. At these points, the stress fields at the tips of the crack lines interact
and prevent the further growth or cracks by reducing the stress at the tips of the cracks
[49]. When compared with SEM micrographs of LDPE/organoclay nanocomposites,
addition of compatibilizer resulted in more miscible surfaces. The improved
mechanical properties of ternary nanocomposites also support the compatibility of the
phases and well dispersion of the clay particles.
When considering Figure 4.9 (a) and 4.9 (b), it is seen that agglomerates of clay
particles are present on the surfaces. These agglomerates act as stress concentrator
in the structure and lead in low mechanical properties of nanocomposites.
In the previous section, intercalation/exfoliation of the clay was discussed by using the
XRD curves of the samples. However, a more powerful technique like transmission
electron microscopy (TEM) analysis should be performed to obtain more precise
observation of nanostructures, owing to high resolution obtained by TEM.

81
Figure 4.8 SEM micrographs of nanocomposites produced with AO4 sequence,
containing 2 wt. % Cloisite® 15A and 5 wt. % compatibilizer, (a) Lotader® AX 8900
x250, (b) Lotader® AX8900 x3500; (c) Lotader® AX8840 x250, (d) Lotader® AX 8840
x3000; (e) Lotader® 2210 x250, (f) Lotader® 2210 x3000.
(a) (b)
(c) (d)
(e) (f)

82
Figure 4.9 SEM micrographs of nanocomposites produced with AO4 sequence,
containing 2 wt. % Cloisite® 25A and 5 wt. % compatibilizer, (a) Lotader® AX 8900
x250, (b) Lotader® AX8900 x3000; (c) Lotader® AX8840 x250, (d) Lotader® AX 8840
x3000; (e) Lotader® 2210 x250, (f) Lotader® 2210 x3000.
(d)
(b)(a)
(c)
(e) (f)

83
Figure 4.10 SEM micrographs of nanocomposites produced with AO4 sequence,
containing 2 wt. % Cloisite®30B and 5 wt. % compatibilizer, (a) Lotader® AX
8900x250, (b) Lotader® AX8900 x3000; (c) Lotader® AX8840 x250, (d) Lotader® AX
8840 x3000; (e) Lotader® 2210 x250, (f) Lotader® 2210 x3000.
(b)(a)
(c) (d)
(e) (f)

84
Figures 4.11 through 4.16 show the SEM micrographs of ternary nanocomposites
prepared by different addition order. No significant differences were observed in the
morphology of fractured surfaces. It is obviously seen that the surfaces are highly
rough and the crack propagation lines are tortuous. The cracks are not far apart from
each other.
The agglomerates of organoclay particles are clearly seen in Figure 4.13 (c), 4.13 (d),
4.15 (c), and 4.15 (d). Dispersion of clay particles was not achieved during melt
blending of these nanocomposites. As expected, the mechanical properties of these
samples are very poor.

85
Figure 4.11 SEM micrographs of nanocomposites produced with different addition
order sequences, containing 2 wt. % Cloisite® 15A and 5 wt. % Lotader® AX8900; (a)
AO1 x250, (b) AO1 x3000 ; (c) AO2 x250, (d) AO2 x3000.
(a) (b)
(c) (d)

86
Figure 4.12 SEM micrographs of nanocomposites produced with different addition
order sequences, containing 2 wt. % Cloisite® 15A and 5 wt. % Lotader® AX8900; (a)
AO3 x250, (b) AO3 x3000 ; (c) AO4 x250, (d) AO4 x3500.
(a) (b)
(d)(c)
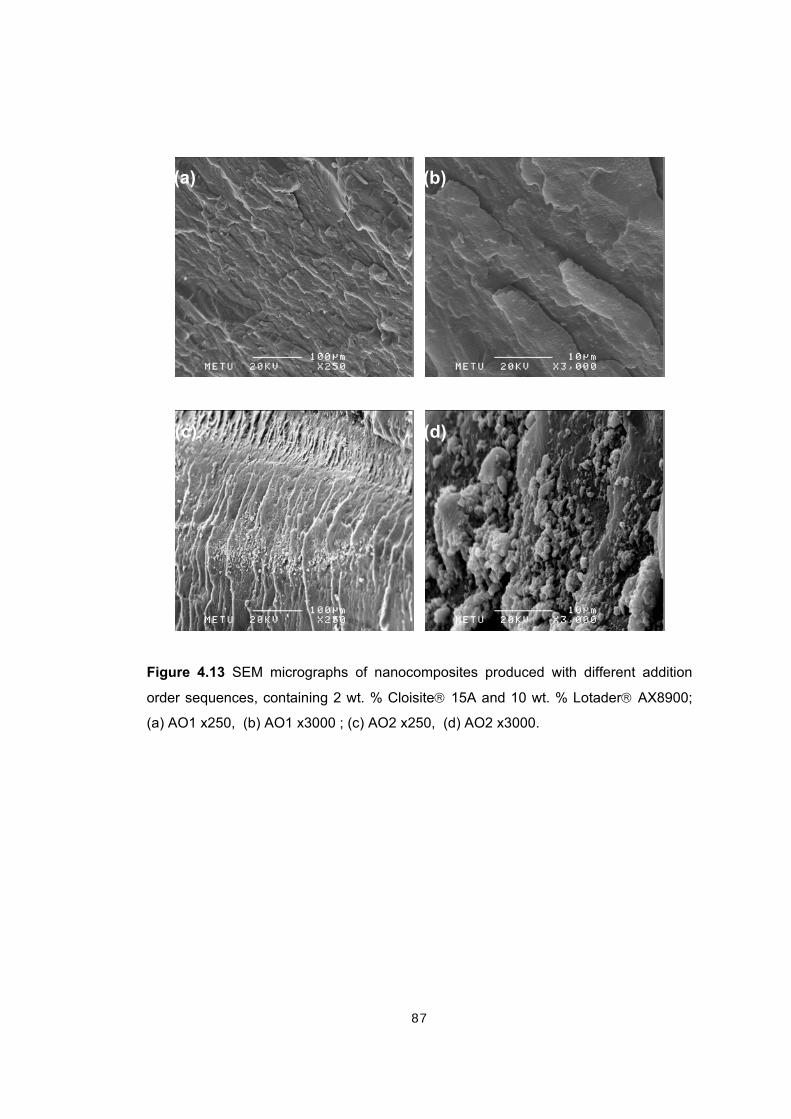
87
Figure 4.13 SEM micrographs of nanocomposites produced with different addition
order sequences, containing 2 wt. % Cloisite® 15A and 10 wt. % Lotader® AX8900;
(a) AO1 x250, (b) AO1 x3000 ; (c) AO2 x250, (d) AO2 x3000.
(b)(a)
(c) (d)

88
Figure 4.14 SEM micrographs of nanocomposites produced with different addition
order sequences, containing 2 wt. % Cloisite® 15A and 10 wt. % Lotader® AX8900;
(a) AO3 x250, (b) AO3 x3000 ; (c) AO4 x250, (d) AO4 x3000.
(b)(a)
(c) (d)

89
Figure 4.15 SEM micrographs of nanocomposites produced with different addition
order sequences, containing 2 wt. % Cloisite® 30B and 5 wt. % Lotader® 2210 ; (a)
AO1 x250, (b) AO1 x3000 ; (c) AO2 x250, (d) AO2 x3000.
(a) (b)
(c) (d)

90
Figure 4.16 SEM micrographs of nanocomposites produced with different addition
order sequences, containing 2 wt. % Cloisite® 30B and 5 wt. % Lotader® 2210 ; (a)
AO3 x250, (b) AO3 x3000 ; (c) AO4 x250, (d) AO4 x3000.
(a) (b)
(c) (d)
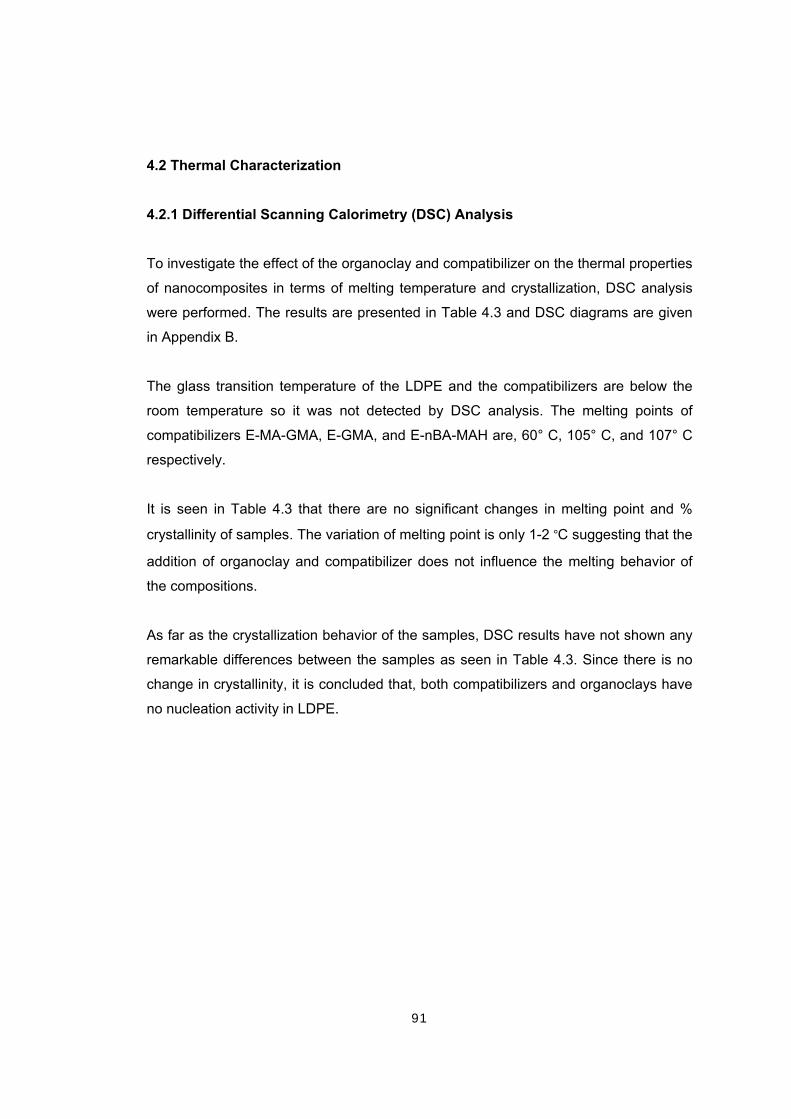
91
4.2 Thermal Characterization 4.2.1 Differential Scanning Calorimetry (DSC) Analysis
To investigate the effect of the organoclay and compatibilizer on the thermal properties
of nanocomposites in terms of melting temperature and crystallization, DSC analysis
were performed. The results are presented in Table 4.3 and DSC diagrams are given
in Appendix B.
The glass transition temperature of the LDPE and the compatibilizers are below the
room temperature so it was not detected by DSC analysis. The melting points of
compatibilizers E-MA-GMA, E-GMA, and E-nBA-MAH are, 60° C, 105° C, and 107° C
respectively.
It is seen in Table 4.3 that there are no significant changes in melting point and %
crystallinity of samples. The variation of melting point is only 1-2 °C suggesting that the
addition of organoclay and compatibilizer does not influence the melting behavior of
the compositions.
As far as the crystallization behavior of the samples, DSC results have not shown any
remarkable differences between the samples as seen in Table 4.3. Since there is no
change in crystallinity, it is concluded that, both compatibilizers and organoclays have
no nucleation activity in LDPE.

92
Table 4.3 DSC analysis results of samples
Composition ΔH(J/g) LDPE wt % % crystallinity Tm (°C)
LDPE 79.47 100 0.27 112.18
LDPE+15A* 79.65 98 0.28 111.71
LDPE+25A* 79.05 98 0.28 111.86
LDPE+30B* 83.46 98 0.29 112.43
LDPE+8900** 83.24 95 0.30 110.88
LDPE+8840** 80.25 95 0.29 111.20
LDPE+2210** 80.76 95 0.29 110.81
LDPE+8900+15A*** 73.13 93 0.27 112.11
LDPE+8840+15A*** 75.02 93 0.28 114.47
LDPE+2210+30B*** 79.17 93 0.29 111.33
* organoclay concentration is 2 wt %.
** compatibilizer concentration is 5 w %.
*** organoclay concentration is 2 wt % & compatibilizer concentration is 5 wt%.
4.3 Mechanical Analysis In order to investigate the effects of the compatibilizer type, organoclay type,
concentration of materials and addition order of materials on the mechanical properties
of the produced nanocomposites, tensile and flexural tests were performed using
injection molded specimens.
4.3.1 Tensile Properties
Stress – strain curves provide information about the response of the materials to
applied stress during the tensile tests. In this study mechanical behavior of the binary
compositions was also determined to be able to examine the effect of the third
component added to the system.

93
Figure 4.17 and 4.18 represent the stress-strain curves of pure LDPE and
LDPE/organoclay nanocomposites. As it is seen from the Figure 4.17 the virgin LDPE
is very ductile at a test rate of 8mm/min. The area under the curve is the measure of
the energy necessary to break the material. Addition of the organoclay to the virgin
LDPE makes it more brittle and decreases the energy required to break it. Moreover,
the decrease in the ultimate strain due to the increase in the clay content is clearly
observed from the Figure 4.17. So with increasing clay content the ductility decreases
gradually. For example, addition of only 2 wt % of Cloisite 30B resulted in decrease of
the ultimate strain from 40 % to 20 % is observed in Figure 4.18.
Stress-strain curves of LDPE/compatibilizer blends and ternary nanocomposites of
LDPE/compatibilizer/organoclay are given in Figures 4.19 through 4.24. Considering
the blends, increase in compatibilizer concentration results in lower ultimate stress and
toughness for blends containing E-MA-GMA, and E-GMA. On the other hand there
was no a straight forward trend for blends containing the E-nBA-MAH. According to
Figures 4.22, 4.23 and 4.24, it was concluded that compatibilizer not only favors the
opening the platelets of the organoclay, and good adhesion to LDPE, but it also
toughens the polymer matrix.
Effect of addition order on stress-strain behavior of the nanocomposites is shown in
Figure 4.25. In comparison to the neat LDPE, AO1 (CoC)P, and AO3 (PCo)C, have
shown almost the same response in tensile test. On the other hand AO2 (PC)Co, and
AO4 (PCoC), showed improvement in toughness, and ultimate stress of the material.

94
0
10
20
30
0 10 20 30 40 50
Strain ( % )
Stre
ss (M
Pa)
Pure LDPE2 wt %4 wt %6 wt %
Figure 4.17 The stress-strain curves of LDPE/organoclay nanocomposites with
different Cloisite® 15A content.
0
10
20
30
0 10 20 30 40 50Strain ( % )
Stre
ss (M
Pa)
Pure LDPE15A25A30B
Figure 4.18 The stress-strain curves of LDPE/organoclay nanocomposites containing
2 wt % of different organoclay types.

95
0
10
20
0 10 20 30 40 50Strain ( % )
Stre
ss (M
Pa)
Pure LDPE5 wt %10 wt %15 wt %
Figure 4.19 The stress-strain curves of LDPE/compatibilizer blends containing
different amounts of E-MA-GMA.
0
10
20
0 10 20 30 40 50
Strain ( % )
Stre
ss (M
Pa)
Pure LDPE5 wt %10 w %15 wt %
Figure 4.20 The stress-strain curves of LDPE/compatibilizer blends containing
different amounts of E-GMA.

96
0
10
20
30
0 10 20 30 40 50
Strain ( % )
Stre
ss (M
Pa)
Pure LDPE
5 wt %
10 wt %
15 wt %
Figure 4.21 The stress-strain curves of LDPE/compatibilizer blends containing
different amounts of E-nBA-MAH.
0
10
20
30
0 10 20 30 40 50
Strain ( % )
Stre
ss (M
Pa)
Pure LDPE15A25A30B
Figure 4.22 The stress-strain curves of LDPE / E-MA-GMA / organoclay
nanocomposites containing 5 wt % of E-MA-GMA and 2 wt % of organoclay.

97
0
10
20
30
0 10 20 30 40 50
Strain ( % )
Stre
ss (M
Pa)
Pure LDPE15A25A30B
Figure 4.23 The stress-strain curves of LDPE / E- GMA / organoclay nanocomposites
containing 5 wt % of E-GMA and 2 wt % of organoclay.
0
10
20
30
0 10 20 30 40 50
Strain ( % )
Stre
ss (M
Pa)
Pure LDPE15A25A30B
Figure 4.24 The stress-strain curves of LDPE/E-nBA-MAH/organoclay
nanocomposites containing 5 wt % of E-nBA-MAH and 2 wt % of organoclay.
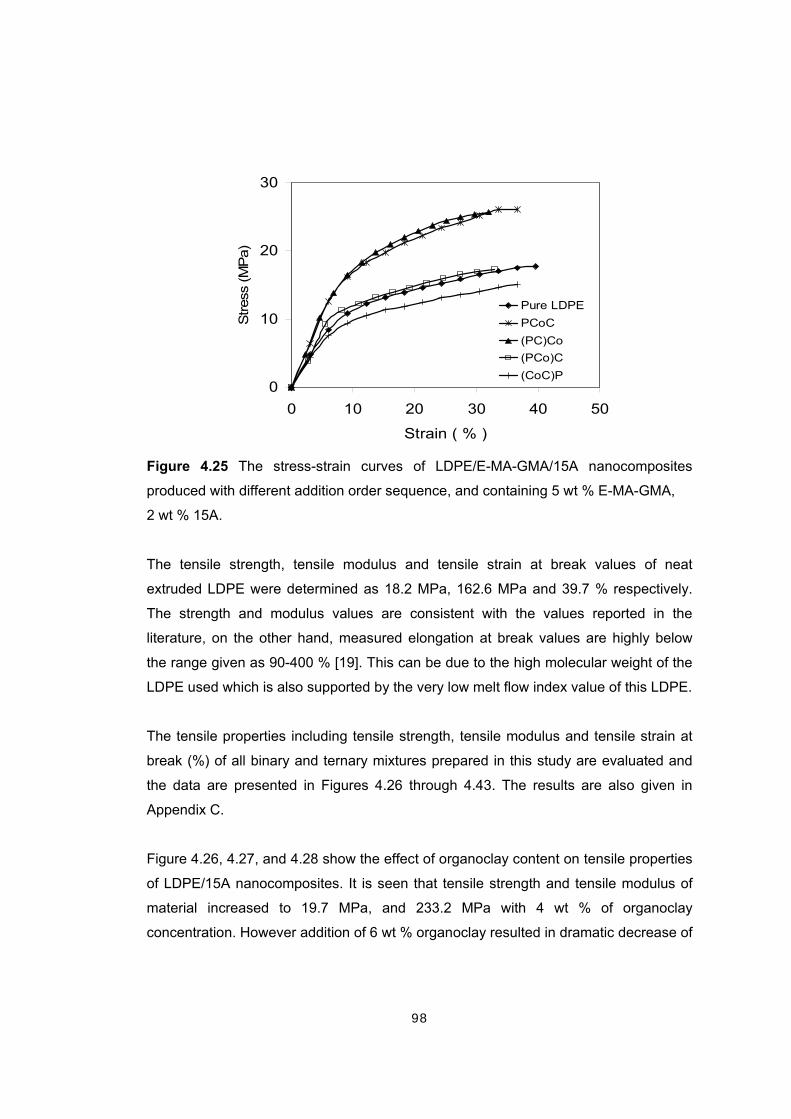
98
0
10
20
30
0 10 20 30 40 50
Strain ( % )
Stre
ss (M
Pa)
Pure LDPEPCoC(PC)Co(PCo)C(CoC)P
Figure 4.25 The stress-strain curves of LDPE/E-MA-GMA/15A nanocomposites
produced with different addition order sequence, and containing 5 wt % E-MA-GMA,
2 wt % 15A.
The tensile strength, tensile modulus and tensile strain at break values of neat
extruded LDPE were determined as 18.2 MPa, 162.6 MPa and 39.7 % respectively.
The strength and modulus values are consistent with the values reported in the
literature, on the other hand, measured elongation at break values are highly below
the range given as 90-400 % [19]. This can be due to the high molecular weight of the
LDPE used which is also supported by the very low melt flow index value of this LDPE.
The tensile properties including tensile strength, tensile modulus and tensile strain at
break (%) of all binary and ternary mixtures prepared in this study are evaluated and
the data are presented in Figures 4.26 through 4.43. The results are also given in
Appendix C.
Figure 4.26, 4.27, and 4.28 show the effect of organoclay content on tensile properties
of LDPE/15A nanocomposites. It is seen that tensile strength and tensile modulus of
material increased to 19.7 MPa, and 233.2 MPa with 4 wt % of organoclay
concentration. However addition of 6 wt % organoclay resulted in dramatic decrease of

99
both tensile strength and tensile modulus of the material. This indicates that
agglomerates of organoclay did not break during the melt blending and surface
interaction of polymer matrix and organoclay decreased at 6 wt % clay content.
Moreover, the agglomerates act as stress concentrators. Addition of organoclay
greater than 2 wt %, leads to significant decrease of the tensile strain at break value.
As seen in Figure 4.29, for the LDPE/organoclay nanocomposites, addition of 2 wt %
of 15A and 30B slightly decreased the tensile strength of LDPE. This is attributed to
relatively weak interaction between the polymer matrix and silicate layers. However in
the case of adding 25A, tensile strength increased from 18.2 MPa to 21.5 MPa which
indicates a better dispersion in comparison to the other clay types. Tensile modulus of
nanocomposites containing only 2 wt % organoclay increased when compared to neat
resin as shown in Figure 4.30. As in the case of in tensile strength results LDPE/25A
nanocomposites possess the highest strength with an increase of 25 %. These results
are also supported by the XRD results which claim the high level of intercalation of the
LDPE/25A nanocomposite.
Figure 4.31 shows the tensile strain at break values of 2 wt % clay loaded
LDPE/organoclay nanocomposites. There is no remarkable change in nanocomposites
containing 15A. On the other hand lower tensile strain at break values are observed
for the nanocomposites containing 25A and 30B indicating lower deformation of the
samples.

100
0
6
12
18
24
0 2 4 6 8
Organoclay Content (wt%)
Tens
ile S
treng
th (M
pa)
Figure 4.26 Effect of organoclay content on tensile strength of LDPE/15A
nanocomposites.
0
100
200
300
0 2 4 6 8
Organoclay Content (wt %)
Tens
ile M
odul
us (M
Pa)
Figure 4.27 Effect of organoclay content on tensile modulus of LDPE/15A
nanocomposites.

101
0
10
20
30
40
50
0 2 4 6 8
Organoclay Content (wt %)
Tens
ile S
train
at B
reak
(%)
Figure 4.28 Effect of organoclay content on tensile strain at break values of LDPE/15A
nanocomposites.
0
5
10
15
20
25
LDPE 15A 25A 30B
Organoclay Type
Tens
ile S
treng
th (M
Pa)
Figure 4.29 Tensile strength of LDPE/organoclay nanocomposites, containing 2 wt %
organoclay.
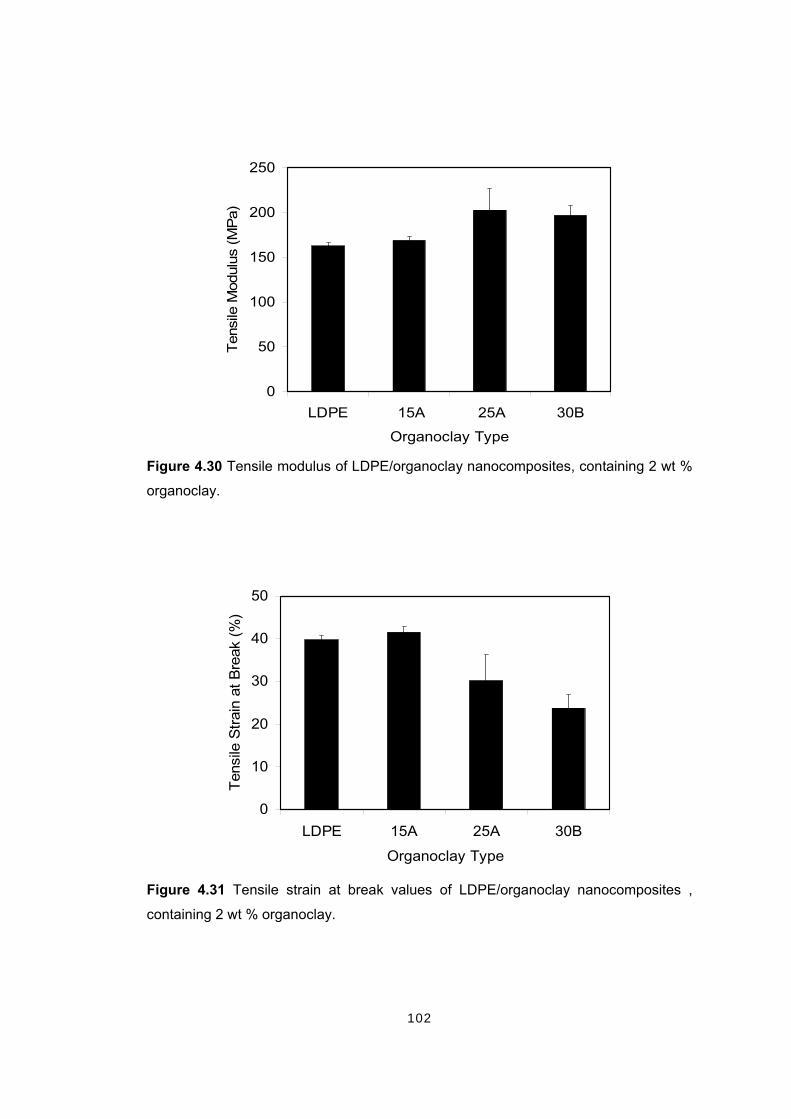
102
0
50
100
150
200
250
LDPE 15A 25A 30B
Organoclay Type
Tens
ile M
odul
us (M
Pa)
Figure 4.30 Tensile modulus of LDPE/organoclay nanocomposites, containing 2 wt %
organoclay.
0
10
20
30
40
50
LDPE 15A 25A 30B
Organoclay Type
Tens
ile S
train
at B
reak
(%)
Figure 4.31 Tensile strain at break values of LDPE/organoclay nanocomposites ,
containing 2 wt % organoclay.

103
Tensile strength, tensile modulus and elongation at break values of
LDPE/compatibilizer blends are shown as a function of compatibilizer content in
Figures 4.32, 4.33, and 4.34. According to technical data sheet reported by the
producer, tensile strength values of E-MA-GMA, E-GMA, and E-nBA-MAH are 4 MPa,
8 MPa and 12 MPa, respectively. For blends containing E-MA-GMA, increase in
compatibilizer content resulted in decrease in both tensile strength and tensile
modulus. On the other hand, for other compatibilizer types, at 10 wt % loading, both
tensile strength and tensile modulus values increased. The maximum tensile strength
and tensile modulus values were 21.6 MPa, and 221.4 at 10 wt % loading of E-nBA-
MAH. However additional loading of compatibilizer caused remarkable decreases. In
addition to these, Figure 4.34 shows that, at 10 wt % loading of compatibilizer,
deformation of blends are much lower when compared with the neat resin and 5 wt %
loading. The lowest tensile strain at break value is observed as 27.9 % at 10 % of E-
nBA-MAH loading.
0
5
10
15
20
25
0 5 10 15 20
Competibilizer Content (wt %)
Tens
ile S
treng
th (M
Pa)
8900 8840 2210
Figure 4.32 Effect of compatibilizer content on tensile strength of LDPE/compatibilizer
blends.
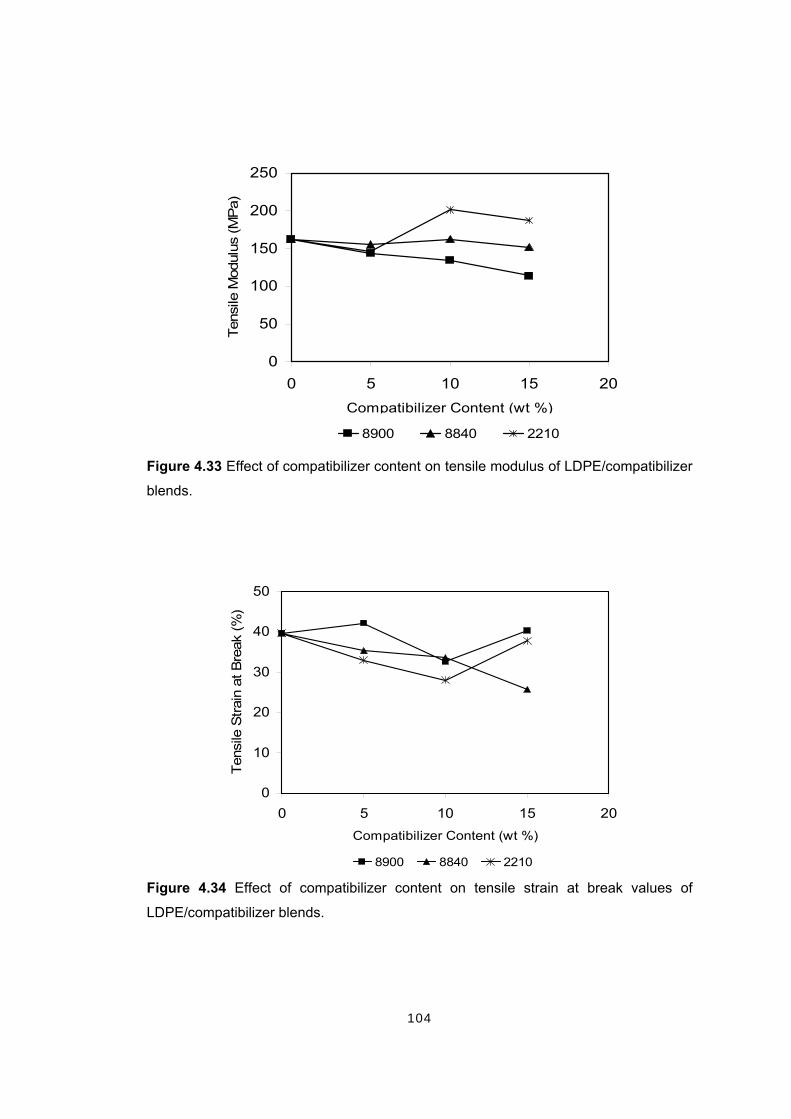
104
0
50
100
150
200
250
0 5 10 15 20Compatibilizer Content (wt %)
Tens
ile M
odul
us (M
Pa)
8900 8840 2210
Figure 4.33 Effect of compatibilizer content on tensile modulus of LDPE/compatibilizer
blends.
0
10
20
30
40
50
0 5 10 15 20Compatibilizer Content (wt %)
Tens
ile S
train
at B
reak
(%)
8900 8840 2210
Figure 4.34 Effect of compatibilizer content on tensile strain at break values of
LDPE/compatibilizer blends.

105
The tensile properties of the 2 wt % of organoclay and 5 wt % of compatibilizer loaded
polymer/layered silicate nanocomposites are observed in Figures 4.35, 4.36, and 4.37.
In the figures, the first and second bars belong to the neat LDPE and
LDPE/compatibilizer blends with a 5 wt % loading. It is seen that with a 5 wt % loading
of compatibilizer, the tensile strength and tensile modulus values of the virgin LDPE
decreases since the compatibilizers have lower tensile strength and tensile modulus.
The tensile strength results of ternary nanocomposites prepared with AO4 sequence,
containing different compatibilizer and organoclay types are shown in Figure 4.35. In
thermoplastic-based nanocomposites (intercalated or exfoliated) the stress at break
value expresses the ultimate strength that the material can bear before break, and
varies strongly depending on the nature of the interactions between the polymer matrix
and the filler [2]. Usually rigid particulate fillers decrease the tensile strength of a
material, unless good adhesion is attained at the interface [55]. In Figure 4.35
remarkably improved tensile strength values are easily observed for ternary
nanocomposites which are the result of the well dispersion of the silicate layers
throughout the LDPE matrix.
It is clearly seen in Figure 4.36 that the tensile modulus, expressing the stiffness of the
material at the start of a tensile test, has shown to be strongly improved when ternary
nanocomposites are formed. The extent of the improvement of the modulus depends
directly upon the average length of dispersed clay particles. Thus the main reason for
the drastic improvement in tensile modulus in LDPE nanocomposites is the strong
interaction between the well dispersed silicate layers and the matrix via formation of
the hydrogen bonds between the functional groups of compatibilizers and the hydroxyl
groups of organoclay [31]. In other words, the possible reactions between the
functional groups of compatibilizers (GMA, MAH), and the groups on the organoclay
surface (OH-), increase the adhesion of the polymer matrix and the organoclay. Due
to this improvement, the stresses are much more effectively transferred from polymer
matrix to the inorganic filler, and thus a higher increase in tensile modulus is expected
[32].

106
When compared with the tensile strength and tensile modulus of LDPE/organoclay
nanocomposites, ternary LDPE/compatibilizer/organoclay nanocomposites are
characterized by larger strength and modulus increases for the same clay loading.
These results are expected based on the morphological analysis results described
earlier. All of these nanocomposites are either intercalated or exfoliated.
Among the ternary LDPE/E-MA-GMA/organoclay nanocomposites, the maximum
increase in tensile strength and tensile modulus values were observed for the ones
prepared with organoclay 15A. The improvement with respect to neat LDPE was 43 %
for tensile strength and 44 % for tensile modulus. In the nanocomposites containing E-
GMA, although each organoclay type showed improvement in mechanical properties,
the highest improvement was achieved with the addition of 15A with 53 % increase in
tensile strength and 54 % increase in tensile modulus. Lastly, in LDPE/E-nBA-
MAH/organoclay nanocomposites, the highest improvement was achieved with 30B.
The tensile strength and tensile modulus of the material was increased by 44 % and
72 % respectively. The striking increase in modulus of LDPE/E-nBA-MAH/30B
nanocomposite could be due to the increased reaction possibility owing to the
additional hydroxyl groups of organic modifier of 30B and strong interaction between
the polar compatibilizer and silicate layers. In addition to these, XRD analysis results
also support that better dispersion was achieved with nanocomposites containing 30B
with the highest basal spacing values.
With an increase of 9.6 % in tensile strength and 11 % increase in tensile modulus the
lowest improvement was observed for LDPE/E-MA-GMA/25A nanocomposites. When
comparing with LDPE/E-MA-GMA/15A nanocomposites, 15A contains two long alkyl
chains instead of one, which enhances the increase of the basal spacing of the
layered silicates.
Figure 4.37 shows the tensile strain at break values of LDPE/compatibilizer/organoclay
nanocomposites. It is observed that for the nanocomposites that have the best tensile
strength and tensile modulus values, there is no a significant change in the tensile
strain at break values. It is possible to say that the mechanical improvement was

107
achieved with suitable compositions of nanocomposites, as explained in the previous
paragraphs.
0
5
10
15
20
25
30
8900 8840 2210
Compatibilizer Type
Tens
ile S
treng
th (M
Pa)
LDPE 5 % Compatibilizer 15A 25A 30B
Figure 4.35 Tensile strength values of ternary LDPE/compatibilizer/organoclay
nanocomposites.

108
0
80
160
240
320
8900 8840 2210
Compatibilizer Type
Tens
ile M
odul
us (M
Pa)
LDPE 5 % Compatibilizer 15A 25A 30B
Figure 4.36 Tensile modulus values of ternary LDPE/compatibilizer/organoclay
nanocomposites.
0
10
20
30
40
50
8900 8840 2210
Compatibilizer Type
Tens
ile S
train
at B
reak
(%)
LDPE 5 % Compatibilizer 15A 25A 30B
Figure 4.37 Tensile strain at break values of ternary LDPE/compatibilizer/organoclay
nanocomposites.
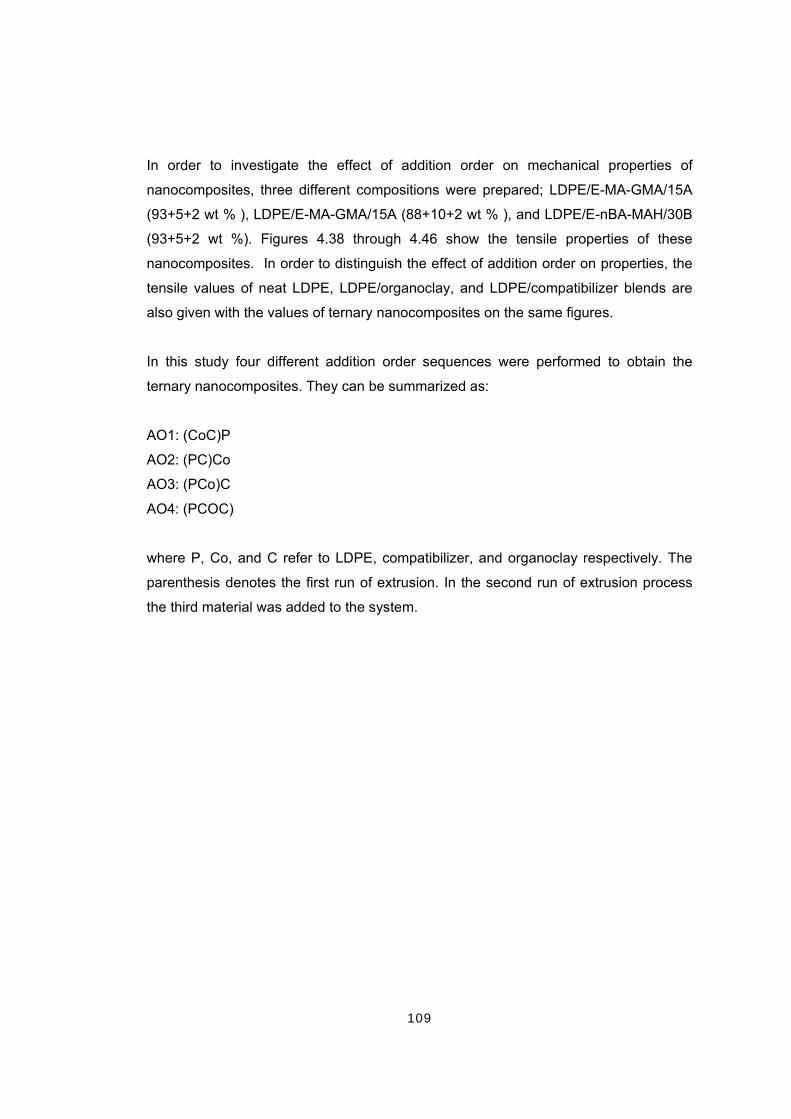
109
In order to investigate the effect of addition order on mechanical properties of
nanocomposites, three different compositions were prepared; LDPE/E-MA-GMA/15A
(93+5+2 wt % ), LDPE/E-MA-GMA/15A (88+10+2 wt % ), and LDPE/E-nBA-MAH/30B
(93+5+2 wt %). Figures 4.38 through 4.46 show the tensile properties of these
nanocomposites. In order to distinguish the effect of addition order on properties, the
tensile values of neat LDPE, LDPE/organoclay, and LDPE/compatibilizer blends are
also given with the values of ternary nanocomposites on the same figures.
In this study four different addition order sequences were performed to obtain the
ternary nanocomposites. They can be summarized as:
AO1: (CoC)P
AO2: (PC)Co
AO3: (PCo)C
AO4: (PCOC)
where P, Co, and C refer to LDPE, compatibilizer, and organoclay respectively. The
parenthesis denotes the first run of extrusion. In the second run of extrusion process
the third material was added to the system.

110
0
5
10
15
20
25
30
P PC PCo PCoC PC-Co PCo-C CoC-P
Addition Order
Tens
ile S
treng
th (M
Pa)
Figure 4.38 Effect of addition order on tensile strength of LDPE/ E-MA-GMA /15A
nanocomposites containing 5 wt % compatibilizer and 2 wt % organoclay.
0
50
100
150
200
250
300
P PC PCo PCoC PC-Co PCo-C CoC-P
Addition Order
Tens
ile M
odul
us (M
Pa)
Figure 4.39 Effect of addition order on tensile modulus of LDPE/ E-MA-GMA /15A
nanocomposites containing 5 wt % compatibilizer and 2 wt % organoclay.

111
0
10
20
30
40
50
P PC PCo PCoC PC-Co PCo-C CoC-P
Addition Order
Tens
ile S
train
at B
reak
(%)
Figure 4.40 Effect of addition order on tensile strain at break value of LDPE/ E-MA-
GMA /15A nanocomposites containing 5 wt % compatibilizer and 2 wt % organoclay.
0
5
10
15
20
25
30
P PC PCo PCoC PC-Co PCo-C CoC-P
Addition Order
Tens
ile S
treng
th (M
Pa)
Figure 4.41 Effect of addition order on tensile strength of LDPE/ E-MA-GMA /15A
nanocomposites containing 10 wt % compatibilizer and 2 wt % organoclay.
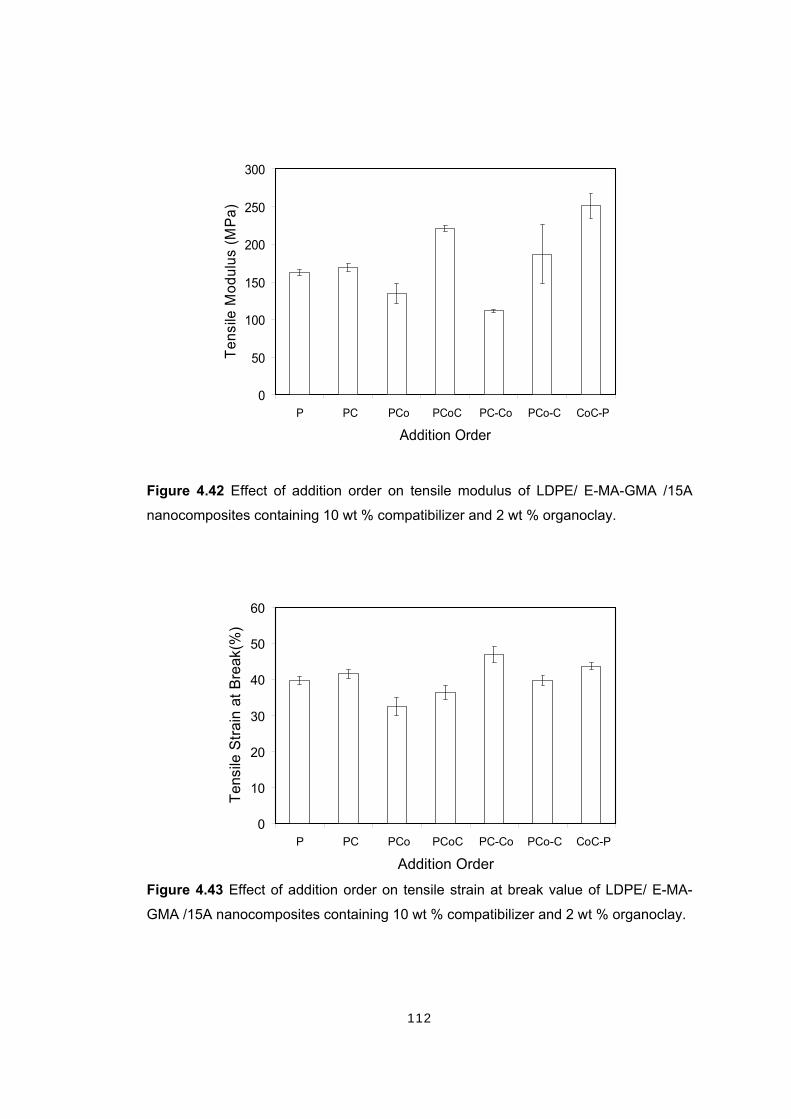
112
0
50
100
150
200
250
300
P PC PCo PCoC PC-Co PCo-C CoC-P
Addition Order
Tens
ile M
odul
us (M
Pa)
Figure 4.42 Effect of addition order on tensile modulus of LDPE/ E-MA-GMA /15A
nanocomposites containing 10 wt % compatibilizer and 2 wt % organoclay.
0
10
20
30
40
50
60
P PC PCo PCoC PC-Co PCo-C CoC-P
Addition Order
Tens
ile S
train
at B
reak
(%)
Figure 4.43 Effect of addition order on tensile strain at break value of LDPE/ E-MA-
GMA /15A nanocomposites containing 10 wt % compatibilizer and 2 wt % organoclay.

113
0
5
10
15
20
25
30
P PC PCo PCoC PC-Co PCo-C CoC-P
Addition Order
Tens
ile S
treng
th (M
Pa)
Figure 4.44 Effect of addition order on tensile strength of LDPE/ E-nBA-MAH/30B
nanocomposites containing 5 wt % compatibilizer and 2 wt % organoclay.
0
100
200
300
P PC PCo PCoC PC-Co PCo-C CoC-P
Addition Order
Tens
ile M
odul
us (M
Pa)
Figure 4.45 Effect of addition order on tensile modulus of LDPE/ E-nBA-MAH/30B
nanocomposites containing 5 wt % compatibilizer and 2 wt % organoclay.

114
0
10
20
30
40
50
P PC PCo PCoC PC-Co PCo-C CoC-P
Addition Order
Tens
ile S
train
at B
reak
(%)
Figure 4.46 Effect of addition order on tensile strain at break value of LDPE/ E-nBA-
MAH/30B nanocomposites containing 5 wt % compatibilizer and 2 wt % organoclay.
Based on the tensile properties, PCoC (AO4) mixing order, is seem to be the best
addition sequence in which all the materials were fed to the extruder in the first run. In
general, these nanocomposites showed the highest improvement in tensile strength
and tensile modulus when compared to nanocomposites prepared with other addition
order sequences. In addition to these, elongation behavior of these nanocomposites
was not poor which is an evidence of better dispersion of the silicate layers in the
polymer matrix. In the case of AO1 mixing order, compatibilizer and the organoclay
were mixed in the first run of extrusion process. Since viscosity of the compatibilizer is
much lower than the LDPE, it can be said that in the first run, compatibilizer was
unable to apply additional shear to organoclay to disperse them and so the
intercalation of compatibilizer into the clay galleries did not occur and this caused a
decrease in the reaction possibility with the organoclay. In the AO2 mixing order,
organoclay and LDPE were mixed in the first run and compatibilizer was added to this
mixture in the second run. In this case, it was possible to provide additional shear by
highly viscous polymer matrix which enhanced the dispersion of clay, but this may
hinder the possible reactions of functional groups of compatibilizer with organoclay
115
since polymer initially surrounded the organoclay. For AO3, LDPE and compatibilizer
were compounded in the first run and then organoclay was added. In this addition
order sequence, the organoclay was subjected to the extrusion process only once so
shear was applied to the organoclay to open the platelets once. This shear was not
sufficient to open the organoclay layers enough and so lower interaction of the clay
layers and polymer matrix occurred. This may be the cause of the lower tensile
properties in comparison to the AO4 results which provided twice extrusion of the
organoclay.
4.3.2 Flexural properties
Flexural properties were measured by three point loading system and results reported
here are the average of at least five samples. The flexural strength and flexural
modulus of all samples are given in Figures 4.47 through 4. 60.
The flexural test involves both tension and compression of the specimen. Due to the
nature of the flexural test, higher values of flexural strength and modulus are expected
than the tensile strength and tensile modulus. However, it was observed that although
the flexural modulus values are significantly higher than the tensile modulus values,
flexural strength values were lower than the tensile strength for all samples.
Considering the stress-strain diagrams of both tests, no yield was observed during the
tensile test and stress hardening occurred until the fracture of the sample. However,
no fracture was observed for the flexural tests and after a maximum value, decrease in
the applied force occurred. The flexural tests were ended manually when the
specimen touched the side walls of the test machine and the applied force started
began to increase.
The effect of organoclay content on flexural strength is similar to tensile test results as
seen in Figures 4.47 and 4.48. Increase of organoclay content increased the flexural
strength values, however after a certain amount of organoclay loading, agglomerates
of clay may occur and that decreased the flexural strength.

116
Flexural modulus can be expressed as the material’s stiffness when flexed, and as in
the case of the tensile modulus it highly depends on the degree of dispersion of the
silicate layers in the polymer matrix. Addition of rigid clay particles generally increased
the flexural modulus as seen in the Figures 4.49 and 4.50.
Figure 4.51 and 4.52 belong to flexural properties of the LDPE/compatibilizer blends.
Generally, increase in organoclay content resulted in decrease in both flexural strength
and modulus as expected.
Flexural properties of ternary nanocomposites are given in Figures 4.53 and 4.54. The
effect of compatibilizer on dispersion of silicate layers is easily observed when
comparing the flexural test results of ternary nanocomposites with binary
nanocomposites as in the case of the tensile properties. The highest flexural tensile
and flexural modulus values also belong to LDPE/E-MA-GMA/15A, LDPE/GMA/15A
and LDPE/nBA/MAH nanocomposites owing to the factors explained in the previous
section. The improvement of flexural strength and flexural modulus of these
nanocomposites are; 22 % and 14.6 % for LDPE/E-MA-GMA/15A; 34.5 % and 13.6 %
for LDPE/GMA/15A; and 36.6 % and 17.7 % for LDPE/nBA/MAH nanocomposites
respectively.
To consider the effect of addition order of materials on flexural properties, it is seen
from Figures 4.55 through 4.60, that there are remarkable differences in properties
according to addition order. In general AO4 is the best among the others. The highest
improvement was achieved with nanocomposites prepared with this sequence
because of the factors explained in tensile properties section. Moreover, decrease in
flexural properties was observed for nanocomposites prepared with other addition
order sequences.

117
0
2
4
6
8
10
12
0 2 4 6 8Organoclay Content (wt %)
Flex
ural
Stre
ngth
(MP
a)
Figure 4.47 Effect of organoclay content on flexural strength of LDPE/15A
nanocomposites.
0
100
200
300
400
0 2 4 6 8Organoclay Content (w %)
Flex
ural
Mod
ulus
(MP
a)
Figure 4.48 Effect of organoclay content on flexural modulus of LDPE/15A
nanocomposites.

118
0
2
4
6
8
10
12
LDPE 15A 25A 30B
Organoclay Type
Flex
ural
Stre
ngth
(MP
a)
Figure 4.49 Flexural strength of LDPE/organoclay nanocomposites, containing 2 wt %
organoclay.
0
100
200
300
400
LDPE 15A 25A 30B
Organoclay Type
Flex
ural
Mod
ulus
(MPa
)
Figure 4.50 Flexural modulus of LDPE/organoclay nanocomposites, containing 2 wt %
organoclay.

119
0
4
8
12
0 5 10 15 20
Compatibilizer Content (wt %)
Flex
ural
Stre
ngth
(MP
a)
8900 8840 2210
Figure 4.51 Effect of compatibilizer content on flexural strength of LDPE/compatibilizer
blends.
0
100
200
300
0 5 10 15 20
Compatibilizer Content (wt %)
Flex
ural
Mod
ulus
(MP
a)
8900 8840 2210
Figure 4.52 Effect of compatibilizer content on flexural modulus of LDPE /
compatibilizer blends.
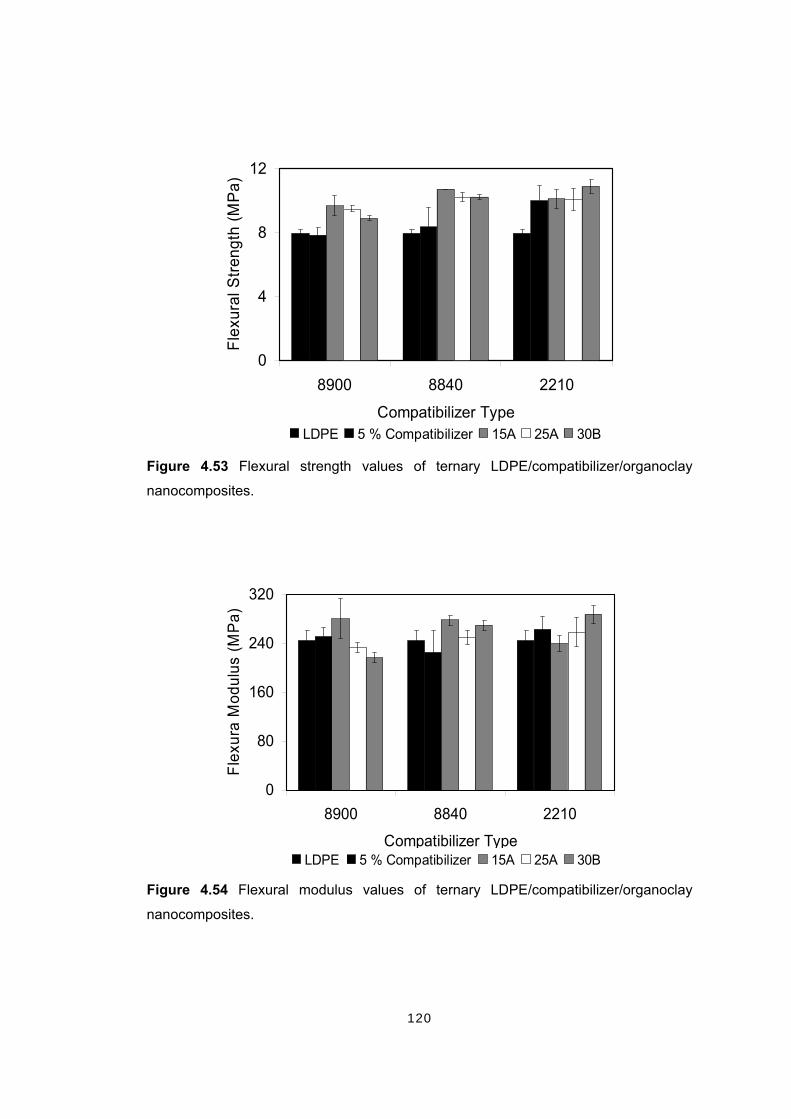
120
0
4
8
12
8900 8840 2210
Compatibilizer Type
Flex
ural
Stre
ngth
(MP
a)
LDPE 5 % Compatibilizer 15A 25A 30B
Figure 4.53 Flexural strength values of ternary LDPE/compatibilizer/organoclay
nanocomposites.
0
80
160
240
320
8900 8840 2210
Compatibilizer Type
Flex
ura
Mod
ulus
(MP
a)
LDPE 5 % Compatibilizer 15A 25A 30B
Figure 4.54 Flexural modulus values of ternary LDPE/compatibilizer/organoclay
nanocomposites.

121
0
2
4
6
8
10
12
P PC PCo PCoC PC-Co PCo-C CoC-P
Addition Order
Flex
ural
Stre
ngth
(MP
a)
Figure 4.55 Effect of addition order on flexural strength of LDPE/ E-MA-GMA /15A
nanocomposites containing 5 wt % compatibilizer and 2 wt % organoclay.
0
100
200
300
400
P PC PCo PCoC PC-Co PCo-C CoC-P
Addition Order
Flex
ural
Mod
ulus
(MP
a)
Figure 4.56 Effect of addition order on flexural modulus of LDPE/ E-MA-GMA /15A
nanocomposites containing 5 wt % compatibilizer and 2 wt % organoclay.

122
0
2
4
6
8
10
12
P PC PCo PCoC PC-Co PCo-C CoC-P
Addition Order
Flex
ural
Stre
ngth
(MP
a)
Figure 4.57 Effect of addition order on flexural strength of LDPE/ E-MA-GMA /15A
nanocomposites containing 10 wt % compatibilizer and 2 wt % organoclay.
0
80
160
240
320
P PC PCo PCoC PC-Co PCo-C CoC-P
Addition Order
Flex
ural
Mod
ulus
(MP
a)
Figure 4.58 Effect of addition order on flexural modulus of LDPE/ E-MA-GMA /15A
nanocomposites containing 10 wt % compatibilizer and 2 wt % organoclay.

123
0
2
4
6
8
10
12
14
P PC PCo PCoC PC-Co PCo-C CoC-P
Addition Order
Flex
ural
Stre
ngth
(MP
a)
Figure 4.59 Effect of addition order on flexural strength of LDPE/ E-nBA-MAH/30B
nanocomposites containing 5 wt % compatibilizer and 2 wt % organoclay.
0
100
200
300
400
P PC PCo PCoC PC-Co PCo-C CoC-P
Addition Order
Flex
ural
Mod
ulus
(MP
a)
Figure 4.60 Effect of addition order on flexural modulus of LDPE/ E-nBA-MAH/30B
nanocomposites containing 5 wt % compatibilizer and 2 wt % organoclay.

124
4.4 Flow Characteristics Melt flow index (MFI) was performed in order to investigate the flow behavior of the
samples, which is inversely related to melt viscosity. The test was carried out under a
specified load of 2.16 kg and a specified temperature of 270°. There are several
factors that influence the MFI as molecular weight, the presence of co-monomers, the
degree of chain branching as well as heat transfer in polymer processing. The
differences in MFI values are so small that it is difficult to have exact conclusions
about the flow properties of the samples.
MFI values of pure materials are given in Table 4.4. It is seen that MFI of neat LDPE
increased (viscosity decrease) during the extrusion process. This may be due to the
decrease in the molecular weight of the LDPE due to the applied shear during
extrusion.
Table 4.4 MFI values of pure materials
Material MFI (g/10 min)
LDPE (not extruded) 1.86
LDPE (twice extruded) 2.84
E-MA-GMA 36.19
E-GMA 30.64
E-nBA-MAH 49.72
Addition of organoclay decreased the MFI value of 2.84 which indicates a higher
viscosity as expected. Here, the clay particles act as fillers causing an increase in
viscosity and dispersed clay particles further prevent the flow of the polymer chains.
The MFI of compatibilizers are much greater than the MFI of pure LDPE, so it was
expected that MFI values would increase (viscosity would decrease) with increasing
concentration of the compatibilizers. However, the situation was opposite for all
LDPE/compatibilizer blends. Non-polar structure of LDPE could lead in the easy flow
of the polymer on the surface of the walls of the MFI machine and viscosity decreases.

125
However the addition of the polar compatibilizer to the LDPE increases the polarity
and they could stick on the walls and resulted in decrease in MFI. The MFI results of
LDPE/organoclay nanocomposites and LDPE/compatibilizer blends are given in Table
4.5 and Table 4.6 respectively.
Table 4.5 MFI values of LDPE/organoclay nanocomposites
Composition Organoclay
wt % MFI (g/10 min)
LDPE + 15A 2 2.29
LDPE + 15A 4 2.22
LDPE + 15A 6 2.30
LDPE + 25A 2 2.02
LDPE + 30B 2 1.89
Table 4.6 MFI values of LDPE/compatibilizer blends
Composition Compatibilizer
wt % MFI (g/10 min)
LDPE + 8900 5 1.57
LDPE + 8900 10 1.12
LDPE + 8900 15 1.05
LDPE + 8840 5 1.86
LDPE + 8840 10 1.78
LDPE + 8840 15 1.74
LDPE + 2210 5 2.09
LDPE + 2210 10 2.20
LDPE + 2210 15 2.57
MFI values of ternary nanocomposites are shown in Table 4.7. It is observed that MFI
of ternary nanocomposites prepared with AO4 mixing order are lower than the neat
LDPE, indicating that melt viscosity increased. It is obvious that the effect of

126
organoclay is dominant to the effect of compatibilizer on MFI of the ternary
nanocomposites. These results are also the evidence of better dispersion of
organoclay due to the addition of compatibilizer to the system. Moreover, XRD results
support the well dispersion of clay by intercalated structures of ternary
nanocomposites.
Table 4.7 MFI values of ternary LDPE/compatibilizer/organoclay nanocomposites
produced with AO4 sequence.
Composition Compatibilizer
wt % Organoclay
wt % MFI (g/10 min)
LDPE+8900+15A 5 2 1.76
LDPE+8840+15A 5 2 1.81
LDPE+2210+15A 5 2 2.32
LDPE+8900+25A 5 2 1.85
LDPE+8840+25A 5 2 1.89
LDPE+2210+25A 5 2 2.24
LDPE+8900+30B 5 2 2.05
LDPE+8840+30B 5 2 2.28
LDPE+2210+30B 5 2 2.57
The effect of addion order on melt flow index is given in Table 4.8. Decrease in melt
flow index (increase in viscosity) was observed for nanocomposites containing E-MA-
GMA, and organoclay 15A. On the other hand owing to the increase in MFI, it can be
said that the compatibilizer effect on MFI was dominant for nanocomposites containing
E-nBA-MAH and 30B and produced with AO1 and AO3 mixing orders.
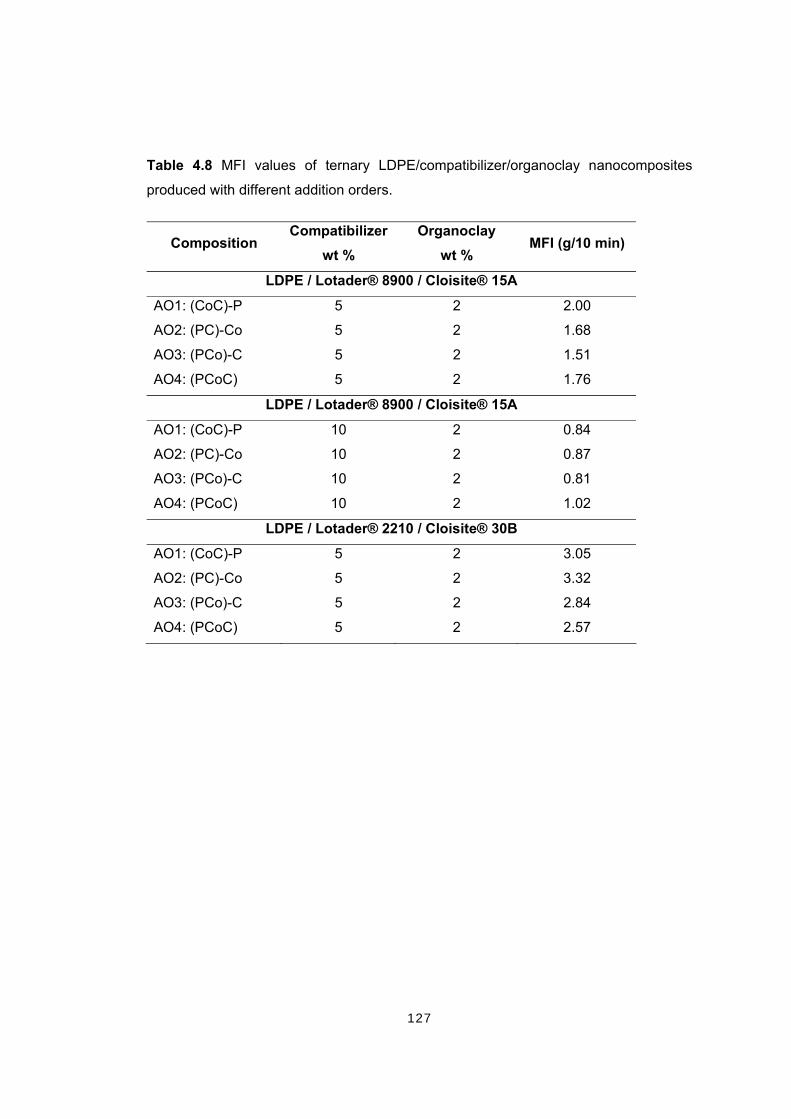
127
Table 4.8 MFI values of ternary LDPE/compatibilizer/organoclay nanocomposites
produced with different addition orders.
Composition Compatibilizer
wt % Organoclay
wt % MFI (g/10 min)
LDPE / Lotader® 8900 / Cloisite® 15A
AO1: (CoC)-P 5 2 2.00
AO2: (PC)-Co 5 2 1.68
AO3: (PCo)-C 5 2 1.51
AO4: (PCoC) 5 2 1.76
LDPE / Lotader® 8900 / Cloisite® 15A
AO1: (CoC)-P 10 2 0.84
AO2: (PC)-Co 10 2 0.87
AO3: (PCo)-C 10 2 0.81
AO4: (PCoC) 10 2 1.02
LDPE / Lotader® 2210 / Cloisite® 30B
AO1: (CoC)-P 5 2 3.05
AO2: (PC)-Co 5 2 3.32
AO3: (PCo)-C 5 2 2.84
AO4: (PCoC) 5 2 2.57

128
CHAPTER 5
CONCLUSIONS
Ternary nanocomposites of low density polyethylene have been produced with
different compatibilizers, and organoclays by means of melt compounding method.
Effects of compatibilizer, organoclay, and the addition order of the components, on the
morphology, thermal properties, mechanical properties, as well as flow behavior were
investigated.
Considering the morphology of 2 wt % organoclay loaded LDPE/organoclay
nanocomposites, intercalation of polymer was observed only for LDPE/25A
nanocomposites. In addition to this, increase in organoclay content does not favor the
dispersion of the clay, but decreases the degree of dispersion. X-ray analyses
obviously show the positive effect of addition of compatibilizer to LDPE/organoclay
nanocomposites, on dispersion of the organoclay particles. 5 wt % compatibilizer
loading to the LDPE/organoclay nanocomposites resulted in a shift to smaller angles,
and diffraction peaks that are broader and lower in height in comparison to those of
the neat organoclay and LDPE/ organoclay nanocomposites. The highest increase of
the basal spacing for ternary nanocomposites obtained for LDPE/E-nBA-
MAH/organoclay nanocomposites were 83 %, 198 %, and 206 % for samples
containing 15A, 25A and 30B respectively. It was difficult to distinguish the effect of
addition order procedure on morphology of ternary nanocomposites, since there is
only slight difference in d-spacing of the clay platelets.
From SEM micrographs, it is seen that, the smooth surface of the pristine LDPE
disappeared when melt blended with either organoclay or compatibilizer. Increase in
organoclay content resulted in shorter and closer crack propagation lines instead of
straight propagation lines. In SEM micrographs of ternary nanocomposites, the smooth
structure of neat LDPE is not detected and many shorter and closer, circular, non

129
linear crack propagation lines are the evidence of the well dispersion of organoclay
throughout the matrix. Due to poor dispersion, agglomerates of clay particles were
also detected in some SEM micrographs of samples which also possess poor
mechanical properties. The effect of organoclay type and addition order on
morphological structure of nanocomposites could not be investigated owing to the
resemblance of the fractured surfaces of the samples.
DSC analysis showed that, the melting temperature (Tm) and percent crystallinity of
LDPE did not change remarkably due to the addition of organoclay and compatibilizer.
Thus it is concluded that addition of both organoclay and compatibilizer does not
influence the melting behavior of the compositions, Also it is observed that the
compatibilizers and organoclay types have no nucleation activity in LDPE.
Increase in organoclay content decreased the mechanical properties of the binary
LDPE/organoclay nanocomposites due to the agglomeration of the organoclay
particles. Also since compatibilizers have lower mechanical properties than the LDPE,
generally poor mechanical properties were observed at high loading of compatibilizers
in LDPE/compatibilizer blends.
The mechanical properties including the tensile strength, tensile modulus, tensile
strain at break, flexural strength and flexural modulus, showed notable improvements
for ternary LDPE/compatibilizer/organoclay nanocomposites with respect to neat
LDPE and LDPE/organoclay nanocomposites. According to the results of the
mechanical tests, LDPE/E-MA-GMA/15A, LDPE/E-GMA/15A and LDPE/E-nBA-
MAH/30M nanocomposites showed the highest improvement in mechanical properties.
Based on tensile and flexural properties, PCoC (AO4) is the best addition sequence in
which all the materials were simultaneously fed to the extruder in the first run.
MFI measurements showed that, the effect of organoclay is more dominant than the
effect of compatibilizer on viscosity of the ternary nanocomposites. Thus with the
addition of organoclay in the ternary nanocomposites the viscosity increased which is

130
also the evidence of better dispersion of organoclay owing to the addition of
compatibilizer to the system.
131
REFERENCES
1. Akovali G., “Handbook of Composite Fabrication”, Rapra Technology Ltd.,
Shawbury, UK, 2001.
2. Alexandre M. and Dubois P., “Polymer-layered Silicate Nanocomposites:
Preparation, Properties and Uses of a New Class of Materials”, Materials Science and
Engineering, vol.28, 1-63, 2000.
3. Giannelis E.P., “Polymer Layered Silicate Nanocomposites” , Advanced Materials,
vol.8, 29-35, 1996.
4. Bafna A. A., “ Polyethylene-Clay Nanocomposites: Processing-Structure-Property
Relationship”, Ph. D. Thesis, University of Cincinnati, Ohio, USA, 2004.
5. Kroschwitz J. I., “Concise Encyclopedia of Polymer Science and Enginering”, Wiley-
Interscience Publication, New York, 1990.
6. Hambir S., Bulakh N., and Jog J.P., “Polypropylene / Clay Nanocomposites: Effect
of Compatibilizer on the Thermal, Crystallization and Dynamic Behavior”, Polymer
Engineering and Science, vol.42 No.9, 1800-1807, 2002.
7. Wang K. H., Choi M. H., Koo C. M., Choi Y.S., Chung I. J., “Synthesis and
Characterization of Maleated Polyethylene / Clay Nanocomposites”, Polymer, vol.42,
9819-9826, 2001.
8. Li X., “Effect of Blending Sequence on the Microstructure and Properties of
PBT/EVA-g-MAH / Organoclay Ternary Nanocomposites”. Polymer Engineering and
Science, vol.42, No.11,2156-2164, 2002.

132
9. Gopakumar T.G., Lee J.A., Kontopoulou M., Parent J.S., “Influence of Clay
Exfoliation on the Physical Properties of Montmorillonite / Polyethylene Composites”,
Polymer, vol. 43, 5483-5491, 2002.
10. Kato M., Okamoto H., Hasegawa N., Tsukigase A. and Usuki A., “ Preparation
and Properties of Polyethylene-Clay Hybrids”, Polymer Engineering and Science,
vol.43 No.6, 1312-1316, 2003.
11. Liang G., Xu J., Bao S., Xu W., “Polyethylene/Maleic Anhydride Grafted
Polyethylene/Organic-Montmorillonite Nanocomposites.I. Preparation, Microstructure,
and Mechanical Properties”, Journal of Applied Polymer Science, vol.91, 3974-3980,
2004.
12. Zhang J., Wilkie C.A., “Preparation and Flammability of Polyethylene-Clay
Nanocomposites”, Polymer Degradation and Stability, vol.80, 163-169, 2003.
13. Hotta S., Paul D.R., “Nanocomposites Formed From Linear Low Density
Polyethylene and Organoclays”, Polymer, vol.45, 7639-7654, 2004.
14. Zhai H., Xu W., Guo H., Zhou Z., Shen S., Song Q., “ Preparation and
Characterization of PE and PE-g-MAH/montmorillonite Nanocomposites”, European
Polymer Journal, vol. 40, No: 11, 2539-2545, 2004.
15. Morawiec J., Pawlak A., Slouf M., Galeski A., Piorkowska E., Krasnikowa N.,
“Preparation and Properties of Compatibilized LDPE/Organo-modified Montmorillonite
Nanocomposites”, European Polymer Journal, vol. 41, 1115-1122, 2005.
16. Zhong Y., Kee D.D., “ Morphology and Properties of Layered Silicate-Polyethylene
Nanocomposite Blown Films”, Polymer Engineering and Science, 469-477, 2005.
133
17. Hasegawa, N., Okamoto, H., Kato, M., Usuki, A., “Preparation and Mechanical
Properties of Polypropylene-Clay Hybrids Based on Modified Polypropylene and
Organophilic Clay”, Journal of Applied Polymer Science, vol. 78, 1918-1922, 2000.
18. http://www.unitedcomposites.net/usapages/whycomposites2.htm
19. Fried J.R., “Polymer Science and Technology”, 2 nd. Edition, Prentice Hall PTR,
2003.
20. “Kirk-Othmer Encyclopedia of Chemical Technology”, 4 th Edition, vol.7, 1-27,
John Wiley and Sons, Inc., New York, 1993.
21. Strong A B., “Fundamentals of Composites Manufacturing: Materials, Methods and
Applications”, Society of Manufacturing Engineers, Publications Development Dept.,
Reference Publications Division, Dearborn, Michigan, 1989.
22. Harper C.A., “Handbook of Plastics, Elastomers & Composires”, 4 th Edition,
McGraw - Hill, Inc., 2002.
23. Callister W.D., “Material Science and Engineering; An Introduction, 4 th Edition,
John Wiley and Sons, Inc.,NY,1997.
24. Chawla K. K., “Composite Materials: Science and Engineering”, Springer-Verlag,
New York, 1998.
25. Daniel I. and Ishai O., “Engineering Mechanics of Composite Materials”, Oxford
University Press Inc., New York, USA, 1994.
26. Mazumdar S.K., “Composites Manufacturing Materials, Product, and Process
Engineering”, CRC Press, USA., 2002.
27. Electronic Development Labs, Inc., http://www.edl-inc.com, fast accessed; July
2005.

134
28. Dennis H.R., Hunter D.L., Chang D., Kim S., White J.L. Cho J.W., Paul D.R.,
“Effect of Melt Processing Conditions on the Extent of Exfoliation in Organoclay-based
Nanocomposites”, Polymer, vol.42, 9513-9522, 2001.
29. Schmidt D., Shah D., Giannelis E.P., “New Advances in Polymer/layered Silicate
Nanocomposites”, Current Opinion in Solid State and Materials Science, vol.6,205-
212, 2002.
30. Pinnavaia T.J., Beall G.W., “Polymer-Clay Nanocomposites”, John Wiley and
Sons, Ltd., England, 2000
31. Ray S.S. and Okamoto M., “Polymer/layered Silicate Nanocomposites: A Review
from Preparation to Processing”, Progress in Polymer Science, 2003.
32. Manias E., Touny A., Wu L., Strawhecker K., Lu B., Chung T.C.,
“Polypropylene/Montmorillonite Nanocomposites.Review of the Synthetic Routes and
Materials Properties”, Chemistry of Materials, vol.13, 3516-3523, 2001.
33. Giannelis, E.P., Krishnamoorti, R., Manias, E., “Polymer-Silicate Nanocomposites:
Model Systems for Confined Polymers and Polymer Brushes”, Advances in Polymer
Science, vol.138, 108-147, 1999.
34. LeBaron P. C., Wang Z. and Pinnavaia T. J., “Polymer-layered Silicate
Nanocomposites: An Overview”, Applied Clay Science, vol.15, 11-29, 1999.
35. Kornmann X., “Synthesis and Characterization of Thermoset-Clay
Nanocomposites”, Ph. D. Thesis, Lulea University of Technology, Sweden, 2000.
36. Vaia, R. A., Ishii, H., Giannelis, E. P.,”Synthesis and Properties of Two-
Dimensional Nanostructures by Direct Intercalation of Polymer Melts in Layered
Silicates”, Chemistry of Materials, vol. 5, 1694-1696, 1993.

135
37. Rubin I. I., “Handbook of Plastic Materials and Technology”, John Wiley and Sons
Inc., 27, New York, 1990
38. Salamone J. C., “Polymer Materials Encyclopedia”, Boca Raton, CRC Press Inc.,
New York, 1996.
39. “Kirk-Othmer Encyclopedia of Chemical Technology”, 4 th Edition, vol.17, 702-707,
John Wiley and Sons, Inc., New York, 1993.
40. “Kirk-Othmer Encyclopedia of Chemical Technology”, 4 th Edition, vol.17, 707-723,
John Wiley and Sons, Inc., New York, 1993.
41. Mark Bishop's Chemistry Site, http://www.mpcfaculty.net/mark_bishop /
polyethylene_ formation_complete.jpg; fast accessed July 2005.
42. Rubin I. I., “Handbook of Plastic Materials and Technology”, John Wiley and Sons
Inc., 28, New York, 1990
43. Seymour R. B., Carraher C. E., “Structure-Property Relationships in Polymers”,
Plenum Press, New York, 1984.
44. Fischer H.,”Polymer Nanocomposites: From Fundamental Research to Specific
applications” Material Science and Engineering C”, vol. 23, 763-772, 2003.
45. The Dow Chemical Company, http://www.dow.com, fast accessed July 2005.
46. Rodriguez F., “ Principles of Polymer Systems”, 4 th. Edition, McGraw Hill, Pub. ,
1996.
47. Rauwendaal C. “Polymer Extrusion” , Third, revised edition, Hanser / Gardner
Publications, Inc. Cincinnati, 1994.

136
48. Rubin I.I., “Handbook of Plastic Materials and Technology”, John Wiley & Sons,
Inc.,New York, 1990.
49. Özden G., “Synthesis and Characterization of Polystyrene Clay Nanocomposites”,
M.Sc. Thesis, Middle East Technical University, Ankara, TURKEY, 2004.
50. Polymer Processing.com, http://www.polymerprocessing.com; fast accessed July
2005.
51. Kılınç M., “Processing and Characterization of PET Based Composites”, M.Sc.
Thesis, Middle East Technical University, Ankara, TURKEY, 2004.
52. Allock H.R., Lampe F.W., “Contemporary Polymer Chemistry”, 2nd Edition, Prentice
Hall., 1990.
53. Braggs Law, http://www.eserc. stonybrook.edu/ProjectJava/Bragg, fast accessed
July 2005.
54. “Kirk-Othmer Encyclopedia of Chemical Technology”, 4 th Edition, vol.16, John
Wiley and Sons, Inc., New York, 1993.
55. Nielsen L. E ., Landel R. F ., “Mechanical Properties of Polymers and Composites”,
2nd Edition, Marcel Decker, Inc., New York, 1994.
56. ASTM D638-91a, Standard Test Method for Tensile Properties of Plastics, “Annual
Book of ASTM Standards”, vol.08.01, 174-182, Philadelphia, USA ,1993.
57. Matweb material data, rhttp://www.matweb.com/reference/tensilestrength.asp; last
accessed, July 2500.
58. Billmeyer J., Fred W., “Textbook of Polymer Science”, 3rd Edition, John Wiley &
Sons, Inc., 1984.

137
59. ASTM D790M-92, Standard Test Methods for Flexural Properties of Unreinforced
Plastics and Electrical Insulating Materials, “ Annual Book of Standards”, vol. 08.01,
284-292, Philadelphia, USA ,1993.
60. Vaia, R.A., Jandt, K.D., Kramer, E.J., Giannelis E.P., “Microstructural Evolution of
Melt Intercalated Polymer-Organically Modified Layered Silicates Nanocomposites”,
Chemistry of Materials, vol. 8, 2628-2635. 1996.
61. Dennis, H.R., Hunter, D.L., Chang, D., Kim, S., White, J.L., Cho, J.W., Paul, D.R.,
2001. Effect of Melt Processing Conditions on the Extent of Exfoliation in Organoclay-
Based Nanocomposites, Polymer, 42, 9513-9522.
62. Yoon J. T., Jo W. H., Lee M. S., Ko M.B, “Effects of Comonomers and Shear on
the Melt Intercalation of Styrenics/Clay Nanocomposites”, Polymer,vol. 42, 329-336,
2001.
63. A. Morgan, J. Gilman “Characterization of Polymer-layered Silicate (clay)
Nanocomposites by Transmission Electron Microscopy and X-ray Diffraction: A
Comparative Study”, Journal of Applied Polymer Science ., vol. 87, 1329-1338, 2003.
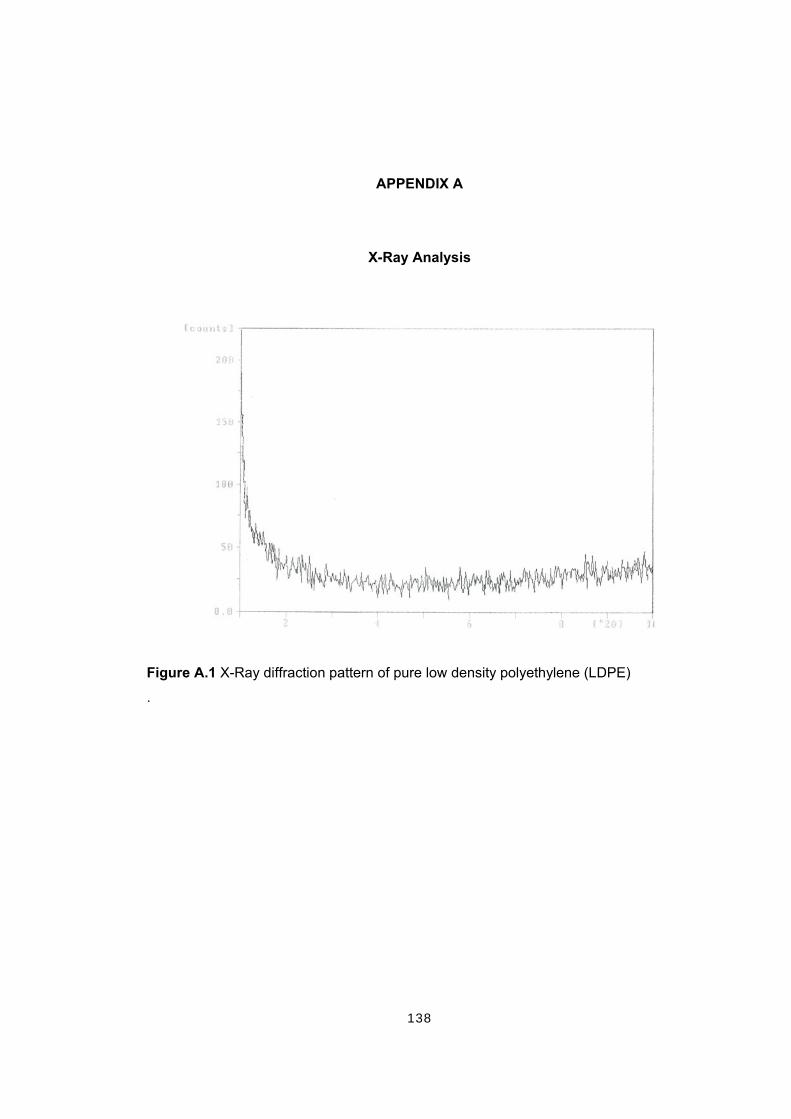
138
APPENDIX A
X-Ray Analysis
Figure A.1 X-Ray diffraction pattern of pure low density polyethylene (LDPE)
.

139
Figure A.2 X-Ray diffraction pattern of nanocomposite containing 2 wt. %
Cloisite® 15A .
Figure A.3 X-Ray diffraction pattern of nanocomposite containing 4 wt. %
Cloisite® 15A .

140
Figure A.4 X-Ray diffraction pattern of nanocomposite containing 6 wt. %
Cloisite® 15A .
Figure A.5 X-Ray diffraction pattern of nanocomposite containing 2 wt. %
Cloisite® 25A .
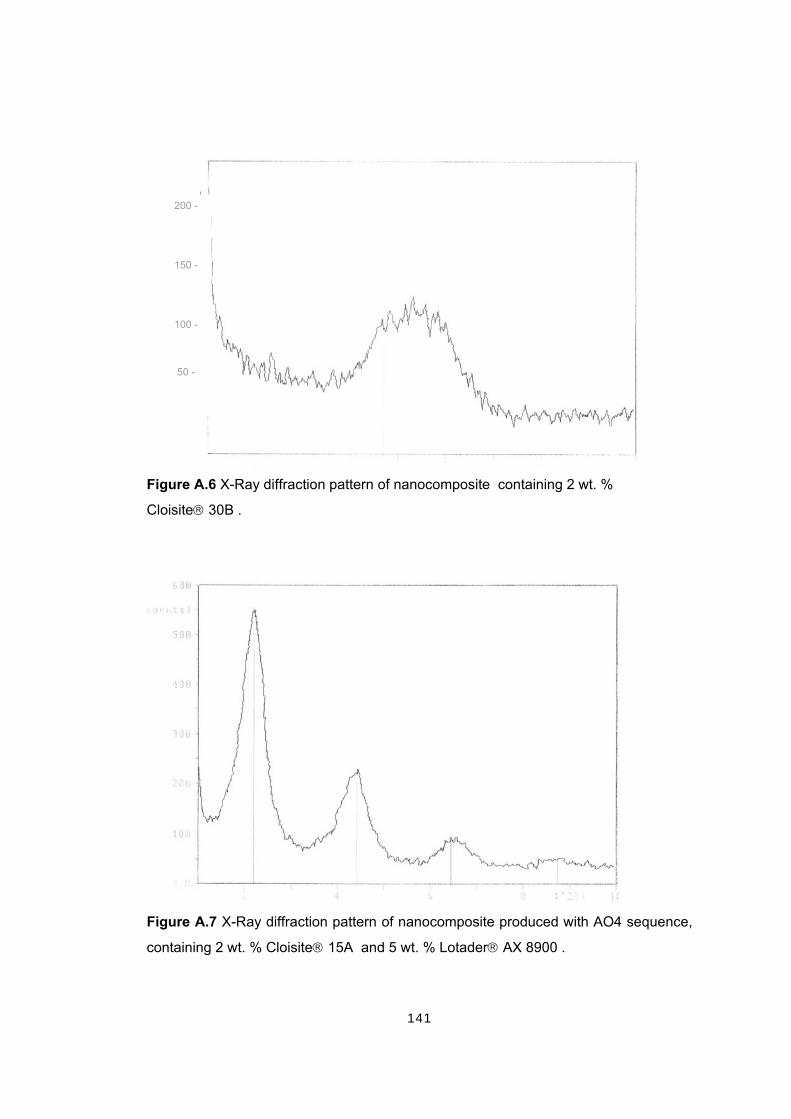
141
Figure A.6 X-Ray diffraction pattern of nanocomposite containing 2 wt. %
Cloisite® 30B .
Figure A.7 X-Ray diffraction pattern of nanocomposite produced with AO4 sequence,
containing 2 wt. % Cloisite® 15A and 5 wt. % Lotader® AX 8900 .
200 -
150 -
100 -
50 -

142
Figure A.8 X-Ray diffraction pattern of nanocomposite produced with AO4 sequence,
containing 2 wt. % Cloisite® 15A and 5 wt. % Lotader® AX 8840 .
Figure A.9 X-Ray diffraction pattern of nanocomposite containing 2 wt. % Cloisite®
15A and 5 wt. % Lotader® 2210 .

143
Figure A.10 X-Ray diffraction pattern of nanocomposite containing 2 wt. % Cloisite®
25A and 5 wt. % Lotader® AX 8900 .
Figure A.11 X-Ray diffraction pattern of nanocomposite produced with AO4 sequence,
containing 2 wt. % Cloisite® 25A and 5 wt. % Lotader® AX 8840.

144
Figure A.12 X-Ray diffraction pattern of nanocomposite produced with AO4 sequence,
containing 2 wt. % Cloisite® 25A and 5 wt. % Lotader® 2210 .
Figure A.13 X-Ray diffraction pattern of nanocomposite produced with AO4 sequence,
containing 2 wt. % Cloisite® 30B and 5 wt. % Lotader® AX 8900 .

145
Figure A.14 X-Ray diffraction pattern of nanocomposite produced with AO4 sequence,
containing 2 wt. % Cloisite® 30B and 5 wt. % Lotader® AX 8840 .
Figure A.15 X-Ray diffraction pattern of nanocomposite produced with AO4 sequence,
containing 2 wt. % Cloisite® 30B and 5 wt. % Lotader® 2210 .

146
Figure A.16 X-Ray diffraction pattern of nanocomposite produced with AO1 sequence,
containing 2 wt. % Cloisite® 15A and 5 wt. % Lotader® AX 8900.
Figure A.17 X-Ray diffraction pattern of nanocomposite produced with AO2 sequence,
containing 2 wt. % Cloisite® 15A and 5 wt. % Lotader® AX 8900.

147
Figure A.18 X-Ray diffraction pattern of nanocomposite produced with AO3 sequence,
containing 2 wt. % Cloisite® 15A and 5 wt. % Lotader® AX 8900.
Figure A.19 X-Ray diffraction pattern of nanocomposite produced with AO1 sequence,
containing 2 wt. % Cloisite® 30B and 5 wt. % Lotader® AX 8900.

148
Figure A.20 X-Ray diffraction pattern of nanocomposite produced with AO2 sequence,
containing 2 wt. % Cloisite® 30B and 5 wt. % Lotader® 2210.
Figure A.21 X-Ray diffraction pattern of nanocomposite produced with AO3 sequence,
containing 2 wt. % Cloisite® 30B and 5 wt. % Lotader® 2210.

149
APPENDIX B
DSC Analysis
Figure B.1 DSC thermogram of pure low density polyethylene (LDPE)
.

150
Figure B.2 DSC thermogram of nanocomposite containing 2 wt. % Cloisite® 15A
Figure B.3 DSC thermogram of nanocomposite containing 2 wt. % Cloisite® 25A .
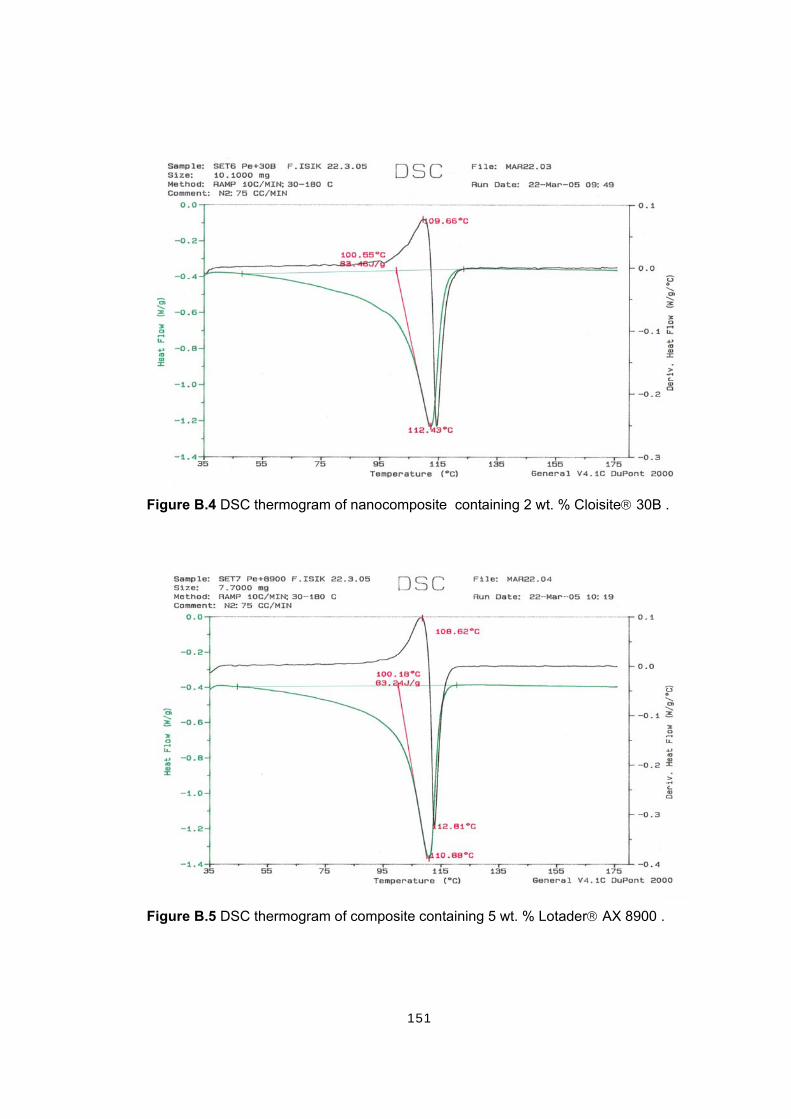
151
Figure B.4 DSC thermogram of nanocomposite containing 2 wt. % Cloisite® 30B .
Figure B.5 DSC thermogram of composite containing 5 wt. % Lotader® AX 8900 .

152
Figure B.6 DSC thermogram of composite containing 5 wt. % Lotader® AX 8840 .
Figure B.7 DSC thermogram of composite containing 5 wt. % Lotader® 2210 .

153
Figure B.8 DSC thermogram of nanocomposite produced with AO4 sequence,
containing 2 wt. % Cloisite® 15A, and 5 wt. % Lotader® AX 8900 .
Figure B.9 DSC thermogram of nanocomposite produced with AO4 sequence,
containing 2 wt. % Cloisite® 15A, and 5 wt. % Lotader® AX 8840 .
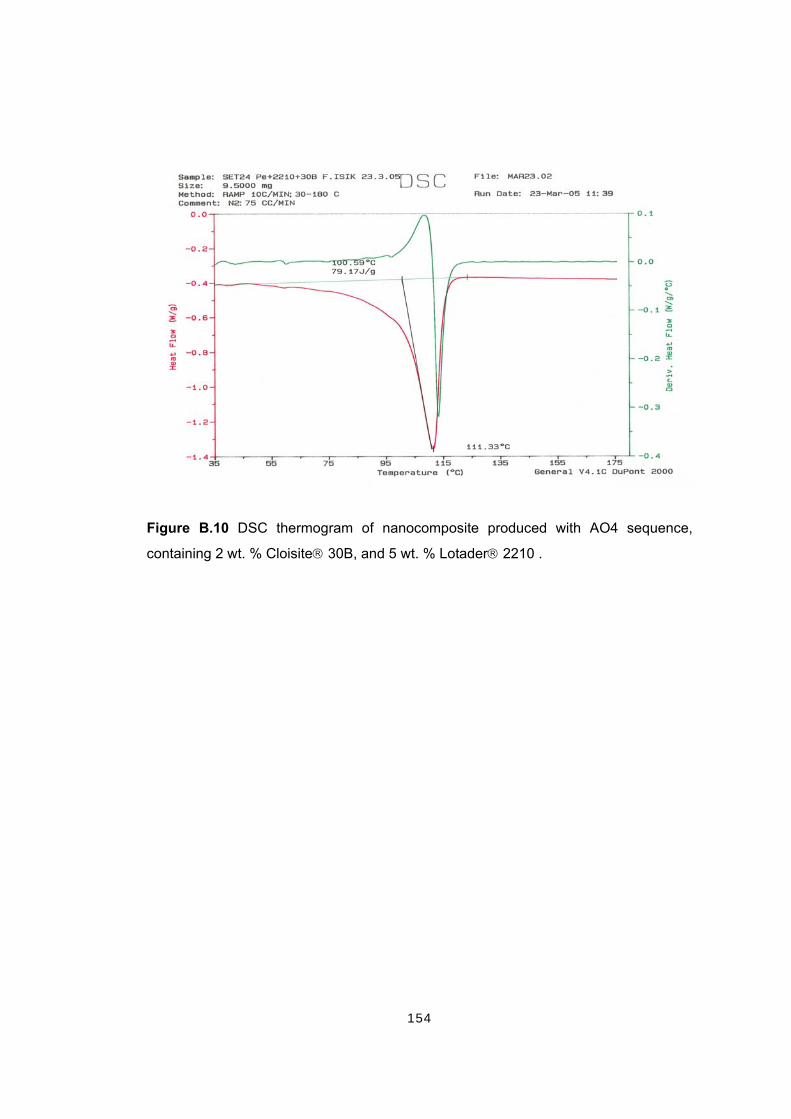
154
Figure B.10 DSC thermogram of nanocomposite produced with AO4 sequence,
containing 2 wt. % Cloisite® 30B, and 5 wt. % Lotader® 2210 .
155
APPENDIX C
Mechanical Test Results
Table C.1 Tensile strength data for all samples
Composition Organoclay
wt % Tensile Strength
(MPa) St. Dev.
LDPE - 18.2 0.4
LDPE/Organoclay
LDPE+15A 2 17.5 0.6
LDPE+15A 4 19.7 1.6
LDPE+15A 6 16.1 0.9
LDPE+25A 2 21.5 1.1
LDPE+30B 2 18.2 0.5
LDPE/Compatibilizer
Composition Compatibilizer
wt % Tensile Strength
(MPa) St. Dev.
LDPE + 8900 5 16.3 0.3
LDPE + 8900 10 14.9 0.8
LDPE + 8900 15 13.5 0.4
LDPE + 8840 5 16.9 0.5
LDPE + 8840 10 18.2 1.1
LDPE + 8840 15 17.1 1.3
LDPE + 2210 5 17.5 0.3
LDPE + 2210 10 21.6 0.4
LDPE + 2210 15 20.1 1.0
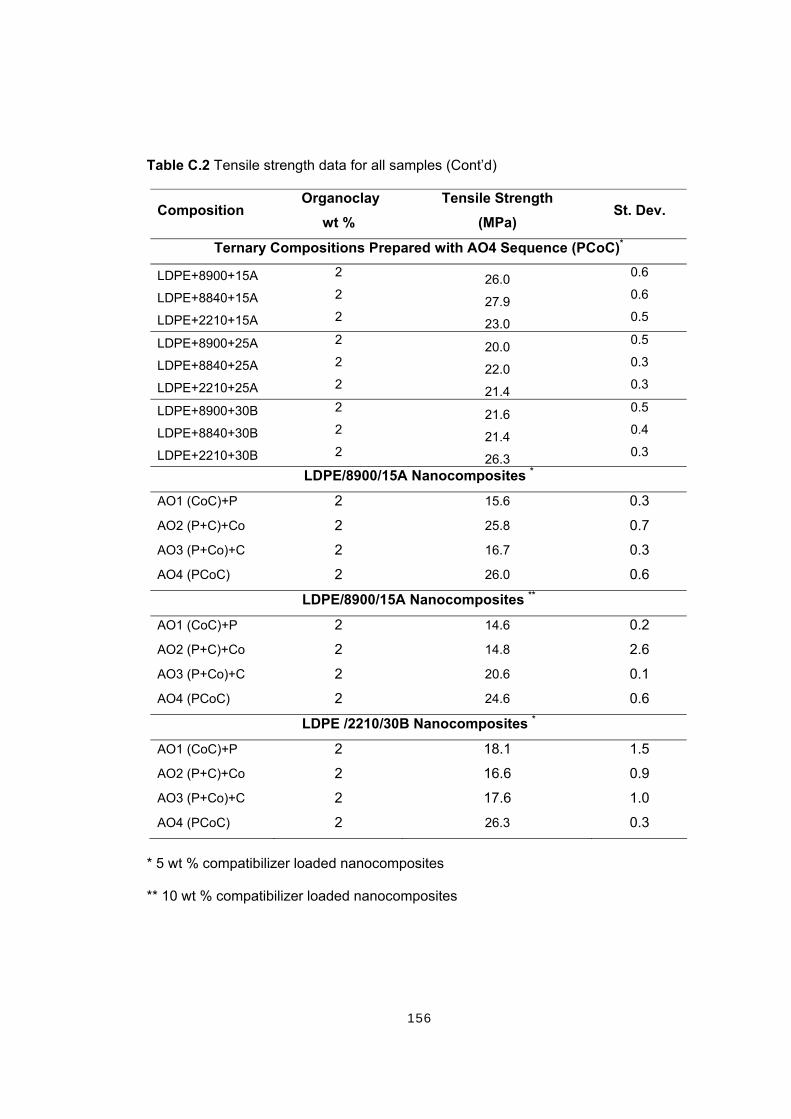
156
Table C.2 Tensile strength data for all samples (Cont’d)
Composition Organoclay
wt % Tensile Strength
(MPa) St. Dev.
Ternary Compositions Prepared with AO4 Sequence (PCoC)*
LDPE+8900+15A 2 26.0 0.6
LDPE+8840+15A 2 27.9 0.6
LDPE+2210+15A 2 23.0 0.5
LDPE+8900+25A 2 20.0 0.5
LDPE+8840+25A 2 22.0 0.3
LDPE+2210+25A 2 21.4 0.3
LDPE+8900+30B 2 21.6 0.5
LDPE+8840+30B 2 21.4 0.4
LDPE+2210+30B 2 26.3 0.3
LDPE/8900/15A Nanocomposites *
AO1 (CoC)+P 2 15.6 0.3
AO2 (P+C)+Co 2 25.8 0.7
AO3 (P+Co)+C 2 16.7 0.3
AO4 (PCoC) 2 26.0 0.6
LDPE/8900/15A Nanocomposites **
AO1 (CoC)+P 2 14.6 0.2
AO2 (P+C)+Co 2 14.8 2.6
AO3 (P+Co)+C 2 20.6 0.1
AO4 (PCoC) 2 24.6 0.6
LDPE /2210/30B Nanocomposites *
AO1 (CoC)+P 2 18.1 1.5
AO2 (P+C)+Co 2 16.6 0.9
AO3 (P+Co)+C 2 17.6 1.0
AO4 (PCoC) 2 26.3 0.3
* 5 wt % compatibilizer loaded nanocomposites ** 10 wt % compatibilizer loaded nanocomposites

157
Table C.3Tensile modulus data for all samples
Composition Organoclay
wt % Tensile Modulus
(MPa) St. Dev.
LDPE - 162.6 3.6
LDPE/Organoclay
LDPE+15A 2 169.1 4.6
LDPE+15A 4 233.2 48.3
LDPE+15A 6 227.0 8.6
LDPE+25A 2 202.6 24.9
LDPE+30B 2 197.3 10.7
LDPE/Compatibilizer
Composition Compatibilizer
wt % Tensile Modulus
(MPa) St. Dev.
LDPE + 8900 5 143.9 2.9
LDPE + 8900 10 134.9 13.3
LDPE + 8900 15 114.2 4.5
LDPE + 8840 5 155.4 9.2
LDPE + 8840 10 162.7 24.1
LDPE + 8840 15 152.0 11.7
LDPE + 2210 5 144.9 9.3
LDPE + 2210 10 221.4 9.7
LDPE + 2210 15 187.3 19.1
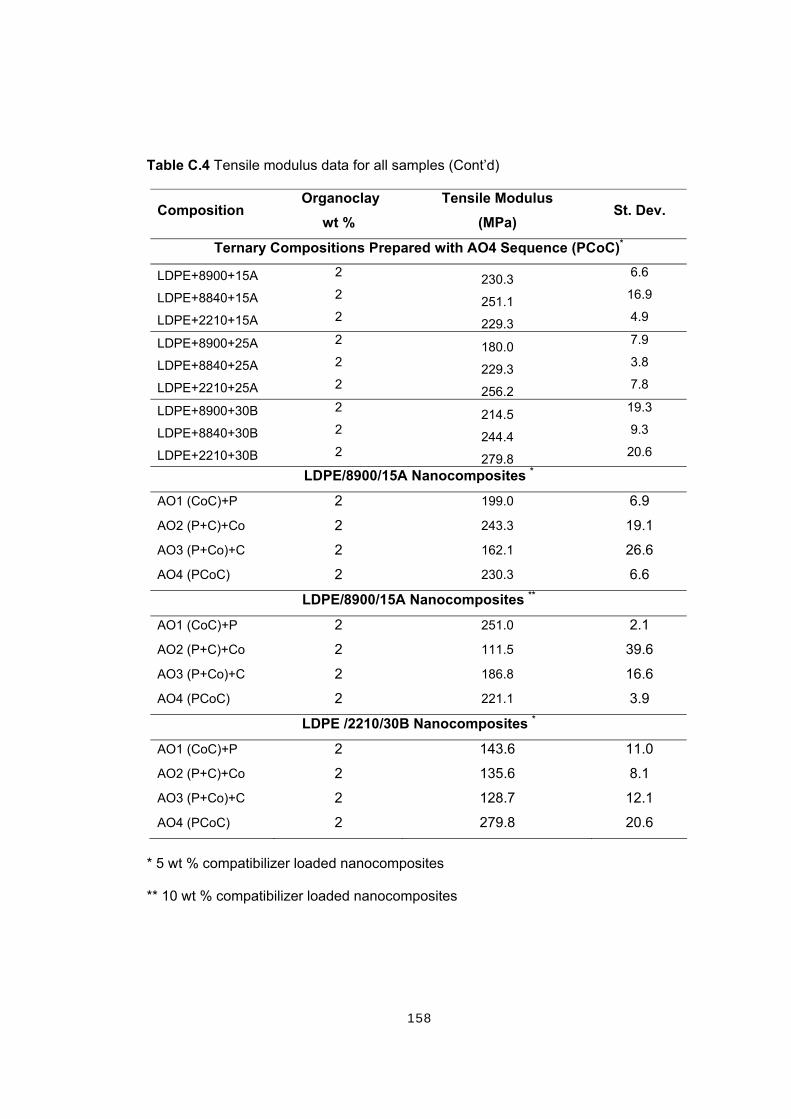
158
Table C.4 Tensile modulus data for all samples (Cont’d)
Composition Organoclay
wt % Tensile Modulus
(MPa) St. Dev.
Ternary Compositions Prepared with AO4 Sequence (PCoC)*
LDPE+8900+15A 2 230.3 6.6
LDPE+8840+15A 2 251.1 16.9
LDPE+2210+15A 2 229.3 4.9
LDPE+8900+25A 2 180.0 7.9
LDPE+8840+25A 2 229.3 3.8
LDPE+2210+25A 2 256.2 7.8
LDPE+8900+30B 2 214.5 19.3
LDPE+8840+30B 2 244.4 9.3
LDPE+2210+30B 2 279.8 20.6
LDPE/8900/15A Nanocomposites *
AO1 (CoC)+P 2 199.0 6.9
AO2 (P+C)+Co 2 243.3 19.1
AO3 (P+Co)+C 2 162.1 26.6
AO4 (PCoC) 2 230.3 6.6
LDPE/8900/15A Nanocomposites **
AO1 (CoC)+P 2 251.0 2.1
AO2 (P+C)+Co 2 111.5 39.6
AO3 (P+Co)+C 2 186.8 16.6
AO4 (PCoC) 2 221.1 3.9
LDPE /2210/30B Nanocomposites *
AO1 (CoC)+P 2 143.6 11.0
AO2 (P+C)+Co 2 135.6 8.1
AO3 (P+Co)+C 2 128.7 12.1
AO4 (PCoC) 2 279.8 20.6
* 5 wt % compatibilizer loaded nanocomposites ** 10 wt % compatibilizer loaded nanocomposites

159
Table C.5 Tensile strain at break data for all samples
Composition Organoclay
wt % Tensile Strain at Break
(%) St. Dev.
LDPE - 39.7 1.1
LDPE/Organoclay
LDPE+15A 2 41.5 1.3
LDPE+15A 4 33.5 7.1
LDPE+15A 6 27.2 1.4
LDPE+25A 2 30.2 6.1
LDPE+30B 2 23.7 3.2
LDPE/Compatibilizer
Composition Compatibilizer
wt % Tensile Strain at Break
(%) St. Dev.
LDPE + 8900 5 42.1 1.3
LDPE + 8900 10 32.5 2.5
LDPE + 8900 15 40.3 1.7
LDPE + 8840 5 35.4 2.2
LDPE + 8840 10 33.6 4.0
LDPE + 8840 15 25.7 2.3
LDPE + 2210 5 33.0 6.9
LDPE + 2210 10 28.0 1.9
LDPE + 2210 15 37.8 3.1

160
Table C.6 Tensile strain at break data for all samples (Cont’d)
Composition Organoclay
wt % Tensile Strain at Break
(%) St. Dev.
Ternary Compositions Prepared with AO4 Sequence (PCoC)*
LDPE+8900+15A 2 40.0 1.9
LDPE+8840+15A 2 43.4 1.4
LDPE+2210+15A 2 37.4 3.1
LDPE+8900+25A 2 33.5 2.7
LDPE+8840+25A 2 32.7 5.6
LDPE+2210+25A 2 26.5 6.1
LDPE+8900+30B 2 32.4 2.0
LDPE+8840+30B 2 27.8 1.3
LDPE+2210+30B 2 41.2 1.6
LDPE/8900/15A Nanocomposites *
AO1 (CoC)+P 2 43.9 2.4
AO2 (P+C)+Co 2 31.7 3.9
AO3 (P+Co)+C 2 39.3 1.9
AO4 (PCoC) 2 40.0 1.9
LDPE/8900/15A Nanocomposites **
AO1 (CoC)+P 2 43.7 2.3
AO2 (P+C)+Co 2 46.9 1.5
AO3 (P+Co)+C 2 39.7 0.9
AO4 (PCoC) 2 36.3 1.9
LDPE /2210/30B Nanocomposites *
AO1 (CoC)+P 2 28.4 4.0
AO2 (P+C)+Co 2 32.5 1.1
AO3 (P+Co)+C 2 31.6 4.9
AO4 (PCoC) 2 41.2 1.6
* 5 wt % compatibilizer loaded nanocomposites ** 10 wt % compatibilizer loaded nanocomposites

161
Table C.7 Flexural strength data for all samples
Composition Organoclay
wt % Flexural Strength
(MPa) St. Dev.
LDPE - 8.0 0.3
LDPE/Organoclay
LDPE+15A 2 7.9 0.4
LDPE+15A 4 9.9 0.4
LDPE+15A 6 9.6 0.5
LDPE+25A 2 10.2 0.6
LDPE+30B 2 10.5 0.2
LDPE/Compatibilizer
Composition Compatibilizer
wt % Flexural Strength
(MPa) St. Dev.
LDPE + 8900 5 7.9 0.5
LDPE + 8900 10 7.0 0.3
LDPE + 8900 15 7.1 0.2
LDPE + 8840 5 8.4 1.2
LDPE + 8840 10 9.3 0.3
LDPE + 8840 15 9.4 0.1
LDPE + 2210 5 10.0 0.9
LDPE + 2210 10 9.1 0.3
LDPE + 2210 15 8.4 0.4
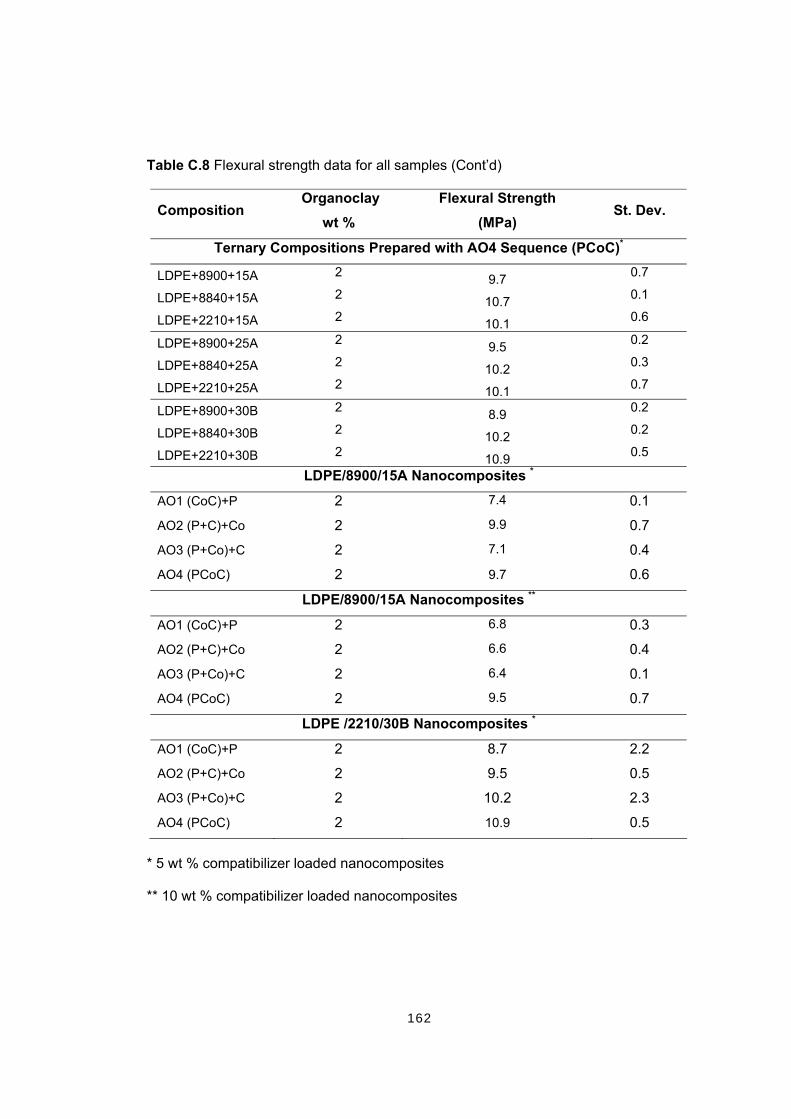
162
Table C.8 Flexural strength data for all samples (Cont’d)
Composition Organoclay
wt % Flexural Strength
(MPa) St. Dev.
Ternary Compositions Prepared with AO4 Sequence (PCoC)*
LDPE+8900+15A 2 9.7 0.7
LDPE+8840+15A 2 10.7 0.1
LDPE+2210+15A 2 10.1 0.6
LDPE+8900+25A 2 9.5 0.2
LDPE+8840+25A 2 10.2 0.3
LDPE+2210+25A 2 10.1 0.7
LDPE+8900+30B 2 8.9 0.2
LDPE+8840+30B 2 10.2 0.2
LDPE+2210+30B 2 10.9 0.5
LDPE/8900/15A Nanocomposites *
AO1 (CoC)+P 2 7.4 0.1
AO2 (P+C)+Co 2 9.9 0.7
AO3 (P+Co)+C 2 7.1 0.4
AO4 (PCoC) 2 9.7 0.6
LDPE/8900/15A Nanocomposites **
AO1 (CoC)+P 2 6.8 0.3
AO2 (P+C)+Co 2 6.6 0.4
AO3 (P+Co)+C 2 6.4 0.1
AO4 (PCoC) 2 9.5 0.7
LDPE /2210/30B Nanocomposites *
AO1 (CoC)+P 2 8.7 2.2
AO2 (P+C)+Co 2 9.5 0.5
AO3 (P+Co)+C 2 10.2 2.3
AO4 (PCoC) 2 10.9 0.5
* 5 wt % compatibilizer loaded nanocomposites ** 10 wt % compatibilizer loaded nanocomposites

163
Table C.9 Flexural Modulus data for all samples
Composition Organoclay
wt % Flexural Modulus
(MPa) St. Dev.
LDPE - 244.7 16.3
LDPE/Organoclay
LDPE+15A 2 241.9 19.1
LDPE+15A 4 289.5 6.9
LDPE+15A 6 338.8 39.0
LDPE+25A 2 281.4 15.3
LDPE+30B 2 283.9 20.8
LDPE/Compatibilizer
Composition Compatibilizer
wt % Flexural Modulus
(MPa) St. Dev.
LDPE + 8900 5 251.7 14.3
LDPE + 8900 10 209.9 20.0
LDPE + 8900 15 164.8 7.3
LDPE + 8840 5 225.4 36.6
LDPE + 8840 10 247.7 30.8
LDPE + 8840 15 212.5 11.8
LDPE + 2210 5 263.6 20.8
LDPE + 2210 10 246.5 7.4
LDPE + 2210 15 206.4 9.9

164
Table C.10 Flexural Modulus data for all samples (Cont’d)
Composition Organoclay
wt % Flexural Modulus
(MPa) St. Dev.
Ternary Compositions Prepared with AO4 Sequence (PCoC)*
LDPE+8900+15A 2 280.4 18.1
LDPE+8840+15A 2 278.1 7.8
LDPE+2210+15A 2 239.9 10.5
LDPE+8900+25A 2 233.3 7.5
LDPE+8840+25A 2 249.8 11.2
LDPE+2210+25A 2 258.5 23.8
LDPE+8900+30B 2 216.4 7.2
LDPE+8840+30B 2 269.9 7.9
LDPE+2210+30B 2 287.9 14.8
LDPE/8900/15A Nanocomposites *
AO1 (CoC)+P 2 208.5 14.0
AO2 (P+C)+Co 2 330.0 26.5
AO3 (P+Co)+C 2 209.9 6.2
AO4 (PCoC) 2 280.4 32.7
LDPE/8900/15A Nanocomposites **
AO1 (CoC)+P 2 189.2 9.5
AO2 (P+C)+Co 2 209.4 13.7
AO3 (P+Co)+C 2 188.0 10.4
AO4 (PCoC) 2 280.7 18.1
LDPE /2210/30B Nanocomposites *
AO1 (CoC)+P 2 221.0 44.7
AO2 (P+C)+Co 2 245.5 6.7
AO3 (P+Co)+C 2 227.6 25.2
AO4 (PCoC) 2 287.9 14.8
* 5 wt % compatibilizer loaded nanocomposites ** 10 wt % compatibilizer loaded nanocomposites