nano FTIR spectroscopy and 10nm s-SNOM chemical imaging - … · 2017-05-22 · nano FTIR...
2
nano FTIR spectroscopy and 10nm s-SNOM chemical imaging 10nm spatial resolution chemical imaging with monolayer sensitivity Monolayer sensitivity demonstrated showing distribution on protein within the lipid membrane s-SNOM phase image with IR source tuned to the amide I absorption band at 1660 cm -1 Highest performance nano FTIR spectroscopy • • Highest•performance•IR•SNOM• spectroscopy•with•the•most•advanced• nanoIR•laser•source•available• • • nano•FTIR•spectroscopy•with•integrated• DFG,•continuum•based•laser•source • • Broadband•synchrotron•light•source• integration • • Multi-chip•QCL•laser•source•for• spectroscopy•and•chemical•imaging Ultrafast-broadband scattering SNOM spectroscopy probing molecular vibrational information. Laser interferogram of Polytetrafluoroethylene (PTFE) shows coherent molecular vibration in the form of free-induction decay in time domain (top). The highlighted feature in sample interferogram is due to the beating of symmetric and antisymmetric mode of C-F modes in the resulting the frequency domain (bottom left). Monolayer sensitivity of nano-FTIR is demonstrated on a monolayer pNTP (bottom right). Data courtesy of Prof. Markus Raschke, University of Colorado, Boulder, US Graphene plasmons showing 8nm spatial resolution. (Scale bar 400nm) Femtosecond broadband nano FTIR spectroscopy Correlative microscopy with nanoIR and materials property mapping Complementary IR, s-SNOM, and AFM-IR techniques Fully featured, high resolution AFM with electrical, mechanical and thermal modes
Transcript of nano FTIR spectroscopy and 10nm s-SNOM chemical imaging - … · 2017-05-22 · nano FTIR...
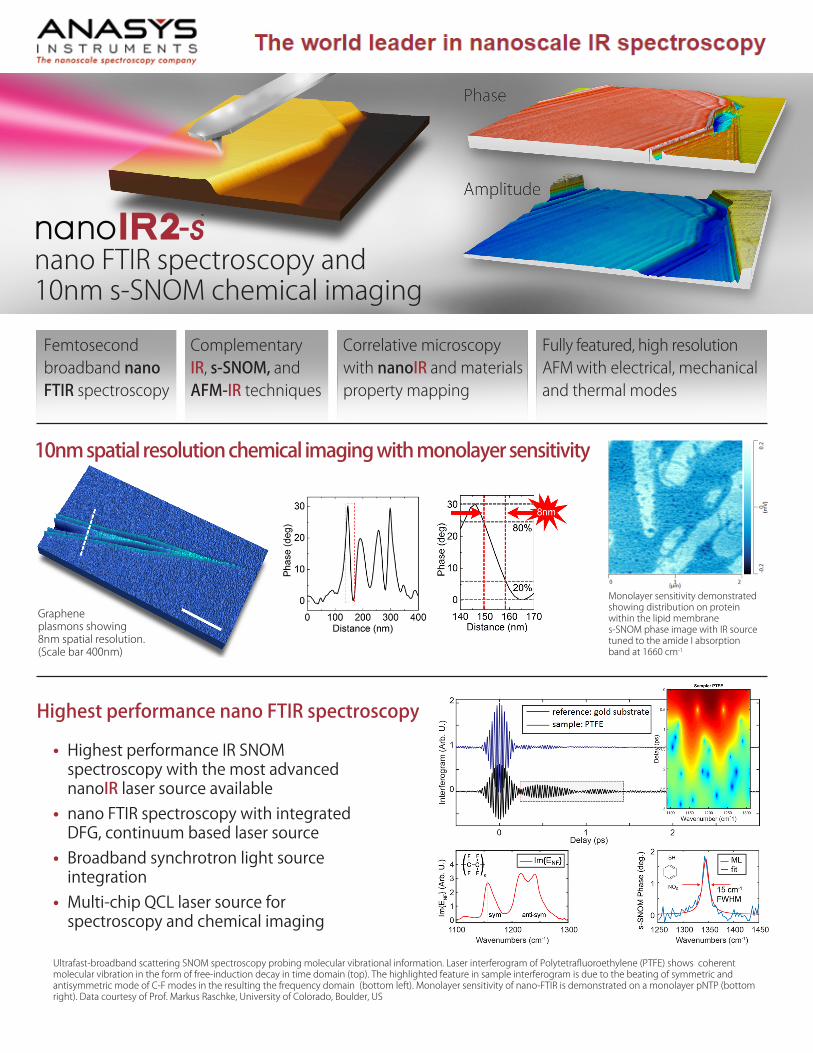
nano FTIR spectroscopy and 10nm s-SNOM chemical imaging
10nm spatial resolution chemical imaging with monolayer sensitivity
Monolayer sensitivity demonstrated showing distribution on protein within the lipid membranes-SNOM phase image with IR source tuned to the amide I absorption band at 1660 cm-1
Highest performance nano FTIR spectroscopy
•• Highest•performance•IR•SNOM•spectroscopy•with•the•most•advanced•nanoIR•laser•source•available••• nano•FTIR•spectroscopy•with•integrated•DFG,•continuum•based•laser•source•• Broadband•synchrotron•light•source•integration•• Multi-chip•QCL•laser•source•for•spectroscopy•and•chemical•imaging
Ultrafast-broadband scattering SNOM spectroscopy probing molecular vibrational information. Laser interferogram of Polytetrafluoroethylene (PTFE) shows coherent molecular vibration in the form of free-induction decay in time domain (top). The highlighted feature in sample interferogram is due to the beating of symmetric and antisymmetric mode of C-F modes in the resulting the frequency domain (bottom left). Monolayer sensitivity of nano-FTIR is demonstrated on a monolayer pNTP (bottom right). Data courtesy of Prof. Markus Raschke, University of Colorado, Boulder, US
Graphene plasmons showing 8nm spatial resolution. (Scale bar 400nm)
Femtosecond broadband nano FTIR spectroscopy
Correlative microscopy with nanoIR and materials property mapping
Complementary IR, s-SNOM, and AFM-IR techniques
Fully featured, high resolution AFM with electrical, mechanical and thermal modes
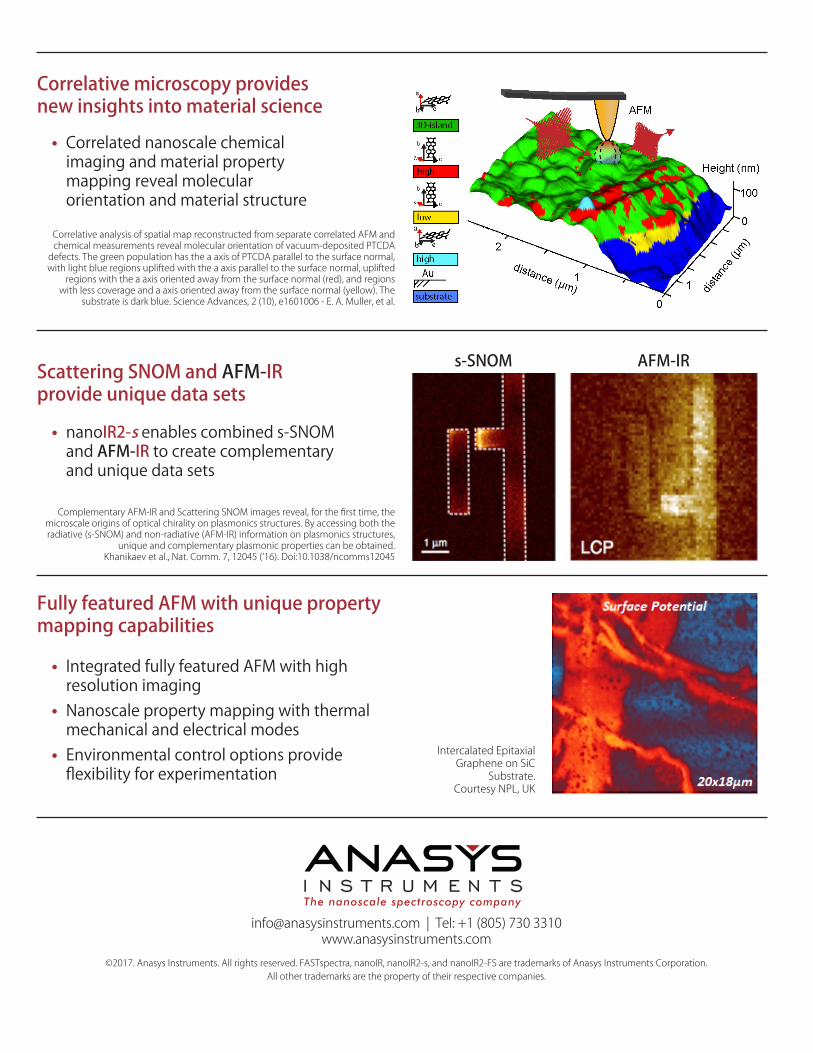
Correlative microscopy provides new insights into material science
Correlative analysis of spatial map reconstructed from separate correlated AFM and chemical measurements reveal molecular orientation of vacuum-deposited PTCDA
defects. The green population has the a axis of PTCDA parallel to the surface normal, with light blue regions uplifted with the a axis parallel to the surface normal, uplifted
regions with the a axis oriented away from the surface normal (red), and regions with less coverage and a axis oriented away from the surface normal (yellow). The
substrate is dark blue. Science Advances, 2 (10), e1601006 - E. A. Muller, et al.
Scattering SNOM and AFM-IR provide unique data sets
•• nanoIR2-s•enables•combined•s-SNOM•and•AFM-IR•to•create•complementary•and•unique•data•sets
Complementary AFM-IR and Scattering SNOM images reveal, for the first time, the microscale origins of optical chirality on plasmonics structures. By accessing both the radiative (s-SNOM) and non-radiative (AFM-IR) information on plasmonics structures,
unique and complementary plasmonic properties can be obtained. Khanikaev et al., Nat. Comm. 7, 12045 (‘16). Doi:10.1038/ncomms12045
Fully featured AFM with unique property mapping capabilities
•• Integrated•fully•featured•AFM•with•high•resolution•imaging••• Nanoscale•property•mapping•with•thermal•mechanical•and•electrical•modes•• Environmental•control•options•provide•flexibility•for•experimentation
Intercalated Epitaxial Graphene on SiC
Substrate. Courtesy NPL, UK
•• Correlated•nanoscale•chemical•imaging•and•material•property•mapping•reveal•molecular•orientation•and•material•structure
[email protected] | Tel: +1 (805) 730 3310www.anasysinstruments.com
©2017. Anasys Instruments. All rights reserved. FASTspectra, nanoIR, nanoIR2-s, and nanoIR2-FS are trademarks of Anasys Instruments Corporation. All other trademarks are the property of their respective companies.
The nanoscale spectroscopy company
s-SNOM AFM-IR