Mechanisms of Manganese Oxide Electrocatalysts Degradation ...
doi.org/10.26434/chemrxiv.8296193.v1
Nano-Folded Gold Electrocatalysts Enhance the Selectivity of CarbonDioxide ReductionKam Sang Kwok, Yuxuan Wang, Michael Cao, Hao Shen, Weinan Xu, David Muller, Chao Wang, DavidGracias
Submitted date: 19/06/2019 • Posted date: 20/06/2019Licence: CC BY-NC-ND 4.0Citation information: Kwok, Kam Sang; Wang, Yuxuan; Cao, Michael; Shen, Hao; Xu, Weinan; Muller, David;et al. (2019): Nano-Folded Gold Electrocatalysts Enhance the Selectivity of Carbon Dioxide Reduction.ChemRxiv. Preprint.
The local structure and geometry of catalytic interfaces can influence the selectivity of chemical reactions.Here, using a pre-strained polymer, we uniaxially compress a thin gold film to form a nano-folded catalyst. Weobserve two kinds of folds and can tune the ratio of loose to tight folds by varying the extent of pre-strain in thepolymer. We characterize the nano-folded catalysts using x-ray diffraction, scanning, and transmissionelectron microscopy. We observe grain reorientation and coarsening in the nano-folded gold catalysts.Electroreduction of carbon dioxide with these nano-folded catalysts reveals an enhancement of Faradaicefficiency for carbon monoxide formation by a factor of about four. This result suggests that electrolyte masstransport limitations and an increase of the local pH in the tight folds of the catalyst outweigh the effects ofalterations in grain characteristics. Together, our studies demonstrate that nano-folded geometries cansignificantly alter grain characteristics, mass transport, and catalytic selectivity.
File list (1)
download fileview on ChemRxivKwok Chemrxiv Final.pdf (4.86 MiB)

Nano-folded gold electrocatalysts enhance the selectivity of carbon dioxide reduction Kam Sang Kwok,1,‡ Yuxuan Wang,1,‡ Michael Cao,3 Hao Shen,1 Weinan Xu,1 David A.
Muller,3,4 Chao Wang,1,*and David H. Gracias1,2,*
1 Department of Chemical & Biomolecular Engineering, Johns Hopkins University, Baltimore, Maryland 21218, United States 2 Department of Materials Science and Engineering, Johns Hopkins University, Baltimore, Maryland 21218, United States 3 School of Applied and Engineering Physics, Cornell University, Ithaca, New York 14853, United States 4 Kavli Institute for Nanoscale Science, Cornell University, Ithaca, New York 14853, United States *Corresponding author: [email protected]; [email protected] Author Contributions ‡These authors contributed equally TOC Figure
KEYWORDS: catalysis, electrochemistry, nanomechanics, self-assembly, internal diffusion

Abstract The local structure and geometry of catalytic interfaces can influence the selectivity of
chemical reactions. Here, using a pre-strained polymer, we uniaxially compress a thin
gold film to form a nano-folded catalyst. We observe two kinds of folds and can tune the
ratio of loose to tight folds by varying the extent of pre-strain in the polymer. We
characterize the nano-folded catalysts using x-ray diffraction, scanning, and
transmission electron microscopy. We observe grain reorientation and coarsening in the
nano-folded gold catalysts. Electroreduction of carbon dioxide with these nano-folded
catalysts reveals an enhancement of Faradaic efficiency for carbon monoxide formation
by a factor of about four. This result suggests that electrolyte mass transport limitations
and an increase of the local pH in the tight folds of the catalyst outweigh the effects of
alterations in grain characteristics. Together, our studies demonstrate that nano-folded
geometries can significantly alter grain characteristics, mass transport, and catalytic
selectivity.

Electroreduction of carbon dioxide (CO2) to valuable carbon-rich products is a
potential solution to end the anthropogenic carbon cycle.1,2 However, slow kinetics and
reduced control over product yield and selectivity have hindered widespread
commercial viability.3,4 Nanostructured catalysts offer the potential to address these
limitations.5 Indeed, a variety of nanoparticles,6–9 thin films,10–14 and nanoporous
materials15–18 have been explored, but there are still challenges with scalability,
reproducibility, extreme reaction conditions, and cost.6,10,12,15
Mechanical wrinkling of metallic thin films using pre-strained polystyrene (PS)
substrates offers a reproducible strategy to create nanostructured interfaces. This
approach is compatible with nanoparticles,19 nanoporous,20 thin films,21,22 and two-
dimensional (2D) materials (e.g. graphene and MoS2),23–28 and the morphology can be
controlled using lithography.24,25,29,30 Previous studies with wrinkled catalysts show
improvement in different electrochemical reactions including hydrogen evolution
reaction (HER),25,27,28,30 glucose sensing,31 and DNA detection.32 For example, wrinkled
platinum (Pt) arrays electrodes improved the performance of HER from ~70 mA/cm2 to
~ 120 mA/cm2 at 0.1 V as compared to conventional Pt on carbon. This improvement
was attributed to weak adhesion of hydrogen (H2) gas bubbles, resulting in a lower
overpotential.
Here, for the first time, we present evidence that a nano-folded gold (Au) catalyst
can improve the selectivity of CO2 reduction. We utilized a pre-strained PS substrate to
uniaxially compress and create a novel Au catalyst with a combination of loose (>200

nm) and tight (< 200 nm) nano-folds (Figure 1). Importantly, we can control the ratio of
tight to loose folds by varying the magnitude of the pre-strain in the PS substrate. Also,
we can release the nano-folded catalysts from the PS substrate and transfer them to
alternate substrates or use them as freestanding catalysts. We characterized the nano-
folded Au catalysts with Scanning Electron Microscopy (SEM), X-ray Diffraction (XRD),
Scanning Transmission Electron Microscopy (STEM) and electron diffraction. XRD
results suggest grain reorientation and STEM studies show grain coarsening in the
nano-folded catalyst. Electrocatalytic studies indicate that the Faradaic efficiency (FECO)
of the nano-folded Au catalyst is approximately four times higher than the flat Au
catalyst. We attribute the enhanced selectivity to the nano-folds in the Au catalyst that
hinder diffusion of the electrolytes leading to an increase of the local pH, which
suppresses the HER.15
Our approach to preparing nano-folded Au catalysts is based on previous studies
with some modifications (see Section 1.1 in the Supporting Information).21,33 Specifically,
we thermally evaporated 60 nm of Au on pre-strained PS at a rate of approximately 0.5
Å/sec. After evaporation, we clamped and then heated the composite film above the glass
transition temperature of PS to drive uniaxial shrinkage with tunable macroscopic pre-
strain as measured by the ratio of the final to the initial length of the film (Figure 1a).
Wrinkling of thin films using pre-strained polymers has been attributed to the mismatch of
the bending energy of the Au and PS films, and wrinkling occurs when the pre-strain is
above a critical strain, 𝜀"# =%&(()*+)*,)./ , where E* 1 and E*2 are the plane-strain moduli of the
substrate and the thin film.34 Assuming representative literature values for E*2and E* 1, we

estimate the critical strain to be 6 x 10⁻⁴, which is significantly below our pre-strain values
of 30% and 70%.33
In our studies, we investigated three pre-strain conditions 0 % (Au-0, Figure S1),
30% (Au-30, Figure 1b), and 70 % (Au-70, Figure 1c). Wrinkles formed at the lower values
of pre-strain can be further compressed into folds at higher values of pre-strain.30 We
observed a greater fraction of loose (d > 200 nm) in Au-30 and a higher fraction of tight
(d < 200 nm) folds at higher values of pre-strain in Au-70 (Figure 1). Specifically, we
observed more than 40% of tight folds in Au-70 as compared to only about 3% of tight
folds in Au-30 (Figure 1d and S2).
Figure 1. Schematic and fold characteristics of the Au catalysts. (a) Schematic illustrations of uniaxially
compressed Au catalysts formed using a pre-strained PS substrate. (b-c) Top view and cross-sectional
SEM images of (b) Au-30 and (c) Au-70 nano-folded Au catalysts. The inset shows zoomed images of the
(b) loose and (c) tight folds. The inset scale bar represents 2 μm. (d) Histogram showing the percentage
of loose and tight folds in the Au-30 and Au-70 nano-folded catalysts.

We characterized the microstructure of the flat and nano-folded Au catalysts by
XRD and observed that the intensity of (200), (220) and (311) planes increased with
increasing pre-strain, and the peaks did not shift or broaden (Figure 2a). The XRD results
suggest that the changes in the nano-folded samples are morphological; they introduce
more diffraction planes and alter the grain structure with no significant changes in atomic
displacement. Previously, it has been observed that the grain structures of polycrystalline
Au films can be altered dramatically when the deformation exceeds the elastic limit of
Au,35 and Au nanostructures undergo plastic deformation when the compressive strain is
larger than 5%.36 We attribute the increased XRD intensities of Au-30 and Au-70 to
preferred grain orientation, which was introduced by compression.37 We performed two
control experiments to investigate if the heating temperature and the orientation of the
folds with respect to the x-ray beam would affect the intensity of the XRD patterns (Figure
S3) and we did not observe any obvious changes in both cases.
In order to investigate the structural changes in the nano-folded catalyst, we
prepared and characterized thinned (30 nm) of Au-0 and Au-70 using STEM. The STEM
imaging and analysis were done in the convex regions of the folds, and we observed
larger grains in the Au-70 (Figure 2c) as compared to Au-0 (Figure 2b) indicating grain
coarsening in the nano-folded catalysts. This is consistent with previous studies on cyclic
plastic deformation of Au thin films that indicate that mechanical deformation can alter
grain energetics and drive grain coarsening.35,36,38,39 Also, the electron diffraction analysis
indicates that the compression did not introduce new crystal planes in Au-70 (Figure 2c).
The STEM diffraction patterns show a similar family of planes for Au-70, such as (111),
(200), (220) and (311), as compared to Au-0, which also agrees with the XRD patterns.

Figure 2. Characterization of the nano-folded catalysts using XRD and STEM. (a) XRD patterns of Au-
0, Au-30 and Au-70. (b,c) STEM images, diffraction patterns and cepstrums of 30 nm thick Au-30 and Au-
70, respectively. The 112 zone (spots 1, 4) has planes {1141} and {220}, 100 zone (spots 2, 5) has {200},
013 zone (spots 3, 6) has {200}, {1314} and {14314}. Dashed circles outline the d-spacings present in the
cepstrums. Red, blue, green, and white dashed circles represent the 111, 200, 220, and 311 spacings,
respectively, consistent with the XRD data

We measured the sheet resistance of the Au catalysts using the four-point probe
measurement technique (Figure S4). We observed that within the statistical variation, the
Au-0 and nano-folded Au catalysts had similar electrical sheet resistivity of 2.28 x 10⁻⁸
(Au-30) and 2.10 x 10⁻⁸ Ω/m (Au-70). These values are also similar to the bulk resistivity
of Au at 300 K (2.25 x 10⁻⁸ Ω/m) (Table 1).40 The four-point measurements indicate that
the compression did not compromise the electrical conductivity, which provides evidence
that no significant defects such as cracks were introduced in the nano-folded Au films.
Also, it is known that metal films with larger grains typically have lower resistivity,41 and
while we did observe some decrease in resistivity of Au-70, the decrease is within the
margin of statistical variation.
Table 1. Properties of as made and transferred Au catalysts.
An interesting feature of our approach is that our nano-folded catalysts are
permanently deformed, and we can even release it from the PS substrate and transfer it
to arbitrary substrates, such as flat silicon wafers or even curved syringe needles (Figure
3). Specifically, after the transfer, we observed that the average width of Au-30 and Au-
70 decreased and increased by approximately 25% and 11 % respectively while the
height decreased by 29% and 8.7% (Table 1, Figure S6 and S7), and no deformation was

induced in Au-0 (Figure S5). This observation can be rationalized by noting that the pre-
strain was high and there is a small extent of relaxation after release. For Au-30, we
observed collapse of the roof of the wrinkles resulting in a decrease in both width and
height, whereas for Au-70 we observed relaxation by spreading of the folds resulting in
an increase in width and a decrease in height of the folds.
Figure 3. Characteristics of released and transferred nano-folded Au catalysts. (a-e) Cross-sectional
SEM images of (a) Au-30 on the pre-strained polymer, (b) Au-30 transferred on a silicon wafer, (c) Au-70
on the pre-strained polymer, (d-e) Au-70 transferred on a silicon wafer (f) SEM and optical images of Au-
70 transferred on a metal syringe needle.
We investigated the electrocatalytic activity in the CO2 reduction reaction using a
home-built, gas-tight electrolysis cell (Figure S8 and S9). Details of the cell and
electrocatalytic measurements are available elsewhere and in section 1.6 in the
supporting information.42 From the potential dependent FECO plots (Figure 4a), we
observed that Au-70 showed enhanced selectivity for CO formation at potentials between

-0.5 V to -1.0 V achieving a maximum FECO of 77.9%, followed by Au-30 with 48.1% and
Au-0 of 19.2% at -0.7V.
In order to investigate the trend in the enhancement of FECO, we plot the current
density per geometric surface area (JCO, Figure 4b) and the current density per
electrochemically active surface area (ECSA) (jCO, Figure 4c) of the Au catalysts. We
estimated the ECSA (Figure S10) by measuring the electrochemical capacitance of the
Au catalysts. Au-70 exhibited the highest JCO, of 3.04 mA/cm2 at -0.7 V that is
approximately two-fold higher than Au-30 and six-fold than Au-0. This observation is
consistent with the results in Figure 4a, since the geometric surface area of all the Au-
catalysts was the same. When accounting for the real surface area in the ECSA plots, at
the same potential, Au-70 has only a 7% increase of jCO to 1.45 mA/cm2Au, as compared
to Au-30, which is 1.34 mA/ cm2Au. Both are significantly higher than Au-0, which has a
jCO of 0.51 mA/cm2Au. This result suggests that roughness does play a role in the
performance of nano-folded catalysts, as expected,15,17,18 but cannot explain the entire
increase in jCO. The measurement also yields surface roughness factors, which indicates
a roughness factor of 2.1 for Au-70, 1.3 for Au-30 and 1 for Au-0 (Table S1).
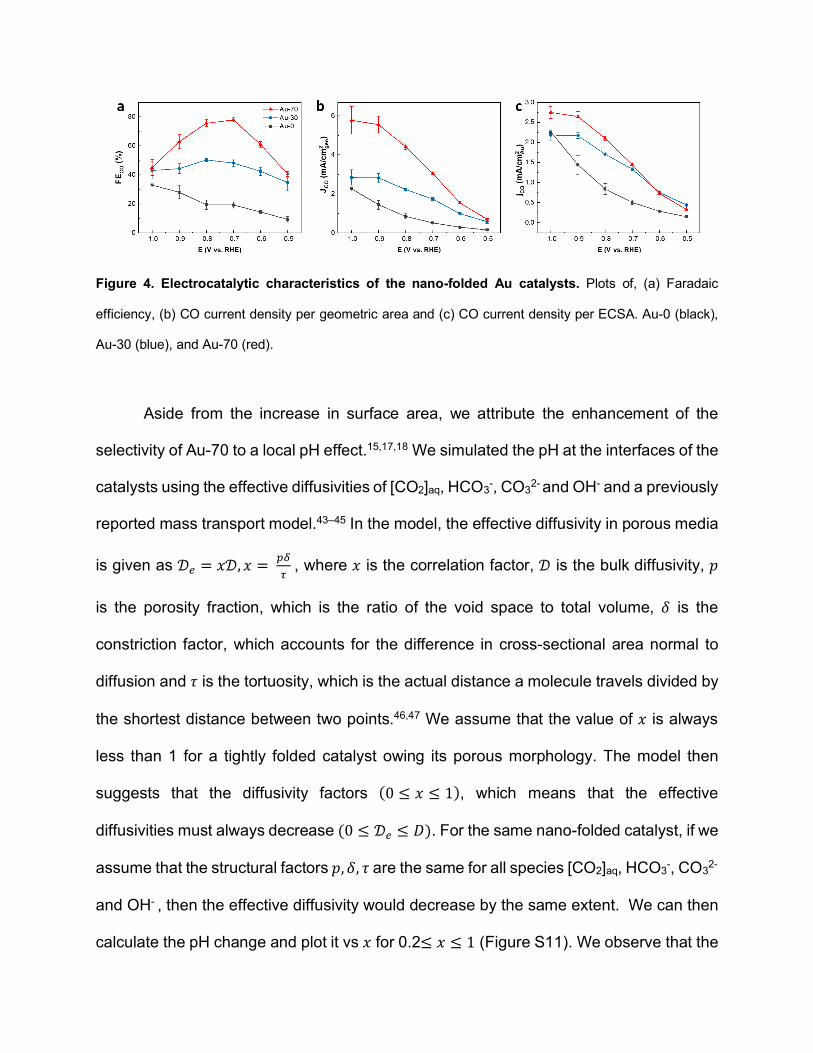
Figure 4. Electrocatalytic characteristics of the nano-folded Au catalysts. Plots of, (a) Faradaic
efficiency, (b) CO current density per geometric area and (c) CO current density per ECSA. Au-0 (black),
Au-30 (blue), and Au-70 (red).
Aside from the increase in surface area, we attribute the enhancement of the
selectivity of Au-70 to a local pH effect.15,17,18 We simulated the pH at the interfaces of the
catalysts using the effective diffusivities of [CO2]aq, HCO3-, CO32- and OH- and a previously
reported mass transport model.43–45 In the model, the effective diffusivity in porous media
is given as 𝒟9 = 𝑥𝒟, 𝑥 = =>?, where 𝑥 is the correlation factor, 𝒟 is the bulk diffusivity, 𝑝
is the porosity fraction, which is the ratio of the void space to total volume, 𝛿 is the
constriction factor, which accounts for the difference in cross-sectional area normal to
diffusion and 𝜏 is the tortuosity, which is the actual distance a molecule travels divided by
the shortest distance between two points.46,47 We assume that the value of 𝑥 is always
less than 1 for a tightly folded catalyst owing its porous morphology. The model then
suggests that the diffusivity factors (0 ≤ 𝑥 ≤ 1), which means that the effective
diffusivities must always decrease (0 ≤ 𝒟9 ≤ 𝐷). For the same nano-folded catalyst, if we
assume that the structural factors 𝑝, 𝛿, 𝜏 are the same for all species [CO2]aq, HCO3-, CO32-
and OH- , then the effective diffusivity would decrease by the same extent. We can then
calculate the pH change and plot it vs 𝑥 for 0.2≤ 𝑥 ≤ 1 (Figure S11). We observe that the

pH increases with decreasing 𝑥 and the local pH begins to rise significantly when the
diffusivities decrease by about 40% (𝑥 = 0.4). This mass transport model confirms that
reducing diffusivities can create a high pH at the interface of the Au-catalysts. The plot
also shows that the pH for Au-70 is higher than that for Au-30, and both are significantly
higher than Au-0. From prior literature, it is known that a higher local pH at the catalyst
interface suppresses the HER reaction, which would improve the FECO and agrees with
our findings.15,17,18
In summary, we have demonstrated a new strategy to enhance the selectivity of
CO formation by utilizing nano-folded Au catalysts for CO2 reduction. The catalysts can
be made in a straightforward manner using a pre-strained polymer substrate. Also, they
can be transferred to other substrates which is important for flexible sensor or
electrochemical devices.48–51 STEM analysis indicates that this process drives grain
coarsening in nano-folded catalysts, which suggests a facile approach to modify grain
morphology the ultra-thin (~30 nm) Au films. Finally, we reveal that tight fold morphologies
can reduce mass transport of the electrolytic species and create high local pH to reduce
the activity of HER and consequently enhance CO selectivity. We anticipate that this
strategy of creating folds in catalysts could be utilized as a general strategy to tune the
selectivity of other electro-catalysts.

AUTHOR INFORMATION
Corresponding Author
*E-mail: [email protected].
*E-mail: [email protected].
Notes
The authors declare no competing financial interest.
ACKNOWLEDGMENTS
This work was supported by the Air Force Office of Scientific Research MURI program (FA9550-16-1-0031), and the National Science Foundation (CMMI-1635443).
References (1) Doman, L. EIA Projects 28% Increase in World Energy Use by 2040.
www.eia.gov/todayinenergy/detail.php?id=32912 (accessed Jun 1, 2019) (2) Verma, S.; Lu, S.; Kenis, P. J. A. Co-Electrolysis of CO2 and Glycerol as a
Pathway to Carbon Chemicals with Improved Technoeconomics Due to Low Electricity Consumption. Nat. Energy 2019, 4 (6), 466–474.
(3) Arán-Ais, R. M.; Gao, D.; Roldan Cuenya, B. Structure- and Electrolyte-Sensitivity in CO2 Electroreduction. Acc. Chem. Res. 2018. 51 (11), 2906–2917.
(4) Wu, J.; Sharifi, T.; Gao, Y.; Zhang, T.; Ajayan, P. M. Emerging Carbon-Based Heterogeneous Catalysts for Electrochemical Reduction of Carbon Dioxide into Value-Added Chemicals. Adv. Mater. 2019, 31 (13), 1804257.
(5) Zhang, L.; Zhao, Z.-J.; Gong, J. Nanostructured Materials for Heterogeneous Electrocatalytic CO2 Reduction and Their Related Reaction Mechanisms. Angew. Chemie Int. Ed. 2017, 56 (38), 11326–11353.
(6) Chen, Y.; Li, C. W.; Kanan, M. W. Aqueous CO2 Reduction at Very Low Overpotential on Oxide-Derived Au Nanoparticles. J. Am. Chem. Soc. 2012, 134 (49), 19969–19972.
(7) Feng, X.; Jiang, K.; Fan, S.; Kanan, M. W. Grain-Boundary-Dependent CO2 Electroreduction Activity. J. Am. Chem. Soc. 2015,137 (14), 4606–4609.
(8) Lee, H. E.; Yang, K. D.; Yoon, S. M.; Ahn, H. Y.; Lee, Y. Y.; Chang, H.; Jeong, D. H.; Lee, Y. S.; Kim, M. Y.; Nam, K. T. Concave Rhombic Dodecahedral Au Nanocatalyst with Multiple High-Index Facets for CO2 Reduction. ACS Nano 2015, 9 (8), 8384–8393.
(9) Trindell, J. A.; Clausmeyer, J.; Crooks, R. M. Size Stability and H2/CO Selectivity for Au Nanoparticles during Electrocatalytic CO2 Reduction. J. Am. Chem. Soc. 2017.139 (45), 16161–16167.
(10) Liu, M.; Pang, Y.; Zhang, B.; De Luna, P.; Voznyy, O.; Xu, J.; Zheng, X.; Dinh, C. T.; Fan, F.; Cao, C.; et al. Enhanced Electrocatalytic CO2 Reduction via Field-
Induced Reagent Concentration. Nature 2016, 537 (7620), 382–386. (11) Saberi Safaei, T.; Mepham, A.; Zheng, X.; Pang, Y.; Dinh, C.-T.; Liu, M.; Sinton,
D.; Kelley, S. O.; Sargent, E. H. High-Density Nanosharp Microstructures Enable Efficient CO2 Electroreduction. Nano Lett. 2016, 16 (11), 7224–7228.
(12) Mariano, R. G.; McKelvey, K.; White, H. S.; Kanan, M. W. Selective Increase in CO2 Electroreduction Activity at Grain-Boundary Surface Terminations. Science 2017, 358 (6367), 1187–1192.
(13) Fang, Y.; Flake, J. C. Electrochemical Reduction of CO2 at Functionalized Au Electrodes. J. Am. Chem. Soc. 2017, 139 (9), 3399–3405
(14) Li, J.; Chen, G.; Zhu, Y.; Liang, Z.; Pei, A.; Wu, C. L.; Wang, H.; Lee, H. R.; Liu, K.; Chu, S.; et al. Efficient Electrocatalytic CO2 Reduction on a Three-Phase Interface. Nat. Catal. 2018, 1 (8), 592–600.
(15) Hall, A. S.; Yoon, Y.; Wuttig, A.; Surendranath, Y. Mesostructure-Induced Selectivity in CO2 Reduction Catalysis. J. Am. Chem. Soc. 2015, 137 (47), 14834–14837.
(16) Zhang, W.; He, J.; Liu, S.; Niu, W.; Liu, P.; Zhao, Y.; Pang, F.; Xi, W.; Chen, M.; Pang, S. S.; et al. Atomic Origins of High Electrochemical CO2 Reduction Efficiency on Nanoporous Gold. Nanoscale 2018,10 (18), 8372–8376.
(17) Welch, A. J.; DuChene, J. S.; Tagliabue, G.; Davoyan, A.; Cheng, W.-H.; Atwater, H. A. Nanoporous Gold as a Highly Selective and Active Carbon Dioxide Reduction Catalyst. ACS Appl. Energy Mater. 2019, 2 (1), 164–170.
(18) Chen, C.; Zhang, B.; Zhong, J.; Cheng, Z. Selective Electrochemical CO2 Reduction over Highly Porous Gold Films. J. Mater. Chem. A 2017, 5 (41),21955–21964.
(19) Gabardo, C. M.; Yang, J.; Smith, N. J.; Adams-McGavin, R. C.; Soleymani, L. Programmable Wrinkling of Self-Assembled Nanoparticle Films on Shape Memory Polymers. ACS Nano 2016, 10 (9), 8829–8836.
(20) Zhang, L.; Lang, X.; Hirata, A.; Chen, M. Wrinkled Nanoporous Gold Films with Ultrahigh Surface-Enhanced Raman Scattering Enhancement. ACS Nano 2011.
(21) Fu, C.-C.; Grimes, A.; Long, M.; Ferri, C. G. L.; Rich, B. D.; Ghosh, S.; Ghosh, S.; Lee, L. P.; Gopinathan, A.; Khine, M. Shrink-Induced Nanowrinkles: Tunable Nanowrinkles on Shape Memory Polymer Sheets. Adv. Mater. 2009, 21 (44).
(22) Gabardo, C. M.; Zhu, Y.; Soleymani, L.; Moran-Mirabal, J. M. Bench-Top Fabrication of Hierarchically Structured High-Surface-Area Electrodes. Adv. Funct. Mater. 2013, 23 (24), 3030–3039.
(23) Leem, J.; Wang, M. C.; Kang, P.; Nam, S. Mechanically Self-Assembled, Three-Dimensional Graphene–Gold Hybrid Nanostructures for Advanced Nanoplasmonic Sensors. Nano Lett. 2015, 15 (11), 7684–7690.
(24) Lee, W.-K.; Kang, J.; Chen, K.-S.; Engel, C. J.; Jung, W.-B.; Rhee, D.; Hersam, M. C.; Odom, T. W. Multiscale, Hierarchical Patterning of Graphene by Conformal Wrinkling. Nano Lett. 2016, 16 (11), 7121–7127.
(25) Kim, J. Y.; Lim, J.; Jin, H. M.; Kim, B. H.; Jeong, S.-J.; Choi, D. S.; Li, D. J.; Kim, S. O. 3D Tailored Crumpling of Block-Copolymer Lithography on Chemically Modified Graphene. Adv. Mater. 2016, 28 (8), 1591–1596.
(26) Choi, J.; Mun, J.; Wang, M. C.; Ashraf, A.; Kang, S.-W.; Nam, S. Hierarchical, Dual-Scale Structures of Atomically Thin MoS2 for Tunable Wetting. Nano Lett.

2017, 17 (3), 1756–1761. (27) Jung, W.-B.; Cho, K. M.; Lee, W.-K.; Odom, T. W.; Jung, H.-T. Universal Method
for Creating Hierarchical Wrinkles on Thin-Film Surfaces. ACS Appl. Mater. Interfaces 2018, 10 (1), 1347–1355.
(28) Jung, W.-B.; Yun, G.-T.; Kim, Y.; Kim, M.; Jung, H.-T. Relationship between Hydrogen Evolution and Wettability for Multiscale Hierarchical Wrinkles. ACS Appl. Mater. Interfaces 2019, 11 (7), 7546–7552.
(29) Yun, G. T.; Jung, W. Bin; Oh, M. S.; Jang, G. M.; Baek, J.; Kim, N. I.; Im, S. G.; Jung, H. T. Springtail-Inspired Superomniphobic Surface with Extreme Pressure Resistance. Sci. Adv. 2018, 4 (8).
(30) Huntington, M. D.; Engel, C. J.; Odom, T. W. Controlling the Orientation of Nanowrinkles and Nanofolds by Patterning Strain in a Thin Skin Layer on a Polymer Substrate. Angew. Chemie - Int. Ed. 2014, 126 (31), 8255-8259.
(31) Chan, Y.; Skreta, M.; McPhee, H.; Saha, S.; Deus, R.; Soleymani, L. Solution-Processed Wrinkled Electrodes Enable the Development of Stretchable Electrochemical Biosensors. Analyst 2019, 144 (1), 172–179.
(32) Woo, S. M.; Gabardo, C. M.; Soleymani, L. Prototyping of Wrinkled Nano-/Microstructured Electrodes for Electrochemical DNA Detection. Anal. Chem. 2014, 86 (24), 12341–12347.
(33) Chapman, C. T.; Paci, J. T.; Lee, W.-K.; Engel, C. J.; Odom, T. W.; Schatz, G. C. Interfacial Effects on Nanoscale Wrinkling in Gold-Covered Polystyrene. ACS Appl. Mater. Interfaces 2016, 8 (37), 24339–24344.
(34) Xue, Y.; Lee, W.-K.; Yuan, J.; Odom, T. W.; Huang, Y. Mechanics Modeling of Hierarchical Wrinkle Structures from the Sequential Release of Prestrain. Langmuir 2018, 34 (51), 15749–15753.
(35) Luo, X.-M.; Zhu, X.-F.; Zhang, G.-P. Nanotwin-Assisted Grain Growth in Nanocrystalline Gold Films under Cyclic Loading. Nat. Commun 2014, 5 (1), 3021.
(36) Wang, L.; Xin, T.; Kong, D.; Shu, X.; Chen, Y.; Zhou, H.; Teng, J.; Zhang, Z.; Zou, J.; Han, X. In Situ Observation of Stress Induced Grain Boundary Migration in Nanocrystalline Gold. Scr. Mater. 2017, 134, 95–99.
(37) Smallman, R. E.; Ngan, A. H. W. Surfaces, Grain Boundaries and Interfaces. In Modern Physical Metallurgy; Elsevier, 2014; pp 415–442.
(38) Glushko, O.; Cordill, M. J. The Driving Force Governing Room Temperature Grain Coarsening in Thin Gold Films. Scr. Mater. 2017, 130, 42–45.
(39) Glushko, O.; Dehm, G. Initiation and Stagnation of Room Temperature Grain Coarsening in Cyclically Strained Gold Films. Acta Mater. 2019, 169, 99–108.
(40) Matula, R. A. Electrical Resistivity of Copper, Gold, Palladium, and Silver. J. Phys. Chem. Ref. Data 1979, 8 (4), 1147–1298.
(41) Steinhoegl, W.; Schindler, G.; Steinlesberger, G.; Traving, M.; Engelhardt, M. Scaling Laws for the Resistivity Increase of Sub-100 nm. Interconnects. International Conference on Simulation of Semiconductor Processes and Devices; IEEE: Boston, MA, 2003; pp 27–30.
(42) Wang, Y.; Raciti, D.; Wang, C. High-Flux CO Reduction Enabled by Three-Dimensional Nanostructured Copper Electrodes. ACS Catal. 2018, 8 (7), 5657–5663.

(43) Raciti, D.; Mao, M.; Park, J. H.; Wang, C. Local pH Effect in the CO2 Reduction Reaction on High-Surface-Area Copper Electrocatalysts. J. Electrochem. Soc. 2018, 165 (10).
(44) Raciti, D.; Mao, M.; Park, J. H.; Wang, C. Mass Transfer Effects in CO2 Reduction on Cu Nanowire Electrocatalysts. Catal. Sci. Technol. 2018, 8 (9), 2364–2369.
(45) Raciti, D.; Mao, M.; Wang, C. Mass Transport Modelling for the Electroreduction of CO2 on Cu Nanowires. Nanotechnology 2018, 29 (4), 044001.
(46) Weng, L.-C.; Bell, A. T.; Weber, A. Z. Modeling Gas-Diffusion Electrodes for CO2 Reduction. Phys. Chem. Chem. Phys. 2018, 20 (25), 16973–16984.
(47) Suter, S.; Haussener, S. Optimizing Mesostructured Silver Catalysts for Selective Carbon Dioxide Conversion into Fuels. Energy Environ. Sci. 2019, 12 (5), 1668–1678.
(48) Pan, Y.-T. (Frank); Yin, X.; Kwok, K. S.; Yang, H. Higher-Order Nanostructures of Two-Dimensional Palladium Nanosheets for Fast Hydrogen Sensing. Nano Lett. 2014, 14 (10), 5953–5959.
(49) Miyamoto, A.; Lee, S.; Cooray, N. F.; Lee, S.; Mori, M.; Matsuhisa, N.; Jin, H.; Yoda, L.; Yokota, T.; Itoh, A.; et al. Inflammation-Free, Gas-Permeable, Lightweight, Stretchable on-Skin Electronics with Nanomeshes. Nat. Nanotechnol. 2017, 12 (9), 907–913.
(50) Zhu, B.; Gong, S.; Cheng, W. Softening Gold for Elastronics. Chem. Soc. Rev. 2019, 48 (6), 1668–1711.
(51) Ray, T. R.; Choi, J.; Bandodkar, A. J.; Krishnan, S.; Gutruf, P.; Tian, L.; Ghaffari, R.; Rogers, J. A. Bio-Integrated Wearable Systems: A Comprehensive Review. Chemical Reviews. 2019,119 (8), 6461–5533.

Supporting Information
Nano-folded gold electrocatalysts enhance the selectivity of carbon dioxide reduction Kam Sang Kwok,1,‡ Yuxuan Wang,1,‡ Michael Cao,3 Hao Shen,1 Weinan Xu,1 David A.
Muller,3,4 Chao Wang,1,*and David H. Gracias1,2,*
1 Department of Chemical & Biomolecular Engineering, Johns Hopkins University, Baltimore, Maryland 21218, United States 2 Department of Materials Science and Engineering, Johns Hopkins University, Baltimore, Maryland 21218, United States 3 School of Applied and Engineering Physics, Cornell University, Ithaca, New York 14853, United States 4 Kavli Institute for Nanoscale Science, Cornell University, Ithaca, New York 14853, United States *Corresponding author: [email protected]; [email protected] Author Contributions ‡These authors contributed equally Table of Contents
1. Details of the experiments and the simulations
2. Characteristics of the nano-folded Au catalysts
3. X-ray diffraction studies of the Au catalysts
4. Four-point probe measurements of the Au catalysts
5. Characteristics of the as made and transferred nano-folded Au
6. Electrochemical measurements of the Au catalysts
7. Local pH modelling of the Au catalysts

1. Details of the experiments and the simulations 1.1 Preparation of the nano-folded Au catalysts We rinsed and dried the shrinkable film (Grafix KSF6-C) with isopropanol (IPA) and air
prior to any experiment. We deposited gold (99.99% Au) on top of the heat shrinkable film
by thermal evaporation at a rate of 0.5 Å/sec. To prepare the folded Au catalysts, we cut
and clamped the Au film on top of the silicon (Si) wafers, and heated it at 200 ℃ for 3
mins to form the nano-folded Au catalysts. We calculated the strain of the nano-folded
catalysts using the following equation,
𝜀1𝐷 = I𝐿 − 𝐿0𝐿0
I
where 𝜀%L is the strain that applied to the Au film, 𝐿M is the original length, and 𝐿 is the
length of the Au film after heating.
1.2 X-ray diffraction measurements We obtained the x-ray diffraction patterns (XRD) using an X’Pert Pro (Philips) instrument
with the Empyrean Cu LFF tube. We set the x-ray generator at 45 kV and 40 mA, and we
scanned all the samples from 5o to 100o with a step size of 0.02o and 10 seconds per
step.
1.3 Scanning transmission electron microscopy analysis Data for STEM images were collected at 300 kV on an FEI Titan Themis CryoS/TEM
operating in microprobe STEM mode with an aperture semi-angle of about 3 mrad. We
collected a diffraction pattern at every scanning point using the Electron Microscope Pixel
Array Detector (EMPAD) developed at Cornell University,1 resulting in a 4D (x, y, kx, ky)
dataset.
To generate the false-colored images, the diffraction patterns were turned into cepstrums2
and then ran through Principal Components Analysis (PCA). The cepstrum is the Fourier
transform of the log of the diffraction pattern. This transform emphasizes the periodicity
in the diffraction pattern and is less sensitive to intensity fluctuations from dynamical
diffraction such as thickness fringes or bend contours that cause nonuniform illumination
in the diffraction pattern. The false-colored images are color composited from the

loadings of the PCA. Similar colored regions indicate similar loadings, thus similar
cepstrums, and ultimately similar grains. The colors themselves were arbitrarily chosen
and have no inherent meaning.
1.4 Sheet resistance measurement We measured the sheet resistance of the Au films using the four-point probe method with
a Keithley 2400 multimeter. Electric current (I) was flowed through the outer two probes,
and the corresponding potential difference (V) was measured across the inner two
probes.
1.5 Transfer Au films to arbitrary substrates We prepared a two-phase water/toluene solution. The toluene dissolves the PS
substrates, and the Au film is suspended at the water/toluene interface. We removed and
added new toluene every few hours over two days. To transfer the Au films to arbitrary
substrates, we removed the toluene, lifted the Au films, and transferred them to the
receiver substrate. The films could also be wrapped around a needle by rolling.
1.6 Electrochemical measurements We measured the electrocatalytic properties of the Au catalysts using a home-built gas-
tight electrolysis cell and an Autolab 302 potentiostat (Metrohm). We used a Hg/HgSO4
electrode (Hach) and a Pt mesh (VWR) as the reference and counter electrode
respectively, and a solution of 0.1 M KHCO3 (Sigma Aldrich, ≥ 99.95%) was used as the
electrolyte. CO2 was bubbled through a glass frit to the cathode compartment at a
constant rate of 20 sccm and purged for 10 minutes prior to each measurement. To
prepare the working electrode, we assembled the Au films with Ag wire (Alfa Assar) and
carbon tape (Nisshin EM), and we covered with Ag wire and carbon tape with Kapton
tape (Micronova) to avoid any background signal from the Ag wire. The cathode and
anode compartments were separated with an AHO anion exchange membrane (Selemion
Inc.), which minimizes the possible transfer of chemical species (e.g. Pt dissolved from
the counter electrode, products produced from the cathode) across the cell. We converted
all potentials in this work to the RHE scale by E (vs RHE) = E (vs Hg/HgSO4) + 0.64 V +
0.0591 × pH, where the pH for the 0.1 M KHCO3 electrolyte saturated by CO2 is 6.8. The
gas-phase products were measured online using a gas chromatography-mass
spectrometry instrument (GC-MS-QP2010SE, Shimadzu).

1.7 Carbon monoxide analysis
We quantified the amount of carbon monoxide (CO) using the GC-MS with a Plot-Q
column (Restek). Helium (He) gas was the carrier gas to the GC-MS, and we calibrated
the GC-MS using a custom gas mix (Airgas). We sampled the gas samples every ten
minutes and six total measurements per value of the potential. We calculated the faradaic
efficiency of CO (𝐹𝐸%QR) using the following equation,
𝐹𝐸%QR =𝑝𝑝𝑚QR × 𝑓𝑙𝑜𝑤𝑟𝑎𝑡𝑒 ×
𝑛𝐹𝑝^𝑅𝑇
𝐽b^c× 100
In addition, we calculated the partial current densities of CO (𝐽QR) using the following
equation,
𝐽QR =𝑝𝑝𝑚QR × 𝑓𝑙𝑜𝑤𝑟𝑎𝑡𝑒 ×
𝑛𝐹𝑝^𝑅𝑇
𝑔𝑒𝑜𝑚𝑒𝑡𝑟𝑖𝑐𝑠𝑢𝑟𝑓𝑎𝑐𝑒𝑎𝑟𝑒𝑎
where 𝑝𝑝𝑚QR is the concentration of CO formation, flow rate = 20 sccm, 𝑛 is the number
of electrons transferred to CO2 to CO (𝑛 = 2 for this reaction), 𝑝^ = 1.013 bar, 𝑇 is 273.15
K, 𝑅 is gas constant, and 𝐹 is the Faraday’s constant. The 𝑔𝑒𝑜𝑚𝑒𝑡𝑟𝑖𝑐𝑠𝑢𝑟𝑓𝑎𝑐𝑒𝑎𝑟𝑒𝑎 in our
studies was 0.25 cm2
1.8 Surface roughness measurement We calculated the surface roughness of the Au films by measuring the double-layer
capacitance from 0 to -0.20 V (vs. RHE) at various scan rates in 0.5 M KHCO3 with
purged argon (Ar). We obtained the capacitance of each Au film by calculating the slope
of the double-layer versus the scan rate. We calculated the surface roughness by the
following equation,
𝐶jkj^l2^mn9nop
𝐶2mkcop=𝐸𝐶𝑆𝐴jkj^l2^mn9nop
𝐴𝑟𝑒𝑎2mkcop= 𝑠𝑢𝑟𝑓𝑎𝑐𝑒𝑟𝑜𝑢𝑔ℎ𝑛𝑒𝑠𝑠

where 𝐶2mkcop is the capacitance of the flat Au, 𝐴𝑟𝑒𝑎2mkcop is 0.25 cm2 in this
experiments, 𝐶jkj^l2^mn9nop is the capacitance of the nano-folded Au catalyst and
𝐸𝐶𝑆𝐴jkj^l2^mn9nop (is the electrochemical active surface area of the nano-folded Au
catalyst.
1.9 Mass Transport Model for CO2 electroreduction We developed a mass transport model for the Au electrocatalysts based on a previously
published model with some modifications.3,4 We simulated the local pH at the Au surfaces
using Matlab 2018a and the parameters listed in Table S2 and S3. The general equation
of the effective diffusivity is 𝒟9 = 𝑥𝒟, 𝑋 = ℰv>?, where 𝒟 is the bulk diffusivity, ℰc is the
porosity, 𝛿 is the constriction factor, and 𝜏 is the tortuosity. For instance, we simulated
𝑥 = 0.4, and we estimated the 𝒟9 (Table S3) for every electrolytic species ([CO2]aq, HCO3-
, CO32-, OH-).

2. Characteristics of the nano-folded Au catalysts
Figure S1. Angled SEM image of the Au-0 catalyst on the pre-strained PS polymer as made.
Figure S2. Histograms of the nano-fold distribution in Au-30 (blue) and Au-70 (red).

3. X-ray diffraction studies of the Au catalysts
Figure S3. (a) XRD of 60 nm flat Au-0 on the pre-strained PS substrate before and after heating.
No significant change was observed indicating that heating did not contribute to structural
changes. (b) XRD of Au-70 with 0 and 90 degree of the x-ray beam.
4. Four-point probe measurements of the Au catalysts
Figure S4. I-V curves of flat (black), Ɛ1D ~0.3 (blue) and Ɛ1D ~0.7 (red) via four-point
measurement.

4. Characterization of the as made and transferred nano-folded Au catalysts
Figure S5. Angled SEM image of the Au-0 catalyst after transfer from the pre-strained PS
polymer to silicon wafer.
Figure S6. Measurement of fold dimensions from cross-sectional SEM images. For Au-30 and
Au-70 catalyst width and height.
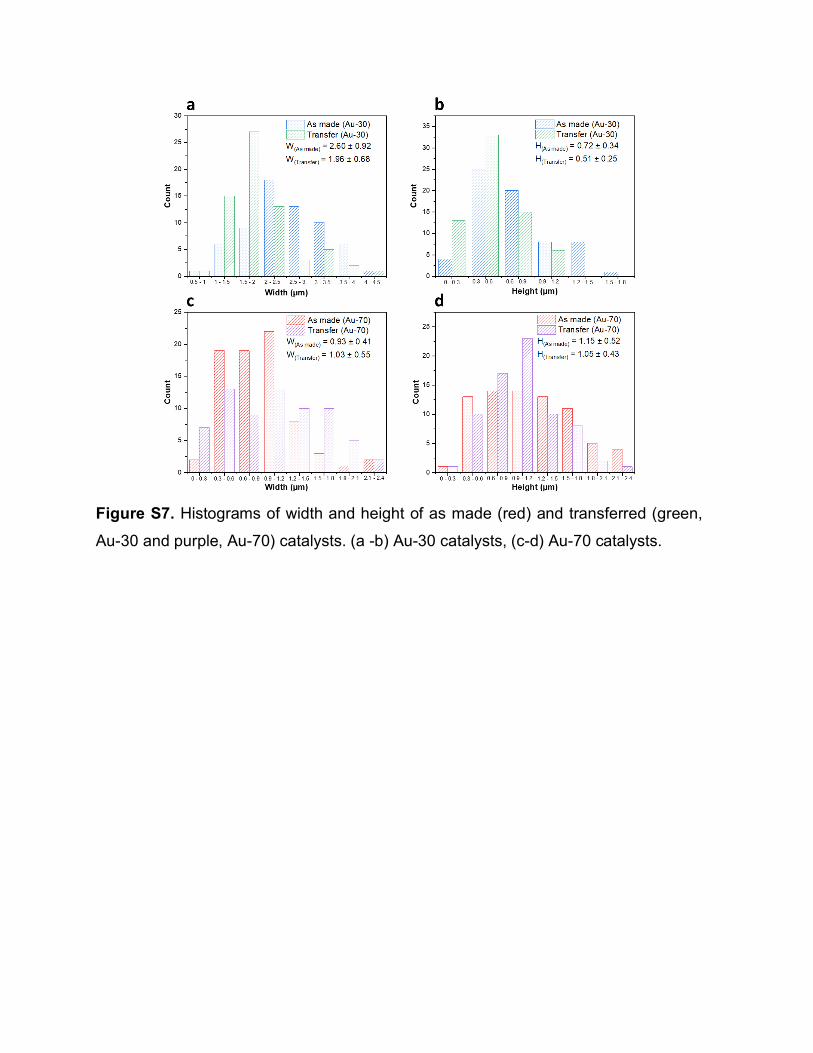
Figure S7. Histograms of width and height of as made (red) and transferred (green,
Au-30 and purple, Au-70) catalysts. (a -b) Au-30 catalysts, (c-d) Au-70 catalysts.

6. Electrochemical measurements of the Au catalysts
Figure S8. Representative optical images of assembled gold catalysts used for the
electrochemical tests.
Figure S9. Schematic of the custom-made gas-tight electrolysis cell used in this
study.

Figure S10. Plots of double layer capacitance vs scan rates that were used to estimate
surface roughness. (a) Au-0, (b) Au-30 and (c) Au-70.

Table S1. Summary of the roughness factor and electrochemically active surface
area (ECSA) of the Au catalysts.
7. Local pH modelling and measurements of the Au catalysts
Figure S11. Plot of the pH vs 𝑥 = =>?
, for 0.2 ≤ 𝑥 ≤ 1at the Au catalyst surfaces.
Table S2. Electrochemical reactions and corresponding parameters considered for the
mass transport model.

Table S3. Concentration and diffusion coefficients of chemical species in the bulk
electrolyte.3,4
References
(1) Tate, M. W.; Purohit, P.; Chamberlain, D.; Nguyen, K. X.; Hovden, R.; Chang, C. S.; Deb, P.; Turgut, E.; Heron, J. T.; Schlom, D. G.; et al. High Dynamic Range Pixel Array Detector for Scanning Transmission Electron Microscopy. Microsc. Microanal. 2016, 22 (1), 237–249. (2) Padgett, E.; Cueva, P.; Holtz, M. E.; Langenberg, E.; Ren, D.; Abruna, H. D.; Schlom, D.; Muller, D. A. Grains and Strains from Cepstral Analysis of 4D-STEM Nano-Diffraction Datasets. Microsc. Microanal. 2018, 24 (S1), 546–547. (3) Raciti, D.; Mao, M.; Wang, C. Mass Transport modelling for the electroreduction of CO2 on Cu nanowires. Nanotechnology. 2018, 29 (4), 044001. (4) Raciti, D.; Mao, M.; Park, J. H.; Wang, C. Local pH Effect in the CO2 Reduction Reaction on High-Surface-Area Copper Electrocatalysts. J. Electrochem. Soc. 2018, 165 (10).

download fileview on ChemRxivKwok Chemrxiv Final.pdf (4.86 MiB)